the 10% rule - mrs. papay's classroom · represents the energy available for each trophic...

1
1 
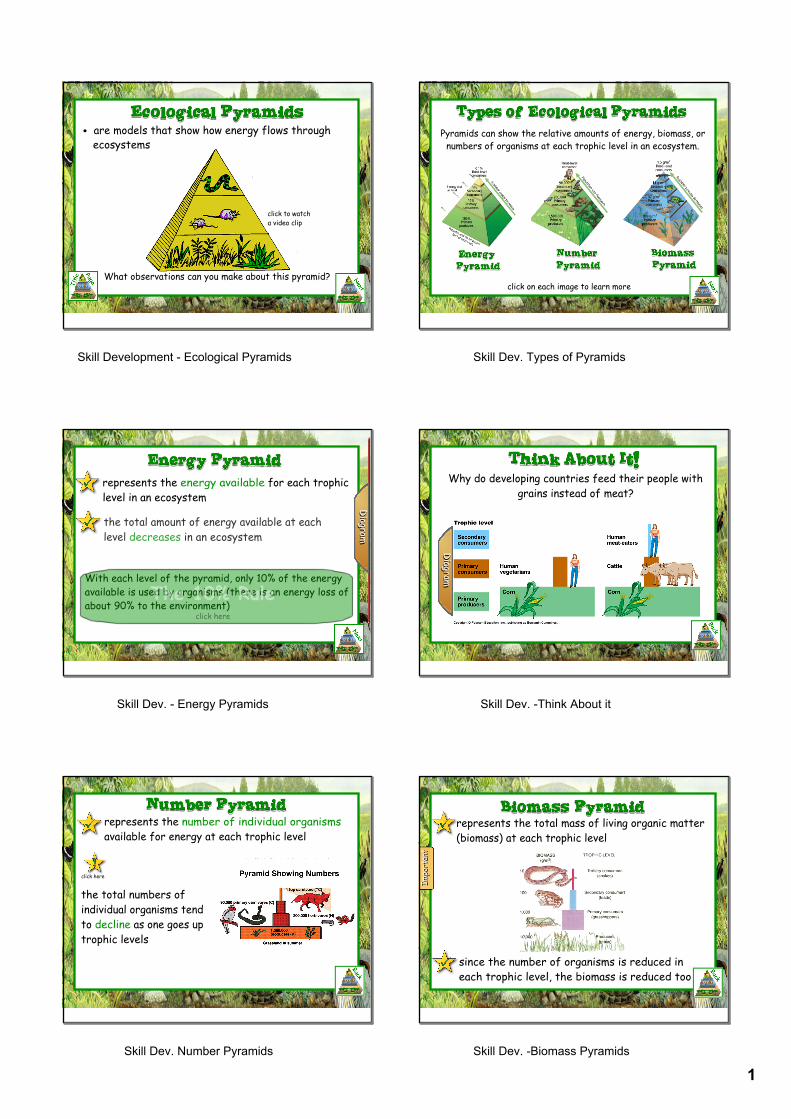
Skill Development Ecological Pyramids are models that show how energy flows through ecosystems click to watch a video clip What observations can you make about this pyramid? Skill Dev. Types of Pyramids Pyramids can show the relative amounts of energy, biomass, or numbers of organisms at each trophic level in an ecosystem. click on each image to learn more Skill Dev. Energy Pyramids With each level of the pyramid, only 10% of the energy available is used by organisms (there is an energy loss of about 90% to the environment) represents the energy available for each trophic level in an ecosystem The 10% Rule click here the total amount of energy available at each level decreases in an ecosystem Diagram Diagram Skill Dev. Think About it Diagram Diagram Why do developing countries feed their people with grains instead of meat? Skill Dev. Number Pyramids the total numbers of individual organisms tend to decline as one goes up trophic levels click here click here represents the number of individual organisms available for energy at each trophic level Skill Dev. Biomass Pyramids represents the total mass of living organic matter (biomass) at each trophic level since the number of organisms is reduced in each trophic level, the biomass is reduced too Important Important

Upload: vuongxuyen

Post on 18-Aug-2018

212 views

Category:

Documents


0 download

TRANSCRIPT

1

Skill Development ­ Ecological Pyramids

• are models that show how energy flows through ecosystems

click to watch a video clip

What observations can you make about this pyramid?

Skill Dev. Types of Pyramids

Pyramids can show the relative amounts of energy, biomass, or numbers of organisms at each trophic level in an ecosystem.

click on each image to learn more

Skill Dev. ­ Energy Pyramids

With each level of the pyramid, only 10% of the energy available is used by organisms (there is an energy loss of about 90% to the environment)

represents the energy available for each trophic level in an ecosystem

The 10% Ruleclick here

the total amount of energy available at each level decreases in an ecosystem

Diagram

Diagram

Skill Dev. ­Think About it

Diagram

Diagram

Why do developing countries feed their people with grains instead of meat?

Skill Dev. Number Pyramids

the total numbers of individual organisms tend to decline as one goes up trophic levels

click hereclick here

represents the number of individual organisms available for energy at each trophic level

Skill Dev. ­Biomass Pyramids

represents the total mass of living organic matter (biomass) at each trophic level

since the number of organisms is reduced in each trophic level, the biomass is reduced too

Impo

rtan

tIm

port

ant