thalamo-frontal white matter alterations in chronic...
TRANSCRIPT

r Human Brain Mapping 30:3812–3825 (2009) r
Thalamo-Frontal White Matter Alterationsin Chronic Schizophrenia: A Quantitative
Diffusion Tractography Study
Jungsu S. Oh,1,2 Marek Kubicki,1,3 Gudrun Rosenberger,1,4
Sylvain Bouix,1 James J. Levitt,1,3 Robert W. McCarley,3
Carl-Fredrik Westin,5 and Martha E. Shenton1,3,6*
1Department of Psychiatry, Psychiatry Neuroimaging Laboratory, Brigham and Women’s Hospital,Harvard Medical School, Boston, Massachusetts
2Brain Korea 21 Division of Human Life Science, Seoul National University, Seoul, South Korea3Clinical Neuroscience Division, Laboratory of Neuroscience, VA Boston Healthcare System,
Brockton, Massachusetts4Department of General Psychiatry, Medical University Innsbruck, Innsbruck, Austria
5Laboratory Mathematical Imaging, Department of Radiology, Brigham and Women’s Hospital,Harvard Medical School, Boston, Massachusetts
6Surgical Planning Laboratory, MRI Division, Department of Radiology,Brigham and Women’s Hospital, Harvard Medical School, Boston, Massachusetts
r r
Abstract: Diffusion tensor imaging (DTI) and fiber tractography are useful tools for reconstructingwhite matter tracts (WMT) in the brain. Previous tractography studies have sought to segment recon-structed WMT into anatomical structures using several approaches, but quantification has been limitedto extracting mean values of diffusion indices. Delineating WMT in schizophrenia is of particular inter-est because schizophrenia has been hypothesized to be a disorder of disrupted connectivity, especiallybetween frontal and temporal regions of the brain. In this study, we aim to differentiate diffusionproperties of thalamo-frontal pathways in schizophrenia from normal controls. We present a quantita-tive group comparison method, which combines the strengths of both tractography-based and voxel-based studies. Our algorithm extracts white matter pathways using whole brain tractography. Func-tionally relevant bundles are selected and parsed from the resulting set of tracts, using an internal cap-sule (IC) region of interest (ROI) as ‘‘source’’, and different Brodmann area (BA) ROIs as ‘‘targets’’. Theresulting bundles are then longitudinally parameterized so that diffusion properties can be measuredand compared along the WMT. Using this processing pipeline, we were able to find altered diffusionproperties in male patients with chronic schizophrenia in terms of fractional anisotropy (FA) decreasesand mean diffusivity (MD) increases in precise and functionally relevant locations. These findings sug-
Contract grant sponsors: Korea Research Foundation by theKorean Government; Contract grant number: MOEHRD KRF-2006-352-D00220; Contract grant sponsors: Second Stage BrainKorea 21 Project in 2008 (Division of Human Life Science),National Institute of Health; Contract grant numbers: K05MH070047, R01 MH 50740, P50 MH080272-01; Contract grantsponsor: National Alliance for Medical Image Computing, andNIH Roadmap for Medical Research Award; Contract grant num-ber: U54 EB005149; Contract grant sponsors: Department of Veter-ans Affairs Merit Awards; VA Schizophrenia Center.
*Correspondence to: Martha E. Shenton, 1249 Boylston Street, Psy-chiatry Neuroimaging Laboratory, Boston, MA 02215.E-mail: [email protected]
Received for publication 16 September 2008; Revised 22 March2009; Accepted 23 March 2009
DOI: 10.1002/hbm.20809Published online 15 May 2009 in Wiley InterScience (www.interscience.wiley.com).
VC 2009 Wiley-Liss, Inc.
gest that our method can enhance the regional and functional specificity of DTI group studies, thusimproving our understanding of brain function. Hum Brain Mapp 30:3812–3825, 2009. VC 2009 Wiley-Liss, Inc.
Keywords: diffusion tensor imaging (DTI); Brodmann area (BA); internal capsule (IC); parameteriza-tion; chronic schizophrenia
r r
INTRODUCTION
Diffusion tensor imaging (DTI) and fiber tractographyhave proven to be useful for investigating in vivo anatomi-cal connectivity of white matter fiber tracts in the brain.However, although great progress has been made in termsof tract visualization, the quantitative analysis of outputfrom fiber tractography remains difficult. An attempt toaddress this issue has been made with recently developedquantitative methods, such as tract-based spatial statistics[Smith et al., 2006] and tract parameterization [Gong et al.,2005; Lin et al., 2006; Oh et al., 2007; Reich et al., 2007].Using these methods, quantitative measures of white mat-ter integrity (e.g., fractional anisotropy (FA) and/or meandiffusivity (MD)) can be followed along the white matterfibers, and compared between groups.
As a number of investigators have speculated that schiz-ophrenia is a disorder involving disconnectivity betweendistant brain regions [e.g., Kubicki et al., 2005; Weinbergeret al., 1994], DTI has become the method of choice forquantifying white matter fiber tracts [see review inKubicki et al., 2007]. Early findings have shown reductionsin integrity of whole white matter [Buchsbaum et al., 1998]as well as FA reduction in fronto-temporal connectionsincluding the uncinate fasciculus [Kubicki et al., 2002a,b],cingulum bundle [Kubicki et al., 2003a; Wang et al., 2004],and arcuate fasciculus [Hubl et al., 2004]. Loss of integrityhas also been reported in the corpus callosum (CC), partic-ularly in the genu and splenium portions of this fiber tract[Argartz et al., 2001; Foong et al., 2000].
Another focus of attention has been thalamic frontalwhite matter projections, traveling through the internalcapsule (IC) [Buchsbaum et al., 1998, 2006]. The IC, in par-ticular the anterior limb of the IC (AL-IC), is an importantpathway involved in affect, attention, working memory,language and association brain functions, often reported tobe abnormal in schizophrenia [Buchsbaum et al., 2006;Park et al., 2004; Zou et al., 2008]. Also, and as noted byNolte [2002], the thalamo-cortical projection through theAL-IC is the final pathway for all higher cognitive feed-back loops, forming the thalamo-subcortical connections.Thus, structural abnormalities of fiber integrity (FA) or tis-sue microstructures (MD) in these fiber tracts could leadto functional disconnections of these networks, which, inturn, may underlie many of the behavioral and cognitiveabnormalities observed in schizophrenia [Kubicki et al.,2005]. In the study presented here, we further investigateFA and MD values in frontal projections of the mostly tha-
lamic connections traveling through the AL-IC inschizophrenia.
Given that frontal projections of the IC include largebundles of fronto-subcortical fiber tracts that connect verydistinct functional regions, we decided to use Brodmannareas (BA) as regions of interest (ROI) to divide IC projec-tions into functionally-relevant parcellations. We thoughtthat such an approach would provide more functional ho-mogeneity compared with parcellation methods that arebased on geometric divisions such as sulcal-gyral parcella-tion [e.g., Fischl et al., 1999; Park et al., 2008]. In addition,we expected that this BA ROI approach would be usefulfor extracting fibers that are not only similar in functionbut also in appearance, thus improving parameterization.Furthermore, this approach is different from previousattempts to use cortical gray matter parcellation as a seg-mentation tool for reconstructing fiber tracts [Park et al.,2008; Thottakara et al., 2006], in that the focus is on parcel-lation of white matter structures in the brain.
With respect to fiber tractography, several issues need tobe addressed. The most commonly-used tractographymethod consists of seeding fiber tracts in one region of thebrain and employs a maximum likelihood orientation-based tracing technique to follow the path of the fibers.This deterministic method, however, is known to be verysensitive to noise and it lacks robustness, especially in con-structing fiber tracts with crossing and fanning along theirpaths [Peled et al., 2006]. Probabilistic tractography meth-ods have been developed to try to resolve these issues[Behrens et al., 2003, 2007; Friman et al., 2006; Parkeret al., 2003]. Such methods are particularly good ataddressing uncertainties in fiber bundle orientations, andat enabling researchers to use gray matter ROIs as seedpoints for fiber tractography. However, these methodsusually involve tremendous computation in terms of esti-mation/sampling of random fiber orientations.
An alternative is to use deterministic tracing, and toseed the fibers in every location of the brain. This tech-nique, called whole brain seeding-based tractography, gen-erally has shown significantly better tracking results thanregional seeding, as many more fibers are initiated [e.g.,Conturo et al., 1999; Huang et al., 2004; Mori et al. 1999;O’Donnell et al., 2006; Park et al., 2003]. This tractographystrategy also tends to be more efficient in terms of compu-tation compared with probabilistic approaches. Manyresearchers thus employ whole brain tractography to con-struct group-based probabilistic maps of specific fiber
r Thalamo-Frontal WMT in Chronic Schizophrenia r
r 3813 r
tracts [e.g., Ciccarelli et al., 2003, 2005; Huang et al., 2005;Parker et al., 2005; Thottakara et al., 2006].
After tracing of fiber paths, information about their in-tegrity needs to be computed so that it can be comparedbetween groups. A common approach is to average valuesof FA and diffusivity for the entire fiber tracts. However,this method is not sensitive to local changes of the diffu-sion properties along the tracts. Thus more recently, meth-ods of tract parameterization have been introduced tomeasure, and to compare, diffusion properties within sub-jects, and between populations [e.g., Gong et al., 2005; Linet al., 2006; Oh et al., 2007; Reich et al., 2007]. For example,Gong et al. [2005] established a cingulum bundle-specific‘‘angular coordinate’’ system for tract parameterization.Others have focused on arc-length or normalized arc-length to subdivide (or parameterize) fiber tracts [e.g., Linet al., 2006; Oh et al., 2007; Reich et al., 2007]. The arc-length-based coordinate system is based on a transforma-tion that converts rectangular Cartesian coordinate systemsto a normalized coordinate system along the fiber bundle.These methods are similar to each other, in that theydivide the fiber tracts into several segments, to providebetter regional specificity than conventional methods (e.g.,bulky ROI-based analysis). In particular, our previousstudy [Oh et al., 2007] demonstrated the usefulness ofthree-dimensional (3-D) parameterization of the CC, interms of more regional specificity. In this previous study,we successfully differentiated group-associated fiber integ-rity differences in the CC, the largest bundle of white mat-ter tracts in human brain. As our objective was to have aquantitative DTI analysis based on a reliable fiber tractextraction with functional specificity, and also furtherparameterization with regional specificity, we decided tocombine the BA ROI parcellation approach with the longi-tudinal tract parameterization.
Finally, we used a statistical analysis to investigategroup-associated differences of DTI measures (i.e., FA val-ues, measures believed to be estimators of fiber tract co-herence/integrity, and MD values, measures of disruptionof tissue microstructures) along the entire length of eachfiber tract. Thus using whole brain tractography, BA-basedROI, and tract parameterization methods, we conducted aquantitative DTI analysis for differentiating male chronicschizophrenia patients from male normal controls, interms of fronto-subcortical white matter alterations.
MATERIALS AND METHODS
Participants
Eighteen male patients with chronic schizophrenia wererecruited from inpatient, outpatient, day treatment, or fos-ter care programs at the Veteran’s Administration (VA)Boston Healthcare System, Brockton, Massachusetts, and21 male normal controls were recruited through newspa-per advertisements. Inclusion and exclusion criteria con-sisted of: aged 18-55, intelligence quotient (IQ) IQ > 75, no
history of seizures or head trauma with loss of conscious-ness or a neurological disorder, and free from alcohol/drug dependences in the past 5 years. A trained inter-viewer diagnosed patients on the basis of the DSM-IV cri-teria using the SCID-P [Spitzer et al., 1990a] in conjunctionwith information obtained from medical records. Usingthe SCID-NP [Spitzer et al., 1990b] and SCID-II [Spitzeret al., 1990c], normal controls were excluded if they had ahistory of Axis I mental disorders (in themselves or theirfirst-degree relatives), or an Axis II disorder. All patientswere receiving antipsychotic medication at the time of test-ing. In addition to the IQ, the premorbid intellectual abil-ities were evaluated using the WAIS-III measure of IQ aswell as the scaled reading score of the Wide RangeAchievements Test 3 (WRAT3-RS), the latter considered anappropriate measure of premorbid IQ in patients withschizophrenia, since IQ measured by the WAIS-III may becompromised by illness. Socioeconomic status (SES) ofschizophrenia and normal controls, and those of theirparents (PSES), was evaluated using the Hollingshead[1965] two-factor index. Clinical symptoms were measuredusing the Scale for the Assessment of Negative Symptomsand the Scale for the Assessment of Positive Symptoms[SANS/SAPS - Andreasen, 1981, 1984]. The study wasapproved by the local IRB committees at Brigham andWomen’s Hospital and the VA Boston Healthcare System,and all study participants gave written informed consentprior to study participation. A subset of subjects used inthis investigation was also used previously in other DTIinvestigations [Kubicki et al., 2005; Kuroki et al., 2006;Rosenberger et al., 2008].
MR Image Acquisition
Line Scan Diffusion Imaging (LSDI) was used to acquireDTI images [Gudbjartsson et al., 1996; Maier et al., 1998]using a quadrate head coil on a 1.5T GE Echospeed system(General Electric Medical Systems, Milwaukee, Wisconsin)at the Brigham and Women’s Hospital, Harvard MedicalSchool, Boston, MA. For each line, six DWIs were acquiredwith diffusion gradients (b ¼ 1,000 sec/mm2) along sixnoncollinear directions and two images were acquired withminimal diffusion gradient (b ¼ 5 sec/mm2). Other imagingparameters included: field of view (FOV) 220 � 165 mm2,scan matrix 128 � 96, and image matrix 256 � 192. Fourmillimeter coronal oblique slices were acquired, and thesewere aligned to the AC-PC line and interhemispheric fis-sure, with 1 mm gap between slices. To compensate for arelatively coarse interslice resolution, cubic spline interpola-tion was conducted along the slice direction to make theDTI volume isotropic (0.86 � 0.86 � 0.86 mm3).
To define the white matter segmentation masks with an-atomical precision, a series of 124 contiguous coronalimages were acquired using a spoiled gradient recalledacquisition (SPGR) MR sequence with the followingparameters: TR ¼ 35 ms, TE ¼ 5 ms, flip angle 45�, FOV
r Oh et al. r
r 3814 r

240 � 240 mm2, number of excitations (NEX) NEX ¼ 1.0,matrix ¼ 256 � 256, axial slice thickness 1.5 mm, resultingin voxel dimensions of 0.94 � 0.94 � 1.5 mm3.
ROI Definition and Preprocessing
To extract fiber tracts of interest (i.e., frontal projectionsfrom the IC), we used a whole brain seeding tractographytechnique, followed by a selection process that only pre-serves tracts going through specific combinations ofregions of interest (ROIs) [Conturo et al., 1999; Huang etal., 2004; Mori et al., 1999; Park et al., 2003]. Indeed, thefibers in the anterior limb of the IC do not exclusively con-nect frontal lobe and thalamus. However, according to aprevious IC population map by Zarei et al. [2007], most ofthem are thalamo-frontal connections. Internal capsuleROIs were drawn on the FA maps. A single rater (G.R.),blind to diagnosis, gender and age, drew ROIs for theentire IC (anterior and posterior limb, as well as genu).The borders were placed generously, including tissue sur-rounding the IC to include all fibers passing through thecapsule. This was possible, since Brodmann area ROIswere selected to eventually exclude extraneous fibers.From the resulting bulky fiber bundle, the fibers connect-ing the IC and the frontal lobe were extracted. After theROIs were drawn, they were upsampled, along with theentire FA map, into isotropic 0.86 mm cubic volumesusing trilinear interpolation, and then the ROI boundarysurface, modeled by a 3D triangular mesh, was extractedusing the marching cubes algorithm [Lorensen and Cline,1987]. The resulting surface was regularized by a mesh-based smoothing, a method for decreasing distancesbetween points on the mesh and their neighboring points.
Next, the second set of ROIs within the frontal lobe wasselected using a BA atlas (BA 9, 10, 11, 32, 44, 45, 46, and47 were selected), which is part of MRIcro software version1.4 (http://www.sph.sc.edu/comd/rorden/mricro.html).Since the atlas is defined in common ‘‘template’’ space, itneeds to be transformed (registered) to each subject’sspace. For the best coregistration results, for each subjectseparately, we used first a nonlinear registration to theindividual anatomical T1 SPGR image, followed by anaffine registration to the DTI image. This process was doneusing SPM2 (http://www.fil.ion.ucl.ac.uk/spm/software/spm2/). In addition, as emphasized by Thottakara et al.[2006], to keep the ROIs intact during spatial transforma-tion, nearest neighbor interpolation was employed in allspatial transformation steps. Since this template was con-structed from a number of subjects, we observed that theboundary of BAs was mildly overinclusive, i.e., these ROIsincluded also white matter regions instead of just graymatter regions. Therefore, we excluded white matterregions from the BA ROIs by using a smoothed (Gaussiankernel with 4 mm full-width-at-half-maximum) FA-basedmask. Using this mask, we could exclude the high FA-value regions (FA > 0.3), generating final cortical BA ROIs.
Taken together, all of these steps resulted in the genera-tion of two separate sets of ROIs: (1) the internal capsule(IC) white matter ROIs, and (2) cortical BA ROIs, whichwere used later for the fiber tract extraction (Fig. 1B).
Diffusion Tensor Tractography
and Postprocessing
Diffusion tensor estimation and fiber tractography wereconducted using in-house fiber tracking software [Oh etal., 2007]. As mentioned in the previous section, we used awhole brain seeding strategy followed by a multiple-ROIselection technique. Our experience [Oh et al., 2007], andthe experience of others, suggest that it is a robust way oftracing fiber paths in DTI in the presence of noise andfiber crossings [e.g., Conturo et al., 1999; Huang et al.,2004; Mori et al., 1999; Park et al., 2003].
We used an FA threshold of 0.1 for both the seedingand stopping criterion for the fiber tracing. After all of thebrain fiber tracts were reconstructed, we applied a multi-ple ROI selection method to segment parts of the IC thatproject to each individual BA. Next, to minimize parame-terization errors due to the fiber length and fiber shapevariability within the gray matter, all surviving fiber tractswere cut using the boundaries of the two anatomical land-marks (i.e., white matter IC ROI and gray matter BAROIs), and subjected to tract parameterization along thedirection of principal diffusion [tract-length parameteriza-tion- Lin et al., 2006; Oh et al., 2007; Reich et al., 2007](Fig. 1C). Specifically, each tract in each subject was di-vided into percentiles (i.e., 100 segments of equal length,starting from the IC ROI forward), thus providing furthercorrespondence between specific locations along the tractsand subjects.
To compare intrasubject variability versus intersubjectvariability along tracts, we calculated two sets of variance,i.e., intrasubject (across-location) variances and intersubject(across-subject) variances. More specifically, let’s assumethat we have a parameterized tractography of ith subject,Xi (s) ¼ [xi(s), yi(s), zi(s)] (s ¼ 1, 2, : : : , 100; where sdenotes each location in the 100 bins-parameterized tract)and corresponding FA (or MD) values, Fi(s) ¼ Fi(xi(s), yi(s),zi(s)).
Then, regarding intrasubject variability, we have meanand variance of FA (or MD) values for each subject
Fi ¼X100
s¼1
FiðsÞ=100
varðFiÞ ¼X100
s¼1
½FiðsÞ � Fi�2=100 : “intra-subject variance” (1)
Regarding intersubject variability, we have mean andvariance of FA (or MD) values for each location:
r Thalamo-Frontal WMT in Chronic Schizophrenia r
r 3815 r

FðsÞ ¼XNs
i¼1
FiðsÞ=Ns ðNs: number of subjectsÞ
varðFðsÞÞ ¼XNs
i¼1
½FiðsÞ � FðsÞ�2=Ns : “inter-subject variance”
(2)
We tested whether or not intrasubject variances are dif-ferent from intersubject variances using Wilcoxon Rank-Sum Test, also known as the Mann-Whitney U-Test.
Statistical Analysis
T-student tests were conducted to assess group differen-ces in age, SES, PSES, education and IQ. As for the diffu-sion measures, since correspondences between specificlocations along the tracts and subjects were well estab-
lished by the aforementioned methods, statistical analysesof group differences in corresponding fiber tracts were rel-atively straightforward. We conducted a statistical analysisas follows. First, we employed three-way analysis of var-iance (ANOVA), to determine group, region, or side inter-actions for FA values. Second, we used multiple one-wayANOVAs, to determine which tract contributed to thoseeffects. Finally, we conducted post hoc protected inde-pendent t-tests along the ‘‘parameterized’’ tracts for eachsubject, to determine region-specific group differences. Thesame methods were applied to MD values.
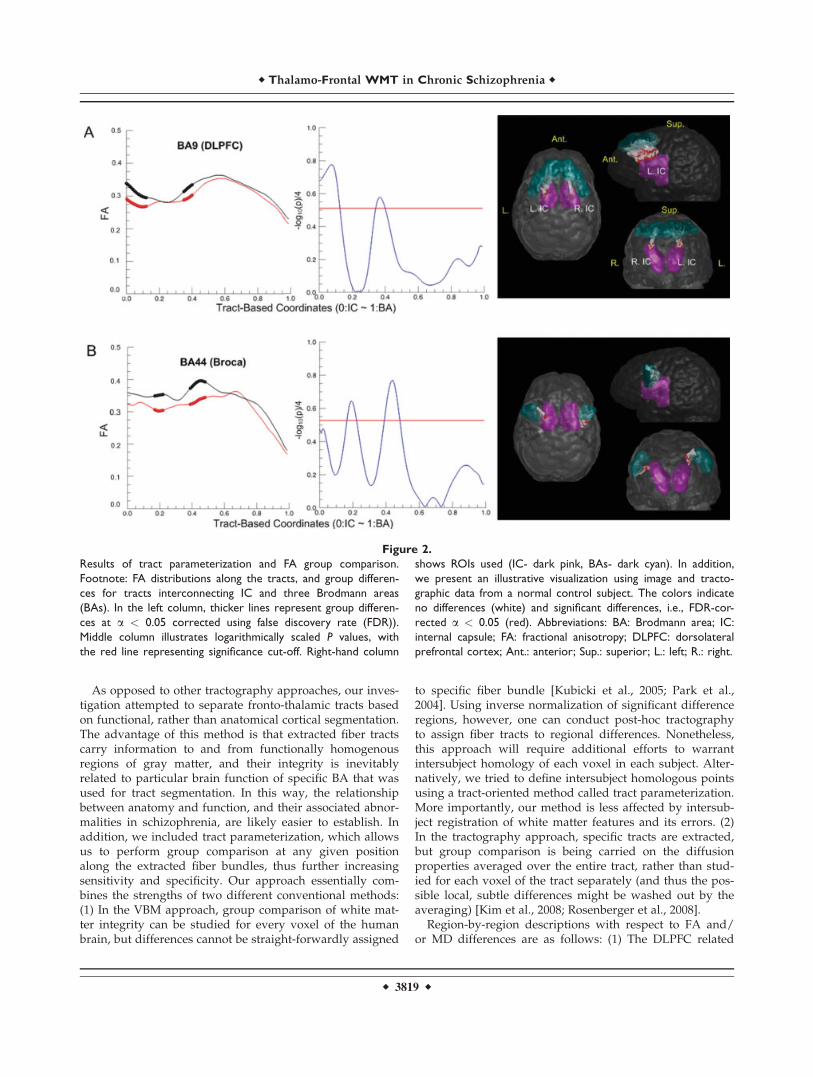
In addition, we further analyzed the data using age andMODE [Ennis and Kindlmann, 2006] as possible con-founds. Considering the age range of our subjects (Normalcontrol: 42.7 � 6.6, Schizophrenia: 39 � 8.7), we includedage in our analyses as a possible confound for FA analysis.In addition, we used a new DTI measure termed MODEdeveloped by Ennis and Kindlmann [2006], where nega-tive MODE is an indirect measure of fiber crossing. Since
Figure 1.
BA and IC ROIs selection and tract parameterization. A
(adapted from http://en.wikipedia.org/wiki/Brodmann_area), rep-
resents atlas of BA ROIs displayed on both lateral and medial
surfaces of the brain. B illustrates frontal ROIs in conjunction
with IC ROI in one random case, and represents a schematic of
overall flow of tractographic data processing (C) (see details in
text). Abbreviations: ROI: region of interest; IC: internal capsule;
BA: Brodmann area; Ant.: anterior view; Sup.: superior view;
Lat: lateral view; DLPFC: dorsolateral prefrontal cortex; FP:
frontal pole; OFC: orbitofrontal cortex; IPFC: inferior prefrontal
cortex; ACC: anterior cingulate cortex.
r Oh et al. r
r 3816 r

fiber crossing might result in underestimated FA values,we introduced MODE as an additional regressor beforeconducting t-tests of FA values. In fact, MODE and FA aretheoretically orthogonal shape measures, and togetherwith tensor norm they form a shape basis that candescribe the shape of any diffusion tensor, so if there isany correlation between them, this is induced by the data.In an effort to introduce MODE as a possible fiber crossingconfound of FA, however, we used a second order regres-sion (See following formula).
FA ¼ a0 þ a1MODEþ a2MODE2 þ e
a0, a1, a2: regression coefficients, e: residual.In addition, false discovery rate (FDR) was applied to
the first level statistical analysis for the purpose of multi-ple-comparison correction.
RESULTS
Although there were significant group differences ineducation, WAIS-III IQ and SES (P < 0.001 for all), therewere no significant group differences in age, PSES, hand-edness or WRAT3-RS (Table I).
The results of three-way ANOVAs for DTI measures(FA/MD values) are summarized in Table II. Both DTImeasures demonstrated a significant main effect for group,as well as a main effect for region, but no side effect, orgroup by region interaction.
The multiple one-way ANOVAs that followed revealedsignificant group effects for FA/MD values of IC projec-tions to each frontal BA (also listed in Table III). For theconvenience of interpretation of functionally similar Brod-mann regions, we describe the significant results of BA 9/46 together and BA 44/45 together in all the followingdescriptions:
TABLE I. Demographic characteristics for SZs and NCs
Characteristics SZs (n ¼ 18) NCs (n ¼ 21)
t-Student test (two-tailed)
t Df P
Age (years) 39 � 8.7 42.7 � 6.6 1.3 38 0.21Education (years)a 12.4 � 2.0 15.6 � 2.4 4.1 37 <0.001
WAIS-iii IQb 93.3 � 13.6 108.7 � 12.6 5.0 33 <0.001
WRAT3 RSc 105.0 � 10.7 103.4 � 11.8 �0.34 24 0.73SESa,d 3.8 � 1.2 2.2 � 1.0 �6.5 37 <0.001
Parental SESa,d 2.9 � 1.0 2.5 � 1.2 �0.95 37 0.35LH Finger tappinge,f 39.8 � 9.2 44.4 � 7.0 1.7 31 0.10RH Finger tappinge,f 41.7 � 8.2 48.3 � 7.9 1.7 31 0.11
Demographic attributes that did not show significant group differences in bold. In addition, signifi-cant P values also in bold.aBased on 18 SZs and 20 NCs.bBased on 17 SZs and 17 NCs.cBased on 11 SZs and 14 NCs.dSocioeconomic status (with lower numbers representing higher SES).eTaps per 10 second period.fBased on 19 SZs and 13 NCs.Abbreviations: SZs: chronic schizophrenia subjects; NCs: normal controls; IQ: intelligence quotient;WRAT3-RS: wide range achievements test 3 reading scaled; LH: left hand; RH: right hand.
TABLE II. Three-way ANOVA of DTI measures
Source df
FA MD
F P F P
Main Effect of Group (SZ/NC) 1 17.9 <0.001* 22.0 <0.001*
Main Effect of Side (LH/RH) 1 2.6 0.11 0.39 0.53Main Effect of Region (BAs) 7 10.9 <0.001* 14.0 <0.001*
Group x Region Interaction 7 1.7 0.11 0.31 0.95
Group and region significant main effects on both FA and MD values. Significant results in bold.Abbreviations: ANOVA: analysis of variance; FA: fractional anisotropy; MD: mean diffusivity; NC:normal control; SZ: chronic schizophrenia; LH: left hemisphere; RH: right hemisphere; BA: Brod-mann area.
r Thalamo-Frontal WMT in Chronic Schizophrenia r
r 3817 r

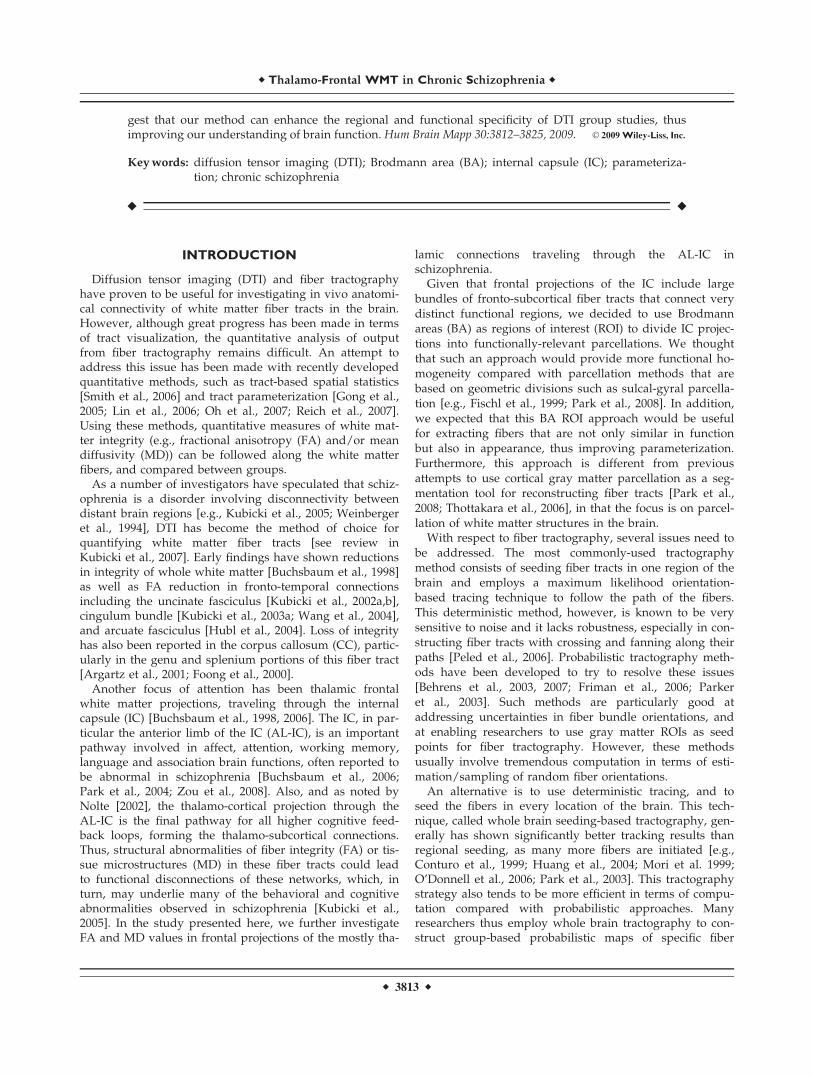
Simultaneous decrease in FA and increase in MD wereobserved only for the dorsolateral prefrontal projections(DLPFC - BA 9/46) (F ¼ 4.7, P ¼ 0.03 for the FA), and(F ¼ 14, P < 0.001 for the MD). Decreased FA withoutchanges in MD was observed for the anterior cingulateprojections (ACC - BA 32) (F ¼ 6.31, P ¼ 0.01) and BA 44/45 projections (that include Broca area on the left) (F ¼5.86, P ¼ 0.02). Finally, increased MD without FA changeswas observed for the frontal pole projections (FP - BA 10)(F ¼ 6.36, P ¼ 0.01), the orbitofrontal projections (orbito-frontal cortex [OFC] OFC - BA 11) (F ¼ 9.52, P < 0.01) andthe inferior-prefrontal projections (inferior prefrontal cor-tex [IPFC] IPFC - BA 47) (F ¼ 5.49, P ¼ 0.02).
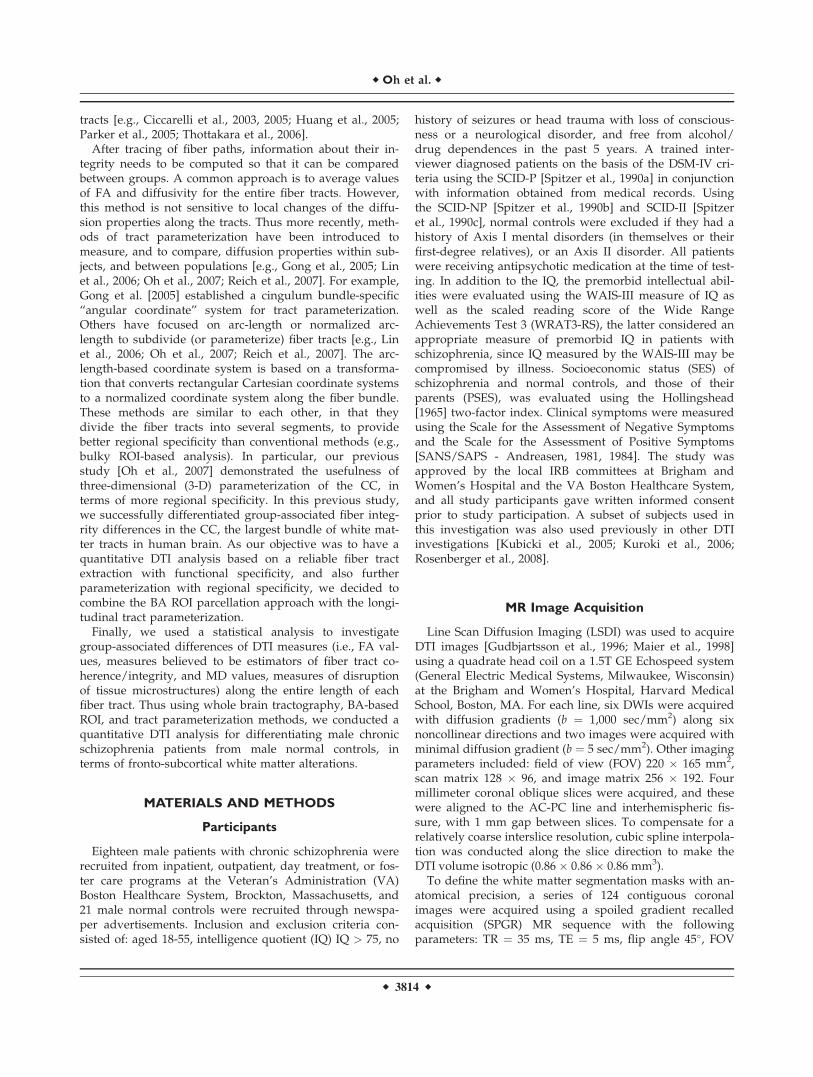
Finally, post hoc independent t-tests revealed regionallyspecific group differences for both DTI measures (FA andMD), localized as follows: FA showed decreases in theproximal (thalamic) part of the BA 9/46 projections, andin the middle part of the BA 9/46 and the BA 44 projec-tions, whereas MD showed increases in the proximal anddistal (cortical) parts of the BA 9/46, BA 47, BA 10, andBA 11 projections (Figs. 2–3 for more details). Accordingto our results, not all ROI connections were affected in thesame way (Figs. 2–3). More specifically, unlike FA differ-ences (which were detected in DLPFC and BA 44/45) inproximal (near IC) and middle parts, most MD differenceswere found in the distant (closer to the cortex) parts of thefiber projections to the rostral BA.
Figure 4 demonstrates results of FA analysis before andafter removing possible confounds of age and mode fromthe analysis, demonstrating that neither fiber crossing norage significantly affected the results.
We found that for most regions intersubject variability(subject vs. subject variability of mean FA value at eachlocation) was equal or smaller than intrasubject variability(location vs. location variability of regional FA values ineach subject), with the exception of area BA 47, where the
intersubject variability was greater than intrasubject vari-ability (Table IV for detail).
DISCUSSION
Results of our study demonstrate local decrease of FAand/or increase of MD values, in patients compared withcontrols, within several functionally specific fronto-tha-lamic tracts, including the projections to and from DLPFC,ACC, BA 44/45, frontal pole, OFC and IPFC. These find-ings were independent of IQ, parental SES, and age. Tothe best of our knowledge, the present study is the first tocombine a BA-specific ROI selection and a tract parameter-ization technique. It is also the first study that applies thistechnique to thalamo-frontal white matter connections inschizophrenia. Of further note, our results indicate dis-rupted fiber integrity (FA decreases) and disrupted tissuemicrostructures (MD increases) in schizophrenia that con-cur with results of previous histopathologic studies whereabnormalities in oligodendrocyte function have beenreported [Uranova et al., 2001, 2004].
Previous studies investigating these connections haveused more generic approaches. For example, some studieshave focused on the integrity and asymmetry of the AL-IC,using a voxel-based morphometry (VBM) approach, andreported decreased FA, altered magnetization transfer anddiminished asymmetry within this region [Kubicki et al.,2005; Park et al., 2004]. Others have used fiber tractography,measuring the length of fronto-thalamic fiber tracts andreporting their shortening in schizophrenia [Buchsbaumet al., 2006]. Finally, Kim et al. [2008] used sulcal/gyral par-cellation to separate and measure anatomically specific tha-lamo-cortical projections, and reported increased mean MDin thalamo-orbitofrontal and thalamo-parietal-occipital-tem-poral fiber tracts in patients with schizophrenia.
TABLE III. Multiple one-way ANOVAs of DTI measures for each BA
Region df
FA MD
mean
F P
mean
F PNC SZ NC SZ
BA 9a/46b 1 0.32 � 0.02 0.30 � 0.03 4.7 0.03 0.74 � 0.04 0.79 � 0.04 14 <0.001
BA 10b 1 N/S N/S N/S N/S 0.78 � 0.04 0.81 � 0.03 6.3 0.01
BA 11b 1 N/S N/S N/S N/S 0.80 � 0.03 0.84 � 0.05 9.5 <0.01
BA 32a 1 0.32 � 0.03 0.28 � 0.03 6.3 0.01 N/S N/S N/S N/SBA 44a(/45) 1 0.34 � 0.03 0.31 � 0.05 5.9 0.02 N/S N/S N/S N/SBA 47b 1 N/S N/S N/S N/S 0.77 � 0.03 0.79 � 0.03 5.5 0.02
Results of fractional anisotropy (FA) and mean diffusivity (MD) group comparison for the internal capsule projections to frontal Brod-mann areas (BAs). Significant group differences in bold.aBAs with significant FA value differences.bBAs with significant MD value differences; BA 9/46: DLPFC; BA 10: frontal pole; BA11: orbitofrontal cortex; BA32: anterior cingulatecortex; BA44/45: left hemispheric part of these areas includes Broca’s area; BA 47: inferior prefrontal cortex.Abbreviations: ANOVAs: analyses of variance; FA: fractional anisotropy; MD: mean diffusivity; BA: Brodmann area; DLPFC: dorsolat-eral prefrontal cortex; N/S: not significant.
r Oh et al. r
r 3818 r
As opposed to other tractography approaches, our inves-tigation attempted to separate fronto-thalamic tracts basedon functional, rather than anatomical cortical segmentation.The advantage of this method is that extracted fiber tractscarry information to and from functionally homogenousregions of gray matter, and their integrity is inevitablyrelated to particular brain function of specific BA that wasused for tract segmentation. In this way, the relationshipbetween anatomy and function, and their associated abnor-malities in schizophrenia, are likely easier to establish. Inaddition, we included tract parameterization, which allowsus to perform group comparison at any given positionalong the extracted fiber bundles, thus further increasingsensitivity and specificity. Our approach essentially com-bines the strengths of two different conventional methods:(1) In the VBM approach, group comparison of white mat-ter integrity can be studied for every voxel of the humanbrain, but differences cannot be straight-forwardly assigned
to specific fiber bundle [Kubicki et al., 2005; Park et al.,2004]. Using inverse normalization of significant differenceregions, however, one can conduct post-hoc tractographyto assign fiber tracts to regional differences. Nonetheless,this approach will require additional efforts to warrantintersubject homology of each voxel in each subject. Alter-natively, we tried to define intersubject homologous pointsusing a tract-oriented method called tract parameterization.More importantly, our method is less affected by intersub-ject registration of white matter features and its errors. (2)In the tractography approach, specific tracts are extracted,but group comparison is being carried on the diffusionproperties averaged over the entire tract, rather than stud-ied for each voxel of the tract separately (and thus the pos-sible local, subtle differences might be washed out by theaveraging) [Kim et al., 2008; Rosenberger et al., 2008].
Region-by-region descriptions with respect to FA and/or MD differences are as follows: (1) The DLPFC related
Figure 2.
Results of tract parameterization and FA group comparison.
Footnote: FA distributions along the tracts, and group differen-
ces for tracts interconnecting IC and three Brodmann areas
(BAs). In the left column, thicker lines represent group differen-
ces at a < 0.05 corrected using false discovery rate (FDR)).
Middle column illustrates logarithmically scaled P values, with
the red line representing significance cut-off. Right-hand column
shows ROIs used (IC- dark pink, BAs- dark cyan). In addition,
we present an illustrative visualization using image and tracto-
graphic data from a normal control subject. The colors indicate
no differences (white) and significant differences, i.e., FDR-cor-
rected a < 0.05 (red). Abbreviations: BA: Brodmann area; IC:
internal capsule; FA: fractional anisotropy; DLPFC: dorsolateral
prefrontal cortex; Ant.: anterior; Sup.: superior; L.: left; R.: right.
r Thalamo-Frontal WMT in Chronic Schizophrenia r
r 3819 r

Figure 3.
Results of tract parameterization and MD group comparison. Abbreviations: BA: Brodmann area;
IC: internal capsule; MD: mean diffusivity; DLPFC: dorsolateral prefrontal cortex; FP: frontal
pole; OFC: orbitofrontal cortex; IPFC: inferior prefrontal cortex; Ant.: anterior; Sup.: superior;
L.: left; R.: right.

part of the AL-IC, that is the tract carrying connectionsmostly between DLPFC and medial-dorsal thalamic nu-cleus, demonstrated both decreased FA and increased MDvalues. This bundle, by virtue of its anatomical connec-tions, likely plays an important role in affect, associationand working memory functions, all reported to be abnor-mal in schizophrenia [Bunney and Bunney, 2000; Cannonet al., 2005; Schlosser et al., 2003]. (2) Decreased fiberintegrity in thalamic projection to BA 44/45, whichincludes Broca’s area, suggests a disruption in the lan-guage network [Felleman and Van Essen, 1991; Petridesand Pandya, 1988] that might elucidate language processabnormalities in schizophrenia [Hubl et al., 2004]. TheACC, thalamic projection to which showed decreased FAvalues as well, is related to cognitive functions includingexecutive attention, reward anticipation, decision-makingand affective functions, which are also abnormal in schizo-phrenia [Quintana et al., 2004; Szeszko et al., 2007]. (3)Although not frequently addressed in previous studies,increased MD values in IC projections to OFC and IPFCare likely important as they underlie cognitive processes,including decision-making in OFC [Hutton et al., 2002],
and syntax processing in spoken and signed languages inIPFC [Kubicki et al., 2003b], all reported to be abnormal inschizophrenia.
Figure 4.
Controlling for possible confounds of age and fiber crossing (MODE). Abbreviations: FA: frac-
tional anisotropy; DLPFC: dorsolateral prefrontal cortex.
TABLE IV. Comparison between inter-subject and
intra-subject variabilities of diffusion measures
BA P values
Mann-Whitney statistics
Intra-subjectvariability
Inter-subjectvariability
9a 0.03* 1555 234544a 0.11 2206 169410b 0.05 1602 229811b 0.06 2277 162346b 0.35 2031 186947b <0.001* 2733 1167
aComparison between intra-subject variability and inter-subjectvariability of FA values.bComparison between intra-subject variability and inter-subjectvariability of MD values.*P < 0.05.
r Thalamo-Frontal WMT in Chronic Schizophrenia r
r 3821 r

According to our results above, not all ROI connectionswere affected in the same way (Figs. 2–3). Since we foundsignificant FA (but not MD) changes in IC connections toarea 9, and MD (but not FA) changes in IC projections toarea 46, DLPFC connectivity results should be treated withcaution. One possible source of such a differential patternof changes in schizophrenia might be due to an anatomicaldifference in the way that the thalamocortical tracts areaffected for these two ROIs in schizophrenia, as well asindividual variability of BAs 9 and 46, which was demon-strated previously by Rajkowska and Goldman-Rakic[1995]. Since the intersubject variability for most regionswas equal or smaller than intrasubject (regional) variabili-ty, we believe it is appropriate to perform not only‘‘bulky’’ tract analysis (i.e., ANOVAs) but also ‘‘regional’’tract analysis (i.e., parameterization). However, since BA47 showed greater intersubject variability of MD values,this region should be treated with more caution.
Interestingly, MD differences were seen along the tractswhen reaching the cortex, and all correspond with rostralBAs. Indeed, we have utilized LSDI for DTI acquisition.Since this imaging technique is relatively free from imagedistortions observed with EPI-based DTIs, we think theresults are not an artifact. Instead, we think that the natureof this dissociation could be due to the fact that the MDmeasures, which basically reflect tissue micro structuredisruption, could be more influenced by architectural,neuro-developmental, and more importantly, cortical reor-ganization than FA, and that MD might be more sensitiveto changes in low coherence regions, and FA in morecoherent regions.
The following limitations should be noted when inter-preting our results. As noted by Smith et al. [2006], ourparameterization method, similar to all parameterization-based approaches tends to be more reliable for large fibertracts but less so for smaller bundles.
As mentioned above, our tracts of interest (frontal pro-jection of the IC tracts) interconnect gray matter regionsincluding frontal lobe and thalamus. To better constructthese gray matter-relevant areas, we chose a relatively lowFA threshold (0.1) for the seeding and stopping criteria offiber tractography. Although low FA values, which alsoimply high fiber orientation uncertainties, can cause possi-ble shape variability of the reconstructed white mattertracts, the parameterization has been regularized by cut-ting tracts between two ROIs (Fig. 1).
Based on whole brain seeding, we were able to improvethe robustness of the fiber tractography in the presence ofuncertainty of the fiber orientation due to noise and fibercrossings. Whole brain tractography, however, is not anultimate solution for these problems, and methods that ex-plicitly model tract orientation uncertainty (such as sto-chastic approaches [Behrens et al., 2003; Friman et al.,2006; Parker et al., 2003] need to be applied. Another con-sideration is to use high angular resolution diffusion imag-ing, including Q-ball imaging [Tuch, 2004] as used bySchmahmann et al. [2007], although such an approach
might be unrealistic in clinical studies due to theextremely long acquisition time.
As demonstrated by Rajkowska and Goldman-Rakic[1995], Amunts et al. [2007], and Malikovic et al. [2007],individual variability of BAs, not captured by a BA tem-plate approach, should be considered when interpretingthe results. One study has also been conducted using gyraland sulcal borderlines for tract definition on the basis ofcortical surface parameterization [Park et al., 2008]. Sinceeach approach has their pros and cons (more functionalspecificity for Brodmann ROIs vs. better anatomical preci-sion for gyral ROIs), more experiments are needed to dem-onstrate the pros and cons of one method versus another.In addition, BA ROIs are easy-to-define using simple spa-tial transformation, which is the reason why voxel-basedanalyses are so popular in all neuroimaging studies.
Finally, we should note that the spatial resolution of ourscans was relatively low, and thus partial volume effectsmight cause potential artifacts in data analysis and coregis-tration. We also note that the sample size of participants,although comparable with most DTI studies to date, wasrelatively small. In addition, we evaluated chronic schizo-phrenia only, medicated subjects only, and men only.Future studies need to evaluate patients with schizophre-nia early in their illness long term neuroleptic use is mini-mal. Previous publications suggest that history ofsubstance abuse, especially its duration [Pfefferbaum et al.,2009], as well as dependence could be a potential con-founding factor for DTI results. We, however, excludedsubjects with a history of substance dependence and weexcluded subjects with substance abuse in the last year.We nonetheless did not have the data available to testmore specifically for such a relationship, and future stud-ies should include more detailed information regardingsubstance abuse and dependence in schizophrenia and itspossible association with white matter pathology. Femalepatients should also be included to evaluate gender differ-ences in this disorder. Similarly, due to using anisotropicvoxels and relatively fewer number of diffusion gradientdirections, we can expect the statistical results might be bi-ased by partial volume effects that can not be radicallyresolved by image volume interpolation. In addition, thereis an argument that interpolating potentially underesti-mates FA values, and that FA estimation errors dependson resolution, especially in regions of fiber crossings [Oou-chi et al., 2007].
CONCLUSION
In summary, this study is the first schizophrenia studyto combine a BA-specific ROI approach and tract parame-terization to compare diffusion properties of the thalamo-frontal projections in schizophrenia compared with healthycontrols. Based on our findings, we believe that ourmethod improves regional and functional specificity of thespatial statistics of the diffusion properties, forming a
r Oh et al. r
r 3822 r

potential promising tool for detecting pathological proc-esses in important white matter tracts in schizophrenia.
REFERENCES
Amunts K, Schleicher A, Zilles K (2007): Cytoarchitecture of thecerebral cortex—More than localization. Neuroimage 37:1061–1065.
Andreasen NC (1981): Scale for the Assessment of NegativeSymptoms (SANS). Iowa City, IA: Department of Psychiatry,University of Iowa College of Medicine.
Andreasen NC (1984): Scale for the Assessment of Positive Symp-toms (SAPS). Iowa City, IA: Department of Psychiatry, Univer-sity of Iowa College of Medicine.
Argartz I, Andersson JL, Skare S (2001): Abnormal brain whitematter in schizophrenia: A diffusion tensor imaging study.Neuroreport 12:2241–2254.
Behrens TE, Johansen-Berg H, Woolrich MW, Smith SM, Wheeler-Kingshott CA, Boulby PA, Barker GJ, Sillery EL, Sheehan K,Ciccarelli O, Thompson AJ, Brady JM, Matthews PM (2003):Non-invasive mapping of connections between human thalamusand cortex using diffusion imaging. Nat Neurosci 6:750–757.
Behrens TE, Berg HJ, Jbabdi S, Rushworth MF, Woolrich MW(2007): Probabilistic diffusion tractography with multiple fibreorientations: What can we gain. Neuroimage 34:144–155.
Buchsbaum MS, Tang CY, Peled S, Gudbjartsson H, Lu D, HazlettEA, Downhill J, Haznedar M, Fallon JH, Atlas SW (1998): MRIwhite matter diffusion anisotropy and PET metabolic rate inschizophrenia. Neuroreport 9:425–430.
Buchsbaum MS, Schoenknecht P, Torosjan Y, Newmark R, ChuKW, Mitelman S, Brickman AM, Shihabuddin L, HaznedarMM, Hazlett EA, Ahmed S, Tang C (2006): Diffusion tensorimaging of frontal lobe white matter tracts in schizophrenia.Ann Gen Psychiatry 28:5–19.
Bunney WE, Bunney BG (2000): Evidence for a compromised dor-solateral prefrontal cortical parallel circuit in schizophrenia.Brain Res Brain Res Rev 31:138–146.
Cannon TD, Glahn DC, Kim J, Van Erp TG, Karlsgodt K, CohenMS, Nuechterlein KH, Bava S, Shirinyan D (2005): Dorsolateralprefrontal cortex activity during maintenance and manipula-tion of information in working memory in patients with schiz-ophrenia. Arch Gen Psychiatry 62:1071–1080.
Ciccarelli O, Toosy AT, Parker GJ, Wheeler-Kingshott CA, BarkerGJ, Miller DH, Thompson AJ (2003): Diffusion tractographybased group mapping of major white-matter pathways in thehuman brain. Neuroimage 19:1545–1555.
Ciccarelli O, Toosy AT, Hickman SJ, Parker GJ, Wheeler-KingshottCA, Miller DH, Thompson AJ (2005): Optic radiation changesafter optic neuritis detected by tractography-based group map-ping. Hum Brain Mapp 25:308–316.
Conturo TE, Lori NF, Cull TS, Akbudak E, Snyder AZ, ShimonyJS, McKinstry RC, Burton H, Raichle ME (1999): Tracking neu-ronal fiber pathways in the living human brain. Proc NatlAcad Sci USA 96:10422–10427.
Ennis DB, Kindlmann G (2006): Orthogonal tensor invariants andthe analysis of diffusion tensor magnetic resonance images.Magn Reson Med 55:136–146.
Felleman DJ, Van Essen DC (1991): Distributed hierarchical pro-cessing in the primate cerebral cortex. Cereb Cortex 1:1–47.
Fischl B, Sereno MI, Tootell RB, Dale AM (1999): High-resolutionintersubject averaging and a coordinate system for the corticalsurface. Hum Brain Mapp 8:272–284.
Foong J, Maier M, Clark CA, Barker GJ, Miller DH, Ron MA(2000): Neuropathological abnormalities of the corpus callosumin schizophrenia: A diffusion tensor imaging study. J NeurolNeurosurg Psychiatry 68:242–244.
Friman O, Farneback G, Westin CF (2006): A Bayesian approachfor stochastic white matter tractography. IEEE Trans MedImaging 25:965–978.
Gong G, Jiang T, Zhu C, Zang Y, Wang F, Xie S, Xiao J, Guo X(2005): Asymmetry analysis of cingulum based on scale-invari-ant parameterization by diffusion tensor imaging. Hum BrainMapp 24:92–98.
Gudbjartsson H, Maier SE, Mulkern RV, Morocz IA, Patz S, JoleszFA (1996): Line scan diffusion imaging. Magn Reson Med36:509–519.
Hollingshead AB (1965): Two Factor Index of Social Position. NewHaven, CT: Yale University Press.
Huang H, Zhang J, van Zijl PC, Mori S (2004): Analysis of noiseeffects on DTI-based tractography using the brute-force andmulti-ROI approach. Magn Reson Med 52:559–565.
Huang H, Zhang J, Jiang H, Wakana S, Poetscher L, Miller MI,van Zijl PC, Hillis AE, Wytik R, Mori S (2005): DTI tractogra-phy based parcellation of white matter: Application to themid-sagittal morphology of corpus callosum. Neuroimage26:195–205.
Hubl D, Koenig T, Strik W, Federspiel A, Kreis R, Boesch C,Maier SE, Schroth G, Lovblad K, Dierks T (2004): Pathwaysthat make voices: White matter changes in auditory hallucina-tions. Arch Gen Psychiatry 61:658–668.
Hutton SB, Murphy FC, Joyce EM, Rogers RD, Cuthbert I, BarnesTR, McKenna PJ, Sahakian BJ, Robbins TW (2002): Decisionmaking deficits in patients with first-episode and chronicschizophrenia. Schizophr Res 55:249–257.
Kim DJ, Kim JJ, Park JY, Lee SY, Kim J, Kim IY, Kim SI, Park HJ(2008): Quantification of thalamocortical tracts in schizophreniaon probabilistic maps. Neuroreport 19:399–403.
Kubicki M, Westin CF, Maier SE, Mamata H, Frumin M, Ersner-Hershfield H, Kikinis R, Jolesz FA, McCarley R, Shenton ME(2002a): Diffusion tensor imaging and its application to neuro-psychiatric disorders. Harv Rev Psychiatry 10:324–336.
Kubicki M, Westin CF, Maier SE, Frumin M, Nestor PG, SalisburyDF, Kikinis R, Jolesz FA, McCarley RW, Shenton ME (2002b):Uncinate fasciculus findings in schizophrenia: A magnetic res-onance diffusion tensor imaging study. Am J Psychiatry 159:813–820.
Kubicki M, Westin CF, Nestor PG, Wible CG, Frumin M, MaierSE, Kikinis R, Jolesz FA, McCarley RW, Shenton ME (2003a):Cingulate fasciculus integrity disruption in schizophrenia: Amagnetic resonance diffusion tensor imaging study. Biol Psy-chiatry 54:1171–1180.
Kubicki M, McCarley RW, Nestor PG, Huh T, Kikinis R, ShentonME, Wible CG (2003b): An fMRI study of semantic processingin men with schizophrenia. Neuroimage 20:1923–1933.
Kubicki M, Park HJ, Westin CF, Nestor PG, Mulkern RV, MaierSE, Niznikiewicz M, Connor EE, Levitt JJ, Frumin MM, KikinisR, Jolesz FA, McCarley RW, Shenton ME (2005): DTI and MTRabnormalities in schizophrenia: Analysis of white matter integ-rity. Neuroimage 15:1109–1118.
Kubicki M, McCarley RW, Westin CF, Park HJ, Maier SE, Kikinis R,Jolesz FA, Shenton ME (2007): A review of diffusion tensor imag-ing studies in schizophrenia. J Psychiatr Res 41:15–30.
Kuroki N, Kubicki M, Nestor PG, Salisbury DF, Park HJ, Levitt JJ,Woolston S, Frumin M, Niznikiewicz M, Westin CF, Maier SE,
r Thalamo-Frontal WMT in Chronic Schizophrenia r
r 3823 r

McCarley RW, Shenton ME (2006): Fornix integrity and hippo-campal volume in male schizophrenic patients. Biol Psychiatry60:22–31.
Lin F, Yu C, Jiang T, Li K, Qin W, Sun H, Chan P (2006): Quanti-tative analysis along the pyramidal tract by length-normalizedparameterization based on diffusion tensor tractography:Application to patients with relapsing neuromyelitis optica.Neuroimage 33:154–160.
Lorensen W, Cline HE (1987): Marching cubes: A high resolution3D surface construction algorithm. Computer Graphics (SIG-GRAPH 87 Proc) 21:163–170.
Maier SE, Gudbjartsson H, Patz S, Hsu L, Lovblad KO, EdelmanRR, Warach S, Jolesz FA (1998): Line scan diffusion imaging:Characterization in healthy subjects and stroke patients. AJRAm J Roentgenol 44:584–590.
Malikovic A, Amunts K, Schleicher A, Mohlberg H, Eickhoff SB,Wilms M, Palomero-Gallagher N, Armstrong E, Zilles K(2007): Cytoarchitectonic analysis of the human extrastriatecortex in the region of V5/MT: A probabilistic, stereotaxic mapof area hOc5. Cereb Cortex 17:562–574.
Mori S, Crain BJ, Chacko VP, van Zijl PC (1999): Three-dimen-sional tracking of axonal projections in the brain by magneticresonance imaging. Ann Neurol 45:265–269.
Nolte J (2002): The Human Brain: An Introduction to Its Func-tional Anatomy, 5th ed. St. Louis: Mosby, Inc.
O’Donnell LJ, Kubicki M, Shenton ME, Dreusicke MH, GrimsonWEL, Westin CF (2006): A method for clustering white matterfiber tracts. AJNR Am J Neuroradiol 27:1032–1036.
Oh JS, Song IC, Lee JS, Kang H, Park KS, Kang E, Lee DS (2007):Tractography-guided statistics (TGIS) in diffusion tensor imag-ing for the detection of gender difference of fiber integrity inthe midsagittal and parasagittal corpora callosa. Neuroimage36:606–616.
Oouchi H, Yamada K, Sakai K, Kizu O, Kubota T, Ito H, Nishi-mura T (2007): Diffusion anisotropy measurement of brainwhite matter is affected by voxel size: Underestimation occursin areas with crossing fibers. AJNR Am J Neuroradiol 28:1102–1106.
Park HJ, Kubicki M, Shenton ME, Guimond A, McCarley RW,Maier SE, Kikinis R, Jolesz FA, Westin CF (2003): Spatial nor-malization of diffusion tensor MRI using multiple channels.Neuroimage 20:1995–2009.
Park HJ, Westin CF, Kubicki M, Maier SE, Niznikiewicz M, BaerA, Frumin M, Kikinis R, Jolesz FA, McCarley RW, Shenton ME(2004): White matter hemisphere asymmetries in healthy sub-jects and in schizophrenia: A diffusion tensor MRI study. Neu-roimage 23:213–223.
Park HJ, Kim JJ, Lee SK, Seok JH, Chun J, Kim DI, Lee JD(2008): Corpus callosal connection mapping using corticalgray matter parcellation and DT-MRI. Hum Brain Mapp29:503–516.
Parker GJ, Haroon HA, Wheeler-Kingshott CA (2003): A frame-work for a streamline-based probabilistic index of connectivity(PICo) using a structural interpretation of MRI diffusion mea-surements. J Magn Reson Imaging 18:242–254.
Parker GJ, Luzzi S, Alexander DC, Wheeler-Kingshott CA, Ciccar-elli O, Lambon Ralph MA (2005): Lateralization of ventral anddorsal auditory-language pathways in the human brain. Neu-roimage 24:656–666.
Peled S, Friman O, Jolesz F, Westin CF (2006): Geometrically con-strained two-tensor model for crossing tracts in DWI. MagnReson Imaging 24:1263–1270.
Petrides M, Pandya DN (1988): Association fiber pathways to thefrontal cortex from the superior temporal region in the rhesusmonkey. J Comp Neurol 273:52–66.
Pfefferbaum A, Rosenbloom M, Rohlfing T, Sullivan EV (2009):Degradation of association and projection white matter sys-tems in alcoholism detected with quantitative fiber tracking.Biol Psychiatry 65:680–690.
Quintana J, Wong T, Qrtiz-Portillo E, Marder SR, Mazziotta JC(2004): Anterior cingulate dysfunction during choice anticipa-tion in schizophrenia. Psychiatry Res 132:117–130.
Rajkowska G, Goldman-Rakic PS (1995): Cytoarchitectonic defini-tion of prefrontal areas in the normal human cortex. II. Vari-ability in locations of area 9 and 46 and relationship to thetalairach coordinate system. Cereb Cortex 5:323–337.
Reich DS, Smith SA, Jones CK, Zackowski KM, van Zijl PC, Cala-bresi PA, Mori S (2007): Quantitative characterization of the cor-ticospinal tract at 3T. AJNR Am J Neuroradiol 27:2168–2178.
Rosenberger G, Kubicki M, Nestor PG, Connor E, Bushell GB,Markant D, Niznikiewicz M, Westin CF, Kikinis R, J Saykin A,McCarley RW, Shenton ME (2008): Age-related deficits infronto-temporal connections in schizophrenia: A diffusion ten-sor imaging study. Schizophr Res 102:181–188.
Schlosser R, Gesierich T, Kaufmann B, Vucurevic G, Hunsche S,Gawehn J, Stoeter P (2003): Altered effective connectivity dur-ing working memory performance in schizophrenia: A studywith fMRI and structural equation modeling. Neuroimage19:751–763.
Schmahmann JS, Pandya DN, Wang R, Dai G, D’Acceuil HE, deCrespigny AJ, Wedeen VJ (2007): Association fibre pathwaysof the brain: Parallel observations from diffusion spectrumimaging and autoradiography. Brain 130:630–653.
Smith SM, Jenkinson M, Johansen-Berg H, Rueckert D, NicholsTE, Mackay CE, Watkins KE, Ciccarelli O, Cader MZ, Mat-thews PM, Behrens TE (2006): Tract-based spatial statistics:Voxelwise analysis of multi-subject diffusion data. Neuroimage31:1487–1505.
Spitzer RL, Williams JB, Gibbson M, First M (1990a): The Struc-tured Clinical Interview for DSM-III-R (SCID). Washington,DC: American Psychiatric Association.
Spitzer RL, Williams JB, Gibbson M, First M (1990b): The StructuredClinical Interview for DSM-III-R-Non-Patient Edition (SCID-NP). Washington, DC: American Psychiatric Association.
Spitzer RL, Williams JB, Gibbson M, First M (1990c): The Struc-tured Clinical Interview for DSM-III-R-Personality-Disorder(SCID-II). Washington, DC: American Psychiatric Association.
Szeszko PR, Robinson DG, Sevy S, Kumra S, Rupp CI, BetenskyJD, Lencz T, Ashtari M, Kane JM, Malhotra AK, Gunduz-BruceH, Napolitano B, Blider RM (2007): Anterior cingulate grey-matter deficits and cannabis use in first-episode schizophrenia.Br J Psychiatry 190:230–236.
Thottakara P, Lazar M, Johnson SC, Alexander AL (2006): Appli-cation of Brodmann’s area templates for ROI selection in whitematter tractography studies. Neuroimage 29:868–878.
Tuch DS (2004): Q-ball imaging. Magn Reson Med 52:1358–1372.
Uranova N, Orlovskaya D, Vikhreva O, Zimina I, Kolomeets N,Vostrikov V, Rachmanova V (2001): Electron microscopy of oli-godendroglia in severe mental illness. Brain Res Bull 55:597–610.
Uranova NA, Vostrikov VM, Orlovskaya DD, Rachmanova VI(2004): Oligodendroglia density in the prefrontal cortex inschizophrenia and mood disorder: A study from the stanleyneuropathology consortium. Schizophr Res 55:597–610.
r Oh et al. r
r 3824 r

Wang F, Sun Z, Cui L, Du X, Wang X, Zhang H, Cong Z, HongN, Zhang D (2004): Anterior cingulum abnormalities in malepatients with schizophrenia determined through diffusion ten-sor imaging. Am J Psychiatry 161:573–575.
Weinberger DR, Aloia MS, Goldberg TE, Berman KF (1994): Thefrontal lobes and schizophrenia. J Neuropsychiatry Clin Neu-rosci 6:419–427.
Zarei M, Johansen-Berg H, Jenkinson M, Ciccarelli O, ThompsonAJ, Mattews PM (2007): Two-dimensional population map ofcortical connections in the human internal capsule. J MagnReson Imaging 25:48–54.
Zou LQ, Xie JX, Yuan HS, Pei XL, Dong WT, Liu PC (2008): Diffu-sion tensor imaging study of the anterior limb of internal capsu-les in neuroleptic-naive schizophrenia. Acad Radiol 15:285–289.
r Thalamo-Frontal WMT in Chronic Schizophrenia r
r 3825 r