thailand’s economic conditions in 201 content...thailand’s economic conditions in 2015 1 year...
TRANSCRIPT


Thailand’s Economic Conditions in 2015 Content
Year 2015 at a Glance and Outlook for 2016 ........................................................................... 1
The Thai Economy in 2015 ............................................................................................................. 3
1. Global Economies ............................................................................................................... 4
2. International Trade and Balance of Payments ...................................................... 11 2.1 Merchandise trade ........................................................................................................ 11 2.2 Exports and imports of services ................................................................................. 15 2.3 Balance of payments.................................................................................................... 16 Box: Thailand’s exports: the lost momentum and economic implications ............ 19
3. Domestic Demand ............................................................................................................ 22 3.1 Private consumption .................................................................................................... 22 3.2 Private investment ........................................................................................................ 25 3.3 Fiscal sector .................................................................................................................... 27 Box: Government measures and implications on the economy .................................. 31
4. Supply-side Economy ...................................................................................................... 35 4.1 Manufacturing sector .................................................................................................... 35 4.2 Agricultural sector ......................................................................................................... 37 4.3 Services sector ............................................................................................................... 39 4.4 Real estate sector ......................................................................................................... 41
5. Monetary Conditions ...................................................................................................... 43
6. Assessment of Thailand’s Economic Stability ........................................................ 48 6.1 Internal stability ............................................................................................................. 48 6.2 External stability ............................................................................................................ 56
7. Important Policies and Measures ................................................................................ 57
Thailand’s Economic Conditions in 2015 1
Year 2015 at a Glance and Outlook for 2016
The Thai economy recovered gradually in 2015, recording a 2.8 percent growth. Domestic spending was the main driver of growth. Government spending was boosted by quick budget disbursements throughout the year, thanks to a series of stimulus measures designed to shore up economic growth. Private consumption expanded, as income of non-farm households rose from the previous year and consumer confidence picked up. Private consumption growth was achieved despite farm households’ subdued income, which was held back by drought and depressed farm prices, notably rice and rubber prices.
Nevertheless, economic recovery was constrained by contracting exports, both in terms of price and quantity. Export prices dropped in line with the falling oil price. Export quantity fell because of the slowdown in Thailand’s main trading partners’ economies, particularly China and ASEAN, which resulted in the generally low level of manufacturing output. Exports and production of certain product categories, such as automobiles, posted a solid growth. However, this growth was caused by fleeting factors, including the production of new car models and the acceleration of domestic car sales in late 2015 before higher excise tax on cars took effect in 2016. The slow rebounding of domestic demand and weak exports, together with adequate remaining production capacity, caused private investment to fall. Although private investment picked up in the last quarter, investment growth was limited to certain sectors. These included investment in telecommunications to support network expansion following the auction for 4G licenses, and in renewable energy in line with government policy.
In terms of economic and financial stability, headline inflation remained negative due to the sharp fall in oil prices. However, deflation risk was still low because core inflation remained positive and inflation expectations were close to the inflation target. Unemployment rate was low, similar to that in the previous year. Nonetheless, sluggish and uneven economic recovery created greater vulnerabilities in the household and business sectors. The declining loan quality of the private sector heightened concerns over the ability of households and businesses to service debt. Nevertheless, the financial institutions system remained robust and well placed to deal with the impacts of more bad debt.
The current account consistently registered a surplus, owing mainly to the substantial fall in imports amid subdued global oil prices and slow economic recovery. The capital account was in a deficit as foreign investors were net sellers of Thai securities in order to reduce their asset holdings in emerging markets amid higher volatility in the global financial market. Thai investors continued to invest abroad, both in the form of direct investment in pursuit of business opportunities, and portfolio investment in equity and bond markets in

Thailand’s Economic Conditions in 2015 2
search of yield and for diversification purposes. The Thai baht and regional currencies weakened against the U.S. dollars from last year, as the U.S. economy showed positive signs and the market began to anticipate the Fed’s interest rate hike in late 2015. The Effective Exchange Rates depreciated albeit at a slower pace, because the baht moved in the same direction as the regional currencies. There were no concerns over external stability, given that the ratio of international reserves to short-term external debt remained higher than the international benchmark, while the ratio of external debt to GDP remained low.
Monetary conditions became more accommodative. In 2015, the Monetary Policy Committee (MPC) reduced the policy interest rate twice in its March and April meetings, with a view to support and stimulate Thailand’s economic recovery. The policy rate stood at 1.50 percent at the end of 2015. Consequently, the private sector’s financing costs declined, notably in the bond market, prompting large businesses to increase their funding through bonds. However, the gradual economic recovery meant that financial institutions remained cautious in lending. Private credit growth edged up slightly from the previous year. Most corporate loans remained at low levels, but loans in some sectors posted a solid growth, such as real estate, renewable energy and food processing. SME credit partly benefited from the government’s soft loan.
Looking ahead, the Thai economy in 2016 is projected to continue its steady recovery. Domestic spending, both public spending and private consumption, and the tourism sector are expected to be the main engines of growth. They will support economic recovery at a time when exports remain subdued amid the sluggish growth in key trading partners’ economies. Inflation is likely to remain consistently low due mainly to depressed global oil prices. Inflation is projected to slowly turn positive as the high-base effects subside and domestic demand picks up.

Thailand’s Economic Conditions in 2015 3
Year H1 H2 Year H1 H2 Year(Annual percentage change, unless specified otherwise)
Gross Domestic Product1/ 2.7 0.1 1.5 0.8 2.8 2.8 2.8 Demand (expenditure) Private consumption expenditure 1.0 -0.9 2.0 0.6 2.1 2.1 2.1 General government consumption expenditure 2.5 2.3 1.9 2.1 0.9 3.5 2.2 Gross fixed capital formation -1.0 -7.6 3.1 -2.4 6.3 3.2 4.7 - Private -1.5 -6.0 4.4 -1.0 0.2 -4.1 -2.0 - Public 0.8 -12.9 -1.3 -7.3 29.4 30.2 29.8 Exports of goods and services 2.7 -0.3 0.7 0.2 1.3 -1.0 0.2 Imports of goods and services 1.6 -9.9 -0.4 -5.3 1.3 -2.0 -0.4 Supply (production) Agriculture 0.8 2.6 -1.0 0.7 -4.4 -3.3 -3.8 Manufacturing 1.7 -1.2 0.8 -0.2 1.0 0.9 0.9 Construction 0.1 -6.6 -0.4 -3.7 15.8 15.8 15.8 Services and others 3.5 0.8 2.2 1.5 4.0 4.0 4.0Domestic stability Headline Consumer Price Index 2.18 2.23 1.56 1.89 -0.81 -0.98 -0.90 Core Consumer Price Index (excluding raw food and energy) 1.00 1.45 1.72 1.59 1.22 0.88 1.05 Unemployment (percent) 0.7 0.9 0.7 0.8 0.9 0.9 0.9 Public debt ( end of period, billion baht) 5,450 5,655 5,624 5,624 5,684 6,005 6,005 Share of GDP (end of period, percent ) 45.7 47.1 46.3 46.3 42.8 44.4 44.4External Stability (billion U.S. dollars) Trade balance 6.7 12.2 12.4 24.6 15.3 19.3 34.6 Current account balance -5.2 5.6 9.9 15.4 14.6 17.0 31.6 Capital account balance 0.3 0.0 0.1 0.1 0.0 0.0 0.0 Financial account balance -2.5 -8.6 -7.9 -16.5 -3.8 -14.3 -18.1 Balance of payments -5.0 -1.1 -0.1 -1.2 7.3 -1.5 5.9 Gross international reserves (end of period) 167.3 168.2 157.1 157.1 160.3 156.5 156.5 External debt (end of period) 141.9 144.9 140.1 140.1 136.5 129.4P 129.4P International reserves to short-term debt (ratio) 2.7 2.7 2.8 2.8 2.9 3.1P 3.1P External debt to GDP (percent) 35.8 36.3 34.4 34.4 33.3 31.8P 31.8P External debt to export value (percent) 51.9 52.7 50.1 50.1 48.6 46.4P 46.4P Short-term debt to external debt (percent) 43.6 43.2 40.0 40.0 40.2 39.6P 39.6PMonetary statistics (end of period) (billion baht) Monetary base 1,581.3 1,508.1 1,668.1 1,668.1 1,549.9 1,710.1 1,710.1 Annual percentage change 5.6 8.8 5.5 5.5 2.8 2.6 2.6 Narrow money 1,661.3 1,585.2 1,682.6 1,682.6 1,619.8 1,781.7 1,781.7 Annual percentage change 3.9 4.3 1.3 1.3 2.2 5.9 5.9 Broad money 16,062.2 16,119.8 16,811.9 16,811.9 17,101.3 17,560.2 17,560.2 Annual percentage change 7.3 4.4 4.7 4.7 6.1 4.5 4.5
Financial institutions' deposits including bills of exchange 2/ 15,764.2 15,788.5 16,433.4 16,433.4 16,776.1 17,274.4 17,274.4 Annual percentage change 7.6 3.8 4.2 4.2 6.3 5.3 5.3
Financial institutions' private credits 2/ 14,688.9 14,892.7 15,343.4 15,343.4 15,651.2 16,159.5 16,159.5 Annual percentage change 10.0 6.5 4.5 4.5 5.3 5.6 5.6Interest rates (end of period) (percent per annum) - Repurchase rate, one-day 2.25 2.00 2.00 2.00 1.50 1.50 1.50 - Overnight interbank rates (mode) 2.15 1.90 1.90 1.90 1.40 1.40 1.40
- Time deposit rate, one year 3/ 2.23 1.73 1.73 1.73 1.50 1.40 1.40
- Prime rate (MLR) 3/ 6.84 6.75 6.75 6.75 6.51 6.51 6.51Exchange rate (end of period) (baht per U.S. dollar) 32.86 32.45 32.90 32.90 33.77 36.00 36.00Nominal Effective Exchange Rate (end of period) (2012=100) 102.12 102.46 109.08 109.08 108.84 106.07 106.07Note: 1/ At constant prices 2/ Financial institution consist of all deposit-taking institutions except the Bank of Thailand 3/ Average rate of four largest commercial banks P = Preliminary data Sources: Office of the National Economic and Social Development Board, Ministry of Commerce, National Statistical Office, Public Debt Management Office and Bank of Thailand
2013 2014 2015
Thailand's Economic Condition in 2015
Thailand’s Economic Conditions in 2015 4
The world economy picked up steadily in 2015 but the pace of recovery was uneven across different regions. The major economies posted a stronger growth, especially the U.S. economy whose economic fundamentals continued to improve. However, the Asian economies expanded at a slower rate as China’s growth weakened.
Major industrialized economies (G3)
The U.S. economy expanded well thanks to a solid consumption growth.
In 2015 the U.S. economy expanded by 2.4 percent, the same rate as in the previous year. In the first quarter of 2015, the economy contracted as the unusually cold weather disrupted economic activities and the labor dispute clogged West Coast ports. Furthermore, subdued oil price reduced profitability and investment of energy firms. However, the U.S. economy in the second quarter grew at a higher rate, driven by buoyed private consumption, especially in durables. This consumption growth
1. Global Economies

Thailand’s Economic Conditions in 2015 5
was supported by the sustained improvements in the labor market. Moreover, exports resumed a positive growth following the end of the labor dispute at the West Coast ports.
In the latter half of the year, the U.S. economy continued to grow thanks to lifted domestic demand, particularly consumption. Nonetheless, net exports were held back by slower growth in emerging market economies and the appreciation of the U.S. dollar. The stronger dollar was a result of invigorated investor confidence in the U.S. economic recovery and growing expectation that the Fed would increase the policy interest rate. In December 2015, the Fed finally raised the policy interest rate for the first time, having maintained the rate at 0 – 0.25 percent for over 7 years. The FOMC’s decision was prompted by improved labor market conditions and higher inflation that had moved closer to the target. The Fed is expected to continue curbing monetary policy easing during 2016, which could lead to occasionally higher volatility in the global financial market. Moreover, reduced monetary easing could pose a downside risk to financial stability of emerging market economies.
-6
-4
-2
0
2
4
6
Q 12013
Q 12014
Q 12015
Net exports Public expenditureChange in inventories InvestmentConsumption GDP
Source: U.S. Department of Commerce
Contribution to Growth of the U.S. Economy%QOQ seasonally adjusted, annualized

Thailand’s Economic Conditions in 2015 6
The euro area1 showed signs of recovery, boosted by eased monetary conditions and a steady job growth.
The euro area economies grew by 1.5 percent in 2015, up from a 0.9 percent growth in the preceding year. In the first half of the year, the euro area economies picked up as stronger domestic demand was lifted by the following factors: (1) accommodative monetary conditions, partly thanks to the European Central Bank’s (ECB) purchases of public sector assets;2 (2) the lower oil price; and (3) improved exports which were boosted by the weaker euro. The euro area’s exports performed well despite two unfavorable developments in the second quarter: the risk of debt default by Greece amidst prolonged negotiations between the Greek government and the lenders, and the European Union’s (EU) imposition of sanctions on Russia that affected exports of several European countries.
Economic growth in the euro area economies moderated slightly in the second half of the year, owing to weaker exports on the back of softer global demand, especially in emerging markets. Moreover, the terrorist acts in Paris in late 2015 debilitated private sector confidence. However, private consumption expanded continually. Going forward, consumption is likely to provide the main thrust for the economy, supported by improved labor market conditions, sustained monetary easing, and low oil price.
1 The euro area comprises 19 countries using the euro as the common currency, namely Greece, Cyprus, the Netherlands, Belgium, Portugal, France, Finland, Malta, Germany, Luxembourg, Latvia, Lithuania, Spain, Slovakia, Slovenia, Austria, Italy, Estonia and Ireland. 2 Since March 2015, the ECB conducted additional quantitative easing by purchasing bonds of 60 billion euro a month. In December 2015, the ECB also extended the asset purchasing program beyond September 2016 to at least March 2017 and lowered the deposit facility rate by 0.10 percentage point to be -0.30%.

Thailand’s Economic Conditions in 2015 7
The Japanese economy expanded gradually in line with the slow growth of domestic demand.
The Japanese economy expanded by 0.5 percent in 2015, up from the 0.0 percent growth in the previous year. Private investment expanded well due to high levels of profitability, particularly among export firms and businesses with overseas investment that benefited from the recent yen depreciation. Although private consumption was boosted from higher wages, overall consumption remained at a low level. Sluggish consumption was partly caused by irregular weather in some quarters, which discouraged household consumption. Exports weakened as demand remained subdued in Japan’s main trading partners’ economies, especially ASEAN.
In December 2015, Japan’s Monetary Policy Committee decided to impose quantitative monetary easing (QQE) along with supplementary QQE to support economic recovery. The measures included an extension of the maturity of the Japanese government bond purchased by the Bank of Japan (BOJ) and the introduction of the New Exchange-Traded Funds (ETFs) program, in which the BOJ bought equity securities closely linked to investment.
Source: Eurostat
Economic Growth Rates in the Eurozone Economy
-2
-1
0
1
2
Q 1 2012
Q 1 2013
Q 1 2014
Q 1 2015
Eurozone Germany France Spain Italy
% QOQ (seasonally adjusted)

Thailand’s Economic Conditions in 2015 8
Chinese and other Asian economies expanded at a slower pace because of weakened exports and domestic demand.
The Chinese economy grew by 6.9 percent in 2015, down from 7.3 percent last year. Contributing to the weaker growth were falling exports, caused by softened demand in trading partners’ economies, and slower investment growth. Investment in the real estate sector weakened markedly due to a high level of excess supply. Investment in industries also slowed down as businesses’ financial standing deteriorated, especially in mining and related industries, and corporate debt rose. Moreover, limitations on local government revenue and on funding sources – caused by restrictions on shadow banking – constrained public investment in infrastructure.
However, private consumption and the growth of the services sector helped support the Chinese economy to a certain extent, thanks to the government’s structural reforms designed to shift the main growth engine from investment and exports to domestic consumption. Private consumption was boosted by (1) rising purchasing power in line with higher wages and low oil price, and (2) accommodative government policies, such as urbanization reform and the 13th economic and social development plan which aimed at raising people’s income. At the same time, the government promoted more activities in the services sector.
-5
-4
-3
-2
-1
0
1
2
3
Q 12013
Q 12014
Q 12015
Net exports Public expenditureChange in inventories InvestmentPrivate GDP
% (seasonally adjusted
Contribution to Growth of Japan’s Economy
Source: Cabinet Office of Japan

Thailand’s Economic Conditions in 2015 9
Moreover, throughout 2015, the Chinese government introduced a series of monetary easing and fiscal measures designed to support the weakening economic growth and achieve the 7 percent target growth rate set for the year. These measures, which helped prevent the economy from slumping too quickly, included: (1) a reduction in the policy rate and the Reserve Requirement Ratio (RRR), (2) the acceleration of infrastructure investment by local governments, and (3) the relaxation of restrictions on the local governments’ capital mobilization.
Looking ahead, the Chinese economy is projected to weaken further. The Chinese government has established an economic growth target of 6.5 percent for the next 5 years.
The Asian economies excluding China expanded at a slower pace in 2015 than last year, mainly as a result of a decline in exports. Falling exports were caused by the following factors: (1) weak demand in trading partner economies, primarily the Chinese economy and ASEAN, whose economic growth was dependent on exports to China, (2) falling world commodity prices which reduced the exports revenue of ASEAN countries where commodities account for a substantial share of exports, and (3) changing global trade structure that reduced the gains made by Asian economies from the recovery in the major industrialized economies. Weakened exports since early 2015 dampened
Source: CEIC
25
30
35
40
45
50
Private consumption Investment
Private Consumption and Investment in China’s Economy
Percent of the economy size

Thailand’s Economic Conditions in 2015 10
domestic demand across the region, especially investment in machinery and equipment. Nonetheless, private consumption gained from the subdued oil price. Consumption picked up despite the lower confidence and greater spending caution among some consumers, who were concerned with signs of weaker growth of jobs in the manufacturing sector.
-25-20-15-10-505
10152025
China Hong Kong TaiwanKorea Malaysia SingaporeIndonesia Philippines Thailand
Source: CEIC
Growth Rates of Export Value in Asian Countries
%YOY, 3-month moving average
Thailand’s Economic Conditions in 2015 11
2.1 Merchandise Exports and Imports
Merchandise Exports
Merchandise export value fell in tandem with export contraction in regional economies, reflecting a decline in both export prices and quantity. Subdued oil and commodity prices in the world market caused export prices to fall. Moreover, a combination of factors caused export quantity to drop. These factors were the slowdown in major trading partners’ economies, notably China and ASEAN, the loss of Thailand’s competitiveness in certain product categories, and the shift in global trade structure.
In 2015, export value continually declined as a result of falling prices and quantity. Export prices dropped because of the low global oil and commodity prices. Prices of petroleum products, chemicals, petrochemicals, rubber and rubber products dropped as a result of the acute fall in crude oil prices. These prices accounted for 16.2 percent of total export value. Moreover,
2. International Trade and Balance of Payments

Thailand’s Economic Conditions in 2015 12
sugar export prices hit a 6-year low on the back of excess supply from India and the depreciation of the Brazilian real (Brazil is the world’s top sugar exporting country).
Export quantity contracted in almost all product categories due to the softened demand from trading partners, especially China, one of Thailand’s major trading partners and a large importer of commodities. The slowdown in China did not only dampen Thailand’s export value directly. It also indirectly led to weakened exports of countries that were net commodity exporters and that were highly dependent on exports to China, notably ASEAN, Australia and the Middle Eastern countries (the share of Thailand’s exports to ASEAN, Australia and the Middle East to Thailand’s total exports were 25.7, 4.6 and 4.9 percent respectively).
Additionally, Thailand’s exports continued to suffer from both internal and external structural constraints. The shift in global trade structure caused global trade to expand considerably slowly relative to world economic growth. This was partly a result of several countries becoming more dependent on domestic demand. For example, China’s economic reform caused imports to fall steadily. Internal structural factors also held back Thailand’s exports: (1) A decline in Thailand’s competitiveness in some products had weighed on the country’s exports recovery over the past three years. Thailand still had limited technological advancement required to raise production capability in response to the changing preferences of global consumers. Consequently, exports of hard disk drives (HDD), one of Thailand’s major export products, continued to contract. (2) The expiration of Thailand’s Generalized Scheme of Preferences (GSP) in all products since early 2015 undermined Thai exports to the euro area.
Nevertheless, some export products expanded well this year due to the following factors. (1) The problem of internal structural constraints started to ease in certain products, such as integrated circuits (IC) and optical instruments. These products recorded a solid growth because some manufacturers had adapted well by investing to expand their productive capacities to meet the changes in global demand. As a result, they benefited

Thailand’s Economic Conditions in 2015 13
more from the launch of new models of smartphones and tablets than in the past. (2) Favorable factors contributed to the growth of exports in specific products. Automobile exports to Australia and ASEAN expanded strongly, thanks to the manufacturing of new car models during mid-year. Rubber and cassava exports increased well, as exports to China were boosted by Chinese government policies. Such policies included an increase in the import tariff of rubber compound, which prompted Chinese importers to switch to natural rubber, and a ban on the use of corn to produce ethanol, which encouraged Chinese manufacturers to import more cassava as a substitute. However, this demand for cassava softened in late 2015 as the Chinese government permitted the use of corn in the production of ethanol, with a view to clear out the excessive stocks of corn.
On the market front, Thai exports contracted for almost all destinations. Only exports to neighboring countries, i.e. Cambodia, Lao PDR, Myanmar and Vietnam (CLMV), experienced a steady growth. As a result, the share of Thai exports to CLMV countries is now close to that of major markets, such as the U.S., Europe and Japan. Exports to the Middle East picked up in the latter half of 2015, thanks to higher automobile exports following the change in production line to new models.
Thailand’s Exports to Major Markets
5060708090
100110120130
Jan2013
July Jan2014
July Jan2015
July
US (11.2) Eurozone (EU28) (10.2)Japan (9.4) China (11.1)Middle East (4.9) ASEAN 4* (15.3)CLMV (10.4)
Index, 3-month moving average seasonally adjusted, Jan 2013=100)
Source: CEIC, calculation by Bank of ThailandNote: Number in parentheses shows the proportion of Thai exports to those countries in 2015
ASEAN 4 consists of the Philippines, Malaysia, Singapore, and Indonesia

Thailand’s Economic Conditions in 2015 14
Merchandise Imports
Merchandise imports fell sharply. Import prices dropped due to the low global oil prices. Import quantity declined in tandem with weakened exports and subdued private investment.
Import value in 2015 recorded a substantial decrease across most product categories. Imports of raw materials and intermediate goods contracted. This reflected a decrease in imports of fuel, metal products and chemicals – caused by a significant fall in oil and commodity prices as well as the contraction of exports. Imports of capital fell, as weak private investment curtailed imports of machinery and equipment. Nevertheless, imports of consumer goods increased, thanks to a gradual recovery of private consumption and a steady rise in the number of foreign tourists. Import value of gold remained stable from the previous year. Import quantity of gold expanded substantially due to the declining trend of gold prices, amidst the strengthening of the U.S. dollar.
Export Value by Categories of Goods in USD Terms Growth from the same period in the
previous year %YOY Proportion
in 20152014 2015P 2015P
Q1 Q Q P Q P
Manufacturing goods
Automobile
Electronics
Chemicals, petrochemical and petroleum products
Agro-manufacturing products
Electrical appliances
Metal products
Textiles and apparel
Optical instruments
Agricultural goods
Rubber
Rice
Cassava
Fishery products
Other goods
Total exports
Total exports excluding gold) Note: P = Primary data Source: Ministry of Commerce, and Bank of Thailand

Thailand’s Economic Conditions in 2015 15
2.2 Exports and Imports of Services
Exports of services expanded well and were one of the main engines of economic growth this year, reflecting a significant rise in tourism receipts. Despite the bomb incident in Bangkok in August that had some impact on the tourism sector, the industry rebounded quickly thanks notably to the return of Chinese tourists. Imports of services contracted as expenses for transportation of goods fell in line with lower merchandise imports.
Foreign tourists totaled 29.9 million in 2015, a major increase of 20.4 percent from the preceding year. Thailand’s tourism industry remained robust and benefited from a number of favorable factors. (1) Domestic politics was more stable than in the previous year, boosting tourists’ confidence. (2) The number of Chinese tourists, who are key to the Thai tourism industry, edged up steadily despite the slowdown of the Chinese economy. This indicated that the number of Chinese tourists still had a lot of potential to grow, and that the Chinese tourists had switched
Import value by categories of goods in USD terms
Growth from the same period in the previous year (%O)
Proportion in 2015
2014 2015P2015P
Q1 Q Q P Q P
Raw materials and intermediate goods
Raw materials and intermediate goods excluding fuels
Fuels .0
Capital goods
Consumer goods
Nondurable goods
Durable goods
Other imports
Automobile and parts
Total imports -8.5 -11.3
Total imports excluding gold -5.0 -12.0
Note: P = Primary dataSource: Ministry of Commerce and Bank of Thailand

Thailand’s Economic Conditions in 2015 16
their travel destination from South Korea to Thailand during the spread of MERS. Hence, Chinese tourists to Thailand expanded by 26.6 percent, up from 18.7 percent in the previous year. (3) Route expansion of low-cost airlines, coupled with the opening of the U-Tapao International Airport, helped facilitate the travel of foreign tourists to Thailand. As a result, the unfavorable internal and external developments that undermined tourist confidence, including the bomb incident in Bangkok in August and the terrorist attacks in Paris in November, only had limited and short-term adverse impacts on the Thai tourism industry. The number of foreign tourists rebounded quickly, especially Chinese tourists, while the number of European tourists (excluding Russians) also rose from the previous year.
The downgrading of Thailand’s aviation safety by the International Civil Aviation Organization (ICAO) and the Federal Aviation Administration (FAA)1 had only limited impact on the number of foreign tourists. This was because the tourists could substitute to other airlines and foreign airlines still had the capacity to meet higher demand from passengers.
2.3 Balance of Payments
The balance of payments registered a surplus in 2015 due mainly to the current account surplus. The financial account recorded a deficit owing to the net sales of Thai securities by foreign investors. Foreign investors adjusted their portfolios to reduce the share of risky assets held in emerging markets amidst volatility in the global financial markets. Thai investors also continued to invest overseas, in the form of both direct and portfolio investment.
Current Account
The current account recorded a sizable surplus of 31.6 billion U.S. dollars in 2015, or 8 percent of GDP, up from 16.2 billion U.S. dollars in the preceding year. The considerable current account
1 The downgrading of Thailand’s aviation safety would restrict Thai airline operators from expanding or rerouting flights, conducting code-share flights with airline operators in other countries, and operating charter flights to some countries.

Thailand’s Economic Conditions in 2015 17
surplus primarily reflected a large trade surplus, caused by the fall in import value of fuel on the back of declining crude oil price. The deficit of net services, income and transfers was smaller than in the previous year. This was attributable to a significant drop in the transportation costs of goods in line with the lower import value. It also reflected the expansion of tourism revenue, in line with the speedy recovery of Chinese tourists following the Bangkok bomb incident.
Financial Account and the Balance of Payments
In 2015, the financial account posted a net deficit or outflow of 18.1 billion U.S. dollars due to the following factors. (1) Foreign investors registered net sales of Thai securities, both equity and debt, reflecting their attempt to lower the share of risky assets held in emerging markets, including Thailand, during periods of volatile global financial conditions. The volatility was attributable to monetary policy divergence across major economies and concerns over the possibility of slower economic growth in the region. (2) Thai investors continued to expand their investment abroad, especially in petroleum industry, wholesale trade, and manufacturing of beverages. (3) Thai investors expanded their portfolio investment overseas, both in equity and debt instruments, in search for yields and diversification.
However, there were still capital inflows into Thailand in the form of foreign direct investment (FDI), due notably to Japanese, Singaporean and American investment in financial intermediaries, real estate, and manufacturing of computer products, electronics and IC businesses.
Overall, the balance of payments recorded a surplus of 5.9 billion U.S. dollars, a turnaround from a deficit of 1.2 billion U.S. dollars in the previous year.

Thailand’s Economic Conditions in 2015 18
-60
-40
-20
0
20
40
60
2014P 2015PThai Direct investment Investment in foreign securitiesLoans Other investment (assets)Foreign direct investment Foreign investment in securitiesLoans from abroad Other investment (liabilities)Capital flows
Thailand’s Capital Flow by Types of Funds
Note: P = Primary data, Positive = Capital inflow Assets decreased liabilities increased Negative= capital outflow assets increased liabilities decreased Source: Bank of Thailand
Billion USD
Balance of Payments
(Units Million USD 2014P 2015P2015P
Q 1P Q P Q P Q P
Exports f.o.b. D% YoY
Imports f.o.b. D% YoY
Trade balance Net trade minus gold Net services, primary income and secondary income Current account balance Current account balance minus gold Capital account Capital and financial account Assets Thailand’s direct investment aboard Investment in foreign securities Loans Other investment assets Liabilities Foreign direct investment Foreign investment in securities Loans from aboard Other investment liabilities) Net errors and omissions Overall balance Note P=Primary dataSource Bank of Thailand

Thailand’s Economic Conditions in 2015 19
Thailand’s exports: the lost momentum and economic implications
Thailand’s exports in 2015 contracted for the third consecutive year, in contrast to high growth seen in the past decade. Insipid growth was attributed to both internal and external factors. The external factors were both cyclical and structural. The cyclical constraint was that global demand had not recovered fully as a result of the global economic slowdown since the crisis in 2008. Meanwhile, there were two major structural factors: 1) There was a shift in the structure of global trade. The correlation between growth of the global economy and the world’s trade volume diminished due to a shorter global value chain.1 Many countries turned to rely more on domestic demand. As a result, when the cyclical factor receded and the world economy recovered, the volume of global trade might not record a high growth as in the past; 2) There was a structural change in the global crude oil market. This was due to the rise in supply especially from the U.S. following successful development of shale oil production. Accordingly, prices of oil and related products plummeted.
Apart from the external factors, Thailand’s exports also faced domestic structural constraints that tarnished the country’s competitiveness: 1) Labor factors - Thailand faces labor shortages both in terms of quantity and quality; 2) Capital factors - Domestic investment, both public and private, has been sluggish for a long time. Foreign direct investment in the manufacturing sector declined, while Thai investors increasingly invested abroad; and, 3) Productivity factors - Because research and development (R&D) has been overlooked for a long time, Thailand’s manufacturing sector has limited capacity in production that requires more advanced technology. Thus, they cannot keep up with changing consumer demand in the global market. Consequently, Thai exports growth are not only low in trade volume, but also limited to low value-added products.
Domestic demand and the services sector, such as tourism and being a trading nation, are considered alternatives that could replace exports as the main engine of Thai economic growth. However, these alternatives are insufficient to replace exports entirely. At present, receipts from exports of services account for only one third of those from total merchandise exports. To revive exports as the main growth engine, every player needs to join hands to reform the exports sector and urgently addresses the structural constraints on the country’s competitiveness. One solution is to promote targeted industries with high potential: choosing to focus on development of industries with high competitiveness, high value-added, and are in line with the global mega trend. 1 After the global financial crisis in 2008, the gap between production costs in developed countries and developing countries
narrowed. This results in a deceleration of investment in developing countries. The reliance on production of developing countries lessened, resulting in shorter global value chain.
2 For instance, China reformed its economy to be less reliant on exports and investment, especially in heavy industries, and instead focused on domestic consumption and the service sector. Moreover, China focused on producing goods in their production chain instead of importing from other countries in the region.

Thailand’s Economic Conditions in 2015 20
An analysis of Thailand’s export industries by their quality through different perspectives2 (Figure 1) reveals that industries with the highest potential according to its competitiveness, value-added capability, and being in line with global demand are as followed: 1) Petrochemicals and chemicals. With high risks due to increasing future supply from competitors and growing environmental awareness, future development in this industry should focus on bioplastic products. At present, Thailand is well-equipped in both the upstream and downstream industries, being one of the largest exporters of agricultural raw materials and home to many plastic products manufacturers. The only missing link is the midstream industry, the bioplastic material industry, which Thailand now entirely relies on imports. 2) Food and beverages. Quality development and innovation of new products should be the focus of the industry’s future development. In particular, the development should emphasize on innovating high value-added products in conjunction with other industries. For instance, knowledge-sharing with the pharmaceutical industry should be pursued to create new supplements. At present, the industry accounted for 16.3 percent of Thailand’s total export value.
Currently, key industries that are the main engine of Thai exports in the past few decades with high exports value (Figure 2)
3 Promvarat Praditr, Warawit Manopiya-ananand Wasin Rojayaroon (2015). Thailand’s exports, the missing
engine and its implication on the economy.Thailand’s Future Growth Research Project. The Bank of Thailand.
4 Scores reflect qualities in each aspect of Thailand’s export industries. An industry can score 10 as the highest index for each perspective, while 0 is the lowest index.
Figure 1 Thai Industires with high poteltial4
02468
10
Electronics Electrical appliancesAutomobile
Labor Productivity
Quality Level
Quality Upgrade
Market Growth
Domestic Value Added
Product Sophistication
Competitiveness Index
Value-added index
Revealed Comparative Advantage
Figure 2 Thai Industries with second highest potential
Note: Scores reflect quality in each perspective of the industries. The industry with a score of 10 has the highest quality; 0 for the lowest quality. The average of indexes in each perspective is calculated as the overall score of an industry. Source: Promvarat, Warawit and Wasin (2015)
Note: Scores reflect quality in each perspective of the industries. The industry with score of 10 has the highest quality; 0 for the lowest quality. The average of indexes in each perspective is calculated as the overall score of an industry. Source: Promvarat, Warawit and Wasin (2015)
02468
10
Chemicals PetrochemicalFood and Beverages
Labor Productivity
Revealed Comparative Advantage
Quality Level
Quality Upgrade
Market Growth
Domestic Value Added
Competitiveness Index
Value-added index
Product Sophistication

Thailand’s Economic Conditions in 2015 21 are electronics, electrical appliances, and automobiles. These industries accounted for 35.7 percent of total export value. However, the weakness of these industries is that they generate low valued-added for the country. Most of the operators are international companies that use Thailand as their assembly bases. The government, therefore, should formulate investment promotion conditions that foster industries that create high value-added for the country. Moreover, human capital development is necessary to produce qualified workforce capable of operating advanced production technology.
In conclusion, exports reform is needed to revitalize the exports sector as an engine of growth (Figure 3). One solution is to select and promote targeted industries with high potential according to the country’s fundamentals (Choose). Then, favorable environment and supporting factors need to be created for these industries to grow, especially in investment in R&D and human capital development (Shift). This will ensure that future exports growth is based on innovation, quality and value creation, rather than on labor factors (Change). If Thailand does not raise the competitiveness of its manufacturing sector, exports are unlikely to resume its historical role as the growth engine of the Thai economy. Thailand’s new normal may display a significantly lower rate of economic growth.
Choose
Shift
Change
4-5 years
1-2 yearsCriteria for choosing targeted industries and future development planning: • Thai industries with high
competitiveness and appropriate for the county’s fundamentals.
• In line with market demand
Timely create favorable conditions and supporting factors, both for overall industries and industry-specifics, to enhance competitiveness of the targeted industries. For instance, implementing infrastructure to support every link of the supply chain.
Thailand’s future exports should focus on innovation and high value-added activities in order to revive the export sectors as the main engine of the Thai economy driving Thailand beyond the middle income level. Moreover, continuous revaluation of targeted industries and supporting policies are necessary for the development to be sustainable.
Figure 3 Recommendations for Thailand’s exports development
Source: Promvarat, Warawit and Wasin (2015)
Thailand’s Economic Conditions in 2015 22
3.1 Private Consumption
Private consumption was a major driver of economic growth thanks to a combination of favorable conditions, including the low oil prices, boosted confidence and transient factors in the last quarter of 2015. However, limited purchasing power and a high level of debt among farm households continued to weigh on household spending this year.
In 2015, private consumption improved from the previous year. Farm income declined as a result of drought and depressed farm prices – partly caused by subdued world commodity prices amidst the global economic slowdown. Household debt remained at a high level, prompting households to be cautious with their spending, especially on high-value and luxury goods. Nevertheless, the following favorable factors provided support to households’ purchasing power and encouraged greater household spending: (1) Falling oil prices throughout the year led to a slight increase in the real income of non-farm households, while reducing household expenses on energy and transport. (2) Consumer
3. Domestic Demand

Thailand’s Economic Conditions in 2015 23
confidence picked up, especially in the last quarter. (3) Temporary factors in the fourth quarter boosted spending. Some consumers opted to purchase cars before the increase in the excise tax on cars on 1 January 2016, as reflected in a higher growth in car loans towards the end of the year. In addition, tax rebates, worth up to 15,000 baht per person, were given on spending on goods and services.1
These developments allowed private consumption to edge up in some categories, namely (1) spending on non-durables, notably necessities such as food, and (2) spending on services, consistent with a solid expansion of businesses in the service sector, particularly transportation, retail trade and telecommunications. However, spending on durables remained subdued, despite some increase in car purchases towards the end of the year. Private consumption could soften in early 2016 in some product categories and services. This is because households had already increased their spending during the tax rebate scheme, while spending on durables had already picked up significantly towards the end of 2015 prior to the increase in excise tax on cars.
1 Those with personal income who purchased goods or paid for services used during 25-31 December 2015 from VAT-registered operators may use the actual amount spent on goods or services, but not more than 15,000 baht, for deduction of their personal income tax in the 2015 tax year. The purchase of the following goods is excluded from the scheme: (1) alcoholic drinks, beer and wine, (2) tobacco, (3) oil and gas for vehicles, and (4) cars, motorcycles and boats.
70
80
90
100
110
120
130
Jan2013
Jul Jan2014
Jul Jan2015
Jul
Fuels Index Services IndexNondurable Index Durable Index
2/
Source: Bank of Thailand
Index, 3-month moving average (seasonally adjusted, 2012=100)
Private Consumption Indicators /
Note: / Constant prices index / The service sector index is calculated using VATs in hotels and restaurants, and sales of transport services.

Thailand’s Economic Conditions in 2015 24
Private Consumption (Real Terms*)
-6
-4
-2
0
2
4
6
1,000
1,050
1,100
1,150
1,200
1,250
1,300
Q12013
Q12014
Q12015
Private consumption Growth rate (RHS)
Billion Baht % YOY
Source: The Office of the National Economics and Social Development Board Real terms, calculated using Chain Volume Measure (CVM) in stead of using the constant price method.
Consumer Confidence IndexIndexIndex
60
65
70
75
80
85
90
20
25
30
35
40
45
50
Jan2013
July Jan2014
July Jan 2015
July
Ministry of Commerce UTCC (RHS)
Index interpretation: Consumer confidence index, Ministry of Commerce: The Index close to 100 means consumer confidence in the economic condition is “good” The Index close to 0 means consumer confidence in the economic condition is “not good” Consumer confidence index, The University of the Thai Chamber of Commerce: Index > 100 means consumers deem the condition will improve or is favorable. Index = 100 means consumers deem the condition will remain unchanged or stabilizes. Index < 100 means consumers deem the condition will worsen or is not favorable. Source: Ministry of Commerce and the University of the Thai Chamber of Commerce

Thailand’s Economic Conditions in 2015 25
3.2 Private Investment
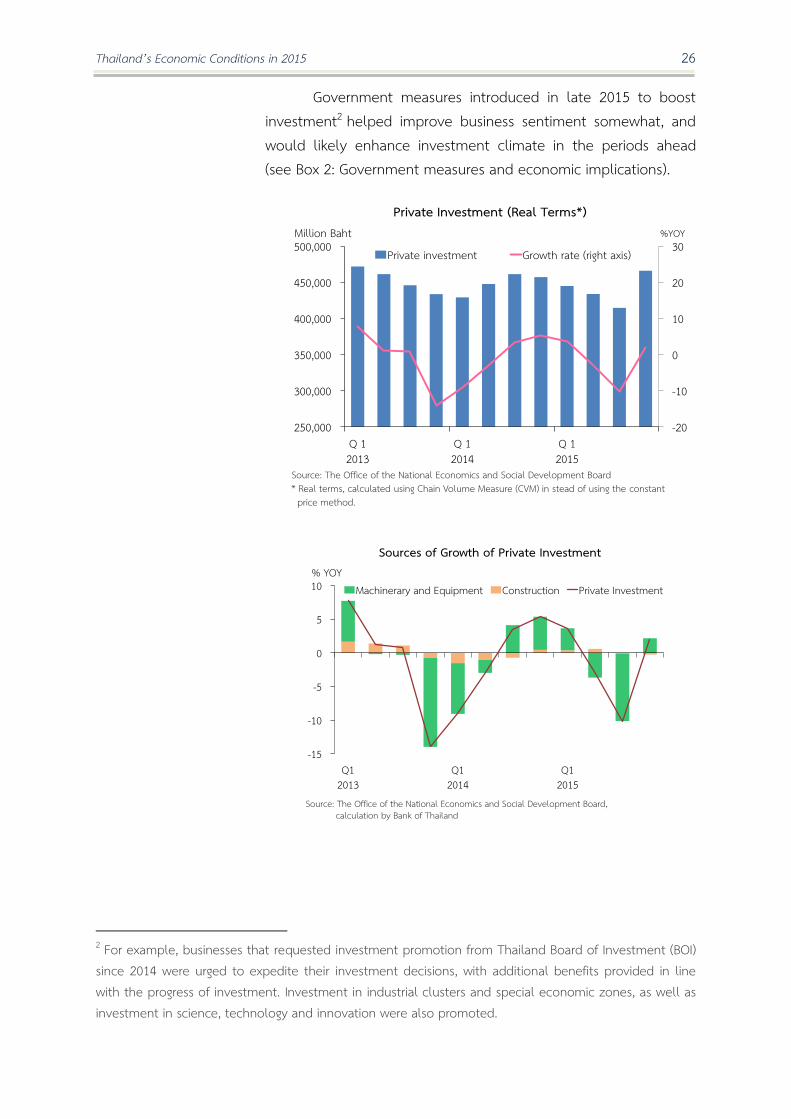
Private investment contracted for the third consecutive year. Due to sluggish exports and the gradual recovery of household spending, businesses still had excess production capacity. Investment in the construction sector remained unchanged from the previous year.
In 2015, private investment contracted for the third consecutive year. Businesses still had adequate production capacity to meet the domestic and external demand. Despite the gradual recovery of government and household spending, the increase in domestic spending could not offset the weakened exports, which were held back by the slowdown in the Chinese and ASEAN economies as well as the changes in the global trade structure. Most investment therefore was geared towards production efficiency improvements rather than capacity expansion. This was reflected by a small expansion of business loans for investment in durable assets and a weaker growth of capital raised through equity and bond markets.
Nonetheless, private investment edged up in the fourth quarter though the increase was limited to certain sectors and resulted by transient factors. Investment in the services sector improved, notably in telecommunications as investment was made to expand the mobile network following the 4G auction. Alternative energy investment also continued to grow, thanks to the government policy support. In addition, commercial car purchases for investment purpose increased in advance of the excise tax hike.
Investment in the construction sector remained quite stable. It expanded slightly in the first half of the year, reflecting the small increase in the permitted residential areas following the launch of new real estate projects. Investment in the construction sector then fell slightly in the latter half of the year because it took developers longer than expected to offload the excess supply on the back of the sluggish economic recovery. Moreover, public investment in most infrastructure megaprojects was delayed. The government measures on the real estate sector introduced in Q4 2015 were merely aimed at offloading the excess supply remaining in the market.
Thailand’s Economic Conditions in 2015 26
Government measures introduced in late 2015 to boost investment2 helped improve business sentiment somewhat, and would likely enhance investment climate in the periods ahead (see Box 2: Government measures and economic implications).
2 For example, businesses that requested investment promotion from Thailand Board of Investment (BOI) since 2014 were urged to expedite their investment decisions, with additional benefits provided in line with the progress of investment. Investment in industrial clusters and special economic zones, as well as investment in science, technology and innovation were also promoted.
-20
-10
0
10
20
30
250,000
300,000
350,000
400,000
450,000
500,000
Q 12013
Q 12014
Q 12015
Private investment Growth rate (right axis)
Private Investment (Real Terms*)%YOYMillion Baht
Source: The Office of the National Economics and Social Development Board Real terms, calculated using Chain Volume Measure (CVM) in stead of using the constant price method.
-15
-10
-5
0
5
10
Q12013
Q12014
Q12015
Machinerary and Equipment Construction Private Investment% YOY
Sources of Growth of Private Investment
Source: The Office of the National Economics and Social Development Board, calculation by Bank of Thailand
Thailand’s Economic Conditions in 2015 27
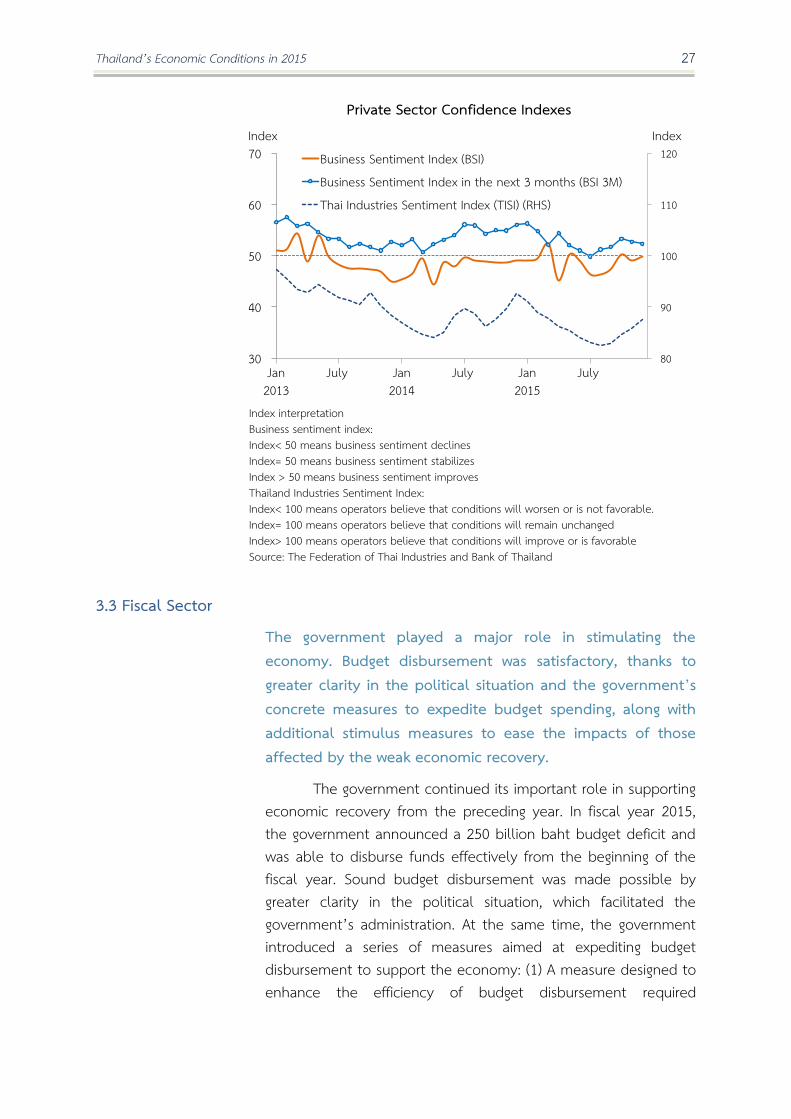
3.3 Fiscal Sector The government played a major role in stimulating the economy. Budget disbursement was satisfactory, thanks to greater clarity in the political situation and the government’s concrete measures to expedite budget spending, along with additional stimulus measures to ease the impacts of those affected by the weak economic recovery.
The government continued its important role in supporting economic recovery from the preceding year. In fiscal year 2015, the government announced a 250 billion baht budget deficit and was able to disburse funds effectively from the beginning of the fiscal year. Sound budget disbursement was made possible by greater clarity in the political situation, which facilitated the government’s administration. At the same time, the government introduced a series of measures aimed at expediting budget disbursement to support the economy: (1) A measure designed to enhance the efficiency of budget disbursement required
Index interpretation Business sentiment index: Index< 50 means business sentiment declines Index= 50 means business sentiment stabilizes Index > 50 means business sentiment improves Thailand Industries Sentiment Index: Index< 100 means operators believe that conditions will worsen or is not favorable. Index= 100 means operators believe that conditions will remain unchanged Index> 100 means operators believe that conditions will improve or is favorable Source: The Federation of Thai Industries and Bank of Thailand
80
90
100
110
120
30
40
50
60
70
Jan2013
July Jan2014
July Jan 2015
July
Business Sentiment Index (BSI)Business Sentiment Index in the next 3 months (BSI 3M)Thai Industries Sentiment Index (TISI) (RHS)
Private Sector Confidence IndexesIndex Index

Thailand’s Economic Conditions in 2015 28
government agencies to identify the project contractors prior to the entry into force of the Annual Expenditure Budget Act. This resulted in a quicker contract signing, project construction and budget disbursement. (2) A measure to expedite budget spending required government agencies to enter into contracts in the first quarter of the fiscal year. (3) A measure to transfer the remaining budget, that was unused by the end of July, back to the central government, so that the funds could be allocated to other projects. The implementation of these concrete measures led to a great number of contract signings in the beginning of the year and rather smooth budget disbursement. Disbursement of investment expenditure was particularly higher than the past average. The government disbursed a total of 2,378 billion baht in the fiscal year 2015, or 92.4 percent of the total annual budget, which was higher than the 89.0 disbursement rate in the previous fiscal year.
The government also introduced additional extra-budgetary measures in order to support the economy. For example, a measure was put in place to accelerate investment in small projects, as part of the plan to finance water management system and high-priority road transport development projects (2nd phase economic stimulus). Fiscal and financial measures were also introduced to assist the low income and SMEs, along with assistance provided to farmers who were hit by the low agricultural prices and the drought.
On the revenue side, collection fell short of projection by 4.8 percent. The main reason was the continued decline in crude oil prices since late 2014, which caused a fall in the collection of petroleum income tax, value added tax on imports and income from petroleum concessions. However, the restructuring of petroleum excise tax since late 2014, especially the increase in the diesel excise tax from 0.75 to 4.25 baht per liter, led to higher excise tax collection. Moreover, the recall of excess liquidity of extra-budgetary funds back to public revenue, together with higher-than-average state enterprises’ remittance, helped compensate for approximately 50 billion baht of the fall in revenue collection. Due to the lower-than-projected net revenue, the government’s cash deficit was 344 billion baht or 2.6 percent of GDP – the same share of GDP as in the previous year. The treasury cash balance stood at 462 billion baht at the end of the fiscal year.
Thailand’s Economic Conditions in 2015 29
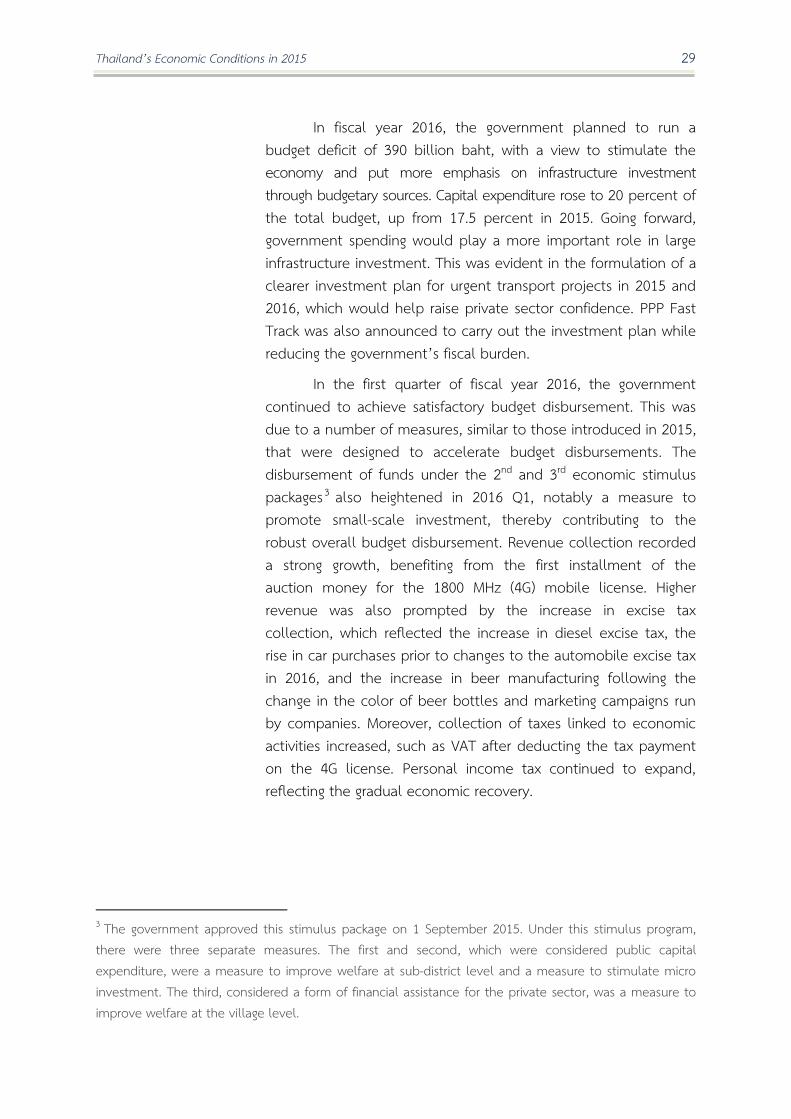
In fiscal year 2016, the government planned to run a budget deficit of 390 billion baht, with a view to stimulate the economy and put more emphasis on infrastructure investment through budgetary sources. Capital expenditure rose to 20 percent of the total budget, up from 17.5 percent in 2015. Going forward, government spending would play a more important role in large infrastructure investment. This was evident in the formulation of a clearer investment plan for urgent transport projects in 2015 and 2016, which would help raise private sector confidence. PPP Fast Track was also announced to carry out the investment plan while reducing the government’s fiscal burden.
In the first quarter of fiscal year 2016, the government continued to achieve satisfactory budget disbursement. This was due to a number of measures, similar to those introduced in 2015, that were designed to accelerate budget disbursements. The disbursement of funds under the 2nd and 3rd economic stimulus packages3 also heightened in 2016 Q1, notably a measure to promote small-scale investment, thereby contributing to the robust overall budget disbursement. Revenue collection recorded a strong growth, benefiting from the first installment of the auction money for the 1800 MHz (4G) mobile license. Higher revenue was also prompted by the increase in excise tax collection, which reflected the increase in diesel excise tax, the rise in car purchases prior to changes to the automobile excise tax in 2016, and the increase in beer manufacturing following the change in the color of beer bottles and marketing campaigns run by companies. Moreover, collection of taxes linked to economic activities increased, such as VAT after deducting the tax payment on the 4G license. Personal income tax continued to expand, reflecting the gradual economic recovery.
3 The government approved this stimulus package on 1 September 2015. Under this stimulus program, there were three separate measures. The first and second, which were considered public capital expenditure, were a measure to improve welfare at sub-district level and a measure to stimulate micro investment. The third, considered a form of financial assistance for the private sector, was a measure to improve welfare at the village level.
Thailand’s Economic Conditions in 2015 30
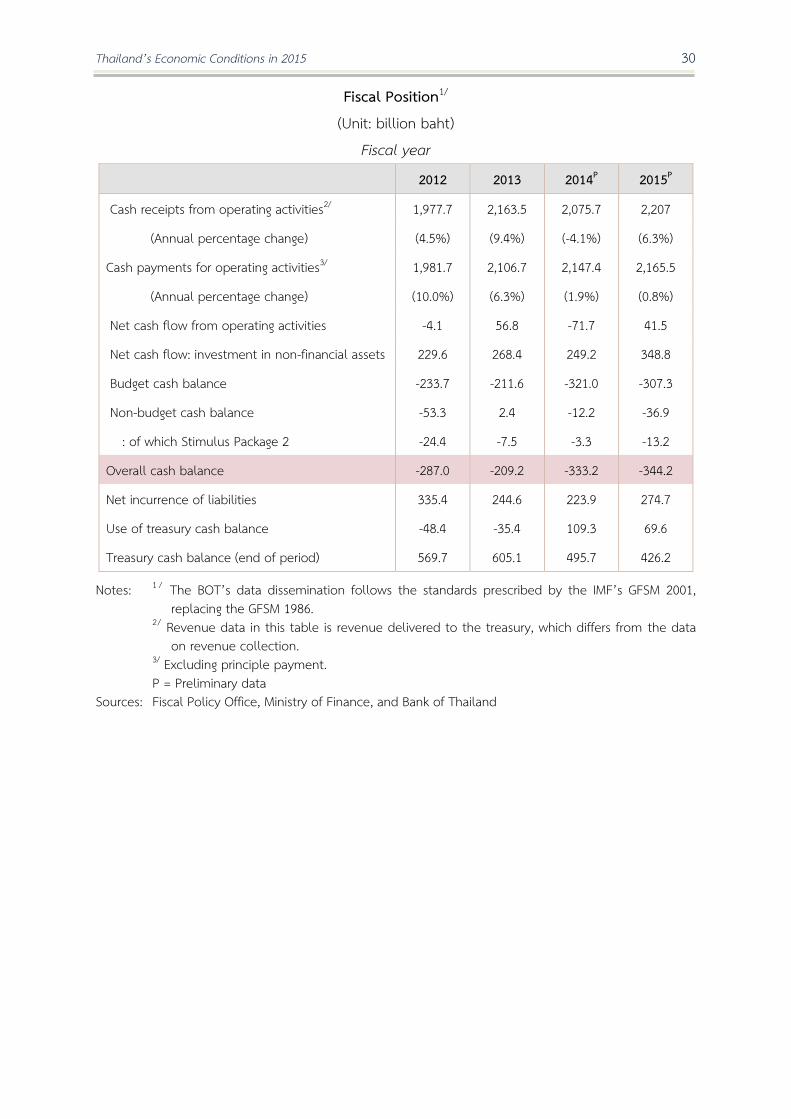
Fiscal Position /
(Unit: billion baht) Fiscal year
2012 2013 2014P 2015P
Cash receipts from operating activities2/ 1,977.7 2,163.5 2,075.7 2,207
(Annual percentage change) (4.5%) (9.4%) (-4.1%) (6.3%)
Cash payments for operating activities3/ 1,981.7 2,106.7 2,147.4 2,165.5
(Annual percentage change) (10.0%) (6.3%) (1.9%) (0.8%)
Net cash flow from operating activities -4.1 56.8 -71.7 41.5
Net cash flow: investment in non-financial assets 229.6 268.4 249.2 348.8
Budget cash balance -233.7 -211.6 -321.0 -307.3
Non-budget cash balance -53.3 2.4 -12.2 -36.9
: of which Stimulus Package 2 -24.4 -7.5 -3.3 -13.2
Overall cash balance -287.0 -209.2 -333.2 -344.2
Net incurrence of liabilities 335.4 244.6 223.9 274.7
Use of treasury cash balance -48.4 -35.4 109.3 69.6
Treasury cash balance (end of period) 569.7 605.1 495.7 426.2
Notes: / The BOT’s data dissemination follows the standards prescribed by the IMF’s GFSM 2001, replacing the GFSM 1986.
/ Revenue data in this table is revenue delivered to the treasury, which differs from the data on revenue collection.
3/ Excluding principle payment. P = Preliminary data Sources: Fiscal Policy Office, Ministry of Finance, and Bank of Thailand

Thailand’s Economic Conditions in 2015 31
Government measures and implications on the economy
Throughout 2015, the Thai economy has sufferred many setbacks, including cyclical factors, especially economic downturn among trad ing partners , and structu ral facto rs accum u la ted o ve r th e ye a rs , su ch a s intermittent investment in large infrastructure projects and insufficient private investment in research and development. These structural lim itations have led to a decline in the country’s competitiveness and a persistent contraction in Thai exports. Amidst such backdrop, the govenment has played a key role in providing support and driving the economy forward. Government measures unveiled throughout the year can be divided into 3 types: (1) Remedial measures targetted at the groups directly hit by economic shocks; (2) Stimulus measures to quickly lift the economy from recession; and, (3) Capacity upgrade measures , particularly investment in infrastructures and support for private investment, to foster long-term economic growth.
Income of farm households has fallen as a result of the decline in production, following the drought and subdued agricultural prices, especially for rice and rubber. Also, SMEs were hardly hit by the economic slump. These two groups are more susceptible to economic shocks than others, given low level of income and savings, high share of debts, and limited liquidity due to the inability to access formal loans that are usually less costly than informal ones. To support them, the government has provided (1) remedial measures to help sustain the livelihood of people at grass -root level, the country’s majority population. These measures included direct transfers and loans for rice farmers and rubber planters, soft loans, loan guarantees, and reduction in SME tax . Aimed at enhancing liquidity and access to formal credits, they would provide SMEs with adequate working capital to maintain employment and survive this cycle of economic downturn.
Moreover, the government has issued (2) stimulus measures that would quickly inject liquidity into the economic system via two channels. First, direct government spending, including expedited disbursements of annual budget from the first quarter of fiscal year, and an increase in stimulus spending, starting with investment in renovations of various government buildings that allowed swift disbursements according to the Phase I Stimulus Package. To ensure uninterrupted stimulus, Phase II was soon announced after, with an emphasis on investment in water management and road transport projects. This was followed by Phase III that provided loans via the village funds and focused on tambon-level investment. Together, these stimulus measures were aimed at creating short-term employment and increasing liquidity within local communities.
Categories of Government Measures
• Target at the groups directly hit by economic shocks such as farmers and SMEs
Remedial
• Lift the economy from recessionStimulus
• Foster long-term economic potential upgrade
Capacity Upgrate

Thailand’s Economic Conditions in 2015 32
However, relying solely on public spending could be insufficient1. Therefore, a second growth engine was needed, namely the spending incentives for private sectors. For example, real estate stimulus measures helped speed up purchasing decisions and transfers of ownerships of real estates, reduce excess supply in the market, and spur other related spending, such as building materials, furnitures, and electrical appliances. The tax reduction on purchases of domestic goods and services at the end of the year motivated some consumers to front-load their purchases, and generated some new demand in retail and wholesale trade sectors, as well as various service sectors . The incentives for private investment allowed companies with BOI licenses to receive corporate income tax exemption for 1-4 additional years, depending on the actual investment progress by 2017. Moreover, those without a license receive a tax refund of 2 times their investment spending. These measures are expected to expedite investment among firms with preexisting investment plans, especially those that rushed their application for BOI licenses in 20142 but have not yet invested.
Although the remedial and stimulus measures above helped alleviate urgent problems that resulted from cyclical factors, they could not address issues that stem from structural factors threatening the country ’s competitiveness. Thus, the government has also pursued (3) capacity enhancement measures that include the following:
(3.1) Public investment: focusing on transport infrastructures that have high impacts on other economic sectors. Improvements in this area will help reduce logistics costs, and spur economic activities along the transport routes, particularly the East-West Economic Corridor in the high-potential Greater Mekong subregion. In order to ensure clarity and continuity of the investment, the government has announced Thailand ’s Transport Infrastructure Master Plan for 2015-2022, along with the Action Plans for 2015 and 2016.
(3.2) Public-Private Partnership for infrastucture investments: the government announced a 5-year Public-Private Partnership (PPP) Strategic Plan, together with the PPP Fast Track that promises to reduce the processing time of partnership approval process from 25 months down to 9 months. If the infrastructure investment projects are implemented according to plan, especially for the auctions and signing of contracts, they will also help improve business confidence and crowd-in additional private investment.
1 The share of government spending to GDP was 23.6 percent in 2015, of which 17.2 percent was public consumption and 6.4 percent was public investment. These figures were dwarfed by the shares of private consumption and investment to GDP, which stood at 51.5 and 18.5 percent, respectively. 2 In 2014, a record-high number of companies applied for BOI privileges, totaling 2 trillion baht in value. This was in order to avoid being subject to the new BOI strategy starting in 2015, which included reprioritizing of industries that would leave some with reduced benefits and some ineligible.
Thailand’s Economic Conditions in 2015 33
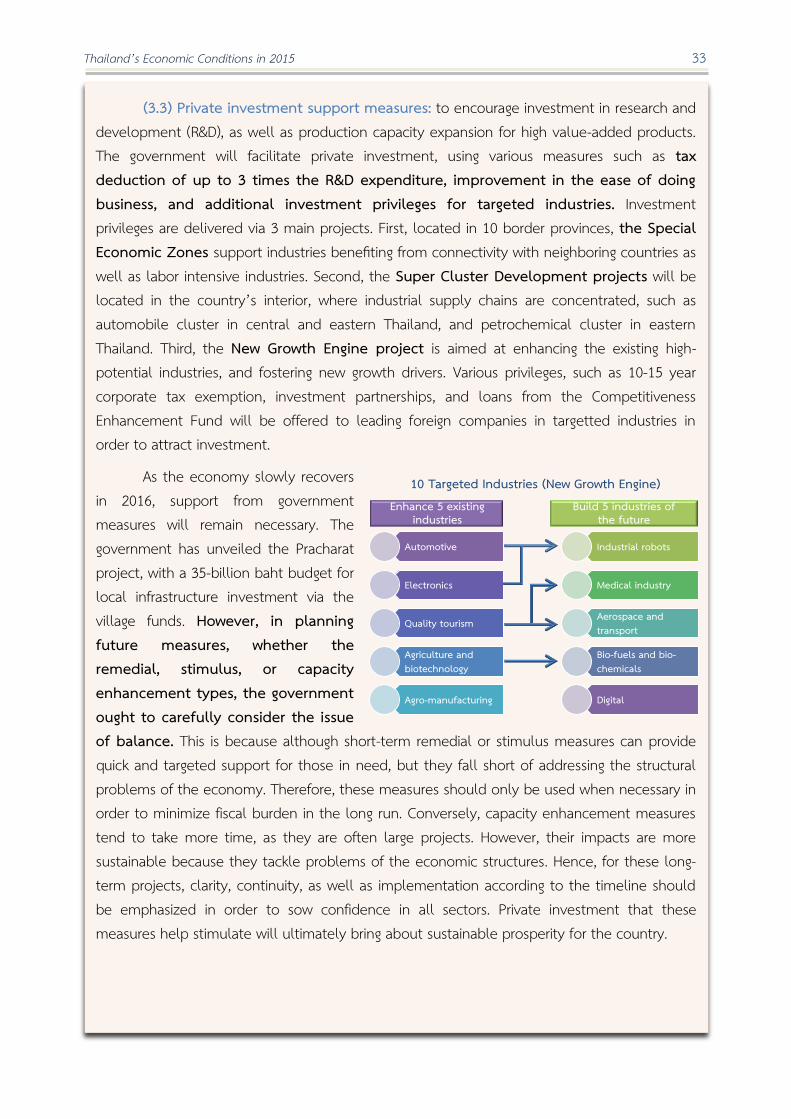
(3.3) Private investment support measures: to encourage investment in research and development (R&D), as well as production capacity expansion for high value-added products. The government will facilitate private investment, using various measures such as tax deduction of up to 3 times the R&D expenditure, improvement in the ease of doing business, and additional investment privileges for targeted industries. Investment privileges are delivered via 3 main projects. First, located in 10 border provinces, the Special Economic Zones support industries benefiting from connectivity with neighboring countries as well as labor intensive industries. Second, the Super Cluster Development projects will be located in the country’s interior, where industrial supply chains are concentrated, such as automobile cluster in central and eastern Thailand, and petrochemical cluster in eastern Thailand. Third, the New Growth Engine project is aimed at enhancing the existing high-potential industries, and fostering new growth drivers. Various privileges, such as 10-15 year corporate tax exemption, investment partnerships, and loans from the Competitiveness Enhancement Fund will be offered to leading foreign companies in targetted industries in order to attract investment.
As the economy slowly recovers in 2016, support from government measures will remain necessary. The government has unveiled the Pracharat project, with a 35-billion baht budget for local infrastructure investment via the village funds. However, in planning future measures, whether the remedial, stimulus, or capacity enhancement types, the government ought to carefully consider the issue of balance. This is because although short-term remedial or stimulus measures can provide quick and targeted support for those in need, but they fall short of addressing the structural problems of the economy. Therefore, these measures should only be used when necessary in order to minimize fiscal burden in the long run. Conversely, capacity enhancement measures tend to take more time, as they are often large projects. However, their impacts are more sustainable because they tackle problems of the economic structures. Hence, for these long-term projects, clarity, continuity, as well as implementation according to the timeline should be emphasized in order to sow confidence in all sectors. Private investment that these measures help stimulate will ultimately bring about sustainable prosperity for the country.
1 Targeted Industries (New Growth Engine)
Automotive
Electronics
Quality tourism
Agriculture and biotechnology
Agro-manufacturing
Industrial robots
Medical industry
Aerospace and transport
Bio-fuels and bio-chemicals
Digital
Enhance 5 existing industries
Build industries of the future

Thailand’s Economic Conditions in 2015 34
Summary of government measures during 2014-2015 fiscal year
Types Measures/Projects Details of the measures Cabinet
resolution
Budget (Billion baht)
1. Remedial
1.1 Financial supports Income transfers for rice farmers 1,000 baht per rai, not exceeding 15 rai per household 1 Oct 14 40 Income compensation for rubber planters 1,000 baht per rai, not exceeding 15 rai per household 21 Oct 14 8.5 Assistance for rubber planters 1,000 baht per rai, not exceeding 15 rai per household
(owners of rubber plantations/renters and rubber tappers receive the ratio of 60:40)
3 Nov 15 12.75
Support for households affected by the drought/agricultural disasters
Gradual disbursement of the central budget for those affected during the production year 2014/15 – 2015/16
- 15
1.2 Loan measures for rubber planters
for rubber businesses for rice farmers
Loans from BAAC for rubber planters to seek part-time employment. Loans for rubber businesses via commercial banks. Loans for up-keeping and creating value added of rice, loans for delaying rice sales, and reduction in lending rates on BAAC loans for rice farmers.
21 Oct 14 21 Oct 14 27 Oct 15
10 10 44
1.3 Rubber buffer stock program Rubber Authority of Thailand buys rubber at benchmark price to maintain price stability, using loans from BAAC.
21 Oct 14 18 Feb 15
6 6
1.4 SMEs Promotion Action Plan Loans for working capital Revision of PGS-5 loan guarantee terms Venture Capital SMEs corporate income tax deduction for 2 years Corporate income tax exemption for new SMEs for 5 years
GSB offers soft loans at 0.1% to participating financial institutions who then lend to SMEs at 4% for not exceeding 7 years. (The government compensates for interest differentials) Loan guarantees from TCG with fee subsidies from the government 1.75 percent in the first year, gradually down to 0.25 percent in the forth. Establishment of venture capital funds to investment in high-potential SME start-ups. Corporate income tax reduced to 10 percent of net profits exceeding 300 thousand baht in the 2015-16 accounting period, compared to the previous rates of 15 percent of profits between 300 thousand and 3 million baht, and 20% of profits exceeding 3 million baht. If SMEs take part in the promotion for SMEs tax registration, they will receive a tax exemption in 2016 and pay 10 percent in 2017. Tax exemption for SMEs in target industries who register between 1 October 2015 and 31 December 2016 for the 2016-2020 accounting periods.
8 Sep 15 (Phase 1) 22 Dec 15 (Phase 2) 14 Jul 15
8 Sep 15 8 Sep 15
29 Dec 15
8 Sep 15
100 (Phase
1) 50
(Phase 2) 80 6 - - -
2. Stimulus 2.1 Expediting and improving efficiency of budget disbursement for 2015-16 fiscal year
Complete the preparation for the signing of contracts before the budget act became effective. Also, the timelines for incurring contingent liabilities and budget disbursements are clearly specified.
- -
2.2 Economic stimulus measures for the initial 3-month period (Economic Stimulus Package Phase I)
Renovations of government buildings and other structures across the country.
1 Oct 14 23
2.3 Water resource management and road transport system action plan (Economic Stimulus Package Phase 2)
Small and medium investment projects to improve water resource management and road transport systems.
17 Mar 15 78
2.4 Support for low-income households and stimulus for small investment projects (Economic Stimulus Package Phase 3) (1) Village-level financial support (2) Tambon-level financial support (3) Small investment stimulus
Expedite public spending at grass-root level. GSB and BAAC offer loans to the village funds who will lend to members with no interest for the first 2 years. Provide financial supports of not exceeding 5 million baht per tambon for renovations of public properties Expedite small investment projects within the first quarter of 2016.
1 Sep 15 136
60
36 40
2.5 Investment acceleration for projects with BOI certificates Tax incentives for domestic investment
Corporate income tax exemption for 1-4 additional years for project applicants from 1 January 2014 onwards and according to actual investment progress by 2017. Tax deduction of two times new investment spending during 2015-16.
3 Nov 15
-
2.6 Financial and fiscal stimulus measures for real estates
Credits from GHB for low to medium-income individuals with eased conditions. Personal income tax reduction on home purchase. Reduction in transfer and mortgage fees to 0.01 percent, from 2 and 1 percent, respectively.
13 Oct 15 10
2.7 Tax reduction on domestic purchase of goods and services
Personal income tax reduction in 2015 on actual purchases of goods and services between 25-31 December 2015, not exceeding 15,000 baht per person.
22 Dec 15 -
3. Capacity enhancement
3.1 Long-term government investment in infrastructures
Transport Infrastructure Master Plan 2015-2022 Transport Infrastructure Development Action Plan 2015 Transport Infrastructure Development Action Plan 2016
27 Mar 15
1 Dec 15
1,913
1,796
3.2 Public-Private Partnership for Investment (5-year plan)
Public-Private Partnership Strategic Plan 2015-2022 for 20 enterprises and 65 projects.
26 May 15 1,410
Public-Private Partnership Fast Track reduces the approval process to 9 months for 5 pilot projects.
3 Nov 15 334
3.3 Private investment support measures Provides tax and other incentives for investment in the Super Cluster Development Projects and the New Growth Engine sectors.
22 Sep 15 17 Nov 15
-
Note: BAAC = Bank for Agriculture and Agricultural Cooperatives TCG = Thai Credit Guarantee Corporation
GHB = Government Housing Bank Source: Compiled by Bank of Thailand

Thailand’s Economic Conditions in 2015 35
4.1 Manufacturing Sector
Production of manufacturing sectors grew slightly overall in 2015. However, growth was concentrated in only a handful of sectors, while production of the rest declined either with the business cycle or due to structural problems.
Manufacturing production recorded a limited growth, as indicated by the manufacturing production index, capacity utilization rate, industrial electricity utilization, and work hours in manufacturing that edged up only slightly from the previous year. Such moderate improvement was driven by a number of industry-specific factors. Petroleum production benefitted from an increase in domestic demand following a substantial fall in oil price. The growth was also a result of longer-than-usual maintenance shutdowns of refineries last year. Production of plastics rose thanks to demand for plastic packaging, especially from the trading sector. Production of eco cars expanded due to an increase in exports to the euro area. Meanwhile, the jewellery industry gained from expanded market shares in key trading partners, such as the U.S., Europe, and Hong Kong.
4. Supply-side Economy

Thailand’s Economic Conditions in 2015 36
However, production of some industries fell following delayed economic recovery. For example, production of beverages, particularly carbonated drinks, plummeted as households cut back on excess spending. Production of automobiles for domestic sales contracted further from the previous year. Nevertheless, a few transitory factors helped boost demand somewhat during the second half of the year, including the launch of a new commercial car model, and the front-loaded purchasing of certain car categories whose prices were expected to surge after the excise tax raise on January 1, 2016.
Moreover, other industries suffered declines in production due to structural problems, both internal and external, that hindered competitiveness of their exports. For instance, production of Hard Disk Drives fell sharply, because products based on Solid-State Drives have gained popularity among consumers. Manufacturing of apparels collapsed amidst weak demand from trading partners and the loss of GSP status. Food production dropped as a result of two factors: 1) the shortage of raw materials for processed seafood after Indonesia suspended concessions for Thai fishing boats, and 2) the fall in processed seafood exports to EU, due to Thailand’s IUU fishing problem and the loss of GSP status. Moreover, manufacturing of steel and steel products fell substantially, especially during the second half of the year, as Thai products were replaced by cheaper imports from China.
60
80
100
120
Jan2014
Jul Jan2015
Jul
Imports of raw materialsElectricity utilization in manufacturingWork hours in manufacturing* (3mma)
Other Manufacturing Production Indicators
Note: The number of work hours is weighted by the value added of each sectorSource: Customs Department, National Statistical Office, Metropolitan Electricity Authority and Provincial Electricity Authority. Indices calculated by Bank of Thailand.
Index (seasonally adjusted, January 2013 = 100)

Thailand’s Economic Conditions in 2015 37
4.2 Agricultural Sector
Agricultural income saw a persistent decline throughout 2015, following comparable decrease in both price and production. Agricultural prices fell markedly mainly because of external factors, including the sizable contraction in trading partners’ demand and excess supply from major competitors. Meanwhile, the domestic drought was mainly responsible for the fall in production.
-10
-5
0
5
10
0
200
400
600
800
Q12013
Q12014
Q12015
Level Growth (RHS)
Note: Real manufacturing production is based on the Chained Volume Measures (CVM) instead of fixed base year previously used. Source: Office of the National Economic and Social Development Board
Billion baht
Manufacturing Production Real Terms* %YOY
Manufacturing Production Index (MPI)
Industry
(%YOY)
Relative Weights
20142014 2015
2015
Q1 Q2 Q3 Q4
Food and beverages 1 .4 1. 0. 0.5 1. 0.5 0.5
Automobile 1 .2 22.0 2.2 2.4 5.2 .0 5.1
Rubbers and plastics 10.0 4.4 1.5 4. .2 2.1 2.5
Electronics . 10. 0. 2. 0. 0. 1.4
Textiles and apparels 5.5 .1 . 0.2 0.1 . 1 .1
Chemicals 5.5 2.0 0.4 0.2 0. .4 0.
Cement and constructions 4. .2 .4 . 0.4 5.2 .
Electrical appliances 4. 0.4 .2 4. 4.0 1.4 2.4
Petroleum 4.1 5. 1 . 12.2 1.1 1 .0 .4
Hard disk drive (HDD) 1.1 . 22. 12. 25. 2 . 2 .
Others 1 . 0. 0. 2.4 0. 0. 0.2
MPI 100 -5.2 0.3 0.4 -0.3 0.9 0.3
Source: Office of Industrial Economics

Thailand’s Economic Conditions in 2015 38
Suffering from the fall in both price and production, agricultural income saw a sharper drop in 2015 compared to the previous year. Prices fell in line with global benchmarks, due to supply and demand factors of major agricultural products. (1) Rubber price was dragged by the slowdown in global demand, particularly from China, as well as the significant and persistent drop in the price of crude oil, raw material for synthetic rubber which can substitute natural rubber. (2) After the shrimp disease that plunged last year’s production was eliminated, a recovery in global fishery supply led to a decrease in prices. (3) Sugarcane prices fell as excess global supply of sugar, led by a surge of exports from Brazil, depressed sugar prices.
Regarding production, agricultural output fell sharply due
to the drought, most severely for the following products. (1) Unhusked white rice suffered from insufficient water supply for the off-season crop, followed by delayed and below-average rainfall that postponed and decreased production of the in-season one. (2) Oil palm production suffered from a decline in rainfall compared to last year, particularly in the southeastern coast. (3) Fruits, such as tangerines and mangos, were also sensitive to abnormal weather, although they are perennial plants.
Annual percentage change 2014 2015P2015P
Q1 Q2 Q3 Q4
Farm income -5.8 -10.8 -6.4 -15.9 -14.8 -8.8
Agricultural outputP 0.4 -5.3 1.0 -10.8 -10.6 -3.2
Agricultural prices -6.2 -5.9 -7.3 -5.8 -4.7 -5.8
Farm Income
Note: Farm income does not include government transfers, which consist of income from the rice pledging scheme, subsidies for farmers, and compensation for production costs for farmers affected by natural disasters.P = Preliminary data for the latest year
Source: Office of Agricultural Economics, calculations by Bank of Thailand

Thailand’s Economic Conditions in 2015 39
4. Services Sector
With uninterrupted growth, the services sector was an important driver of the economy in 2015. Tourism-related sectors played a particularly important role, although the bomb incident in Bangkok led to a stall in the number of foreign tourists during the forth quarter.
In 2015, the services sector recorded a higher growth than in the previous year. Leading the improvement was the increase in the number of foreign visitors, which benefitted tourism-related businesses. Although the bombing incident in Bangkok in August 2015 adversely affected tourism, the level of confidence in the situation in
Annual Percentage ChangeWeight201
2014 2015P2015P
Q1 Q2 Q3 Q4
Agricultural Price Index 100.0 -6.2 -5.9 -7.3 -5.8 -4.7 -5.8
Unhusked rice 25.4 -13.9 -2.4 -4.4 -0.2 -4.0 -0.8
Unsmoked sheet rubber 3 18.5 -25.9 -19.0 -26.4 -17.2 -14.8 -15.9
Sugarcane 7.2 -5.0 -13.2 -2.1 -11.6 -18.9 -19.7
Cassava 4.3 -1.3 2.5 0.2 1.9 18.6 -8.5
Oil palm 4.0 20.4 -5.5 -1.4 4.4 -15.0 -9.2
Fruits 14.3 14.5 6.2 10.7 2.1 10.9 1.5
Livestock 17.7 9.3 -6.1 -7.5 -8.3 -4.6 -3.7
Fishery 4.2 13.0 -19.4 -24.2 -16.9 -15.9 -19.6
Thai Agricultural Prices
Source: Office of Agricultural Economics
Annual Percentage ChangeWeight201
2014 2015P2015P
Q1 Q2 Q3 Q4
Agricultural Production Index 100.0 0.4 -5.3 1.0 -10.8 -10.6 -3.2
Unhusked rice 25.4 -4.0 -20.7 -11.9 -53.8 -55.1 -7.9
Unsmoked sheet rubber 3 18.5 6.1 -2.2 -2.8 -3.0 0.0 -3.2
Sugarcane 7.2 2.4 4.5 3.4 10.2 0.0 6.9
Cassava 4.3 -14.5 11.0 23.4 -2.2 7.4 -14.7
Oil palm 4.0 0.3 -11.7 -20.9 -5.6 -17.4 -2.2
Fruits 14.3 6.5 -9.0 -2.3 -5.7 -18.3 -9.6
Livestock 17.7 3.5 5.7 5.9 5.8 5.7 5.5
Fishery 4.2 -14.6 4.0 0.0 0.5 0.0 11.2
Agricultural Production
Source: Office of Agricultural Economics

Thailand’s Economic Conditions in 2015 40
Thailand was quickly restored among tourists. As a result, the number of foreign tourists continued to grow in the fourth quarter.
A number of tourism-related services sectors continued their robust growth. These include: 1 Hotels and restaurants, with hotel occupancy rate rising from 55.6 percent last year to 61.7 percent, 2 Transportation, driven mainly by air transports as new routes and more frequent domestic and international flights raised the number of passengers traveling through Thailand’s international airports, and Retail and wholesale trading, improving slightly because the sluggish domestic demand recovery was compensated by the increase in foreign tourists and the fiscal measures that boosted consumption towards the second half of the year.
Telecommunications and real estate services benefitted from government measures. For telecommunications, new frequency auctions, which would enable more rapid data services, generated widespread interest among consumers and led to growth. Moreover, mobile service providers launched various marketing plans to promote more intensive data usage, resulting in higher spending on non-voice services. Similarly, real estate services expanded by more than the previous year, as projects launched 2-3 years ago were getting completed and ready for owndership transfer during the second half of 2015. Moreover, government’s real estate stimulus measures provided incentives for consumers to expedite purchases and transfers, particularly for horizontal housing projects with higher per-unit costs than regular condominiums.
Transportation of goods expanded somewhat, thanks to manufacturing and E-Commerce growth. Nevertheless, the sector faced headwinds from transportations for international trade, which remained subdued.

Thailand’s Economic Conditions in 2015 41
4.4 Real Estate Sector
Real estate sector in 2015 contracted from the previous year, as sluggish economic recovery delayed home purchases and raised excess supply in the market. Nevertheless, the government’s real estate sector stimulus package announced near the end of the year helped to some extent reduce excess supply.
The real estate sector decelerated in 2015. Consumers delayed purchases of residential units on the back of slow economic recovery. Moreover, the high level of household debt led financial institutions to tighten home loan standards. The softened demand was evident in the unit reservation rate (horizontal residential units and condominiums) in Bangkok and its vicinities, which averaged at 1 percent, down from the 3-year moving average of 3.7 percent.
Weakened market activities contributed to the buildup of excess supply. This was particularly the case for the low to medium-end condominiums (below 3 million baht per unit), as the demand among their target buyers was constrained by the high level of household debt. Real estate developers, as a result, held off the launches of new low- to medium-end projects, and focused instead on selling the remaining units. Moreover, new
0
50
100
150
200
250
80
90
100
110
120
130
Q1 2013
Q1 2014
Q1 2015
Sales in Trade SectorsSales in Transportation SectorsNumber of Foreign TouristsOther Business ServicesJuristic Act and Right Registration Fee for Real Estate (RHS)Sales in Communication Sectors (RHS)
Note: Other Business Services include legal and accounting activities, management consultancy activities, advertising and market research, etcSource: The Revenue Department of the Ministry of Finance and Department of Tourism of the Ministry of Tourism and Sports Seasonally adjustment and calculattions by Bank of Thailand
Index sa, 3mma (Q1 2013 = 100)
Service Sector Indicators (Real Terms)Index sa, 3mma (Q1 2013 = 100)

Thailand’s Economic Conditions in 2015 42
projects were geared more towards the medium- to high-end consumers, who were deemed to still have the purchasing capacity.
In effect since the end of October 2015, the government’s real estate sector stimulus package helped expedite purchasing decisions and ownership transfers of residential units during the last two months of the year. In addition, it contributed somewhat to the run down of excess supply, particularly for units that cost less than or equal to 3 million baht.
0
50
100
150
200
1 1 7 2000 2003 2006 200 2012 2015
Horizontal residents* Condominiums
Cumulated Excess Supply of Real Estates in Bangkok and Vicinities at Year-end Classified by Housing Types
Thousand units
Note: Including single detached houses, semi-detached houses, town houses, and commercial buildingsNote: Agency for Real Estate Affairs (AREA) and calculations by Bank of Thailand.
0
20
40
60
80
100
120
140
2010 2011 2012 2013 201 2015
Horizontal residents* Condominiums Total
New Residential Units in Bangkok and Vicinities Classified by Housing Types
Thousand Units
Note: Including single detached houses, semi-detached houses, town houses, and commercial buildingsNote: Agency for Real Estate Affairs (AREA) and calculations by Bank of Thailand.
Thailand’s Economic Conditions in 2015 43
5.1 Interest Rates and Credits
Financial conditions were eased, given the decline in interest rates and funding costs in the financial market. Credits expanded but at a slower pace than past average, in line with the delay in economic recovery and the caution with which financial institutions extended credits.
Monetary policy saw further easing in 2015, leaving the policy interest rate at 1.50 percent at year end, or 0.50 percentage-point lower than at end of 2014. The Monetary Policy Committee announced two rate cuts at March and April 2015 meetings. The decisions were aimed to support economic recovery amidst growing downside risks, especially from external factors, boost private confidence, and anchor inflation expectation.
Interest rates in the money market and short-term government bond yields edged down following the policy rate cuts. At end of 2015, overnight interbank rate and 1-month government bond yield stood at 1.40 and 1.50 percent per annum, respectively, or 0.50
5. Monetary Conditions

Thailand’s Economic Conditions in 2015 44
and 0.54 percentage-point lower than the end of 2014. Yields on medium- and long-term government bonds fluctuated throughout the year. The main sources of such volatility were external factors, including uncertainties regarding the timing of the Fed’s interest rate hike, increasing divergence in monetary policy directions among major economies, and investors’ concerns over the economic slowdown in China and ASEAN. Overall, however, the level of volatility declined from 2014. At the end of 2015, 10-year government bond yield traded at 2.51 percent per annum, a 0.32 percentage-point fall from the end of 2014.
Regarding commercial banks’ rates, deposit and lending rates declined gradually following the policy rate cuts during the first half of 2015, before leveling off. On the deposit side, the 12-month time deposit interest rates of the four largest commercial banks averaged at 1.40 percent at year end, a 0.33 percentage-point fall from the previous year. On the lending side, the average Minimum Lending Rates (MLR) of the four largest commercial banks averaged at 6.51 percent, a 0.24 percentage-point drop from the previous year.
Loans and deposits expanded in 2015, thanks to the gradual economic recovery. The growth of both, however, was lower than the average of the past 5 years, as financial institutions remained cautious with lending. New private credits1 softened, except for a few sectors, such as real estate, alternative energy, and processed food.
Focusing on businesses of different sizes, we can see that credits to SMEs accelerated from the previous year, partly as a result of the government’s soft loan program towards the end of the year. In contrast, large corporates raised more funds via corporate bonds, partly substituting loans from commercial banks. This was prompted by the decline from the previous year in bond market funding cost. Moreover, by doing so, the corporates could maintain low cost of funding for a longer period than the credit market would allow. Meanwhile, fund raising in the equity market surged in the first half of the year, before cooling down as Price/Earning (P/E) Ratio fell, rendering equity a less attractive
1 New private credits represent the change in credit outstanding at year-end of Other Depository Corporations (ODCs), which include commercial banks, finance companies, depository specialized financial institutions, savings cooperatives, and money market mutual funds.

Thailand’s Economic Conditions in 2015 45
funding option compared to bonds. Also, the Stock Exchange of Thailand Index fluctuated throughout 2015, in line with regional markets, amidst market concerns over possible further slowdown in regional economies, uncertainties regarding the Fed’s interest rate hike, and intensifying geopolitical risks near the end of the year.
Household loans increased but growth softened slightly in the second half of the year across nearly all loan types, including home loans, credit card loans, and other consumer loans. Such slack reflected both households’ unwillingness to spend, and financial institutions’ caution in lending. However, car loans rose at the end of the year, in line with front-loaded car purchases before the excise tax hike.
Overall, private credits stood at 16.2 trillion baht at the end of 2015, posting a 5.6 percent growth from the previous year, an improvement from 4.2 percent in 2014. For corporate bonds, the amount outstanding was 1.7 trillion baht and growth was 18.4 percent, a drop from 26.1 percent in the previous year.
With 17.3 trillion baht outstanding at year end, total deposits including bills of exchange grew by 5.3 percent from the end of the previous year, up from 4.0 percent in 2014. Nevertheless, the size of deposit growth was small compared to historical average, as commercial banks and SFIs continually reduced the number of special deposit products as well as interest rates offered. This indicates a decline in demand for funding among financial institutions at a time when demand for credits stalled. In addition, some savers switched their savings to
Corporate Financing
Source: Thai Bond Market Association and Bank of Thailand
-75-50-25
0255075
100
Jan2014
Mar May Jul Sep Nov Jan2015
Mar May Jul Sep Nov
Bank loans Corporate bonds EquitiesBillion baht
Note: (1) Bank loans represent monthly changes in business credits outstanding (seasonally adjusted). (2) Corporate bonds represent monthly changes in outstanding corporate bonds, excluding commercial banks. (3) Only newly-issued equities are presented.
0
2
4
6
8
10
Private Sector Funding CostsPercent
MRR MLR
BBBAAAAAA
Note: MLR (Minimum Lending Rate) refers to commercial bank interest rate for most credit-worthy major borrowers.
MRR (Minimum Retail Rate) refers to commercial bank interest rate for most credit-worthy retail borrowers.
AAA, AA, A and BBB refer to the costs of funding via bonds of credit ratings AAA, AA, A and BBB, respectively. Source: Thai Bond Market Association and Bank of Thailand
Jan2014
Jan 2015
Jul2015
Jul2014

Thailand’s Economic Conditions in 2015 46
higher-yield assets, such as mutual funds investing domestically and abroad, and life insurance.
5.2 Exchange Rates
The baht weakened due to both internal and external factors. Its volatility edged up, but remained moderate compared to those of regional currencies.
The baht closed at 36.00 baht per US dollar at the end of 2015, posting a 8.6 percent drop since the end of the previous year. The currency saw sustained depreciation beginning in late April 2015 due to a number of key factors: (1) On the domestic side, the baht weakened following the MPC’s decisions to reduce policy interest rate on March 11, 2015 and April 29, 2015, which were beyond market expectation. This was coupled with the announcment of additional measures to relax foreign exchange regulations on April 30, 2015. Moreover, adding to the baht’s weakness were investors’ concerns over Thailand’s fragile economic recovery and the bombing incident in Bangkok in August 2015; (2) On the external side, signs of economic recovery in the U.S. and market expectations that the Fed would raise its policy rate towards year-end prompted foreign investors to reduce their holdings of equities and bonds in Emerging Asia, including Thailand. Investors’ appetite for these risky assets ebbed because of the expected fall in interest rate differentials that would follow the Fed’s policy actions, and the episodes of
0
5
10
15
20
25
Jan2009
Jan2010
Jan2011
Jan2012
Jan2013
Jan2014
Jan2015
Private creditsDeposits including Bills of Exchange
%YOY
Private Credits and Deposits yncluding Bills of Exchange of Other Depository Corporations*
Source: Bank of Thailand
Dec 20155.6 percent
5.3 percent
Note: *Other Depository Corporations (ODCs) include commercial banks, financial companies, depository specialized financial institutions, savings cooperatives, and money market mutual funds

Thailand’s Economic Conditions in 2015 47
volatile global financial market throughout the year. Meanwhile, the average volatility of the baht in 2015 rose to 5.1 percent, compared to 4.0 percent in the previous year. However, the volatility level remained around an average among other regional currencies.
As the majority of regional currencies also weakened against the U.S. dollar, the Nominal Effective Exchange Rate (NEER) depreciated to a lesser extent than did the baht per U.S. dollar. At the end of 2015, the NEER recorded at 106.07, a 2.8 percent depreciation from the end of 2014. Likewise, the Real Effective Exchange Rate (REER) recorded at 100.92, weakening by 5.2 percent from the previous year. This was in line with the NEER depreciation and the lower inflation in Thailand compared to overall trading partners.
25
27
29
31
33
35
3790
95
100
105
110
115
120
Jan-13 Jul-13 Jan-14 Jul-14 Jan-15 Jul-15
Nominal Effective Exchange Rate (NEER)Real Effective Exchange Rate (REER)Baht per USD (RHS)
Baht per USDIndex (2012=100)
USDTHB and Exchange Rate Indices
Baht depreciation
Note: End of month dataSource: Bank of Thailand (As of December 30, 2015)
-10.7%-10.1%
-4.5%
-0.7%
-18.4%
-9.7%-8.6%
-6.5% -6.3%-4.7% -4.4% -4.4% -3.5%
-20%
-15%
-10%
-5%
0%AUD EUR GBP JPY MYR IDR THB KRW SGD PHP CNY INR TWD
Depreciation against US dollar
Note: AUD = Australian Dollar, CNY = Yuan, EUR = Euro, GBP = Pound Sterling, JPY = Yen, KRW = Won, IDR = Rupiah, INR = Indian Rupee, MYR = Ringgit, PHP = Philippine Peso, SGD = Singapore Dollar, THB = Baht, and TWD = Taiwanese DollarSource: Bank of Thailand (As of December 30, 2015)
Changes in Currencies against U.S. dollar(End of 2015 compared to end of 2014)
0%
5%
10%
15%
20%
Jan-14 Jul-14 Jan-15 Jul-15
MYR
THBTWD
INR
IDR
PHPCNY
KRW
Note: Volatility is computed by Exponentially Weighted Moving Average (EWMA) methodSource: Reuters and Bank of Thailand
Volatility of the Baht and Regional Currencies

Thailand’s Economic Conditions in 2015 48
6.1 Internal Stability
Overall stability remained well-preserved, given low unemployment and inflation rates. Fiscal and corporate sectors maintained solid positions, while households became more fragile amidst lackluster economic recovery. Loan quality worsened somewhat, but financial institutions maintained sufficient buffers to withstand the risks.
Labor Market
Labor market conditions in 2015 stabilized from the previous year. However, sectoral analysis reveals a reallocation of labor force from agricultural to non-agricultural sectors, resulting from the drought and persistent decline in agricultural prices. Particularly for central and northern Thailand, where the drought conditions were most severe, workers who migrated to non-agricultural jobs were absorbed into the construction sector, which benefited from public investment projects, and tourism-related service sector, which gained from the increase in the number of toursists. With such labor reallocation, the effects of the drought on farm income and private consumption were partly mitigated. Overall, unemployment rate in 2015 remained at a low level as with the previous year.
The number of hours worked in non-agricultural sectors edged down slightly in 2015 compared to the previous year. This was
6. Assessment of Thailand’s Economic Stability

Thailand’s Economic Conditions in 2015 49
due to a decline in the number of over-time workers (those who worked at least 50 hours a week) in industries such as furniture manufacturing, which saw a plunge in orders from abroad, and trading and constructions, in which extra workers from agricultural sector substituted for overtime. In contrast, the number of hours worked rose in some service sectors, particularly hotel and restaurants, which benefited from the surge in the number of tourists.
Inflation
Headline inflation in 2015 averaged at -0.9 percent due to a considerable fall in the global crude oil price. Following structural changes in the global oil market, supply of oil increased, causing price to decline. These changes included particularly the advancement of the United States’ shale oil technology, as well as the maintaining of oil production among major exporting countries in order to retain market share. Subdued demand for oil,
%YOY 2014 20152015
Q1 Q2 Q3 Q4
Employment 0. 0.2 0.5 0.2 0.2 0.
Agricultural 2. . . 5. . 0.
Non-agricultural 0. 1. 1. 2. 1. 0.
Manufacturing 1. 0.9 1.2 .0 0. 1.0
Construction 5.0 0. 1.9 2.5 2. .9
Trading 0.2 0.1 2. 2.0 0.2 0.
Services 2.0 .1 . 2. .2 .2
Hours worked in non-agricultural 1.2 0. 1.0 1.0 1.2 0.
Manufacturing 0.01 0. 1. 1. 1. 1.2
Construction .1 1.1 0.2 1.1 0.2 5.
Trading 2. 2.1 . 0.9 .2 1.
Services 0. 1.2 1. 0. 0.01 2.
Unemployment (thousand persons) 22. 0. 1. .1 5 .0 0 .
Unemployment rate (%) 0. 0.9 0.9 0.9 0.9 0.8
Underemployment (thousand persons)
25 . 2 2.52 1.2 2 .2 250.9 2 0.9
Underemployment rate (%) 0. 0. 0. 0. 0. 0.
Note: Based on 2010 Population Database (Service sector excludes construction and trading)Source: National Statistical Office
Key Labor Market Indicators

Thailand’s Economic Conditions in 2015 50
given the slow pace of global economic recovery, also contributed to the fall in price. Against such global backdrop, domestic fuel price tumbled, especially retail oil prices, albeit to a smaller extent than did the global prices given the weakness of the baht. Meanwhile, raw food prices rose only moderately because pork meat and eggs were in excess supply.
Core inflation averaged at 1.1 percent. It remained at a low level because (1) cost-push pressure fell, most notably as transportation costs declined with oil prices, (2) demand-side pressure remained subdued in line with the economic conditions, and ( ) the high base price for prepared food from the previous year led to a negative contribution. Nevertheless, deflation risk was limited since domestic demand continued to expand, and long-term inflation expectation remained close to the 2.5 percent target.
-3-2-101234
Q12012
Q12013
Q12014
Q12015
Raw food EnergyCore inflation Headline infaltion
Contributions to Headline InflationPercent
Source: Bureau of Trade and Economic Indices, Ministry of Commerce. Calculations by Bank of Thailand.
0
2
4
6
8
Jan2007
Jan2008
Jan2009
Jan2010
Jan2011
Jan2012
Jan2013
Jan2014
Jan2015
Inflation expectation by firms (1-year ahead)Inflation expectation by professional economists (1-year ahead)Inflation expectation by professional economists (5-year ahead)Headline inflation target (2.5±1.5)
Inflation Expectations%YOY
Note: Inflation expectations by firms are based on Bank of Thailand surveys, while Inflation expectations by professional economists are based on Consensus Economics surveys.Source: Business Sentiment Index by Bank of Thailand, Asia Pacific Consensus Forecast
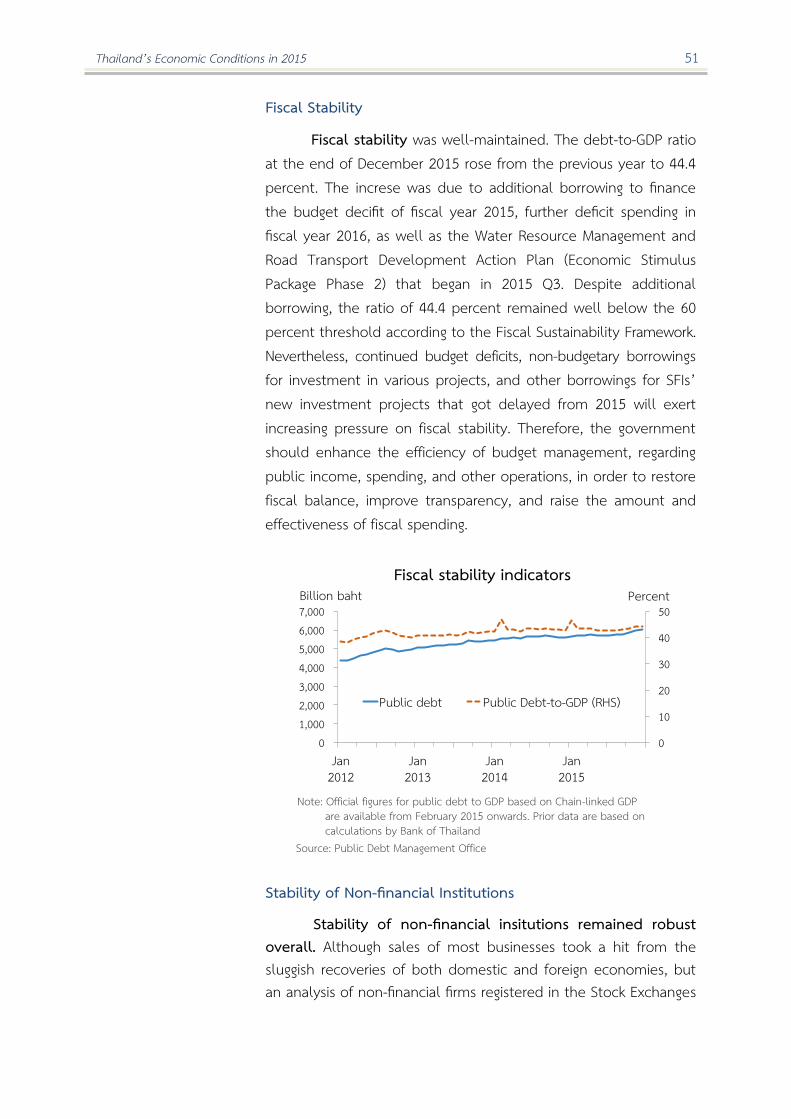
Thailand’s Economic Conditions in 2015 51
Fiscal Stability
Fiscal stability was well-maintained. The debt-to-GDP ratio at the end of December 2015 rose from the previous year to . percent. The increse was due to additional borrowing to finance the budget decifit of fiscal year 2015, further deficit spending in fiscal year 201 , as well as the Water Resource Management and Road Transport Development Action Plan (Economic Stimulus Package Phase 2) that began in 2015 Q3. Despite additional borrowing, the ratio of 44.4 percent remained well below the 60 percent threshold according to the Fiscal Sustainability Framework. Nevertheless, continued budget deficits, non-budgetary borrowings for investment in various projects, and other borrowings for SFIs’ new investment projects that got delayed from 2015 will exert increasing pressure on fiscal stability. Therefore, the government should enhance the efficiency of budget management, regarding public income, spending, and other operations, in order to restore fiscal balance, improve transparency, and raise the amount and effectiveness of fiscal spending.
Stability of Non-financial Institutions
Stability of non-financial insitutions remained robust overall. Although sales of most businesses took a hit from the sluggish recoveries of both domestic and foreign economies, but an analysis of non-financial firms registered in the Stock Exchanges
Fiscal stability indicators
Source: Public Debt Management Office
0
10
20
30
40
50
01,0002,0003,0004,0005,0006,0007,000
Jan 2012
Jan2013
Jan2014
Jan2015
Public debt Public Debt-to-GDP (RHS)
Billion baht Percent
Note: Official figures for public debt to GDP based on Chain-linked GDP are available from February 2015 onwards. Prior data are based on calculations by Bank of Thailand

Thailand’s Economic Conditions in 2015 52
(SET and MAI) reveals that profitability in 2015 was largely unchanged from the previous year. This is indicated by the Operating Profit Margin of .5 percent, compared to .1 percent in 201 . Effective cost management allowed firms in most sectors to maintain profitability, as operating costs fell more than sales. However, some sectors did experience a drop in profitability: (1) Petroleum industry suffered from a sharp drop in global crude oil price, causing a massive fall in sales revenue. As a result, profits tumbled due to stock loss realization, particularly in 2015 Q ; (2) Metal industry saw a collapse in sales following the fall in metal prices in the global market. Excluding these industries, overall profitability would improve from .5 to . percent.
Debt repayment ability of corporates deteriorated slightly, as indicated by the Interest Coverage Ratio that fell from 5.6 percent in 2014 to 5.4 percent in 2015. However, liquidity remained robust, with a low level of Debt to Equity Ratio1 and Current Ratio2 of 0.7 and 1.7 times, respectively.
Eventhough profits in the corporate sector was well-maintained, but debt repayment ability going forward will depend critically on the recovery path of both global and Thai economies. Already fragile, small businesses are particularly at risk, indicated by a steeper growth in NPL ratios among SMEs compared to those among large businesses in the commercial bank system. Moreover, the rapid debt accumulation among some large corporates is to be monitored. For some industries, such as telecommunication, retail and wholesale trade, additional borrowing during the period of low funding costs was used to finance business expansion. However, for others, such as the metal industry, the loss in profits that reduced equity called for extra borrowing.
1 Debt to Equity Ratio (D/E) indicates corporates’ debt burden and is calculated by dividing debt by equity. 2 Current Ratio (CR) reflects corporates’ ability to repay short-term debt when due. It is the ratio between
current assets and current liabilities.
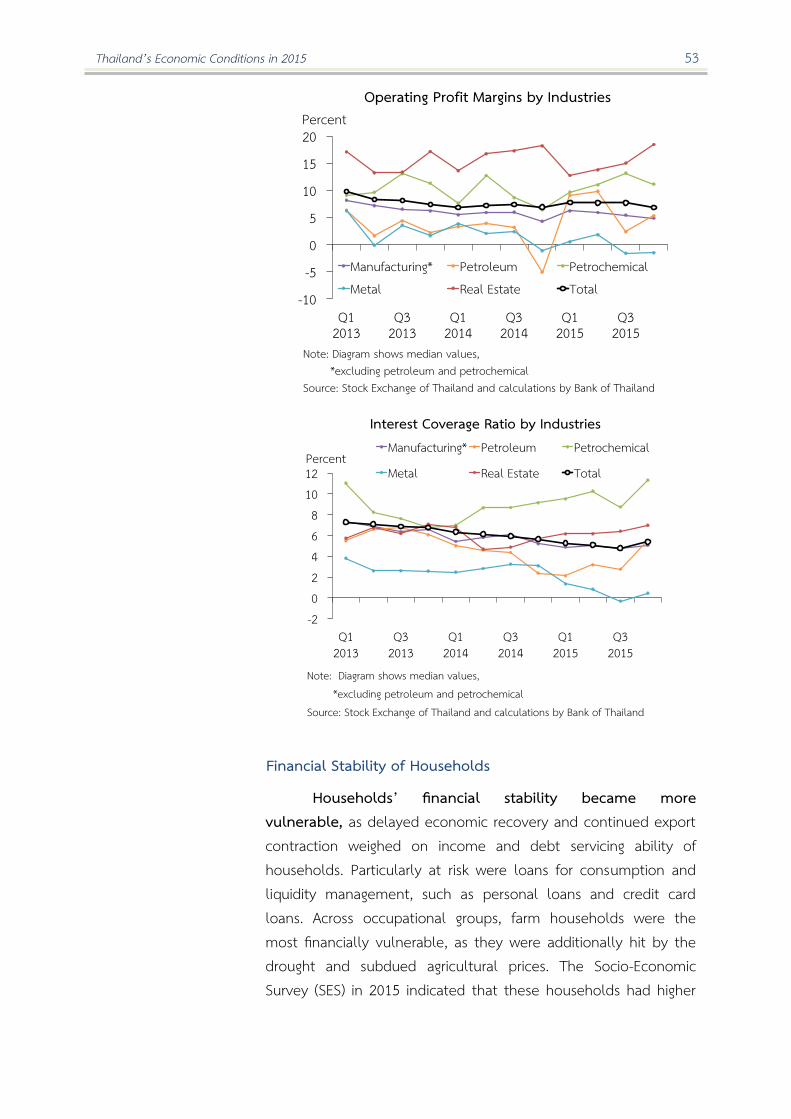
Thailand’s Economic Conditions in 2015 53
Financial Stability of Households
Households’ financial stability became more vulnerable, as delayed economic recovery and continued export contraction weighed on income and debt servicing ability of households. Particularly at risk were loans for consumption and liquidity management, such as personal loans and credit card loans. Across occupational groups, farm households were the most financially vulnerable, as they were additionally hit by the drought and subdued agricultural prices. The Socio-Economic Survey (SES) in 2015 indicated that these households had higher
PercentOperating Profit Margins by Industries
Note: Diagram shows median values, excluding petroleum and petrochemical Source: Stock Exchange of Thailand and calculations by Bank of Thailand
-10
-5
0
5
10
15
20
Q12013
Q32013
Q12014
Q32014
Q12015
Q32015
Manufacturing* Petroleum PetrochemicalMetal Real Estate Total
-202468
1012
Q12013
Q32013
Q12014
Q32014
Q12015
Q32015
Manufacturing* Petroleum Petrochemical
Metal Real Estate Total
Interest Coverage Ratio by Industries
Note: Diagram shows median values, excluding petroleum and petrochemical Source: Stock Exchange of Thailand and calculations by Bank of Thailand
Percent

Thailand’s Economic Conditions in 2015 54
debt burden than those of other occupations. Government measures, such as the village-level welfare support and the soft loans for farmers would help to some extent provide liquidity for households in need.
0%
10%
20%
30%
40%
50%
Agricultural Non-agriculturalprivate business
Professionals Employees Total
p25 p50 p75
Source: Household Socio-Economic Survey, National Statistical Office. Calculations by the Bank of Thailand.
Note: Only includes households with debt, representing 50% of all households (in 2015).1 Such as managers, scholars, professional workers, and technical workers. 2 Such as farming, forestry, and fishery workers, machine operators, clerks,
service workers, and craftsmen in manufacturing or construction.
09
1 2
% of income
0909
09 0911 131111
1111
13
1313
13 1515
151515
Debt Servicing Ratio (DSR)
Share of Non-Performing Consumer LoansIssued by Commercial Banks
0
2
4
6
Q12011
Q12012
Q12013
Q12014
Q12015
Home loans Car loansCredit card loans Personal loansConsumer loans (total)
Percent of loans
Note: Share of total loans in 2015 - home loans 15.7%, car loans 7.4%, personal loans 6.7%, and credit card loans 1.8%.
Source: Bank of Thailand

Thailand’s Economic Conditions in 2015 55
Stability of Financial Institutions
Loan quality worsened, but the financial standings of financial institutions overall could endure additional risks. Deteriorated loan repayment ability among households and businesses resulted in worsened loan quality, as suggested by the rise in the share of NPL from 2.2 percent at end of 201 to 2. percent at end of 2015. The decline was observd across all types of debters, particularly small corporates and larger ones in the metal industry that suffered from subdued commodity prices. Moreover, consumer loans quality weakened for all loan types. However, financial institutions remained robust overall, thanks to the high level of capital buffers and loan loss provision. The Actual Regulatory Loan Loss Provision Ratio at year-end stood at 15 . percent. Meanwhile, the Capital Adequacy Ratio recorded at 1 . percent, above the required .5 percent, thus indicating that financial institutions could withstand higher level of loan defaults.
In terms of commercial banks profitability, operating profits registered a strong growth, eventhough net profits dropped from 192. billion baht to 21 .1 billion baht in 201 . Prompted by higher allowance for doubtful accounts in the face of worsened loans quality, the fall in net profits also rendered a decline in Returns on Assets (ROA) from 1.2 percent at the end of 201 to 0.9 percent at the end of 2015.
Share of Non-Performing Loans Issued by Commercial Banks
0
2
4
6
Q12011
Q12012
Q12013
Q12014
Q12015
Total loans Total consumer loansTotal business loans Large business loansSME loans
Percent of loans
Note: Share of total loans in 2015 – large business loans 29.9%, SME loans 38.4%, and consumer loans 31.6%.
Source: Bank of Thailand

Thailand’s Economic Conditions in 2015 56
6.2 External Stability
External stability was strong overall, both in terms of liquidity and repayment ability. This suggests limited vulnerability to global market volatility.
External stability was well maintained, with most indicators of liquidity and debt servicing ability improving from the previous year and at a high level according to international benchmarks. External debt outstanding fell from 201 due to two factors: (1) Foreign investors were net sellers of Thai government and BOT bonds, as they reduced their holdings of emerging markets’ risky assets amidst global financial market volability that followed policy divergence among major economies; (2) Depository institutions paid off part of their debts, including long-term loans that had matured, and short-term loans for foreign currency position adjustments. Given the baht’s depreciation over this period, the change in short-term loans was in line with lower demand for foreign exchange hedging from exporters, and higher such demand from importers and borrowers of foreign funds. ( ) Trade credits were repaid as import volumes declined. In addition, the valuation change following U.S. dollar’s strength against the baht and other major currencies resulted in . billion fall in external debt outstanding.
External Stability Indicators
International benchmarks
2014 2015 2015
Q1 Q2 Q Q
Indicators of debt servicing ability (percent) - current account balance1 to GDP n.a. 3.8 8.0 8.1 6.2 7.3 10.4 - External debt to GDP2 48-80 34.4 31.8 33.5 33.3 32.7 31.8
- External debt to value of exports of goods and services1 2 132-220 50.1 46.4 48.8 48.6 47.8 46.4 - Debt service ratio < 20 4.9 6.1 5.0 8.1 5.5 6.0
Indicators of liquidity - Gross reserves to short-term external debt (times) > 1 2.8 3.1 3.0 2.9 2.9 3.1 - Gross reserves to import value (months) > 3-4 9.4 10.6 9.5 10.0 10.1 10.6
- Short-term external debt to total external debt (percent) n.a. 40.0 39.6 38.3 40.2 40.3 39.6 Notes: 1/ Since October 2006, “Reinvested Earning” has been recorded as part of direct investment in the financial account and its contra
entry recorded as “Investment Income” in the current account 2/Outstanding debt divided by averaged quarterly GDP or export values for the last three years starting from the quarter considered. 3/ Principals and interest payments, both short and long terms of external debt, divided by value of exports of goods and services. 4/ Benchmark for middle-income countries, i.e. with GDP per capita of 756 – 9,265 US dollars per year. Source: Bank of Thailand

Thailand’s Economic Conditions in 2015 57
7. Important Monetary Policies and Measures
Interest Rate Policy
28 Jan 11 Mar 29 Apr 10 Jun 5 Aug 16 Sep 4 Nov 16 Dec Monetary Policy Committee (MPC) Meetings in 2015
Source: BOT News No. 4/2015, 14/2015, 22/2015, 29/2015, 37/2015, 46/2015, 52/2015 and 60/2015
o In the second and third meetings of the year, the MPC decided to cut the policy interest rate twice consecutively. In the second meeting on March 11, 2015, the Committee voted, 4 to 3, to lower the policy rate from 2.00 to 1.75 percent. The cut was to accommodate the slower-than-expected economic recovery, as well as to maintain the confidence of the private sector while awaiting the effect of fiscal stimulus to kick in. In the third meeting on April 29, 2015, the Committee voted, 5 to 2, to further reduce the policy rate by 0.25 percent, down to 1.50 percent. The easing of monetary policy was accommodative to the recovery of the Thai economy amidst the impacts of the global economic slowdown. The policy, moreover, aimed to maintain the public inflation expectation at a suitable level, as headline inflation would likely remain low for some time.
o In the next three meetings, the MPC projected the Thai economy to recover gradually and unanimously agreed to maintain the policy rate at 1.50 percent. The economy still faced with both internal and external headwinds, including the drought crisis, slowdown of the Chinese and Asian economies, and the structural constraints associated with the global trade and Thai manufacturing exports. Nonetheless, sustained government budget disbursement and flourishing tourism helped support the economy. Moreover, previous policy interest rate cuts and accommodative monetary policy under the International Capital Flow Master Plan significantly alleviated the monetary conditions. Exchange rates also shifted in a favorable direction to the economic recovery.
o In the last quarter of the year, the MPC was primarily concerned with maintaining financial stability. Hence, the Committee avoided policies that could add uncertainties to the financial markets, which were already sensitive to divergent monetary policies of major economies. In the meantime, the government’s stimulus measures had continually taken an important role in the economy. The Committee therefore unanimously agreed to maintain the policy rate at 1.50 percent in its meeting in July and August 2015, reckoning that the monetary policy was still sufficiently relaxed. They also agreed that
1.75 percent
Policy Interest Rate
2.00 percent 1.50 percent

Thailand’s Economic Conditions in 2015 58 accommodative monetary policy should be maintained to facilitate the economic recovery. Furthermore, close monitoring of risk factors that could jeopardize the recovery was necessary. In particular, a cautious watch on search-for-yield behaviors that imposed risks on financial stability was deemed imperative, especially for a country that had been under low policy interest rates for an extended period of time.
Financial Market Measures
1. Foreign Exchange Control
Measure Key Content Effective Date 1. Relaxation of regulations
on business operations of corporate treasury centers
1. Allow corporate treasury centers to have foreign currency accounts abroad, however, only with a licensed institution, in order to help enhance liquidity of the conglomerate.
2. Allow a corporate treasury center to borrow from a company in the conglomerate abroad.
3. Allow a corporate treasury center to borrow from an affiliated firm without a limit on the duration of loans.
4. Allow a corporate treasury center to keep financial documentation of foreign exchange transactions at an affiliated company.
May 13, 2015
2. Relaxation of purchase limits on foreign currency
1. Extend the limit of outgoing credit transfer for purchasing assets abroad to 50 million U.S. dollars, or equivalent, per entity per year.
2. Extend the limit on foreign currency purchase by residents to put in saving accounts with commercial banks freely. However, outstanding must not exceed 5 million U.S. dollars, or equivalent.
July 8, 2015
3. Relax regulations and procedures on investment in foreign securities and derivatives.
1. Allow residents to invest in foreign securities via commercial banks, while they were previously only allowed to invest via security firms or private funds.
2. Annex an additional type of corporate investors: future contract investors in Thailand Future Exchange Market (TFEX).
3. Allow corporate investors and individual investors to cancel exchange rate-hedging transactions against risks from investment in foreign securities in every case.
July 8, 2015
Source: 1. BOT Circular No. FMD(21) Wor.15/2015 dated April 30, 2015 2.-3. BOT Circular No. FMD(21) Wor.25-26/2015 dated June 24, 2015

Thailand’s Economic Conditions in 2015 59
2. Measures against search-for-yield behavior
Measure Key Content Effective Date
1. Release Thai Baht liquidity to Non-Residents (NR)
Extend the credit limits that Thai financial institutions can release Thai Baht liquidity to NR. For instance, the limit on swap and forward transactions without underlying trades or investment in Thailand are lifted to 600 million Baht per group of NR per one financial institution (from the previous limit of 300 million Baht.)
May 6, 2015
Source: BOT Circular FMD(21) Wor.572/2015 dated April 30, 2015 Updated regulations and practical measures against search-for-yield behavior (Updated Circular BOT.FER(02) Wor.371/2008 dated February 29, 2008)
