thailand economic monitor - world...
TRANSCRIPT


i
THAILAND ECONOMIC MONITOR
JUNE 2010
World Bank Office – Bangkok Country Director: Annette Dixon Chief Economist: Vikram Nehru
Comments to: Mathew A. Verghis
[email protected] Frederico Gil Sander
30th Floor, Siam Tower 989 Rama I Road, Pathumwan
Bangkok 10330, Thailand (662) 686-8300
www.worldbank.or.th
Acknowledgements
This report was prepared by Frederico Gil Sander (Task Team Leader), Vatcharin Sirimaneetham,
Nattaporn Triratanasirikul and Ratchada Anantavrasilpa under the overall supervision of Mathew A.
Verghis. Vachraras Pasuksuwan and Ruangrong Thongampai expertly handled the processing of the
document. The cover of this report was designed by Tinnakorn Sareenun.
We would like to acknowledge input from Pamornrat Tansanguanwong, Magnus Lindelow and Piriya
Pholphirul (Social Protection and Health), Shabih Mohib (Public Sector), and Pichaya Fitts (External
Relations). Valuable comments and information were provided by officials of the Bank of Thailand, Board of
Investment, Customs Department, Department of Trade Negotiations, EXIM Bank, Federation of Thai
Industries, Fiscal Policy Office, the National Economic and Social Development Board, National Statistics
Office, Office of Agricultural Economics, Office of Industrial Economics, Office of the Civil Service
Commission, Office of the Public Sector Development Commission, Public Debt Management Office,
Securities and Exchange Commission, Stock Exchange of Thailand, Thai Chamber of Commerce, and the
Thai Bond Market Association as well as by World Bank staff including Vikram Nehru, Ivailo Izvorski,
Kirida Bhaopichitr and Philip Schellekens.

ii
ABBREVIATIONS
AFET Agricultural Futures Exchange of Thailand
ASEAN Association of Southeast Asian Nations
BEX Bond Electronic Exchange
BIMSTEC Bay of Bengal Initiative for Multi-sectoral Technical and Economic Cooperation
BIS Bank for International Settlements
BOB Bureau of the Budget
BOI Board of Investment
BOP Balance of Payments
BOT Bank of Thailand
BSI Business Sentiment Index
CAR Capital Adequacy Ratio
CGD Comptroller‘s General Department
CMDP Capital Market Development Master Plan
CPI Consumer Price Index
E&E Electrical and electronics
EPPO Energy Policy and Planning Office
EU European Union
EXIM Bank Export-Import Bank of Thailand
FDI Foreign Direct Investment
FIDF Financial Institutions Development Fund
FRDF Farmers‘ Reconstruction and Development Fund
FSMP Financial Sector Master Plan
FTA Free Trade Agreement
FY Fiscal Year
GEP Global Economic Prospects
GDP Gross Domestic Product
GTAP Global Trade Analysis Project
HS Harmonized System
IAS International Accounting Standards
IFRS International Financial Reporting Standards
IOSO International Organization of Securities Commissions
IPEA Institute of Applied Economic Research
KPIs Key Performance Indicators
MAI Market for Alternative Investment
MNCs Multinational Companies
MOC Ministry of Commerce
NCB National Credit Bureau
NEER Nominal Effective Exchange Rate
iii
NESDB National Economic and Social Development Board
NIM Net interest margin
NPA Non-performing asset
NPL Non-performing loan
NSO National Statistic Office
OAG Office of the Auditor General of Thailand
OECD Organization for Economic Cooperation and Development
PAEC Public Audit and Evaluation Committee
PEFA Public Expenditure and Financial Accountability
PDMO Public Debt Management Office
PICS Productivity and Investment Climate Survey
PSA Public Service Accounting
REER Real Effective Exchange Rate
SEC Stock Exchange Commission
SEPO State Enterprise Policy Office
SET Stock Exchange of Thailand
SFI Specialized financial institution
SMEs Small and Medium Enterprises
SOCBs State-owned Commercial Banks
SOEs State-owned Enterprises
SP Stimulus Package
TCH Thailand Clearing House Co. Ltd.
TFEX Thailand Futures Exchange
TFP Total factor productivity
TKK Thai Khem Kaeng
UNCTAD United Nations Conference on Trade and Development
UTCC University of the Thai Chamber of Commerce

iv
TABLE OF CONTENTS
SECTION 1 SUMMARY ......................................................................................................................... 1
SECTION 2 MACROECONOMIC DEVELOPMENTS AND OUTLOOK ..................................... 5
2.1 Production ........................................................................................................................................ 10
2.2 External Demand .............................................................................................................................. 13
2.2.1 External Environment ............................................................................................................... 14
2.2.2 Merchandise Exports ................................................................................................................. 19
2.2.3 Exports of Services .................................................................................................................... 27
2.3 Private Domestic Demand ................................................................................................................ 32
2.3.1 Household Consumption ........................................................................................................... 32
2.3.2 Private Investment ..................................................................................................................... 37
2.4 Fiscal Policy ..................................................................................................................................... 39
2.4.1 Public Investment ...................................................................................................................... 39
2.4.2 Fiscal Framework ...................................................................................................................... 41
2.5 Monetary Policy and Capital Flows ................................................................................................. 48
2.5.1 Inflation and Monetary Policy Stance ....................................................................................... 48
2.5.2 Exchange Rate and Capital Flows ............................................................................................. 49
2.6 Financial and Corporate Sector Developments ................................................................................ 53
2.6.1 Financial Sector ......................................................................................................................... 53
2.6.2 Corporate Sector ........................................................................................................................ 60
SECTION 3 SHARED AND SUSTAINABLE GROWTH .................................................................. 62
3.1 Poverty and Inequality ...................................................................................................................... 62
3.2 Education for Sustainable Growth .................................................................................................... 67
Appendix 1: Key Indicators Table .......................................................................................................... 75
Appendix 2: Monitoring Matrices for Structural Reform Implementation ........................................ 77
1. Poverty Reduction ............................................................................................................................. 78
2. Financial and Corporate Sectors Reforms ......................................................................................... 79
3. Reforms to Improve Business and Investment Environment and Trade Regime .............................. 82
4. Public Sector and Governance Reform .............................................................................................. 85
5. Social Protection ................................................................................................................................ 87
v
BOXES
Box 1. Potential Impact of the Escalation of Political Crisis on the Thai Economy..................................... 6
Box 2. Supply Chains in the Electrical and Electronics (E&E) Sectors ..................................................... 12
Box 3. Chinese Import Demand from Thailand Looking Forward ............................................................. 23
Box 4. Will a More Competitive Vietnamese Dong Hurt Thai Exports? ................................................... 30
Box 5. From Crop Mortgage to Price Insurance ......................................................................................... 33
Box 6. Public Expenditure and Financial Accountability: Summary Findings .......................................... 45
Box 7. Specialized Financial Institutions .................................................................................................... 58
Box 8. Findings on the Second Round of the Rapid Poverty and Social Impact Assessment of the
Economic Downturn in Thailand ................................................................................................................ 65
FIGURES
Figure 1. The Thai economy has been driven by sectors linked to external demand, both in the short
term… ........................................................................................................................................................... 1
Figure 2. …and the long-term. A pick-up in sectors linked to domestic demand is needed to change this
trend, but that is unlikely in the near term. ................................................................................................... 1
Figure 3. Import demand, especially from China, has rebounded and is expected to remain on firm footing
in the medium term, providing a basis for continued growth in the Thai economy. .................................... 2
Figure 4. Although GDP contracts sharply in Q2 due to the political turmoil, the strong performance in
Q1, a modest recovery in the second half of 2010 and the low base in 2009 lead to a 6.1 percent yearly
growth rate. ................................................................................................................................................... 2
Figure 5. Sectors resilient to the political crisis account for 49 percent of GDP, but only employ 17
percent of the labor force. ............................................................................................................................. 3
Figure 6. Thai labor markets are very flexible and workers respond to shocks to one sector by moving to a
different sector. ............................................................................................................................................. 3
Figure 7. The fiscal deficit declines in 2010 as revenues recover and disbursements of public investments
remain sluggish. ............................................................................................................................................ 4
Figure 8. The financial position of Thai banks has continued to strengthen even during the crisis and they
are now well positioned to expand credits rapidly during the recovery. ....................................................... 4
Figure 9. The Thai economy experienced a V-shaped contraction and recovery in 2009, driven primarily
by the manufacturing sector. ......................................................................................................................... 6
Figure 10. Manufacturing value-added has grown faster in Thailand compared to Malaysia, Indonesia and
the Philippines, despite a number of political events in the period. .............................................................. 7
Figure 11. Household consumption has declined relative to Malaysia and the Philippines, suggesting Thai
households may be saving more in response to heightened political uncertainty. ........................................ 8
Figure 12. Gross capital formation has also lagged, and especially compared to Malaysia appears
sensitive to political events. .......................................................................................................................... 8
Figure 13. Tourist receipts in both Indonesia and Thailand fell in late 2008 because of the global financial
crisis, but the decline in Thailand was larger. ............................................................................................... 9

vi
Figure 14. The sell-off of Thai stocks observed on May 19 likely represented flight-to-quality of domestic
investors… .................................................................................................................................................... 9
Figure 15. …that bid up ‗safe‘ government bond prices, keeping yields low. ............................................. 9
Figure 16. E&E exports tracked overall exports quite closely. ................................................................... 11
Figure 17. Capacity utilization and production in the E&E industry have tracked each other… ............... 11
Figure 18. …as well as broader economic indicators. ................................................................................ 11
Figure 19. Capacity utilization overall is yet to return to pre-crisis levels. ................................................ 11
Figure 20. Net foreign demand is negative when investment picks up, reflecting the large import
component of machinery investments......................................................................................................... 14
Figure 21. An adjusted measure of external demand confirms that GDP dynamics are driven by the
external outlook. ......................................................................................................................................... 14
Figure 22. The US and Japan recovered faster than the EU in early 2010. ................................................ 15
Figure 23. Industrial production picked up steadily in the US and the EU................................................. 15
Figure 24. Consumer spending remains far below pre-crisis peaks in G3 economies. ............................... 15
Figure 25. Joblessness is still very high in the US and the EU. .................................................................. 15
Figure 26. Unlike China, G-3 import demand remains subdued. ............................................................... 17
Figure 27. Agricultural and metal prices have rebound quite strongly unlike energy prices...................... 17
Figure 28. The recent export slump is the most severe since 1960. ............................................................ 19
Figure 29. Compared to other export crises, the current turmoil was characterized by a steeper decline at
the onset and a stronger rebound................................................................................................................. 19
Figure 30. Momentum growth is picking up with high year-on-year growth. ............................................ 20
Figure 31. Shipments to key East Asian economies have surpassed the pre-crisis peaks. ......................... 20
Figure 32. The crisis hit high-tech shipments harder than other product groups. ....................................... 21
Figure 33. Auto exports are lagging behind other high-tech goods on the recovery path. ......................... 21
Figure 34. Thailand‘s export value recovered more favorably than most other regional economies. ........ 21
Figure 35. The decline in Thailand‘s export volume is generally deeper than others… ............................ 21
Figure 36. …but export prices are clearly more supportive. ...................................................................... 22
Figure 37. Agricultural prices have surpassed the record highs in mid-2008. ............................................ 22
Figure 38. The export outlook in 2010 has improved since late 2009 along with lower perceived
uncertainty................................................................................................................................................... 23
Figure 39. The Singapore purchasing manager index and US computer stocks typically correlate with
Thai exports. ............................................................................................................................................... 23
Figure 40. Chinese import demand emerged from the crisis more forcefully than G3 economies… ......... 24
Figure 41. …largely supported by more resilient domestic demand .......................................................... 24
Figure 42. Close to 80 percent of East Asia production is ultimately consumed elsewhere....................... 25
Figure 43. Import orders from China for Thai products have now matched those from G3 economies. ... 25
Figure 44. The share of electronics in exports rose sharply, replacing natural rubber as Thailand‘s top
export. ......................................................................................................................................................... 25
Figure 45. Tourists had returned before the political crisis intensified in March 2010. ............................. 28
Figure 46. Overall spending per visitor seems to have resumed positive growth. ...................................... 28
Figure 47. Before the unrest, arrivals from East Asia and Europe already exceeded the lows of the crisis
by over 200 percent. .................................................................................................................................... 29
Figure 48. Stronger consumer confidence and favorable stock markets in G3 economies correlate with
higher arrivals in Thailand… ...................................................................................................................... 29
vii
Figure 49. … so improved G3 stock markets should help to boost tourist arrivals. ................................... 29
Figure 50. European visitors are crucial to Thailand‘s tourism sector performance. ................................. 29
Figure 51. The Vietnam Dong has lost value against the US dollar while the baht strengthened. ............. 30
Figure 52. Agricultural prices plummeted as a result of the global financial crisis but have recovered since
mid-2009. .................................................................................................................................................... 32
Figure 53. Consumption indicators generally bottomed out in May 2009 and fell again in April and May
2010 due to the political crisis. ................................................................................................................... 32
Figure 54. Benchmark prices were generally below the insured price, allowing farmers to claim
compensation for the difference. ................................................................................................................. 35
Figure 55. Most private investment in Thailand since the financial crisis has been in equipment, which is
associated with machinery imports. ............................................................................................................ 37
Figure 56. The recovery of equipment investment lagged the manufacturing rebound….......................... 37
Figure 57. … and increases in capacity utilization. .................................................................................... 38
Figure 58. FDI declines in Thailand in 2009 were in line with those in neighboring countries. ................ 38
Figure 59. Following massive drawdowns in 2009, inventory restocking is likely to make only a small
contribution for the rest of 2010. ................................................................................................................ 39
Figure 60. Public investment picked up modestly in 2009 as government construction accelerated. ........ 40
Figure 61. Except for consumption-based items such as agricultural insurance, disbursements under the
TKK budget have been slow. ...................................................................................................................... 40
Figure 62. TKK investments will make up for a near halving of on-budget public sector investments. .... 41
Figure 63. The modest overall increase will keep the share of public investment to GDP practically
constant. ...................................................................................................................................................... 41
Figure 64. Shocks to growth could result in a persistent deterioration of Thailand‘s debt levels. ............. 44
Figure 65. Core prices remain below historical trends, suggesting inflation risks are limited. .................. 49
Figure 66. Capital flows are expected to remain positive, although the current account surplus is likely to
decline on rising imports. ............................................................................................................................ 51
Figure 67. Capital inflows remained high but the pace of sterilization declined as appreciation of the baht
led to valuation losses on the stocks of foreign reserves. ........................................................................... 52
Figure 68. With the exception of Korea, since October 2009 nominal effective exchange rates across the
region have been within 7 percent of their pre-crisis levels. ....................................................................... 52
Figure 69. Banks‘ capital continued to grow thanks to a decrease in bad loans… ..................................... 54
Figure 70.…and loans overall, but credit growth started to recover in Q4 of 2009.................................... 54
Figure 71. In contrast to commercial banks, SFIs expanded credit robustly in 2009. ................................ 54
Figure 72. Despite the global financial crisis, Thai banks were profitable for the ninth consecutive year. 54
Figure 73. Commercial banks profits in the second half of 2009 nearly returned to the pre-crisis level. .. 55
Figure 74. Thailand has high banking spreads in comparison with other East Asian economies. .............. 55
Figure 75. Investments in domestic bonds and mutual funds have increased faster than GDP over the past
two decades. ................................................................................................................................................ 56
Figure 76. From a high of 90 percent, deposits now comprise only 30 percent of assets. .......................... 56
Figure 77. The issuance of short-term bonds expanded remarkably in 2008-09... ..................................... 56
Figure 78. … greatly increasing the stock of domestic bonds. ................................................................... 56
Figure 79. The daily average trading value in the bond market increased significant in recent years but
declined in 2009. ......................................................................................................................................... 57
Figure 80. The market share of SFIs doubled between 1994 and 2009. ..................................................... 58
Figure 81. The three largest SFIs account for 94 percent of SFIs total assets. ........................................... 58

viii
Figure 82. SFIs have higher NPL and lower capital adequacy ratios than banks. ...................................... 60
Figure 83. Unlike during the 1997 crisis, credit and total assets of SFIs increased against commercial
banks in 2009. ............................................................................................................................................. 60
Figure 84. Despite lower revenues in 2009, listed firms increased their efficiency and managed to increase
profits. ......................................................................................................................................................... 61
Figure 85. Debt-to-equity ratios remained on a downward trend, even as profits took a large hit in 2008.61
Figure 86. Farm incomes have rebounded since the fourth quarter of 2009 although production has
declined. ...................................................................................................................................................... 63
Figure 87. Wages declined in 2009 despite low rates of unemployment as workers shifted to lower-paying
jobs. ............................................................................................................................................................. 63
Figure 88. Labor initially shifted to agriculture during the crisis, but as the recovery took hold
manufacturing employment gained. ............................................................................................................ 63
Figure 89. Employers cut overtime as a means to rein in labor costs, so even those who did not lose their
jobs saw their incomes reduced. ................................................................................................................. 63
Figure 90. Thailand‘s average growth has been higher, but in Brazil incomes of the poor have grown
faster relative to incomes of the rich… ....................................................................................................... 64
Figure 91. … as a result inequality declined more in Brazil during the period. ......................................... 64
Figure 92. Primary enrollment rates are close to 100 percent, but upper-secondary and higher education
enrollment rates have lagged. ..................................................................................................................... 68
Figure 93. Tertiary Gross Enrollment rates in Thailand are well below those of most OECD countries. .. 68
Figure 94. Students in higher education still predominantly come from top quintile of the income
distribution. ................................................................................................................................................. 69
Figure 95. While most students from the top quintile go on to finish university, students from the lowest
quintile drop out earlier. .............................................................................................................................. 69
Figure 96. Thai employers are willing to pay a significant premium for higher education. ....................... 70
Figure 97. Work experience exacerbates the impact of schooling on wage differentials. .......................... 70
Figure 98. It takes Thai firms 5.2 weeks to fill a vacancy for a skilled position. ....................................... 71
Figure 99. Skill shortages are a salient factor explaining Thai firms‘ difficulty in filling vacancies. ....... 71
Figure 100. Chinese and Korean universities have been spending more on R&D and catching up to other
OECD countries. ......................................................................................................................................... 72
Figure 101. About three percent of responders indicated Thailand was an attractive R&D destination,
compared to 61 percent for China. .............................................................................................................. 72
Figure 102. Thailand has fewer doctors per capita than most middle-income countries. ........................... 73
Figure 103. The number of medical students had been declining, suggesting that a supply response may
be appropriate.............................................................................................................................................. 74
TABLES
Table 1. Real GDP Growth, 2009-2011 (Percent, year-on-year) .................................................................. 5
Table 2. A moderate global economic recovery with trade rebound and low inflation .............................. 17
Table 3. All items under the normal track of ASEAN-China FTA enjoy no tariff in 2010. ....................... 26
Table 4. Many of Thailand‘s top export products to China already enjoyed no tariffs before 2010. ......... 27
Table 5. Some Thailand and Vietnam‘s export goods are similar thus likely more affected. .................... 31

ix
Table 6. Market prices responded to the government‘s intervention price, highlighting the program‘s
distortionary nature. .................................................................................................................................... 34
Table 7. The contribution of the off-budget TKK program is likely to decline sharply as investment
projects are moved on-budget. .................................................................................................................... 43
Table 8. Thailand‘s debt profile is resilient to one-off shocks, but lower growth rates would lead to
increasing levels of debt. ............................................................................................................................. 45
Table 9. The current account surplus is projected to narrow substantially as import prices and volumes
recover in 2010. .......................................................................................................................................... 50
Table 10. Partly due to political uncertainties, foreign portfolio inflows were modest, accounting for less
than 0.5 percent of GDP. ............................................................................................................................. 50
Table 11. Measures announced by the Bank of Thailand on February 2, 2010 to facilitate capital outflows.
.................................................................................................................................................................... 52
Table 12. The issuance of government securities picked up in 2009, as did long-term bonds by
commercial issuers. ..................................................................................................................................... 57
Table 13. SFIs have a mandate to support various sectors of the economy. ............................................... 58
Table 14. Government involvement in financial institutions ranges from fully directed to partially
influenced through an implicitly guarantee. ............................................................................................... 59
Table 15. Workers with higher education make four times more than those with only a primary education.
.................................................................................................................................................................... 70
Table 16: Universities are not an important source of information and technology to Thai firms. ............ 72
1 ‹‹ THAILAND ECONOMIC MONITOR JUNE 2010
SECTION 1
SUMMARY
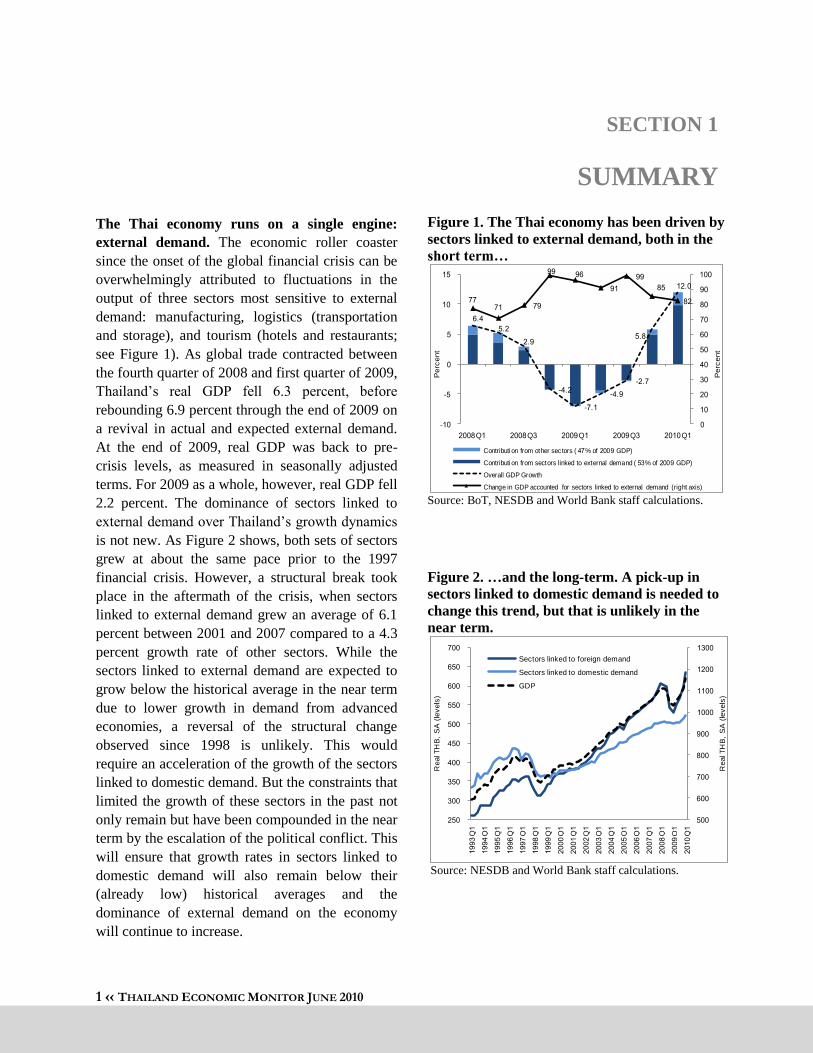
The Thai economy runs on a single engine:
external demand. The economic roller coaster
since the onset of the global financial crisis can be
overwhelmingly attributed to fluctuations in the
output of three sectors most sensitive to external
demand: manufacturing, logistics (transportation
and storage), and tourism (hotels and restaurants;
see Figure 1). As global trade contracted between
the fourth quarter of 2008 and first quarter of 2009,
Thailand‘s real GDP fell 6.3 percent, before
rebounding 6.9 percent through the end of 2009 on
a revival in actual and expected external demand.
At the end of 2009, real GDP was back to pre-
crisis levels, as measured in seasonally adjusted
terms. For 2009 as a whole, however, real GDP fell
2.2 percent. The dominance of sectors linked to
external demand over Thailand‘s growth dynamics
is not new. As Figure 2 shows, both sets of sectors
grew at about the same pace prior to the 1997
financial crisis. However, a structural break took
place in the aftermath of the crisis, when sectors
linked to external demand grew an average of 6.1
percent between 2001 and 2007 compared to a 4.3
percent growth rate of other sectors. While the
sectors linked to external demand are expected to
grow below the historical average in the near term
due to lower growth in demand from advanced
economies, a reversal of the structural change
observed since 1998 is unlikely. This would
require an acceleration of the growth of the sectors
linked to domestic demand. But the constraints that
limited the growth of these sectors in the past not
only remain but have been compounded in the near
term by the escalation of the political conflict. This
will ensure that growth rates in sectors linked to
domestic demand will also remain below their
(already low) historical averages and the
dominance of external demand on the economy
will continue to increase.
Figure 1. The Thai economy has been driven by
sectors linked to external demand, both in the
short term…
Source: BoT, NESDB and World Bank staff calculations.
Figure 2. …and the long-term. A pick-up in
sectors linked to domestic demand is needed to
change this trend, but that is unlikely in the
near term.
Source: NESDB and World Bank staff calculations.
-
-
-
-
-
-
Q Q Q Q Q
Perc
ent
Perc
ent
Contributi on from other sec tors ( % of GDP)
Contributi on from sectors linked to external demand ( % of GDP)
Overall GDP Growth
Change in GDP accounted for sectors linked to external demand (right axis)
Q
Q
Q
Q
Q
Q
Q
Q
Q
Q
Q
Q
Q
Q
Q
Q
Q
Q
Re
al T
HB
, S
A (
leve
ls)
Re
al T
HB
, S
A (
leve
ls)
Sectors linked to foreign demand
Sectors linked to domestic demand
GDP
2 ‹‹ THAILAND ECONOMIC MONITOR JUNE 2010
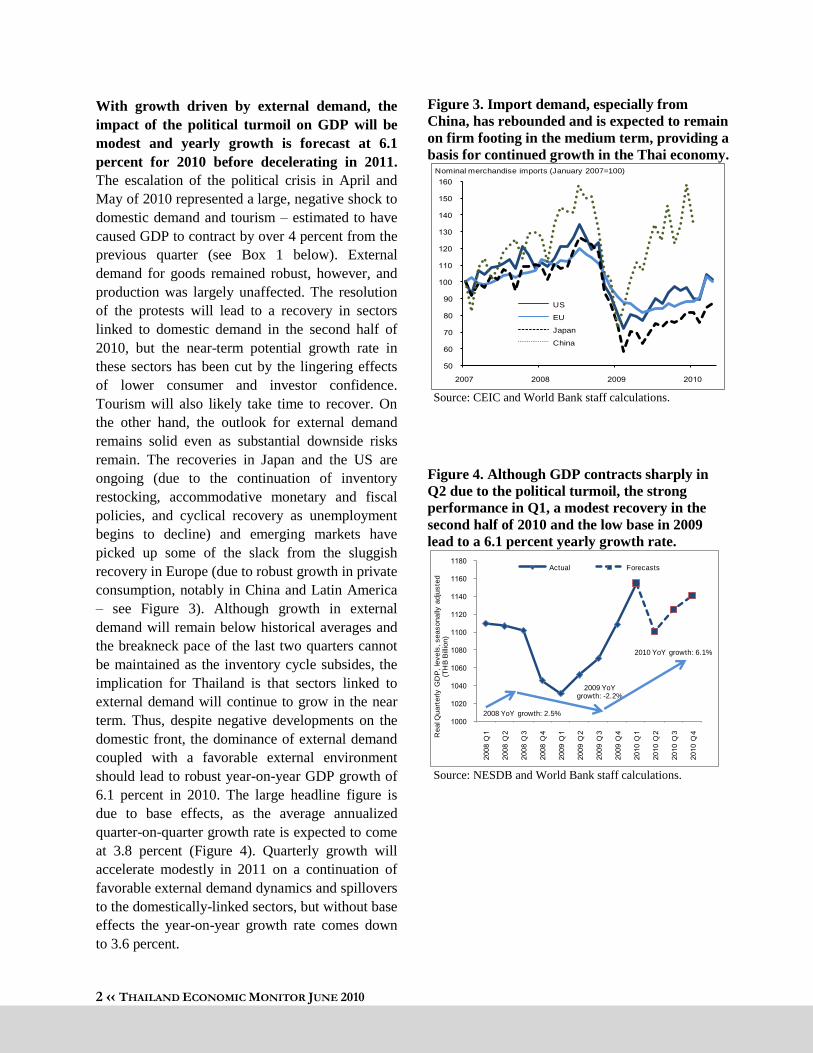
With growth driven by external demand, the
impact of the political turmoil on GDP will be
modest and yearly growth is forecast at 6.1
percent for 2010 before decelerating in 2011.
The escalation of the political crisis in April and
May of 2010 represented a large, negative shock to
domestic demand and tourism – estimated to have
caused GDP to contract by over 4 percent from the
previous quarter (see Box 1 below). External
demand for goods remained robust, however, and
production was largely unaffected. The resolution
of the protests will lead to a recovery in sectors
linked to domestic demand in the second half of
2010, but the near-term potential growth rate in
these sectors has been cut by the lingering effects
of lower consumer and investor confidence.
Tourism will also likely take time to recover. On
the other hand, the outlook for external demand
remains solid even as substantial downside risks
remain. The recoveries in Japan and the US are
ongoing (due to the continuation of inventory
restocking, accommodative monetary and fiscal
policies, and cyclical recovery as unemployment
begins to decline) and emerging markets have
picked up some of the slack from the sluggish
recovery in Europe (due to robust growth in private
consumption, notably in China and Latin America
– see Figure 3). Although growth in external
demand will remain below historical averages and
the breakneck pace of the last two quarters cannot
be maintained as the inventory cycle subsides, the
implication for Thailand is that sectors linked to
external demand will continue to grow in the near
term. Thus, despite negative developments on the
domestic front, the dominance of external demand
coupled with a favorable external environment
should lead to robust year-on-year GDP growth of
6.1 percent in 2010. The large headline figure is
due to base effects, as the average annualized
quarter-on-quarter growth rate is expected to come
at 3.8 percent (Figure 4). Quarterly growth will
accelerate modestly in 2011 on a continuation of
favorable external demand dynamics and spillovers
to the domestically-linked sectors, but without base
effects the year-on-year growth rate comes down
to 3.6 percent.
Figure 3. Import demand, especially from
China, has rebounded and is expected to remain
on firm footing in the medium term, providing a
basis for continued growth in the Thai economy.
Source: CEIC and World Bank staff calculations.
Figure 4. Although GDP contracts sharply in
Q2 due to the political turmoil, the strong
performance in Q1, a modest recovery in the
second half of 2010 and the low base in 2009
lead to a 6.1 percent yearly growth rate.
Source: NESDB and World Bank staff calculations.
US
EU
Japan
China
Nominal merchandise imports (January 2007=100)
Q
Q
Q
Q
Q
Q
Q
Q
Q
Q
Q
Q
Rea
l Qu
art
erl
y G
DP
, le
vels
, seas
ona
lly a
dju
ste
d
(TH
B B
illio
n)
Actual Forecasts
2009 YoYgrowth: -2.2%
2010 YoY growth: 6.1%
2008 YoY growth: 2.5%
3 ‹‹ THAILAND ECONOMIC MONITOR JUNE 2010
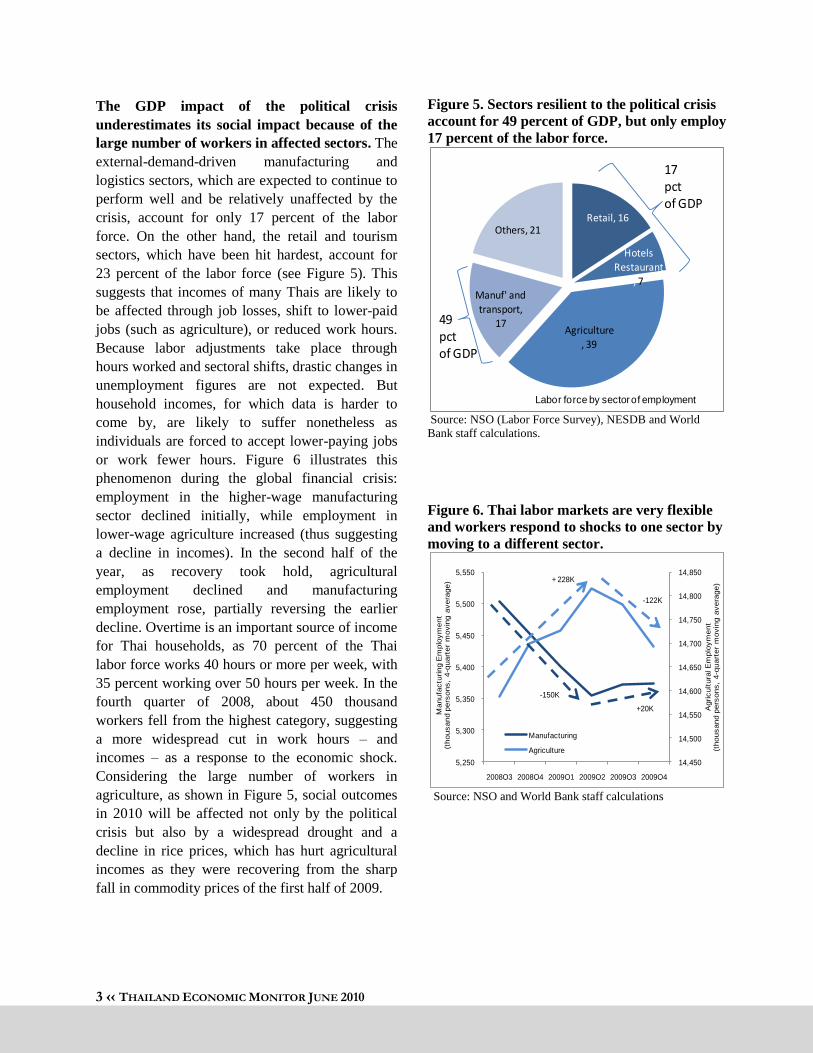
The GDP impact of the political crisis
underestimates its social impact because of the
large number of workers in affected sectors. The
external-demand-driven manufacturing and
logistics sectors, which are expected to continue to
perform well and be relatively unaffected by the
crisis, account for only 17 percent of the labor
force. On the other hand, the retail and tourism
sectors, which have been hit hardest, account for
23 percent of the labor force (see Figure 5). This
suggests that incomes of many Thais are likely to
be affected through job losses, shift to lower-paid
jobs (such as agriculture), or reduced work hours.
Because labor adjustments take place through
hours worked and sectoral shifts, drastic changes in
unemployment figures are not expected. But
household incomes, for which data is harder to
come by, are likely to suffer nonetheless as
individuals are forced to accept lower-paying jobs
or work fewer hours. Figure 6 illustrates this
phenomenon during the global financial crisis:
employment in the higher-wage manufacturing
sector declined initially, while employment in
lower-wage agriculture increased (thus suggesting
a decline in incomes). In the second half of the
year, as recovery took hold, agricultural
employment declined and manufacturing
employment rose, partially reversing the earlier
decline. Overtime is an important source of income
for Thai households, as 70 percent of the Thai
labor force works 40 hours or more per week, with
35 percent working over 50 hours per week. In the
fourth quarter of 2008, about 450 thousand
workers fell from the highest category, suggesting
a more widespread cut in work hours – and
incomes – as a response to the economic shock.
Considering the large number of workers in
agriculture, as shown in Figure 5, social outcomes
in 2010 will be affected not only by the political
crisis but also by a widespread drought and a
decline in rice prices, which has hurt agricultural
incomes as they were recovering from the sharp
fall in commodity prices of the first half of 2009.
Figure 5. Sectors resilient to the political crisis
account for 49 percent of GDP, but only employ
17 percent of the labor force.
Source: NSO (Labor Force Survey), NESDB and World
Bank staff calculations.
Figure 6. Thai labor markets are very flexible
and workers respond to shocks to one sector by
moving to a different sector.
Source: NSO and World Bank staff calculations
Retail, 16
Hotels Restaurant
, 7
Agriculture
, 39
Manuf' and
transport, 17
Others, 21
49pctof GDP
17pctof GDP
Labor force by sector of employment
14,450
14,500
14,550
14,600
14,650
14,700
14,750
14,800
14,850
5,250
5,300
5,350
5,400
5,450
5,500
5,550
2008Q3 2008Q4 2009Q1 2009Q2 2009Q3 2009Q4
Ag
ric
ultu
ral E
mp
loy
me
nt
(th
ou
sa
nd
pe
rso
ns
, 4-q
ua
rte
r m
ov
ing
av
era
ge
)
Ma
nu
factu
ring
Em
plo
ym
ent
(th
ou
sa
nd
pers
ons,
4-q
ua
rte
r m
ovin
g a
ve
rage
)
Manufacturing
Agriculture
+ 228K
-150K
+20K
-122K
4 ‹‹ THAILAND ECONOMIC MONITOR JUNE 2010
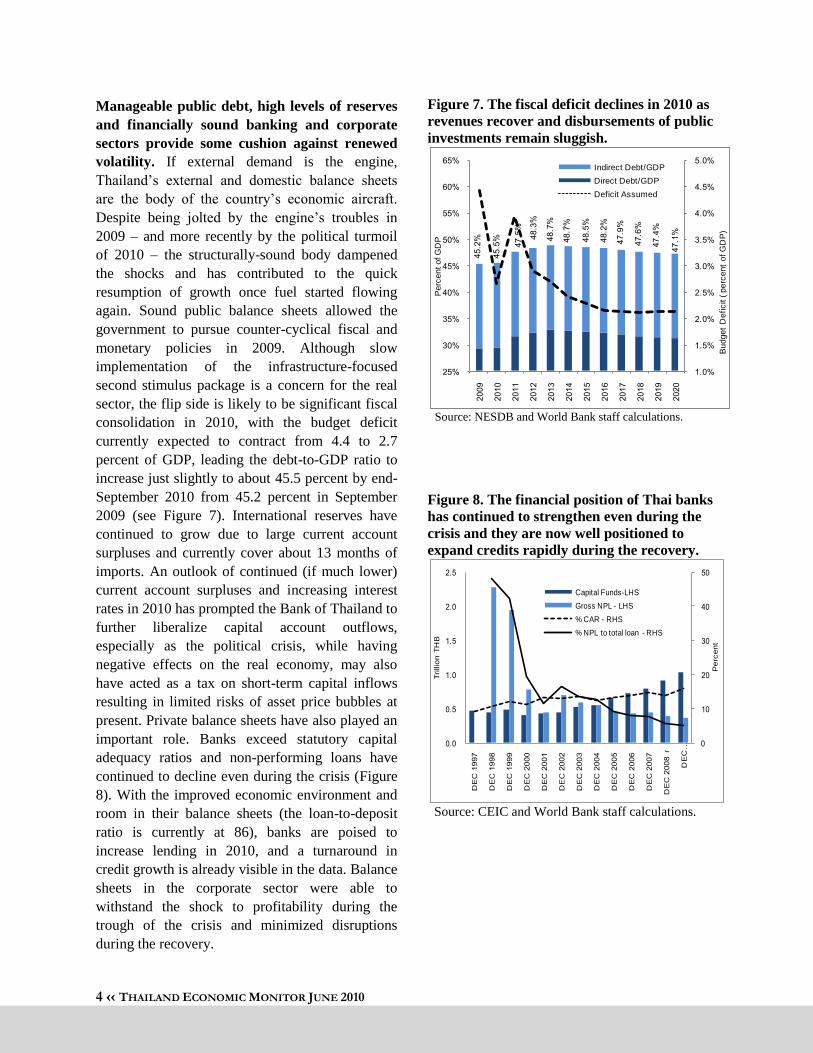
Manageable public debt, high levels of reserves
and financially sound banking and corporate
sectors provide some cushion against renewed
volatility. If external demand is the engine,
Thailand‘s external and domestic balance sheets
are the body of the country‘s economic aircraft.
Despite being jolted by the engine‘s troubles in
2009 – and more recently by the political turmoil
of 2010 – the structurally-sound body dampened
the shocks and has contributed to the quick
resumption of growth once fuel started flowing
again. Sound public balance sheets allowed the
government to pursue counter-cyclical fiscal and
monetary policies in 2009. Although slow
implementation of the infrastructure-focused
second stimulus package is a concern for the real
sector, the flip side is likely to be significant fiscal
consolidation in 2010, with the budget deficit
currently expected to contract from 4.4 to 2.7
percent of GDP, leading the debt-to-GDP ratio to
increase just slightly to about 45.5 percent by end-
September 2010 from 45.2 percent in September
2009 (see Figure 7). International reserves have
continued to grow due to large current account
surpluses and currently cover about 13 months of
imports. An outlook of continued (if much lower)
current account surpluses and increasing interest
rates in 2010 has prompted the Bank of Thailand to
further liberalize capital account outflows,
especially as the political crisis, while having
negative effects on the real economy, may also
have acted as a tax on short-term capital inflows
resulting in limited risks of asset price bubbles at
present. Private balance sheets have also played an
important role. Banks exceed statutory capital
adequacy ratios and non-performing loans have
continued to decline even during the crisis (Figure
8). With the improved economic environment and
room in their balance sheets (the loan-to-deposit
ratio is currently at 86), banks are poised to
increase lending in 2010, and a turnaround in
credit growth is already visible in the data. Balance
sheets in the corporate sector were able to
withstand the shock to profitability during the
trough of the crisis and minimized disruptions
during the recovery.
Figure 7. The fiscal deficit declines in 2010 as
revenues recover and disbursements of public
investments remain sluggish.
Source: NESDB and World Bank staff calculations.
Figure 8. The financial position of Thai banks
has continued to strengthen even during the
crisis and they are now well positioned to
expand credits rapidly during the recovery.
Source: CEIC and World Bank staff calculations.
Budget
Deficit ( p
erc
ent
of G
DP
)
Perc
ent of G
DP
Indirect Debt/GDP
Direct Debt/GDP
Deficit Assumed
DE
C
DE
C
DE
C
DE
C
DE
C
DE
C
DE
C
DE
C
DE
C
DE
C
DE
C
DE
C r
DE
C …
Pe
rce
nt
Trillio
n T
HB
Capital Funds-LHS
Gross NPL - LHS
% CAR - RHS
% NPL to total loan - RHS

5 ‹‹ THAILAND ECONOMIC MONITOR JUNE 2010
SECTION 2
MACROECONOMIC
DEVELOPMENTS AND OUTLOOK
Thanks to its manufacturing-for-exports sector, the Thai economy has recovered from the global
economic and financial crisis and will post solid growth in 2010 despite the recent political turmoil
(Table 1 and Figure 9). The global economic crisis affected the Thai economy through two main
channels: (1) reduced demand for the output of firms within global supply chains, especially in
electronics; and (2) lower commodity prices. The first channel was by far the most determinant to the
performance of overall GDP, and the pattern of contraction and recovery can be largely explained by
firms within global supply chains shutting down and later reactivating production. As global demand
conditions remain supportive in 2010, the manufacturing-for-exports sector will lead the economy into
modest quarterly growth, notwithstanding the recent escalation of the political crisis (see Box 1 below).
Table 1. Real GDP Growth, 2009-2011
(Percent, year-on-year)
Share in 2009 2010 2010 2011
2009 GDP Year Q1 Q2p Q3p Q4p Year(p) Year(p)
Consumption 63.1 -0.1 4.5 0.4 0.9 2.7 2.1 3.7
Private 53.0 -1.1 4.0 1.4 2.0 2.0 2.3 3.5
Public 10.1 5.8 6.9 -5.0 -4.0 6.5 0.8 5.0
Gross Fixed Capital
Formation 20.7 -9.0 12.6 6.1 6.0 7.6 8.0 5.4
Public 5.7 2.7 2.7 4.0 5.0 6.5 4.6 5.0
Private 15.0 -12.8 15.8 7.0 6.5 7.9 9.3 5.5
Total Domestic Demand 81.5 -6.7 18.6 6.2 5.8 2.0 7.8 3.6
Exports 65.1 -12.7 16.2 17.7 11.5 7.0 12.8 7.0
Goods 52.4 -14.0 16.5 20.6 13.2 8.0 14.3 7.7
Services 12.8 -6.9 15.0 4.0 3.5 3.0 6.6 4.0
Imports 46.6 -21.8 31.4 25.0 15.1 6.7 18.5 8.2
Goods 36.8 -23.7 43.2 31.0 17.0 6.1 22.4 9.0
Services 9.8 -13.6 -4.5 4.0 7.0 9.5 4.0 4.5
Net Foreign Demand 18.5 23.5 -10.3 -4.2 2.1 7.6 -1.7 3.5
By Sectors:
Agriculture 8.9 -0.6 0.2 0.5 1.5 1.0 0.8 2.0
Industry 44.1 -4.3 20.7 8.4 7.7 3.8 9.9 4.7
Services 47.0 -0.4 5.8 1.2 2.8 2.4 3.1 2.7
GDP 100.0 -2.3 12.0 4.6 5.1 2.9 6.1 3.6
Source: NESDB and World Bank staff projections.
Note: p = World Bank projections.

6 ‹‹ THAILAND ECONOMIC MONITOR JUNE 2010
Figure 9. The Thai economy experienced a V-shaped
contraction and recovery in 2009, driven primarily by the
manufacturing sector.
Source: NESDB and World Bank staff calculations.
Box 1. Potential Impact of the Escalation of Political Crisis on the Thai Economy
Thailand‟s political crisis escalated in April and May, with negative implications for economic
performance. The direct impact of the crisis includes losses from the closure of businesses around the
Rajprasong area, which included a number of very large shopping centers and hotels, as well as the fire
damage to several buildings. The indirect impact includes the effects on tourism, consumer and investor
confidence, and trade. Tourism plummeted as governments warned their citizens against coming to the
country, leading to a 50 percent reduction in the number of tourist arrivals in Bangkok‘s main airport.
Consumer confidence also declined, leading to lower retail sales. The impact on consumption and tourism
is likely to linger, and a decline in investor confidence could have long-term implications if risks of
operating in Thailand are reassessed upward. Because the events of April and May did not happen in
isolation, the extent of the impact of the political crisis on the economy depends crucially on the evolution
of the conflict going forward, as a scenario of full reconciliation would lead to very different economic
outcomes compared to one of escalating political violence. Because it is not possible to predict the
evolution of the political situation, in this Box we assess the short- and medium-term impact of the crisis
assuming a continuation of uncertainty on the political front, but without a significant escalation of
political violence.
Because the manufacturing-for-exports sector is the main driver of the economy in the near term,
the downside risks to growth in 2010 are limited. Limited disruptions to trade were reported
surrounding the events of April and May. Specifically, at the height of the crisis there were reports that
customs clearances were being delayed as government workers were given holidays, and during the
curfew period a number of companies were unable to run over-time. By and large, however,
manufacturing production was not severely affected by the crisis. Historical experience also suggests that
manufacturing output generally does not vary significantly around political events.
Figure 10 below compares an index of Thailand‘s manufacturing value-added (2000 average = 100) with
the average of a similar index for Malaysia, Indonesia and the Philippines. On average, Thailand‘s
manufacturing sector has consistently outperformed that of its three ASEAN neighbors since 2000 (this is
consistent with the finding that Thailand is the only ASEAN country that increased its market share of
global exports since 2000). The only exception was the fourth quarter of 2008 and first quarter of 2009.
This coincides with the airport closure, which was known to disrupt trade flows for high-value added
Q
Q
Q
Q
Q
Q
Q
Q
Re
al S
A G
DP
(T
HB
bill
ion
)
Ind
ex
of
SA
Qu
art
erl
y L
ev
els
(2
00
8 Q
1 =
10
0)
Other Sectors Manufacturing GDP (right axis)

7 ‹‹ THAILAND ECONOMIC MONITOR JUNE 2010
parts shipped via airfreight. The remainder of the data series does not show any patterns correlated to
political events: the pace of outperformance decelerates starting in early 2004 (before protests escalate
and the 2006 coup), then picks up again in 2007, continuing to accelerate during the ―yellow shirt‖
protests in mid-2008.
Figure 10. Manufacturing value-added has grown faster in
Thailand compared to Malaysia, Indonesia and the Philippines,
despite a number of political events in the period.
1/ Index: Real Manufacturing Value Added in 2000 = 100.
Lines show difference in 4-quarter moving average of index for countries indicated.
Source: CEIC and World Bank staff calculations.
The impact on domestic demand will likely be significant as the increased uncertainty leads to
precautionary behavior on the part of both consumers and investors. Figure 11 shows that Thailand‘s
private consumption has declined substantially relative to Malaysia and the Philippines since the 2006
coup, which marked the beginning of a period of heightened political uncertainty. The recent events could
accelerate this trend, at least in the near-term. On the other hand, lower consumption in an environment of
rising incomes has led to an increase in household savings, which may have created pent-up demand. This
suggests that improvements to the political outlook could lead to a strong recovery of consumption.
Private investment shows a similar pattern as consumption, decreasing markedly relative to Thailand‘s
peers since 2006 (see Figure 12). Investment in the first quarter of 2010 was strong as firms imported
machines to expand production. Beyond the first quarter, momentum from the execution of planned
investments, continued pressures for foreign companies to move production overseas, the low base, and
the postponement of rate hikes by the Bank of Thailand could continue to support investment in 2010.
However, a possible upward reassessment of business risks in Thailand may lead to a lower potential
growth rate of investment going forward. As with consumption, such an increase in risk perception could
well be reversed depending on the evolution of the political situation in the coming months.
Mar-
Se
p-
Mar-
Se
p-
Mar-
Se
p-
Mar-
Se
p-
Mar-
Se
p-
Ma
r-
Se
p-
Mar-
Se
p-
Ma
r-
Diffe
ren
ce
in In
de
x 1
/
Pol Event
THA-MYS
THA-IDN
THA-PHL
Coup
PA
Dpro
tests
PA
Dpro
tests
Songra
nriots
Airport
clo
sure

8 ‹‹ THAILAND ECONOMIC MONITOR JUNE 2010
Figure 11. Household consumption has declined relative to Malaysia and the Philippines,
suggesting Thai households may be saving more in response to heightened political uncertainty.
Source: CEIC and World Bank Calculations.
Figure 12. Gross capital formation has also lagged, and especially compared to Malaysia appears
sensitive to political events.
Source: CEIC and World Bank Calculations.
Tourism is likely to take a large hit both in the short and medium-term. The headlines generated by
the crisis were seen all over the world and several governments issued travel warnings and a number of
tours have been cancelled. The number of tourists arriving in Bangkok‘s Suvarnabhumi airport dropped
by half at the height of the crisis. The underperformance of Thailand‘s tourism sector in 2009 relative to
Indonesia, for which 2009 data was available, Figure 13) suggests that the impact of the airport closure
lasted for about two quarters beyond the resolution of the immediate crisis. That experience suggests
tourist arrivals in 2010 are likely to remain depressed (relative to potential). On the other hand, the
tourism market worldwide (and especially in Asia) is poised for healthy growth in 2010, and
underperformance relative to fast-growing peers is still likely to translate into positive growth. Moreover,
since tourism accounts for about seven percent of nominal GDP, reducing the growth rate from the
projected nominal growth of 10.7 percent by half would only reduce nominal GDP growth by 0.4
percentage points. Nevertheless, tourism employs proportionally more people and the multiplier effect of
a shock to tourism could be significant.
-
-
-
-
Ma
r-
Au
g-
Jan
-
Jun
-
Nov-
Apr-
Se
p-
Feb-
Jul-
Dec-
May-
Oct-
Ma
r-
Au
g-
Jan
-
Jun
-
Nov-
Diffe
rence (in
dex u
nits)
Index (
2000
=100
), 4
-quart
er
MA
Thailand
Philippines
Thailand - Philippines
PAD Protests
Coup
PADProtests
AirportClosure
SongkranRiots
-
-
-
-
-
-
-
-
-
Mar-
Se
p-
Mar-
Se
p-
Mar-
Se
p-
Mar-
Se
p-
Mar-
Se
p-
Mar-
Se
p-
Ma
r-
Se
p-
Diffe
renc
e (in
dex
unit
s)
Inde
x (2
00
0=1
00),
4-q
ua
rter
MA
Thailand
Malaysia
Thailand - Malaysia
PAD Protests
Coup
PADProtests
AirportClosure
SongkranRiots
Ma
r-
Se
p-
Ma
r-
Se
p-
Ma
r-
Se
p-
Ma
r-
Se
p-
Ma
r-
Se
p-
Ma
r-
Se
p-
Ma
r-
Se
p-
Dif
fere
nc
e (
ind
ex
un
its
)
Ind
ex
(2
00
0=1
00),
4-q
ua
rte
r M
A
Thailand
Philippines
Thailand - Philippines
PAD Protests
Coup
PADProtests
AirportClosure
SongkranRiots
M
ar-
Se
p-
Mar-
Se
p-
Mar-
Se
p-
Ma
r-
Se
p-
Mar-
Se
p-
Ma
r-
Se
p-
Mar-
Se
p-
Diffe
ren
ce
(in
de
x u
nits)
Ind
ex (2
00
0=1
00),
4-q
ua
rte
r M
A
Thailand
Malaysia
Thailand - Malaysia
PAD Protests
Coup
PADProtests
AirportClosure
SongkranRiots

9 ‹‹ THAILAND ECONOMIC MONITOR JUNE 2010
Figure 13. Tourist receipts in both Indonesia and
Thailand fell in late 2008 because of the global financial
crisis, but the decline in Thailand was larger.
Index based on travel receipts obtained from the Balance of Payments.
Source: CEIC and World Bank staff calculations.
Financial markets have had a subdued reaction to the events to date, underlying the view that the
fundamentals of the economy are strong. The SET stock index fell since the violence of April 10th and
sold-off sharply on May 19th, but the general direction of Thai stocks compared to its peers seems to
remain on an upward trend (Figure 14). Moreover, the stock sell-off reflected primarily a flight-to-quality
from domestic investors rather than capital outflows, as evidenced by the persistent low yields on
government securities (Figure 15) and the strong baht, which had weakened only 0.5 percent against the
US dollar between end-March and end-May. Thailand‘s credit default swaps rose, but not substantially
more than its peers. As of end-June they were at 134 basis points (―bps‖), similar to the levels in Korea
(131 bps), lower than the Philippines and Indonesia (174 and 186 bps, respectively) and about 30 bps
higher than in Malaysia, representing a 20 bps increase compared to earlier in 2010.
Figure 14. The sell-off of Thai stocks observed
on May 19 likely represented flight-to-quality
of domestic investors…
Figure 15. …that bid up „safe‟ government
bond prices, keeping yields low.
Source: World Bank Prospects Group and staff calculations. Source: Thai Bond Market Association.
-
De
c-
Ma
r-
Ju
n-
Se
p-
De
c-
Ma
r-
Jun
-
Se
p-
De
c-
Ma
r-
Jun
-
Se
p-
De
c-
Ma
r-
Jun
-
Se
p-
De
c-
Mar-
Ju
n-
Se
p-
Dif
fere
nc
e in
In
de
x
Ind
ex
(2
00
4 a
ve
rag
e =
10
0)
Indonesia
Thailand
Thailand - Indonesia (right axis)
-70
-60
-50
-40
-30
-20
-10
0
1/1
/20
08
3/1
/20
08
5/1
/20
08
7/1
/20
08
9/1
/20
08
11/1
/20
08
1/1
/20
09
3/1
/20
09
5/1
/20
09
7/1
/20
09
9/1
/20
09
11/1
/20
09
1/1
/20
10
3/1
/20
10
5/1
/20
10
Improvement
May 19
Deterioration
Thailand stock market index compared to a basket of regional peers
1.0
1.5
2.0
2.5
3.0
3.5
4.0
4.5
5.0
0 1 2 3 4 5 6 7 8 9 10 11 12 13 14 15 16 17 18 19 20
Yie
ld (perc
ent)
Time to maturity (years)

10 ‹‹ THAILAND ECONOMIC MONITOR JUNE 2010
The resilience of the overall GDP to the political turmoil does not translate into limited social
impact given the large number of workers in affected sectors. The external-demand-driven
manufacturing and logistics sectors, which are expected to continue to perform well and be relatively
unaffected by the crisis, account for only 17 percent of the labor force. On the other hand, the retail and
tourism sectors, which have been hit hardest, account for 23 percent of the labor force (see Figure 5). This
suggests that incomes of many Thais are likely to be affected through job losses in tourism and formal
retail sectors, a shift to lower-paid jobs (such as agriculture and informal retail), or reduced work hours.
Because labor adjustments take place through hours worked and sectoral shifts, drastic changes in
unemployment figures are not expected, but household incomes may decline.
The overall long-term impact of the political crisis is highly uncertain and will depend on political
developments in the coming months. Three scenarios can be envisaged. First, if politically-motivated
violence resumes and persists over a period of months, the long-term negative impact would be
substantial. Investments in manufacturing production facilities would decline, constraining long-term
growth in the sector. Without its engine of growth, depressed domestic demand, and government focused
on security, economic stagnation is likely. On the other hand, a successful reconciliation process that puts
Thailand on a path towards greater political stability would have the opposite effect. The intermediate
scenario used as our baseline includes an ongoing threat of political violence, while actual violent acts
remain limited in number and scope. Under this scenario, medium-term growth would remain positive,
supported by modest growth in investments and consumption, but an acceleration of growth would be
unlikely and a return to potential growth of about five percent per year would be protracted. In the long-
term, resolving the political crisis is a necessary, even if not sufficient, condition for Thailand to achieve
high and sustainable rates of growth.
2.1 Production The export-oriented manufacturing sector will continue to grow in 2010, but at a slower pace than
observed during the rebound. The electrical and electronics (E&E) sector has been a key contributor to
the GDP contraction and recovery, as supply chains were switched back on (see Box 2 below). E&E
exports tracked overall exports quite closely (Figure 16), and capacity utilization and manufacturing
production in the E&E industry have tracked not only each other (Figure 17) but also GDP and
manufacturing value-added overall (Figure 18). This suggests two implications for growth in 2010. First,
capacity utilization is nearly at pre-crisis levels, suggesting that the ‗rebound‘ phase (where fast growth
comes primarily from the reactivation of existing capacity) is mostly complete. Nevertheless, industrial
capacity utilization overall is yet to return to pre-crisis levels (Figure 19), suggesting that some industries
can still rely on reactivating existing capacity for growth. Second, the swift pace of the reactivation of idle
production capacity in an environment of temporary labor shortages suggests potential for continued
growth, which will require expanding existing capacity. Attractive labor costs combined with good
infrastructure and large logistical clusters in the automotive and electronics industries will continue to
make Thailand a relatively attractive destination for FDI in the manufacturing sector, although longer
term prospects are more uncertain (see Section 2.3.2 below on the investment outlook).

11 ‹‹ THAILAND ECONOMIC MONITOR JUNE 2010
Figure 16. E&E exports tracked overall exports
quite closely.
Source: BoT and World Bank staff calculations.
Figure 17. Capacity utilization and production
in the E&E industry have tracked each other…
Source: BoT and World Bank staff calculations.
Figure 18. …as well as broader economic
indicators.
Source: NESDB, BoT and World Bank staff calculations.
Figure 19. Capacity utilization overall is yet to
return to pre-crisis levels.
Source: BoT and World Bank staff calculations.
The outlook for the services sectors linked to external demand is more mixed. The logistics sectors
(transport and storage) related to global trade will likely grow at the same pace as overall exports and
continue to recover into 2010. However, the outlook for tourism (discussed in detail in Section 2.2.3
below) is less certain given the recent escalation of political violence in Thailand (see Box 1).
Among the sectors linked to domestic demand, construction has the greatest potential to provide a
boost to growth. As the Bank of Thailand is widely expected to increase interest rates towards more
normal levels in 2010, developers and builders have taken advantage of the currently low interest rates to
secure financing for new projects. Moreover, real estate tax exemptions implemented as part of the
government‘s fiscal stimulus package are set to expire in the fourth quarter of this year. Given these
incentives, as well as an expected eventual pick-up in demand, construction activity has picked up since
the fourth quarter, when the number of areas receiving construction permits jumped from the previous
year.
The agricultural sector faces several challenges in 2010, most recently from a severe drought.
Although agriculture contributes only ten percent of GDP, it employs nearly 40 percent of the labor force
60
70
80
90
100
110
120JA
N 2
008
AP
R 2
00
8
JUL
2008
OC
T 2008
JAN
2009
AP
R 2
00
9
JUL
2009
OC
T 2009
JAN
2010
AP
R 2
01
0
Inde
x (2
00
8 =
10
0)
E&E Export Index
Overall Exports (excl. gold), Index
40
45
50
55
60
65
70
75
80
60
70
80
90
100
110
120
130
140
JA
N 2
00
8
AP
R 2
008
JU
L 2
008
OC
T 2
00
8
JA
N 2
00
9
AP
R 2
009
JU
L 2
009
OC
T 2
00
9
JA
N 2
01
0
AP
R 2
010
Perc
ent
Index (
20
08
= 1
00)
Production Index (left axis)
Capacity Utilization (right axis)
Q Q Q Q Q Q Q
Index (Q
3 2
008 =
100
), G
DP
Index (Q
3 2
008 =
100
)
Capacity Utilization (Electronics)Production (Electronics)Manufacturing Value AddedGDP (right axis)
Correlations
Pre-crisis Since crisis
CU (elec), GDP 16% 95%
MPI (elec), MVA 97% 96%
Capacity
Util
izatio
n, S
easonally
-Adju
ste
d
(perc
ent)

12 ‹‹ THAILAND ECONOMIC MONITOR JUNE 2010
and therefore the outlook of this sector is highly correlated with the outlook for vulnerable households.
On the one hand, agricultural prices have recovered from their lows at the trough of the global financial
crisis. Moreover, a grasshopper infestation was effectively dealt with by the government and is expected
to have almost no impact on production. A drought, which has affected 53 provinces, is a more serious
challenge. However, there are reports that planted areas for the second crop of rice have actually grown
from the previous year, relying primarily on irrigation. On balance, the agricultural sector is likely to
grow modestly in 2010.
Box 2. Supply Chains in the Electrical and Electronics (E&E) Sectors1
Thailand and Malaysia have been highly successful in inserting themselves into the regional and
global supply chains of large multinational companies (MNCs) in the E&E sector, resulting in
massive inflows of FDI, rising production, employment, and trade. Today, E&E products represent the
top manufactured exports (by value) in both countries. As technology leaders in the E&E industry and
one of the largest sources of foreign investment in Southeast Asia, Japanese companies have played an
important role in this process and remain key players in the industry. The paper presents two main
arguments: (1) A disproportionate share of the variation in economic activity in both Thailand and
Malaysia seen during the global financial crisis and recent recovery can be traced back to supply chains of
E&E products due to improvements in information technology and inventory management that allowed
firms to adjust production (and to some extent investment) rapidly and dramatically in the face of changes
in (primarily external) demand; and (2) Although Japanese E&E firms are likely to maintain a long-term
presence in both countries for risk management and competition reasons, in the absence of significant
policy changes the movement towards locating higher value-added processes in Thailand and Malaysia is
likely to be slow, as the comparative advantage for performing higher value-added tasks (skills,
integration of university, government and industry research, and technological clusters) remains in
advanced economies.
Thailand and Malaysia serve primarily as manufacturing hubs of medium to high-technology
products, but tasks performed in both countries are on average of low complexity, often involving
only the assembly of final products. Import content is high, and in the case of Malaysia a substantial
fraction of the labor in the industry is also imported. On the other hand, production takes place within
globally competitive firms at the cutting edge of both product and process technology, and these firms
have implemented management techniques to improve the efficiency and flexibility of their supply
chains. One way in which supply chains have become more efficient has been through the emergence of
clusters of supporting industries, driven by a secular trend to move larger parts of the supply chain away
from high-cost advanced economies. However, the clusters that emerged in Thailand and Malaysia are
primarily logistical (i.e., they reduce transactions costs in production) rather than technological (which
capitalize on spillovers of research and development between different players in the supply chain), and
often companies within the supply chain of Japanese MNCs are also Japanese. Improved inventory
management through the use of information technology has also allowed firms to adjust more quickly to
variations in demand.
As a consequence, supply chains represented the main mechanism through which the global
financial crisis was transmitted to Thailand and Malaysia, with changes in global demand quickly
reflected in large variations in production in those industries and accounting for a large share of GDP
changes. However, a limited footprint meant that the impact on households, while significant, was small
relative to the headline (GDP and exports) effects. The speed of adjustment to the drop in final demand
was unprecedented in part due to structural changes in the supply chain efficiency. Although the recovery
1 Based on a study by Ratchada Anantavrasilpa, Frederico Gil Sander, Rie Hijiki, and Philip Schellekens.

13 ‹‹ THAILAND ECONOMIC MONITOR JUNE 2010
was also rapid, there was greater friction in restarting the supply chain compared to shutting it down
because of the fragmentation of production processes, the emergence of labor bottlenecks, and the
divergence in beliefs about the strength of the recovery.
The secular movement of parts of the supply chain away from advanced economies is likely to
continue despite the excess capacity expected in the immediate post-crisis years, but the speed at
which high-value added processes move to Thailand and Malaysia is likely to be slow without
significant policy interventions. Although the growth of new investments going forward is likely to be
greater in China compared to Thailand or Malaysia, Japanese E&E firms are likely to maintain a long-
term presence in both countries for risk management and competition reasons. Enhancing the economic
footprint and maximizing the value-added of the supply chain will however require measures to increase
the productivity of existing processes, upgrade processes along the value chain, and improve backward
and forward industry linkages. Accelerating this process and the resulting movement of more complex
tasks to Thailand and Malaysia will require improving the supply of skills, better coordination of research
and development between universities, industry and government research institutes, and the formation of
technological rather than purely logistical clusters.
2.2 External Demand The link between the manufacturing and logistics sectors and external demand can be confirmed in
the expenditure side, but focusing only on gross or net exports is misleading. Because exports are
reported on a ‗gross‘ basis, overall export figures overstate exports‘ domestic value-added (and therefore
their contribution to GDP). Most manufacturing exports include large shares of imported components,
and studies have concluded that the domestic value-added may be as low at five percent for some export
products. However, because imports are also used for consumption and investment, subtracting the value
of all imports from exports (what is sometimes called ―net foreign demand‖) is also not an informative
measure of how much Thai value added is being purchased by foreigners. For example, Figure 20 shows
that negative contributions of net foreign demand to growth in 2005 coincided with a pickup in
investment: it was not the case that export growth or external demand were lagging, but rather that
investment was picking up with associated increases imports of capital goods. In addition, inventory
investments are largely associated with manufacturing (and to a large extent are comprised of imported
inputs) and are better thought of as part of external demand. Finally, services payments relate to the
consumption of Thai consumers and firms (tourism, professional services), and for the most part do not
subtract from the domestic value added of Thai exports. Therefore, ‗net exports‘ in the national accounts
greatly understates the importance of external demand as a driver of growth. Figure 21 attempts to
identify the role of external demand on expenditure components by adding inventories and removing
services payments and imports used in consumption and investment. The result confirms the view from
the production side, namely that external demand remains the main driver of the Thai economy.

14 ‹‹ THAILAND ECONOMIC MONITOR JUNE 2010
Figure 20. Net foreign demand is negative when
investment picks up, reflecting the large import
component of machinery investments.
Source: NESDB and World Bank staff calculations.
Figure 21. An adjusted measure of external
demand confirms that GDP dynamics are driven
by the external outlook.
Source: NESDB, BoT, and World Bank staff calculations.
Note: 1/Adjusted domestic demand excludes imports of
consumer and capital goods, services payments and changes in
inventories. Adjusted external demand includes exports of
goods and services and changes in inventories, net of goods
imports except consumer and capital goods.
Because external demand will remain the main driver of growth in the near term, the external
environment and the outlook for export performance will remain the critical variable to Thailand‟s
near-term GDP outlook. The external environment is expected to be supportive, though risks are more
substantial than the historical experience. Export performance in the first five months of 2010 has been
strong and is likely to remain firm throughout the year.
2.2.1 External Environment The US and Japanese economies recovered favorably in early 2010, but Europe has lagged the
recovery. Most industrial economies are back in positive quarterly growth territory since the second half
of 2009. Extraordinary stimulus measures worldwide, inventory restocking, and resilience in large
emerging economies are key contributing factors. The US economy grew 2.7 percent on annualized,
quarterly and seasonally-adjusted basis (QoQ, saar) in the first quarter of 2010 after expanding 5.6
percent in the preceding quarter (Figure 22). Private consumption and inventory investment each
accounted for around two percent, while government spending and residential fixed investment
contributed negatively. In Japan, output growth accelerated to five percent in the first quarter of this year
(QoQ, saar). A fifteen-month export slump ended in December 2009 on robust orders from emerging East
Asia and later the US. The EU is a growth laggard, growing only one percent in the final quarter (QoQ,
saar). Household consumption and private investment shrank, so growth was fuelled mainly by export
orders and inventory buildup. Larger member economies such as Germany, France, and the UK all
experienced only marginal growth.
-70
-50
-30
-10
10
30
50
70
2000
Q1
2000
Q3
2001
Q1
2001
Q3
2002
Q1
2002
Q3
2003
Q1
2003
Q3
2004
Q1
2004
Q3
2005
Q1
2005
Q3
2006
Q1
2006
Q3
2007
Q1
2007
Q3
2008
Q1
2008
Q3
2009
Q1
2009
Q3
Perc
ent
Contribution of 'net exports' to Change in GDP
Contribution of Gross Capital Formation to change in GDP700
750
800
850
900
950
1,000
1,050
1,100
1,150
1,200
250
300
350
400
450
500
550
600
650
20
00Q
1
20
00Q
3
20
01Q
1
20
01Q
3
20
02Q
1
20
02Q
3
20
03Q
1
20
03Q
3
20
04Q
1
20
04Q
3
20
05Q
1
20
05Q
3
20
06Q
1
20
06Q
3
20
07Q
1
20
07Q
3
20
08Q
1
20
08Q
3
20
09Q
1
20
09Q
3
20
10Q
1
Bill
ion
s o
f R
ea
l TH
B,
SA
(G
DP
)
Bill
ions
of
Re
al T
HB
, S
A (
co
mp
on
ents
)
Adjusted Domestic Demand 1/
Adjusted External Demand 1/
GDP (right axis)

15 ‹‹ THAILAND ECONOMIC MONITOR JUNE 2010
Figure 22. The US and Japan recovered faster
than the EU in early 2010.
Source: CEIC and World Bank staff calculations.
Figure 23. Industrial production picked up
steadily in the US and the EU.
Source: CEIC and World Bank staff calculations.
Figure 24. Consumer spending remains far
below pre-crisis peaks in G3 economies.
Source: CEIC and World Bank staff calculations.
Figure 25. Joblessness is still very high in the US
and the EU.
Source: CEIC and World Bank staff calculations.
Monthly indicators point to continued recovery in advanced economies but the second half of this
year may see slower growth. The US manufacturing sector grew for an eleventh consecutive month in
June 2010 but at the slower speed in the latest two months (Figure 23). The speed of expansion in non-
manufacturing activities also dropped to a four-month low. A pickup in economic activities and
improvement in the labor market has led to positive consumer spending growth since late 2009 (Figure
24), although total outstanding credit to US consumers did fall in April and May. The unemployment rate
moderated to 9.7 percent in May from the peak of 10.1 percent in January (Figure 25), while new claims
for unemployment insurance benefits also continued to fall. In Europe, the results are rather mixed.
Manufacturing industries rebounded since the second half of 2009 on rising export orders from emerging
economies and a weaker Euro. Germany‘s industrial production growth in May accelerated to 3.4 percent
on a month-on-month, seasonally adjusted basis, but factory orders dropped for the first time in five
months. Production in the third quarter could decelerate as (i) region‘s public debt crisis, (ii) high
unemployment that reached an 11-year high of 9.7 percent in April, (iii) uncertainty over banks‘ capital
adequacy, and (iv) fading of stimulus packages likely hold back domestic demand. In July, Moody's
downgraded Portugal's sovereign debt rating, while German investor confidence fell for a third
consecutive month. In Japan, a recovery in industrial production has been speedy after a much deeper
-20
-15
-10
-5
0
5
10
2008 Q1
Q2 Q3 Q4 2009 Q1
Q2 Q3 Q4 2010 Q1
US
EU
Japan
Real GDP growth (percent, saar)
60
70
80
90
100
110
US
EU
Japan
Industrial production index (sa, January 2007=100)
US
EU
Japan
Wholesale and retail sales (sa, January 2007=100)
US
EU
Japan
Unemployment rate (%)

16 ‹‹ THAILAND ECONOMIC MONITOR JUNE 2010
plunge relative to the US and the EU during the crisis (Figure 23). Retail sales in January 2010 grew for
the first time in 17 months but this has been rather volatile as joblessness seems to rise in recent months.
Japanese machinery orders shrank in May, in line with that in the EU. But business sentiment has
improved to the most favorable level in two years.
Global financial flows have resumed as trade, investment and financing flows recovered throughout
2009 and so far in 2010. Global trade value contracted around 12 percent in 2009, the largest such
contraction in the post-war period, due to subdued global demand, a crunch in trade finance, and lower
commodity prices. World trade bounced back after hitting the bottom in mid-2009. Import volume by
developing countries in late 2009 already surpassed the pre-crisis peak, partly underpinned by Chinese
commodity stockpiling. Import values by industrial economies remain below their pre-crisis peaks. Risk
premiums in financial markets subsided noticeably, while equity markets strengthened and cross-border
portfolio flows resumed. The tightening of bank credit standards has moderated in the US and the EU,
although lending could remain weak due to ongoing write-downs and the need to rebuild capital. Cross-
border bond issuance has spiked worldwide to take advantage of record low interest rates. New issuance
has been dominated by government bonds issued to finance the fiscal costs of stimulus packages and
revenue shortfalls. Corporate bond issuance has also picked up especially in emerging economies.
Emerging market companies‘ international bonds issuance registered a 146-percent increase in the first
half of 2010 (year-on-year), while this fell around 30 percent in the US and the EU. Consumers and
SMEs, which have more limited access to booming bond markets, still face financial constraints. Unlike
equity and bond flows, foreign direct investment has experienced a much more rigid recovery. Global
FDI flows stabilized since mid-2009 but remained muted in several months that followed.
The global economic and trade outlook is optimistic and revised upwards in recent months. After
contracting 2.1 percent in 2009, the World Bank estimated in June 2010 that the world economy likely
grows 3.3 percent this year, up from 2.7 percent in its January estimate. Developing countries, led by East
and South Asia, are likely lead the turnaround. Europe and Japan are expected to experience a slower
rebound relative to the United States (Table 2). Although the outlook for 2011 remains favorable with
growth at the same speed as 2010, the world economy is in a transition to new medium-term equilibrium
with lower growth in industrial economies. A constrained pickup in advanced countries translates into
relatively sluggish international trade transactions, despite eased trade credits, higher commodity prices
and increased demand from emerging markets. World trade volume in 2010 would roughly regain the loss
last year, and import demand growth from emerging markets should outpace that of industrial economies
in the next few years. China‘s import demand has returned to the pre-crisis level, but is clearly more
stagnant in G3 economies (Figure 26).
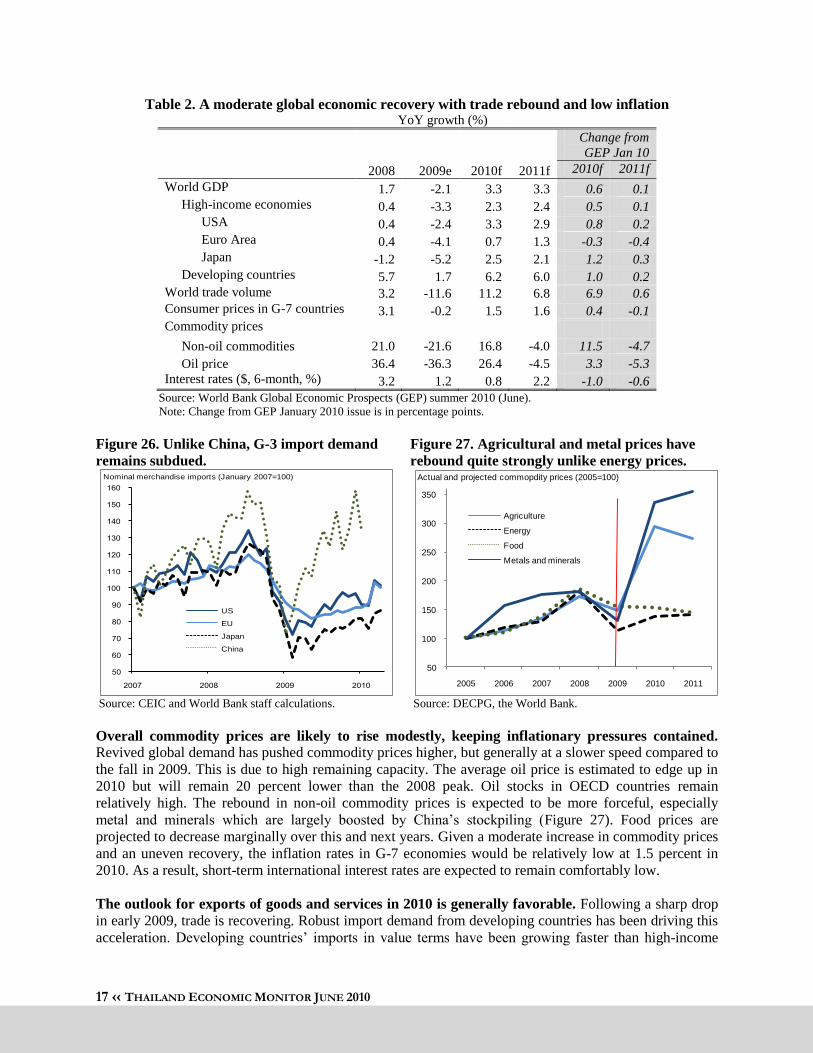
17 ‹‹ THAILAND ECONOMIC MONITOR JUNE 2010
Table 2. A moderate global economic recovery with trade rebound and low inflation YoY growth (%)
2008 2009e 2010f 2011f
Change from
GEP Jan 10
2010f 2011f
World GDP 1.7 -2.1 3.3 3.3 0.6 0.1
High-income economies 0.4 -3.3 2.3 2.4 0.5 0.1
USA 0.4 -2.4 3.3 2.9 0.8 0.2
Euro Area 0.4 -4.1 0.7 1.3 -0.3 -0.4
Japan -1.2 -5.2 2.5 2.1 1.2 0.3
Developing countries 5.7 1.7 6.2 6.0 1.0 0.2
World trade volume 3.2 -11.6 11.2 6.8 6.9 0.6
Consumer prices in G-7 countries 3.1 -0.2 1.5 1.6 0.4 -0.1
Commodity prices
Non-oil commodities 21.0 -21.6 16.8 -4.0 11.5 -4.7
Oil price 36.4 -36.3 26.4 -4.5 3.3 -5.3
Interest rates ($, 6-month, %) 3.2 1.2 0.8 2.2 -1.0 -0.6
Source: World Bank Global Economic Prospects (GEP) summer 2010 (June).
Note: Change from GEP January 2010 issue is in percentage points.
Figure 26. Unlike China, G-3 import demand
remains subdued.
Source: CEIC and World Bank staff calculations.
Figure 27. Agricultural and metal prices have
rebound quite strongly unlike energy prices.
Source: DECPG, the World Bank.
Overall commodity prices are likely to rise modestly, keeping inflationary pressures contained.
Revived global demand has pushed commodity prices higher, but generally at a slower speed compared to
the fall in 2009. This is due to high remaining capacity. The average oil price is estimated to edge up in
2010 but will remain 20 percent lower than the 2008 peak. Oil stocks in OECD countries remain
relatively high. The rebound in non-oil commodity prices is expected to be more forceful, especially
metal and minerals which are largely boosted by China‘s stockpiling (Figure 27). Food prices are
projected to decrease marginally over this and next years. Given a moderate increase in commodity prices
and an uneven recovery, the inflation rates in G-7 economies would be relatively low at 1.5 percent in
2010. As a result, short-term international interest rates are expected to remain comfortably low.
The outlook for exports of goods and services in 2010 is generally favorable. Following a sharp drop
in early 2009, trade is recovering. Robust import demand from developing countries has been driving this
acceleration. Developing countries‘ imports in value terms have been growing faster than high-income
US
EU
Japan
China
Nominal merchandise imports (January 2007=100)
50
100
150
200
250
300
350
2005 2006 2007 2008 2009 2010 2011
Agriculture
Energy
Food
Metals and minerals
Actual and projected commopdity prices (2005=100)
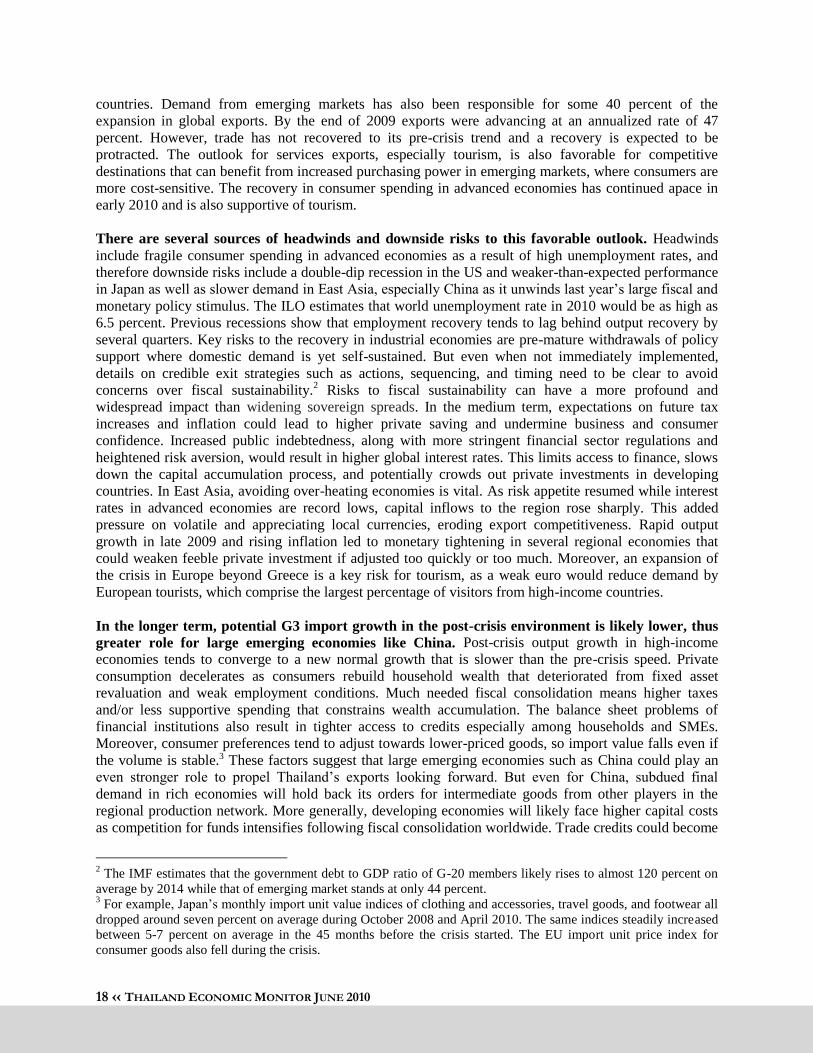
18 ‹‹ THAILAND ECONOMIC MONITOR JUNE 2010
countries. Demand from emerging markets has also been responsible for some 40 percent of the
expansion in global exports. By the end of 2009 exports were advancing at an annualized rate of 47
percent. However, trade has not recovered to its pre-crisis trend and a recovery is expected to be
protracted. The outlook for services exports, especially tourism, is also favorable for competitive
destinations that can benefit from increased purchasing power in emerging markets, where consumers are
more cost-sensitive. The recovery in consumer spending in advanced economies has continued apace in
early 2010 and is also supportive of tourism.
There are several sources of headwinds and downside risks to this favorable outlook. Headwinds
include fragile consumer spending in advanced economies as a result of high unemployment rates, and
therefore downside risks include a double-dip recession in the US and weaker-than-expected performance
in Japan as well as slower demand in East Asia, especially China as it unwinds last year‘s large fiscal and
monetary policy stimulus. The ILO estimates that world unemployment rate in 2010 would be as high as
6.5 percent. Previous recessions show that employment recovery tends to lag behind output recovery by
several quarters. Key risks to the recovery in industrial economies are pre-mature withdrawals of policy
support where domestic demand is yet self-sustained. But even when not immediately implemented,
details on credible exit strategies such as actions, sequencing, and timing need to be clear to avoid
concerns over fiscal sustainability.2 Risks to fiscal sustainability can have a more profound and
widespread impact than widening sovereign spreads. In the medium term, expectations on future tax
increases and inflation could lead to higher private saving and undermine business and consumer
confidence. Increased public indebtedness, along with more stringent financial sector regulations and
heightened risk aversion, would result in higher global interest rates. This limits access to finance, slows
down the capital accumulation process, and potentially crowds out private investments in developing
countries. In East Asia, avoiding over-heating economies is vital. As risk appetite resumed while interest
rates in advanced economies are record lows, capital inflows to the region rose sharply. This added
pressure on volatile and appreciating local currencies, eroding export competitiveness. Rapid output
growth in late 2009 and rising inflation led to monetary tightening in several regional economies that
could weaken feeble private investment if adjusted too quickly or too much. Moreover, an expansion of
the crisis in Europe beyond Greece is a key risk for tourism, as a weak euro would reduce demand by
European tourists, which comprise the largest percentage of visitors from high-income countries.
In the longer term, potential G3 import growth in the post-crisis environment is likely lower, thus
greater role for large emerging economies like China. Post-crisis output growth in high-income
economies tends to converge to a new normal growth that is slower than the pre-crisis speed. Private
consumption decelerates as consumers rebuild household wealth that deteriorated from fixed asset
revaluation and weak employment conditions. Much needed fiscal consolidation means higher taxes
and/or less supportive spending that constrains wealth accumulation. The balance sheet problems of
financial institutions also result in tighter access to credits especially among households and SMEs.
Moreover, consumer preferences tend to adjust towards lower-priced goods, so import value falls even if
the volume is stable.3 These factors suggest that large emerging economies such as China could play an
even stronger role to propel Thailand‘s exports looking forward. But even for China, subdued final
demand in rich economies will hold back its orders for intermediate goods from other players in the
regional production network. More generally, developing economies will likely face higher capital costs
as competition for funds intensifies following fiscal consolidation worldwide. Trade credits could become
2 The IMF estimates that the government debt to GDP ratio of G-20 members likely rises to almost 120 percent on
average by 2014 while that of emerging market stands at only 44 percent. 3 For example, Japan‘s monthly import unit value indices of clothing and accessories, travel goods, and footwear all
dropped around seven percent on average during October 2008 and April 2010. The same indices steadily increased
between 5-7 percent on average in the 45 months before the crisis started. The EU import unit price index for
consumer goods also fell during the crisis.

19 ‹‹ THAILAND ECONOMIC MONITOR JUNE 2010
more limited. Managing export performance in a post-crisis environment is an even more challenging
task.
2.2.2 Merchandise Exports
Thailand‟s export recession – the worst since 1960 – ended in November 2009. The growth rate of
goods exports moved into positive territory in November last year as global trade rebounded. This marked
the end of the turmoil that lasted for exactly one year with average monthly decline in shipment value of
around 20 percent, making it the most severe episode since 1960 (Figure 28). The magnitude of export
contraction far exceeded the East Asian crisis in 1997/98 and the Dot.com crisis in 2001. In the months
before year-on-year export growth turned negative, the transition to the decline was also much steeper this
time compared to the earlier experiences. But the rebound has also been much more forceful (Figure 29).
When valued in Thai baht, the mean monthly decline was 16 percent; therefore, a relatively strong baht
has helped to cushion the impact of the collapse in terms of revenues for exporting businesses.
Figure 28. The recent export slump is the most
severe since 1960.
Source: CEIC and World Bank staff calculations.
Figure 29. Compared to other export crises, the
current turmoil was characterized by a steeper
decline at the onset and a stronger rebound.
Source: Bank of Thailand and World Bank staff calculations.
Export growth has been gaining momentum in early 2010 as expectations of a global recovery have
solidified, boosting demand for capital goods and fueling the restocking cycle. Revitalized global
demand has led to rising shipment levels, which makes them very high when compared to the low values
in 2009. Year-on-year growth registered 34 percent on average in the first five months of 2010 (Figure
30). Momentum export growth (month-on-month growth of seasonally adjusted, three-month moving
average value) during this period (2.6 percent) also accelerated relative to the final quarter of 2009.
Export earnings now virtually returned to the level in booming years. The seasonally-adjusted level in
May 2010 reached 99 percent of the July 2008 peak, improving noticeably from 64 percent in the March
2009 trough. This bottom was equivalent to the export level back in October 2006.
0
2
4
6
8
10
12
14
16-25
-20
-15
-10
-5
0
Fe
b 5
8–J
an
59
Oct
67–
Ju
n 6
8
Ja
n 7
5–
Ju
n 7
5
Ju
l 82–A
ug
83
Ma
y 8
5–
No
v 8
5
Ju
n 9
6–
De
c 9
6
Ma
r 9
8-M
ar
99
Ju
n 0
1–M
ar
02
No
v 0
8–
Oc
t 0
9
Mo
nth
s
Perc
ent
Average monthly decline (year-on-year %)
Number of consecutive months with negative export growth
90
100
110
120
130
140
150t=
-6
t=-4
t=-2
t=0
t=2
t=4
t=6
t=8
t=10
t=12
t=14
t=16
t=18
t=20
t=22
Global recession (Nov 08)
East Asian crisis (Mar 98)
Dot.com crisis (Jan 01)
Movements in seasonally-adjusted, monthly export value. t=0 denotes the beginning of export turmoil episodes (in parenthesis), and are set to equal 100

20 ‹‹ THAILAND ECONOMIC MONITOR JUNE 2010
Figure 30. Momentum growth is picking up with
high year-on-year growth.
Source: Bank of Thailand and World Bank staff calculations.
Figure 31. Shipments to key East Asian
economies have surpassed the pre-crisis peaks.
Source: Bank of Thailand and World Bank staff calculations.
Shipments to East Asia have recovered more speedily than exports to advanced economies. Boosted
by resilient domestic demand from large and timely fiscal expansion, shipments to China have already
exceeded the pre-crisis level despite the very steep drop earlier (Figure 314). This is also true for industrial
East Asian economies--Hong Kong (China), South Korea, and Taiwan (China). In contrast, while orders
from G3 economies have clearly rebounded, the recovery appeared to lose stream in recent few months so
that shipments remain far below the pre-crisis levels. ASEAN markets have enjoyed continued
improvements especially among richer members that are part of the regional production networks. But the
recovery path is slower than the preceding fall, reflecting subdued final demand in advanced economies.
In the four months after Thailand‘s export turmoil ended in November 2009, the average contributions to
growth by China and ASEAN (out of 100) are 30 and 38 percent respectively. This is below 20 percent
for G3 economies. Contributions from China and ASEAN decelerated in recent months as destinations
like Australia and Switzerland emerged but G3 contributions remain subdued.
High-technology products were the most heavily affected by the economic downturn. Even before
the global recession started in late 2008, exports of agricultural products and non high-tech manufactured
items had generally outperformed high-tech goods (Figure 32), mainly underpinned by record high
commodity prices that boosted agricultural and resource-based, manufactured products (including gold).
This gap widened during the crisis because (i) demand for high-tech merchandises is relatively elastic to
household incomes, (ii) final products are disproportionally destined to high-income economies which
suffer more from the recession, and (iii) prices went down. Within the high-tech group, shipment levels of
key items such as computers and parts, electrical appliances, and integrated circuits have resumed rather
robustly (Figure 33), and less impressively for vehicles and parts despite a favorable turnaround in recent
months. Auto exports to Australia and Indonesia, the two largest markets that together account for one
quarter of total auto exports, improved in the early months of 2010.
4 This figure shows a complete transition from peaks to troughs in all key Thailand's export destinations, which took
at most 11 months. The latest data point is May 2010.
0
2
4
6
8
10
12
14
16
18
20
-30
-20
-10
0
10
20
30
40
08
Ja
n
Ma
r
Ma
y
Ju
l
Se
p
No
v
09
Ja
n
Ma
r
Ma
y
Ju
l
Sep
No
v
10
Ja
n
Ma
r
May
Bill
ion U
S$
Perc
ent
Growth (% YoY, nsa)
Growth (% MoM, sa)
Growth (% MoM, 3mma, sa)
Export value (RHS)
100
120
140
160
180
200
220
t=11
t=10
t=9
t=8
t=7
t=6
t=5
t=4
t=3
t=2
t=1
t=0
t=1
t=2
t=3
t=4
t=5
t=6
t=7
t=8
t=9
t=10
t=11
t=12
t=13
t=14
t=15
t=16
China (Jan 09)
ASEAN (Jan 09)
Emerging East Asia (Jan 09)
Japan (Feb 09)
EU (Apr 09)
US (Apr 09)
Movement in monthly exports value, t=0 denotes troughs (in parenthesis) and are set to equal 100

21 ‹‹ THAILAND ECONOMIC MONITOR JUNE 2010
Figure 32. The crisis hit high-tech shipments
harder than other product groups.
Source: BoT and World Bank staff calculations.
Figure 33. Auto exports are lagging behind other
high-tech goods on the recovery path.
Source: BoT and World Bank staff calculations.
Thailand withstood the export slump more resiliently than most other regional economies largely
due to favorable price effects. Like China, Thailand performs reasonably well relative to other East
Asian economies, both in terms of smaller magnitude of loss and faster speed of the rebound so far
(Figure 34). Only Indonesia and Taiwan (China) that now have regained higher proportions of losses than
Thailand. Countries that rely heavily on exporting electrical and electronics products to advanced
economies such as Malaysia and the Philippines experienced a more severe episode. Thailand‘s favorable
performance is not underpinned by buoyant export volume, which clearly lagged behind other economies
in the second half of 2009 (Figure 35), but because export prices have far more supportive since March
2009 (Figure 36). In particular, agricultural prices have taken off since May 2009 (Figure 37), growing on
average 5.6 percent on a month-on-month, seasonally adjusted basis so the prices in January 2010 was
nearly 60 percent higher.5 Although agricultural prices went down recently, the May 2010 level was still
comparable to the record highs during the global food price crisis in mid-2008.
Figure 34. Thailand‟s export value recovered
more favorably than most other regional
economies.
Source: CEIC and World Bank staff calculations.
Figure 35. The decline in Thailand‟s export
volume is generally deeper than others…
Source: DECPG World Bank and staff calculations.
5 For example, between March 2009 and February 2010, export value per ton of smoked Para rubber sheet (class 1)
jumped 96 percent. Prices of sugar, jasmine rice, and several seafood products also increased noticeably over 2009.
70
100
130
160
190
07
Ja
n
Ma
r
Ma
y
Ju
l
Se
p
No
v
08
Ja
n
Ma
r
Ma
y
Ju
l
Se
p
No
v
09
Ja
n
Ma
r
Ma
y
Ju
l
Se
p
No
v
10
Ja
n
Ma
r
Ma
y
Agriculture, fishery & forestry
Non high-tech manufactured goods
High-tech products
Export value index (january 2007 = 100)
J
an
Ma
r
Ma
y
Ju
l
Sep
No
v
J
an
Ma
r
Ma
y
Ju
l
Sep
No
v
J
an
Ma
r
Ma
y
Ju
l
Sep
No
v
J
an
Ma
r
Ma
y
Computers and parts
Integrated circuits and parts
Electrical Appliances
Vehicles and parts
Nominal export value (million USD)
Philippines
Vietnam
Malaysia
Korea
Singapore
Hong Kong
China
Thailand
Taiwan
Indonesia
Percent
Most recent/peak
Trough/peak50
60
70
80
90
100
110
120
130
08 J
an
Feb
Mar
Ap
r
May
Jun
Ju
l
Aug
Sep
Oc
t
No
v
Dec
09 J
an
Fe
b
Mar
Ap
r
Ma
y
Jun
Jul
Aug
Sep
Oc
t
No
v
Dec
10 J
an
Indonesia Korea
China Taiwan (China)
Malaysia Thailand
Singapore Philippines
Export volume index (January 2008=100)

22 ‹‹ THAILAND ECONOMIC MONITOR JUNE 2010
Figure 36. …but export prices are clearly more
supportive.
Source: DECPG World Bank and staff calculations.
Figure 37. Agricultural prices have surpassed
the record highs in mid-2008.
Source: Bank of Thailand and World Bank staff calculations.
The 2010 export outlook is favorable as much of Thailand‟s exports are shipped to East Asia and
the US, which are expected to exhibit more robust demand than Europe and other emerging
markets. Although a recovery in global trade volume is expected to be sluggish, Thailand‘s export
performance could perform better because much of its shipments are destined to East Asia and the US,
which likely enjoy a more robust demand than most others. Market views on export prospects this year
improved continuously since late 2009 (Figure 38). The then less optimistic camps now all agreed on
positive growth. Dispersion also subsided relative to late 2009, potentially reflecting lower perceived
uncertainty among forecasters. A simple cross-correlation analysis on leading indicators of export
performance suggests that improvement in Singapore‘s industrial production index and purchasing
manager index and lower computer inventory to shipments ratios in the US have historically led to
stronger shipments in Thailand by around 3-6 months (Figure 39).6 These external variables have clearly
edged up in the first five months of 2010 so reasonably strong export performance in the second half of
this year is anticipated.
6 A total of 57 variables were included in the cross-correlation analysis. The three variables highlighted above met
two selection criteria: (i) having the cross-correlation coefficient with nominal exports in US dollar term (both
measured as a year-on-year change) of at least 0.50 with an expected sign, and (ii) the leading time of at least three
months. The data set includes Thailand data as well as those from key trading partners (US, EU, Japan, China, and
Singapore). Two other variables depicted in Figure 39 can be viewed as weaker leading indicators, firmly fulfill one
of two selection criteria, and nearly meet the other. Higher correlation coefficient should be viewed as more
important than lead time, as modern technology has led to shorter ordering and inventory adjustment process.
70
80
90
100
110
120
130
08 J
an
Feb
Mar
Apr
May
Jun
Jul
Au
g
Se
p
Oct
Nov
Dec
09 J
an
Fe
b
Mar
Apr
May
Jun
Jul
Au
g
Se
p
Oct
Nov
Dec
Thailand Philippines
Korea China
Singapore Malaysia
Taiwan, China Indonesia
Export price index (January 2008=100)
90
100
110
120
130
140
150
160
170
180
-20
-15
-10
-5
0
5
10
15
07 J
an
Ma
r
Ma
y
Ju
l
Sep
No
v
08 J
an
Ma
r
Ma
y
Ju
l
Sep
No
v
09 J
an
Ma
r
Ma
y
Ju
l
Sep
No
v
10 J
an
Ma
r
Ma
y
Ja
n 0
7=
10
0
Pe
rce
nt
Price - Agriculature (3mma, MoM sa)
Price - All products (3mma, MoM sa)
Price - Agriculture (Jan 07=100, RHS)

23 ‹‹ THAILAND ECONOMIC MONITOR JUNE 2010
Figure 38. The export outlook in 2010 has
improved since late 2009 along with lower
perceived uncertainty.
Source: Consensus Economics and World Bank staff
compilation.
Figure 39. The Singapore purchasing manager
index and US computer stocks typically
correlate with Thai exports.
Source: CEIC and World Bank staff calculations.
Continued uncertainty in the external environment and potential capacity constraints will act as
headwinds, however. As highlighted in the External Environment section above, the global economic
recovery path could be uneven due to factors such as joblessness in industrial economies, design and
implementation of exit strategies, sovereign debt problems in several European economies, and policy
tightening and capital inflows management in East Asia. Dispute between China and the US over China‘s
currency management, although now eased slightly with greater yuan flexibility, could result in stronger
protectionist measures, with indirect impacts on Thailand‘s exports of parts and components to China.
Box 3 below provides some perspectives on Chinese import demand from Thailand looking forward. Also
relevant for Thailand, the World Bank estimated that the overall agricultural price index would decrease
slightly in 2011. Prices of country‘s key commodity products such as rice, rubber, prawn, and sugar are
expected to decline between 6-15 percent relative to 2010. An appreciating pressure on the baht that
follows large capital inflows could further hurt commodity exports. Prior to the crisis, strong baht
appeared to have a limited impact on high-tech exports because material costs were also cut due to high
import content. The Semiconductor Industry Association estimated over ten percent growth in world
semiconductor sales in 2010, after registering around nine percent drop last year. So high-tech exports
seem to have more favorable prospect. Finally, as capacity utilization in export-focused industries
approaches pre-crisis levels, the continuing political crisis may dampen new investments and constrain
export growth, especially into 2011.
Box 3. Chinese Import Demand from Thailand Looking Forward
Chinese import demand weathered and recovered from the crisis more favorably than G3
economies benefitting from stronger domestic demand. China‘s monthly import value contracted
around 20 percent on average for 12 months during the global economic turmoil. The hit was less severe
when compared to the US with the average monthly loss of 26 percent and the EU, which faced 15
months of decline (Figure 40). China also enjoyed more robust recovery; import levels already surpassed
the pre-crisis peak but still about 25 percent below in G3 economies. Speedier rebound in Chinese
imports is largely underpinned by more resilient domestic demand. While imports of parts and
components for further, export-oriented processing plummeted as consumption in rich markets subsided,
imports of consumer goods and commodity items were not as much affected. Import growth of ordinary
J
an
Feb
Mar
Apr
Ma
y
Jun
Jul
Au
g
Se
p
Oct
No
v
De
c
J
an
Fe
b
Mar
Apr
Ma
y
Jun
Bill
ions
US
D
Bill
ion
s U
SD
Standard deviation (RHS)
Max
Mean
Min
Actual
Forecast goods export value in 2010 (billions US$). Horizonal axis shows months that surveys were conducted
Sin
ga
pore
indus
tria
l pro
du
ction in
dex
Sin
gapore
purc
hasin
g
manager in
dex
US
com
pute
r in
vento
ry t
o
ship
ments
ratio (in
vert
ed)
Japan receiv
ed o
rders
for
sem
iconducto
rs
Term
s o
f tr
ade
Cross correlation (left axis) and monhths of leading time (right axis, dots)

24 ‹‹ THAILAND ECONOMIC MONITOR JUNE 2010
products have consistently outpaced that of items for further processing since mid-2007, thus resulting in
widening import shares between the two product categories (Figure 41).7
Figure 40. Chinese import demand emerged
from the crisis more forcefully than G3
economies…
Source: CEIC and World Bank staff calculations.
Figure 41. …largely supported by more resilient
domestic demand
Source: CEIC and World Bank staff calculations.
Chinese import demand tends to remain solid in the medium term. Chinese import value has risen
noticeably in the past decade. In 2000, EU and US import values were still 4.1 and 5.6 times that of China
respectively but these fell to only 1.7 and 1.6 times in 2009. Based on a growth accounting framework,
Kuijs (2009)8 suggests that China‘s medium-term output growth remains favorable. Capital deepening
will continue, although the potential growth could decelerate in the next ten years due to slower growth of
working population and total factor productivity. Consumption likely rises as a share of GDP as
rebalancing takes place, while export share could fall underpinned by weaker global trade. These results
tend to imply higher proportion of consumer goods imports in total imports.
Although magnificent, much of Chinese imports are determined by final demand in high-income
economies. Figure 42 depicts the destinations of East Asian exports in 2004, and suggests that almost 80
percent of total shipments were ultimately consumed outside the region (60 percent in G3 economies
alone).9 For primary destinations, exports to other East Asian economies accounted for 40 percent but half
of this was in fact for further processing and later shipped to the rest of the world. This share tends to be
even higher now given stronger regional production networks in the recent years. So East Asian,
including Chinese, import demand will remain dependent on industrial markets to a large extent. In fact,
the recent global economic crisis demonstrated that the idea that East Asia has decoupled from industrial
economies was overemphasized.
7 Imports for processing include imports for (a) processing and assembling, (b) processing with imported materials,
and (c) equipment imported for processing and assembling. 8 Kuijs, Louis (2009), ―China through 2020—A macroeconomic scenario‖, World Bank China Office Research
Working Paper No.9 9 Kim, Soyoung, Jong-Wha Lee and Cyn-Young Park (2010), ―The ties that bind Asia, Europe, and United States‖,
ADB Economics Working Paper No.192. The data there is based on the Global Trade Analysis Project (GTAP)
version 7 in which 2004 is the latest data available. East Asia here includes China, Hong Kong (China), Indonesia,
Korea, Malaysia, Philippines, Singapore, and Thailand. ―Goods consumed within East Asia‖ are exports of finished
goods to other East Asian economies, and those for further processing in East Asia and elsewhere that are finally
consumed within the region.
Jan Jul Jan Jul Jan Jul Jan
EU
US
China
Japan
Monthly nominal import values (billions US dollar)
20
30
40
50
60
05 Jan
Jul 06 Jan
Jul 07 Jan
Jul 08 Jan
Jul 09 Jan
Jul 10 Jan
Ordinary imports
Imports for processing
China's import share by customs regime (percent)

25 ‹‹ THAILAND ECONOMIC MONITOR JUNE 2010
Figure 42. Close to 80 percent of East Asia
production is ultimately consumed elsewhere.
Source: Data based on Kim, Lee and Park (2010). See
footnote 9 for reference.
How much Thailand‟s exports are finally
consumed within China is difficult to estimate
but this does not seem very high. Thai exporters
would benefit from China‘s robust domestic
demand if much of their shipments are consumed
within China. Although largely unknown and
difficult to precisely measure, it appears that such
share is not very high. Around one-third of
Thailand‘s exports to China in 2009 were
automatic processing machines units (HS8471)
and parts (HS8473) and electronic integrated
circuits (HS8542), which are also China‘s top
export goods. Components such as hard disk
drives and electronic circuits from Thailand are
assembled and shipped as part of final products to
advanced economies by firms in China.
China has robustly emerged as one of Thailand‟s major export destinations. China was the fastest-
growing market for Thai exports between 1995 and 2009. The market share increased 7.7 percentage
points to 10.6 percent (Figure 43). G3 economies in contrast lost around 5-7 percentage points so
shipment level to China now converged to those of rich economies. The composition of the export basket
also changed noticeably. High-tech items such as electronics goods have quickly replaced resource-based
products like natural rubber as Thailand‘s top export items to China (Figure 44). Meanwhile, Thailand‘s
share in Chinese market also rose steadily from 0.5 percent in 1992 to 2.4 percent in 2007, which placed
Thailand as the sixth top gainer, comparable to what Australia, Brazil, Malaysia, and Saudi Arabia also
achieved but still behind South Korea that gained six percentage points.
Figure 43. Import orders from China for Thai
products have now matched those from G3
economies.
Source: Bank of Thailand and World Bank staff calculations.
Figure 44. The share of electronics in exports
rose sharply, replacing natural rubber as
Thailand‟s top export.
Source: WITS and World Bank staff calculations. Numbers in
the parentheses are HS codes.
China‟s import unit values are not always as low as its income level may suggest. Because of lower
income per capita and higher import share of intermediate goods that tend to exhibit lower unit value,
22%
31%
28%
19%
Goods consumed within East Asia (EA)
To rest of the world (ROW) as finished goods
To ROW for further processing & consumed in ROW
To EA for further processing & consumed in ROW
Destinations of East Asia's exports in 2004 (percent)
0
5
10
15
20
25
1995 1997 1999 2001 2003 2005 2007 2009
Japan
USA
EU
ASEAN
China
Thailand's export share by market (percent)
0
5
10
15
20
25
30
Automatic data processing machines
and units (8471)
Electronic integrated circuits (8542)
Natural rubber (4001)
1996 2000 2005 2009
Share of Thailand's top export products in China (percent)
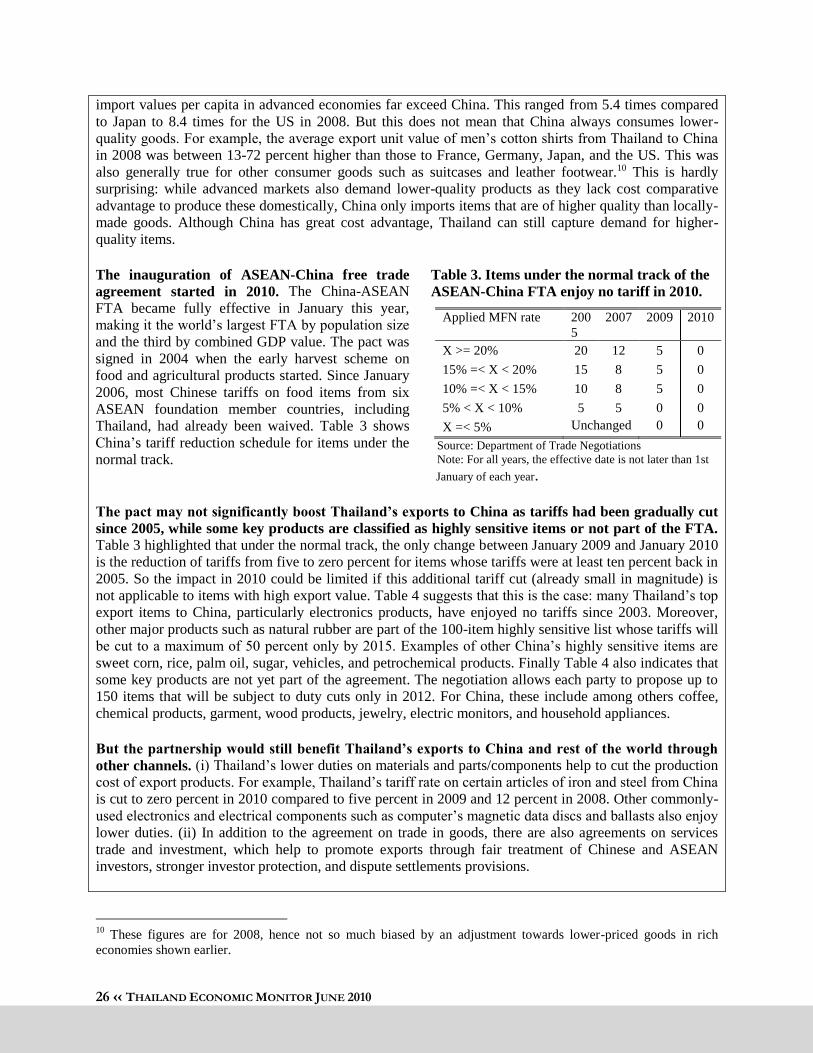
26 ‹‹ THAILAND ECONOMIC MONITOR JUNE 2010
import values per capita in advanced economies far exceed China. This ranged from 5.4 times compared
to Japan to 8.4 times for the US in 2008. But this does not mean that China always consumes lower-
quality goods. For example, the average export unit value of men‘s cotton shirts from Thailand to China
in 2008 was between 13-72 percent higher than those to France, Germany, Japan, and the US. This was
also generally true for other consumer goods such as suitcases and leather footwear.10 This is hardly
surprising: while advanced markets also demand lower-quality products as they lack cost comparative
advantage to produce these domestically, China only imports items that are of higher quality than locally-
made goods. Although China has great cost advantage, Thailand can still capture demand for higher-
quality items.
The inauguration of ASEAN-China free trade
agreement started in 2010. The China-ASEAN
FTA became fully effective in January this year,
making it the world‘s largest FTA by population size
and the third by combined GDP value. The pact was
signed in 2004 when the early harvest scheme on
food and agricultural products started. Since January
2006, most Chinese tariffs on food items from six
ASEAN foundation member countries, including
Thailand, had already been waived. Table 3 shows
China‘s tariff reduction schedule for items under the
normal track.
Table 3. Items under the normal track of the
ASEAN-China FTA enjoy no tariff in 2010.
Applied MFN rate 200
5
2007 2009 2010
X >= 20% 20 12 5 0
15% =< X < 20% 15 8 5 0
10% =< X < 15% 10 8 5 0
5% < X < 10% 5 5 0 0
X =< 5% Unchanged 0 0
Source: Department of Trade Negotiations Note: For all years, the effective date is not later than 1st
January of each year.
The pact may not significantly boost Thailand‟s exports to China as tariffs had been gradually cut
since 2005, while some key products are classified as highly sensitive items or not part of the FTA.
Table 3 highlighted that under the normal track, the only change between January 2009 and January 2010
is the reduction of tariffs from five to zero percent for items whose tariffs were at least ten percent back in
2005. So the impact in 2010 could be limited if this additional tariff cut (already small in magnitude) is
not applicable to items with high export value. Table 4 suggests that this is the case: many Thailand‘s top
export items to China, particularly electronics products, have enjoyed no tariffs since 2003. Moreover,
other major products such as natural rubber are part of the 100-item highly sensitive list whose tariffs will
be cut to a maximum of 50 percent only by 2015. Examples of other China‘s highly sensitive items are
sweet corn, rice, palm oil, sugar, vehicles, and petrochemical products. Finally Table 4 also indicates that
some key products are not yet part of the agreement. The negotiation allows each party to propose up to
150 items that will be subject to duty cuts only in 2012. For China, these include among others coffee,
chemical products, garment, wood products, jewelry, electric monitors, and household appliances.
But the partnership would still benefit Thailand‟s exports to China and rest of the world through
other channels. (i) Thailand‘s lower duties on materials and parts/components help to cut the production
cost of export products. For example, Thailand‘s tariff rate on certain articles of iron and steel from China
is cut to zero percent in 2010 compared to five percent in 2009 and 12 percent in 2008. Other commonly-
used electronics and electrical components such as computer‘s magnetic data discs and ballasts also enjoy
lower duties. (ii) In addition to the agreement on trade in goods, there are also agreements on services
trade and investment, which help to promote exports through fair treatment of Chinese and ASEAN
investors, stronger investor protection, and dispute settlements provisions.
10
These figures are for 2008, hence not so much biased by an adjustment towards lower-priced goods in rich
economies shown earlier.

27 ‹‹ THAILAND ECONOMIC MONITOR JUNE 2010
Table 4. Many of Thailand‟s top export products to China already enjoyed no tariffs before 2010.
HS Product description Share
2007-09
Base rate
2003
2005-
2008
2009 2010-
2012
1 84717020 Hard disk drives 8.4 0 0 0 0
2 84717010 Floppy disk drives 7.9 0 0 0 0
3 40012220 Technically specified natural rubber in primary
forms
4.5 Highly sensitive list
4 84733090 Parts of automatic data processing machines 4.1 0 0 0 0
5 84717099 Other storage units (electronics) 3.7 0 0 0 0
6 29173600 Terephthalic acid and its salts 3.0 Not part of negotiation
7 27090010 Crude petroleum oils 2.7 0 0 0 0
8 40012130 Smoked rubber sheet, Grade 3 2.5 Highly sensitive list
9 85423100 Processors and controllers, converters 2.4 Not part of negotiation
10 07141011 Dried chips 2.2 0 0 0 0
11 27101979 Heavy fuel oil for use in boiler furnace 2.2 Not part of negotiation
12 40059900 Other compounded rubber in primary forms 2.0 8 5 0 0
Source: Department of Trade Negotiations and Department of Commerce.
Note: This table lists products with market share of at least two percent. These 12 items alone already accounted for 46 percent of
Thailand‘s total exports to China during 2007-09 on average.
2.2.3 Exports of Services Overseas tourist arrivals registered record highs in the early months of 2010, just before political
unrest intensified in March that led to a sharp turnaround. The monthly tourist arrivals reached 1.6
million visitors for the first time during December 2009 and February 2010 (see Figure 45 for seasonally-
adjusted levels). The seasonally-adjusted level in February reached 145 percent of the December 2008
trough, when arrivals went down to 73 percent of the pre-crisis peak in February 2008. As a result, the
room occupancy rate picked up to around 65 percent but still lower than the pre-crisis mean of 70 percent.
The political unrest that deepened in March 2010 reversed this positive trend quickly and severely.
Arrivals dropped 6.2 percent in March on a month-on-month, seasonally adjusted basis, and plummeted
over 21 percent in May. This in fact resulted in a new bottom, so domestic political unrest seems to have
greater negative effect on the tourism sector than the global economic turmoil. The seasonally-adjusted
level in May 2010 was below 70 percent of the February 2008 crisis-peak. The occupancy rate plunged to
only 35 percent or 30 percentage points lower within just three months, and was the lowest level since the
data series began in 1997. For the whole year 2009, arrivals to Thailand dropped over six percent, which
according to the United Nations World Tourism Organization (UNWTO) is more severe than the global (-
4.2 percent) and East Asia and the Pacific (-1.9 percent) figures. The overall number of visitors to South
East Asia indeed increased slightly, benefitting from expansion in Cambodia, Indonesia, Malaysia, and
Myanmar.11
11
This partly reflects different profiles of the tourism sector. For example, visitors from ASEAN constitute over 70
percent of overseas tourists in Malaysia (around half from Singapore alone). So Malaysia‘s tourism revenue is less
affected by subdued demand in high-income economies.
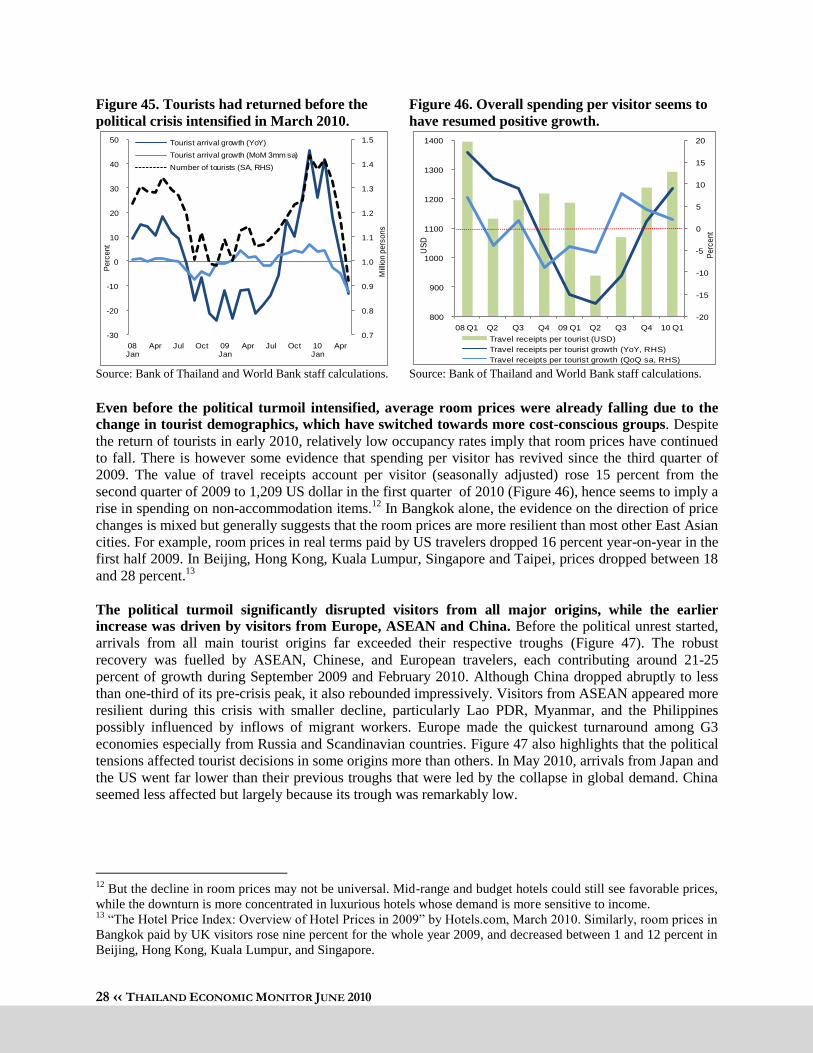
28 ‹‹ THAILAND ECONOMIC MONITOR JUNE 2010
Figure 45. Tourists had returned before the
political crisis intensified in March 2010.
Source: Bank of Thailand and World Bank staff calculations.
Figure 46. Overall spending per visitor seems to
have resumed positive growth.
Source: Bank of Thailand and World Bank staff calculations.
Even before the political turmoil intensified, average room prices were already falling due to the
change in tourist demographics, which have switched towards more cost-conscious groups. Despite
the return of tourists in early 2010, relatively low occupancy rates imply that room prices have continued
to fall. There is however some evidence that spending per visitor has revived since the third quarter of
2009. The value of travel receipts account per visitor (seasonally adjusted) rose 15 percent from the
second quarter of 2009 to 1,209 US dollar in the first quarter of 2010 (Figure 46), hence seems to imply a
rise in spending on non-accommodation items.12
In Bangkok alone, the evidence on the direction of price
changes is mixed but generally suggests that the room prices are more resilient than most other East Asian
cities. For example, room prices in real terms paid by US travelers dropped 16 percent year-on-year in the
first half 2009. In Beijing, Hong Kong, Kuala Lumpur, Singapore and Taipei, prices dropped between 18
and 28 percent.13
The political turmoil significantly disrupted visitors from all major origins, while the earlier
increase was driven by visitors from Europe, ASEAN and China. Before the political unrest started,
arrivals from all main tourist origins far exceeded their respective troughs (Figure 47). The robust
recovery was fuelled by ASEAN, Chinese, and European travelers, each contributing around 21-25
percent of growth during September 2009 and February 2010. Although China dropped abruptly to less
than one-third of its pre-crisis peak, it also rebounded impressively. Visitors from ASEAN appeared more
resilient during this crisis with smaller decline, particularly Lao PDR, Myanmar, and the Philippines
possibly influenced by inflows of migrant workers. Europe made the quickest turnaround among G3
economies especially from Russia and Scandinavian countries. Figure 47 also highlights that the political
tensions affected tourist decisions in some origins more than others. In May 2010, arrivals from Japan and
the US went far lower than their previous troughs that were led by the collapse in global demand. China
seemed less affected but largely because its trough was remarkably low.
12
But the decline in room prices may not be universal. Mid-range and budget hotels could still see favorable prices,
while the downturn is more concentrated in luxurious hotels whose demand is more sensitive to income. 13
―The Hotel Price Index: Overview of Hotel Prices in 2009‖ by Hotels.com, March 2010. Similarly, room prices in
Bangkok paid by UK visitors rose nine percent for the whole year 2009, and decreased between 1 and 12 percent in
Beijing, Hong Kong, Kuala Lumpur, and Singapore.
0.7
0.8
0.9
1.0
1.1
1.2
1.3
1.4
1.5
-30
-20
-10
0
10
20
30
40
50
08 Jan
Apr Jul Oct 09 Jan
Apr Jul Oct 10 Jan
Apr
Mill
ion
pe
rso
ns
Pe
rce
nt
Tourist arrival growth (YoY)
Tourist arrival growth (MoM 3mm sa)
Number of tourists (SA, RHS)
-20
-15
-10
-5
0
5
10
15
20
800
900
1000
1100
1200
1300
1400
08 Q1 Q2 Q3 Q4 09 Q1 Q2 Q3 Q4 10 Q1
Perc
ent
US
D
Travel receipts per tourist (USD)
Travel receipts per tourist growth (YoY, RHS)
Travel receipts per tourist growth (QoQ sa, RHS)
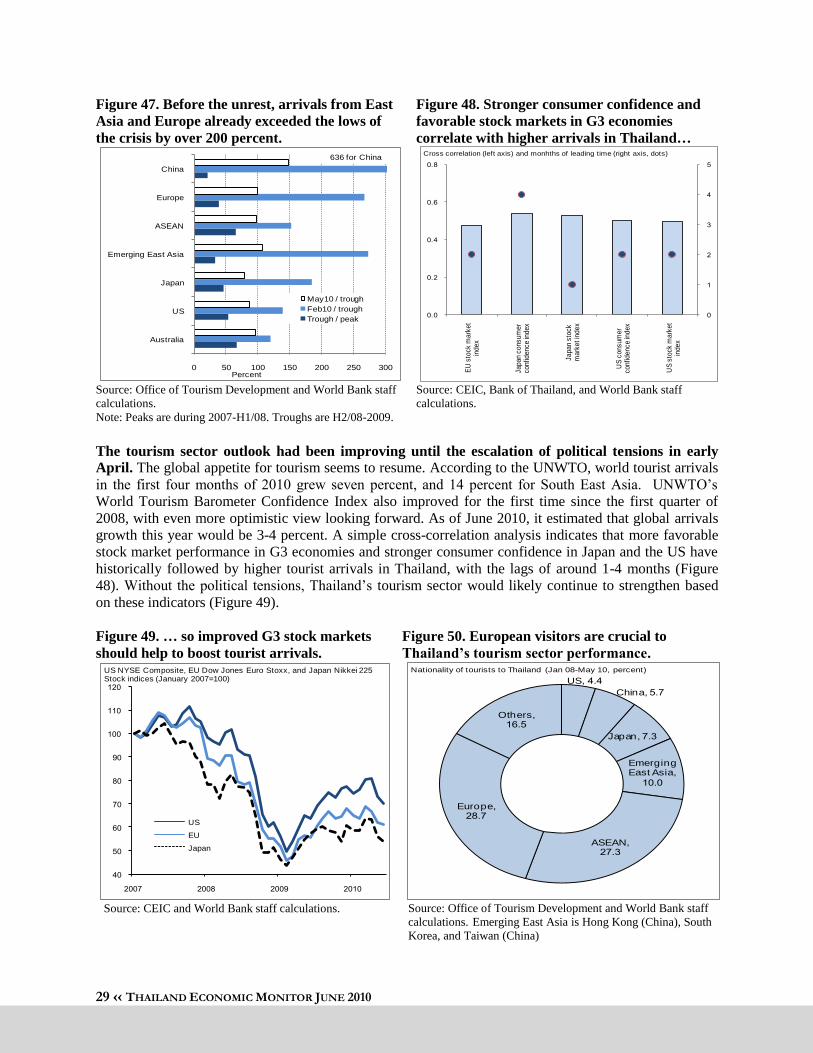
29 ‹‹ THAILAND ECONOMIC MONITOR JUNE 2010
Figure 47. Before the unrest, arrivals from East
Asia and Europe already exceeded the lows of
the crisis by over 200 percent.
Source: Office of Tourism Development and World Bank staff
calculations.
Note: Peaks are during 2007-H1/08. Troughs are H2/08-2009.
Figure 48. Stronger consumer confidence and
favorable stock markets in G3 economies
correlate with higher arrivals in Thailand…
Source: CEIC, Bank of Thailand, and World Bank staff
calculations.
The tourism sector outlook had been improving until the escalation of political tensions in early
April. The global appetite for tourism seems to resume. According to the UNWTO, world tourist arrivals
in the first four months of 2010 grew seven percent, and 14 percent for South East Asia. UNWTO‘s
World Tourism Barometer Confidence Index also improved for the first time since the first quarter of
2008, with even more optimistic view looking forward. As of June 2010, it estimated that global arrivals
growth this year would be 3-4 percent. A simple cross-correlation analysis indicates that more favorable
stock market performance in G3 economies and stronger consumer confidence in Japan and the US have
historically followed by higher tourist arrivals in Thailand, with the lags of around 1-4 months (Figure
48). Without the political tensions, Thailand‘s tourism sector would likely continue to strengthen based
on these indicators (Figure 49).
Figure 49. … so improved G3 stock markets
should help to boost tourist arrivals.
Source: CEIC and World Bank staff calculations.
Figure 50. European visitors are crucial to
Thailand‟s tourism sector performance.
Source: Office of Tourism Development and World Bank staff
calculations. Emerging East Asia is Hong Kong (China), South
Korea, and Taiwan (China)
0 50 100 150 200 250 300
Australia
US
Japan
Emerging East Asia
ASEAN
Europe
China
Percent
May10 / trough
Feb10 / trough
Trough / peak
636 for China
EU
sto
ck m
ark
et
index
Japan c
onsum
er
confidence in
dex
Japan s
tock
mark
et in
dex
US
consum
er
confidence in
dex
US
sto
ck m
ark
et
index
Cross correlation (left axis) and monhths of leading time (right axis, dots)
US
EU
Japan
US NYSE Composite, EU Dow Jones Euro Stoxx, and Japan Nikkei 225 Stock indices (January 2007=100) US,
China,
Japan,
Emerging East Asia,
ASEAN,
Europe,
Others,
Nationality of tourists to Thailand (Jan 08-May 10, percent)

30 ‹‹ THAILAND ECONOMIC MONITOR JUNE 2010
Recovery in Europe and domestic political tensions are key uncertainties. Despite the relatively quick
rebound so far, the return of Europeans, one of the two largest origins of tourists in Thailand (Figure 50),
could decelerate in the coming months. Renewed concerns over macroeconomic stability ignited by
several downgrades in European sovereign debt ratings have led to weaker Euro (already over 18 percent
against the baht since December 2009), thus lowering their purchasing power. High unemployment rate
also holds back consumer spending. For domestic factor, heightened political uncertainty and associated
social unrest in recent months will further impair confidence, with likely disproportional impact on
tourists from nearby Asian countries due to shorter reservation lead time.14
Box 4. Will a More Competitive Vietnamese Dong Hurt Thai Exports?
The dong devaluation tends to enhance Vietnam‟s export competitiveness. Widening trade deficits
and high consumer inflation that leads to the hoarding of US dollar by Vietnamese have placed the dong
under pressure to depreciate. The dong was devalued twice since late 2009. By April 2010, the currency
depreciated nine percent against the US dollar from October 2009 (and 15 percent from January 2008,
Figure 51). In contrast, the Thai baht gained nine percent in a year to April 2010, so a potential rise in
Vietnam‘s export competitiveness relative to Thailand could be much greater than what the dong value
alone suggests. This box examines the effects that the devaluation likely has on Thailand‘s export
performance.
Figure 51. The Vietnam Dong has lost value
against the US dollar while the baht strengthened.
Source: CEIC and World Bank staff calculations.
The devaluation impact on Thailand‟s
overall exports is likely limited as export
baskets differ. At the four-digit harmonized
system (HS) code level, only rice and natural
rubber are ranked among the top ten products
in both Thailand and Vietnam‘s export
baskets.15
Vietnam‘s other top earners are
resource-based and labor-intensive goods such
as footwear, seafood items, furniture, and
garments. Thailand‘s top merchandises contain
more high-technology components such as
computers, electronic circuits, and vehicle
parts. It is unlikely that the dong devaluation
will markedly shift these export structures in
the near term so the overall, immediate impact
on Thailand‘s shipments is arguably limited.
But the effect on commodity products with direct competition can be significant. Table 5 lists
products that are among the top 30 in both export baskets. A more competitive dong could particularly
affect Thai shipments of commodity products such as rice, natural rubber, and crustaceans (e.g. prawns
and crabs) because Thailand and Vietnam‘s export destinations for these goods are similar. For instance,
eight out of the top ten rubber and crustaceans export markets are common (five for rice). Based on price
14
Even before the unrest began, over 40 percent of overseas tourists who are already in Thailand expressed that
political conflict has affected their travel decisions based on the Bangkok University survey in late March 2010.
This share is doubled relative to the similar survey conducted in late 2009. This ratio would have been higher if the
sample also included travelers who had decided to cancel/postpone their trips. 15
At this disaggregation level, the top ten items accounted for 44 and 36 percent of Vietnam and Thailand‘s total
exports in 2008, respectively. Data in 2008 are used to lessen the effect that the global recession may temporarily
have on export product structures in 2009.
80
90
100
110
120
Ja
n-0
7
Ap
r-0
7
Jul-0
7
Oc
t-0
7
Jan-0
8
Ap
r-0
8
Ju
l-0
8
Oc
t-0
8
Ja
n-0
9
Ap
r-0
9
Jul-0
9
Oc
t-0
9
Jan-1
0
Ap
r-1
0
Dong/USD
Baht/USD
Vietnam Dong and Thai Baht values against US dollar (January 2007=100, the index value over 100 indicates depreciation, and appreciation if below 100)
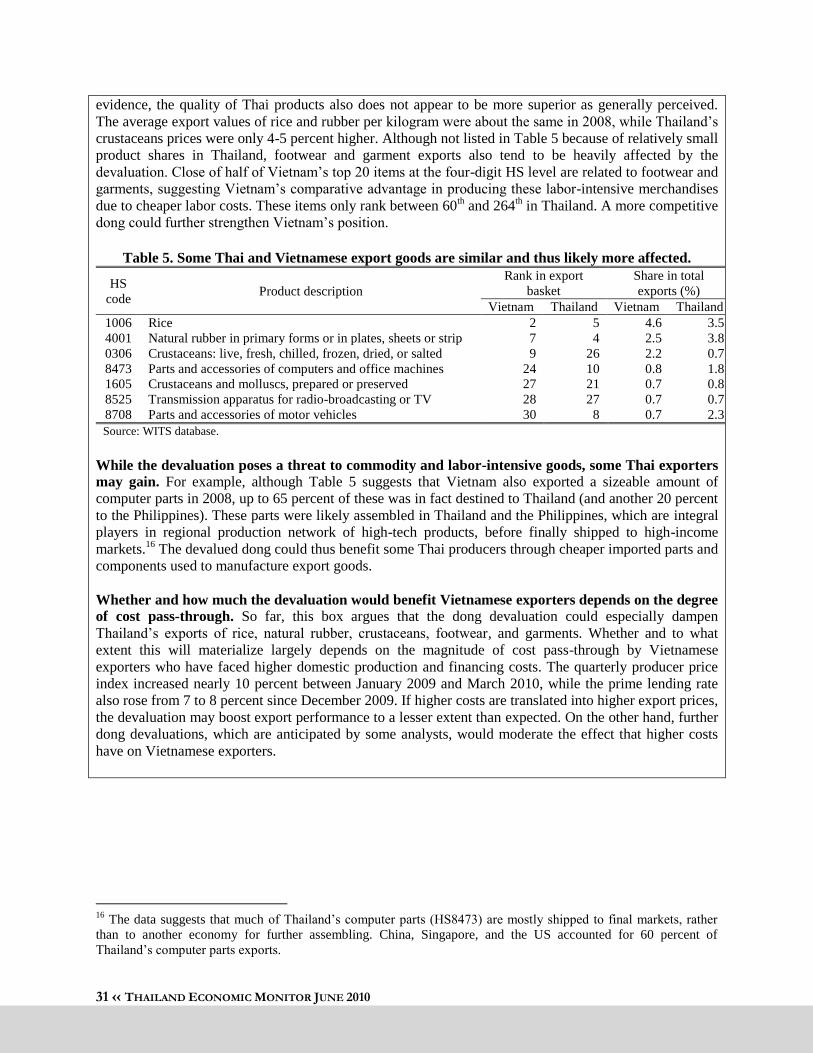
31 ‹‹ THAILAND ECONOMIC MONITOR JUNE 2010
evidence, the quality of Thai products also does not appear to be more superior as generally perceived.
The average export values of rice and rubber per kilogram were about the same in 2008, while Thailand‘s
crustaceans prices were only 4-5 percent higher. Although not listed in Table 5 because of relatively small
product shares in Thailand, footwear and garment exports also tend to be heavily affected by the
devaluation. Close of half of Vietnam‘s top 20 items at the four-digit HS level are related to footwear and
garments, suggesting Vietnam‘s comparative advantage in producing these labor-intensive merchandises
due to cheaper labor costs. These items only rank between 60th and 264
th in Thailand. A more competitive
dong could further strengthen Vietnam‘s position.
Table 5. Some Thai and Vietnamese export goods are similar and thus likely more affected.
HS
code Product description
Rank in export
basket
Share in total
exports (%)
Vietnam Thailand Vietnam Thailand
1006 Rice 2 5 4.6 3.5
4001 Natural rubber in primary forms or in plates, sheets or strip 7 4 2.5 3.8
0306 Crustaceans: live, fresh, chilled, frozen, dried, or salted 9 26 2.2 0.7
8473 Parts and accessories of computers and office machines 24 10 0.8 1.8
1605 Crustaceans and molluscs, prepared or preserved 27 21 0.7 0.8
8525 Transmission apparatus for radio-broadcasting or TV 28 27 0.7 0.7
8708 Parts and accessories of motor vehicles 30 8 0.7 2.3
Source: WITS database.
While the devaluation poses a threat to commodity and labor-intensive goods, some Thai exporters
may gain. For example, although Table 5 suggests that Vietnam also exported a sizeable amount of
computer parts in 2008, up to 65 percent of these was in fact destined to Thailand (and another 20 percent
to the Philippines). These parts were likely assembled in Thailand and the Philippines, which are integral
players in regional production network of high-tech products, before finally shipped to high-income
markets.16
The devalued dong could thus benefit some Thai producers through cheaper imported parts and
components used to manufacture export goods.
Whether and how much the devaluation would benefit Vietnamese exporters depends on the degree
of cost pass-through. So far, this box argues that the dong devaluation could especially dampen
Thailand‘s exports of rice, natural rubber, crustaceans, footwear, and garments. Whether and to what
extent this will materialize largely depends on the magnitude of cost pass-through by Vietnamese
exporters who have faced higher domestic production and financing costs. The quarterly producer price
index increased nearly 10 percent between January 2009 and March 2010, while the prime lending rate
also rose from 7 to 8 percent since December 2009. If higher costs are translated into higher export prices,
the devaluation may boost export performance to a lesser extent than expected. On the other hand, further
dong devaluations, which are anticipated by some analysts, would moderate the effect that higher costs
have on Vietnamese exporters.
16
The data suggests that much of Thailand‘s computer parts (HS8473) are mostly shipped to final markets, rather
than to another economy for further assembling. China, Singapore, and the US accounted for 60 percent of
Thailand‘s computer parts exports.

32 ‹‹ THAILAND ECONOMIC MONITOR JUNE 2010
2.3 Private Domestic Demand
2.3.1 Household Consumption
Lower agricultural prices and weak consumer confidence led to a decline in household consumption
in 2009. Household consumption contracted by 1.1 percent in 2009, the first contraction since the 1997
crisis. The global economic crisis affected household consumption in at least three ways. First, incomes in
agriculture, which employs nearly 40 percent of the workforce, declined in 2009 along with the prices of
agricultural commodities (Figure 52). Second, agriculture and the informal economy served as a safety
net to many workers displaced from the manufacturing and trade-related sectors, which placed downward
pressure on wages and incomes. Finally, the crisis affected consumer confidence, especially in the
beginning of the year when the pace of recovery was highly uncertain. In addition the first half of 2009
was marked by an escalation of Thailand‘s political crisis, which also had a negative impact on consumer
confidence. In response to these shocks, the government implemented a consumption-focused fiscal
stimulus package, which was implemented quickly and likely prevented a further decline in consumption.
However, the emphasis on quick disbursements made it more difficult to target agricultural households,
which were arguably the most affected by the crisis.
Figure 52. Agricultural prices plummeted as a
result of the global financial crisis but have
recovered since mid-2009.
Source: DECPG, the World Bank.
Figure 53. Consumption indicators generally
bottomed out in May 2009 and fell again in
April and May 2010 due to the political crisis.
Source: UTCC, BoT and World Bank staff calculations.
A recovery in agricultural prices since the third quarter of 2009 will support modest growth in
household consumption in 2010. Private consumption picked up in the fourth quarter of 2009 on the
back of improved employment outcomes and higher agricultural prices (Figure 52 and Figure 53), but
declined again (on a quarterly, seasonally-adjusted basis) in the first quarter of 2010. Given the escalation
of the political crisis, this weakness may continue. However, given base effects, firm agricultural prices,
and a recovery in commodity prices, household consumption should post modest growth in 2010. Key
risks to this outlook include the escalation of the political crisis, which may dampen consumer confidence
in the second half of the year (see Box 1), as well as a severe drought. These risks are mitigated by the
possibility that favorable political developments may realize pent-up demand, as well as by irrigation and
government intervention in an earlier locust infestation, which suggest agricultural production may not be
reduced significantly by the drought. Moreover, even as production declines somewhat, incomes may not
be reduced as sharply when government relief assistance is included. The government‘s farm support
100
120
140
160
180
200
220
240
260
280
300
Jan-05 Jan-06 Jan-07 Jan-08 Jan-09 Jan-10
Ind
ex (2
00
0=
100
)
Food
Raw Materials Beverages
Ja
n-
Ma
r-
Ma
y-
Ju
l-
Se
p-
No
v-
Jan
-
Ma
r-
Ma
y-
Ju
l-
Se
p-
No
v-
Ja
n-
Ma
r-
Ma
y-
Co
ns
um
er
Co
nfi
de
nc
e In
de
x
Ind
ex
(2
00
8=
10
0)
Gross VAT, prices
Real consumer goods imports, prices
UTCC Consumer Confidence Index (right axis)

33 ‹‹ THAILAND ECONOMIC MONITOR JUNE 2010
schemes (see Box 5 below) have expanded their reach to more farmers, providing sizeable transfers to
agricultural households and further supporting consumption growth in 2010.
Box 5. From Crop Mortgage to Price Insurance
The crop mortgage scheme
Supporting farmers has always been a priority for successive Thai governments, leading to the
development of the crop mortgage scheme in 1981. Because many farmers are liquidity constrained
and/or have limited storage facilities, they tend to sell their paddy during the harvest season. With many
farmers coming to market at the same time, prices become depressed. To address this problem the Thai
government introduced a scheme under which farmers could obtain low-interest loans from the Bank for
Agriculture and Agricultural Cooperatives (BAAC) to allow them to delay the sale of the paddy, which in
the meantime was used as collateral for the loan. The collateral was valued at government-set ―pledging
prices‖ intended to approximate market prices, and stored at approved warehouses. Farmers who did not
own a warehouse could participate in the program through the Ministry of Commerce‘s Public Warehouse
Organization (PWO), which operated through regional rice mills. While 90 percent of total government
farm support in 2008 went to rice farmers, the scheme was also available to a number of other agricultural
and fishery products such as cassava, longans, maize and shrimp.
For most of its history, the mortgage scheme did not have large budgetary implications. Pledging
prices were set below market prices and/or loans were over-collateralized, and therefore farmers had an
incentive to repay the loan and redeem the paddy collateral, limiting program costs. There is some
evidence that farmers benefited from the program by the improved ability to time paddy sales according
to market conditions. However, whether due to higher volatility in rice prices or an attempt to modify the
program‘s objectives, in the mid-2000s pledging prices increased substantially, often above market prices.
This effectively transformed the program into a price support scheme because it became advantageous for
farmers to default on the loans and leave the collateral with the government.
The crop mortgage scheme was criticized on several fronts:
It imposed high and volatile costs to the government‟s budget. The costs come from (1) losses
from the difference between the financial losses accrued to BAAC (which are linked to the book
value of the collateral and must be compensated by the government) and the actual revenues from
rice sales (including, for example, losses from spoilage); (2) storage costs; (3) milling costs; and
(4) BAAC expenses. The program accrued losses of 18 billion baht in the 2005/2006 growing
season, when the government was left with 3.8 million tons of paddy, and even larger losses in
the 2008/2009 season when high rice prices at the beginning of the growing season pushed
pledging prices to historically high levels. In FY09 the budgetary burden of the mortgaging
program for rice alone was estimated at over 70 billion baht.
As a safety net for farmers, the program was not well-targeted. In FY09, an estimated one
million rice farming households, 250,000 tapioca farmers and 80,000 maize farmers benefited
from the scheme. The Thailand Development Research Institute (TDRI) estimated that farmers
derived only 40 percent of the total program benefits. In addition to the farmers, the program
benefited government agencies (14 percent), millers (14 percent), exporters (24 percent), and
warehouse owners (4 percent). In addition, the program disproportionally benefits large and
wealthier farmers: among the beneficiaries in 2006, less than five percent belonged to the lowest
two deciles of the income distribution.
The program distorted market prices and does not allow for the normal operation of a

34 ‹‹ THAILAND ECONOMIC MONITOR JUNE 2010
commodity futures exchange. The scheme distorts prices as farmers prefer to mortgage the
paddy at the government‘s high pledging prices rather than to sell the paddy in the market.
Because of these distortions, it is not possible to use market mechanisms to hedge rice prices. The
Agricultural Futures Exchange of Thailand (AFET) has been incurring losses since it started
trading commodity contracts in 2004 (first rubber, then rice in 2005) as volumes for rice contracts
are very low due to the intervention policies.
Competition in the rice market has been reduced as the government became the country‟s
largest rice trader. TDRI research indicates that the number of local rice traders and central
paddy markets run by the private operators has declined. Meanwhile, large millers have expanded
further in response to the policy, generating excess capacity. The largest three millers now
account for close to three quarters of the market.
There are substantial „leakages‟ and potential for corruption. The program created incentives
for illicit schemes such as illegal cross-border trade (i.e. rice is bought cheaply from neighboring
countries and then mortgaged at a higher price) and mixing of rice varieties of different qualities.
The program reduces exports through price and quality effects. The price distortions
generated by the scheme made Thai rice less competitive than that of neighboring countries –
notably Vietnam. The USDA estimates that in 2005 and 2006, prices under the intervention
program raised Thai export prices between 30–50 US dollar/ton compared to major competitors
(see Table 6). The program also affected Thailand‘s reputation as a reliable supplier of rice since
it became difficult for buyers to form solid expectations about how and when sales would be
managed, as government sales had to take political concerns into account. There are also claims
that the scheme has led to deterioration in the quality of rice, as high-quality jasmine rice has
been mixed with lower-quality white rice in order to attain a high volume for mortgaging.
Table 6. Market prices responded to the government‟s intervention price, highlighting the
program‟s distortionary nature.
2002/03 2003/04 2004/05 2005/06
Intervention price (baht/ton)
Fragrant paddy 6,500-6,800 6,700-7,000 9,700-10,000 9,700-10,000
White rice paddy 4,760-5,330 4,760-5,330 6,200-6,600 6,700-7,100
Paddy pledges (ton)
Main crop 3,542,429 2,838,141 5,295,237 5,291,831
Second crop 2,040,265 1,183,92 797,778 2,173,727
Carry-over stocks 2,613,040 1,716,364 5,883,233 6,754,888
(milled equivalent) 1,437,172 944,000 3,235,778 3,715,172
Market price before the program (baht/ton)
Fragrant paddy 6,340 7,980 7,738 7,683
White rice paddy 4,688 4,434 5,932 6,800
Market price after the program (baht/ton)
Fragrant paddy 7,560 9,567 7,999 8,151
White rice paddy 4,700 5,193 6,682 6,788
Source: Ministry of Commerce and USDA.
The price insurance scheme
In October 2009, the government started replacing the crop mortgage scheme with a “price
insurance” (or “price guarantee”) scheme. In its inaugural year, price insurance was made available for
rice, tapioca and maize. The program is designed to provide farmers with compensation when the

35 ‹‹ THAILAND ECONOMIC MONITOR JUNE 2010
―benchmark‖ market price of rice falls below the ―insured‖ price level set at the beginning of the growing
season. These prices are set by the Sub-committee on Benchmark Price Determination under the Ministry
of Commerce. During the price guarantee period, if the benchmark prices of rice are lower than the
insured prices set by the government, farmers are eligible to receive a payment based on their registered
commitment for the season (see Figure 54 for actual benchmark and market prices since the inception of
the program). Farmers may only claim compensation once per season (BAAC keeps records when a claim
is paid), and therefore the program also encourages farmers to time their sales to obtain the highest prices.
Notwithstanding the ‗insurance‘ aspect, no proof of loss (e.g. receipts from the rice sales) is required.
However, the volume of crops that can be ―insured‖ is limited based on average plot sizes. The key
difference under the new scheme is that farmers are now responsible for selling the crops, with financial
compensation designed to complement the revenue earned from the sale of the crop to the market. This
removes the government‘s role in physical storage, handling, or marketing of the commodities.
Figure 54. Benchmark prices were generally below the
insured price, allowing farmers to claim compensation
for the difference.
Source: USDA, based on information from the Ministry of Commerce.
Note: Benchmark prices are average historical wholesales prices which
will be used for the calculation of compensation to farmers. The
compensation is based on the difference between insurance prices and
benchmark prices.
The cost of the overall price insurance scheme is currently covered by the government as part of the
second stimulus package, and is budgeted to be 30 billion baht for FY10. The government eventually
intends to eliminate the fiscal burden of this program altogether by charging farmers a premium for the
insurance. The longer term objective is to use commodities exchanges to hedge the government‘s position
by using the premiums to buy futures contracts, so that in effect the government would act as a bridge
between futures markets and farmers. This would not only eliminate the expected cost of the program
(which would be achieved by charging farmers an ‗actuarially fair‘ premium) but also the year-to-year
volatility to the budget.
The price insurance scheme is intended to have several advantages over the crop mortgaging
scheme: (1) the government would no longer need to use warehouses to store crops or to process the
produce; (2) the government would get out of the commodity trading business and reduce distortions in
the commodity markets; (3) the fiscal cost was anticipated to be lower and may eventually be eliminated
altogether; (4) more farmers would benefit: the government claims the program reached three million
Ba
ht p
er
ton
Benchmark Prices
Insured Price
Mkt Prices, USDA

36 ‹‹ THAILAND ECONOMIC MONITOR JUNE 2010
farming households including 400,000 corn farmers and 400,000 tapioca farmers; and (5) the scheme is
more ‗market-based‘ and may be combined with other types of insurance to provide greater level of
income certainty to farmers (including weather risk insurance to insure part of the weather-related risk
that affects the volume of production).
Some potential pitfalls of the program were known in advance: (1) the scheme requires clear and easy
methods to inspect the area of land registered by the farmer; (2) benchmark prices need to reflect actual
prices farmers obtain in the market; (3) because farmer income before insurance depends on output times
market price, actual volumes should eventually also be insured (possibly through weather risk insurance
schemes) to provide true income insurance while avoiding moral hazard created by allowing a fixed
volume; (4) to move the scheme off-budget a properly functioning commodity futures exchange is
required, but past government interventions in the commodity market has not allowed commodity
exchanges in Thailand to function properly; and (5) the beneficiaries of the old scheme would resist the
changes.
Recent developments
Ceasing direct intervention proves politically difficult and since the new program started the
government has announced several measures to directly intervene in rice markets. On October 20,
2009 the cabinet authorized direct purchases of two million tons of paddy from farmers at the benchmark
prices. The cabinet also authorized financial assistance to millers, domestic and international marketing
efforts, on-farm mortgage of 1.5 million tons of paddy, and outreach to farmers regarding the new price
insurance program.17
On February 25, 2010 partly in response to a threat of farmers to rally at
Government House, the government announced additional rice purchases of at least 290,000 tons of
paddy.18
At the same time, the Commerce Ministry announced it was terminating the auction of 500,000
tons of rice in the government‘s warehouse in order to boost prices. On April 7, as ―red shirt‖ protests
intensified, the government announced it was preparing to buy as much as 900,000 tons of paddy from
farmers as well as milled rice from millers. Given that auctions of the government‘s stocks remain
suspended, the new buying program also aims at exchanging new paddy bought by millers from farmers
for milled rice from the government‘s stockpile. The purchases will be made at the government‘s
benchmark price, which at the time of the announcement were above market prices.
Fraud in registered production areas has been reported, and may be tackled with remote sensing
technology. For the second phase of the farm income guarantee scheme, the government plans to use
satellite imaging technology in monitoring the registration of farmers to ensure the accuracy of reported
growing areas. State authorities have found irregularities in the registration of farms, and in many areas
the total production area registered by farmers in the district exceeds the total area of that district. The
cabinet gave the Ministry of Science and Technology approval to use photographs taken by the satellite to
measure the off-season rice growing areas. The use of remote sensing function to reduce fraud by
validating planted areas as opposed to loss adjustment is unusual, and contrasts with the use of remote
sensing imagery from GISTDA, which has been used to support measurement of flooded areas for
disaster compensation. In the UK, remote sensing is used to check on farm subsidy claims, which rely on
declarations of planted areas.
17
The program is financed by a 60-billion baht fund from BAAC, whereby the bank will provide 20 billion baht in
loans guaranteed by the Ministry of Finance to the Marketing Organization for Farmers (MOF) and the PWO to
directly buy rice from farmers; 20 billion baht in subsidized loans to rice millers to boost their liquidity on the
condition that they must buy rice from farmers at the benchmark prices; and an additional 20 billion baht for a rice
mortgaging scheme. 18
The purchases are financed through BAAC, which will provide a credit line of 20 billion baht to PWO and MOF
to purchase paddy from farmers at benchmark prices.

37 ‹‹ THAILAND ECONOMIC MONITOR JUNE 2010
Notwithstanding the obstacles, the government plans to extend the price insurance scheme in the
coming year to other agricultural produce such as sugarcane and some fruits. Regarding insurance
for production volumes, the government also announced in January, 2010 that it intends to implement a
weather insurance program that uses a district-level rainfall index to trigger insurance payouts to BAAC
in case of droughts. The payouts will then be credited to the farmers who had paid premiums for the
insurance coverage, thus alleviating part of their debt to BAAC in a drought-affected year. BAAC plans
to conduct another test run this year, and the program may be expanded to other provinces if the two-year
operation is successful.
2.3.2 Private Investment
Private investment was late to join the rebound because of the lag between investment planning and
implementation. Since the 1997/98 financial crisis, most private investment in Thailand is in the form of
equipment and machinery (see Figure 55). Therefore, the slump in investment following the global
financial crisis is closely linked to a decline in imports of capital goods by export-oriented manufacturing
firms. Given the prospect of substantial excess capacity, firms made drastic cuts to their investment plans
in early 2009. Once the outlook for external demand started improving in the second quarter of 2009, new
investment plans were drafted resuming planned investments. Given the lag between planning and
implementation, imports of capital goods bottomed out only in April (three months after manufacturing
production bottomed out) and remained depressed through August (Figure 56). The rebound in private
investment is seen in the first quarter of 2010, when private investment grew by nearly 16 percent.
Figure 55. Most private investment in Thailand
since the financial crisis has been in equipment,
which is associated with machinery imports.
Source: NESDB and World Bank staff calculations.
Figure 56. The recovery of equipment
investment lagged the manufacturing rebound…
Source: BoT and World Bank staff calculations.
The outlook for private investment is positive in the near term, but higher uncertainty due to the
political turmoil is likely to dampen investment beyond the first half of 2010. The rebound in
manufacturing production has implied an increase in capacity utilization from its lows in February 2009
and a resumption of capital expenditures that had been all but frozen during the trough of the crisis
(Figure 57). These capital expenditures are primarily machine maintenance, upgrades and plant expansion
of existing firms that had been previously planned but delayed due to the crisis. The prospect for
‗greenfield‘ investments in new plants or by new investors is far more limited, however. Remaining
Perc
ent
of
Real
GD
P
Construction
Equipment
Ja
n-
Ma
r-
Ma
y-
Ju
l-
Sep
-
No
v-
Ja
n-
Ma
r-
Ma
y-
Ju
l-
Sep
-
No
v-
Ja
n-
Ma
r-
Ma
y-
Ju
l-
Se
p-
No
v-
Ja
n-
Ind
ex
(J
an
20
06
= 1
00)
MPI, SA
Capital Goods Imports, SA

38 ‹‹ THAILAND ECONOMIC MONITOR JUNE 2010
excess capacity on a global scale, a related highly competitive environment for foreign direct investment,
and the weight of the ongoing political turmoil and regulatory uncertainty from the Map Ta Phut court
case will limit the potential growth rate of investment in the medium term (See Box 3, Thailand
Economic Monitor, November 2009 issue). On a positive note, there are signs that construction
investment, long subdued, may be picking up as building permits jumped in December 2009 and credit to
the sector increased. This pick-up may be due to the expectation that low interest rates as well as tax
breaks given to the sector as part of the economic stimulus will be withdrawn later in 2010.
Figure 57. … and increases in capacity
utilization.
Source: Bank of Thailand and World Bank staff calculations.
Figure 58. FDI declines in Thailand in 2009
were in line with those in neighboring countries.
Source: CEIC and World Bank staff calculations.
Foreign direct investment (FDI) declined markedly in 2009, but inflows are expected to continue
due to the secular trend to move production away from advanced economies. Inward foreign direct
investment declined by 28 percent in nominal terms in 2009, in line with declines seen in other countries
in the region (Figure 58). The outlook for FDI in 2010 is favorable as the recovery in global demand leads
to a resumption of the secular trend for firms to move production facilities away from advanced
economies to cut costs. Supply chain risk management will continue to provide incentives for firms to
maintain production facilities in different countries, and therefore although the expansion of production
facilities in China should continue to outpace FDI in other countries, FDI growth outside of China should
remain positive. In the case of Thailand, existing investors are likely to maintain planned investments, but
the potential for new entrants is limited due to political and regulatory uncertainties discussed earlier.
Inventory investment is poised to be a key contributor to growth in 2010 due to the large degree of
destocking in 2009. Inventory investment reflects a temporary mismatch between production (supply)
and consumption (demand). As demand plummeted in November 2008 and firms took time to adjust
production downward, inventories rose. Once production was adjusted, a drawdown in inventories was
expected. However, because realized demand exceeded initial pessimistic expectations, inventory
drawdowns exceeded the initial accumulation, bringing inventories below equilibrium levels: in real
terms, drawdowns in 2009 were 68 percent higher than the accumulation in 2008. Considering that in
normal years inventory investment is positive (as capacity expands, so does the overall amount of
inventories in the economy), inventory restocking is expected to be large in 2010, contributing 3.4
percentage points to the annual GDP growth rate (in 2009, inventory drawdowns subtracted 3.7
percentage points from the annual growth rate). However, most of the inventory restocking has already
taken place in the first quarter as nearly 1.9 percentage points of the total expected contribution of
inventories to yearly growth has already been realized in the first quarter (see Figure 59).
90
100
110
120
130
55
60
65
70
75
20
08Jan
2008
Mar
20
08M
ay
20
08Jul
2008
Sep
2008
Nov
20
09J
an
2009
Mar
20
09M
ay
20
09Jul
2009
Sep
2009
Nov
20
10Jan
2010
Mar
Capit
al G
ood
s I
mport
s,
TH
B B
illio
n
Capa
cit
y U
tiliz
ati
on,
perc
ent
Capacity Utilization
Capital Goods Imports
-100
-80
-60
-40
-20
0
20
40
China Indonesia Malaysia Philippines Thailand
Perc
ent C
han
ge
, 2009 f
rom
2008

39 ‹‹ THAILAND ECONOMIC MONITOR JUNE 2010
Figure 59. Following massive drawdowns in 2009,
inventory restocking is likely to make only a small
contribution for the rest of 2010.
Source: NESDB and World Bank staff calculations and projections.
2.4 Fiscal Policy
2.4.1 Public Investment
Following a contraction of 4.6 percent in 2008, public investment grew by 2.7 percent in 2009 and
growth is expected to accelerate to 4.6 percent in 2010 despite slow disbursements under the
government‟s infrastructure-focused second stimulus package. Investment projects under government
stimulus packages helped raise public investment only marginally in 2009 – around 2.7 percent of total
public investment or 0.3 percent of GDP.19
This contribution is expected to pick-up in 2010, making up
for a reduction of on-budget investments. The investment budget from the first stimulus package that has
been carried forward to 2010 is expected to add about 11 billion baht in new investments, whereas
approximately two-thirds of the TKK budget is allocated to construction and equipment investments.
Although on-budget capital expenditures of the central government are expected to decrease by 50
percent from the previous year, these investment projects under the TKK program more than compensate
for this reduction. Notwithstanding slow disbursements in the initial months of 2010, an acceleration of
public investment growth is expected thanks to the availability of financing and advanced stage of most
projects under the TKK program, as well as a recovery of investments from state-owned enterprises
(Figure 60).
19
The first stimulus package ―SP1‖ was approved in January 2009 with a total amount of 93.4 billion baht, of which
only a quarter or 22 billion baht was earmarked for investment projects (construction and equipment). The second
stimulus package ―Thai Khem Kaeng‖ (TKK) has two tranches already approved by the cabinet; the first tranche
was approved in September 2009 with the total budget of 200 billion baht and the second tranche was approved in
October 2009 worth 150 billion baht.
0.2
-3.65
3.40
-4
-3
-2
-1
0
1
2
3
4
2000-2008 average
2009 2010 f
Contribution of inventories to yearly GDP growth (percentage points)
Q1 Actual: 1.88
Q2-Q4 (proj.): 1.52

40 ‹‹ THAILAND ECONOMIC MONITOR JUNE 2010
Figure 60. Public investment picked up
modestly in 2009 as government construction
accelerated.
Figure 61. Except for consumption-based items
such as agricultural insurance, disbursements
under the TKK budget have been slow.
Source: NESDB and World Bank staff calculations.
Source: CGD and World Bank staff calculations.
Public investment growth in 2009 was led by new construction investments by both central
government and local administrative organizations. Public investment in construction grew by 5.9
percent year-on-year in 2009. High construction growth in the second quarter was due to the accelerated
disbursement in capital expenditures from central and local governments, particularly on road
construction and infrastructure projects, while SOEs also continued construction projects on natural gas
pipelines. Investment projects under the stimulus packages helped raise public investment only
marginally and at the end of FY09 the disbursement rate of SP1‘s investment projected was at 49 percent.
Projects that have disbursement rates exceeding of 80 percent are construction projects within the village,
water resources for farmers, and the construction of 532 residences for policeman. Economic Sufficiency
Program remained under disbursed of only 33 percent.
The TKK Program impact on public investment growth in 2010 will be positive, but modest, as
implementation lags. Although budgeted capital expenditures of the central government are expected to
decrease by 50 percent in FY10 from the previous year, TKK investment projects will more than
compensate for this reduction. Around two-thirds of the 350 billion baht (230 billion baht) budget is to be
spent on construction and equipment, of which around 55 percent or 1.3 percent of GDP is expected to be
disbursed in 2010. As of June 2010, around 60 percent of 350 billion baht or 181 billion baht has been
disbursed from TKK program (Figure 61), of which around 20 percent was for investment spending.
Unspent investment budget from SP1 carried forward to FY10 are estimated at 11 billion baht or 50
percent of the total approved investment projects. As of June 2010, only ten percent of SP1‘s carry
forward budget has been disbursed since the disbursement of Economic Sufficiency Program which takes
the largest share of 90 percent to total carry forward has not made any progress from the last fiscal year.
With the contribution from TKK program, total public investment in 2010 will increase by 2.9 percent
from that of last year (Figure 62). However, its share to GDP remains relatively the same level as of the
previous year (Figure 63).
-30
-25
-20
-15
-10
-5
0
5
10
15
20
25
Q1/0
8
Q2/0
8
Q3/0
8
Q4/0
8
Q1/0
9
Q2/0
9
Q3/0
9
Q4/0
9
Perc
ent,
yoy
Construction
Equipment
Public investment
Jo
b c
rea
tio
n fo
r
be
tte
r q
ua
lity o
f lif
e
Ba
sic
infr
astr
uctu
re
Fo
od
an
d e
ne
rgy
se
cu
rity
Qu
alit
y
en
ha
nce
me
nt in
E
du
ca
tio
n
Oth
ers
i.e
. p
rice
insu
ran
ce
Inco
me
en
ha
nce
me
nt fr
om
T
ou
rist se
cto
r
Co
un
try's
ne
w
so
urc
e o
f in
co
me
Qu
alit
y
en
ha
nce
me
nt in
P
ub
lic h
ea
lth
Bill
ion
ba
ht
Approved budget
Disbursement

41 ‹‹ THAILAND ECONOMIC MONITOR JUNE 2010
Figure 62. TKK investments will make up for a
near halving of on-budget public sector
investments.
Figure 63. The modest overall increase will
keep the share of public investment to GDP
practically constant.
Source: FPO, PDMO, BoB, and World Bank calculations.
Note: CY is calendar year
Source: NESDB and World Bank staff calculations.
2.4.2 Fiscal Framework
Fiscal policy has been expansionary as the government responded to the global financial crisis with
two rounds of stimulus measures. The fiscal deficit spiked in 2009, coming in at 376 billion baht or 4.2
percent of GDP for the fiscal year ended in September. The deficit was driven by the sharp decline in
revenues due to the global financial crisis (accounting for about 2.6 percentage points of the deficit), the
first round of stimulus (1.1 percentage points) and the lower denominator (0.4 percentage points). A
supplementary budget of 116.7 billion baht, of which 97.6 billion baht (1.1 percent of GDP) was used to
finance the first round of stimulus measures, was approved by Parliament in February 2009 along with tax
reductions costing around 0.45 percent of GDP. The emphasis of the first round of stimulus was on
consumption measures for quick implementation.
The first round of stimulus was reasonably well implemented, meeting most of the four “Ts”
(timely, temporary, targeted and transparent) that characterize well-designed packages. Although
the impact of the first stimulus package on overall GDP is likely to have been small, the consumption-
focused measures, most notably direct cash transfers through 2,000-baht checks, were certainly timely,
being implemented between March and May, 2009, and helped stem a further decline in consumer
confidence. Although measures were imperfectly targeted (given the focus on timeliness of
implementation), some programs, especially the 500-baht pension to the elderly not enrolled in social
security, likely supported the livelihoods of vulnerable households. The stimulus package proved to
contain mostly temporary measures, but some programs were incorporated in the regular budget (notably
the elderly pension and 15 years of free education). Finally, the program was transparently implemented
through a supplementary budget, which was appreciated and approved by the parliament.
The deficit is expected to decline to 2.4 percent of GDP in FY10 as revenues recover and spending
growth is restrained by slow disbursements of TKK expenditures. Because expenditures cannot
exceed expected revenues plus financing, the borrowing ceiling imposed by the PDM act effectively
207 201103
129 130
122
263 260
218
11
5
122
49
0
100
200
300
400
500
600
CY2008 2009 2010F
Bill
ion
bah
t
SP2 (Others)
SP2 (Emergency Decree: Bt350 bn)
SP1
SOEs
Local Administrative Org.
CG (on-budget)
-5
0
5
10
15
20
6.0
6.5
7.0
7.5
CY
20
03
20
10F
Pe
rce
nt
Perc
ent
Public investment/GDP
Public investment growth (RHS)

42 ‹‹ THAILAND ECONOMIC MONITOR JUNE 2010
limits the overall on-budget expenditures to 125 percent of expected revenues.20
Since the budget for
fiscal year 2010 was prepared at the height of the crisis, revenue estimates were low (1.35 trillion baht)
and constrained on-budget expenditures to 1.7 trillion baht. The off-budget TKK program announced in
April 2009 aimed at maintaining public investments in the face of the severe constraints to the budget
envelope, but also to boost public investments beyond previous levels, providing a second round of
stimulus. Based on current revenue estimates (1.6 trillion baht), the magnitude of the overall fiscal deficit
in FY10 will primarily be a function of the off-budget TKK program expenditures. But as discussed in the
previous section, disbursements have been relatively slow. Therefore, the temporary nature of most
consumption measures under the first round of stimulus, tight on-budget expenditures, and low
disbursements under the TKK program will lead to a lower deficit of 2.4 percent of GDP in FY10.
The FY11 budget announced in January 2010 implies an overall deficit of between 3.5 and 5.0
percent of GDP depending on the extent of TKK projects financed off-budget. The government
announced in January a 2.07 trillion baht (20.1 percent of GDP) budget for FY11. Depending on the level
of investment expenditures from the TKK program financed from off-budget sources, overall FY11
expenditures could amount to between 20 and 22 percent of GDP. The government forecast revenues for
FY11 at 1.65 trillion baht (16.0 percent of GDP), below World Bank forecasts of 16.8 percent of GDP or
1.73 trillion baht. The FY11 budget contains a number of large ―headline‖ increases – the announced
level of spending represents a 22 percent increase over the FY10 budget, whereas the investment budget
(341 billion baht, about 16.5 percent of the total budget) was announced as an increase of about 100
billion baht (over 25 percent) from FY10. However, some TKK investments have now been moved on-
budget. The exit from fiscal stimulus will imply a gradual move of TKK projects into the budget, with
some projects perhaps taking longer to be implemented (i.e., entering the budget beyond FY12) or even
being scrapped.21
The extent of debt-financed disbursements under the TKK program remains the largest question
mark over the next two years and is the key to Thailand‟s exit from fiscal expansion. Current
assumptions are for about 230 billion baht in off-budget TKK expenditures in FY10, in line with funds
available through the Emergency Decree. In FY11 TKK off-budget expenditures may be as high as 460
billion baht depending on the pace of implementation of the underlying projects. Based on the limited
prospects for additional off budget financing, however, this figure is likely to be far lower and as low as
80 billion baht. This implies that the actual deficit may vary by as much as 1.5 percentage points of GDP.
Table 7 below summarizes the government‘s fiscal framework and borrowing plans for FY10-FY13.
20
Following the 1997 Asian financial crisis, the public debt management law limits domestic borrowing in any
fiscal year to 20 percent of approved expenditures (including the supplementary budget) plus 80 percent of budgeted
principal repayments. 21
Dust-free roads are one example. There are plans for 901 roads (3,246 kilometers) at a cost of 14.8 billion baht
this year, and an additional 1,984 kilometers are planned for next year at a cost of 9.8 billion baht. The projects have
been the subject to corruption allegations, and the deputy Prime Minister has mulled scrapping them.

43 ‹‹ THAILAND ECONOMIC MONITOR JUNE 2010
Table 7. The contribution of the off-budget TKK program is likely to decline sharply as investment
projects are moved on-budget.
Source: FPO, PDMO, and World Bank staff calculations.
Because some programs introduced as part of the stimulus packages have become ongoing, the
government is looking for new sources of revenue such as a land tax. Revenues are expected to return
to their historical average of about 17.3 percent of GDP in the medium term, but this will not be sufficient
for a rapid reduction in debt levels given that expenditures are expected to increase by two percentage
points of GDP to accommodate new programs such as the twelve years of free education, pensions to the
elderly and other social programs being contemplated by the government. The government is therefore
analyzing measures to boost revenue. A possible increase in the value-added tax rate was considered but
scrapped. However, a land tax, which would increase funds directly available to local governments and
reduce transfers from the central government, was submitted to parliament. The new tax would impose an
annual charge on land assets and property nationwide, with local administrations given flexibility in
setting rates based on their community development priorities. Rates would vary depending on the use of
the property, whether for agriculture, commercial or residential use. Currently, 90 percent of tax revenue
comes from taxes on income (including the value-added tax), with only ten percent assessed on assets.
The goal is to expand the tax base and strengthen the revenue-raising capacity of local governments,
which would reduce the need for subsidies from the central government to local administrations.
As long as growth returns to its long-term trend, debt levels decline – albeit very slowly – even with
a higher equilibrium level of expenditures. Under the baseline scenario, Thailand‘s public debt-to-GDP
ratio does not exceed 50 percent, and ratios start to slowly decline in 2015.22
After an initial spike due to
the substantial financing needs that arise from the TKK program (Figure 64 below), debt ratios resume
their downward trend, albeit very slowly. The debt-to-GDP ratio is expected to be approximately 48
percent of GDP by 2020 following a peak of 49 percent in 2014. The slow decline under the baseline
arises from conservative assumptions on fiscal deficits, which remain higher than their post-crisis average
22
In addition to the projections described in Table 7above, the baseline scenario assumes that real GDP growth
converges to its potential of 5.0 percent by 2014 and the primary public sector balance moderates to a deficit of 2.3
percent of GDP. The baseline scenario incorporates the impact of the stimulus packages, which can be seen in the
high budget deficit of 2009-2012 averaging 3.5 percent of GDP, well above the post-98 crisis average of 0.9 percent
of GDP. Levels of new foreign and domestic borrowing are consistent with the government‘s proposed funding
sources for the stimulus package.
(Fiscal Years) 2004 - 2008 av 2009 2010 2011 2012 2013 2020
Fiscal Framework (percent of GDP)
Revenues 17.6 15.9 16.5 16.7 16.8 16.9 17.3
Expenditures 18.2 21.8 18.9 20.4 19.5 19.4 19.2
of which off-budget TKK expenditures … … 2.4 1.3 0.7
Non-budgetary Balance -0.1 1.5 -0.2 -0.2 -0.2 -0.2 -0.2
Fiscal Deficit -0.8 4.4 2.7 3.9 2.9 2.7 2.1
Memo: on-budget borrowing ceiling 5.0 3.9 4.0 4.3 4.4 4.3
Off-Budget TKK Expenditures (THB billion)
Planned … 14.6 342.6 503.8 411.7
Expected 1/ … 14.6 232.1 149.6 111.1
Financing Identified 2/ … 14.6 205.5 64.8 76.3
1/ Transfer of TKK expenditures on-budget are reflected as lower expected off-budget expenditures.
2/ Includes the Emergency Decree and debt-financed SOE investments

44 ‹‹ THAILAND ECONOMIC MONITOR JUNE 2010
throughout the projection period to account for increased expenditures whereas no revenue measures are
assumed.
Public debt sustainability is generally resilient to worst-than-expected outcomes in 2011-2012, but a
temporary or permanent shock to growth could lead to an upward path of external debt. The DSA
considered the effect on debt sustainability of (i) a real GDP contraction of 4.7 percent in FY12 (similar
to that experienced in FY09); (ii) a 30-percent nominal depreciation of the Thai baht; and (iii) the
realization of contingent liabilities adding up to ten percent of GDP (Table and Figure 64). The GDP
shock is the most severe, leading the debt-to-GDP ratio to peak at 63 percent and setting it on an
increasing path. However, the greatest risks to debt sustainability come from protracted growth slowdown
and lack of fiscal consolidation following the resumption of growth. Should deficits remain close to their
FY09 levels, the debt-to-GDP ratio remains on a rising trend and would remain above 50 percent and on
an increasing trend in the longer term. This highlights the importance of ensuring that deficits are reduced
in the medium-term. The scenario with permanently low growth also leads to rapidly increasing debt
ratios (Figure 64). This emphasizes the importance of taking advantage of the crisis to enhance
competitiveness and ensure a return to sustainable growth.
Figure 64. Shocks to growth could result in a persistent
deterioration of Thailand‟s debt levels.
Source: World Bank staff calculations based on data from PDMO, FPO and BoT.
Per
cent
of G
DP
Baseline
Historical scenario
Lower long-term growth
Shock to Growth

45 ‹‹ THAILAND ECONOMIC MONITOR JUNE 2010
Table 8. Thailand‟s debt profile is resilient to one-off shocks, but lower growth rates would lead to
increasing levels of debt. (Fiscal Years)
Source: World Bank staff calculations based on data from PDMO, FPO and BoT.
Maintaining focus on public financial management reforms will help ensure medium term fiscal
sustainability is maintained, by achieving allocative and operational efficiency of public spending.
The PEFA assessment highlighted that overall credibility of the budget is high, however there is need to
better align the budgeting and financial reporting systems in order for the government to improve
monitoring of budget spending, including on SP-2. Furthermore, the assessment noted that the building
blocks for medium term policy based budgeting have been put in place, and these have to be further
refined to provide a set of medium term forward estimates, in order to ensure that medium term macro-
fiscal and government action plan is more systematically linked with budgetary appropriations. A
summary of the PEFA assessment is presented in Box 6 below.
Box 6. Public Expenditure and Financial Accountability: Summary Findings23
The Public Expenditure and Financial Accountability (PEFA) report aims to assess the status of the public
financial management (PFM) system in Thailand across six core dimensions of PFM performance using
the standard PEFA methodology of 28 high-level indicators. The report was conducted in 2009 in
collaboration with the Thai government.
Dimension 1: Credibility of the Budget
The PFM system in Thailand performs well overall on credibility of the budget. The budget is
realistic and is implemented as intended. The actual expenditure deviated from the approved amount by
more than ten percent in only one year during 2007-09 (study period). The variance in expenditure
composition exceeded the overall deviation in expenditure by no more than 2.5 percent in all of these
three years. The actual domestic revenue collection also exceeded the budgeted amount, while the stock
of arrears of central government expenditure (including expenditure from revolving funds) has been
negligible throughout the period under review. There are no records of any arrears.
However arrangements governing execution of the Central Fund allow significant flexibility. Approximately 14 percent of total budget is put in a Central Fund. Nearly five-sixth of this Central Fund
is predetermined for statutory expenditures, while the remaining is put in a pure contingency. Detailed
23
The full report can be accessed at www.worldbank.or.th.
2010 2011 2012 2013 2014 2015 2020
Baseline 45 48 48 49 49 49 47
A. Alternative scenarios
A1. Real GDP growth and primary balance are at historical averages 45 45 45 45 46 46 47
A2. Primary balance is unchanged from 2009 45 51 56 61 65 70 90
A3. Permanently lower GDP growth 1/ 45 48 49 50 51 52 58
B. Bound tests
B1. Real GDP growth contracts by 4.7 percent in 2012 45 47 54 55 57 58 61
B2. One-time 30 percent real depreciation in 2011 45 49 50 50 49 49 47
B3. 10 percent of GDP increase in other debt-creating flows in 2011 45 57 57 57 57 56 52
Debt-to-GDP Ratio
Projections
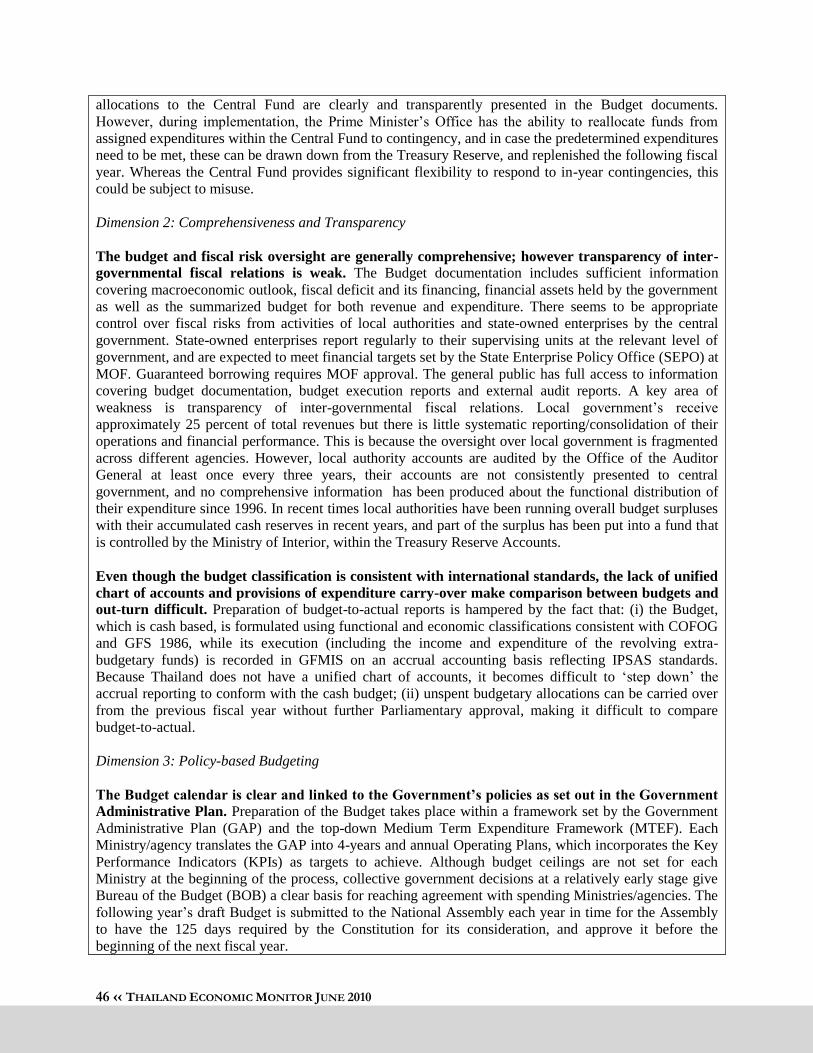
46 ‹‹ THAILAND ECONOMIC MONITOR JUNE 2010
allocations to the Central Fund are clearly and transparently presented in the Budget documents.
However, during implementation, the Prime Minister‘s Office has the ability to reallocate funds from
assigned expenditures within the Central Fund to contingency, and in case the predetermined expenditures
need to be met, these can be drawn down from the Treasury Reserve, and replenished the following fiscal
year. Whereas the Central Fund provides significant flexibility to respond to in-year contingencies, this
could be subject to misuse.
Dimension 2: Comprehensiveness and Transparency
The budget and fiscal risk oversight are generally comprehensive; however transparency of inter-
governmental fiscal relations is weak. The Budget documentation includes sufficient information
covering macroeconomic outlook, fiscal deficit and its financing, financial assets held by the government
as well as the summarized budget for both revenue and expenditure. There seems to be appropriate
control over fiscal risks from activities of local authorities and state-owned enterprises by the central
government. State-owned enterprises report regularly to their supervising units at the relevant level of
government, and are expected to meet financial targets set by the State Enterprise Policy Office (SEPO) at
MOF. Guaranteed borrowing requires MOF approval. The general public has full access to information
covering budget documentation, budget execution reports and external audit reports. A key area of
weakness is transparency of inter-governmental fiscal relations. Local government‘s receive
approximately 25 percent of total revenues but there is little systematic reporting/consolidation of their
operations and financial performance. This is because the oversight over local government is fragmented
across different agencies. However, local authority accounts are audited by the Office of the Auditor
General at least once every three years, their accounts are not consistently presented to central
government, and no comprehensive information has been produced about the functional distribution of
their expenditure since 1996. In recent times local authorities have been running overall budget surpluses
with their accumulated cash reserves in recent years, and part of the surplus has been put into a fund that
is controlled by the Ministry of Interior, within the Treasury Reserve Accounts.
Even though the budget classification is consistent with international standards, the lack of unified
chart of accounts and provisions of expenditure carry-over make comparison between budgets and
out-turn difficult. Preparation of budget-to-actual reports is hampered by the fact that: (i) the Budget,
which is cash based, is formulated using functional and economic classifications consistent with COFOG
and GFS 1986, while its execution (including the income and expenditure of the revolving extra-
budgetary funds) is recorded in GFMIS on an accrual accounting basis reflecting IPSAS standards.
Because Thailand does not have a unified chart of accounts, it becomes difficult to ‗step down‘ the
accrual reporting to conform with the cash budget; (ii) unspent budgetary allocations can be carried over
from the previous fiscal year without further Parliamentary approval, making it difficult to compare
budget-to-actual.
Dimension 3: Policy-based Budgeting
The Budget calendar is clear and linked to the Government‟s policies as set out in the Government
Administrative Plan. Preparation of the Budget takes place within a framework set by the Government
Administrative Plan (GAP) and the top-down Medium Term Expenditure Framework (MTEF). Each
Ministry/agency translates the GAP into 4-years and annual Operating Plans, which incorporates the Key
Performance Indicators (KPIs) as targets to achieve. Although budget ceilings are not set for each
Ministry at the beginning of the process, collective government decisions at a relatively early stage give
Bureau of the Budget (BOB) a clear basis for reaching agreement with spending Ministries/agencies. The
following year‘s draft Budget is submitted to the National Assembly each year in time for the Assembly
to have the 125 days required by the Constitution for its consideration, and approve it before the
beginning of the next fiscal year.

47 ‹‹ THAILAND ECONOMIC MONITOR JUNE 2010
Multi-year perspective in fiscal planning, expenditure policy and budgeting are presented, however
outer year estimates remain indicative. BOB prepares the 4-year Medium Term Expenditure
Framework (MTEF) consistent with the GAP. The outer year projections are indicative and not binding.
Despite the emphasis on 4-years Operating Plan, with KPIs set for the whole period, it does not appear
that general medium-term planning objectives have yet been translated into costed strategies at the sector
level. Investment planning hitherto has focused mainly on identifying and specifying a series of priority
projects to be implemented as budgetary headroom and external borrowing permits.
Dimension 4: Predictability and Control
The budget is implemented in an orderly and predictable manner and the arrangements for
exercise of control and stewardship in the use of public funds is robust. The budget is implemented as
planned. The Comptroller General‘s Department (CGD) at the Ministry of Finance (MoF) manages
budget execution through the consolidated Treasury Reserve Accounts. Cash flow management through
cash reserve system and T-Bill issuance ensures that the executing agencies will have cash available to
meet their payments, within their appropriated budget throughout the fiscal year.
Internal controls and audits are consistent with international standards, but the systematic process
to review the audit findings as well as the follow-up action from management levels has been lack. Internal control standards are based on the international benchmark of COSO‘s five components
including (i) environment of the control entity; (ii) risk assessment; (iii) control activities; (iv)
information technology and communications; and (v) assessment. The CGD has issued internal audit
standards that are consistent with the International Institute of Internal Auditors Standards. There is no
systematic process to submit the internal audit reports to the CGD in order for them to evaluate whether
there is a need to amend or modify the internal audit standards. No evidence is available about
management responses to internal audit reports.
Controls over civil service pay and numbers appear to have worked satisfactorily, while controls
over procurement can be further strengthened. Although personnel and payroll records are not directly
linked, the payroll is supported by full documentation of changes to the personnel records and payroll.
Established procedures ensure that the payroll is revised each month to reflect changes in personnel
records. Payroll payments have been regularly examined by OAG on a test basis as part of the regular
financial audit of expenditure. With regards to procurement, about two thirds of contracts (by value) are
procured using competitive methods.
However, the joint WB/CGD study showed that there are a number of areas where the competitive
process could be strengthened, concerning for example arrangements for the pre-qualification of
bidders, the extent of preferences for public sector suppliers and the transparency of arrangements
for tender specifications. Complaints may be made directly to the head of tendering authority, to CGD,
and to the courts. The CGD is aware of instances of complaints going to the courts, but there is a lack of
systematic record of the numbers, the reasons for the complaints, or the outcomes.
Dimension 5: Accounting, Recording and Reporting
Consolidated central government financial statements cover revenue, expenditure and financial
assets and liabilities, but since the introduction of GFMIS in 2005, it has been difficult to reconcile
inconsistencies between data entered into different parts of the system. Most receipts and expenditure
passing through GFMIS are automatically reflected in movements in the TRA at BoT, and reconciliation
is straightforward provided sufficient information is included about the characteristics of individual
payments and receipts. Statements are intended to be presented on a modified accruals basis which

48 ‹‹ THAILAND ECONOMIC MONITOR JUNE 2010
generally reflects IPSAS. The consolidated financial statements are submitted for external audit within 10
months of the end of the fiscal year, however because of reconciliation difficulties the consolidated
financial statements have been not certified by OAG since 2005. The authorities are working on ensuring
these data inconsistencies are effectively addressed and reconciled so that FY2009/10 and preceding years
consolidated report can be certified appropriately by the OAG.
Dimension 6: External Scrutiny and Audit
The scope, nature and follow-up of external audits are well established, but there is a lack in the
legislative scrutiny of external audit reports. The OAG performs audits in the areas of financial,
performance, procurement, subsidy use, tax collection and other specific audits, covering all central
government revenue and expenditure, including revolving funds together with financial statement from
SOEs as well as local authorities. The OAG presents the annual report to the Parliament and findings
debated. There is little evidence, however, of systematic follow up by Ministries/agencies in response to
its findings and recommendations. The Auditor-general‘s annual report is presented to a plenary session
of the National Assembly, but there are no established arrangements for its subsequent detailed
consideration by a specialised committee. There is no evidence of any recommendations being issued by
the National Assembly in response to the OAG annual report.
2.5 Monetary Policy and Capital Flows With inflation and short-term capital inflows subdued, the monetary and exchange rate outlook
will follow the pace of tightening in other East Asian countries. East Asian emerging economies have
started to tighten monetary policy, well ahead of still-ailing advanced economies. This movement will
increase interest rate differentials and put further pressures for East Asian currencies to appreciate –
development central banks in the region have attempted to manage. Therefore, given the dependence of
the Thai economy on exports and its role in global supply chains, tightening will likely be somewhat
coordinated. China and India were the first to tighten monetary policy through higher bank reserve
requirements and interest rate hikes. Following three interest rate hikes in Malaysia in March, May and
June and one in Korea and Taiwan, the Bank of Thailand raised rates in its July meeting; Indonesia is
likely next as the recovery in those economies picks up steam. These moves are also likely to be followed
by gradual exchange rate appreciation (as signaled by the recent move by China to resume moderate
appreciation of the yuan). Given political and regulatory uncertainty that have made Thai assets less
buoyant than others in the region as well as subdued core inflation, Thailand is likely to follow the
tightening cycle, as evidenced by the BoT‘s relatively late entry into the tightening club.
2.5.1 Inflation and Monetary Policy Stance
Although expectations need to be monitored, the inflation outlook is subdued. Thailand‘s headline
CPI increased 3.3 percent year-on-year in June whereas core prices rose 1.1 percent. Prices of food,
beverages and retail oil prices continued to be the key drivers, explaining the difference between core and
headline numbers. Agricultural goods prices overall have risen, partly due to the widespread drought that
has now affected 53 provinces, but rice prices have been declining as the government continues to hold
large stocks (Figure 54). Year-on-year readings will remain relatively high due to base effects, but price
levels are likely to remain below their long-term trend (Figure 65). This is likely to keep the Bank of
Thailand primarily concerned with the economic recovery despite higher inflation readings, but as
suggested by the recent rate hike, the BoT wants to send clear signals and keep inflation expectations low.
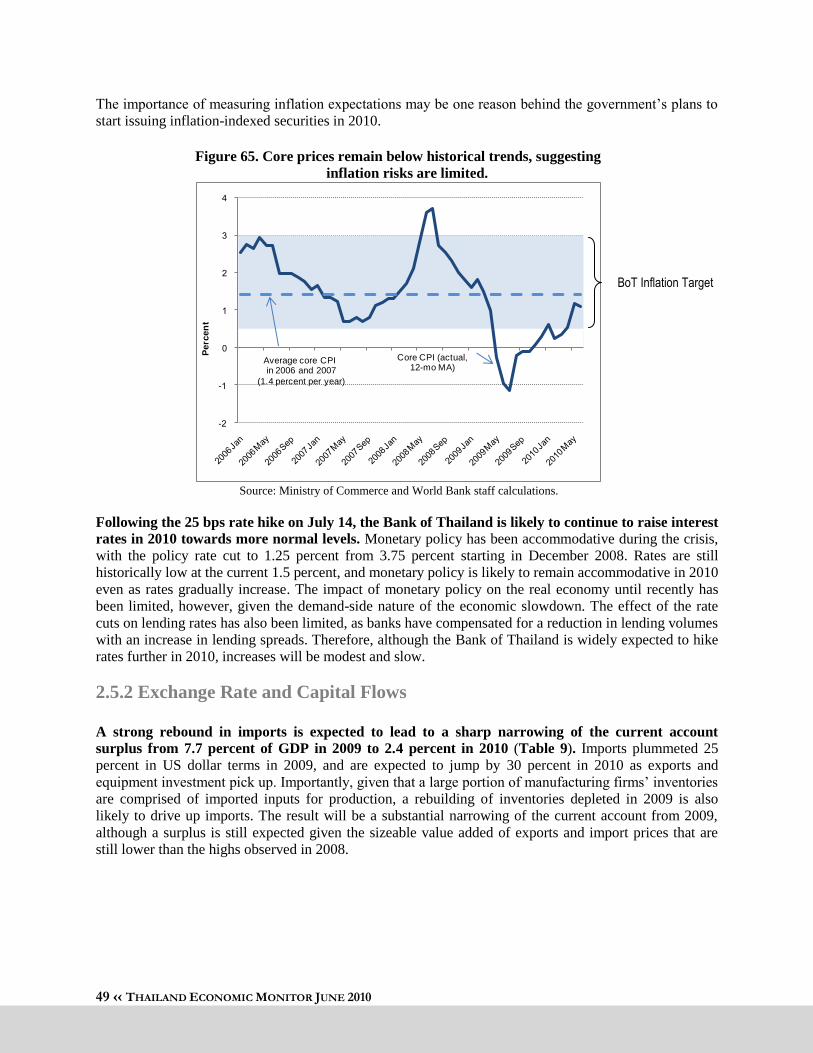
49 ‹‹ THAILAND ECONOMIC MONITOR JUNE 2010
The importance of measuring inflation expectations may be one reason behind the government‘s plans to
start issuing inflation-indexed securities in 2010.
Figure 65. Core prices remain below historical trends, suggesting
inflation risks are limited.
Source: Ministry of Commerce and World Bank staff calculations.
Following the 25 bps rate hike on July 14, the Bank of Thailand is likely to continue to raise interest
rates in 2010 towards more normal levels. Monetary policy has been accommodative during the crisis,
with the policy rate cut to 1.25 percent from 3.75 percent starting in December 2008. Rates are still
historically low at the current 1.5 percent, and monetary policy is likely to remain accommodative in 2010
even as rates gradually increase. The impact of monetary policy on the real economy until recently has
been limited, however, given the demand-side nature of the economic slowdown. The effect of the rate
cuts on lending rates has also been limited, as banks have compensated for a reduction in lending volumes
with an increase in lending spreads. Therefore, although the Bank of Thailand is widely expected to hike
rates further in 2010, increases will be modest and slow.
2.5.2 Exchange Rate and Capital Flows
A strong rebound in imports is expected to lead to a sharp narrowing of the current account
surplus from 7.7 percent of GDP in 2009 to 2.4 percent in 2010 (Table 9). Imports plummeted 25
percent in US dollar terms in 2009, and are expected to jump by 30 percent in 2010 as exports and
equipment investment pick up. Importantly, given that a large portion of manufacturing firms‘ inventories
are comprised of imported inputs for production, a rebuilding of inventories depleted in 2009 is also
likely to drive up imports. The result will be a substantial narrowing of the current account from 2009,
although a surplus is still expected given the sizeable value added of exports and import prices that are
still lower than the highs observed in 2008.
-
-
P
erc
en
t
Core CPI (actual,12-mo MA)
Average core CPI in 2006 and 2007
(1.4 percent per year)
BoT Inflation Target

50 ‹‹ THAILAND ECONOMIC MONITOR JUNE 2010
Table 9. The current account surplus is projected to narrow substantially as import prices
and volumes recover in 2010.
2007 2008 2009 2010p
Exports of Goods 151,258 175,232 150,743 175,712
(% change) 18.2 15.9 -14.0 16.6
Imports of Goods 138,477 175,604 131,356 170,379
(% change) 9.1 26.8 -25.2 29.7
Trade Account 12,781 -371 19,387 5,332
as % GDP 5.17 -0.14 7.35 1.74
Net services income & transfers 2,900 1,525 874 1,869
Current Account 15,681 1,154 20,262 7,201
as % GDP 6.3 0.4 7.7 2.4
Capital and financial account including net errors and
omissions 1,420 23,539 3,685 -6,113
Balance of payments 17,101 24,693 23,947 1,088
Foreign Reserves (year-end) 87,455 111,008 134,327 135,415
Source: Bank of Thailand
The capital account posted modest outflows in 2009 as the economic crisis led to a slowdown in FDI
and the political crisis limited foreign portfolio inflows (Table 10). In 2008, the health of the Thai
financial sector as well as liberalization measures led to large inflows, especially by banks. In 2009,
portfolio outflows from Thais seeking higher yields overseas offset continued strong inflows from banks.
FDI and foreign portfolio inflows were muted due to the ongoing political crisis, which effectively acted
as a tax on ‗hot‘ foreign capital inflows. In the first quarter of 2010, a slowdown in bank inflows was
offset by portfolio inflows and a pick-up in FDI, leading to strong capital inflows.
Table 10. Partly due to political uncertainties, foreign portfolio inflows were modest,
accounting for less than 0.5 percent of GDP. 2008 2009 2010
Q1 Q2 Q3 Q4 Q1
1. Monetary authorities 61 -149 -56 1,736 -50 591
2. Government -502 -809 -107 491 123 775
3. State Enterprises -2,419 -765 -237 -535 -467 -178
4. Bank 10,602 -2,180 1,142 4,407 5,010 216
5. Non-Bank Private 6,862 704 -4,207 -3,252 -1,965 3,838
FDI 7,574 1,336 1,021 1,435 1,534 1,671
- Equity investment 7,776 1,538 1,483 1,375 1,726 1,754
- Direct loans -202 -202 -462 60 -192 -83
Portfolio 53 552 -4,675 -3,905 -2,259 699
- Foreign -1,059 154 287 883 -50 343
- Equity securities -1,372 224 224 745 -164 393
- Debt securities 313 -70 63 138 114 -50
- Thai 1,111 398 -4,962 -4,788 -2,209 356
Loans (foreign) 776 4 -189 -234 -989 421
Trade Credits 714 -1,156 501 692 580 1069
Others -1,540 -1,188 -364 -548 -251 1,048
Total capital flows 14,604 -3,199 -3,465 2,848 2,652 5,242
Source: Bank of Thailand
51 ‹‹ THAILAND ECONOMIC MONITOR JUNE 2010
The balance of payments is likely to remain in surplus, putting pressure on the exchange rate. The
large current account deficit, small capital account outflows and sizeable unaccounted inflows led to a
balance of payments surplus of 24 billion US dollar or nearly ten percent of GDP in 2009 (Figure 66).
This surplus was reflected by a similar accumulation of foreign reserves, as the Bank of Thailand has
managed pressures for exchange rate appreciation by accumulating reserves and mopping up the resulting
liquidity through sterilization. Although the pace of domestic asset growth has steadily declined due to
the appreciation of the baht (which reduces the growth of net foreign assets in baht terms), domestic
liabilities were still growing by 10 percent year-on-year in May (Figure 67). As a result, the nominal
effective exchange rate has remained in line with that of other East Asian countries within global supply
chains (Figure 68). The cost of this policy has been limited since policy rates are low and economic
activity has been sufficiently subdued to convince private actors to leave baht liquidity at the Bank of
Thailand in exchange for low returns. Given the outlook of economic recovery and rate ―normalization‖
(i.e. increases) in 2010, the costs of ―managing exchange rate volatility‖ are bound to increase.
Figure 66. Capital flows are expected to remain positive, although the current account
surplus is likely to decline on rising imports.
Source: Bank of Thailand.
-
-
Q Q Q Q Q
Mill
ion
s o
f U
S d
olla
rs (
qu
art
erly f
igu
res)
Other (incl. errors & omissions) Government (incl. BoT & SOE)
Bank Net Portfolio Flows
Inward FDI Current Account
BoP -
-
-
Mil
lio
ns
of U
S d
oll
ars
(ye
arl
y fig
ure
s)
52 ‹‹ THAILAND ECONOMIC MONITOR JUNE 2010
Figure 67. Capital inflows remained high but the
pace of sterilization declined as appreciation of
the baht led to valuation losses on the stocks of
foreign reserves.
Figure 68. With the exception of Korea, since
October 2009 nominal effective exchange rates
across the region have been within 7 percent of their
pre-crisis levels.
Source: Bank of Thailand and World Bank staff calculations. Source: BIS and World Bank staff calculations.
As interest rates and sterilization costs head higher in 2010, the Bank of Thailand announced
capital account liberalization measures to help manage pressures on the exchange rate. The prospect
of managing the exchange rate in a rising interest rate environment is likely behind the Bank of
Thailand‘s announcement of new measures to liberalize the capital account and facilitate capital outflows
(see Table 11 for details and analysis of individual measures announced). The overall objective of the
policies is to allow higher portfolio and direct investments overseas by Thais, thus increasing the demand
by the private sector for foreign currency and reducing the need for the Central Bank to accumulate
reserves in order to reduce pressure on the baht. The expected result of these measures is a diversification
of foreign assets away from reserves and into Thai private sector assets abroad. Higher demand for dollar
liquidity reduces the need for sterilization in order to stabilize the exchange rate in line with other
countries, while maintaining an appropriate level of liquidity as the economy recovers and policy rates
increase.
Table 11. Measures announced by the Bank of Thailand on February 2, 2010 to facilitate capital
outflows. Area Measures
1. Investment
abroad
Limits have been lifted on foreign direct investment by Thai companies, and the limit on
overseas portfolio investments overseen by the Stock Exchange Commission (SEC) has
been raised from 30 billion to 50 billion US dollar. The limit for purchasing real estate
outside Thailand has been raised from five million to ten million US dollar per year. This is
the key policy change, which aims to rebalance Thailand‘s foreign assets from the Central
Bank to the private sector.
2. Foreign
exchange hedging
transactions
Importers and exporters in Thailand may unwind foreign exchange hedging transactions for
goods and services without Bank of Thailand‘s permission. This measure aims at
developing exchange rate markets and reflects a diminished concern with the capital
outflows that may result.
3. Corporate
treasury centers
Regulations on corporate treasury centers have been relaxed to allow an existing company
to conduct treasury center business and permit transfers of foreign currency funds between
the center and its affiliated companies in Thailand. The aim is to encourage multinational
companies having production base in Thailand to relocate their foreign exchange
management business into the country, supporting the government‘s policy in promoting
0
200
400
600
800
1000
1200
0
10
20
30
40
50
60
70
Ja
n-0
8
Ma
r-0
8
Ma
y-0
8
Ju
l-08
Se
p-0
8
No
v-0
8
Ja
n-0
9
Ma
r-0
9
Ma
y-0
9
Ju
l-09
Se
p-0
9
No
v-0
9
Ja
n-1
0
Ma
r-1
0
Ma
y-1
0
TH
B B
illio
n
Year-
on
-Ye
ar
Pe
rce
nt C
ha
ng
e
Net Foreign Assets
Monetary Base
Net Domestic Assets
Balance of Payments
(Last 12 months, RHS)
Aug
-
Oc
t-
De
c-
Fe
b-
Ap
r-
Ju
n-
Aug
-
Oc
t-
De
c-
Fe
b-
Ap
r-
Ju
n-
Inde
x (A
ug 2
008 =
100
) Hong Kong, China
China
Korea
Indonesia
Taiwan, China
Philippines
Malaysia
Thailand
Singapore
China 105.6
Philippines 98.2
Korea 88.0

53 ‹‹ THAILAND ECONOMIC MONITOR JUNE 2010
Thailand as Regional Operating Headquarter, which is a concern often heard from the
private sector.
4. Other measures Lending by Thai companies to non-affiliated companies abroad, which previously required
approval, is now allowed up to 50 million US dollar. The outstanding balance limits of
foreign currency accounts deposited with funds exchanged from Thai baht have been
raised. Source: Bank of Thailand.
External debt (both public and private) is low at around 70 billion US dollar or under 30 percent of
GDP, and do not pose a significant risk. About 40 percent of the external debt is short-term, but trade
credits represent over half of private short-term debt, while another 20 percent are inter-company loans.
Public external debt (primarily owed by state-owned enterprises) comprises 22 percent of total external
debt and only 2.5 percent is short-term. External debt service ratios are manageable at 6.5 percent of total
exports. Total external debt was about 50 percent of international reserves at end-2009. The stock of
private non-bank external debt declined in 2009 as large companies that would normally seek funding in
foreign markets switched to the domestic bond markets as liquidity was reduced in foreign markets in the
first half of the year.
2.6 Financial and Corporate Sector Developments
The Thai financial and corporate sectors remain sound and bank balance sheets continued to
strengthen in 2009. Commercial banks exceeded statutory capital adequacy ratios, with the average ratio
standing at 15.8 percent at end-2009, compared to the BIS requirement of 8.5. Although at the onset of
the crisis there was a concern that asset quality was bound to deteriorate, non-performing loans (NPLs)
actually declined: ratios of gross and net NPL to total assets stood at 4.9 and 2.7 percent at end-2009,
respectively. Large firms entered the crisis with strong balance sheets. Debt-to-equity ratios had been
declining and stood at about three times at the end of last year. Strong balance sheets allowed firms to
withstand the shock to their profits during the crisis and minimized disruptions during the recovery,
enabling firms to post solid financial results for 2009 as a whole.
2.6.1 Financial Sector
Stricter credit screening and improvements in risk management helped Thai commercial banks
maintain asset quality and boost their capital bases, but also contributed to a contraction in credit
to the private sector. Gross NPLs decreased from 401 billion baht in 2008 to 379 billion baht in 2009.
The ratio of NPLs to total loans also decreased, with gross NPL and net NPL ratio stood at 4.9 and 2.7
percent, respectively (Figure 69). Lower new/reentry NPLs, loan repayments, debt restructuring and
NPLs returning to performing status led to a reduction of bad credits by 22 billion baht. The slight
decrease in defaults contributed to a slight increase in capital funds, which, in addition to continued
profits, raised the average capital adequacy ratios (CARs) of Thai commercial banks as of December
2009 to 15.8 percent, of which 11.8 percent in Tier 1 capital. The flip side of the increased focus on asset
quality was a contraction in credit of commercial banks to businesses by six percent in 2009 (Figure 70).
As the economy recovers, commercial banks have been easing their loan conditions especially in the SME
and consumer loans segments, as evidenced by the pickup in the amount of outstanding loans in the
fourth quarter of 2009.

54 ‹‹ THAILAND ECONOMIC MONITOR JUNE 2010
Figure 69. Banks‟ capital continued to grow
thanks to a decrease in bad loans…
Source: Bank of Thailand and World Bank staff calculations.
Figure 70.…and loans overall, but credit growth
started to recover in Q4 of 2009.
Source: Bank of Thailand and World Bank staff calculations.
In contrast to sluggish commercial bank lending, SFIs posted 20 percent loan growth in 2009 as
part of the government‟s policy response to the global financial crisis. Over the past 15 years, credit
growth of SFIs has generally followed that of commercial banks. But in 2009 SFIs recorded credit growth
of 20 percent compared to a two-percent decline in commercial banks (Figure 71). This credit expansion
is due to a number of government schemes, implemented through SFIs, to assist firms affected by
commercial banks‘ tighter credit standards during the global financial crisis. These schemes include: (1)
an increase in the 2009 lending target of six SFIs and Krung Thai Bank from 625 and 300 billion baht to
927 and 350 billion baht, respectively; (2) a Portfolio Loan Guarantee scheme with a guarantee-fee
waiver program to help offset credit risks carried by lenders, which was offered until the end of March
2010; (3) an informal debt refinancing program to help borrowers at the grass-root level nationwide; (4) a
program of loans for sustainable employment that provided low-cost loans to businesses that could meet
Ministry of Labor standards with regard to employment retention; and (5) a concessional loan program to
assist the tourism and hospitality sector, which was seriously affected by the airport closure in late 2008
and weaker consumer spending (see Box 6 below for more on SFIs.)
Figure 71. In contrast to commercial banks,
SFIs expanded credit robustly in 2009.
Source: Bank of Thailand and World Bank staff calculations.
Figure 72. Despite the global financial crisis,
Thai banks were profitable for the ninth
consecutive year.
Source: Bank of Thailand and World Bank staff calculations.
D
EC
DE
C
DE
C
DE
C
DE
C
DE
C
DE
C
DE
C
DE
C
DE
C
DE
C
DE
C r
DE
C p
Perc
ent
Trilli
on T
HB
Capital Funds-LHS
Gross NPL - LHS
% CAR - RHS
% NPL to total loan - RHS
-
-
Q
-
Q
-
Q
-
Q
-
Q
-
Q
-
Q
-
Q
-
Q
-
pe
rce
nt g
row
th y
ea
r-on
-ye
ar
Credits to Business
Credits to Individuals
-20
-10
0
10
20
30
40
50
60
70
-2000
-1000
0
1000
2000
3000
4000
5000
6000
7000
Pe
rce
nt
Bill
ion
TH
B
Loan-CBs
Loan-SFIs
Loan Growth-CBs
Loan Growth-SFIs
-400
-300
-200
-100
0
100
Bill
ion
TH
B
55 ‹‹ THAILAND ECONOMIC MONITOR JUNE 2010
The Thai banking sector remained profitable during the crisis, further supporting the banks‟ solid
financial position. The commercial banking system recorded yearly net profit of 92 billion baht in 2009
(Figure 72). This represented a six percent decline from 2008 due to a fall in loan volumes and net interest
margins (NIM – see Figure 73). The spread between lending and deposit rates widened, but the NIM
declined from 3.4 percent in 2008 to 3.1 percent in 2009. The return on assets dropped marginally to 0.95
percent in 2009 from one percent in 2008. On the liability side, deposits in banking sector also contracted
as depositors responded to historically low deposit rates by shifting savings to other financial products
such as stocks, bonds, and mutual and retirement funds. Because loan volumes shrank more steeply than
deposits, liquidity in the commercial banking slightly increased and the adjusted loan-to-deposit ratio
averaged 86 percent in 2009 compared to 91 percent in 2008.
Figure 73. Commercial banks profits in the
second half of 2009 nearly returned to the pre-
crisis level.
Source: Bank of Thailand and World Bank staff calculations.
Figure 74. Thailand has high banking spreads in
comparison with other East Asian economies.
Source: World Bank (World Development Indicators).
With deposit rates following the policy rate sharply lower and relatively high banking spreads,
equities and bonds became more attractive to both investors and borrowers. The policy rate was kept
stable at 1.25 percent between April 2009 and July 2010. Banks responded through a reduction of deposit
and lending rates, but partly due to the increased focus on maintaining profitability in a difficult
environment, lending spreads also increased; lending spreads in Thailand in 2008 were already among the
highest in the region (Figure 74). These developments led investors and borrowers to look beyond the
traditional banking sector in 2009. In the past, deposits were the only financial product available for retail
customers and accounted for more than 90 percent of GDP. Since the late 1990s, however, the
government has actively promoted mutual funds through tax incentives, giving the stock and bond
markets a greater share of investments (Figure 75 and Figure 76). Borrowers, meanwhile, went into the
bond markets for a larger share of their financing (Figure 77 and Figure 78).
-1.5
-1
-0.5
0
0.5
1
1.5
2
2.5
3
3.5
-15000
-10000
-5000
0
5000
10000
15000
20000
25000
30000
35000
Q3 0
4
Q4 0
4
Q1 0
5
Q2 0
5
Q3 0
5
Q4 0
5
Q1 0
6
Q2 0
6
Q3 0
6
Q4 0
6
Q1 0
7
Q2 0
7
Q3 0
7
Q4 0
7
Q1 0
8
Q2 0
8
Q3 0
8
Q4 0
8
Q1 0
9
Q2 0
9
Q3 0
9
Q4 0
9
Q1 1
0
Perc
ent
Bill
ion T
HB
Net Profit NIM (RHS)
ROA (RHS)
1.30 1.32
2.95 3.05 3.06
4.264.55 4.56
4.965.11
Ko
rea
Ja
pa
n
Ma
lay
sia
Vie
tna
m
Ch
ina
Ph
ilip
pin
es
Ho
ng
Kon
g,
Ch
ina
Th
aila
nd
Sin
ga
po
re
Ind
on
es
ia
Pe
rce
nt
Interest rate spread
(lending rate minus deposit rate), 2008

56 ‹‹ THAILAND ECONOMIC MONITOR JUNE 2010
Figure 75. Investments in domestic bonds and
mutual funds have increased faster than GDP
over the past two decades.
Source: NESDB, BoT, SET, Thai Bond Market Association,
Association of Investment Management Companies, Office of
Insurance Commission, and World Bank staff calculations.
Figure 76. From a high of 90 percent, deposits
now comprise only 30 percent of assets.
Source: BoT, SET, Thai Bond Market Association,
Association of Investment Management Companies, Office of
Insurance Commission, and World Bank staff calculations.
Figure 77. The issuance of short-term bonds
expanded remarkably in 2008-09...
Source: Thai Bond Market Association and World Bank staff
calculations
Figure 78. … greatly increasing the stock of
domestic bonds.
Source: Thai Bond Market Association and World Bank staff
calculations
Note: 1/ FIDF bonds traded in the repurchase market operated
by BOT are excluded (93 billion baht)
Because of investor and borrower diversification as well as the government‟s borrowing needs to
finance fiscal stimulus, bond markets saw higher volumes of new issuance in 2009 and 2010. The
size of debt market also expanded from 11 percent of GDP in 1996 to 67 percent in 2009. Although
government bonds accounted for the bulk of new issuance (increasing 120 percent), corporate issuance
also picked up strongly, increasing by 55 percent in 2009 (Figure 78 and Table 12). The government
plans to issue more types of bonds such as public saving bond and Sukuk (Islamic) bonds. Perhaps
because of the active primary market, average trading volumes declined in 2009 compared to 2008
(Figure 79).
0
20
40
60
80
100
Pe
rce
nt
Deposit
Mkt Capitalization
Domestic Bond
Fund Business
Net Premium
Deposit30%
Net Premium1%
Market Cap 26%
Domestic Bond
27%Mutual Fund
NAV
8%
Private Fund 1%
Retirement Investment
7%
Fund16%
0
2000
4000
6000
8000
10000
12000
1999 2000 2001 2002 2003 2004 2005 2006 2007 2008 2009
Bill
ion
TH
B
Foreign Bonds Offshore Corp Bond
ST Com Paper LT Corp Bond
BoT/FIDF/PLMO Bond State enterprise Bond
T-Bills Government Bond
0
1000
2000
3000
4000
5000
6000
1999 2000 2001 2002 2003 2004 2005 2006 2007 2008 2009
Bill
ion T
HB
Foreign Bonds Corporate Debt Securities
BoT/FIDF/PLMO Bond 1/ State enterprise Bond
T-Bills Government Bond

57 ‹‹ THAILAND ECONOMIC MONITOR JUNE 2010
Table 12. The issuance of government securities picked up in 2009, as did long-term bonds by
commercial issuers.
Source: Thai Bond Market Association
Figure 79. The daily average trading value in the bond market increased significant in recent years
but declined in 2009.
Source: The Thai Bond Market Association, SET, and World Bank staff calculations.
Note: Bond outright trading value includes all transactions in government debt, corporate bonds, and foreign bond trading only.
Ongoing financial sector reforms aim to continue the deepening of Thailand‟s financial markets. The government approved the second Financial Sector Master Plan (FSMP) and the Capital Market
Development Master Plan (CMD) in November 2009. The five-year FSMP encourages competition
through new players and mergers and acquisitions. It aims to enhance the efficiency of the financial sector
by lowering structural funding costs. The plan also encourages the development of microfinance and
Islamic finance. Key measures include (i) reducing system-wide operating costs; (ii) promoting
competition and financial access; and (iii) strengthening financial infrastructure. Similarly, the SET is
implementing a five-year CMD master plan using four main strategies: (i) enhancing Thai capital
market‘s reliability; (ii) boosting liquidity; and (iii) building a strong foundation for growth; and (iv)
preparing for the bourse‘s demutualization. SET will also continue to develop the long-term domestic
capital market through the Capital Market Development Fund. Finally, to prepare for future expansion of
both SET and bond market under the capital market development plan, the Securities Clearing and
Settlement Unit of Thailand Securities Depository Co. Ltd. (TSD) was transferred to the Thailand
Clearing House Co. Ltd. (TCH). This development will bring the capital market‘s post-trade services to
be more in line with international standards. TSD acts as the central securities depository for stocks and
bonds using efficient and secure scrip-less systems while TCH will provide clearing and settlement
service within an appropriate risk management framework.
Type of Securities 2005 % % G 2006 % % G 2007 % % G 2008 % % G 2009 % % G
Government Debt Securities
Government Bond 188.90 10 30- 221.60 7 17 330.20 5 49 228.09 2 31- 501.84 5 120
T-Bills 494.00 25 13- 897.20 29 82 553.00 9 38- 421.00 4 24- 885.85 8 110
State enterprise Bond 100.14 5 47 69.73 2 30- 63.83 1 8- 122.09 1 91 99.62 1 18-
BoT/FIDF/PLMO Bond 988.28 50 211 1,001.60 33 1 4,124.55 66 312 9,272.38 82 125 8,419.34 77 9-
Corporate Debt Securities
Long-term Bond 152.73 8 25 142.57 5 7- 212.50 3 49 282.06 2 33 437.13 4 55
Commercial Paper 736.50 24 975.72 16 32 985.29 9 1 560.94 5 43-
Offshore 26.65 1 4.81 0 12.03 0 150
Foreign Bonds 7 0 9.1 0 30 9.77 0 7 18.09 0 85 12 0 34-
Total 1,957.70 100 3,078.30 100 6,269.57 100 11,333.81 100 10,928.75 100
0
10000
20000
30000
40000
50000
60000
70000
80000
0
2000
4000
6000
8000
10000
12000
14000
16000
18000
20000
Millio
n T
HB
Billio
n T
HB
Bond Trading Value
SET Turnover Value
Avg daily bond trading value (RHS)
Avg daily SET turnover value
58 ‹‹ THAILAND ECONOMIC MONITOR JUNE 2010
Box 7. Specialized Financial Institutions
Specialized financial institutions (SFIs) serve as an important tool of government credit policies.
There are eight SFIs in Thailand which provide financial assistance to specific sectors of the economy
(Table 13). The SFIs generally aim to meet gaps in access to affordable financial services to those often
overlooked by commercial banks. While the financial system continues to be dominated by commercial
banks, the SFIs represent a substantial share of 22 percent in 2009. The market share of SFIs, both in
terms of asset size and loan portfolio, has been increasing rapidly since 1994 (Figure 80). If one includes
the government‘s participation in some commercial banks, the government can be classified as the largest
financial services operator in Thailand with a share of 33 percent in total assets in 2009, more than twice
that of the largest bank. The three largest SFIs (Government Savings Bank, Bank for Agriculture and
Agricultural Cooperatives, and the Government Housing Bank) account for 94 percent of the capital of
the SFIs (Figure 81).
Table 13. SFIs have a mandate to support various sectors of the economy.
Source: Fiscal Policy Office
Figure 80. The market share of SFIs doubled
between 1994 and 2009.
Source: Bank of Thailand and World Bank staff
calculations.
Figure 81. The three largest SFIs account for 94
percent of SFIs total assets.
Source: Fiscal Policy Office
Corporate governance and transparency could be enhanced. SFIs operate independently of each other
and all come under the direct control of the Ministry of Finance (MOF). Boards of directors of these SFIs
are appointed and accountable to the MOF. In practice, a substantial number of directors in the SFIs and
Specialized Financial Institutions (SFIs) Role
Bank for Agriculture and Agricultural Cooperatives (BAAC) Promote better quality of life for farmers
Gov Saving Bank (GSB) Promote saving and support grass-root economy
Gov Housing Bank (GHB) Provide housing finance for low-income people
SME Development Bank (SME Bank) Provide financial services to SMEs
Export-Import Bank of Thailand (Exim Bank) Promote trade and support Thai exporters
Islamic Bank of Thailand (I-Bank) Provide financial services under Shariah principles
Small Business Credit Guarantee Corporation (SBCG) Provide credit guarantees to SMEs
Secondary Mortgage Corporation (SMC) Promote capital market and securitization business
0
20
40
60
80
100
Perc
ent
CBs in Total Asset CBs in Total Credit
SFIs In Total Asset SFIs in Total Credit
BAAC28%
GSB40%
GHB26%
SME Bank2%
Exim Bank2%
I-Bank2%
SBCGC0%
SMC0%

59 ‹‹ THAILAND ECONOMIC MONITOR JUNE 2010
state-owned commercial banks (SOCBs) are government officials (Table 14). SFIs are regulated by the
Fiscal Policy Office in the MOF, and subject to corporate governance rules applicable to State-Owned
Enterprises issued by the State Enterprise Policy Office. At present, ownership and supervisory/regulatory
functions are located in the MOF, creating potential conflicts of interest and undermining the
effectiveness of both roles. . In addition, unlike commercial banks, SFIs are not required to prepare their
accounts to meet with International Financial Reporting Standards and are instead only audited by the
Office of the Auditor General. External audits are typically not carried out by independent third parties
who are mandated to give an impartial view on their accounts in relation to the overall management, and
on governance in accordance with the normal prudential standards. Table 14. Government involvement in financial institutions ranges from fully directed to partially
influenced through an implicitly guarantee.
Source: Audited Financial Statements, MoF and Stock Exchange of Thailand
Note: CPB = The Crown Property Bureau, CPB Equity = CPB Equity Co. Ltd.
Stricter capital requirements and impartial operational oversight may desirable to minimize the
risk of realization of contingent liabilities related to SFIs. As state-owned institutions, SFI deposits are
guaranteed by the government (implicitly or explicitly) and their operations are exempted from
taxes/duties imposed by the Revenue Code. On the other hand, SFIs are not subject to Bank of Thailand
rules governing provisioning and capital requirements. Commercial banks have implemented IAS 39
standards in relation to provisions for bad loans since 2009 while SFIs were given an extension on the
compliance date until 2012. In the past, asset quality problems have occurred in some SFIs (Figure 82),
which are not bound by the prudential requirements of the central bank
SFI lending increased sharply in 2009 as part of the government‟s response to the global financial
crisis. Occasionally, the government has initiated various policy-based lending through SFIs, but only
Group 1 Group 2 Group 3
Bank BAAC, GSB, GHB, SME Bank Krung Thai Bank (KTB) Thai Military Bank (TMB), Siam City Bank
Exim Bank, I-Bank, SBCG, SMC (SCIB) and Siam Commercial Bank (SCB)
Gov participation More than 95% Financial Institutions Development TMB - MOF 22.56%
Fund (FIDF) - 55.31% SCIB - FIDF 47.58%
SCB - CPB 27.79% + CPB Equity 3.13%
Board of Director
Chairman
BAAC Minister of Finance KTB - Permanent Secretary, MOF TMB - Deputy Permanent Secretary, MOF
Exim Bank Former Minister of Commerce SCIB - Former Director General, MOF
I-Bank Advisor, Ministry of Foreign Affair SCB - Former Prime Minister
SME Bank Director General, MOF
GSB Director General, MOF
GHB Deputy Permanent Secretary, MOF
SMC Financial Policy Advisor, MOF
SBCG MOF's Director Pool
Member - MOF Representative - 1 Deputy Permanent Secretary, MOF TMB - 1 Director General, MOF
- MOF's Director Pool - 3 MOF's Director Pool TMB - 1 Military Representative
- Other Government Agencies - 1 Former BOT Governor TMB - 1 Former BOT Governor
such as BOT, SET, Ministry of SCIB - 3 MOF Director Pool
Commerce, Ministry of Foreign SCIB - Former Deputy Prime Minister
Affair, Ministry of Industry, SCB - 2 Senior Management of the CPB
Ministry of Agriculture and etc. SCB - 2 Director General, MOF
Gov Direct Lending Influence Influence Small Influence
Gov Contingent Liabilitiy Explicitly Implicitly Implicitly
External Auditor Office of Auditor General Office of Auditor General TMB - Ernst & Young
SCIB - Ernst & Young
SCB - KPMG
Supervisor Ministry of Finance (MOF) Bank of Thailand Bank of Thailand
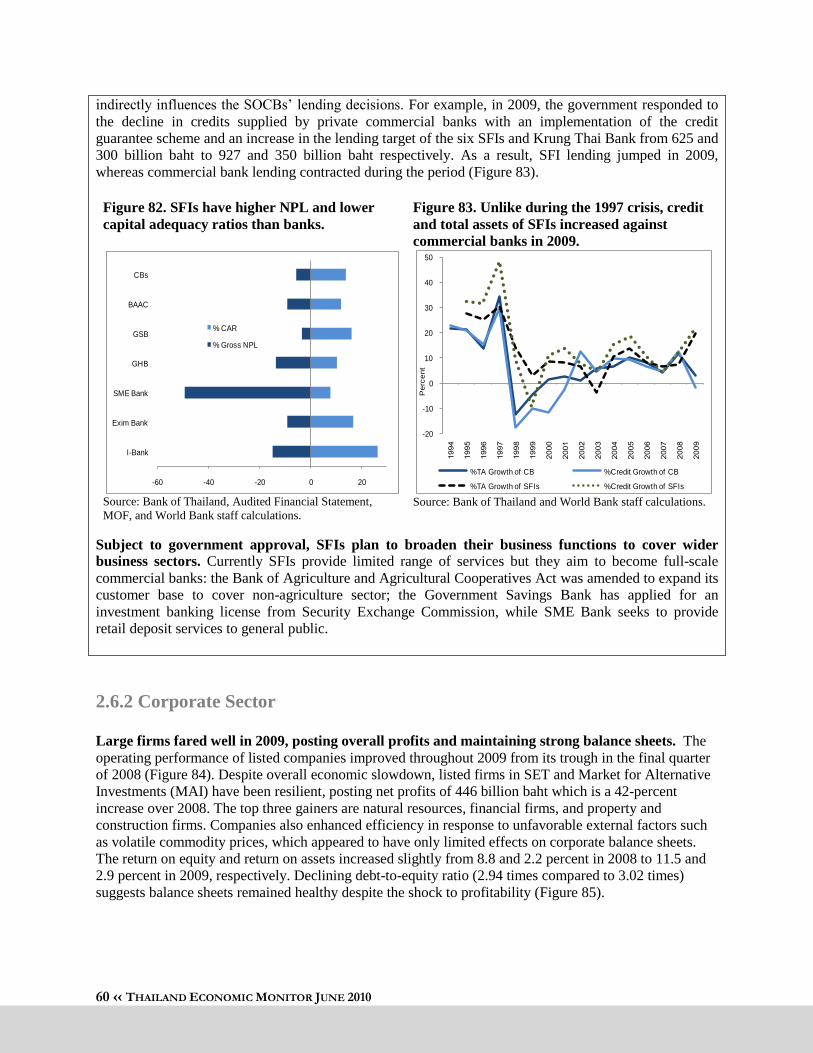
60 ‹‹ THAILAND ECONOMIC MONITOR JUNE 2010
indirectly influences the SOCBs‘ lending decisions. For example, in 2009, the government responded to
the decline in credits supplied by private commercial banks with an implementation of the credit
guarantee scheme and an increase in the lending target of the six SFIs and Krung Thai Bank from 625 and
300 billion baht to 927 and 350 billion baht respectively. As a result, SFI lending jumped in 2009,
whereas commercial bank lending contracted during the period (Figure 83).
Figure 82. SFIs have higher NPL and lower
capital adequacy ratios than banks.
Source: Bank of Thailand, Audited Financial Statement,
MOF, and World Bank staff calculations.
Figure 83. Unlike during the 1997 crisis, credit
and total assets of SFIs increased against
commercial banks in 2009.
Source: Bank of Thailand and World Bank staff calculations.
Subject to government approval, SFIs plan to broaden their business functions to cover wider
business sectors. Currently SFIs provide limited range of services but they aim to become full-scale
commercial banks: the Bank of Agriculture and Agricultural Cooperatives Act was amended to expand its
customer base to cover non-agriculture sector; the Government Savings Bank has applied for an
investment banking license from Security Exchange Commission, while SME Bank seeks to provide
retail deposit services to general public.
2.6.2 Corporate Sector
Large firms fared well in 2009, posting overall profits and maintaining strong balance sheets. The
operating performance of listed companies improved throughout 2009 from its trough in the final quarter
of 2008 (Figure 84). Despite overall economic slowdown, listed firms in SET and Market for Alternative
Investments (MAI) have been resilient, posting net profits of 446 billion baht which is a 42-percent
increase over 2008. The top three gainers are natural resources, financial firms, and property and
construction firms. Companies also enhanced efficiency in response to unfavorable external factors such
as volatile commodity prices, which appeared to have only limited effects on corporate balance sheets.
The return on equity and return on assets increased slightly from 8.8 and 2.2 percent in 2008 to 11.5 and
2.9 percent in 2009, respectively. Declining debt-to-equity ratio (2.94 times compared to 3.02 times)
suggests balance sheets remained healthy despite the shock to profitability (Figure 85).
-60 -40 -20 0 20
I-Bank
Exim Bank
SME Bank
GHB
GSB
BAAC
CBs
% CAR
% Gross NPL
-20
-10
0
10
20
30
40
50
Perc
ent
%TA Growth of CB %Credit Growth of CB
%TA Growth of SFIs %Credit Growth of SFIs

61 ‹‹ THAILAND ECONOMIC MONITOR JUNE 2010
Figure 84. Despite lower revenues in 2009,
listed firms increased their efficiency and
managed to increase profits.
Source: SET and World Bank staff calculations.
Figure 85. Debt-to-equity ratios remained on a
downward trend, even as profits took a large hit
in 2008.
Source: SET and World Bank staff calculations.
Despite adequate liquidity in the financial system, small and medium enterprises (SMEs)
experienced shocks to sales and access to credit. Business dissolutions peaked in the second quarter of
2009 even as large corporations were returning to profitability. This reflected the difficulties faced by
many SMEs that had neither strong balance sheets nor easy access to credit despite ample liquidity in the
financial system. With improved economic environment and large room in their balance sheets, banks are
poised to increase lending in 2010, including to SMEs. A turnaround in credit growth is already visible:
credit growth started to recover in the third quarter of 2009.
0
200
400
600
800
1000
1200
0
1000
2000
3000
4000
5000
6000
7000
8000
B
illion T
HB
Billion T
HB
Sales
EBIDTA (right axis)
Net profit (right axis)
0
5
10
15
20
25
Pe
rce
nt
D/E Gross Profit
ROA ROE
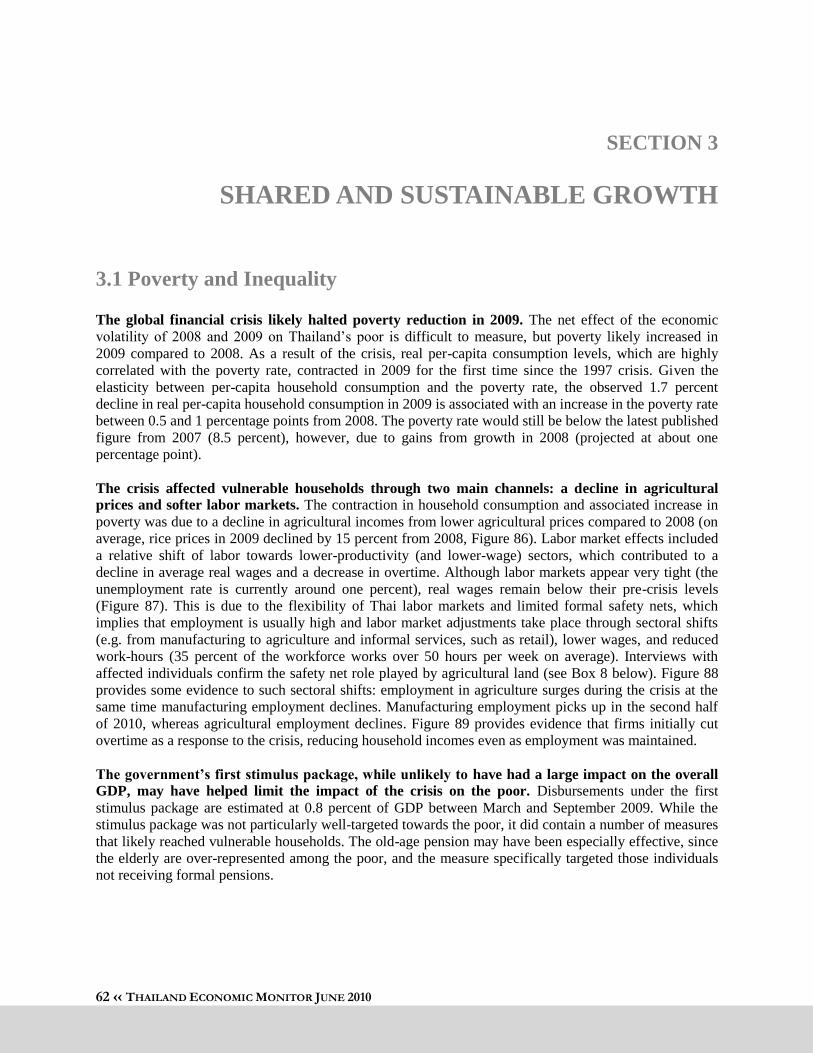
62 ‹‹ THAILAND ECONOMIC MONITOR JUNE 2010
SECTION 3
SHARED AND SUSTAINABLE GROWTH
3.1 Poverty and Inequality
The global financial crisis likely halted poverty reduction in 2009. The net effect of the economic
volatility of 2008 and 2009 on Thailand‘s poor is difficult to measure, but poverty likely increased in
2009 compared to 2008. As a result of the crisis, real per-capita consumption levels, which are highly
correlated with the poverty rate, contracted in 2009 for the first time since the 1997 crisis. Given the
elasticity between per-capita household consumption and the poverty rate, the observed 1.7 percent
decline in real per-capita household consumption in 2009 is associated with an increase in the poverty rate
between 0.5 and 1 percentage points from 2008. The poverty rate would still be below the latest published
figure from 2007 (8.5 percent), however, due to gains from growth in 2008 (projected at about one
percentage point).
The crisis affected vulnerable households through two main channels: a decline in agricultural
prices and softer labor markets. The contraction in household consumption and associated increase in
poverty was due to a decline in agricultural incomes from lower agricultural prices compared to 2008 (on
average, rice prices in 2009 declined by 15 percent from 2008, Figure 86). Labor market effects included
a relative shift of labor towards lower-productivity (and lower-wage) sectors, which contributed to a
decline in average real wages and a decrease in overtime. Although labor markets appear very tight (the
unemployment rate is currently around one percent), real wages remain below their pre-crisis levels
(Figure 87). This is due to the flexibility of Thai labor markets and limited formal safety nets, which
implies that employment is usually high and labor market adjustments take place through sectoral shifts
(e.g. from manufacturing to agriculture and informal services, such as retail), lower wages, and reduced
work-hours (35 percent of the workforce works over 50 hours per week on average). Interviews with
affected individuals confirm the safety net role played by agricultural land (see Box 8 below). Figure 88
provides some evidence to such sectoral shifts: employment in agriculture surges during the crisis at the
same time manufacturing employment declines. Manufacturing employment picks up in the second half
of 2010, whereas agricultural employment declines. Figure 89 provides evidence that firms initially cut
overtime as a response to the crisis, reducing household incomes even as employment was maintained.
The government‟s first stimulus package, while unlikely to have had a large impact on the overall
GDP, may have helped limit the impact of the crisis on the poor. Disbursements under the first
stimulus package are estimated at 0.8 percent of GDP between March and September 2009. While the
stimulus package was not particularly well-targeted towards the poor, it did contain a number of measures
that likely reached vulnerable households. The old-age pension may have been especially effective, since
the elderly are over-represented among the poor, and the measure specifically targeted those individuals
not receiving formal pensions.
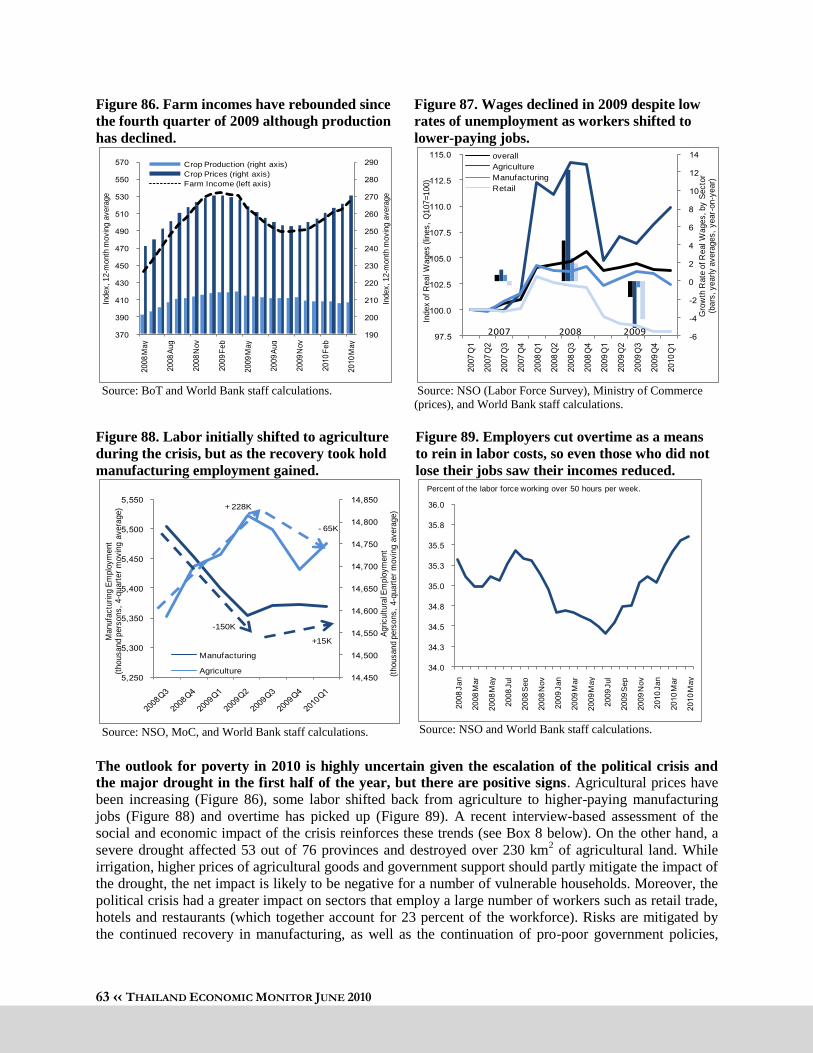
63 ‹‹ THAILAND ECONOMIC MONITOR JUNE 2010
Figure 86. Farm incomes have rebounded since
the fourth quarter of 2009 although production
has declined.
Source: BoT and World Bank staff calculations.
Figure 87. Wages declined in 2009 despite low
rates of unemployment as workers shifted to
lower-paying jobs.
Source: NSO (Labor Force Survey), Ministry of Commerce
(prices), and World Bank staff calculations.
Figure 88. Labor initially shifted to agriculture
during the crisis, but as the recovery took hold
manufacturing employment gained.
Source: NSO, MoC, and World Bank staff calculations.
Figure 89. Employers cut overtime as a means
to rein in labor costs, so even those who did not
lose their jobs saw their incomes reduced.
Source: NSO and World Bank staff calculations.
The outlook for poverty in 2010 is highly uncertain given the escalation of the political crisis and
the major drought in the first half of the year, but there are positive signs. Agricultural prices have
been increasing (Figure 86), some labor shifted back from agriculture to higher-paying manufacturing
jobs (Figure 88) and overtime has picked up (Figure 89). A recent interview-based assessment of the
social and economic impact of the crisis reinforces these trends (see Box 8 below). On the other hand, a
severe drought affected 53 out of 76 provinces and destroyed over 230 km2 of agricultural land. While
irrigation, higher prices of agricultural goods and government support should partly mitigate the impact of
the drought, the net impact is likely to be negative for a number of vulnerable households. Moreover, the
political crisis had a greater impact on sectors that employ a large number of workers such as retail trade,
hotels and restaurants (which together account for 23 percent of the workforce). Risks are mitigated by
the continued recovery in manufacturing, as well as the continuation of pro-poor government policies,
Ma
y
Au
g
No
v
Fe
b
May
Au
g
No
v
Fe
b
May
Inde
x,
12
-mo
nth
mo
vin
g a
ve
rage
Inde
x,
12
-mo
nth
mo
vin
g a
ve
rage
Crop Production (right axis)
Crop Prices (right axis)
Farm Income (left axis)
-
-
-
Q
Q
Q
Q
Q
Q
Q
Q
Q
Q
Q
Q
Q
Gro
wth
Rate
of R
eal W
ages, by S
ecto
r (b
ars
, yearly a
vera
ges,
year-
on
-year)
Inde
x o
f R
eal
Wage
s (
lines
, Q
10
7=
10
0)
overall
Agriculture
Manufacturing
Retail
2007 20092008
Agricu
ltu
ral E
mp
loym
ent
(th
ou
sa
nd
pers
ons,
4-q
ua
rte
r m
ovin
g a
ve
rage
)
Ma
nu
fac
turi
ng
Em
plo
ym
en
t (t
ho
us
an
d p
ers
on
s,
4-q
ua
rte
r m
ov
ing
av
era
ge
)
Manufacturing
Agriculture
+ 228K
-150K
+15K
- 65K
Ja
n
Ma
r
Ma
y
Ju
l
Se
p
No
v
Ja
n
Ma
r
Ma
y
Ju
l
Se
p
No
v
Ja
n
Ma
r
Ma
y
Percent of the labor force working over 50 hours per week.
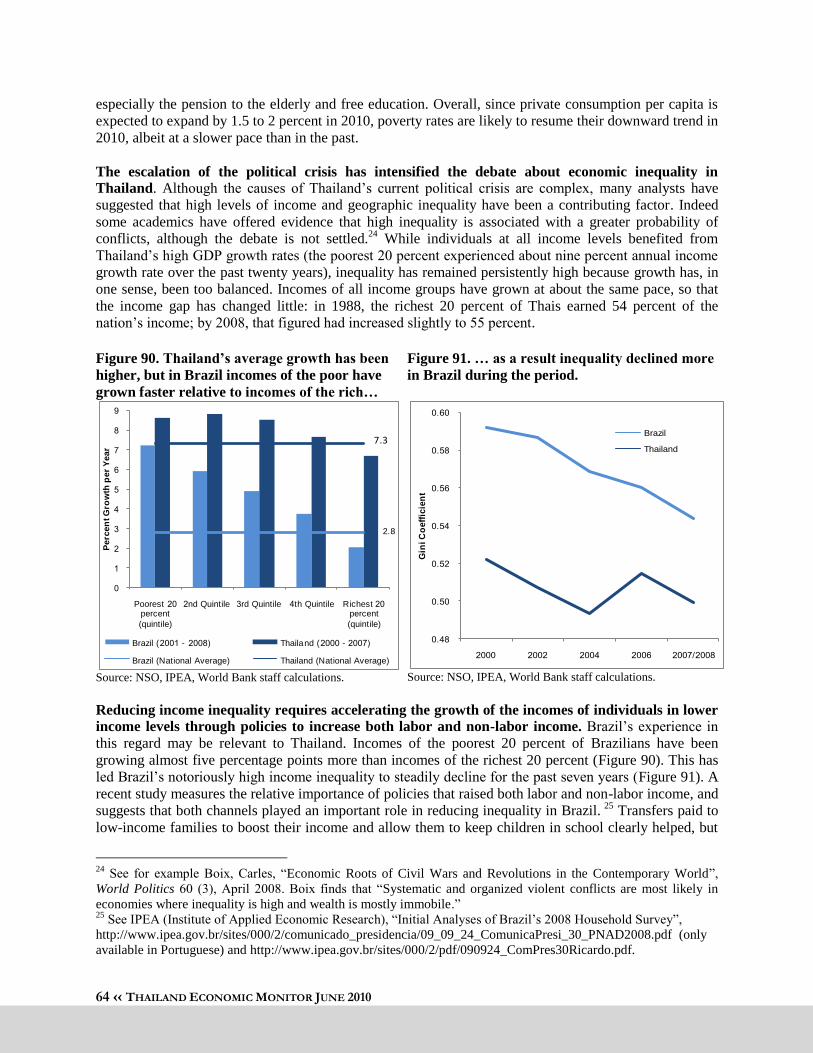
64 ‹‹ THAILAND ECONOMIC MONITOR JUNE 2010
especially the pension to the elderly and free education. Overall, since private consumption per capita is
expected to expand by 1.5 to 2 percent in 2010, poverty rates are likely to resume their downward trend in
2010, albeit at a slower pace than in the past.
The escalation of the political crisis has intensified the debate about economic inequality in
Thailand. Although the causes of Thailand‘s current political crisis are complex, many analysts have
suggested that high levels of income and geographic inequality have been a contributing factor. Indeed
some academics have offered evidence that high inequality is associated with a greater probability of
conflicts, although the debate is not settled.24
While individuals at all income levels benefited from
Thailand‘s high GDP growth rates (the poorest 20 percent experienced about nine percent annual income
growth rate over the past twenty years), inequality has remained persistently high because growth has, in
one sense, been too balanced. Incomes of all income groups have grown at about the same pace, so that
the income gap has changed little: in 1988, the richest 20 percent of Thais earned 54 percent of the
nation‘s income; by 2008, that figured had increased slightly to 55 percent.
Figure 90. Thailand‟s average growth has been
higher, but in Brazil incomes of the poor have
grown faster relative to incomes of the rich…
Source: NSO, IPEA, World Bank staff calculations.
Figure 91. … as a result inequality declined more
in Brazil during the period.
Source: NSO, IPEA, World Bank staff calculations.
Reducing income inequality requires accelerating the growth of the incomes of individuals in lower
income levels through policies to increase both labor and non-labor income. Brazil‘s experience in
this regard may be relevant to Thailand. Incomes of the poorest 20 percent of Brazilians have been
growing almost five percentage points more than incomes of the richest 20 percent (Figure 90). This has
led Brazil‘s notoriously high income inequality to steadily decline for the past seven years (Figure 91). A
recent study measures the relative importance of policies that raised both labor and non-labor income, and
suggests that both channels played an important role in reducing inequality in Brazil. 25
Transfers paid to
low-income families to boost their income and allow them to keep children in school clearly helped, but
24
See for example Boix, Carles, ―Economic Roots of Civil Wars and Revolutions in the Contemporary World‖,
World Politics 60 (3), April 2008. Boix finds that ―Systematic and organized violent conflicts are most likely in
economies where inequality is high and wealth is mostly immobile.‖ 25
See IPEA (Institute of Applied Economic Research), ―Initial Analyses of Brazil‘s 2008 Household Survey‖,
http://www.ipea.gov.br/sites/000/2/comunicado_presidencia/09_09_24_ComunicaPresi_30_PNAD2008.pdf (only
available in Portuguese) and http://www.ipea.gov.br/sites/000/2/pdf/090924_ComPres30Ricardo.pdf.
2.8
Poorest percent
(quintile)
nd Quintile rd Quintile th Quintile Richest percent
(quintile)
Perc
en
t G
row
th p
er
Yea
r
Brazil ( - Thailand ( -
Brazil (National Average) Thailand (National Average)
7.3
Gin
i C
oe
ffic
ien
t
Brazil
Thailand
65 ‹‹ THAILAND ECONOMIC MONITOR JUNE 2010
more important was an uneven increase in labor incomes (i.e., the labor incomes of the poor have grown
more quickly than those of the rich). This likely reflects the fact that the productivity of low-income
individuals has increased more quickly than that of higher-income workers. While the causes of this
unbalanced growth in labor incomes are not fully understood, a possible explanation is that educational
reforms implemented in the 1990s (which greatly expanded access to basic education and incentives to
conclude primary education) are currently bearing fruit.
Inequality in Thailand has important spatial dimensions, as most of the poor are concentrated in
the North and Northeast of the country. The faster development of Bangkok compared to the rest of the
country Thailand‘s development success, as agglomeration economies were realized and catalyzed
economic growth. Despite substantial migration from rural to urban areas, especially Bangkok, a large
fraction of the Thai workforce remains in agriculture and therefore in rural areas. Welfare disparities
between those in urban and rural areas have increased with the process of development, and today most
inequality in Thailand is inequality between regions rather than within each region. Getting the benefits of
both economic concentration and social convergence (i.e. reduced welfare disparities) requires policy
actions aimed at economic integration between lagging and leading regions and equitable delivery of
social services.
Box 8. Findings on the Second Round of the Rapid Poverty and Social Impact Assessment of the
Economic Downturn in Thailand26
The second rapid assessment of the impact of the economic crisis was conducted in Thailand during
the month of January 2010. A series of in-depth interviews and focus group discussions with workers
in the formal and the informal sectors, with private sector, non-governmental organizations and
government agencies were conducted in four provinces, namely Bangkok, Ayutthaya, Samutsakorn and
Nakornrachasrima. The assessment was able to provide a flow of updated information on crisis impacts
that are diverse in both scope and intensity across different groups and sectors. The storyline is one of
recovery in some formal sectors, but of persistent and severe hardship in the urban informal sector.
The assessment found signs of improvement in the business sector. General views from the in-depth
interviews with enterprises indicate that business has been picking up since the second quarter of 2009.
This is especially true for large sized companies and companies in the IT and automobile sectors.
However, business owners described adjustments that they had made in order to survive the crisis. IT
related companies had downsizing its staff and reorganized management into cluster to improve
efficiency and cope with both the crisis and the new rapid demand of products. In the automobile sector,
enterprises mentioned that demand for high-end cars had held firm during the crisis but there had been a
shift in demand among mid- and lower income groups towards cars with smaller engines (1,300cc or
1,500cc). Several small and medium enterprises were struggling to survive and were particularly troubled
by their inability to access credit.
Scarcity of workers: In stark contrast to the first round of research, there was high demand for
workers in every target province. The employment offices reported that local enterprises were short of
13,000 workers in Ayutthaya and 6,000 workers in Nakornrachasrima. Though business owners and the
Employment Department have been working closely together to try to find workers over the past months,
the supply of Thai workers has been limited. Enterprises seeing a recovery in orders from overseas noted
that the scarcity of workers is now a major constraint. Respondents suggested that the following factors
were important in limiting the supply of workers:
26
Prepared by Pamornrat Tansanguanwong.
66 ‹‹ THAILAND ECONOMIC MONITOR JUNE 2010
Workers in the formal sector and laid off workers are (possibly temporarily) enjoying the benefits
from the government stimulus interventions such as the Income Generating scheme (Tonklar
Archeep) which provides training, seed funds for the laid-off workers and youth groups to start
small businesses, and the 2,000 baht cash support scheme for workers who earn up to 15,000
baht.
Some workers may have decided to move permanently out of paid employment. Laid-off workers
in their late twenties/early thirties anticipate that they will not be employed in certain industries
after the age of 35. Rather than return to paid employment for a few years, the Employment
Department estimated that around 20 percent of laid off workers have changed their career and
invested instead in small businesses or small-scale income generating activities.
A recent surge in the prices of agricultural products such as rice, corn, tapioca and rubber, may
mean that workers that originally migrated from agricultural areas are staying back in rural areas
during the harvest season.
Some workers who do not have much education may not access employment information.
Representatives from the Provincial Employment Department felt that the education system is
producing a workforce with a skill set that is poorly matched with the increasing demand in the
industrial sector.
Stress and Hardship in the formal sectors remained high. Workers employed in enterprises that are
experiencing labor shortages in the face of recovering demand reported working long hours. Women
workers who are working in the lowest level of the production line were simultaneously pleased with the
opportunity to earn overtime wages, but commented on the physical stress of long working hours. Men in
the mid and upper management also reported stress that they all would have to manage to meet their
reached targets.
The role of migrant workers appears to have extended. With the shortage of Thai workers, some
enterprises were filling gaps with migrant workers. In Samutsakorn, migrant workers have expanded from
working in the unskilled to more skilled labor positions, and have extended beyond the traditional seafood
processing businesses. Unlike Samutsakorn, the labor office of Ayutthaya is still firm in allowing migrant
workers to only work in the unskilled positions. Many enterprises reported a preference for immigrant
workers because they accept lower wages and are ―easier to manage‖, a factor that might influence the
nature of the Thai labor force in the future. Immigrant workers reported anxieties over government‘s
policy requiring proof of citizenship, with exploitation by brokers reportedly common.
The well-being of informal workers deteriorated. Workers in the informal sector reported severe
economic stress. Work remains scarce, wages remain low and many reported an accumulation of alarming
levels of debt. In the Klong Toey area, most porters and informal workers reported drawing down on their
long term safety net, the savings and cooperative groups for housing. Managers of these savings and
cooperative groups felt that if they did not use the funds to help their members now, many members will
lose their houses used for collateral to loan sharks. The long term savings were at risk of evaporating
within the next few months as there are limited funds revolving in the system. The informal workers
reported highly constrained access to formal safety nets. They are unable to make use of programs aiming
to refinance loans because such schemes do not work in situations where they cannot report the names of
their loan sharks. Other schemes (such as training or cash support) are catered to people in the formal
sector. Other major concern is the widespread of drugs in all provinces interviewed. Disturbing note that
the major targets of drug dealers are children as lower as ten years of age. As much as they are struggling
to survive, majority do not want to return to rural areas.
Land remains an important safety net in rural areas. Agricultural land has provided an important
safety net for households in rural areas and has cushioned the impact of falling remittances from overseas

67 ‹‹ THAILAND ECONOMIC MONITOR JUNE 2010
and domestic sources. Rising agricultural prices have kept rural livelihoods buoyant and many households
even called their children and relatives to move back from their hardship in urban areas or industrial
zones to live in rural areas with them.
High levels of social capital were noted to be important for rural people who are landless. These
people are suffering the most from receiving less remittance from their children working in other
provinces in Thailand. Without land, they do not reap the benefit from rising agricultural prices and are
dependent on day laboring jobs. Many of these landless households reported that they are struggling but
their neighbors and relatives in the villages have helped provide food for their families. Living in the rural
areas, they can still find crabs, fish and vegetables from the rivers and public land to feed their families.
3.2 Education for Sustainable Growth27 To start a second engine of growth, a greater number of Thai workers must be integrated into
dynamic sectors of economy and perform tasks with higher value-added. Thailand‘s long-term
challenge is to move a large share of the labor force currently in agriculture or otherwise performing
simple, low value-added tasks into the dynamic parts of the economy. To achieve such a shift, Thailand
requires better and more accessible education, deeper regional integration, improvements to agricultural
productivity, and regulatory reforms to foster competition in the services sectors, including through
greater participation of foreign firms.
Export-driven manufacturing will continue to be a dynamic sector, but services sectors potentially
offer opportunities for more Thais to engage in higher value-added tasks. The competition for the
location of manufacturing facilities of global supply chains is only likely to increase going forward, as
infrastructure improves and political stability takes hold in countries such as Vietnam and Indonesia.
Therefore, in order to maintain high growth rates of manufacturing value added, Thailand will need to
attract higher value added tasks. Substantial growth in manufacturing value-added over the past decade
was achieved primarily through capital deepening and has not contributed to growth in employment,
suggesting limited potential for employment growth. Nevertheless, there are ample opportunities to move
from simpler to more complex tasks within manufacturing, namely from assembly, testing and packaging
to research, design, development, marketing, servicing and branding. Services sectors hold greater
potential for generating more higher-paying jobs, but the key remains to shift workers to high complexity,
high value-added tasks. Financial services, medical tourism and creative areas such as architecture and
advertising are example of services sectors that involve the performance of complex tasks.
Investments in education represent one critical requirement for the activation of a second engine of
growth. While improving education is only one element of a strategy for shared and sustainable growth
(and often not even the most important element), enhancing the quality and access to secondary and
tertiary education could potentially contribute to (1) reducing income inequality and create a larger
middle class; (2) increasing the supply of skills in the market, which is required for moving up the value
chain in manufacturing and fostering the creation of high-value-added and internationally competitive
services sectors. This section draws from the World Bank‘s Thailand Social Monitor to highlight some
ways in which improvements in education may contribute to Thailand‘s long-term development.
27
This section draws from the Thailand Social Monitor, February 2010 issue. The report can be downloaded from
http://www.worldbank.or.th.

68 ‹‹ THAILAND ECONOMIC MONITOR JUNE 2010
The combination of unequal access to tertiary education and the high premium labor markets pay
for skills is one source of the persistence of income disparities in Thailand. Inequality in access to
quality primary and secondary education, leads, in part, to the large observed disparities in access to
higher education across different levels of household income. Labor markets transform these disparities in
access to education into income disparities through the high premium attached to additional years of
education, a premium that increases with experience, thus contributing to overall income inequality.
Because this analysis only considers one factor affecting labor incomes, it does not provide an overall
explanation for Thailand‘s levels of income inequality. Nevertheless, the analysis suggests access to
tertiary education may be one source of inequality that merits further examination.28
Despite high enrollment rates in primary and secondary education, access to tertiary education in
Thailand is highly unequal. Access to primary and lower-secondary education is nearly universal as
between 2001 and 2005 Thailand steadily and impressively increased gross enrollment rates (Figure 92).29
Enrollment rates in tertiary education are 50 percent, in line with other countries in the region but behind
OECD countries (Figure 93). However, when looking at enrollment by age group, it is noteworthy that
higher education participation by the appropriate age cohort (18 to 21 years old) is only 25 percent.30
Most importantly, Thailand experiences substantial inequalities in terms of access to higher education by
household income. Whereas almost 50 percent of students from the highest income quintile participate in
higher education, less than five percent of students in the lowest quintile are enrolled, a pattern that has
not changed significantly since 2000 (Figure 94). The three lowest income quintiles combined represent
about 20 percent of higher education enrollment. While the top two income quintiles represent the vast
majority of enrollments, there is nonetheless a vast chasm in participation rates even between the fourth
and the fifth quintiles.
Figure 92. Primary enrollment rates are close to
100 percent, but upper-secondary and higher
education enrollment rates have lagged.
Source: Ministry of Education, 2007.
Figure 93. Tertiary Gross Enrollment rates in
Thailand are well below those of most OECD
countries.
Source: Edstats and World Development Indicators.
28
The role of education as a source of inequality in Thailand was studied by Fofack, Hippolyte and Albert Zeufack
(1999), ―Dynamics of income inequality in Thailand: evidence from household psudo-panel data‖, World Bank
working paper. The authors find that education, along with access to formal credit markets, intra-family transfers
and spatial concentration of wealth are key determinants of income inequality in Thailand. 29
The GER is the number of pupils enrolled in a given level of education regardless of the age expressed as a
percentage of the population in the theoretical age group for that level of education. 30
See Makishima, Minoru and Somchai Sukisiriserekul, eds. (2003), Human Resource Development Toward a
Knowledge-Based Economy: The Case of Thailand. Bangkok, Thailand: Institute of Developing Economies, Japan
External Trade Organization.
Pe
rce
nt
Primary
Lower Secondary
Upper Secondary
Higher Education
Kore
aF
inla
nd
Gre
ece
Un
ite
d S
tate
sD
en
ma
rkN
ew
Ze
ala
nd
No
rwa
yA
ustr
alia
Sw
ede
nIc
ela
nd
Sp
ain
Hu
ng
ary
Ita
lyP
ola
nd
Be
lgiu
mIr
ela
nd
Ne
the
rla
nd
sU
nit
ed
Kin
gd
om
Ja
pa
nP
ort
ug
al
Fra
nc
eC
zec
h R
ep
ub
licA
us
tria
Slo
va
k R
epu
blic
Th
aila
nd
Sw
itze
rla
nd
Tu
rke
yM
ex
ico

69 ‹‹ THAILAND ECONOMIC MONITOR JUNE 2010
Inequality in access to tertiary education may be in part due to disparities in the quality of primary
and secondary education. Inequalities in higher education manifest early in the educational lives of Thai
children. Figure 95 illustrates the survival curve for students (ages 6 to 22) from primary through tertiary
education. Whereas survival rates are constant for students from the highest income quintile, they are
constantly decreasing for students from low-income families. Survival rates of wealthier students are
almost 100 percent compared to barely 60 percent for students from the poorest backgrounds. At each
level of education, low income students are more likely to drop out upon completion. The dropout rate
increases from primary to secondary and from secondary to higher education. Given the high premium
attached to additional years of education and the relatively open access (especially to additional years of
secondary education), this may imply that students do not feel that the level of education they completed
adequately prepares them to succeed in the next level.
Figure 94. Students in higher education still
predominantly come from top quintile of the
income distribution.
Source: Socio-Economic Survey, 2006.
Figure 95. While most students from the top
quintile go on to finish university, students from
the lowest quintile drop out earlier.
Source: Socio-Economic Survey, 2006.
Mean wages in Thailand increase substantially with additional years of education completed. As
Table 15 indicates, workers with higher education make, on average, three times more than workers with
only a secondary education. Evidence from firm surveys suggests that the skills premium in Thailand is
higher compared to other countries in the region.31
Whereas mean hourly wages for a Thai worker who
completed more than 16 years of education were 110 percent more than wages for those who completed
only basic education, the comparable figure for Malaysia is only 60 percent (Figure 96; see also Table
15). In addition, there is evidence that this gap tends to grow wider as workers increase their labor force
experience. At the age of 25, workers with tertiary education earn about 5,000 baht more per month more
than workers with either primary or secondary education. The difference increases over time and by the
age of retirement, workers with tertiary education receive about 40,000 baht per month compared to
25,000 baht for those with a secondary education and 5,000 baht for those with primary education. Figure
97 shows that there is almost no growth in earnings over time for workers with only primary education.
31
See World Bank (2006), Thailand Investment Climate, Firm Competiveness and Growth, Chapter 3.
Q Q Q Q Q
Higher education participation rate (age 20 and over)
0
0.2
0.4
0.6
0.8
1
1 2 3 4 5 6 7 8 9 10 11 12 13 14 15 16
Grade
Poorest Richest
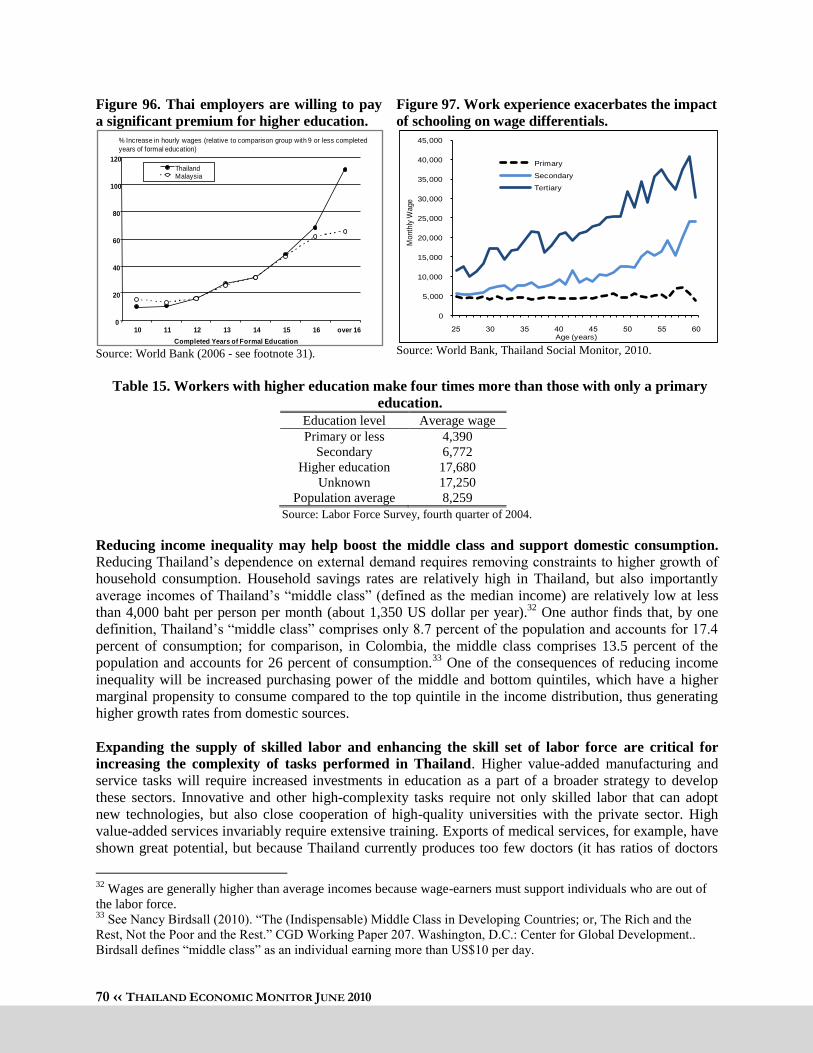
70 ‹‹ THAILAND ECONOMIC MONITOR JUNE 2010
Figure 96. Thai employers are willing to pay
a significant premium for higher education.
Source: World Bank (2006 - see footnote 31).
Figure 97. Work experience exacerbates the impact
of schooling on wage differentials.
Source: World Bank, Thailand Social Monitor, 2010.
Table 15. Workers with higher education make four times more than those with only a primary
education.
Education level Average wage
Primary or less 4,390
Secondary 6,772
Higher education 17,680
Unknown 17,250
Population average 8,259
Source: Labor Force Survey, fourth quarter of 2004.
Reducing income inequality may help boost the middle class and support domestic consumption.
Reducing Thailand‘s dependence on external demand requires removing constraints to higher growth of
household consumption. Household savings rates are relatively high in Thailand, but also importantly
average incomes of Thailand‘s ―middle class‖ (defined as the median income) are relatively low at less
than 4,000 baht per person per month (about 1,350 US dollar per year).32
One author finds that, by one
definition, Thailand‘s ―middle class‖ comprises only 8.7 percent of the population and accounts for 17.4
percent of consumption; for comparison, in Colombia, the middle class comprises 13.5 percent of the
population and accounts for 26 percent of consumption.33
One of the consequences of reducing income
inequality will be increased purchasing power of the middle and bottom quintiles, which have a higher
marginal propensity to consume compared to the top quintile in the income distribution, thus generating
higher growth rates from domestic sources.
Expanding the supply of skilled labor and enhancing the skill set of labor force are critical for
increasing the complexity of tasks performed in Thailand. Higher value-added manufacturing and
service tasks will require increased investments in education as a part of a broader strategy to develop
these sectors. Innovative and other high-complexity tasks require not only skilled labor that can adopt
new technologies, but also close cooperation of high-quality universities with the private sector. High
value-added services invariably require extensive training. Exports of medical services, for example, have
shown great potential, but because Thailand currently produces too few doctors (it has ratios of doctors
32
Wages are generally higher than average incomes because wage-earners must support individuals who are out of
the labor force. 33
See Nancy Birdsall (2010). ―The (Indispensable) Middle Class in Developing Countries; or, The Rich and the
Rest, Not the Poor and the Rest.‖ CGD Working Paper 207. Washington, D.C.: Center for Global Development..
Birdsall defines ―middle class‖ as an individual earning more than US$10 per day.
0
20
40
60
80
100
120
10 11 12 13 14 15 16 over 16
Completed Years of Formal Education
ThailandMalaysia
% Increase in hourly wages (relative to comparison group with 9 or less completed
years of formal education)
0
5,000
10,000
15,000
20,000
25,000
30,000
35,000
40,000
45,000
Month
ly W
age
Age (years)
Primary
Secondary
Tertiary

71 ‹‹ THAILAND ECONOMIC MONITOR JUNE 2010
per capita well below most middle-income countries) the private health sector has been absorbing doctors
from the public sector, creating long-term problems for the equitable delivery of social services.
Firms identify skills shortages as a key obstacle to growth, reflecting shortcomings with the quality
of tertiary education. According to firm-level surveys, 36 percent of Thai firms identify the lack of
skilled labor as a top constraint to their business.34
Thai firms take on average 5.2 weeks to fill a vacancy
for a skilled position compared to 3.2 weeks in India, for example (Figure 98). The main reason for job
vacancies is related to the inability to identify applicants with appropriate basic and technical skills. More
than 80 percent of companies in Thailand and 70 percent in Malaysia identified insufficient basic and
technical skills as the major causes for open jobs (Figure 99). On the other hand, less than 20 percent of
firms in both countries points to a lack of applicants as a major factor for vacancies. This finding indicates
an imbalance between the quantity and the quality of higher education graduates. As noted earlier, this
situation is particularly acute in Thailand where employers are willing to pay a significant premium for
high-skilled workers.
Figure 98. It takes Thai firms 5.2 weeks to fill a vacancy for a skilled position.
Source: PICS 2007 (see footnote 34 below)
Figure 99. Skill shortages are a salient factor explaining
Thai firms‟ difficulty in filling vacancies.
Source: PICS 2007 (see footnote 34 below)
34
See World Bank (2006), op. cit. and World Bank (2008) Thailand Investment Climate Assessment Update.
1.6
2.3
2.9
3.2
3.4
3.7
5.2
8.8
0 2 4 6 8 10
Indonesia
Turkey
Russia
India
Korea
Germany
Thailand
Brazil
Weeks
Percentage of Firms Pointing Out to Each Factor as One of Main 3 Causes for Vacancies
0
10
20
30
40
50
60
70
80
90
ApplicantsDemand Very
High Wage
Univ. NotProduce
SufficientNumber
Graduates
Applicants NotHave Required
Basic Skills
Applicants NotHave RequiredTechnical Skills
No Applicantsfor Unskilled
WorkersPosition
High Turnoverof New Recruits
Thailand Malaysia

72 ‹‹ THAILAND ECONOMIC MONITOR JUNE 2010
Innovation-led growth is linked to a strong tertiary education sector. Higher education institutions
play an important role in preparing individuals to adopt existing technologies (including foreign-
developed technologies), but also as engines of research and technological development. New product
development, innovation and technology have been conceived and generated from higher education
institutions, and countries such as Korea and China have been investing heavily in R&D capacity of their
universities (Figure 100).35
In Thailand, a recent survey of firms revealed that they rarely seek local
universities as a source of information and Technology (Table 16). 36
Figure 100. Chinese and Korean universities
have been spending more on R&D and
catching up to other OECD countries.
Source: Netherlands Observatory of Science and
Technology. R&D intensity is measured as R&D
expenditures by universities as a percent of GDP.
Figure 101. About three percent of responders
indicated Thailand was an attractive R&D
destination, compared to 61 percent for China.
Source: UNCTAD (2005). See footnote below.
Table 16: Universities are not an important source of information and technology to Thai firms.
Sources of information Automobile Electronics
No. % No. %
Customers‘ firms 12 21.8 14 26.9
Parent company (foreign) 15 27.3 12 23.1
Own company (Thai) 4 7.3 6 11.5
Suppliers 4 7.3 5 9.6
Others 9 16.4 5 9.6
Consult/visit/ training inside or outside the
country 3 5.5 3 5.8
University 1 1.8 3 5.8
Website 2 3.6 2 3.8
Product fair/ exhibition 2 3.6 1 1.9
Machinery 2 3.6 1 1.9
Conference with other firms 1 1.8 0 0.0
Total 55 100.0 52 100.0 Source: TDRI 2009, in Yussuf and Nabeshima (2010)
35
See Netherlands Observatory of Science and Technology (2010). Science and Technology Indicators 2010. 36
Yussuf, S. and K. Nabeshima (2010). ―Industrial Change in the Bangkok Urban Region‖ World Bank mimeo.
Australia
Canada
Denmark
France Ireland
Japan
Korea
Sweden
UK
USA
China
0.0
0.1
0.2
0.3
0.4
0.5
0.6
0.7
0.8
0.9
1.0
0 3 6 9 12 15
R&
D in
ten
sity
by U
niv
ers
ities
(perc
ent o
f GD
P)
Average Annual growth rate real R&D expenditures by universities (percent)
Followers
FallingBehind
Leaders
Catching up
Averages61.8
4.4 2.9
0
10
20
30
40
50
60
70
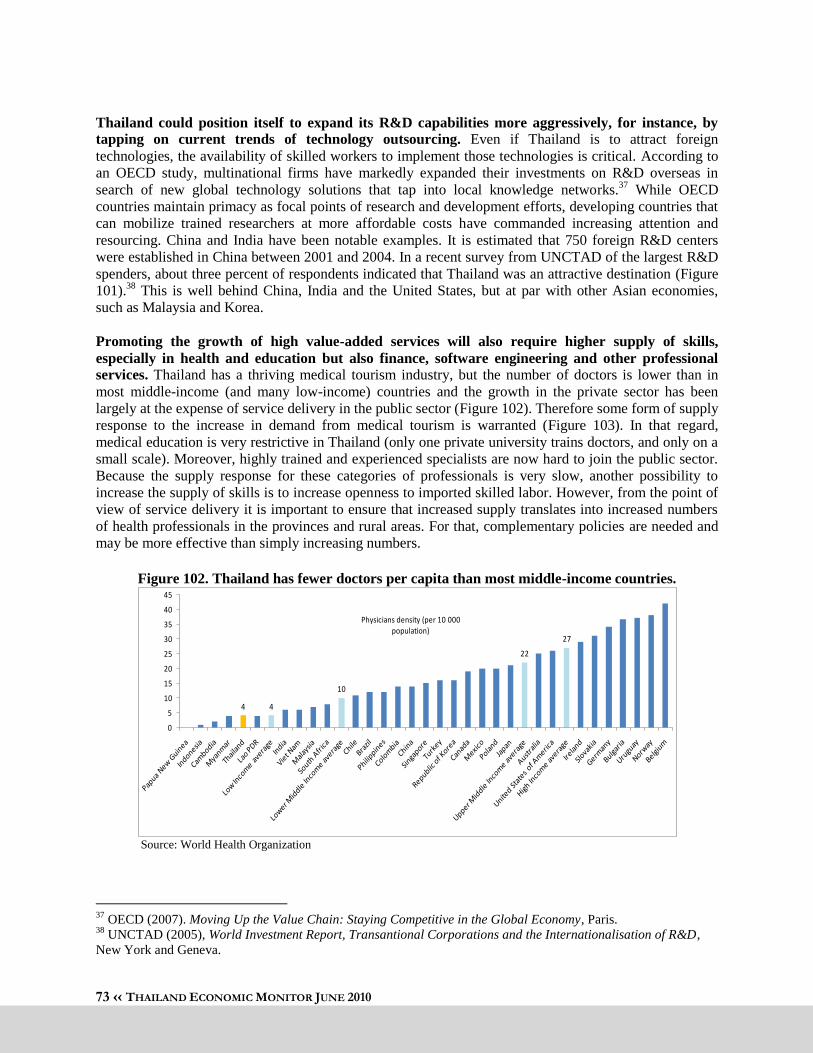
73 ‹‹ THAILAND ECONOMIC MONITOR JUNE 2010
Thailand could position itself to expand its R&D capabilities more aggressively, for instance, by
tapping on current trends of technology outsourcing. Even if Thailand is to attract foreign
technologies, the availability of skilled workers to implement those technologies is critical. According to
an OECD study, multinational firms have markedly expanded their investments on R&D overseas in
search of new global technology solutions that tap into local knowledge networks.37
While OECD
countries maintain primacy as focal points of research and development efforts, developing countries that
can mobilize trained researchers at more affordable costs have commanded increasing attention and
resourcing. China and India have been notable examples. It is estimated that 750 foreign R&D centers
were established in China between 2001 and 2004. In a recent survey from UNCTAD of the largest R&D
spenders, about three percent of respondents indicated that Thailand was an attractive destination (Figure
101).38
This is well behind China, India and the United States, but at par with other Asian economies,
such as Malaysia and Korea.
Promoting the growth of high value-added services will also require higher supply of skills,
especially in health and education but also finance, software engineering and other professional
services. Thailand has a thriving medical tourism industry, but the number of doctors is lower than in
most middle-income (and many low-income) countries and the growth in the private sector has been
largely at the expense of service delivery in the public sector (Figure 102). Therefore some form of supply
response to the increase in demand from medical tourism is warranted (Figure 103). In that regard,
medical education is very restrictive in Thailand (only one private university trains doctors, and only on a
small scale). Moreover, highly trained and experienced specialists are now hard to join the public sector.
Because the supply response for these categories of professionals is very slow, another possibility to
increase the supply of skills is to increase openness to imported skilled labor. However, from the point of
view of service delivery it is important to ensure that increased supply translates into increased numbers
of health professionals in the provinces and rural areas. For that, complementary policies are needed and
may be more effective than simply increasing numbers.
Figure 102. Thailand has fewer doctors per capita than most middle-income countries.
Source: World Health Organization
37
OECD (2007). Moving Up the Value Chain: Staying Competitive in the Global Economy, Paris. 38
UNCTAD (2005), World Investment Report, Transantional Corporations and the Internationalisation of R&D,
New York and Geneva.
4 4
10
Physicians density (per 10 000 population)
22
27
0
5
10
15
20
25
30
35
40
45

74 ‹‹ THAILAND ECONOMIC MONITOR JUNE 2010
Figure 103. The number of medical students had been declining, suggesting that a supply response
may be appropriate.
Source: Thailand Ministry of Health
800
1,000
1,200
1,400
1,600
1,800
2,000
1997 1998 1999 2000 2001 2002 2003 2004 2005 2006
New medical students
Medical graduates

75 ‹‹ THAILAND ECONOMIC MONITOR JUNE 2010
Appendix 1: Key Indicators Table
2008 2009 2009 2010 2010
Year Year Q2 Q3 Q4 Q1 Apr May
Output, Employment and Prices
GDP (% change, previous year) 2.5 -2.2 -4.9 -2.7 5.9 12.0 .. ..
Industrial production index (2000=100) 190.2 180.4 171.9 186.0 201.4 213.1 197.3 204.5
(% change, previous year) 5.3 -5.1 -9.2 -5.0 14.2 31.3 21.8 17.2
Unemployment rate (%) 1.4 1.5 1.7 1.2 1.0 1.1 1.2 ..
Real wage growth (%) 1/ 4.8 -1.6 1.1 1.3 -2.1 -0.6 .. ..
Consumer price index (% change,
previous year) 5.5 -0.8 -2.8 -2.2 1.9 3.7 2.9 3.4
Public Sector
Government balance (% GDP) 2/ -1.9 -3.8 0.6 0.0 -7.2 .. .. ..
Public sector debt (% GDP, end-period) 3/ 38.2 45.2 43.0 45.2 43.8 .. .. ..
Foreign Trade, BOP and External Debt
Trade balance (US$ million) -0.4 19.4 3.9 5.2 2.6 2.1 -0.2 2.3
Exports of goods (fob, US$ million) 175.2 150.7 34.0 40.7 42.8 44.0 13.8 16.4
(% change, previous year) 15.9 -14.0 -26.2 -17.6 12.0 32.1 34.7 42.5
Key exports: Machinery & mach.
appliances (% chg in US$) 7.6 -15.2 -25.0 -13.6 12.8 57.5 16.2 26.7
Imports of goods (cif, US$ million) 175.6 131.4 30.0 35.5 40.2 41.8 14.0 14.1
(% change, previous year) 26.8 -25.2 -33.1 -28.4 1.5 63.6 42.0 78.5
Current account balance (US$ million) 1.2 20.3 2.8 3.8 4.2 5.3 -0.4 1.0
(% GDP) 0.4 7.7 4.4 5.7 5.8 7.2 .. ..
Foreign direct investment, net (US$
million) 4/ 7.6 5.3 1.0 1.4 1.5 1.7 .. ..
Total external debt (US$ million) 5/ 65.2 70.0 63.1 67.4 70.0 .. .. ..
(% GDP) 24.0 26.6 .. .. .. .. .. ..
Short-term external debt (US$ million) 5/ 24.2 27.9 21.7 24.1 27.9 .. .. ..
Debt service ratio (% exports of goods and
services) 6/ 7.1 6.7 7.8 6.0 6.1 5.2 .. ..
Reserves, including gold (US$ million) 111.0 138.4 120.8 131.8 138.4 144.1 147.6 143.5
(months of imports of goods) 7.9 13.2 10.0 9.5 8.9 9.0 10.6 10.3

76 ‹‹ THAILAND ECONOMIC MONITOR JUNE 2010
2008 2009 2009 2010 2010
Year Year Q2 Q3 Q4 Q1 Apr May
Financial Markets
Domestic credit (% change, previous
year) 6/ 9.3 3.1 2.9 0.4 3.1 6.0 6.0 ..
Short-term interest rate
(average period) 7/ 3.40 1.35 1.25 1.25 1.25 1.25 1.25 1.25
Exchange rate (average period) 33.4 34.3 34.7 34.0 33.3 33.0 34.0 33.8
Real effective exchange rate (2000=100,
+ = appn) 8/ 112.8 108.8 109.6 108.4 107.8 111.1 113.9 115.1
(% change, previous year) 0.5 -3.6 -5.1 -2.6 -1.9 1.6 1.5 3.1
Stock market index (SET), end of period 450 735 597 717 735 788 764 750
Memo Items:
Nominal GDP (Billion baht) 272.0 263.7 63.4 65.8 72.6 73.0 .. ..
Nominal GDP (Billion USD) 9,075.5 9,050.7 2,203.9 2,236.0 2,417.0 2,406.6 .. ..
Real per capita GNI (constant 2000 US
dollars) 3,055.0 2,950.1 .. .. .. .. .. ..
1/ Average wage of employed person from Labour force survey, National Statistical Office deflated by CPI inflation
2/ Cash balance of central government.
3/ Includes domestic central government (CG) debt, domestic debt of non-financial state enterprise and Financial institutions
Development fund (FIDF) debt.
4/ Non-Bank FDI
5/ Source: Bank of Thailand
6/ IFS definition (net credit to the nonfinancial public sector, credit to the private sector, and other accounts).
7/ BoT Policy Rate (end of day liquidity adjustment window, average of borrowing and lending facilities).
8/ Source: Bank for International Settlements

77 ‹‹ T
HA
ILA
ND
EC
ON
OM
IC M
ON
ITO
R J
UN
E 2
010
Appendix 2: Monitoring Matrices for Structural Reform Implementation
1. Poverty Reduction
2. Financial and Corporate Sector Reforms
3. Reforms to Improve Business and Investment Environment and Trade Regime
4. Public Sector and Governance Reform
5. Social Protection

78 ‹‹ T
HA
ILA
ND
EC
ON
OM
IC M
ON
ITO
R J
UN
E 2
010
1. Poverty Reduction
Objective Reform Measures Taken
A. Improve quality of life for
the poor by enhancing self-
reliance and creating
opportunities in the local
economy
Measures taken over last 6 months and significance
A project to restructure debt and enhance career of farmers is put forward. The initiative aims to benefit
510,000 farmers, with the budget of 1.14 billion baht for FY10 allocated to the Farmers‘ Reconstruction and
Development Fund (FRDF). The budget, increasing to 2.2-2.5 billion baht each in 2011 and 2012, will be used to
restructure farmers‘ debt and restore farmers‘ careers through lower production cost and higher productivity. Up
to four specialized financial institutions work with FRDF to channel the resources. Target farmers are grouped
according to criteria such as whether they have any outstanding non-performing loans, are FRDF member, and
registered in a debt record system. Debt relief will generally amount to interest charges plus half of the total
outstanding debt value if farmers pay off the other half of their debt within the agreed timeframe and not
exceeding 15 years.
Draft Prime Minister Office rule on community deed. As part of land ownership distribution, the issuance of
community deeds to communities will allow them to jointly use and manage publicly-owned pieces of land,
mainly to benefit housing stability and full utilization of public land. A committee will be set up, and is
responsible for designing policies, work program, budgeting that will be proposed to the cabinet. There will be at
least 30 pilot areas at the start of the scheme.
Measures to reduce cost of living are extended to end-2010. Previously set to end in mid-2010, these measures
include (i) free electricity bills for low-volume users (not exceeding 90 units per months), (ii) free public buses in
Bangkok up to 800 buses per day in 73 routes, and (iii) free third-class public train services for both short and
long-distance routes. Free water supply services were discontinued from March 2010. The total implementation
cost amounts to around 4.5 billion baht.
Draft Royal Decree on tax measures to support disabled persons is approved by the cabinet. Individual and
corporate income taxes are waived for enterprises or individuals that employ registered disabled persons. The tax
amount exempted will be equal to the compensation value of disabled employees. In addition to compensation,
taxes are also waived for expenditures on equipment, facilities and transportation especially designed for disabled
persons.
The cabinet approves projects on market development and enhancing rubber value-added. The Rubber
Estate Organization will implement two projects to support rubber farmers: (i) setting up centers in six provinces
to buy rubber products directly from farmers and to sell rubber production factors at fair prices, and (ii)
establishing block rubber production plants in three provinces to process/add value to rubber products. The total
budget is 476 million baht. Prepared by Vatcharin Sirimaneetham.

79 ‹‹ T
HA
ILA
ND
EC
ON
OM
IC M
ON
ITO
R J
UN
E 2
010
2. Financial and Corporate Sectors Reforms
Objective Reform Measures Taken
A. Enable sharing of credit
information among
financial institutions
Measure to be taken in the next 6-12 months
A national credit-scoring system is on process as planned. The National Credit Bureau (NCB) plans to
launch the Consumer Credit Scoring and Bureau Statistic Report in March 2010. In addition, the NCB plans to
test-run the Commercial Credit Scoring for 10 months before the official launch in 2011.
Measure to be taken, but delayed
The Government‟s plan on submission of credit information by insurance firms will be reconsidered
again when the time is appropriate. The decision on whether insurance companies are required to report their
information of customers to the NCB has not yet been finalized.
B. Formulate and implement
a medium-term strategy for
Thai financial sector
Measure taken over last 6 months and significance
Further relaxation of foreign exchange control regulations. Bank of Thailand (BOT) further relaxed foreign
exchange regulations related to investment abroad, foreign exchange hedging transactions and corporate treasury
centers. Latest relaxation in August 2009 has provided importers and exporters more flexibility in managing their
exchange rate risk.
Measure to be taken in the next 6-12 months
The Financial Sector Master Plan (FSMP) Phase II is on track. On November 4, 2009 the Economic Cabinet
approved the second phase of the FSMP. The plan aims in setting the goals and strategic direction for continuous
development of financial sector. The master plan is implemented during 2010 – 2014.
C. Transition from the current
blanket government
guarantee on deposits to a
limited deposit insurance
Measure to be taken, but delayed
Blanket guarantee on customer deposit is extended until 2011.The deposit protection will be limited to THB
50 million and THB 1 million per person per financial institution on 11 August 2011 and 2012 respectively.
D. Remove legal impediments
and provide an enabling
environment.
Measure taken over last 6 months and significance
Waiver of investment advisor license. To promote investment in the Thai capital market and ensure adequate
information for investors‘ decision making, the Securities and Exchange Commission (SEC) Board allowed
foreign securities and derivatives business operators to disseminate their research papers and/or give investment
advice to local retail investors without the need to obtain investment advisor or derivatives advisor licenses.
However those foreign operators must be screened by local securities firms as being competent and reliable
foreign firms regulated by International Organization of Securities Commissions (IOSCO)‘s ordinary members
and allowed to give advice in their home jurisdictions. The waiver is effective on February 1, 2010.
E. Development the domestic
financial markets,
including bond, capital, and money markets
Measures taken over last 6 months and significance
The Thailand Securities Depository Co.Ltd. (TSD) transferred its clearing and settlement unit to Thailand
Clearing House Co.Ltd. (TCH) on February 15, 2010. This makes a clear operation between TCH and TSD,
gives stronger protection for investors‘ assets stored in the depository, and reduces cost of managing risk and
placing collateral, thus bringing the Thai capital market‘s post-trade services more in line with international
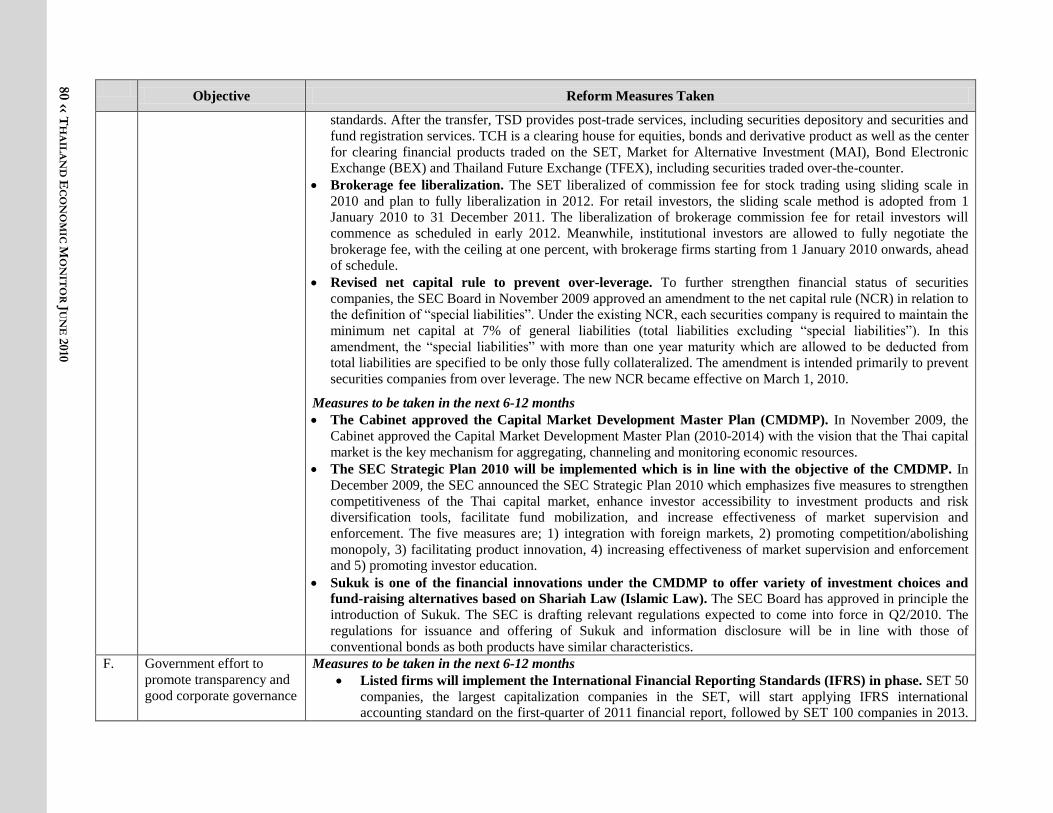
80 ‹‹ T
HA
ILA
ND
EC
ON
OM
IC M
ON
ITO
R J
UN
E 2
010
Objective Reform Measures Taken
standards. After the transfer, TSD provides post-trade services, including securities depository and securities and
fund registration services. TCH is a clearing house for equities, bonds and derivative product as well as the center
for clearing financial products traded on the SET, Market for Alternative Investment (MAI), Bond Electronic
Exchange (BEX) and Thailand Future Exchange (TFEX), including securities traded over-the-counter.
Brokerage fee liberalization. The SET liberalized of commission fee for stock trading using sliding scale in
2010 and plan to fully liberalization in 2012. For retail investors, the sliding scale method is adopted from 1
January 2010 to 31 December 2011. The liberalization of brokerage commission fee for retail investors will
commence as scheduled in early 2012. Meanwhile, institutional investors are allowed to fully negotiate the
brokerage fee, with the ceiling at one percent, with brokerage firms starting from 1 January 2010 onwards, ahead
of schedule.
Revised net capital rule to prevent over-leverage. To further strengthen financial status of securities
companies, the SEC Board in November 2009 approved an amendment to the net capital rule (NCR) in relation to
the definition of ―special liabilities‖. Under the existing NCR, each securities company is required to maintain the
minimum net capital at 7% of general liabilities (total liabilities excluding ―special liabilities‖). In this
amendment, the ―special liabilities‖ with more than one year maturity which are allowed to be deducted from
total liabilities are specified to be only those fully collateralized. The amendment is intended primarily to prevent
securities companies from over leverage. The new NCR became effective on March 1, 2010.
Measures to be taken in the next 6-12 months
The Cabinet approved the Capital Market Development Master Plan (CMDMP). In November 2009, the
Cabinet approved the Capital Market Development Master Plan (2010-2014) with the vision that the Thai capital
market is the key mechanism for aggregating, channeling and monitoring economic resources.
The SEC Strategic Plan 2010 will be implemented which is in line with the objective of the CMDMP. In
December 2009, the SEC announced the SEC Strategic Plan 2010 which emphasizes five measures to strengthen
competitiveness of the Thai capital market, enhance investor accessibility to investment products and risk
diversification tools, facilitate fund mobilization, and increase effectiveness of market supervision and
enforcement. The five measures are; 1) integration with foreign markets, 2) promoting competition/abolishing
monopoly, 3) facilitating product innovation, 4) increasing effectiveness of market supervision and enforcement
and 5) promoting investor education.
Sukuk is one of the financial innovations under the CMDMP to offer variety of investment choices and
fund-raising alternatives based on Shariah Law (Islamic Law). The SEC Board has approved in principle the
introduction of Sukuk. The SEC is drafting relevant regulations expected to come into force in Q2/2010. The
regulations for issuance and offering of Sukuk and information disclosure will be in line with those of
conventional bonds as both products have similar characteristics.
F. Government effort to
promote transparency and
good corporate governance
Measures to be taken in the next 6-12 months
Listed firms will implement the International Financial Reporting Standards (IFRS) in phase. SET 50
companies, the largest capitalization companies in the SET, will start applying IFRS international
accounting standard on the first-quarter of 2011 financial report, followed by SET 100 companies in 2013.

81 ‹‹ T
HA
ILA
ND
EC
ON
OM
IC M
ON
ITO
R J
UN
E 2
010
Objective Reform Measures Taken
By 2015, IFRS will be a mandatory requirement for all companies listed on the SET and the MAI.
The securities companies and derivative brokers will implement the International Financial
Reporting Standards (IFRS) and the International Accounting Standards (IAS). The Accounting
Standards-Setting Committee is in the process of revising current Thai accounting standards and laying out
new accounting and financial reporting standards in line with the International Financial Report Standards
(IFRS) and the International Accounting Standards (IAS). The revised and newly issued standards, which
will affect bookkeeping systems of securities business operators in different degrees, are expected to
become effective one after another from the year 2011 onwards. Prepared by Ratchada Anantavrasilpa

82 ‹‹ T
HA
ILA
ND
EC
ON
OM
IC M
ON
ITO
R J
UN
E 2
010
3. Reforms to Improve Business and Investment Environment and Trade Regime
Objective Reform Measures Taken
A. Improve competitiveness of
business sector
Measures taken over last 6 months and significance
Food industry master plan (2010-2014). The plan aims to advance Thailand‘s food industry by processing
agricultural products with frontier technology and innovation, upgrading production efficiency and food safety,
and introducing new products. Consumer awareness, quality assurance, and environmental protection are also
core strategies. Among others, the targets include raising the share of processed food exports in total food
exports to at least 60 percent and ensuring that at least half of food production establishments are internationally
accredited.
Draft development strategy for Para rubber (2009-2013). The cabinet agreed with the plan that seeks to
enhance rubber production efficiency, increase value-added through processing and product development,
promote the production of quality materials, develop domestic and overseas markets, and raise farmer income
through carbon credit scheme. These goals can be achieved through innovative government support programs,
enhanced public management system, stronger international cooperation (e.g. with ASEAN), R&D, and human
resources development. A national committee on natural rubber policies will be key coordinating agency.
Operational plan for fishery master plan (2009-2013) and fishery act. In this phase 1, the operational plan
covers five strategies, including improving the efficiency and participation in fishery management system,
restructuring fishery industry and organizations, conducting fishery in a responsible and sustainable ways,
developing fishery sources to promote environment and biodiversity, and encouraging fishery activities outside
Thailand. A total of 88 projects are designed as part of these strategies. The Fishery act is also approved. A
national fishery policy committee will be set up. There will be several sub-committees that are responsible for
issues such as fishery data collection and research, regulating domestic fishery activities, and setting Thailand‘s
fishery zones.
Thailand signed various agreements and memorandums of understanding (MoU) with foreign
counterparts. (i) MoU on agriculture with Chile that covers agricultural production, agricultural cooperatives,
farmer institute, and biodiversity management and conservation. The partnership will be in terms of research
projects and exchange of researchers. (ii) MoU on agriculture with South Africa, to promote bilateral technology
transfers and agricultural trade through capacity building schemes, training, technical assistance projects, and
exchange of researchers. (iii) MoU on agriculture with South Korea‘s rural development agency. (iv)
Cooperation on science and technology with Slovenia through a new joint committee that is responsible for
activities such as exchange of scientists and joint conferences. (v) Five-year joint operational plan with Spain,
which seeks to promote bilateral trade and investment and intellectual property rights protection. Other areas
include culture and education, defense, and environmental conservation.
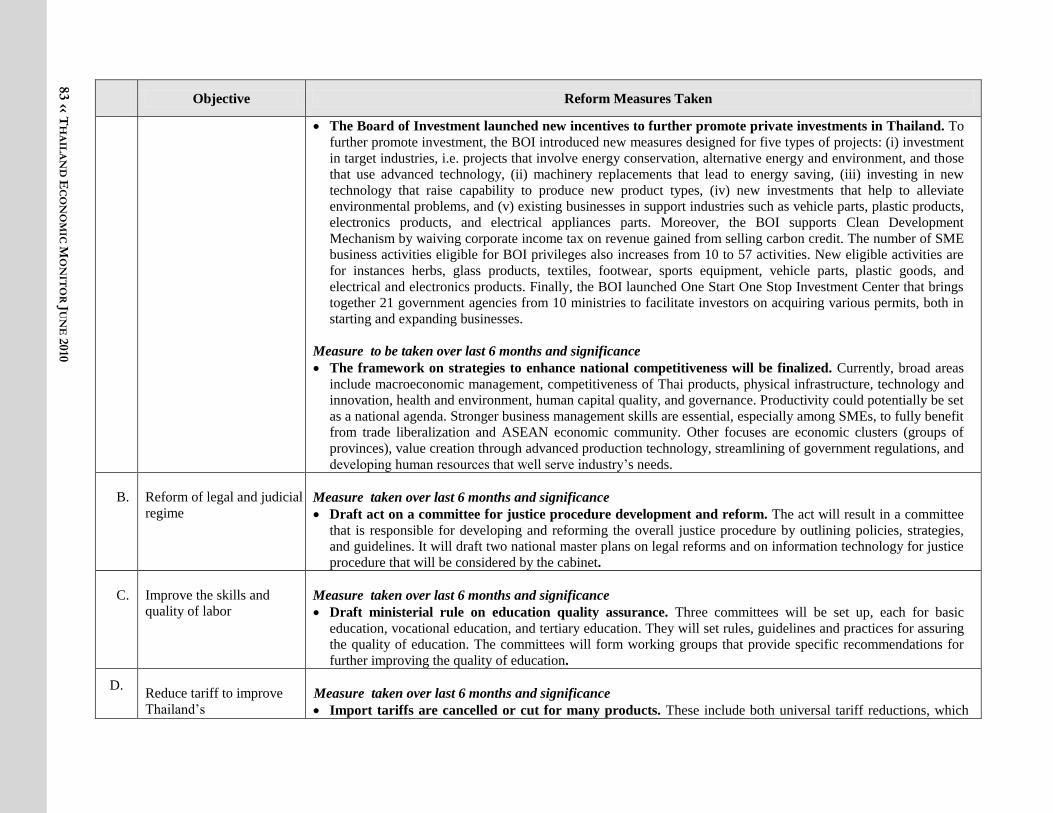
83 ‹‹ T
HA
ILA
ND
EC
ON
OM
IC M
ON
ITO
R J
UN
E 2
010
Objective Reform Measures Taken
The Board of Investment launched new incentives to further promote private investments in Thailand. To
further promote investment, the BOI introduced new measures designed for five types of projects: (i) investment
in target industries, i.e. projects that involve energy conservation, alternative energy and environment, and those
that use advanced technology, (ii) machinery replacements that lead to energy saving, (iii) investing in new
technology that raise capability to produce new product types, (iv) new investments that help to alleviate
environmental problems, and (v) existing businesses in support industries such as vehicle parts, plastic products,
electronics products, and electrical appliances parts. Moreover, the BOI supports Clean Development
Mechanism by waiving corporate income tax on revenue gained from selling carbon credit. The number of SME
business activities eligible for BOI privileges also increases from 10 to 57 activities. New eligible activities are
for instances herbs, glass products, textiles, footwear, sports equipment, vehicle parts, plastic goods, and
electrical and electronics products. Finally, the BOI launched One Start One Stop Investment Center that brings
together 21 government agencies from 10 ministries to facilitate investors on acquiring various permits, both in
starting and expanding businesses.
Measure to be taken over last 6 months and significance
The framework on strategies to enhance national competitiveness will be finalized. Currently, broad areas
include macroeconomic management, competitiveness of Thai products, physical infrastructure, technology and
innovation, health and environment, human capital quality, and governance. Productivity could potentially be set
as a national agenda. Stronger business management skills are essential, especially among SMEs, to fully benefit
from trade liberalization and ASEAN economic community. Other focuses are economic clusters (groups of
provinces), value creation through advanced production technology, streamlining of government regulations, and
developing human resources that well serve industry‘s needs.
B. Reform of legal and judicial
regime
Measure taken over last 6 months and significance
Draft act on a committee for justice procedure development and reform. The act will result in a committee
that is responsible for developing and reforming the overall justice procedure by outlining policies, strategies,
and guidelines. It will draft two national master plans on legal reforms and on information technology for justice
procedure that will be considered by the cabinet.
C. Improve the skills and
quality of labor
Measure taken over last 6 months and significance
Draft ministerial rule on education quality assurance. Three committees will be set up, each for basic
education, vocational education, and tertiary education. They will set rules, guidelines and practices for assuring
the quality of education. The committees will form working groups that provide specific recommendations for
further improving the quality of education.
D.
Reduce tariff to improve
Thailand‘s
Measure taken over last 6 months and significance
Import tariffs are cancelled or cut for many products. These include both universal tariff reductions, which
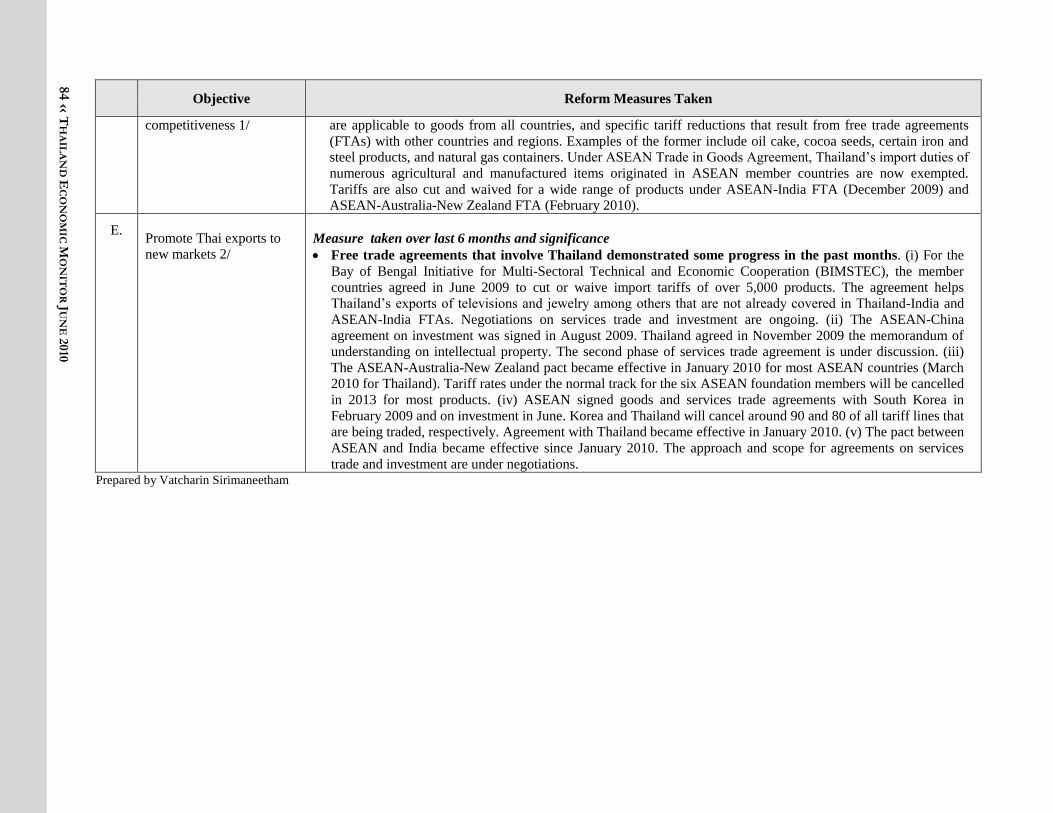
84 ‹‹ T
HA
ILA
ND
EC
ON
OM
IC M
ON
ITO
R J
UN
E 2
010
Objective Reform Measures Taken
competitiveness 1/
are applicable to goods from all countries, and specific tariff reductions that result from free trade agreements
(FTAs) with other countries and regions. Examples of the former include oil cake, cocoa seeds, certain iron and
steel products, and natural gas containers. Under ASEAN Trade in Goods Agreement, Thailand‘s import duties of
numerous agricultural and manufactured items originated in ASEAN member countries are now exempted.
Tariffs are also cut and waived for a wide range of products under ASEAN-India FTA (December 2009) and
ASEAN-Australia-New Zealand FTA (February 2010).
E.
Promote Thai exports to
new markets 2/
Measure taken over last 6 months and significance
Free trade agreements that involve Thailand demonstrated some progress in the past months. (i) For the
Bay of Bengal Initiative for Multi-Sectoral Technical and Economic Cooperation (BIMSTEC), the member
countries agreed in June 2009 to cut or waive import tariffs of over 5,000 products. The agreement helps
Thailand‘s exports of televisions and jewelry among others that are not already covered in Thailand-India and
ASEAN-India FTAs. Negotiations on services trade and investment are ongoing. (ii) The ASEAN-China
agreement on investment was signed in August 2009. Thailand agreed in November 2009 the memorandum of
understanding on intellectual property. The second phase of services trade agreement is under discussion. (iii)
The ASEAN-Australia-New Zealand pact became effective in January 2010 for most ASEAN countries (March
2010 for Thailand). Tariff rates under the normal track for the six ASEAN foundation members will be cancelled
in 2013 for most products. (iv) ASEAN signed goods and services trade agreements with South Korea in
February 2009 and on investment in June. Korea and Thailand will cancel around 90 and 80 of all tariff lines that
are being traded, respectively. Agreement with Thailand became effective in January 2010. (v) The pact between
ASEAN and India became effective since January 2010. The approach and scope for agreements on services
trade and investment are under negotiations. Prepared by Vatcharin Sirimaneetham

85 ‹‹ T
HA
ILA
ND
EC
ON
OM
IC M
ON
ITO
R J
UN
E 2
010
4. Public Sector and Governance Reform39
Objective Reform Measures Taken
A.
Improving public service
quality by streamlining
and redesigning work
processes and procedures
Measure taken over last 6 months and significance
MOF announcement on rules and principles on borrowing for social and economic development is
approved by the cabinet in principles in March 2010. By the Public Debt Management Act (2005), MOF is
authorized to borrow for the purpose of social and economic development and guarantee debt creating by SOEs
or SFIs. In order to implement the Act effectively, MOF has drafted rules and principles in borrowing and
public debt guarantee accordingly. The announcement specifies that MOF is allowed to borrow with the limit of
10% of total budget expenditure of that particular fiscal year and no exceed the ceiling of public debt borrowing
plan approved by cabinet annually. Borrowing can be made for projects that need financing in addition to annual
budget appropriation and in foreign currency. The borrowing should be made in foreign currency form, except
that domestic market is fundamentally strong to raise fund. For the loan guarantee to SOEs and SFIs, the limit of
government guarantee is at 20% of total budget expenditure and no exceed ceiling of publicly guaranteed plan
approved by cabinet annually.
B. Changing roles,
responsibilities, and
rightsizing the government
bureaucracy by
restructuring public
administration and
improving
intergovernmental
relations at all levels
Measures taken over last 6 months and significance
Code of Ethics of the Civil Service was approved by the Cabinet and announced in the Royal Gazette in
November 2009 to provide the basis for ethical standards as well as mechanism to ensure such standard for the Civil Service. By the Constitution of the Kingdom of Thailand B.E. 250 Section 279, specifies that
ethical standards of those hold political positions, civil service officials, or government officers must abide by
the established Code of Ethics of the Civil Service. There must be mechanism and functional system to
efficiently enforce the Code and also set the punishment process according or the malignity of action. Violation
or neglecting to comply with ethical standards is considered perpetration of disciplines. The part of ethics of
civil service officials provides a list of moral action that officials must adhere to and insist in perform righteous.
Civil Service Commission appoints Ethics Committee, proposed by head of government agency for each
government agency to monitor and supervise Code of Ethics. The Head of Ethics Protection Work Group will
act as a secretary of the Committee. The committee is responsible for monitoring, supervision, and providing
recommendation regarding the Code for the government agency and submits Code of Ethics performance report
of the Work Group to the head of government agency to use that report in conjunction with the process of salary
increase and promotion. The Work Group performs the duty in finding fact regarding the breach of the Code as
requested by officials or as the Work group considers appropriate.
Draft of Local Revenue Act was approved by the Cabinet in December 2009. By the Constitution (B.E.
2550) Section 283, clause 4 stipulates that there shall be the law on local revenue determines the powers and
duties in taxation and other revenue of local government organizations attached with appropriate rules for each
category of tax. The essence of the Act includes determination of local revenue from tax and non-tax, donation,
and commercialization as well as principles, procedure and tax rates in relating to revenue allocation. The Draft
is currently submitted to the Council of State for consideration.
39 The objectives detailed in this matrix are consistent with the Government‘s Public Sector Development Strategy (2003-2007) and the more recent Public Affairs Management
Plan.
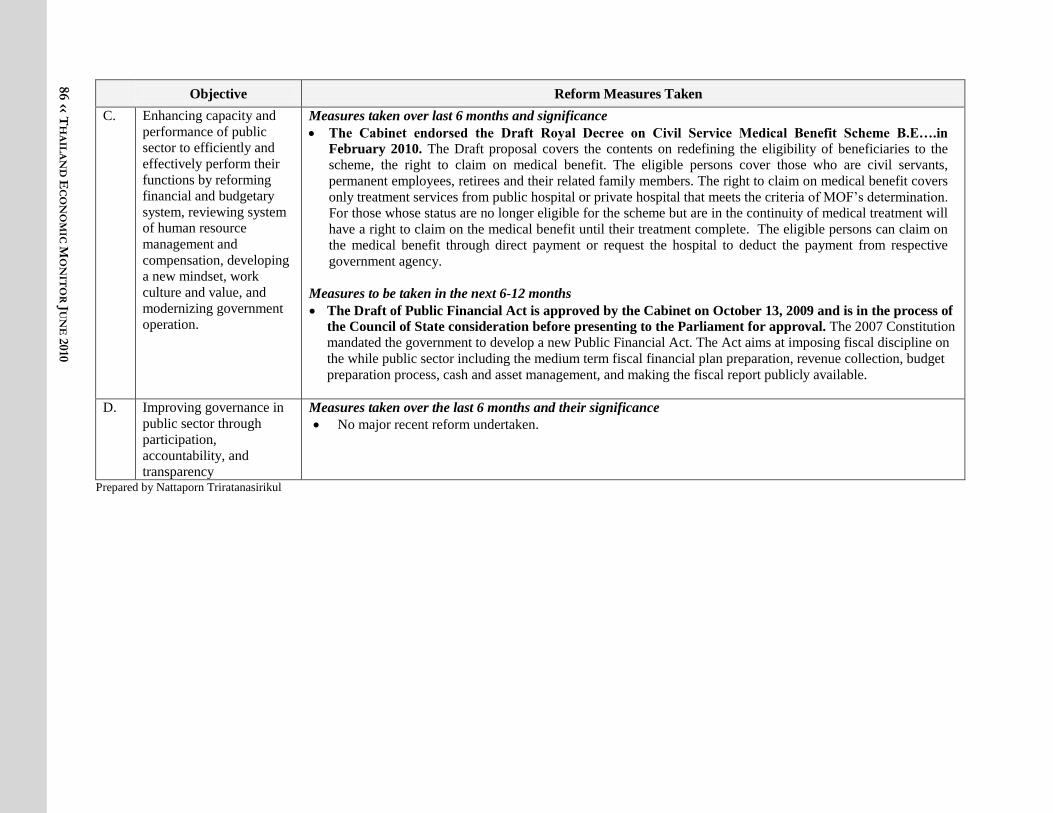
86 ‹‹ T
HA
ILA
ND
EC
ON
OM
IC M
ON
ITO
R J
UN
E 2
010
Objective Reform Measures Taken
C. Enhancing capacity and
performance of public
sector to efficiently and
effectively perform their
functions by reforming
financial and budgetary
system, reviewing system
of human resource
management and
compensation, developing
a new mindset, work
culture and value, and
modernizing government
operation.
Measures taken over last 6 months and significance
The Cabinet endorsed the Draft Royal Decree on Civil Service Medical Benefit Scheme B.E….in
February 2010. The Draft proposal covers the contents on redefining the eligibility of beneficiaries to the
scheme, the right to claim on medical benefit. The eligible persons cover those who are civil servants,
permanent employees, retirees and their related family members. The right to claim on medical benefit covers
only treatment services from public hospital or private hospital that meets the criteria of MOF‘s determination.
For those whose status are no longer eligible for the scheme but are in the continuity of medical treatment will
have a right to claim on the medical benefit until their treatment complete. The eligible persons can claim on
the medical benefit through direct payment or request the hospital to deduct the payment from respective
government agency.
Measures to be taken in the next 6-12 months
The Draft of Public Financial Act is approved by the Cabinet on October 13, 2009 and is in the process of
the Council of State consideration before presenting to the Parliament for approval. The 2007 Constitution
mandated the government to develop a new Public Financial Act. The Act aims at imposing fiscal discipline on
the while public sector including the medium term fiscal financial plan preparation, revenue collection, budget
preparation process, cash and asset management, and making the fiscal report publicly available.
D. Improving governance in
public sector through
participation,
accountability, and
transparency
Measures taken over the last 6 months and their significance
No major recent reform undertaken.
Prepared by Nattaporn Triratanasirikul
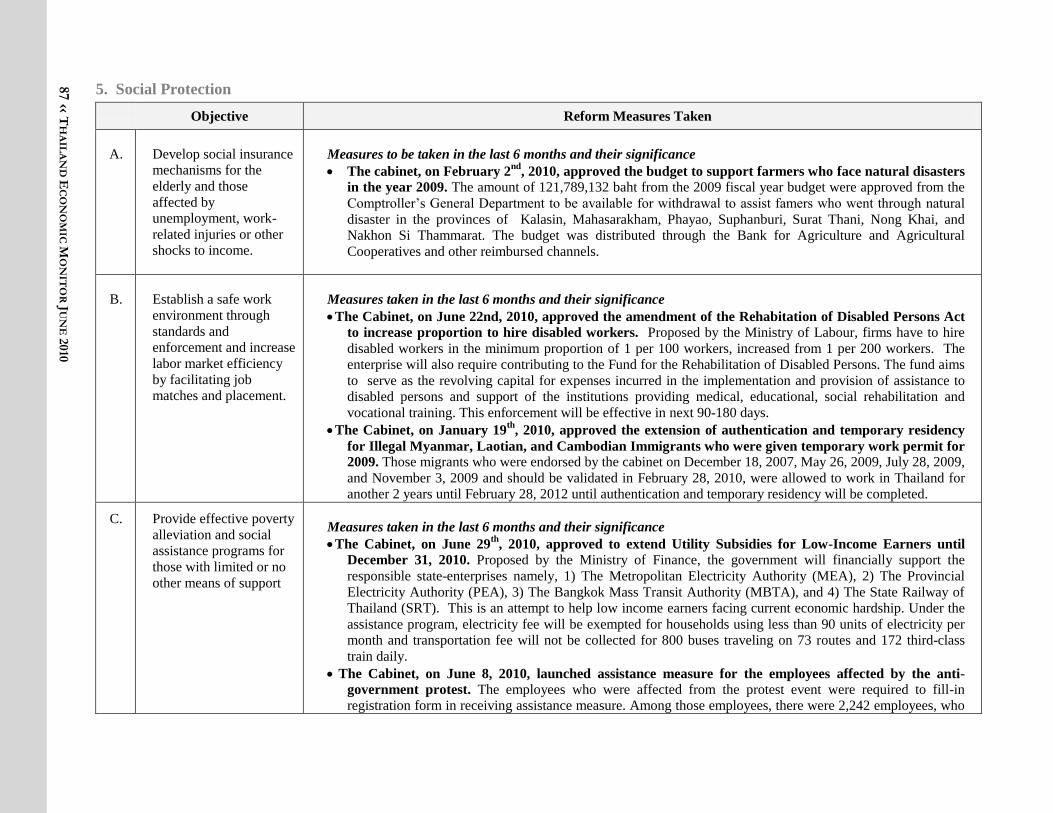
87 ‹‹ T
HA
ILA
ND
EC
ON
OM
IC M
ON
ITO
R J
UN
E 2
010
5. Social Protection
Objective Reform Measures Taken
A.
Develop social insurance
mechanisms for the
elderly and those
affected by
unemployment, work-
related injuries or other
shocks to income.
Measures to be taken in the last 6 months and their significance
The cabinet, on February 2nd
, 2010, approved the budget to support farmers who face natural disasters
in the year 2009. The amount of 121,789,132 baht from the 2009 fiscal year budget were approved from the
Comptroller‘s General Department to be available for withdrawal to assist famers who went through natural
disaster in the provinces of Kalasin, Mahasarakham, Phayao, Suphanburi, Surat Thani, Nong Khai, and
Nakhon Si Thammarat. The budget was distributed through the Bank for Agriculture and Agricultural
Cooperatives and other reimbursed channels.
B.
Establish a safe work
environment through
standards and
enforcement and increase
labor market efficiency
by facilitating job
matches and placement.
Measures taken in the last 6 months and their significance
The Cabinet, on June 22nd, 2010, approved the amendment of the Rehabitation of Disabled Persons Act
to increase proportion to hire disabled workers. Proposed by the Ministry of Labour, firms have to hire
disabled workers in the minimum proportion of 1 per 100 workers, increased from 1 per 200 workers. The
enterprise will also require contributing to the Fund for the Rehabilitation of Disabled Persons. The fund aims
to serve as the revolving capital for expenses incurred in the implementation and provision of assistance to
disabled persons and support of the institutions providing medical, educational, social rehabilitation and
vocational training. This enforcement will be effective in next 90-180 days.
The Cabinet, on January 19th
, 2010, approved the extension of authentication and temporary residency
for Illegal Myanmar, Laotian, and Cambodian Immigrants who were given temporary work permit for 2009. Those migrants who were endorsed by the cabinet on December 18, 2007, May 26, 2009, July 28, 2009,
and November 3, 2009 and should be validated in February 28, 2010, were allowed to work in Thailand for
another 2 years until February 28, 2012 until authentication and temporary residency will be completed.
C. Provide effective poverty
alleviation and social
assistance programs for
those with limited or no
other means of support
Measures taken in the last 6 months and their significance
The Cabinet, on June 29th
, 2010, approved to extend Utility Subsidies for Low-Income Earners until
December 31, 2010. Proposed by the Ministry of Finance, the government will financially support the
responsible state-enterprises namely, 1) The Metropolitan Electricity Authority (MEA), 2) The Provincial
Electricity Authority (PEA), 3) The Bangkok Mass Transit Authority (MBTA), and 4) The State Railway of
Thailand (SRT). This is an attempt to help low income earners facing current economic hardship. Under the
assistance program, electricity fee will be exempted for households using less than 90 units of electricity per
month and transportation fee will not be collected for 800 buses traveling on 73 routes and 172 third-class
train daily.
The Cabinet, on June 8, 2010, launched assistance measure for the employees affected by the anti-
government protest. The employees who were affected from the protest event were required to fill-in
registration form in receiving assistance measure. Among those employees, there were 2,242 employees, who

88 ‹‹ T
HA
ILA
ND
EC
ON
OM
IC M
ON
ITO
R J
UN
E 2
010
Objective Reform Measures Taken
were covered by the Social Security but could not retain their jobs, were financially compensated with one-
month salary in total valued in 24,502,935 baht. There were other 1,325 employees who are not covered by
the Social Security received 7,500 baht for a month salary with total valued of 9,937,500 baht. If the
employees were retired but having right to receive compensation and severance pay according to the Labour
Protection Act, they would receive 50 percent of the hiring rate but not over 7,500 baht per month
The Cabinet, on March 23, 2010, approved the principles on implementation of children development
projects in communities. Supported by Ministry of Public Health and Ministry of Education, the expenditure
will be disbursed from the 2010 central fiscal budget in the total amount 97,508,472 baht. The payment details
will be furthered planned by the Bureau of Budget.
The Cabinet, on March 23rd
, 2010, approved the set up of “Health Service Funds for Individuals who
have Status and Rights Problems”, Proposed by the National Health Security Office, the total amount of
472,823,683 baht will be allocated for 457,409 individuals who have status and rights problems. The fund
aims promoting basic health rights include health support, medical treatment, health restoration, and disease
prevention.
Prepared by Piriya Pholphirul