th quarter and full year fy15 resultsacmkentico-dev.s3.amazonaws.com/astrocorporate/media/...limited...
TRANSCRIPT
4th quarter and full year FY15 results
30th March 2015
1 |
This document contains certain forward-looking statements with respect to Astro Malaysia Holdings Berhad’s (“Astro”) financial condition,
results of operations and business, and management’s strategy, plans and objectives for Astro. These statements include, without limitation,
those that express forecasts, expectations and projections such as forecasts, expectations and projections in relation to new products and
services, revenue, profit, cash flow, operational metrics etc.
These statements (and all other forward-looking statements contained in this document) are not guarantees of future performance and are
subject to risks, uncertainties and other factors, some of which are beyond Astro’s control, are difficult to predict and could cause actual
results to differ materially from those expressed or implied or forecast in the forward-looking statements. These factors include, but are not
limited to, the fact that Astro operates in a competitive environment that is subject to rapid change, the effects of laws and government
regulation upon Astro’s activities, its reliance on technology which is subject to risk of failure, change and development, the fact that Astro is
reliant on encryption and other technologies to restrict unauthorised access to its services, failure of key suppliers, risks inherent in the
implementation of large-scale capital expenditure projects, and the fact that Astro relies on intellectual property and proprietary rights which
may not be adequately protected under current laws or which may be subject to unauthorised use.
All forward-looking statements in this presentation are based on information known to Astro on the date hereof. Astro undertakes no
obligation publicly to update or revise any forward-looking statements, whether as a result of new information, future events or otherwise.
This presentation has been prepared by Astro. The information in this presentation, including forward-looking statements, has not been
independently verified. Without limiting any of the foregoing in this disclaimer, no representation or warranty, express or implied, is made as
to, and no reliance should be placed on, the fairness, accuracy or completeness of such information. Astro and its subsidiaries, affiliates,
representatives and advisers shall have no liability whatsoever (whether in negligence or otherwise) for any loss, damage, costs or expenses
howsoever arising out of or in connection with this presentation.
Disclaimer
4QFY15 results
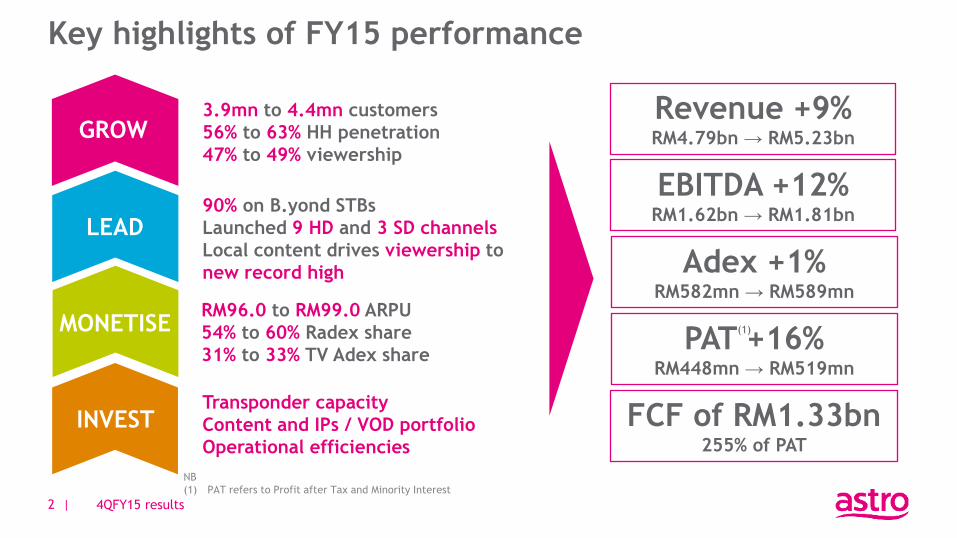
RM96.0 to RM99.0 ARPU
54% to 60% Radex share
31% to 33% TV Adex share
3.9mn to 4.4mn customers
56% to 63% HH penetration
47% to 49% viewership
Transponder capacity
Content and IPs / VOD portfolio
Operational efficiencies
2 |
Revenue +9% RM4.79bn → RM5.23bn
FCF of RM1.33bn 255% of PAT
Adex +1% RM582mn → RM589mn
GROW
MONETISE
LEAD
INVEST
EBITDA +12% RM1.62bn → RM1.81bn
PAT +16% RM448mn → RM519mn
Key highlights of FY15 performance
4QFY15 results
90% on B.yond STBs
Launched 9 HD and 3 SD channels
Local content drives viewership to
new record high
(1)
NB
(1) PAT refers to Profit after Tax and Minority Interest
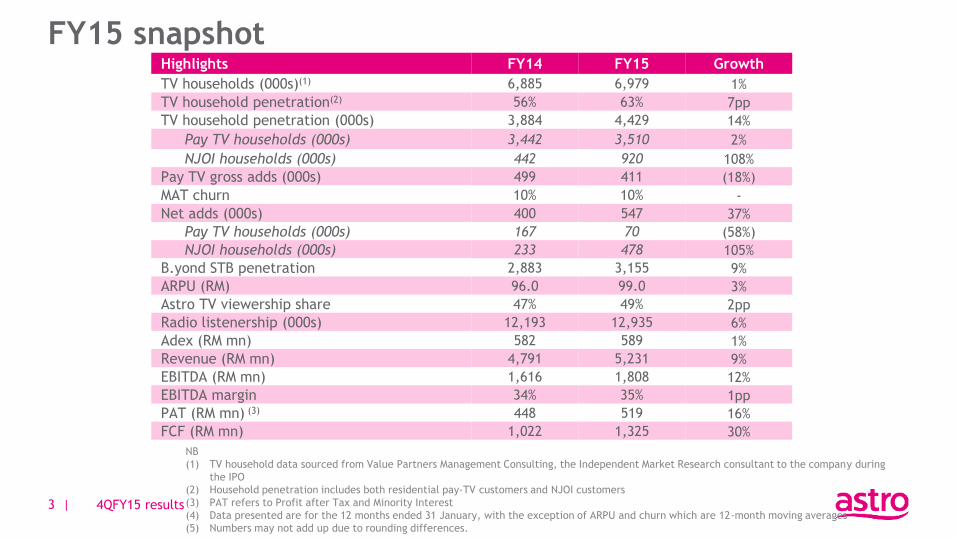
FY15 snapshot
3 |
Highlights FY14 FY15 Growth
TV households (000s)(1) 6,885 6,979 1%
TV household penetration(2) 56% 63% 7pp
TV household penetration (000s) 3,884 4,429 14%
Pay TV households (000s) 3,442 3,510 2%
NJOI households (000s) 442 920 108%
Pay TV gross adds (000s) 499 411 (18%)
MAT churn 10% 10% -
Net adds (000s) 400 547 37%
Pay TV households (000s) 167 70 (58%)
NJOI households (000s) 233 478 105%
B.yond STB penetration 2,883 3,155 9%
ARPU (RM) 96.0 99.0 3%
Astro TV viewership share 47% 49% 2pp
Radio listenership (000s) 12,193 12,935 6%
Adex (RM mn) 582 589 1%
Revenue (RM mn) 4,791 5,231 9%
EBITDA (RM mn) 1,616 1,808 12%
EBITDA margin 34% 35% 1pp
PAT (RM mn) (3) 448 519 16%
FCF (RM mn) 1,022 1,325 30%
NB
(1) TV household data sourced from Value Partners Management Consulting, the Independent Market Research consultant to the company during
the IPO
(2) Household penetration includes both residential pay-TV customers and NJOI customers
(3) PAT refers to Profit after Tax and Minority Interest
(4) Data presented are for the 12 months ended 31 January, with the exception of ARPU and churn which are 12-month moving averages
(5) Numbers may not add up due to rounding differences.
4QFY15 results
4 |
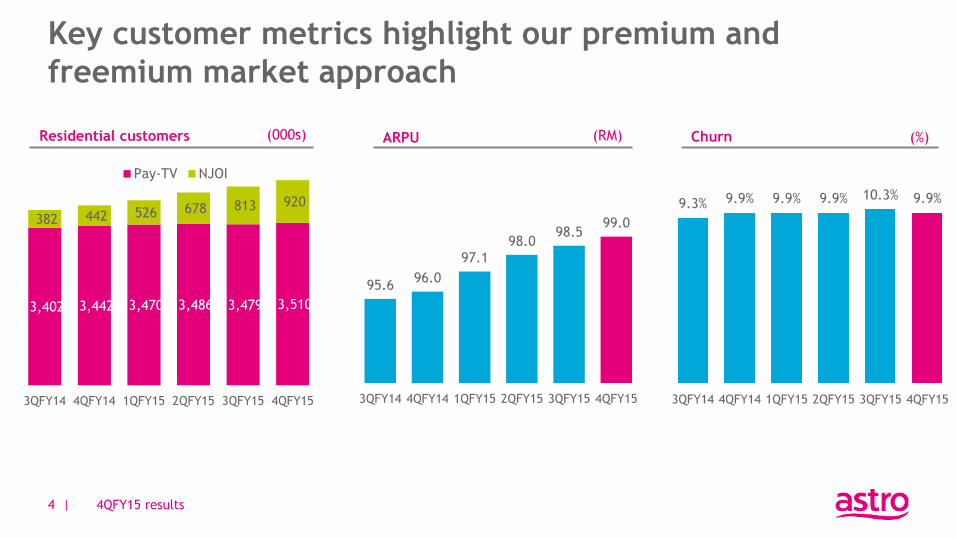
3,402 3,442 3,470 3,486 3,479 3,510
382 442 526 678 813 920
3QFY14 4QFY14 1QFY15 2QFY15 3QFY15 4QFY15
Pay-TV NJOI
Residential customers (000s)
95.6 96.0
97.1 98.0
98.5 99.0
3QFY14 4QFY14 1QFY15 2QFY15 3QFY15 4QFY15
ARPU (RM)
9.3% 9.9% 9.9% 9.9% 10.3% 9.9%
3QFY14 4QFY14 1QFY15 2QFY15 3QFY15 4QFY15
Churn (%)
Key customer metrics highlight our premium and
freemium market approach
4QFY15 results

5 |
1,611 1,675 1,780 1,877 1,917 1,939
3Q14 4Q14 1Q15 2Q15 3Q15 4Q15
(000s)
468 532 585 636 679 715
3Q14 4Q14 1Q15 2Q15 3Q15 4Q15
(000s)
Penetration(1)
60% 60% 58%
Multiroom
289 312 335 359 372 386
3Q14 4Q14 1Q15 2Q15 3Q15 4Q15
(000s)
875 902 918 961 960 967
152 196 244 283 325 348
3Q14 4Q14 1Q15 2Q15 3Q15 4Q15
Superpack Valuepack
(000s) & VALUEPACK
20 26 29
33 37
43
3Q14 4Q14 1Q15 2Q15 3Q15 4Q15
(000s)
733 847
966 1,208 1,292 1,393
3Q14 4Q14 1Q15 2Q15 3Q15 4Q15
(000s) downloads
61% 62%
Upselling of value-added products and services maintain
its positive trajectory
4QFY15 results
61%
NB
(1) As a % of Pay TV customers with B.yond STB

6 |
184 channels
in total
50 HD
channels
73 Astro-branded
channels
Local content is our key unique differentiator…
4QFY15 results
In FY15, we…
…had 50 shows surpassing 1 million viewership, tripling FY14 record Launched 9 HD and 3 SD channels
TV viewers 2.6mil
32mil digital views
Games app 940K downloads
No.1
ASTRO
CONTENT Talent Search
2.1mil viewers
Islamic
Lifestyle
1.3mil viewers
Renowned artist
singing competition
2.0mil viewers
Romantic Novel
based drama
1.3mil viewers
Comedy Game Show
1.2mil viewers
Silver Hair Singing
competition
1.7mil viewers
HD Channels
SD Channels
Presentation Title 7 |
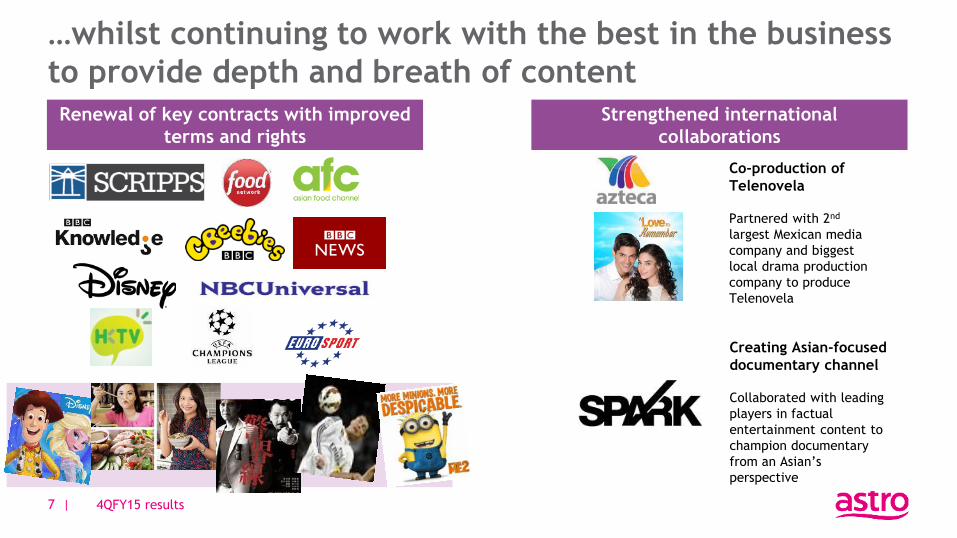
Creating Asian-focused
documentary channel
Collaborated with leading
players in factual
entertainment content to
champion documentary
from an Asian’s
perspective
Co-production of
Telenovela
Partnered with 2nd
largest Mexican media
company and biggest
local drama production
company to produce
Telenovela
…whilst continuing to work with the best in the business
to provide depth and breath of content
Renewal of key contracts with improved
terms and rights
Strengthened international
collaborations
7 | 4QFY15 results
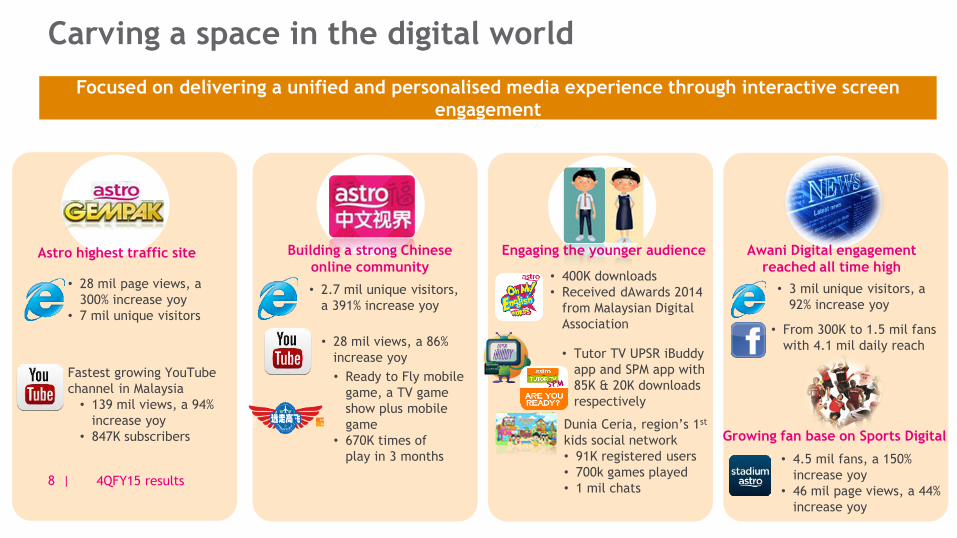
• 400K downloads
• Received dAwards 2014
from Malaysian Digital
Association • From 300K to 1.5 mil fans
with 4.1 mil daily reach
• 2.7 mil unique visitors,
a 391% increase yoy
• 28 mil page views, a
300% increase yoy
• 7 mil unique visitors
Fastest growing YouTube
channel in Malaysia
• 139 mil views, a 94%
increase yoy
• 847K subscribers
• Ready to Fly mobile
game, a TV game
show plus mobile
game
• 670K times of
play in 3 months
• 28 mil views, a 86%
increase yoy
Dunia Ceria, region’s 1st
kids social network
• 91K registered users
• 700k games played
• 1 mil chats
• Tutor TV UPSR iBuddy
app and SPM app with
85K & 20K downloads
respectively
• 3 mil unique visitors, a
92% increase yoy
Growing fan base on Sports Digital
Astro highest traffic site Building a strong Chinese
online community
Engaging the younger audience Awani Digital engagement
reached all time high
Carving a space in the digital world
Focused on delivering a unified and personalised media experience through interactive screen
engagement
8 | 4QFY15 results
• 4.5 mil fans, a 150%
increase yoy
• 46 mil page views, a 44%
increase yoy
4QFY15 results 9 |
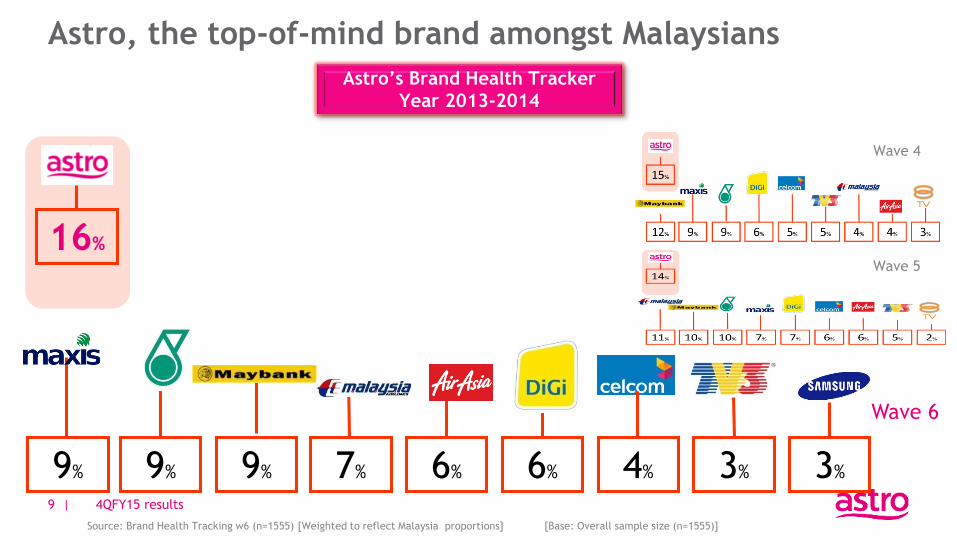
Astro, the top-of-mind brand amongst Malaysians
9% 9% 9% 6% 6% 4% 3% 3%
16%
7%
Wave 4
Wave 5
Source: Brand Health Tracking w6 (n=1555) [Weighted to reflect Malaysia proportions] [Base: Overall sample size (n=1555)]
Astro’s Brand Health Tracker
Year 2013-2014
Wave 6
10 | 4QFY15 results
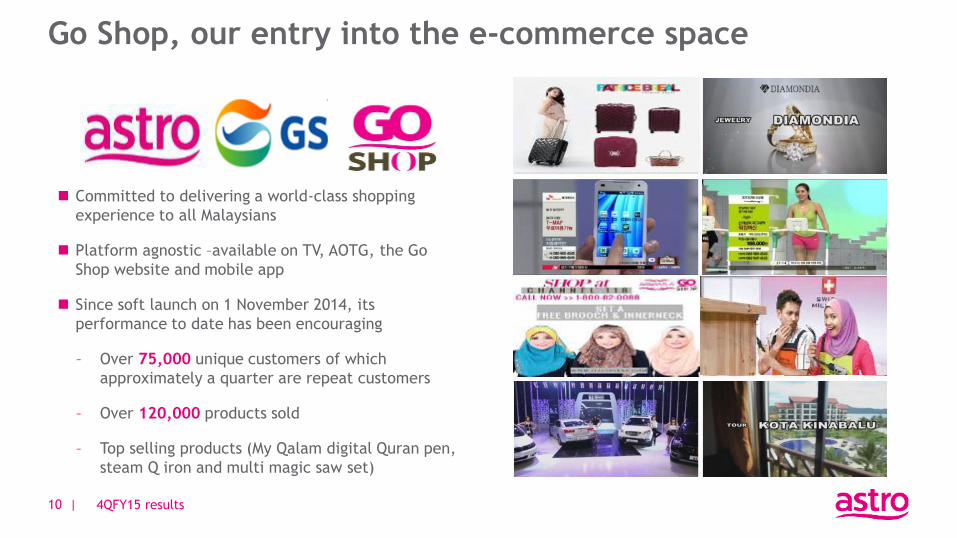
Committed to delivering a world-class shopping
experience to all Malaysians
Platform agnostic –available on TV, AOTG, the Go
Shop website and mobile app
Since soft launch on 1 November 2014, its
performance to date has been encouraging
– Over 75,000 unique customers of which
approximately a quarter are repeat customers
– Over 120,000 products sold
– Top selling products (My Qalam digital Quran pen,
steam Q iron and multi magic saw set)
Go Shop, our entry into the e-commerce space
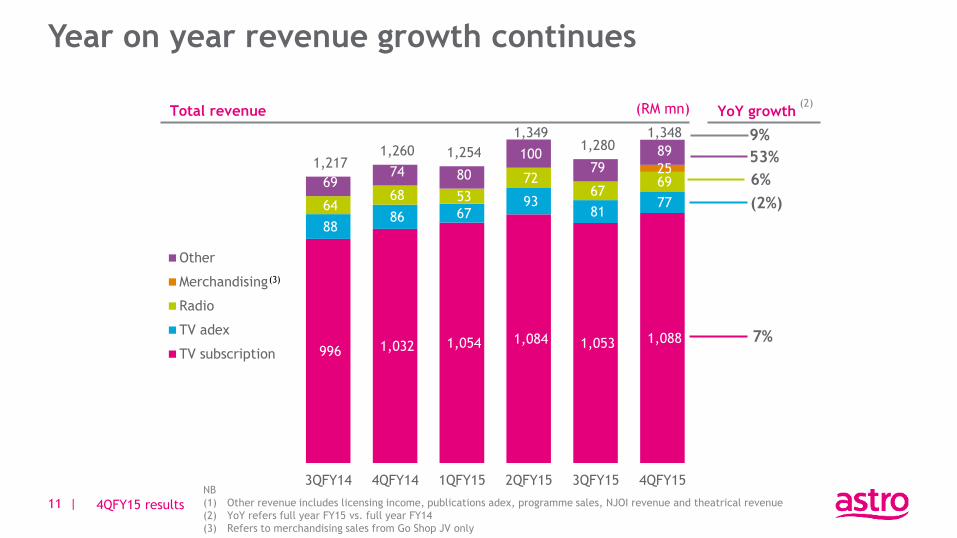
Year on year revenue growth continues
11 |
996 1,032 1,054 1,084 1,053 1,088
88 86 67
93 81
77 64 68 53
72 67
69 25
69 74 80
100 79
89 1,217
1,260 1,254
1,349 1,280
1,348
3QFY14 4QFY14 1QFY15 2QFY15 3QFY15 4QFY15
Other
Merchandising
Radio
TV adex
TV subscription
(3)
(RM mn)
53%
6%
(2%)
7%
9%
Total revenue YoY growth (2)
NB
(1) Other revenue includes licensing income, publications adex, programme sales, NJOI revenue and theatrical revenue
(2) YoY refers full year FY15 vs. full year FY14
(3) Refers to merchandising sales from Go Shop JV only
4QFY15 results
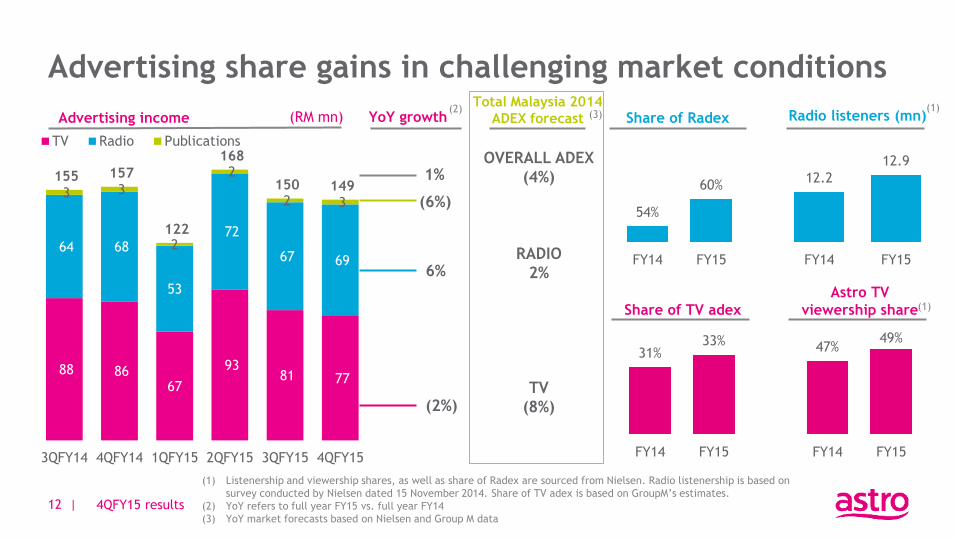
88 86 67
93 81 77
64 68
53
72
67 69
3 3
2
2
2 3
155 157
122
168
150 149
3QFY14 4QFY14 1QFY15 2QFY15 3QFY15 4QFY15
TV Radio Publications
12 |
Advertising income
54%
60%
FY14 FY15
Share of Radex
31% 33%
FY14 FY15
Share of TV adex
12.2
12.9
FY14 FY15
Radio listeners (mn)
47% 49%
FY14 FY15
Astro TV
viewership share
(RM mn) YoY growth (2)
(1) Listenership and viewership shares, as well as share of Radex are sourced from Nielsen. Radio listenership is based on
survey conducted by Nielsen dated 15 November 2014. Share of TV adex is based on GroupM’s estimates.
(2) YoY refers to full year FY15 vs. full year FY14
(3) YoY market forecasts based on Nielsen and Group M data
(6%)
6%
(2%)
1%
Advertising share gains in challenging market conditions
4QFY15 results
Total Malaysia 2014
ADEX forecast
OVERALL ADEX
(4%)
RADIO
2%
TV
(8%)
(3) (1)
(1)

366 383 377 490
395 402
407 424 420
415 410 432
138 147 126
123 132 134
109 125 130
111 137 125
1,020 1,079
1,053 1,138
1,075 1,092
3QFY14 4QFY14 1QFY15 2QFY15 3QFY15 4QFY15
Content costs Operating expenses
Marketing & distribution costs Administrative expenses
Cost management a key focus to optimise profit growth
13 |
Content cost as % of TV revenue
(RM mn)
32% 32% 32%
Total operating expenditure
31%
NB
(1) Operating expenses include STB installation and smartcard costs, depreciation and amortisation, as well as maintenance costs
(2) Content costs and operating expenses are jointly disclosed as cost of sales in our financial statements
38% 33%
4QFY15 results
Increase in operating expenses is mainly
attributable to merchandising cost of sales
arising from Go Shop JV

14 |
96 170
129 93
128 64
56 26
409 352
FY14 FY15
9% 7% as % of
revenue
(RM mn)
703
244
FY14 FY15
15% 5% as % of
revenue
(RM mn)
Capitalised capex is significantly lower in FY15 in line with
completion of the Astro B.yond swapout exercise
STBs/ODUs are owned by Astro, and are capitalised
STBs/ODUs are conservatively amortised over 3 years; note
that actual useful life is typically greater than 5 years
Discretionary 36 month bullet payment vendor financing is
available for Astro for STB/ODU purchases
RM1,023mn of vendor financing recorded in payables, of
which RM411mn is current and RM612mn is non-current
Key capex investments in FY15 include:
Investment in M3B platform and equipment
Improvement in CRM systems
Product and service upgrading
Building expansions
Capital maintenance Revenue growth Operational efficiencies
Expansion
Cash capex Capitalised capex
NB
(1) Data presented are for the 12 months ended 31 January
Continued discipline in capex investments
4QFY15 results

15 |
1,794 2,071
772
746
1,022 1,325
Cash fromoperations
Cash frominvesting
Free cash flow Cash fromoperations
Cash frominvesting
Free cash flow(2)
(3)
(3)
228% 255% as % of PAT
(RM mn)
FY14 FY15
Free cash flow
(2)
…enabling significant flexibility on capital management and adoption of progressive dividend policy
NB
(1) Data presented are for respective full financial years
(2) Excludes investments, disposals and maturities of unit trust and money market funds
(3) Excludes repayments of vendor financing (FY15: RM651mn, of which RM547mn was voluntary early repayment) and
payments of finance leases (FY15: RM103mn; FY14: RM101mn), which are categorised as cash from financing to be
consistent with Bursa disclosure
Consistently strong cash generation significantly exceeds
PAT
4QFY15 results

Leveraging on invested capital, AMH continues to be highly cash generative enabling
the adoption of a progressive dividend policy
Board of Directors of AMH is pleased to declare a quarterly dividend of 2.25 sen per
share for 4QFY15 and a final dividend of 2.0 sen, subject to shareholders’ approval at
the AGM in June 2015
This represents a 12.5% increase from quarterly dividends of 2.0 sen in
4QFY14; and a 100% increase in the final dividend compared to FY14
Quarterly dividend entitlement and payment dates: 14 April 2015 /29 April 2015
16 |
Quarterly dividend announcement
4QFY15 results

Appendix
18 |
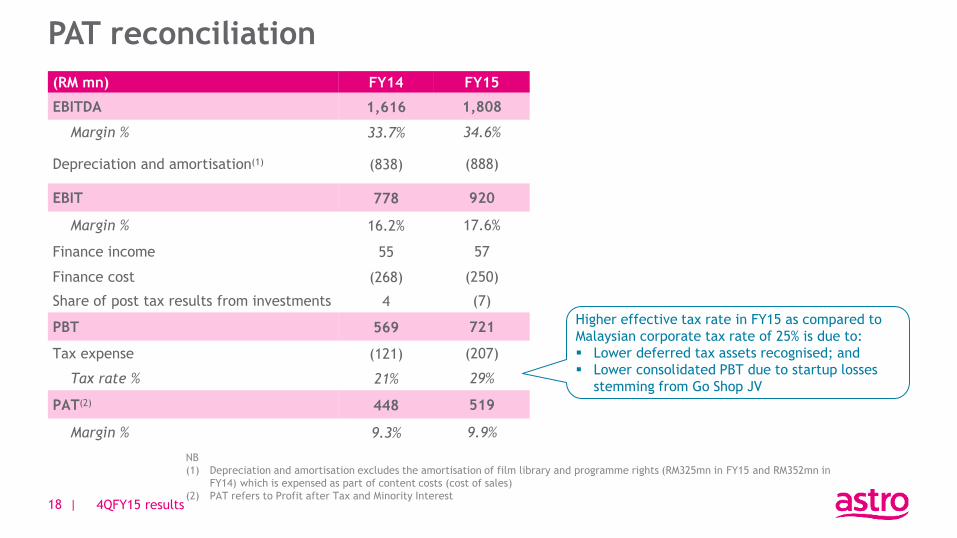
(RM mn) FY14 FY15
EBITDA 1,616 1,808
Margin % 33.7% 34.6%
Depreciation and amortisation(1) (838) (888)
EBIT 778 920
Margin % 16.2% 17.6%
Finance income 55 57
Finance cost (268) (250)
Share of post tax results from investments 4 (7)
PBT 569 721
Tax expense (121) (207)
Tax rate % 21% 29%
PAT(2) 448 519
Margin % 9.3% 9.9%
NB
(1) Depreciation and amortisation excludes the amortisation of film library and programme rights (RM325mn in FY15 and RM352mn in
FY14) which is expensed as part of content costs (cost of sales)
(2) PAT refers to Profit after Tax and Minority Interest
PAT reconciliation
4QFY15 results
Higher effective tax rate in FY15 as compared to
Malaysian corporate tax rate of 25% is due to:
Lower deferred tax assets recognised; and
Lower consolidated PBT due to startup losses
stemming from Go Shop JV

19 |
(RM mn) FY14 FY15
Non-current assets 4,437 4,425
Property, plant and equipment 2,157 1,881
Other non-current assets 2,280 2,544
Current assets 2,666 2,307
Receivables and prepayments 992 827
Cash and investments in unit trusts 1,635 1,354
Other current assets 40 126
7,103 6,731
(RM mn) FY14 FY15
Non-current liabilities 4,740 3,809
Payables 1,249 612
Borrowings 3,362 3,103
Other non-current liabilities 129 94
Current liabilities 1,747 2,208
Payables 1,426 1,736
Borrowings 302 400
Other current liabilities 19 72
Shareholders’ equity 617 714
7,103 6,731
Net debt / LTM EBITDA: 1.2x
NB
(1) Data presented are as at 31 January 2015
Group balance sheet overview
4QFY15 results

639
1,819
1,074
FY15
Finance lease RM term loan USD term loan
20 |
USD term
loan
RM term
loan
Finance lease
(primarily
satellite
transponders)
Finance lease related to lease of Ku-band transponders on MEASAT-3 and
MEASAT-3A. Payment arrangement for the remaining contractual years have
been redenominated into Ringgit at USD/RM 3.0445 w.e.f. 21 May 2013
Effective interest rate: 6.2% and 12.5% p.a. for M3 and M3A, respectively
Average life: 15 years
RM3,503mn
(RM mn) Total borrowings Details of borrowings
Total borrowings is net of
debt issuance costs
(RM28mn)
As at 31 January 2015, outstanding principal US dollar term loan stood at
US$297mn. The fourth principal repayment amounting to USD16.5mn
(RM49.8mn) is scheduled to be paid on 8 June 2015
Fully hedged via cross currency interest rate swap at an exchange rate of
USD/RM3.0189 and an all-in interest rate of 4.19% p.a.
Back ended amortisation schedule, with average life of 7 years and has final
maturity date of 8 June 2021
As at 31 January 2015, total outstanding principal RM term loan stood at
RM1,800mn. The fourth principal repayment amounting to RM100mn is
scheduled to be paid on 19 May 2015
All-in interest rate (post-hedging) for the hedged portion of RM1,350mn is
5.4467% while balance unhedged of RM450mn stood at 5.1600% (variable
floating rate based on cost of funds)
Back ended amortisation schedule, with average life of 7 years and has final
maturity date of 19 May 2021
Debt profile
4QFY15 results