th grade vocabulary cards and word walls - closte proof statement: there is a prime number between...
TRANSCRIPT

8th Grade Vocabulary Cards and Word Walls
Revised: January 4, 2016
Important Notes for Teachers:
The vocabulary cards in this file match the Common Core, the math curriculum adopted by the Utah State Board of Education, August 2010.
The cards are arranged alphabetically. Each card has three sections.
o Section 1 is only the word. This is to be used as a visual aid in spelling and pronunciation. It is also used when students are writing their own “kid-friendly” definition and drawing their own graphic.
o Section 2 has the word and a graphic. This graphic is available to be used as a model by the teacher.
o Section 3 has the word, a graphic, and a definition. This is to be used for the Word Wall in the classroom. For more information on using a Word Wall for Daily Review – see “Vocabulary – Word Wall Ideas” on this website.
These cards are designed to help all students with math content vocabulary, including ELL, Gifted and Talented, Special Education, and Regular Education students.
For possible additions or corrections to the vocabulary cards, please contact the Granite School District Math Department at 385-646-4239. Bibliography of Definition Sources: Algebra to Go, Great Source, 2000. ISBN 0-669-46151-8 Math on Call, Great Source, 2004. ISBN-13: 978-0-669-50819-2 Math at Hand, Great Source, 1999. ISBN 0-669-46922 Math to Know, Great Source, 2000. ISBN 0-669-47153-4 Illustrated Dictionary of Math, Usborne Publishing Ltd., 2003. ISBN 0-7945-0662-3 Math Dictionary, Eula Ewing Monroe, Boyds Mills Press, 2006. ISBN-13: 978-1-59078-413-6 Student Reference Books, Everyday Mathematics, 2007. Houghton-Mifflin eGlossary, http://www.eduplace.com Interactive Math Dictionary, http://www.amathsdictionaryforkids.com/

negative association
negative association
negative association
Two variables have a negative association when the values
of one variable tend to decrease as the values of the
other variable increase.
0 x
y
0 x
y

no solution
no solution5x + 8 = 5x – 13
5(11) + 8 = 5(11) – 13 63 42
no solution
no solution
5x + 8 = 5x – 13 5(11) + 8 = 5(11) – 13
63 42 no solution
No solution would mean that there is no answer to the equation. It is impossible for the equation to be
true no matter what value we assign to the variable. Infinite solutions would mean that any
value for the variable would make the equation true.

nonlinear association
nonlinear association
nonlinear association
A scatterplot, which does not form a
straight line, is said to have a nonlinear
association.
0 x
y
0 x
y

nonlinear function
nonlinear function
21( ) ( 4) 7
4 f x x
nonlinear function
21( ) ( 4) 7
4 f x x
Equation whose graph does not form
a straight line (linear) is called a nonlinear
function.
-12 -8 -4 4 8 12
-12
-8
-4
4
8
12
x
y
-12 -8 -4 4 8 12
-12
-8
-4
4
8
12
x
y

non-vertical line
non-verticalline
non-vertical line
All lines which have a defined slope. -8 -4 4 8
-8
-4
4
8
x
y
-8 -4 4 8
-8
-4
4
8
x
y

number line
number line
number line
A diagram that represents numbers as points on a line.

ordered pair
ordered pair
(-5, 2) (x , y)
ordered pair
(-5, 2) (x , y)
A pair of numbers that gives the coordinates of a
point on a grid in this order (horizontal
coordinate, vertical coordinate). Also known
as a coordinate pair.

origin
origin
origin
The intersection of the x- and y-
axes in a coordinate plane, described by the
ordered pair (0, 0).
origin
y-axis
I x-axis II
III IV
origin
y-axis
I x-axis II
III IV

outlier
outlier
outlier
An outlier is a piece of data that doesn’t seem to fit with the rest of a data set.
x
y outlier
x
y outlier

output
output f(x) = 2(x + 1) – 7
input: x = 3
f(3) = 2(3 + 1) – 7 = 2(4) – 7
= 8 – 7 = 1
output: 1
output
f(x) = 2(x + 1) – 7
input: x = 3
f(3) = 2(3 + 1) – 7 = 2(4) – 7
= 8 – 7 = 1
output: 1
A value of the dependent variable.
(Generally an answer to an equation.)

parallel lines
parallel lines
parallel lines
Two lines in the same plane that never
intersect. Parallel lines have the same slope.

perfect square
perfect square
21010 10 100
266 6 36( )
255 5 25
perfect square
21010 10 100
266 6 36( )
255 5 25
The product of an integer and itself.

positive association
positive association
positive association
Two variables have a positive association
when the values of one variable tend to increase as the values of the other
variable increase.
Distance Traveled
Gas
Distance Traveled
Gas

power of ten
power of ten
2 10 10 01 10 0
4 10 10 10 10 010 1 ,000
2 1 1 1
10 1 010
0 1 0
power of ten
2 10 10 01 10 0
4 10 10 10 10 010 1 ,000
2 1 1 1
10 1 010
0 1 0
A number with 10 as a base and an integer exponent.

proof
proof Statement: There is a prime number between 45 and 54.
Proof: We examine one by one, the numbers between 45 and 54, until a prime is found. If no prime is found, the statement is false.
Number Is it prime? 45 No, because it's divisible by 5 46 No, because it's divisible by 2 47 Yes, 47 because is only divisible by 1 and 47
Conclusion: The statement is true. (no need to check the rest of the numbers from 48 to 54)
proof
Statement: There is a prime number between 45 and 54. Proof: We examine one by one, the numbers between 45 and 54, until a prime is found. If no prime is found, the statement is false.
Number Is it prime? 45 No, because it's divisible by 5 46 No, because it's divisible by 2 47 Yes, 47 because is only divisible by 1 and 47
Conclusion: The statement is true. (no need to check the rest of the numbers from 48 to 54)
A proof is a logical argument in which each statement you make is backed up by a reason that is accepetted as true.
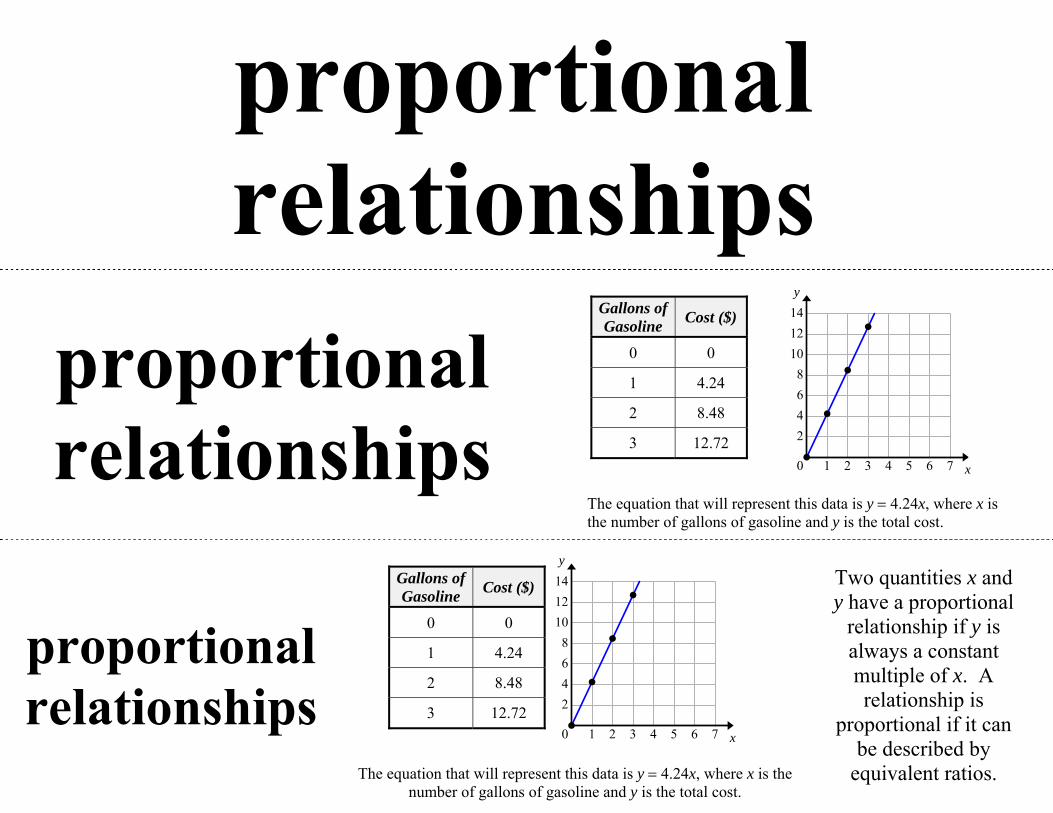
proportional relationships
proportional relationships
The equation that will represent this data is y 4.24x, where x is the number of gallons of gasoline and y is the total cost.
Gallons of Gasoline Cost ($)
0 0
1 4.24
2 8.48
3 12.72
proportional relationships
The equation that will represent this data is y 4.24x, where x is the number of gallons of gasoline and y is the total cost.
Gallons of Gasoline Cost ($)
0 0
1 4.24
2 8.48
3 12.72
Two quantities x and y have a proportional
relationship if y is always a constant multiple of x. A relationship is
proportional if it can be described by
equivalent ratios.
1 2 3 4 5 6 7
2
4
6
8
10
12
14
0 x
y
1 2 3 4 5 6 7
2
4
6
8
10
12
14
0 x
y

Pythagorean Theorem
Pythagorean Theorem
a2 + b2 = c2
a = 3 b = 4 c = 5 32 + 42 = 52 9 + 16 = 25
PythagoreanTheorem
a2 + b2 = c2
a = 3 b = 4 c = 5 32 + 42 = 52 9 + 16 = 25
In any right triangle, the sum of the squares of the length legs (a and b) is
equal to the square of the length of the hypotenuse c.
ab
c
ab
c

Pythagorean Theorem Converse
Pythagorean Theorem Converse
c2 = a2 + b2
c = 5 a = 3 b = 4 52 = 32 + 42 25 = 9 + 16
Pythagorean Theorem Converse
c2 = a2 + b2
c = 5 a = 3 b = 4 52 = 32 + 42 25 = 9 + 16
If c is the longest side of a triangle, and a
and b are the lengths of the other two sides, and c2 = a2 + b2, then the triangle is a right
triangle.
a
b
c
a
b
c

radicals
radicals 2 cubed, 23 = 8
The cubed root of 8, 3 8 = 2
3 to the 4th power, 34 = 81 The 4th root of 81, 4 81 = 3
radicals 2 cubed, 23 = 8
The cubed root of 8, 3 8 = 2
3 to the 4th power, 34 = 81 The 4th root of 81, 4 81 = 3
Radicals are the opposite operation of applying exponents.

rate of change
rate of change
Change in the input
Change in theoutput 125 75
5 0
52
3 2
5
Input Output
1 25 3 75 5 125 7 175 9 225
rate of change
Changein the input
Change in theoutput 125 75
5 0
52
3 2
5
Input Output
1 25 3 75 5 125 7 175 9 225
The ratio of the change in the output value and change in the input value of a
function.

rational number
rational number
rational number
A number that can be expressed as a ratio
of two integers.
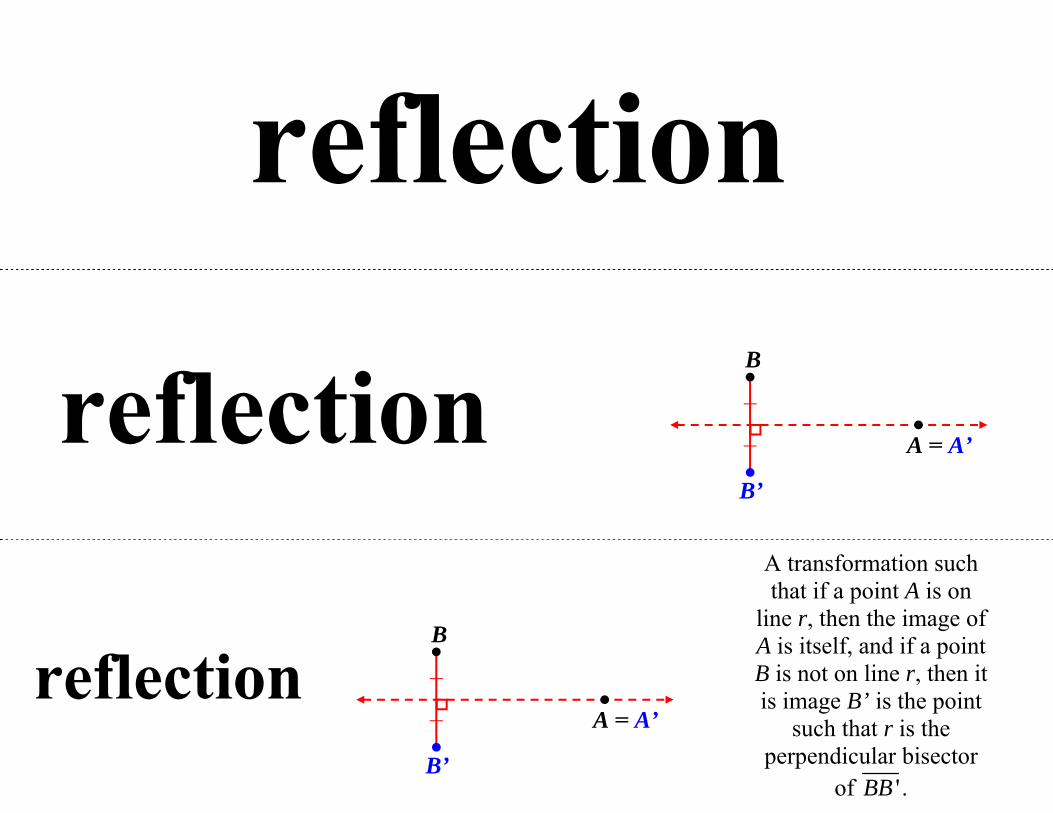
reflection
reflection
reflection
A transformation such that if a point A is on
line r, then the image of A is itself, and if a point B is not on line r, then it is image B’ is the point
such that r is the perpendicular bisector
of 'BB .
A = A’
B
B’
A = A’
B
B’

relative frequency table relative
frequency table
Dance Sports Movies TOTAL
Women 0.32 0.12 0.16 0.60 Men 0.04 0.20 0.16 0.40
TOTAL 0.36 0.32 0.32 1.00
relative frequency
table
Dance Sports Movies TOTAL
Women 0.32 0.12 0.16 0.60
Men 0.04 0.20 0.16 0.40
TOTAL 0.36 0.32 0.32 1.00
A relative frequency table is a chart that
shows the popularity or mode of a certain type of data based on
the population sampled.

repeating decimal
repeating decimal
repeating decimal
A decimal, which has
repeating digits or a repeating
pattern of digits.
1
1
=0.1428571428577
=0.3333333333333
1
1
=0.1428571428577
=0.3333333333333

rotation
rotation
rotation
A transformation such that for any point V, its image is
the point V’, where RV = RV’ and 'm VRV x . The image R itself. The
positive number of degrees x that a figure rotates is the
angle of rotation.
R V
V’
R’ x○
R V
V’
R’ x○

scale factor
scale factor
In real-life, the length of this van may measure 240 inches. However, the length of the van above is 2 inches. You can write this scale factor as 1:20 or
1/20 or 1 to 20.
scale factor
In real-life, the length of this van may measure 240 inches. However, the length of
the van above is 2 inches. You can write this scale factor as 1:20 or 1/20 or 1 to 20.
A scale is a ratio that compares a length in a scale drawing to the corresponding length in the actual object.
Length
Length

scatter plot
scatter plot
scatter plot
A graphic tool used to display the
relationship between two quantitative (numerical) variables.
66 68 70 72 74 76 78
150
175
200
225
Height (inches)
Wei
ght
(pou
nd
s)
66 68 70 72 74 76 78
150
175
200
225
Height (inches)
Wei
ght
(pou
nd
s)

scientific notation
scientific notation
2,600,000,000 = 2.6 109
0.0000017 = 1.7 10-6
scientific notation
2,600,000,000 = 2.6 109
0.0000017 = 1.7 10-6
Scientific notation is the way that
scientists easily handle very large numbers or very small numbers.

sequence
sequence 2, 5, 8, 11, 14, 17…
What is the pattern?
sequence
2, 5, 8, 11, 14, 17…
What is the pattern?
A set of numbers arranged in a special
order or pattern.

8 cm
5 cm
6 cm6 cm
10 cm
16 cm
12 cm 12 cm
similar figures
similar figures
similar figures
When two figures are similar, the ratios
of the lengths of their corresponding
sides are equal.
8 cm
5 cm
6 cm6 cm
10 cm
16 cm
12 cm 12 cm

similar triangles
similar triangles
similar triangles
Two triangles are similar if and only if
the corresponding sides are in
proportion and the corresponding angles
are congruent.
30 m
33 m 24 m
11 m 8 m
10 m
30 m
33 m 24 m
11 m 8 m
10 m

slope
slope
slope
Slope describes steepness, incline, or
grade of a line. A higher slope value indicates a steeper incline. The slope of a line is the ratio of the change in y
over the change in x.
xy
slopeyx
xy
slopeyx

slope formula
slope formula
slope formula
The formula used to find the slope of a line. Slope is often represented with
the variable m.
2
1
1
2 3 1 2 1
4 0 4 2m
xy y
x
(0, 1)
(4, 3)
rise
runslope =
yx
12 1
2
2 1
, where 0m x xx xy y
2
1
1
2 3 1 2 1
4 0 4 2m
xy y
x
(0, 1)
(4, 3)

slope intercept form
slope intercept
form
slope intercept
form
The equation of a straight line in the form y = mx + b
where m is the slope of the line and b is its
y-intercept
-8 -6 -4 -2 2 4 6 8
-8
-6
-4
-2
2
4
6
8
x
y
b 4-3
-8 -6 -4 -2 2 4 6 8
-8
-6
-4
-2
2
4
6
8
x
y
b 4-3

solution
solution
Examples:
The only solution for the equation 2x – 15 = -3 is x = 4.
The solutions which satisfy the inequality 2x + 3 ≤ 7 are all values which are less than or equal to x, denoted x ≤ 2, or (-∞, 2].
solution
Examples:
The only solution for the equation 2x – 15 = -3 is x = 4.
The solutions which satisfy the inequality 2x + 3 ≤ 7 are all values which are less than or equal to x, denoted x ≤ 2, or (-∞, 2].
Any and all value(s) of the
variable(s) which; satisfies an equation, or inequality.

square root
square root
5 5, 52 = 25 25 5 = 2
9 9, 92 = 81
81 9
square root
5 5, 52 = 25 25 5 = 2
9 9, 92 = 81
81 9
The square root of a number is a number when it is multiplied by itself, equals the
original number.

table of values
table of values
x f(x) 0 1 1 4 2 7 3 10 4 13 5 16 6 19
table of values
x f(x) 0 1 1 4 2 7 3 10 4 13 5 16 6 19
A list of numbers that are used to substitute one variable, such as
within an equation of a line or other functions, to find the value of the
other variable.

terminating decimal
terminating decimal
terminatingdecimal
A decimal which has a finite
number of digits.
1 =0.1258
1 =0 1 =.254
1 =0.110
0.25
1 =0.1258
1 =0 1 =.254
1 =0.110
0.25

transformation
transformation
transformation
To change the position of a shape on a coordinate plane. There are three basic transformations:
translations reflections rotations
pre image
image
pre image
image

translation
translation
translation
A transformation that moves points the same distance
in the same direction.

transversal
transversal
transversal
A line that cuts across two or more (usually
parallel) lines.
transversal
transversal

truncate
truncate = 3.14159265358979323…
≈ 3.14
truncate = 3.14159265358979323…
≈ 3.14
A method of approximating a
decimal number by dropping all decimal places past a certain
point without rounding.
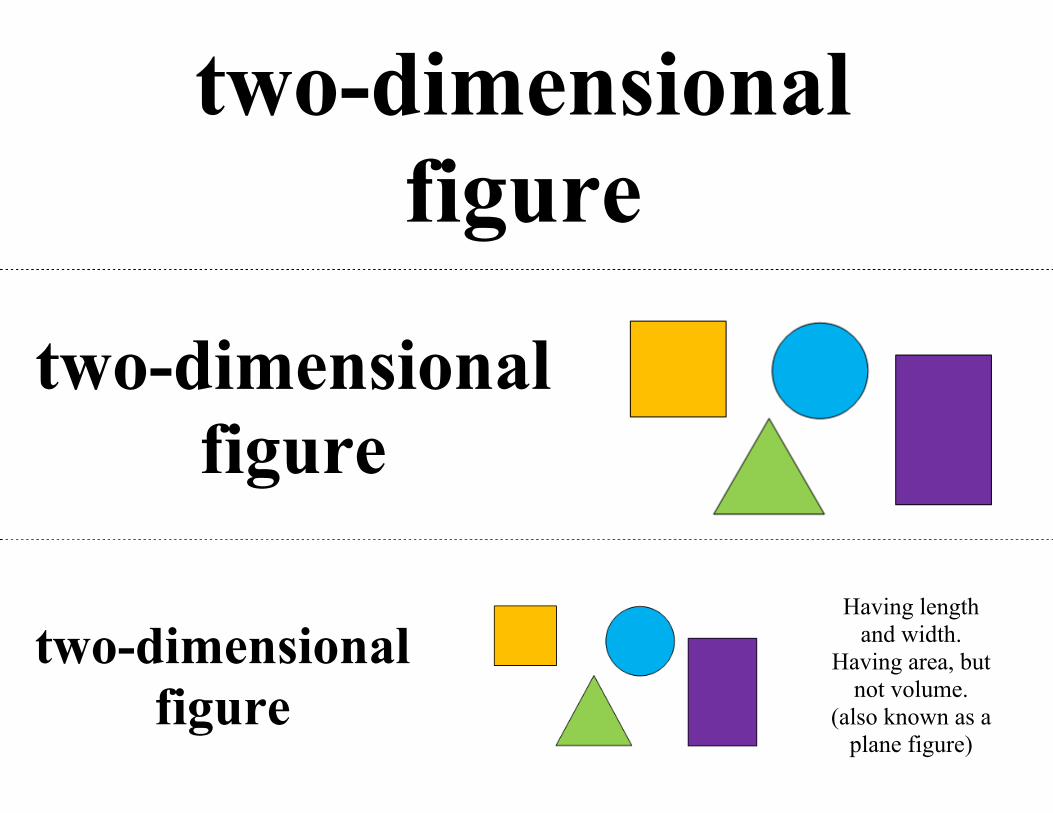
two-dimensional figure
two-dimensional figure
two-dimensional figure
Having length and width.
Having area, but not volume.
(also known as a plane figure)

two-way frequency table
two-way frequency
table
For Against No Opinion TOTAL
Ages 21–40 25 20 5 50
Ages 41–60 30 30 15 75
Over 60 50 20 5 75
TOTAL 105 70 25 200
two-way frequency
table
For Against No Opinion TOTAL
Ages 21–40 25 20 5 50
Ages 41–60 30 30 15 75
Over 60 50 20 5 75
TOTAL 105 70 25 200
A frequency table is a table that
shows the total for each category or group of data.

unit rate
unit rate
unit rate
The ratio of two measurements in which
the second term (denominator) is 1.
Cereal is $0.43 per 1 ounce.
Cereal is $0.43 per 1 ounce.

variable
variable
variable
A quantity that changes or can have different values. A symbol,
usually a letter that can stand for a variable
quantity.
2n + 3 = 11
variable
2n + 3 =
variable

vertical axis
vertical axis
vertical axis
The y-axes in a plane Cartesian coordinate
plane.
y
x vertical axis
y
x vertical axis

vertical intercept
vertical intercept
vertical intercept
A vertical intercept is a point where a line
crosses the vertical axis, or y-axis, on the
Cartesian coordinate plane.
vertical intercept
y
x
●
vertical intercept
y
x
●

volume (cone)
volume (cone)
volume (cone)
The amount of 3-dimensional space a cone occupies. Volume
is capacity.
r
h 21
3V r
r
h 21
3V r

volume (cylinder)
volume (cylinder)
volume (cylinder)
The amount of 3-dimensional space a
cylinder occupies. Volume is capacity.
h
r
h
r

volume (sphere)
volume (sphere)
volume (sphere)
The amount of 3-dimensional space a
sphere occupies. Volume is capacity.
34
3V r r
r 34
3V r
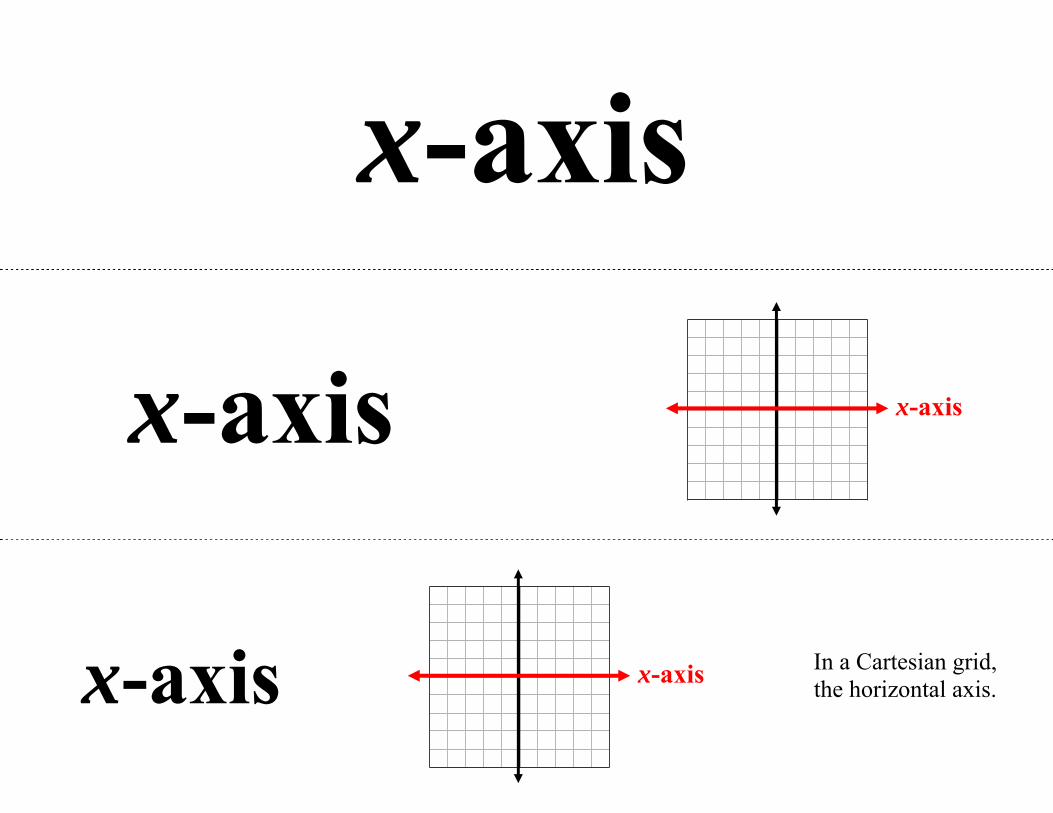
x-axis
x-axis
x-axis
In a Cartesian grid, the horizontal axis.
x-axis
x-axis

x-coordinate
x-coordinate
(7, 2)
x-coordinate
x-coordinate
(7, 2)
x-coordinate
In an ordered pair, the value that is
always written first.

x-intercept
x-intercept
x-intercept
A point where a line crosses the
horizontal axis, or x-axis, on the
Cartesian coordinate plane.
x-intercept -4 -2 2 4
-4
-2
2
4
●
x-intercept-4 -2 2 4
-4
-2
2
4
●

y-axis
y-axis
y-axis
In a Cartesian grid, the vertical axis.
y-axis
y-axis

y-coordinate
y-coordinate
(7, 2)
y-coordinate
y-coordinate (7, 2)
y-coordinate
In an ordered pair, the value that is always written
second.

y-intercept
y-intercept
y-intercept
A point where a line crosses the vertical
axis, or y-axis, on the Cartesian coordinate
plane.
y-intercept
y
x
●
y-intercept
y
x
●