tgfbr2 ovarian damage via adenovirus mediated sirt1 and in
TRANSCRIPT

Page 1/34
In Situ Gene Therapy Rescues Doxorubicin-inducedOvarian Damage via Adenovirus Mediated Sirt1 andTgfbr2Lingwei Ma
Department of Obstetrics and Gynecology, Tongji Hospital, Tongji Medical College,Huazhong Universityof Science and TechnologyHuan Lu
Department of Obstetrics and Gynecology, Tongji Hospital, Tongji Medical College,Huazhong Universityof Science and TechnologyYanzhi Feng
Department of Obstetrics and Gynecology, Tongji Hospital, Tongji Medical College,Huazhong Universityof Science and TechnologyYan Li
Department of Obstetrics and Gynecology, Tongji Hospital, Tongji Medical College,Huazhong Universityof Science and TechnologySu Zhou
Department of Obstetrics and Gynecology, Tongji Hospital, Tongji Medical College,Huazhong Universityof Science and TechnologyMeng Wu
Huazhong University of Science and TechnologyPeng-Fei Cui
National Medical Center for Major Public Health Events, Tongji Hospital, Tongji Medical College,Huazhong University of Science and Technology, Wuhan, 430000 https://orcid.org/0000-0003-2915-9157Jinjin Zhang
Huazhong University of Science and TechnologyShixuan Wang ( [email protected] )
Huazhong University of Science and Technology
Article
Keywords: chemotherapy-induced ovarian damage, AdV-Sirt1, AdV-Tgfbr2
Posted Date: September 10th, 2021

Page 2/34
DOI: https://doi.org/10.21203/rs.3.rs-843854/v1
License: This work is licensed under a Creative Commons Attribution 4.0 International License. Read Full License

Page 3/34
AbstractChemotherapy-induced ovarian damage and fertility loss have negative impacts on the quality of life forfemale cancer patients worldwide. Thus, we aimed to explore the feasibility and safety of gene therapyfor prevention of such damage. First, we validated doxorubicin-induced ovarian damage in human andmouse ovarian tissues and identi�ed two key genes (Sirt1 and Tgfbr2). Next, we generated AdV-Sirt1 andAdV-Tgfbr2 after vectors screening (AdV,AAV and LV) for their ability to transduce mouse ovaries. Finally,we conducted in situ ovarian injection of AdV-Sirt1 and AdV-Tgfbr2 in doxorubicin-treated mice andassessed their ovarian functions and reserves. The interventions dramatically alleviated doxorubicin-induced ovarian damage without apparently in�uencing the health status of their offspring. Together, ourresults indicate that AdV-Sirt1 and AdV-Tgfbr2 can serve as effective and safe agents for reducingdoxorubicin-induced ovarian damage and also suggest that they may be potentially applicable for post-chemotherapy protection in female cancer patients.
IntroductionWith the rapid progress in the diagnosis and treatment of cancer, the long-term survival rate of femalepatients has signi�cantly improved 1. Chemotherapy is an important regimen for the treatment of tumors.However, ovarian damage caused by chemotherapy is a common problem related to women’s physicaland mental health, including reproductive system dysplasia, premature ovarian failure, and fertility loss 2.Hence, protecting the ovaries from chemotherapy-induced damage is crucial for female cancer patients.
Currently, some strategies that have been applied in the protection of ovarian injury caused bychemotherapy include gonadotropin-releasing hormone agonists, embryos, mature oocytes, and ovariantissue cryopreservation and transplantation. Other approaches, such as stem cell therapy research andpotential protective agents (such as AS101, AMH, and S1P), and other drugs, are still at their earlydeveloping stage 3. Also, the application of these strategies is limited due to the complexity of technology,uncertain therapeutic effects 4,5, ethical issues, unknown risk of tumor recurrence by ovarian tissueautologous transplantation 6, narrow scope of the application, and other problems 7,8.
Gene therapy has been extensively explored for multiple tumors and genetic diseases 9. However, theapplication of gene therapy for non-tumor and non-genetic abnormalities has been understudiedespecially in the area of ovarian damage caused by chemotherapy. Thus, in this study, we explored thefeasibility and safety of gene therapy for the prevention and protection of ovarian injury caused bychemotherapy.
Doxorubicin (Dox) is a commonly used chemotherapeutic agent and also widely used for the treatment offemale cancers, such as breast and ovarian cancers, and other solid tumors, in addition to hematologicaldiseases, including leukemia, Hodgkin's lymphoma, multiple myeloma 10. As a moderate gonadotoxicchemotherapy agent, it has been reported to cause ovarian interstitial damage, including local ovarian�brosis and vascular damage 11–14. However, the molecules or genes responsible for DOX-induced

Page 4/34
ovarian damage remain incompletely understood. Thus, there is a lack of effective prevention andprotection strategies for ovarian injury caused by Dox.
In our attempt to address this issue, we found that Tgfbr2 and Sirt1 are markedly downregulated inmouse and human damaged ovarian tissues caused by Dox. To determine whether overexpression ofthese two genes might be able to prevent or protect Dox-induced ovarian damage, we explored the safety,feasibility, and effectiveness of targeting Sirt1 and Tgfbr2 gene therapy by employing adenovirus vectors.Our results strongly indicate that these two agents effectively protect ovaries from damage caused byDox in mice and suggest that they could be potentially useful for doxorubicin-treated cancer patients withovarian damage.
Results1. Doxorubicin leads to decreased ovarian reserve and declined ovarian function
Several studies have indicated that chemotherapy-induced damage to the ovary includes microvasculardamage, interstitial necrosis, and �brosis 11,15. In our study, ovarian damage was induced by theintraperitoneal injection of doxorubicin (Dox, 10 mg kg-1) (Fig. 1a). Compared with the blank group,ovarian weight and ovary index were signi�cantly decreased (81.8% vs 25.0%, P < 0.05) (Fig. S1, 1b and1c). The proportion of irregular estrus cycles increased in the Dox-treated group (Fig. 1b). The levels ofestrogen, progesterone, and AMH in the Dox group decreased, and the level of follicle-stimulatinghormone (FSH) was increased (Fig. 1c-f). Furthermore, the number of mouse follicles at all levels wascounted after H&E staining of para�n sections of mouse ovaries (Fig. 1g). Compared with the blankgroup, the number of primordial follicles (PMF), secondary follicles (SF), and total number of healthyfollicles (THF) in the Dox group decreased signi�cantly (Fig. 1h). Moreover, the proportion of primordialfollicles and secondary follicles in the Dox group was lower than that in the Blank group, with atreticfollicles (ATF) increasing (Fig. 1i), indicating that Dox causes a signi�cant loss of primordial follicles andan increase in atretic follicles. In addition, �brosis of the ovary was evaluated by red Sirius staining (Fig.1j), showing that the proportion of collagen area in the Dox group is higher than that in the blank group(31.58% ± 1.702%, 9.975% ± 0.6826%, P < 0.001), which was also con�rmed by polarized lightphotography. Masson’s trichrome staining (Fig. 1k) revealed that the proportion of collagen-positive (blue)�ber area in the ovary of the Dox group is higher than that of the Dox group (3.639% ± 0.3098%, 18.59% ±0.7567%, P < 0.001). The expression of the �brosis marker α-SMA in the Dox group was higher than thatin the blank group by IHC (Fig. S1, d and e). Together, these results indicate that Dox causes ovariandamage in mice by inducing ovarian interstitial �brosis.
2. Tgfbr2 and Sirt1 are markedly reduced in human and mouse damaged ovarian tissues
To identify genes that might be responsible for doxorubicin-induced ovarian damage, we performed anRNA seq analysis in RNAs that were extracted from the ovarian tissues of the Dox and blank groups.Differentially expressed genes (DEGs) were obtained through data quality control, mapping, and

Page 5/34
normalization. Compared with the blank group, the DEGs (119 upregulated genes and 178 downregulatedgenes) were identi�ed in the ovaries of the Dox group compared with the blank group (FDR < 0.05, foldchange > 2). The DEGs were displayed in a volcano plot (Fig. 2a) and heatmap (Fig. S2a). Gene Ontology(GO) enrichment analysis of upregulated DEGs revealed that they were mainly enriched in biologicalprocesses, such as “Adherens junction,” “Focal adhesion,” and “Extracellular matrix” (Fig. 2b). KEGGpathway enrichment analysis found that it was enriched in “ECM-receptor interaction,” “Cell adhesionmolecules (CAMs),” and other pathways, indicating that Dox may increase the degree of ovarian �brosis(Fig. S2b), which is also consistent with the ovarian phenotype in the above experiment. The genesrelated to steroid hormone synthesis and ovarian follicle development, such as Hsd17b7, Lhcgr, Hmgcs1,and Sirt1, were signi�cantly downregulated, and �brosis-related genes that inhibit �brosis, such as Tgfbr2and Mmp15, were also downregulated (Fig. 2a). GO and KEGG pathway enrichment analysis of down-regulated genes revealed that these genes are mainly enriched in “Sterol biosynthetic process”,“Cholesterol metabolic process”, and other steroid hormone synthesis-related biology processes (Fig. 2c).KEGG pathway analysis includes “Ovarian steroidogenesis,” “Estrogen signaling pathway” and otherKEGG pathways (Fig. S2c), con�rming that Dox causes the decline of ovarian function. These resultssuggest that Dox increases the degree of ovarian �brosis while reduces the hormone synthesis functionof the ovary.
The transforming growth factor-beta 1 (Tgfb1) signaling pathway plays a key role in the progression ofmultiple organ �brosis, such as renal �brosis, age-related hypertrophic cardiomyopathy, immune cellrecruitment, and extracellular matrix 16 17. Exogenous administration of Tgfbr2-targeted inhibition of theTgfb1 pathway can alleviate myocardial �brosis and myocardial infarction by reducing myocardialremodeling18, preventing the progression of heart failure, and improving the survival rate 19. In addition,sirtuin 1 (Sirt1) can affect follicle development by regulating apoptosis. Studies have found thatactivating Sirt1 can inhibit the activation of primordial follicles, reduce follicle assumption, and increasethe reserve of follicles 20. Therefore, it is speculated that increasing the expression of Sirt1 can play aprotective role against chemotherapy-induced ovarian damage.
Our qPCR results showed that the expression of ovarian �brosis-related molecules Tgfb1, Acta2, IL-1b,and Tnf-α in the Dox group is upregulated, whereas the expression of Sirt1, Tgfbr2, and Timp2 isdownregulated (Fig. 2d). Western blot (WB) and immunohistochemistry (IHC) analysis revealed that theexpression of Sirt1 and Tgfbr2 is also decreased in the Dox group (Fig. 2e and 2f). To validate thedifference in the expression of Sirt1 and Tgfbr2 in human ovarian tissue between Dox and normalcontrols, 8 samples of human ovarian tissue aged between 33 and 67 years old were collected forculture in vitro. After culturing in medium containing Dox (1 μg mL-1), the relative expression of SIRT1and TGFBR2 mRNA (Fig. 2g) and protein (Fig. 2h and 2i) was signi�cantly lower than that of the ovariescultured in the control medium.
In summary, our results suggest that Dox might cause ovarian damage by reducing the expression ofTgfbr2, a key factor that inhibits the process of �brosis, and Sirt1 that is related to follicle development.

Page 6/34
3. AdV serves as a suited vector for ovary infection
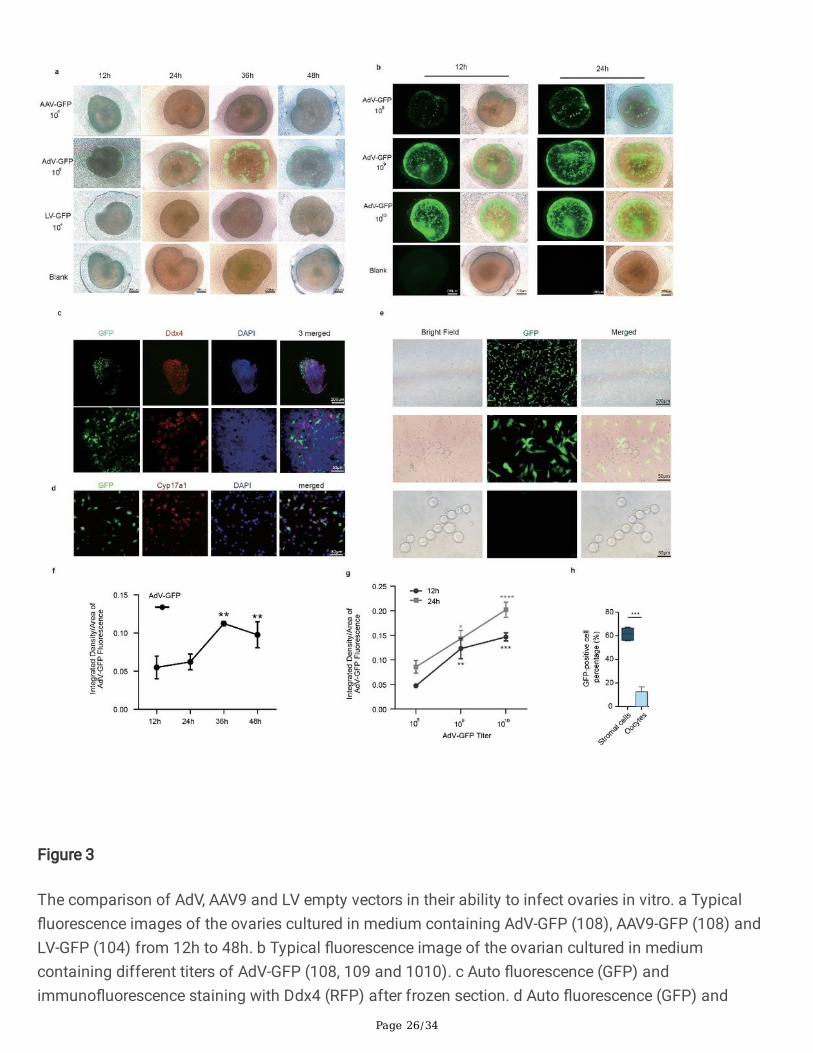
To identify a better vector more suited for the gene therapy experiments in ovaries, we explored thetransductional tropism of three commonly used vectors by carrying out ovarian culture in vitro with emptyviral vectors (AdV-GFP, AAV-GFP, and LV-GFP) to observe the �uorescence intensity. The results showedthat AdV-GFP has a better a�nity for the ovaries, as there was almost no �uorescence intensity in the LV-GFP and AAV-GFP groups (Fig. 3a and 3f). Also, the media containing 108, 109 and 1010 titers of AdV-GFPwere used for ovarian culture in vitro. With time and the virus titer increased, the �uorescence alsoincreased (Fig. 3b and 3g). The ovaries cultured with 1010 titer of AdV-GFP were frozen and sectioned.These samples were analyzed by GFP �uorescence and the oocyte marker Ddx4 immuno�uorescencelabeling (Fig. 3c). The result showed that the oocytes have almost no green �uorescence. Furthermore,the ovarian tissues were digested and separated into single cells for culture and then cultured with 109
empty AdV-GFP. The results showed that most of the GFP-positive cells are stroma cells, and theproportion of GFP-positive stromal cells is 61.55 ± 2.651%. The oocytes were hardly transfected (Fig. 3eand 3h). The cells were stained with Cyp17a1 (red �uorescence), a marker of ovarian stromal cells (Fig.3d). The statistical results showed that the ratio of red light to green light overlapping cells is 52.23 ±9.805%. These results indicate that AdV-GFP mainly infects ovarian stromal cells and has almost noinfectivity to oocytes. Also, these results along with literature 21 suggest that AdV is a better gene carrierfor the following ovarian gene therapy experiments.
4. Safety assessment of AdV gene therapy in situ injection of ovary
To further explore the safety of ovarian gene therapy and determine the duration of overexpression in theovary, we constructed AdV-Sirt1 and AdV-Tgfbr2 for the following in vivo experiments. A schematicdiagram of the vector construction is shown in Fig. 4a. The experimental �owchart is presented in Fig. 4b.The mouse ovaries of the four groups were injected with AdV-GFP, AdV-Sirt1, AdV-Tgfbr2, and PBS in situ,and then tested at four time points (2, 4, 6, and 8 weeks). By the end of the observation (Day 61), therewas no signi�cant difference in body weight among all of the four groups. Also, the hair color and vitalityof the mice displayed no changes among the four groups. The levels of alanine aminotransferase (ALT),aspartate aminotransferase (AST), and creatine kinase (CK) were not signi�cantly altered in each timepoint compared with the PBS group (Fig. 4c-e). However, blood urea nitrogen (BUN) and creatinine (CREA)in the AdV-Sirt1 and AdV-Tgfbr2 groups were higher than those in the PBS group at different time points(Fig. 4f-g), though the levels of the in�ammation marker TNF-α in the other groups were not signi�cantlydifferent at various time points compared with the PBS group (Fig. 4h). Furthermore, H&E staininganalyses of the hearts, livers, spleens, kidneys, and uteruses of the mice showed that there are noapparent pathological changes in these tissues (Fig. S3a). Also, there was no signi�cant difference inorgans’ weights among all of the 8-week groups (Fig. S3b). By calculating the organ index, we found thatthere is a decrease in liver index in the AdV-Tgfbr2 group (Fig. S3c). The changes in the liver index and thelevel of CREA in the AdV-Tgfbr2 group might be due to the in�uence of Tgfbr2 or other yet unknownfactors, which requires further investigation.

Page 7/34
To test whether ovarian gene therapy is toxic to the ovaries, we also tested the ovaries. There was nosigni�cant difference in the ovarian weight at each time point. AdV-Sirt1 and AdV-Tgfbr2 groups showedan increasing trend at 8 weeks, which may be related to the increase in body weight over time (Fig. S3d).Further calculations revealed that the ovarian index of each group did not change signi�cantly atdifferent time points. However, only in the AdV-Tgfbr2 group, the 4-week group showed a signi�cantdecrease compared with the 2-week group, but it was compensated in the subsequent time (Fig. S3e).The estrous cycle of the mice in each group was monitored one week after ovarian injection in situ (Fig.4i). The results showed that there is no signi�cant difference in the ratio of regular and irregular estrouscycles among the groups (Fig. 4j). In conclusion, AdV-Sirt1 and AdV-Tgfbr2 appear to be safe agentsbecause no signi�cant damage to ovarian function in mice.
We also assessed the expression of Sirt1 and Tgfbr2 in mouse ovarian tissues by extracting RNAs fromof ovarian tissues in each group and conducting qPCR analysis at each time point. As a result, the mRNAexpression of Sirt1 increased and lasted 2 weeks and 4 weeks after injection of AdV-Sirt1, but there wasno signi�cant difference by 6-8 weeks (Fig. 5a). The mRNA expression of Tgfbr2 increased and lasted 6weeks after injection of AdV-Tgfbr2, but not by week 8 (Fig. 5b). This was con�rmed by WB analysis oftheir protein levels (Fig. 5c-f). As a control, we also detected GFP expression in mouse ovaries afterinjection of AdV-GFP by IHC analysis. As a result, the expression of GFP increased from 2 to 6 weeks andgradually decreased by 8 weeks (Fig. 5g-h and S4a-b). In summary, in situ injection of the AdV vector intothe ovary can maintain the overexpression effect of target genes for 4-6 weeks.
5. The protective effects of adenovirus mediated Sirt1 and Tgfbr2 gene therapy on Dox-induced ovariandamage
Next, we determined whether in vivo restitution of Sirt1 and Tgfbr2 could repair or improve ovariandamage caused by Dox. As shown in Fig. 6a, mice were treated with a single dose of AdV-Sirt1, AdV-Tgfbr2, AdV-Sirt1 combined with AdV-Tgfbr2 or AdV-GFP control, and Dox ( the model of ovarian damagewas induced by the intraperitoneal injection of doxorubicin (Dox, 10 mg kg-1), or N.S. control wasadministered intraperitoneally to the animals one week later for studying their effects on ovarianfunction. The animals’ body weights were monitored after the intervention (Fig. S5a). Compared with theirweights before surgery (day 0), the animals’ body weights in each group on the �rst postoperative day(day 1) decreased signi�cantly, but gradually recovered from day 2. By day 38, their body weights in theDox, S+Dox, T+Dox, and ST+Dox groups showed a decreasing trend, compared with that of the N.S.group. The survival rate of T+Dox was 90%, and that of ST+Dox was 88.89%, showing no statisticaldifference when compared to the N.S., Dox, and S+Dox groups (Fig. 6b). The ovarian endocrine functionand the estrous cycle of mice were monitored for 2 weeks. Interestingly, the regularity of the estrous cyclein the Dox group was 30% while the regularity of the Sirt1+Dox group increased to 44%, and the ratio ofthe ST+Dox group was increased to 50% (Fig. 6c and S5b). Also, sex hormone levels, such as the levels ofestrogen, progesterone, and AMH, in the ST+Dox group increased signi�cantly, compared with the Doxgroup. Moreover, the levels of estrogen and AMH in the T+Dox group tended to increase. There was no

Page 8/34
signi�cant difference in FSH levels among the �ve groups, but the T+Dox and ST+Dox groups showed adownward trend (Fig. 6d-g).
Compared with the Dox group, the ovarian weight of the mice in the T+Dox and ST+Dox groups weresigni�cantly increased (Fig. 6i), and the ovary index of S+Dox, T+Dox, and ST+Dox groups also increased(Fig. 6j). H&E staining of ovarian sections was performed to detect mice ovarian reserve withrepresentative images as shown in Fig. 6h. The number of ATFs decreased in the S+Dox, T+Dox, andST+Dox groups by follicle counting in comparison with the Dox group, (Fig. 6k). Follicle ratio resultsshowed that compared with the Dox group, the proportion of growing follicles in the T+Dox groupappeared to incline (Fig. S5d). These results suggest that AdV-Tgfbr2 and AdV-Sirt1+AdV-Tgfbr2 couldimprove the recovery of ovarian endocrine and reserve function after Dox treatment.
Further, we tested whether the gene therapy could improve the reproductive function of the ovary afterDox treatment. Randomly selected mice from each group were caged with wild-type male mice for 10days, and the pregnancy rate of the female mice was tested to evaluate reproductive function. Thepregnancy rates of the S+Dox, T+Dox, and ST+Dox female mice increased, compared with the Dox group(Fig. 7a). The average litter size of post-delivery mice (Fig. 7b) and all mated mice of T+Dox and ST+Doxgroups (Fig. 7c) increased compared with the Dox group. There was no signi�cant statistical difference inthe average birth weight per litter (Fig. S6a) and the ratio of male to female (Fig. S6b) in each group. Asshown in the representative images of the offspring of each group (Fig. 7d), all of the pups lookedhealthy without any apparent birth defects. These data indicate that AdV-Tgfbr2 alone or combined withAdV-Sirt1 via in vivo restitution could rescue ovarian endocrine and reproductive damage caused by Dox.
To verify whether the offspring of each group of female mice carry the AdV gene, we extracted thegenomic DNA of each group of offspring mice and designed primers for the E4 region of AdV. The resultsof agarose gel electrophoresis after PCR showed that Gapdh in each group had a positive band (exceptfor the negative control), and there was no positive band in AdV-E4 in each group (except the positivecontrol) (Fig. 7e). This result indicates that the ovarian in situ injection of the AdV vector does not passthe genomic sequence of this vector to the offspring through vertical transmission. This suggests that theapproach is safe to the offspring. Also, we simultaneously detected the primordial follicles and primaryfollicles of the ovaries in the offspring of PND3 and PND7. As shown in the representative H&E images inFig. 7f, the number and proportion of follicles in PND3 and PND7 mice as quanti�ed and presented in Fig.7g and 7h were not signi�cantly different among all of the groups, suggesting that ovarian in situ genetherapy does not affect the ovarian reserve of the offspring.
6. Signature transcriptome in response to overexpression of Sirt1 and Tgfbr2 likely underlying theprotection of ovaries from doxorubicin-induced damage
To gain molecular insights into how Sirt1 and Tgfbr2 might improve the Dox-induced ovarian damage, wecarried out transcriptome sequencing in the Dox and ST+ groups, which had a better rescuing effect. TheFPKM value was obtained through quality control, mapping, and quanti�cation. Since the geneexpression value of RNA-Seq is usually expressed by FPKM, we �rst corrected the data and then

Page 9/34
visualized the distribution of gene expression levels before (Fig. 8a) and after (Fig. 8b) correction throughbox plots, respectively. In addition, principal component analysis (PCA) was also used to assess thedifferences between groups and sample duplication within groups, and to perform dimensionalityreduction and principal component analysis on genetic variables. The PC1 coordinate axis is the methodwith the largest variance in data. The PC2 coordinate axis selects the direction orthogonal to the PC1coordinate axis and has the second largest variance. As shown in Fig. 8c, the samples were divided intotwo groups after PCA analysis. In order to show the correlation of gene expression between samples,Pearson correlation calculation was conducted on all gene expression levels between two samples, andthe results were presented in the form of a heat map (Fig. 8d), indicating the sample differences betweengroups, which was used for downstream differential expressed gene (DEG) analysis. We used the Deseq2package 22 to analyze the DEGs of the ST+Dox and Dox groups. Genes with FDR (P.adj) < 0.05, and log2foldchange > 1 were extracted as DEGs. Furthermore, a heatmap plot was drawn and clustered asdemonstrated in Fig. 8e. In the volcano map, some of the DEGs of interest were marked, and it was foundthat genes related to the �brosis process, such as Mmp2, Mmp12, Mmp19, Col22a1, and Timp1, weresigni�cantly downregulated. Reproduction-related genes, such as Fshr, were signi�cantly upregulated(Fig. 8f).
Table 1. GO enrichment analysis of DEGs

Page 10/34
Category Term Description Count % P value
BP GO:0008406 gonad development 13 7.26% 1.25E-08
BP GO:0048608 reproductive structuredevelopment
15 8.38% 2.27E-06
BP GO:0061458 reproductive systemdevelopment
15 8.38% 2.53E-06
BP GO:0043062 extracellular structureorganization
13 7.26% 1.10E-06
BP GO:0030198 extracellular matrixorganization
11 6.14% 8.81E-06
BP GO:0046626 regulation of insulinreceptor signaling pathway
6 3.35% 2.51E-05
BP GO:1900076 regulation of cellularresponse to insulin stimulus
6 3.35% 6.62E-05
CC GO:0031012 extracellular matrix 18 9.90% 3.58E-08
CC GO:0062023 collagen-containingextracellular matrix
12 6.59% 2.57E-05
CC GO:0030017 sarcomere 8 4.40% 0.000119391
CC GO:0019898 extrinsic component ofmembrane
10 5.49% 0.000181577
CC GO:0044449 contractile fiber part 8 4.40% 0.00019496
MF GO:0008237 metallopeptidase activity 9 5.02% 1.08E-05
MF GO:0004175 endopeptidase activity 13 7.26% 5.28E-05
MF GO:0004222 metalloendopeptidaseactivity
6 3.35% 0.000142372
MF GO:0046935 1-phosphatidylinositol-3-kinase regulator activity
3 1.68% 0.000164419
MF GO:0005201 extracellular matrixstructural constituent
6 3.35% 0.00086498
GO functional enrichment analysis was performed using the ClusterPro�ler package 23. The results ofgene enrichment showed that in the biological process (BP) category, DEGs were signi�cantly enriched inbiological processes, such as “reproductive structure development”, “reproductive system development”,and “gonad development”. The DEGs in the cellular component (CC) category were signi�cantly enriched

Page 11/34
in “extracellular matrix”, “collagen-containing extracellular matrix”, collagen-containing extracellularmatrix, and other cytological components. The DEGs in the molecular function (MF) category wereenriched in “metallopeptidase activity” and “metalloendopeptidase activity” (Fig. 8g and Table 1). Inaddition, gene set enrichment analysis (GSEA) results indicated that the BP terms, such as “ovarianfollicle development” and “response to gonadotropin,” in ST+Dox group were up-regulated than Doxgroup, and the corresponding genes of BP terms, such as Inha, Inhba, Foxl2 and Amh, were ranked higherin the gene set (Fig. 8h). At the same time, the GSEA of KEGG pathway revealed that the pathways, suchas “Oocyte meosis,” “Progesterone-medieated oocyte maturation,” and “Insulin signaling pathway,” in theST+Dox group are also higher in the gene rank list. The corresponding genes Akt1 and Igf1r were rankedhigher in the pathway (Fig. 8i).
In addition, we used the differentially expressed pathways as the analysis object to conduct a differentialpathway variation analysis (Gene set variation analysis, GSVA) 24 based on the hallmark pathway geneset provided by the molecular signature database (version 7.2) 25. GSVA analysis showed that the term“ESTRONGEN_RESPONSE_LATE” has a higher score and that other terms, such as in�ammation-relatedresponses such as “INTERFERON_GAMMA_RESPONSE,” and “INFLAMMATORY_RESPONSE,” also havehigher GSVA scores (Fig. S7a). Additionally, using the String website (https://string-db.org/) andCytoscape (Windows 3.8.2 version), a protein-protein interaction (PPI) network of DEGs was constructedand the degree value was �ltered through the Centiscape 2.2 plug-in. Genes with a degree value > 5.0were selected as hub genes, and Timp2 and Mmp2 were identi�ed as hub genes (Fig. S7b).
DiscussionChemotherapy has been one of the commonly used cancer treatments in clinical oncology. However, itoften induces ovarian damage, resulting in developmental disorders of the reproductive system,decreased ovarian reserve function, loss of fertility, and early menopause. This detrimental side effectgreatly in�uences the self-esteem and life quality of female cancer patients before their menopause 26.The current clinical countermeasure or potential therapies to chemotherapy-induced ovarian damage areeither still at their early research phase or with unclear e�cacy and possible relapse of cancer and ethicaldilemmas. These negative components hinder the corresponding clinical application of these existingapproaches. Hence, an effective repairing therapy is urgently needed to improve the chemotherapy-induced ovarian damage for female cancer patients.
In our study as presented, we employed a mouse model system with Dox-induced ovarian damage as abreakpoint to explore the feasibility of gene therapy as a protective strategy. The adenovirus vector wasselected as a gene therapy vector in this study through screening three different gene delivery agents asfurther discussed below. Ovarian in situ injection of AdV-mediated Sirt1 and Tgfbr2 was used for genetherapy in vivo. Our �ndings from this set of studies demonstrated that a single administration of AdV-Sirt1 and AdV-Tgfbr2 individually or in combination can protect the ovarian endocrine, reproductivefunction, and ovarian reserve from Dox-caused damage.

Page 12/34
First, we showed that the degree of ovarian �brosis increases in doxorubicin-induced ovarian damage.Through RNA-Seq, we found that the expression of Tgfbr2 and Sirt1 decreases in the ovaries of the Doxgroup. Through the in vitro culture of human ovarian tissue in Dox, we also found that the expression ofSIRT1 and TGFBR2 decreases in the human ovary. Sirt1, a longevity gene, is known to extend lifespanand delay aging 27 and plays an important role in the development of follicles 28. In Dox-inducedcardiotoxicity, the expression of Sirt1 decreased and increased levels of apoptosis and oxidative stress;however, administration of resveratrol, a Sirt1 activator, can alleviate cardiac damage 29. Tgfb1 is acritical pro�brotic factor, which is closely related to the synthesis of the extracellular matrix (ECM) andcan cause multiple organ �brogenesis 17. An abnormal increase in the level of Tgfb1 in the ovary cancause follicular dysplasia and ovulation failure 30. Tgfbr2 speci�cally binds to Tgfb1, and exogenousadministration of Tgfbr2 can reduce the binding of Tgfb1 to receptors on the cell membrane andsubsequent signaling cascades, thereby inhibiting the process of �brosis 18. This study also showed thatthe expression of the ovarian follicle development-related gene Sirt1 and the �brosis-related index Tgfbr2decreased in the Dox-induced ovarian damage model, which is consistent with the aforementionedresearch in other organ systems.
Regarding the types of virus vectors, we searched the literature and summarized that the vectors thathave been conducted in the germline include AAV9 31, AdV 21 21 32 33, RV 32 and LV 32. Based on thisinformation, we used the empty vectors of AAV9-GFP, AdV-GFP, and LV-GFP to explore tropism to theovary. Through in vitro culture of ovaries and ovarian single cells, we found that the AdV empty vectorhas a better tropism to the ovary, and mainly infects the stromal cells, but not the oocytes, of the ovary.Moreover, Gordon 34 reported that adenoviruses are not able to transduce female germ cells, which is anatural advantage of AdV. Therefore, AdV was selected as the vector for subsequent experiments.
AdV-Sirt1 and AdV-Tgfbr2 were constructed and injected into ovaries in situ for detection of localization,safety, and overexpression time. Two weeks after the ovarian injection in situ, ovarian function was notseverely damaged, and the green �uorescence was mainly concentrated in the ovarian stroma, but no�uorescence was detected in the follicles, indicating that the AdV vector mainly acts on the interstitialcells of the ovary. Our results also indicated that ovarian gene therapy had no signi�cant effect on thegeneral health condition of the mice. The above results fully con�rmed the safety of ovarian in situinjection of adenovirus, suitable as a carrier for gene therapy in the ovary.
AdV-Sirt1 combined with AdV-Tgfbr2 gene therapy showed that ovarian endocrine function and reservefunction are improved in the Dox-induced mouse ovarian damage model. Investigation of reproductivefunction revealed that the pregnancy rate and average litter size also increase after gene therapy.Tracking down to its offspring, no offspring carrying the AdV genome was found, indicating that theadenovirus vector’s own gene is not inherited by the offspring and �rmly con�rming the safety of genetherapy. This safety result to the reproduction system is consistent with the study using male mice asreported by Ikawa et al. 32. C-kit ligand (KL2) gene therapy was administered to male sterile Sl/Sld mutantmice caused by KL2 defects in male testicular Sertoli cells. The offspring were produced by the method

Page 13/34
of in vitro fertilization, and no germline transduction was identi�ed, which fully illustrates the safety ofgene therapy in the male reproductive system.
In addition, we compared the histology and functional changes of mouse ovaries between the genetherapy group (AdV-Sirt1+AdV-Tgfbr2+Dox) and the chemotherapy group (AdV-GFP+Dox) through RNA-Seq. Compared with the chemotherapy group, AdV-Sirt1 combined with AdV-Tgfbr2 restored the structureof the reproductive system, promoted ovarian follicle development, oocyte meiosis, and maturation, andenhanced the effect of gonadotropin response.
In contrast, our RNA seq analysis of these ovarian tissues showed that genes related to the �brosisprocess in DEGs are signi�cantly downregulated. The biological processes, including extracellular matrixreorganization of the �brosis process, metallopeptidase activity, and metallopeptidase activity, were alsosigni�cantly downregulated in the gene therapy group, which con�rmed that ovarian in situ gene therapycan alleviate ovarian �brosis. Interestingly, the regulation of the insulin pathway ranks high in the GSEAresults, which may be closely related to Sirt1 administration and its subsequent regulation. Sirt1 candirectly or indirectly participate in the insulin signaling pathway, and can play an active role in themetabolic pathway by regulating the in�ammatory response, gluconeogenesis and reactive oxygenspecies that promote the development of insulin resistance 35,36, which is also suggested in Fig. 8i. Anumber of studies showed that insulin stimulation in vitro of granulosa cells can promote the productionof estradiol37. Intriguingly, Peluso 38 found that insulin administration in vivo can stimulate mitoticactivity, but inhibit the secretion of estradiol by the ovaries. There are some contradictions betweenexperiments in vivo and in vitro 39, indicating that the relationship between the insulin pathway andfollicle development is more complicated. Our study as presented here showed that pathways related toin�ammation and oxidative stress, such as interferon gamma response, reactive oxygen species pathway,and hypoxia, also score higher in GSVA, which is believed to be caused by the local in�ammatoryresponse caused by AdV vectors to the ovaries, hence, further research is still needed.
Previously, Ghadami et al. 21 used AdV-FSHR to perform gene augmentation therapy on FSHR geneknockout mouse models and showed a therapeutic effect, including enhanced oogenesis and follicledevelopment, increased estrogen levels, and decreased serum free FSH levels. However, this research isbased on the human FSHR gene C566T homozygous missense mutation transgenic knockout mice tostudy premature ovarian failure. Of note, this study used wild-type mice to con�rm the feasibility ofovarian in situ injection gene therapy. However, the method of ovarian in situ injection used in thisexperiment is more complicated, so its clinical translation could be challenging. In order to expresstherapeutic genes in ovaries by non-surgical methods, such as intraperitoneal or intravenous injection,constructing ovarian stroma-speci�c promoters can be adopted in the optimization of the vector, whichwill be the future research direction of this research.
In summary, our study is the �rst to validate the feasibility of using AdV as a carrier of ovarian genetherapy, which can increase the mRNA and protein expression levels of target genes. As the method is insitu injection, no signi�cant systemic damage has been detected. We also show that a single

Page 14/34
administration of AdV-Sirt1 with AdV-Tgfbr2 could alleviate the damage caused by Dox to improve theovarian endocrine, reproductive function, and ovarian reserve. Our results provide a proof of concept ofusing AdV-Sirt1 with AdV-Tgfbr2 as potential therapeutic agents for improvement of ovarian damagecaused by chemotherapy, such as Dox, for female cancer patients.
Methods1. Animal and experiment design
The 8-week-old female C57BL/6 mice used in this study were purchased from the Beijing Charles RiverAnimal Laboratory (Beijing, China). All the mice were housed in ABSL-2 an environmentally conditionedroom at 25 °C and 50% humidity with a 12-hour light/dark cycle, and given food and water ad libitum.The experimental procedures were approved by the ethics committee of Tongji hospital, Tongji MedicalCollege, Huazhong University of Science and Technology in China.
To detect Dox-induced ovarian damage, doxorubicin (Dox) and normal saline (NS) were administered tothe female mice i.p. (10 mg kg-1, n=10). One week after injection, the estrous cycle was monitored for 14days, and the mice were euthanized at diestrus. Ovaries and blood samples were collected for thefollowing experiments.
To assess the safety and overexpression period, 100 female C57BL/6 mice were randomly divided intofour groups, as described in Fig. 5a. AdV-GFP(1.0×10¹⁰ PFU mL-1), AdV-Sirt1 (6.5×10¹⁰ PFU mL-1), AdV-Tgfbr2 (7.0×10¹⁰ PFU mL-1), and PBS were delivered by bilateral intraovarian injection using a Gauge 30Hamilton syringe(5 μL, n = 25). Four groups of mice were euthanized at 2 weeks, 4 weeks, 6 weeks, and 8weeks after the operation, and the ovaries, blood samples, and other organs were collected for furtheranalysis.
To investigate the protective effects of ovarian function, 100 C57BL/6 mice were randomly divided into�ve groups, as described in Fig. 8a. Five microliters of AdV-GFP empty vector was delivered throughbilateral intraovarian injection in the N.S and Dox groups, and normal saline and Dox were administeredi.p. one week later. Five microliters of AdV-Sirt1, AdV-Tgfbr2, and AdV-Sirt1 combined with AdV-Tgfbr2were delivered through bilateral intraovarian injection in the S+Dox, T+Dox, and ST+Dox groups,respectively, and Dox was administered i.p. one week later. After monitoring the estrous cycle for another14 days, half of the mice were sacri�ced at the stage of diestrus. The other half of the female mice wasused for the mating test.
2. Surgical procedures of ovarian in situ injection
Sodium pentobarbital was used for anesthesia (50 mg kg-1 in PBS) intraperitoneally (i.p.). The mice werethen placed in the prone position on a sterile gauze pad, and the limbs were stretched and �xed. The backarea was shaved to expose the surgical �eld, and iodophor and 75% alcohol were used to disinfect theskin. A small 1 cm incision located at the dorsomedial position was made, and the peritoneal wall was

Page 15/34
cut open using scissors. A sterile saline gauze pad was placed near the incision after �nding the ovarianfat pad, exposing the ovary. Then, 5 μL of the prepared adenovirus or saline was aspirated with analcohol-sterilized microinjection needle (30-gauge, G), and gently inserted into the bend of the fallopiantube of the ovarian sac under a stereo microscope. The needle can be observed under the ovarian sac.After injection, the ovary was returned to its initial anatomical position. The peritoneal, muscle layer,fascia, and skin were sutured with absorbable sutures. After suturing, the surgical incision wasdisinfected with an iodophor. The mice were placed on a heating pad for recovery to prevent hypothermia.The breathing rate and comfort level of the mice were monitored, as well as the ability to moveautonomously in order to determine the postoperative recovery effect.
3. Ethical approval and human ovarian samples collection
The ovarian tissues used in this study were collected from eight patients (aged 33–67 years) at TongjiHospital, Tongji Medical College, Huazhong University of Science and Technology. The quali�cations forsurgery included breast cancer, cervical spindle cell tumor, and endometrioid adenocarcinoma. Thepathologists observed no abnormal ovarian pathology. The study protocol was approved by the localhuman research ethics committee. All patients signed an informed consent form for this study.
4. Estrous cycle monitoring
Vaginal smears were made at 9 am every day for 14 consecutive days. Dried slices were stained withhematoxylin for 5 min, rinsed with tap water three times, stained in eosin solution for half a minute, and�xed in ethanol for 10 min. The estrous cycle was identi�ed under a light microscope by two observers,as described by Byers et al. 40.
5. Enzyme-linked immunosorbent assay
The serum levels of estrogen, progesterone, AMH, FSH, and TNF-α were measured by ELISA according tothe manufacturer’s instructions (Cusabio Biotech, Wuhan, China). An empty well was set up, and 50 μL ofthe standard solution of each concentration was added, and the samples were tested in the assay plate.Next, 50 μL of HRP-conjugate mixed solution was added to each well, excluding the empty well. This wasstirred thoroughly, then the plate was sealed with a transparent �lm and incubated at 37℃ for 1 hour.The liquid was discarded, 200 μL of wash buffer was added to each well, and this procedure wasrepeated �ve times. Fifty microliters of substrate A and 50 μL of substrate B were pipetted into the wellplate, mixed thoroughly, and incubated at 37 °C for 15 min. Then, 50 μL of stop solution was added, andthe plate was read using a microplate reader (450 nm, reference 620 nm). Curve Expert 1.4 software wasused to generate the standard curve and obtain the �nal concentration of the hormones.
6. Follicle counting
After the mouse ovaries were �xed in 4% paraformaldehyde, the tissues were embedded in para�n andserially sectioned along the longitudinal axis of the ovary, and each section was attached to four pieces

Page 16/34
of ovarian tissue with a thickness of 5 μm. The sections were H&E stained and counted for follicles at allstages (primordial follicles, primary follicles, secondary follicles, antral follicles, and atretic follicles)under a light microscope. The detailed morphological and structural characteristics of various levels offollicles in the mouse ovary were described by Sonigo et al. 41.
7. Histology
For H&E staining, the para�n sections of the ovaries were depara�nized and rehydrated by passingthrough dewaxing solution I (20 min), dewaxing solution II (20 min), ethanol (10 min), 95% ethanol (10min), 80% ethanol (5 min), and 75% ethanol (5 min). The sections were stained with hematoxylin solutionfor 5 min, rinsed with tap water, soaked in hematoxylin differentiation solution, and rinsed with tap water.Afterwards, the sections were stained with bluing solution, rinsed with tap water, and stained with eosindye for 5 min. The sections were dehydrated as routine procedures and sealed with neutral gum.
For immunohistochemistry, the sections were heated in a microwave for 25 min with citric acid forantigen retrieval. 3% H2O2 was used at room temperature to block endogenous peroxidase activity. Thesections were blocked with 3% BSA for 1 h and incubated with primary antibody overnight at 4 °C. Afterthe sections were incubated in secondary antibody (HRP labeled) for 1 h, they were stained with DABagent and hematoxylin to visualize the signal.
For Sirius red staining, the sections were stained with Sirius red solution for 8 min and dehydrated quicklywith three cycles of ethanol. Slices were placed in xylene for 5 min and mounted with neutral resin formicroscopic inspection, image acquisition, and analysis.
For Masson’s trichrome staining, the sections were soaked in Masson’s solution overnight. Masson B andMasson C solutions were mixed at a ratio of 1:1. The sections where then soaked for 1 minute, rinsedwith tap water, and differentiated for 1 minute with 1% hydrochloric acid alcohol. Subsequently, thesections were soaked in Masson D for 6 min, Masson E for 1 min, and Masson F for 2-30 s. The sectionswere rinsed and differentiated in 1% glacial acetic acid, dehydrated with three cups of ethanol, placed inxylene for transparency, and sealed with neutral gum. The sections were observed under a microscopeand analyzed using Image Pro Plus software (version 6.0; Media Cybernetics, MD, USA).
8. Ovarian culture in vitro
The dissected ovaries were placed into cell culture inserts (6.5 mm, 0.4 μm, and NEST, Wuxi, China) in a24-well plate, with 3-5 ovaries per well, and 500 μL medium was added. Minimum essential mediumalpha (MEM-alpha) (Boster, Wuhan, China) was supplemented with fetal bovine serum (FBS, 3 mg mL-1)(Gibco, USA), ascorbic acid (50 μg mL-1) (Solarbio, Beijing, China), sodium pyruvate (0.24 mM) (ThermoFisher Scienti�c, Shanghai, China), insulin-transferrin-sodium selenite media supplement (ITS, 100×)(Sigma-Aldrich, St Louis, USA), penicillin (100 U mL-1), and streptomycin (100 mg mL-1) (Servicebio,Wuhan, China). The protocols are described in detail in a previous study42.

Page 17/34
9. RNA extraction and qPCR
Total RNA was extracted from the ovaries of different groups of mice using RNAiso plus reagent (Takara,Shiga, Japan). RNA samples (1 µg) were treated with gDNA wiper mix (Vazyme, Nanjing, China) and thentranscribed into cDNA using HiScript reverse transcriptase (Vazyme, Nanjing, China) according to themanufacturer’s protocol. Real-time PCR was conducted using a CFX96 real-time PCR system (Bio-Rad, CA,USA). The PCR cycling parameters of the primers were as follows: pre-denaturation at 95 °C for 10 min,denaturation at 95°C for 30 s, annealing, and extension at 60°C for 30 s. The number of cycles was set to40. Relative gene expression levels were calculated using the formula 2 −ΔΔCt with Actb as theendogenous control. Primer sequences are listed in Table S1.
10. Western blot
Total protein was extracted from the ovaries of the different groups by lysis buffer containing RIPA with0.1 mM phenylmethylsulfonyl �uoride. The protein concentrations were quanti�ed using CoomassieBrilliant G250. Proteins were separated by SDS-PAGE and transferred to a polyvinylidene �uoridemembrane. After blocking in 5% nonfat milk for 1 h, the membranes were incubated with differentprimary antibodies (1:1000) at 4 °C overnight. The membranes were then incubated with the secondaryantibody (1:3000) for 1 h at room temperature. The membranes were detected using a chemiluminescentECL agent (Advansta, CA, USA) in a darkroom and captured using the ChemiDoc MP imaging system(Bio-Rad, CA, USA).
11. Statistical analysis
The data were analyzed using GraphPad Prism 7.0 (GraphPad Software, CA, USA) and SPSS software(version 21.0; IBM Corp., Armonk, NY, USA). Normally distributed data are presented as the mean ±standard error. Measurement data were analyzed using Student’s t-test or one-way ANOVA according tothe distribution condition. Count data were analyzed using the chi-square test or Fisher's exact test.Differences were considered statistically signi�cant at P < 0.05; “ns’ indicates not statistically different.
12. Gene expression analysis
Total RNA from frozen ovarian samples was extracted and delivered to the BGI-Wuhan lab for RNAsequencing. Clean reads were obtained after �ltering the raw reads and checking the sequencing errorrate and GC content distribution. HISAT software 21 was used to compare clean reads to the mousegenome assembly (GRCm38.p6). FPKM was used to display the gene expression abundance, and thecorresponding annotations were added. The raw data analysis process was conducted using the BGI.Next, differentially expressed genes (DEGs) were identi�ed using the DESeq2 package 43.The screeningcriteria were |log2(FoldChange)| > 1 and P.adj < 0.05. The ClusterPro�ler 23 package was used for GeneOntology (GO) 44 and KEGG 45 pathway enrichment analyses. Gene set enrichment analysis (GSEA) wasperformed using the ClusterPro�ler package, and the reference gene set of “h.all.v7.1.symbols.gmt” in themolecular signature database 25 (version 7.2). Gene set variation analysis (GSVA) was performed using

Page 18/34
the limma package 46 to visualize the pathways with signi�cant differences. PPI network and hub geneidenti�cation were built using the STRING 47 database and Cytoscape software 48, with Centiscape 2.2 49
and MCODE 50 apps.
Data availability:
The authors declare that all other data supporting the �ndings of this study are
available within the paper and its supplementary information �les.
References1. Brenner, H. Long-term survival rates of cancer patients achieved by the end of the 20th century: a
period analysis. Lancet 360, 1131–1135 (2002).
2. Molina, J. R., Barton, D. L. & Loprinzi, C. L. Chemotherapy-induced ovarian failure: manifestationsand management. Drug Saf 28, 401–416 (2005).
3. Spears, N. et al. Ovarian damage from chemotherapy and current approaches to its protection. HumReprod Update 25, 673–693, doi:10.1093/humupd/dmz027 (2019).
4. Demeestere, I. et al. Gonadotropin-releasing hormone agonist for the prevention of chemotherapy-induced ovarian failure in patients with lymphoma: 1-year follow-up of a prospective randomizedtrial. J Clin Oncol 31, 903–909, doi:10.1200/JCO.2012.42.8185 (2013).
5. Demeestere, I. et al. No Evidence for the Bene�t of Gonadotropin-Releasing Hormone Agonist inPreserving Ovarian Function and Fertility in Lymphoma Survivors Treated With Chemotherapy: FinalLong-Term Report of a Prospective Randomized Trial. J Clin Oncol 34, 2568–2574,doi:10.1200/JCO.2015.65.8864 (2016).
�. Bastings, L. et al. Autotransplantation of cryopreserved ovarian tissue in cancer survivors and therisk of reintroducing malignancy: a systematic review. Hum Reprod Update 19, 483–506,doi:10.1093/humupd/dmt020 (2013).
7. Donnez, J. & Dolmans, M.-M. Fertility Preservation in Women. The New England journal of medicine377, 1657–1665, doi:10.1056/NEJMra1614676 (2017).
�. Xiong, J. et al. Therapy of Endocrine Disease: Novel protection and treatment strategies forchemotherapy-associated ovarian damage. Eur J Endocrinol, doi:10.1530/EJE-20-1178 (2021).
9. Dunbar, C. E. et al. Gene therapy comes of age. Science 359, 1–10, doi:10.1126/science.aan4672(2018).
10. Blum, R. H. & Carter, S. K. Adriamycin. A new anticancer drug with signi�cant clinical activity. AnnIntern Med 80, 249–259 (1974).
11. Ben-Aharon, I. et al. Doxorubicin-induced ovarian toxicity. Reprod Biol Endocrinol 8, 20,doi:10.1186/1477-7827-8-20 (2010).

Page 19/34
12. Bar-Joseph, H. et al. Doxorubicin-induced apoptosis in germinal vesicle (GV) oocytes. Reprod Toxicol30, 566–572, doi:10.1016/j.reprotox.2010.07.003 (2010).
13. Wang, Y. et al. Multidrug Resistance Protein 1 De�ciency Promotes Doxorubicin-Induced OvarianToxicity in Female Mice. Toxicol Sci 163, 279–292, doi:10.1093/toxsci/kfy038 (2018).
14. Roti Roti, E. C., Ringelstetter, A. K., Kropp, J., Abbott, D. H. & Salih, S. M. Bortezomib prevents acutedoxorubicin ovarian insult and follicle demise, improving the fertility window and pup birth weight inmice. PloS one 9, 1–10, doi:10.1371/journal.pone.0108174 (2014).
15. Bar-Joseph, H. et al. In vivo bioimaging as a novel strategy to detect doxorubicin-induced damage togonadal blood vessels. PloS one 6, e23492, doi:10.1371/journal.pone.0023492 (2011).
1�. Meng, X.-M., Nikolic-Paterson, D. J. & Lan, H. Y. TGF-β: the master regulator of �brosis. Nat RevNephrol 12, 325–338, doi:10.1038/nrneph.2016.48 (2016).
17. Kim, K. K., Sheppard, D. & Chapman, H. A. TGF-β1 Signaling and Tissue Fibrosis. Cold Spring HarbPerspect Biol 10, 1–34, doi:10.1101/cshperspect.a022293 (2018).
1�. Okada, H. et al. Postinfarction gene therapy against transforming growth factor-beta signalmodulates infarct tissue dynamics and attenuates left ventricular remodeling and heart failure.Circulation 111, 2430–2437 (2005).
19. Davidsohn, N. et al. A single combination gene therapy treats multiple age-related diseases. Proc NatlAcad Sci U S A 116, 23505–23511, doi:10.1073/pnas.1910073116 (2019).
20. Zhang, J. et al. Are sirtuins markers of ovarian aging? Gene 575, 680–686,doi:10.1016/j.gene.2015.09.043 (2016).
21. Ghadami, M. et al. Toward gene therapy of premature ovarian failure: intraovarian injection ofadenovirus expressing human FSH receptor restores folliculogenesis in FSHR(-/-) FORKO mice. MolHum Reprod 16, 241–250, doi:10.1093/molehr/gaq003 (2010).
22. Love, M. I., Huber, W. & Anders, S. Moderated estimation of fold change and dispersion for RNA-seqdata with DESeq2. Genome Biol 15, 1–21 (2014).
23. Yu, G., Wang, L.-G., Han, Y. & He, Q.-Y. clusterPro�ler: an R package for comparing biological themesamong gene clusters. OMICS 16, 284–287, doi:10.1089/omi.2011.0118 (2012).
24. Hänzelmann, S., Castelo, R. & Guinney, J. GSVA: gene set variation analysis for microarray and RNA-seq data. BMC Bioinformatics 14, 7, doi:10.1186/1471-2105-14-7 (2013).
25. Subramanian, A. et al. Gene set enrichment analysis: a knowledge-based approach for interpretinggenome-wide expression pro�les. Proc Natl Acad Sci U S A 102, 15545–15550 (2005).
2�. Ahmad, S. S., Reinius, M. A., Hatcher, H. M. & Ajithkumar, T. V. Anticancer chemotherapy in teenagersand young adults: managing long term side effects. BMJ (Clinical research ed.) 354, 1–8,doi:10.1136/bmj.i4567 (2016).
27. Chang, K. T. & Min, K.-T. Regulation of lifespan by histone deacetylase. Ageing Res Rev 1, 313–326(2002).

Page 20/34
2�. Iljas, J. D., Wei, Z. & Homer, H. A. Sirt1 sustains female fertility by slowing age-related decline inoocyte quality required for post‐fertilization embryo development. Aging Cell 19,doi:10.1111/acel.13204 (2020).
29. Ruan, Y. et al. SIRT1 suppresses doxorubicin-induced cardiotoxicity by regulating the oxidative stressand p38MAPK pathways. Cell Physiol Biochem 35, 1116–1124, doi:10.1159/000373937 (2015).
30. Zhou, F., Shi, L.-B. & Zhang, S.-Y. Ovarian Fibrosis: A Phenomenon of Concern. Chinese medicaljournal 130, 365–371, doi:10.4103/0366-6999.198931 (2017).
31. Kano, M. et al. AMH/MIS as a contraceptive that protects the ovarian reserve during chemotherapy.Proc Natl Acad Sci U S A 114, E1688-E1697, doi:10.1073/pnas.1620729114 (2017).
32. Ikawa, M. et al. Restoration of spermatogenesis by lentiviral gene transfer: offspring from infertilemice. Proc Natl Acad Sci U S A 99, 7524–7529 (2002).
33. Kanatsu-Shinohara, M. et al. Adenovirus-mediated gene delivery and in vitro microinseminationproduce offspring from infertile male mice. Proc Natl Acad Sci U S A 99, 1383–1388 (2002).
34. Gordon, J. W. Direct exposure of mouse ovaries and oocytes to high doses of an adenovirus genetherapy vector fails to lead to germ cell transduction. Molecular therapy 3, 557–564,doi:10.1006/mthe.2001.0290 (2001).
35. Cao, Y. et al. SIRT1 and insulin resistance. J Diabetes Complications 30, 178–183,doi:10.1016/j.jdiacomp.2015.08.022 (2016).
3�. Wang, R.-H. et al. Hepatic Sirt1 de�ciency in mice impairs mTorc2/Akt signaling and results inhyperglycemia, oxidative damage, and insulin resistance. The Journal of clinical investigation 121,4477–4490, doi:10.1172/JCI46243 (2011).
37. Kolodziejczyk, J., Gertler, A., Leibovich, H., Rzasa, J. & Gregoraszczuk, E. L. Synergistic action ofgrowth hormone and insulin-like growth factor I (IGF-I) on proliferation and estradiol secretion inporcine granulosa and theca cells cultured alone or in coculture. Theriogenology 60, 559–570(2003).
3�. Peluso, J. J., Delidow, B. C., Lynch, J. & White, B. A. Follicle-stimulating hormone and insulinregulation of 17 beta-estradiol secretion and granulosa cell proliferation within immature rat ovariesmaintained in perifusion culture. Endocrinology 128, 191–196 (1991).
39. Poretsky, L., Cataldo, N. A., Rosenwaks, Z. & Giudice, L. C. The insulin-related ovarian regulatorysystem in health and disease. Endocr Rev 20, 535–582 (1999).
40. Byers, S. L., Wiles, M. V., Dunn, S. L. & Taft, R. A. Mouse Estrous Cycle Identi�cation Tool and Images.PLOS ONE 7, e35538, doi:10.1371/journal.pone.0035538 (2012).
41. Sonigo, C. et al. High-throughput ovarian follicle counting by an innovative deep learning approach.Scienti�c Reports 8, 13499, doi:10.1038/s41598-018-31883-8 (2018).
42. Au - Komatsu, K., Au - Iwase, A., Au - Murase, T. & Au - Masubuchi, S. Ovarian Tissue Culture toVisualize Phenomena in Mouse Ovary. JoVE, e57794, doi:doi:10.3791/57794 (2018).

Page 21/34
43. Love, M. I., Huber, W. & Anders, S. Moderated estimation of fold change and dispersion for RNA-seqdata with DESeq2. Genome Biol 15, 550 (2014).
44. Gene Ontology Consortium: going forward. Nucleic Acids Res 43, D1049-D1056,doi:10.1093/nar/gku1179 (2015).
45. Kanehisa, M. et al. KEGG for linking genomes to life and the environment. Nucleic Acids Res 36,D480-D484, doi:10.1093/nar/gkm882 (2008).
4�. Ritchie, M. E. et al. limma powers differential expression analyses for RNA-sequencing andmicroarray studies. Nucleic Acids Res 43, e47-e47, doi:10.1093/nar/gkv007 (2015).
47. von Mering, C. et al. STRING: a database of predicted functional associations between proteins.Nucleic Acids Res 31, 258–261 (2003).
4�. Shannon, P. et al. Cytoscape: a software environment for integrated models of biomolecularinteraction networks. Genome Res 13, 2498–2504 (2003).
49. Scardoni, G., Petterlini, M. & Laudanna, C. Analyzing biological network parameters with CentiScaPe.Bioinformatics 25, 2857–2859, doi:10.1093/bioinformatics/btp517 (2009).
50. Bader, G. D. & Hogue, C. W. V. An automated method for �nding molecular complexes in large proteininteraction networks. BMC Bioinformatics 4, 1–27 (2003).
DeclarationsAcknowledgments
Funding:
National Natural Science Foundation of China 81873824 (SW)
National Natural Science Foundation of China 82001498 (JZ)
National Natural Science Foundation of China 82002768 (PC)
Clinical Research Pilot Project of Tongji hospital, Huazhong University of Science and Technology2019CR205 (SW)
Author contributions:
Conceptualization: JZ, SW
Methodology: JZ, SW
Investigation: LM, HL, YF
Visualization: LM, HL, YF
Supervision: YL, SZ, MW, PC

Page 22/34
Writing—original draft: LM, HL
Writing—review & editing: YL, SZ, MW, JZ, SW
All authors have read and approved the �nal manuscript.
Competing interests: Authors declare that they have no competing interests.
Materials & Correspondence: Corresponding authors’ Email:
[email protected] (S. W.);
[email protected] (J. Z.)
Figures

Page 23/34
Figure 1
Doxorubicin impairs ovarian function and reserve. a Schematic diagram of the animal experiment designto detect the effect of doxorubicin (Dox) on ovarian endocrine function and ovarian reserve. NS, normalsaline. b The representative estrous cycle monitoring of Blank and Dox group mice and the proportion ofregular or irregular estrous cycle of Blank and Dox group mice. Levels of serum estrogen (c), progesterone(d), FSH (e) and AMH (f) in control mice and mice with Dox treatment. g Hematoxylin-eosin (HE) stained

Page 24/34
sections of con and Dox-treated mice ovaries. Follicle counting (h) and follicle proportion (i) results basedon H&E-stained ovarian serial sections. j Sirius red stained sections of con and Dox-treated mice ovariesand the statistical analysis on the right. k Masson’s trichrome (MT) staining of con and Dox-treated miceovaries. MT stained collagen content area proportion on the right. PMF: primordial follicles, PF: primaryfollicles, SF: secondary follicles, ANF: antral follicle, THF: total healthy follicle, ATF: atretic follicle. * P <0.05, ** P < 0.01, *** P < 0.001.
Figure 2

Page 25/34
Identi�cation of Sirt1 and Tgfbr2 as two genes dramatically changes in Dox-treated ovaries throughscreening and validation. a Volcano plot of blank and Dox-treated groups. GO enrichment analysis ofDEG of upregulated (b) and down-regulated (c) DEGs in Dox-induced ovarian damage. d The mRNA levelchanges of related genes in the ovaries by qPCR of Blank and Dox groups of mice. The gradient colorfrom blue to red indicates the change in expression value from low to high. e Western Blot detects thechanges in the expression of Tgfbr2 and Sirt1 in the ovaries of Blank and Dox groups of mice, and therelative protein expression of Sirt1 and Tgfbr2. f IHC detection of Sirt1 and Tgfbr2 protein expression inthe ovaries of the Blank and Dox groups. Typical images on the left, relative expression level analysis ofSirt1 and Tgfbr2 on the right. g The change in the mRNA level in SIRT1 and TGFBR2 in human ovariantissues cultured in vitro. h The change in protein level in SIRT1 and TGFBR2 in human ovarian tissues byWB in Blank and Dox groups. i Representative images of IHC detection of SIRT1 and TGFBR2 expressionin human ovarian tissues in Blank and Dox group on the left. The relative expression level analysis ofSIRT and TGFBR2 on the right. * P < 0.05, ** P < 0.01, *** P < 0.001, ****P < 0.0001.
Page 26/34
Figure 3
The comparison of AdV, AAV9 and LV empty vectors in their ability to infect ovaries in vitro. a Typical�uorescence images of the ovaries cultured in medium containing AdV-GFP (108), AAV9-GFP (108) andLV-GFP (104) from 12h to 48h. b Typical �uorescence image of the ovarian cultured in mediumcontaining different titers of AdV-GFP (108, 109 and 1010). c Auto �uorescence (GFP) andimmuno�uorescence staining with Ddx4 (RFP) after frozen section. d Auto �uorescence (GFP) and

Page 27/34
immuno�uorescence staining with Cyp17a1 (RFP) in ovarian cells containing AdV-GFP (109). e Bright,GFP and merged �eld of view of ovarian cells cultured in a medium containing 109 titers of AdV-GFP(109) vector for 24h. f The relative �uorescence density analysis of AdV-GFP over time. g The relative�uorescence density analysis of different titers of AdV-GFP. h GFP-positive cell percentage of stromalcells and oocytes. * P < 0.05, ** P < 0.01, *** P < 0.001, ****P < 0.0001.
Figure 4

Page 28/34
Ovarian in situ injection of AdV-Sirt1 and AdV-Tgfbr2 does not affect blood biochemistry and ovarianfunction of mice. a Schematic diagram of AdV-GFP, AdV-Sirt1 and AdV-Tgfbr2. b Schematic diagram ofthe animal experiment design to assess the safety of ovarian gene therapy. Serum biochemical pro�les ateach time in each group: ALT (c), AST (d), CK (e), BUN (f), CREA (g), TNF-α (h). i Typical line charts ofestrous cycle changes in each group. j The proportion of regular and irregular estrous cycle. P: proestrusstage, E: estrus stage, M: metestrus stage; D: diestrus stage. * P < 0.05, ** P < 0.01, *** P < 0.001, ****P <0.0001.

Page 29/34
Figure 5
Expression of Sirt1 and Tgfbr2 in ovaries after AdV in situ injeciton. a The mRNA expression level of Sirt1in AdV-GFP group and AdV-Sirt1 group from 2w to 8w over time. b The mRNA expression level of Tgfbr2in AdV-GFP group and AdV-Tgfbr2 group from 2w to 8w over time. c The protein expression level of Sirt1in AdV-GFP group and AdV-Sirt1 group from 2w to 8w over time. d The protein expression level of Tgfbr2in AdV-GFP and AdV-Tgfbr2 group from 2w to 8w over time. e The relative protein expression analysis ofSirt1. f The relative protein expression level of Tgfbr2. g Representative images of IHC detection of GFPexpression in AdV-GFP group and PBS group over time. h Representative images of the expression ofGFP in AdV-GFP group of by detection of frozen sections. * P < 0.05, ** P < 0.01, *** P < 0.001, ****P <0.0001.

Page 30/34
Figure 6
AdV-Sirt1 and AdV-Tgfbr2 alleviate Dox-induced ovarian damage. a Schematic diagram of the animalexperiment design to explore the preventive and therapeutic effects of ovarian gene therapy on ovariandamage caused by Dox. b The survival percentage of NS group, Dox group, S+Dox group, T+Dox groupand ST+Dox group. c The ratio of regular and irregular estrous cycle of each group. d The estrogen levelof mice in each group. e The progesterone level of mice in each group. f The FSH level of mice in each

Page 31/34
group. g The AMH level of mice in each group. h Representative images of H&E stained sections of miceovaries. Changes in ovarian weight (i) and ovary index (j) of each group. (k) Ovarian follicle numberbased on ovarian sections in each group. * P < 0.05, ** P < 0.01, *** P < 0.001, ****P < 0.0001. P:proestrus stage, E: estrus stage, M: metestrus stage; D: diestrus stage.
Figure 7

Page 32/34
Effects of AdV-Sirt1 and AdV-Tgfbr2 on the reproductive function of ovaries upon Dox-induced damage. aThe pregnancy ratio of each group. b The average litter size of postpartum female mice of each group. cThe average litter size of all mated female mice of each group. d Typical images of postpartum femalemice and their offspring in each group. e There is no vertical transmission of AdV in the offspring. Theexpression of Gapdh on the top. The expression of AdV5-E4 gene on the bottom. NC: Negative control,PC: positive control. f Typical H&E stained images of postnatal day (PND) 3 and PND7 in each group.Follicle counts of PND3 (g) and PND7 (h) ovaries. PMF: primordial follicles, PF: primary follicles, SF:secondary follicles, THF: total healthy follicles.

Page 33/34
Figure 8
The comparison of gene expression pro�ling in ovaries between the Dox and ST+Dox groups. a Box plotbefore data normalization. b Box plot after data normalization. (Each box plot corresponds to 5 statistics:from top to bottom are the maximum value, the upper quartile, the median, lower quartile and theminimum value). c The principal component analysis plot of Dox and ST+Dox. d Correlation analysis ofeach group of the ovarian samples, the color of the number corresponds to the legend rule on the right. e

Page 34/34
Heatmap visualization of the DEGs in Dox and ST+Dox ovarian tissues. The gradual process of colorfrom red to blue indicates the change of expression value from high to low. f Volcano map shows theDEGs in the ovarian tissues of Dox and ST+Dox group. Red: signi�cantly up-regulated genes, blue:signi�cantly down-regulated genes, grey: non-signi�cantly different genes. g GO functional enrichment ofDEGs. h GSEA results of GO terms. (i) GSEA results of KEGG pathway enrichment.
Supplementary Files
This is a list of supplementary �les associated with this preprint. Click to download.
SupplementaryMaterials.docx