tgf-beta impairs alveolar protein clearance through
TRANSCRIPT

TGF-β impairs alveolar protein clearance through downregulation of the
endocytic receptor megalin in alveolar epithelial cells
Inaugural Dissertation
submitted to the
Faculty of Medicine
in partial fulfillment of the requirements
for the PhD-Degree
of the Faculties of Veterinary Medicine and Medicine
of the Justus Liebig University Giessen
by
Mazzocchi, Luciana Carla
of
Buenos Aires, Argentina
Giessen 2016

From the Institute of Internal Medicine II
Director / Chairman: Prof. Dr. Werner Seeger
of the Faculty of Medicine of the Justus Liebig University Giessen
First Supervisor and Committee Member: Prof. Dr. Werner Seeger
Second Supervisor and Committee Member: Prof. Dr. Martin Diener
Committee Members:
Date of Doctoral Defense:

Declaration
I declare that I have completed this dissertation single-handedly without the unauthorized help
of a second party and only with the assistance acknowledged therein. I have appropriately
acknowledged and referenced all text passages that are derived literally from or are based on
the content of published or unpublished work of others, and all information that relates to
verbal communications. I have abided by the principles of good scientific conduct laid down
in the charter of the Justus Liebig University of Giessen in carrying out the investigations
described in the dissertation.
Mazzocchi, Luciana Carla
Giessen

Index
Index
List of abbreviations ................................................................................................................................ 1
Summary ................................................................................................................................................. 4
Zusammenfassung ................................................................................................................................... 5
1. Introduction ..................................................................................................................................... 6
1.1. Acute respiratory distress syndrome ........................................................................................ 6
1.2. Physiology and function of the alveolar-capillary barrier ....................................................... 8
1.3. Pathophysiology of ARDS ....................................................................................................... 8
1.4. Clinical relevance of alveolar protein clearance .................................................................... 11
1.5. Transforming growth factor-β ................................................................................................ 11
1.6. Role of TGF-β in ARDS ........................................................................................................ 13
1.7. Low-density lipoprotein receptor family ............................................................................... 13
1.8. LDL-receptor related protein-2 .............................................................................................. 15
1.9. Megalin regulation ................................................................................................................. 17
1.9.1. mRNA levels and protein expression .......................................................................... 17
1.9.2. Subcellular localization ............................................................................................... 17
1.9.3. Megalin Notch-like processing, shedding and RIP, intracellular signaling ................. 19
1.10. Ubiquitin-proteasome degradation system ............................................................................. 20
1.11 Role of matrix-metalloproteases in ARDS ............................................................................ 23
1.12. Modulation of LRPs function by MMPs ............................................................................... 23
1.13. MMPs and TGF-β reciprocal regulation ................................................................................ 24
1.14. Regulation of MMPs by PKCs .............................................................................................. 24
1.15. TGF-β regulation of PKC and γ-secretase activity ................................................................ 25
1.16. Hypothesis ............................................................................................................................. 25
1.17. Aims ....................................................................................................................................... 26
2. Materials and methods ................................................................................................................... 27
2.1. Chemicals, reagents and methodologies ................................................................................ 27
2.1.1. General reagents .......................................................................................................... 27
2.1.2. Drugs ........................................................................................................................... 27
2.1.3. Antibodies .................................................................................................................... 27
2.1.4. Rat lung epithelial cell line .......................................................................................... 28
2.1.5. Rat primary alveolar epithelial cells ............................................................................ 28
2.1.6. Primary ATII cells isolation from rat lung .................................................................. 28
2.1.7. Cell culture .................................................................................................................. 29
2.1.8. Total protein quantification ......................................................................................... 30
2.1.9. SDS-PAGE and Western blotting ................................................................................ 30

Index
2.1.10. Coomassie brilliant blue staining ................................................................................. 31
2.1.11. Densitometry ............................................................................................................... 31
2.1.12. Plasmidic DNA amplification in E. coli ...................................................................... 31
2.1.13. Site-directed mutagenesis (SDM) ................................................................................ 32
2.1.14. Short scale plasmid isolation ....................................................................................... 34
2.1.15. Large scale plasmid isolation....................................................................................... 34
2.1.16. Total RNA isolation ..................................................................................................... 35
2.1.17. cDNA preparation (reverse transcription) ................................................................... 35
2.1.18. Real time polymerase chain reaction ........................................................................... 36
2.1.19. Specific mRNA knockdown (siRNA) ......................................................................... 37
2.1.20. RLE-6TN and rat primary ATII cells transfection ...................................................... 38
2.1.21. Cell surface proteins biotinylation ............................................................................... 39
2.1.22. Confocal microscopy ................................................................................................... 40
2.1.23. Complete subcellular fractionation .............................................................................. 41
2.1.24. Proteasome purification ............................................................................................... 43
2.1.25. Lysosome purification ................................................................................................. 44
2.1.26. Plasma membrane purification .................................................................................... 45
2.1.27. In silico analysis of megalin c-terminal tail ubiquitination ......................................... 45
2.1.28. Ubiquitinated proteins specific pulldown .................................................................... 45
2.1.29. Co-immunoprecipitation of proteins from enriched plasma membrane fraction ......... 46
2.1.30. Zymography................................................................................................................. 47
2.1.31. FITC-albumin binding and uptake ............................................................................... 47
2.2. Experimental settings ............................................................................................................. 48
2.2.1. TGF-β treatment .......................................................................................................... 48
2.2.2. Megalin turnover analysis............................................................................................ 49
2.2.3. Megalin turnover inhibition ......................................................................................... 50
2.2.4. PKC activity inhibition ................................................................................................ 50
2.2.5. γ-secretase activity inhibition ...................................................................................... 51
2.2.6. MCTF, MMP-2, -9 and -14 detection ......................................................................... 51
2.2.7. MMP-2 and MMP-9 specific ELISA .......................................................................... 51
2.2.8. Megalin ectodomain specific ELISA ........................................................................... 52
2.2.9. MICD treatment ........................................................................................................... 53
2.3. Statistical analysis .................................................................................................................. 54
3. Results ........................................................................................................................................... 55
3.1. Short term effect of TGF-β on megalin cell surface stability ................................................ 55
3.1.1. TGF-β reduces megalin cell surface abundance .......................................................... 55
3.1.2. TGF-β promotes megalin degradation in a proteasome-dependent manner ................ 59

Index
3.1.3. TGF-β enhances megalin c-terminal tail ubiquitination .............................................. 63
3.2. Long term effect of TGF-β on megalin downregulation: shedding and intracellular
proteolysis ......................................................................................................................................... 69
3.2.1. TGF-β reduces megalin gene expression by increasing the release of megalin
intracellular domain ....................................................................................................................... 69
3.2.2. TGF-β-induced megalin downregulation requires PKC and γ-secretase activity ........ 76
3.2.3. Megalin shedding is enhanced in the presence of TGF-β ............................................ 81
3.2.4. TGF-β regulates MMPs expression, activity and subcellular localization .................. 81
3.2.5. Megalin downregulation induced by TGF-β is impaired by KD of MMPs ................. 86
4. Discussion ...................................................................................................................................... 89
4.1. TGF-β reduces megalin cell surface stability by promoting endocytosis and proteasomal
degradation of the receptor ................................................................................................................ 89
4.2. Megalin downregulation induced by TGF-β requires specific ubiquitination of the receptor c-
terminal tail ....................................................................................................................................... 91
4.3. Persistance of TGF-β stimulus reduces megalin gene expression by increasing the release of
megalin intracellular domain ............................................................................................................. 93
4.4. TGF-β-induced megalin shedding and RIP require PKC and γ-secretase activity ................ 94
4.5. MMPs expression, activity and localization are modulated by TGF-β .................................. 95
5. Concluding remarks ....................................................................................................................... 97
6. References ................................................................................................................................... 100
7. Acknowledgments ....................................................................................................................... 111

List of abbreviations
1
List of abbreviations
AKT Protein kinase B
ALI Acute lung injury
AMP Adenosin monophosphate
ANOVA Analysis of variance
ApoER-2 Apolipoprotein E receptor 2
ARDS Acute respiratory distress syndrome
ATCC American type culture collection
ATI Alveolar type I cells
ATII Alveolar type II cells
ATP Adenosin triphosphate
BAL Bronchoalveolar lavage
BSA Bovine serum albumin
cDNA Copy desoxyribonucleic acid
CE Compound E
CE Crude endosomes
CFTR Cystic fibrosis transmembrane conductance regulator
CKII Casein kinase II
Cl- Chloride
ClC5 Chloride channel 5
CO2 Carbon dioxide
CPAP Continuous positive airway pressure
DAB-2 Disabled 2
DAPI 4',6-diamidino-2-phenylindole
DBP Vitamin D binding protein
DMEM Dulbeco´s modified eagle medium
DMSO Dimethilsulfoxyde
DNA Desoxyribonucleic acid
DNAase Desoxyribonucleic acid nulcease
DPBS-G Dulbeco´s modified eagle medium-glucose
DTT Dithiothreitol
E1 Ubiquitin-activating enzyme
E2 Ubiquitin-conjugating enzyme
E3 Ubiquitin-ligase enzyme
ECCO2-R Extracorporeal carbon dioxide removal
ECM Extracellular matrix
ECMO Extracorporeal membrane oxygenation
EDTA Ethylenediaminetetraacetic acid
EGF Epidermal rowth factor
EGTA Ethylene glycol-bis(β-aminoethyl ether)-N,N,N',N'-tetraacetic acid
ELF Epithelial lining fluid
ELISA Enzyme-linked immunosorbent assay
ENaC Epithelial sodium channel
ERK Extracellular signal–regulated kinase
FAC Focal adhesion complexes
FBS Fetal bovine serum

List of abbreviations
2
FiO2 Fraction of inspired oxygen
GFP Green fluorescent protein
GSK3-β Glycogen synthase kinase-3
HB Homogenization buffer
HRP Horseradish peroxidase
HS High sucrose
IF Immunofluorescence
IP Immuniprecipitation
I-smad Inhibitory Smad
JNK c-Jun N-terminal kinase
kDa Kilo dalton
LAP Latency-associated peptide
LB Lysis buffer
LDL Low-density lipoprotein
LRP LDL-receptor related protein
LS Low sucrose
LTBP Latent TGF-beta binding protein
MAP Mitogen-activated protein
MCTF Megalin c-terminal fragment
ME Microsome extraction
MegBP Megalin binding protein
MEK Mitogen-activated protein kinase kinase
MICD Megalin intracellular domain
MMP Matrix-metalloproteases
mRIPA Modified ripa buffer
MSOD Multiple system organ dysfunction
MT-MMPs Membrane type-matrix-metalloproteases
N Nucleus
NE Nuclear extraction
NEM n-methylmaleimide
NETs Neutrophil extracellular traps
NO Nitric oxide
PAF Platelet-activating factor
PaO2 Partial pressure of arterial oxygen
PBS Phosphate buffer saline
PCR Polimerase chain reaction
PDZ Post-synaptic density protein 95 and zona occludens 1
PEEP Positive end-expiratory pressure
PI3K Phosphoinositide 3-kinase
PKA Portein kinase A
PKC Portein kinase C
PM Plasma membrane
PMSF Phenylmethane sulfonyl fluoride
PPA-1 Protein phosphatase A-1
PPAR Peroxisome proliferator-activated receptor
PPi Pyrophosphate
RAP Receptor-associated protein

List of abbreviations
3
Ras Rat sarcoma
RHO-A Ras homolog family member A
RIP Regulated intramembrane proteolysis
RLE-6TN Rat lung epithelial cells antigen T negative
RNA Ribonucleic acid
R-Smad Receptor associated Smad
SDM Site-directed mutagenesis
SDS-PAGE Sodium dodecilsulfate-polyaclylamide gel electrophoresis
SEM Standard error of the mean
SH3 SRC homology 3 Domain
SHH Sonic hedgehog
siRNA Small interferent RNA
SNs Supernatants
TGF-β Transforming growth factor-β
TβRI/II TGF-β receptor I and II
TRAIL TNF-related apoptosis-inducing ligand
Tsp-1 Trombospondin-1
T-TBS Tween-tris buffer saline
VILI Ventilated induced lung injury
VLDL-receptor Very low-density lipoprotein-receptor
WB Western blot
WH Whole homogenate
WNT Wingless-related integration site

Summary
4
Summary
The acute respiratory distress syndrome (ARDS) is a severe clinical condition characterized
by impaired gas exchange due to inflammation and disruption of the alveolar-capillary
barrier, which leads to accumulation of protein-rich edema into the alveolar space
exacerbating the damage and reducing survival. The ability to remove excess proteins from
the distal airways has been associated with positive prognosis; however, there are no effective
pharmacological approaches able to facilitate alveolar protein clearance. For this reason,
further research is necessary in order to shed light on the molecular mechanisms responsible
of regulating the pathogenesis and resolution of ARDS.
Here we provide evidence that transforming growth factor-β (TGF-β), a key regulator of the
pathogenesis of ARDS, significantly impairs alveolar protein clearance by downregulation of
the endocytic receptor megalin in alveolar epithelial cells. Megalin function was found to be
critical for maintenance of homeostasis in many organs where negative effects of TGF-β on
megalin function have been described. However, the exact mechanisms underlying TGF-β-
dependent megalin downregulation remain unclear. Our data suggest that TGF-β induces
rapid megalin endocytosis and subsequently promotes its degradation in an ubiquitin-
proteasome-dependent manner. Furthermore, prolonged exposition to this cytokine promotes
megalin ectodomain shedding and intramembrane proteolysis of the remaining fragment,
resulting in the release of a soluble variant of megalin c-terminal tail that translocates into the
nucleus and regulates gene expression, including repression of its own mRNA transcription.
We also demonstrate that TGF-β-induced megalin shedding and regulated intramembrane
proteolysis requires protein kinase C and γ-secretase activities; as well as regulation of the
expression, activity and localization of matrix-metalloproteases (MMPs)-2, -9 and -14.
Remarkably, we propose for the first time MMP-2 and MMP-14 as novel sheddases of
megalin.
Short- and long-term effects of TGF-β on megalin downregulation significantly contribute to
the impairment of alveolar protein clearance, which impairs the healing of the alveolar-
capillary barrier and restoration of proper lung function. Understanding how to interfere with
the molecular mechanisms underlying TGF-β-induced megalin downregulation may, thus,
hold a therapeutic promise.

Zusammenfassung
5
Zusammenfassung
Das akute Atemnotsyndrom (ARDS) ist eine schwerwiegende klinische Erkrankung und wird
durch einen beeinträchtigten Gasaustausch charakterisiert. Diese Beeinträchtigung entsteht
durch eine Entzündung und Störung der alveolar-kapillaren Barriere, welches zu einer
Ansammlung eines proteinreichen Ödems in den Alveolen führt, was somit die Beschädigung
am Gewebe exazerbiert und die Überlebenschance des Patienten reduziert. Die Fähigkeit
überschüssige Proteine aus dem distalen Luftraum zu beseitigen wurde zwar mit einer
positiven Prognose assoziiert, dennoch gibt es weiterhin keine pharmakologischen Ansätze,
die eine Clearance der Proteine aus den Alveolen beschleunigt. Aus diesem Grund sind
weitere Studien im Hinblick auf die molekularen Mechanismen, die für die Regulation der
Pathogenese und der Lösung des akuten Atemnotsyndroms, dringend notwendig.
Wir weisen nach, dass der transformierende Wachstumsfaktor – ß (TGF-ß) - welcher eine
Schlüsselrolle in der Pathogenese des ARDS spielt – signifikant die Clearance der Proteine
durch das Herunterregulieren des endozytischen Rezeptor Megalin in den alveolären
Epithelzellen beeinträchtigt. Es wurde bereits beschrieben, dass Megalin eine entscheidende
Rolle in der Aufrechterhaltung der Homöostase vieler Organe hat, in denen TGF-ß negativ
darauf einwirkte. Jedoch bleibt der zugrundeliegende Mechanismus der Herunteregulierung
des TGF-ß abhängigen Megalin unklar. Unsere Forschungsergebnisse deuten darauf hin, dass
TGF-ß eine beschleunigte Endozytose des Megalin induziert und infolgedessen wird es durch
das Ubiquitin-Proteasome-System in eine Degradierung befördert. Außerdem begünstigt eine
verlängerte Exposition des Zytokins eine Abspaltung der Megalinektodomäne und eine
intramembrane Proteolyse der verbleibenden Fragmente. Daraus resultiert die Freisetzung
einer löslichen Variante des c-terminalen Megalinendes, welches dann in den Nukleus
eindringt, somit die Genexpression reguliert und zusätzlich seine eigene mRNA Transkription
hemmt. Ebenfalls konnten wir darlegen, dass die TGF-ß induzierte Megalin Abspaltung und
die regulierte intramembrane Proteolyse das Protein Kinase C, die Aktivität der γ-Sekretase,
und die Regulation der Expression, Aktivität sowie Lokalisation der Matrix-Metalloprotease
(MMPs) -2, -9 und 14 benötigt. Wir haben somit MMP-2 und MMP-14 als Sheddasen von
Megalin identifiziert.
Kurz- und Langzeiteffekte des TGF-ß auf die Herunterregulierung des Megalins trägt
signifikant zu einer Minderung des alveolären Proteinabtransportes bei, was die Heilung und
Wiederherstellung einer normalen Lungenfunktion verhindert. Somit könnte die Interferenz
mit den molekularen Mechanismen, die der TGF-ß induzierten Megalin Herunterregulation
zugrunde liegen, einen therapeutischen Ansatz aufweisen.
Introduction
6
1. Introduction
1.1. Acute respiratory distress syndrome
Acute respiratory distress syndrome or ARDS was first described almost 50 years ago during
the Vietnam War [1]. This severe clinical condition is caused by an insult to the alveolar-
capillary barrier that results in an increased lung vascular permeability and a subsequent
protein-rich edema formation that impair alveolar gas exchange [2], [3], [4]. The pathogenesis
of ARDS include two different mechanisms of damage: 1) direct, including bacterial and viral
pneumonia, gastric acid aspiration, direct trauma to the lung parenchyma, and 2) indirect,
extrathoracic sepsis, trauma, shock, burn injury, transfusions, among others [4], [5], [6].
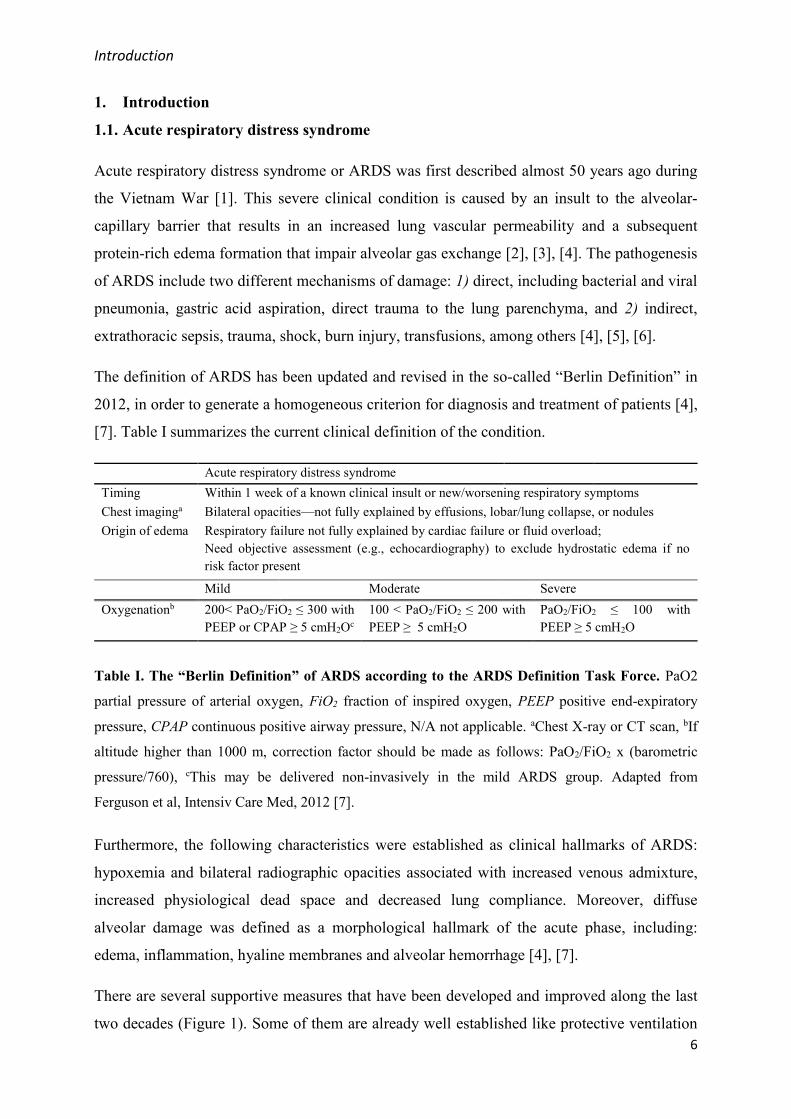
The definition of ARDS has been updated and revised in the so-called “Berlin Definition” in
2012, in order to generate a homogeneous criterion for diagnosis and treatment of patients [4],
[7]. Table I summarizes the current clinical definition of the condition.
Acute respiratory distress syndrome
Timing Within 1 week of a known clinical insult or new/worsening respiratory symptoms
Chest imaginga Bilateral opacities—not fully explained by effusions, lobar/lung collapse, or nodules
Origin of edema Respiratory failure not fully explained by cardiac failure or fluid overload;
Need objective assessment (e.g., echocardiography) to exclude hydrostatic edema if no
risk factor present
Mild Moderate Severe
Oxygenationb
200< PaO2/FiO2 ≤ 300 with
PEEP or CPAP ≥ 5 cmH2Oc
100 < PaO2/FiO2 ≤ 200 with
PEEP ≥ 5 cmH2O
PaO2/FiO2 ≤ 100 with
PEEP ≥ 5 cmH2O
Table I. The “Berlin Definition” of ARDS according to the ARDS Definition Task Force. PaO2
partial pressure of arterial oxygen, FiO2 fraction of inspired oxygen, PEEP positive end-expiratory
pressure, CPAP continuous positive airway pressure, N/A not applicable. aChest X-ray or CT scan, bIf
altitude higher than 1000 m, correction factor should be made as follows: PaO2/FiO2 x (barometric
pressure/760), cThis may be delivered non-invasively in the mild ARDS group. Adapted from
Ferguson et al, Intensiv Care Med, 2012 [7].
Furthermore, the following characteristics were established as clinical hallmarks of ARDS:
hypoxemia and bilateral radiographic opacities associated with increased venous admixture,
increased physiological dead space and decreased lung compliance. Moreover, diffuse
alveolar damage was defined as a morphological hallmark of the acute phase, including:
edema, inflammation, hyaline membranes and alveolar hemorrhage [4], [7].
There are several supportive measures that have been developed and improved along the last
two decades (Figure 1). Some of them are already well established like protective ventilation

Introduction
7
with low tidal volumes of oxygen, low to moderate positive end-expiratory pressure (PEEP) in
mild to moderate ARDS and higher PEEP levels at the severe phase, as well as to rotate the
patient to a prone position for better oxygenation. Others, like noninvasive ventilation in mild
ARDS, and neuromuscular blockade, extracorporeal carbon dioxide removal (ECCO2-R) and
extracorporeal membrane oxygenation (ECMO) in moderate to severe ARDS are often
applied but still need to be confirmed in prospective clinical trials [7]–[9]. Although these
supportive measures improved patients survival, no pharmacological therapy is available and
the current mortality of patients with ARDS remains approximately 30% [6]. There are
several factors that worsen the outcome of patients with ARDS, including age, underlying
medical condition and the severity of lung damage; however, predisposition to develop
multiple system organ dysfunction (MSOD) and ongoing sepsis are the most critical ones
[10]. Experimental and clinical evidence suggest that development of MSOD is due to
alveolar-capillary barrier disruption and the migration of cytokines produced in the lung into
the systemic circulation [11]. Thus, how to promote or facilitate healing of the alveolar-
capillary barrier to avoid systemic inflammation and sepsis should be elucidated in order to
significantly reduce mortality of patients with ARDS.
Figure 1. Aligning therapeutic option with the Berlin Definition Schematic representation of
potential treatments according to the severity of ARDS. The yellow boxes refer to therapeutic options
that still require confirmation in prospective clinical trials. Adapted from Ferguson et al, Intensive
Care Med, 2012 [7].

Introduction
8
1.2. Physiology and function of the alveolar-capillary barrier
Gas exchange takes place in the last seven generations of branching of the respiratory tract
that include respiratory bronchioles, alveolar ducts and alveolar sacs and alveoli [12].
Airways and alveoli are lined by a continuous epithelium that provides secretive and
absorptive functions. At the same time, it is a barrier for macromolecules but allows
bidirectional flux of water, small solutes and gases [13]–[15]. In the most distal airways, the
alveolar epithelium comprises two types of cells, thin squamous type I cells and cuboidal type
II cells [12]. Alveolar type I cells (ATI) cover the major part of the surface area of distal
airways and provide a pathway for diffusion of respiratory gases. On the other hand, ATII
cells produce and secrete surfactant proteins, and together with ATI cells, actively participate
in trans-epithelial transport of ions and proteins generating the driving force that allow fluid
clearance from the alveolar space (Reviewed in [16]). Other important structures for the
barrier function of the alveolar epithelium are the tight junctions. These cell-to-cell contact
areas are flexible and selectively control passive movement of fluid and solutes between
compartments. Thus tight junctions are critical in the maintenance of gradients created by
active transport across the epithelium [17].
As long as the integrity of the alveolar-capillary barrier is preserved, maintenance of optimal
fluid balance in the alveolar space mainly depends on vectorial transport of Na+ through the
alveolar epithelium to the interstitial space, creating a positive gradient for passive diffusion
of liquid (fluid clearance)(Reviewed in [18]). Additionally, many mechanisms have been
described for protein removal out of the distal airways in order to keep the oncotic pressure at
normal levels. However, several of these mechanisms, including mucociliary protein
clearance, protein endocytosis and degradation by macrophages and intra-alveolar
degradation of proteins have been shown in vivo to be too slow or inefficient for
physiologically relevant protein clearance at maximal rates of 1-2%/h [16], [19].
Nevertheless, a (patho)physiological relevance for another mechanism, the “receptor-
mediated endocytosis of alveolar proteins” has recently been suggested by our group [20] and
others [21], [22].
1.3. Pathophysiology of ARDS
After a direct or indirect insult to the lungs, the acute phase of ARDS in defined by a plethora
of events that strongly contribute to the alveolar-capillary barrier dysfunction (Figure 2).
Between them, hallmarks of the pathogenesis of ARDS are: 1) unbalanced inflammatory

Introduction
9
response, including dysregulated recruitment of leukocytes and exaggerated activation of
these cells, inappropriate production of cytokines, lipid mediators or reactive oxygen species,
enhanced activation of death receptor signaling, uncontrolled activity of platelets or the
coagulation cascades; 2) severe hypoxemia, which downregulates the expression of ion
transporters in alveolar epithelial cells and impairs tight junctions formation and stability; 3)
increase of reactive nitrogen species that leads to endothelial barrier hyperpermeability; 4)
activation of the ubiquitin-proteasome system, responsible of degrading surfactant proteins,
Na+ transporters and proteins from the tight junctions (Reviewed in [3], [23], [24]). The
combination of these events leads to the disruption of tight and adherens junctions, and
subsequent disassemble of the epithelial and endothelial barrier; loss of barrier integrity
together with degradation of Na+ transporters impair fluid clearance from the alveolar space,
contributing to protein-rich edema formation; variations in glycocalyx composition and
disruption of focal adhesion complexes (FAC) increase endothelial barrier permeability and
dysfunction; necrosis and apoptosis of ATI and ATII cells generate denuded areas in the
alveoli; extracellular matrix deposition and hyaline membranes formation promote the
thickening of the area of gas exchange (Figure 3) (Reviewed in [3], [24].
Disruption of the alveolar-capillary barrier integrity not only promotes leakage of protein-rich
edema fluid from the vasculature into the interstitial and alveolar space, but impairs the ability
of the epithelium to remove the excess liquid out of the distal airways [25].
Persistence of the injury promotes the development of severe ARDS, characterized by
multiple organ failure, pulmonary fibrosis and pulmonary vascular destruction [26]–[28]. In
case of healing, barrier repair and edema resolution occur. Although the exact molecular
mechanisms of resolution remain largely unknown; reduced inflammation, migration and
proliferation of ATII cells and restoration of the structure of the epithelium and the
endothelium may be required [29].

Introduction
10
Figure 2. Schematic representation of inflammatory and non-inflammatory events that mainly
contribute the pathophysiology of ARDS. TRAIL, tumor necrosis factor-related apoptosis-inducing
ligand; VILI, ventilator-induced lung injury; NETs, neutrophil extracellular traps; PAF, platelet-
activating factor; ATI and ATII, alveolar type I and II cells, respectively. Adapted from Herold et al,
Am J Physiol Lung Cell Mol Physiol, 2013 [24].
Figure 3. Schematic representation of impaired structures and functions in the alveolar-
capillary barrier during ARDS. FAC, focal adhesion complexes. Adapted from Herold et al, Am J
Physiol Lung Cell Mol Physiol, 2013 [24].

Introduction
11
1.4. Clinical relevance of alveolar protein clearance
Clearance of proteins and peptides from the lung distal air spaces is important because: 1)
transport across the alveolar epithelium is a venue for foreign antigens to enter the body, 2)
delivery of therapeutic peptides via the air space of the lungs would be interesting; 3) the
increase of protein amount in the interstitial and alveolar space due to damage to the alveolar-
capillary barrier enhances both oncotic pressure and inflammatory responses, impairing
healing of the barrier, edema resolution and restoration of lung function [16]. It has been
reported that in patients with ARDS the protein concentration in the alveolar edema is
comparable to that of plasma [30]. Interestingly, patients that survive this condition have 3-
times less protein concentration in the alveolar edema than non-survivors [25]. Thus, the
ability to remove excess protein from the alveolar space may be critical for a positive
prognosis.
1.5. Transforming growth factor-β
Transforming growth factor-β (TGF-β) comprises a family of polypeptides capable of
regulating a wide range of cellular processes including cell proliferation, lineage
determination, differentiation, motility, adhesion, and death. This molecule is released to the
extracellular space as a latent TGF-β complexed with latent TGF-β-binding proteins (LTBP)
and latency-associated peptide (LAP) that prevent binding to the receptors. Proteolytical
cleavage of LTPB/LAP by trombospondin-1 (Tsp-1), MMP-2 and -9, plasmin or ανβ6 integrin
associated to MMP-14 releases activated TGF-β [31], [32], [33]. The general mechanism by
which activated TGF-β exerts its function implyies binding of the peptide to TGF-β type II
receptor that then forms a heterodimeric complex with TGF-β type I receptor. Both receptor
have tyrosin kinase activity and phosphorylate the receptor asossiated Smads (R-Smad),
Smad-2 and -3, which bind to the common mediator Smad, Smad-4 and translocate into the
nucleus to regulate gene expression (Figure 4) [32], [34]. Activation of Smad-2 and -3 may
lead to regulation of different pathways, as well as the activation of other members of the
Smad transcriptional factors superfamily, that may act as inhibitors of the signaling pathway
(I-Smad 7) [35]–[38].
The most representative members of the TGF-β family are TGF-β1, -β2 and -β3. All of them
induce cell cycle arrest in epithelial and hematopoietic cells, control of mesenchymal cell
proliferation and differentiation, wound healing, extracellular matrix production and
immunosuppression [34].

Introduction
12
The TGF-β/Smad signaling pathway is tightly controlled by the ras/MEK/ERK mitogen-
activated protein (MAP) kinase cascade that phosphorylates and modifies Smads activity.
Activation of this cascade may enhance or suppress Smads-dependent responses by promoting
or preventing translocation of the Smad complexes into the nucleus and association to the
transcriptional regions, which depends on the cell type [32], [39].
Figure 4. The TGF-β/Smads pathway. Binding of a TGF-β family member to its type II receptor (1)
in concert with a type I receptor (2) leads to formation of a receptor complex (3) and phosphorylation
of the type I receptor (4). Thus activated, the type I receptor subsequently phosphorylates a receptor-
regulated SMAD (R-Smad) (5), allowing this protein to associate with Smad-4 (6) and move into the
nucleus (7). In the nucleus, the SMAD complex associates with a DNA-binding partner, such as Fast-1
(8), and this complex binds to specific enhancers in targets genes (9), activating transcription. Adapted
from Massagué, Annual review of Biochemistry, 1998 [34].
Other than the Smads-dependent pathway, TGF-β receptor also relay signals through a group
of additional signal-trasmitting proteins, such as PI3K/AKT, RHO-A and JNK/p38 MAP
kinase (Reviewed in [40]). Additionaly, cross-talk between TGF-β pathway and others like
WNT or SHH pathways regulate Smads activation and function, as well [40]. TGF-β
stimulation of human lung fibroblasts can activate the wingless-related integration site (WNT)
signaling cascade by inhibition of GSK3-β upon activation of MAPK pathway and ERK
phosphorylation. Moreover, GSK3-β can reciprocaly inhibit TGF-β pathway by induction of
Smad-3 phosphorylation and subsequent degradation by the ubiquitin-proteasome system
[40]–[42]. Interestingly and in an opposing manner, we have recently demonstrated that TGF-
β1 treatment of alveolar type II cells activates GSK3-β through induction of protein
phosphatase A-1 (PPA-1) phosphatase-dependent GSK3-β dephosphorylation (Vohwinkel et

Introduction
13
al,; manuscript in revision). Taken together, these findings suggest that there is a wide variety
of responses to TGF-β that mostly depend on the cell type and cross-talk with simultaneously
activated pathways.
1.6. Role of TGF-β in ARDS
TGF-β is a critical player in the pathogenesis of ARDS because 1) the alveolar-capillary
barrier integrity gets disrupted when TGF-β is activated by the protease-activated receptor-1
in combination with ανβ6 integrin, promoting alveolar flooding; 2) increased abundance of
TGF-β has been detected in the epithelial lining fluid (ELF) of patients with ARDS; 3) lower
levels of TGF-β in the ELF of these patients correlated with reduced exposition to ventilation
and to intensive care treatments; 4) it has been demonstrated that TGF-β downregulates gene
expression of α-ENaC and induces the internalization of the channel from lung epithelial
cells, regulates sodium pump gene expression and affects Cl- transport, thereby disturbing ion
and fluid transport across the barrier; 5) in animal models of ARDS, administration of soluble
TGF-β receptor II attenuated the degree of pulmonary edema by sequestering free activated
TGF-β; in contrast, application of clinically relevant doses of TGF-β rapidly blocked the
trans-epithelial ion fluxes necessary to promote alveolar fluid reabsorption [43]–[50].
Although the role of TGF-β in alveolar fluid clearance and barrier stability has been
extensively investigated, the relevance of this molecule in excess protein removal from the
distal airways in ARDS remains unknown.
Several studies focused on the role of TGF-β in glomerular and tubulointerstitial pathobiology
in chronic kidney diseases. There is evidence suggesting that TGF-β impairs albumin
reabsorption at the proximal tubules by downregulation of the endocytic receptor megalin,
thus promoting not only urinary excretion of plasma proteins but loss of vitamins, hormones
and amino acids that also bind to this receptor [51]–[53]. Furthermore, reduced albumin
endocytosis is associated with interstitial fibrosis and development of kidney diseases [54]. To
elucidate if a similar mechanism may be at play in alveolar protein clearance in lung
homeostasis and the resolution of ARDS is of high clinical relevance.
1.7. Low-density lipoprotein receptor family
The group of low-density lipoprotein receptors used to be viewed as the means by which cells
were supplied with lipids. Generally, cholesterol is taken up from the blood by endocytosis of
low-density lipoproteins (LDL) that bind specific LDL receptors. These receptors are located

Introduction
14
at the basolateral surface of the plasma membrane of the cells (except megalin) and cluster in
coated pits after binding the ligands. This step is followed by internalization and degradation
of the lipoproteins into the lysosomes, and release of lipids into the cytoplasm [55]. However,
novel functions of these receptors became evident after other members of the same family
than the LDL receptor were identified, and novel functions different from lipoprotein uptake
were defined. The newly identified members of this family were the LDL-receptor related
protein (LRP), megalin, the very-low-density lipoprotein (VLDL) receptor and the
apolipoprotein E receptor-2 (ApoER-2) (Figure 5).
Figure 5. LDL-receptor family. Members of the LDL receptor family share common structural
motifs, including a single membrane anchor, complement-type repeats (which make up the ligand-
binding domains) and epidermal growth factor (EGF) precursor homology domains (required for acid-
dependent release of ligands in endosomes). NPxY designates the four-amino-acid motif — Asn-Pro-
X-Tyr — that mediates clustering of the receptors into coated pits. O-linked sugar domains are found
in some, but not all, of the receptors. Adapted from Willnow et al, 1999, Nature Cell Biology [56].
These receptors are expressed in various tissues and are able to bind multiple unrelated
ligands, suggesting that their physiological role in not limited to the metabolism of lipids but
includes endocytosis of hormones, vitamins, proteases, proteases inhibitors, as well as
intracellular signaling [56], [57].

Introduction
15
1.8. LDL-receptor related protein-2
LRP-2 is a member of the sub-family of LDL-receptors, LDL-receptor related proteins (LRP),
also known as megalin (Figure 6). This protein was first discovered more than 30 years ago
by Farquhar and Kerjaschki, as responsible for the pathophysiology of Neymann nephritis in
the brush borders of renal proximal tubules [58], [59]. Megalin function was described in the
kidney where it mediates the reabsorption of almost all the proteins that are filtrated into the
urine. Thus, megalin serves as a multi-ligand clearance receptor and the basis for this resides
in the large extracellular domain. It consists of four clusters of ligand-binding, cysteine-rich
complement-type repeats. The clusters contain 7 to 11 complement-type repeats, each with
approximately 40 amino acids. The binding clusters are separated by YWTD and EGF repeats
which are involved in ligand release into the acidic environment of the lysosomes and
recycling of the receptor, respectively. Megalin has a single transmembrane domain of 23
amino acids and a cytoplasmic c-terminal tail of 209 amino acids, where modules that
regulate megalin trafficking and endocytosis are located (Figure 7) (Reviewed in [60]–[62]).
Figure 6. The LDL-receptor related protein (LRP) family of receptors. Receptors on the left are
considered to be core members of the protein family as their extracellular domains are built from a
unifying module of amino-terminal complement-type repeats, followed by a carboxyl-terminal cluster
of β-propellers and epidermal growth factor-type repeats. Receptors on the right are more distantly
related, as the module is inverted (LRP5/6) or combined with motifs that are not seen in the other
receptors (e.g. SORLA). Adapted from Willnow et al, Development, 2007 [63].

Introduction
16
Figure 7. The structure of megalin. The extracellular domain contains four cysteine-rich clusters of
low-density lipoprotein-receptor type A repeats (1–4), which constitute the ligand-binding regions,
and are separated and followed by 17 epidermal growth factor (EGF)-type repeats and eight spacer
regions that contain YWTD repeats. A single transmembrane domain (23 aa) is followed by the
cytoplasmic tail (209 aa), which contains two NPXY sequences and one ‘NPXY-like’ sequence in
addition to several Src-homology-3 (SH3) and one Src-homology-2 (SH2) recognition sites. Adapted
from Christensen et al, Nature reviews, 2002 [61].
Megalin is a 600 kDa transmembrane endocytic receptor that is expressed in the apical
surface of many absorptive epithelia like, small intestine, renal proximal tubule, the visceral
yolk sac and placental cytotrophoblast. Moreover, it is also found in other tissues: glomerular
podocytes, the choroid plexus, ependymal cells, the epididymis, alveolar type II cells,
parathyroid-hormone-secreting cells of the parathyroid gland, the endometrium (during
pregnancy at the time of implantation), oviduct, ciliary epithelium, strial marginal cells, and
epithelial cells of Reissner’s membrane in the inner ear and the thyroid. Among all these cell
types, megalin binds to more than 25 different ligands, ranging from vitamin carrier proteins,
lipoproteins and hormones, to enzymes, enzymes inhibitors and immune related molecules;
being albumin the most relevant for our studies, as it is the most abundant protein in plasma
(Reviewed in [60], [61], [64]). Thus, this endocytic receptor is responsible of maintaining
homeostasis in multiple organs and tissues by retrieval of vital molecules back to their proper
compartments.

Introduction
17
Interestingly, full knockout (KO) mice for megalin die perinatally of respiratory insufficiency,
characterized by over-bloated alveoli and collapsed and thickened alveolar walls that result in
impaired pulmonary inflation and expansion. Mice with heterozygous genotype that survive
present a holoprosencephalic phenotype, which is characterized by abnormal development of
the forebrain, absence of olfactory apparatus and abnormalities of facial structures [65]. Also,
these animals showed reduced formation of endocytic vesicles in the proximal tubules
epithelial cells and a distinct pattern of low-molecular-weight proteins in the urine content.
Disturbed calcium homeostasis was also shown by megalin KO mice, due to abnormal
vitamin D uptake in kidney [61], [65].
1.9. Megalin regulation
1.9.1. mRNA levels and protein expression
Few transcriptional factors, as Sp1 and IID, have been described to bind megalin promoter
and to regulate basal transcription of the gene [66], [67]. CpG islands methylation was also
correlated with lack of megalin in cell lines [68]. Additionally, treatment of cells with PPAR-
α and -γ agonists induce megalin mRNA and protein expression in mice and rats gallbladder
and kidney [69], [70].
Several of the molecules that regulate megalin expression are also ligands of this receptor and
their abundance is also regulated by megalin itself. This is the case for retinoic acid (vitamin
A) and vitamin D, which upregulate megalin mRNA expression [71]; as well as clusterin, the
antiapoptotic role of which is achieved by megalin-mediated activation of PI3K/ AKT
signaling pathways [72]. In contrast, angiotensin II impairs the expression of the receptor
[73]. It has been suggested that reduction of megalin abundance can be induced by toxic
levels of albumin and/ or TGF-β, however, the regulatory role of this cytokine on megalin
promoter through Smads-2 and -3 pathway remains unknown [51], [52], [70].
1.9.2. Subcellular localization
Beside the regulation of megalin mRNA levels, there are other mechanisms that also regulate
the receptor protein expression and trafficking. Megalin endocytosis, recycling and
degradation regulatory modules are located within the last 209 amino acids of its sequence
(Figure 8). The most relevant motifs required for ligand efficient internalization are two
NPxY sequences, which are well-known to serve as the sorting signal for endocytosis in
clathrin-coated pits. Interestingly, megalin contains a third NPxY-like domain that is
necessary for its apical sorting [74]. The c-terminal tail also contains a SH3 recognition region

Introduction
18
and a PDZ binding site that are implicated in megalin interaction with the cytoskeleton,
regulation of tyrosine kinases and others. Despite the presence of several consensus
phosphorylation sites for different protein kinases in megalin cytosolic tail, phosphorylation
of the PPPSP motif by GSK3-β is the most significant in terms of controlling recycling of
megalin [70], [75].
Figure 8. Characteristic features of megalin cytoplasmic tail. The 209 amino acid residues
cytoplasmic domain of megalin has several putative internalization motifs, including one dileucine and
three NPxY motifs. In addition, it contains two proline-rich sequences, one PDZ terminal motif,
several putative protein kinase C (PKC) and casein kinase II (CKII) phosphorylation motifs as well as
one protein kinase A (PKA) phosphorylation motif. Under basal conditions, these motifs contribute
little to the phosphorylation of the megalin cytoplasmic domain. However, within the distal, proline-
rich motif there is a PPPSP motif that is responsible for megalin phosphorylation by GSK3-β [75].
Adapted from Marzolo et al, Biological research, 2011 [70].
Proper folding of megalin requires the assistance of the chaperone receptor-associated protein
(RAP) that interacts with the ectodomain of the receptor in the lumen of the endoplasmic
reticulum; YWTD repeats flanked by EGF-like modules are necessary. This specific
interaction avoids premature binding of ligands to megalin and ensures delivery of megalin to
the plasma membrane [76]. Moreover, binding to cytosolic adaptor protein Dab-2, which has
affinity for the NPxY domain in megalin c-terminal tail, regulates apical localization of the
receptor, internalization of ligands and is involved in megalin trafficking; due to the fact that
it is associated with tyrosine kinases activation and cytoskeleton remodeling pathways [70],
[77]. There are several other cytosolic adaptors and scaffold proteins that also interact with

Introduction
19
megalin cytosolic domain and, not only regulate its trafficking and endocytosis, but may also
be implicated in ligand-driven intracellular signaling [77]–[79].
1.9.3. Megalin Notch-like processing, shedding and RIP, intracellular signaling
Regulated intramembrane proteolysis (RIP) represents an evolutionary conserved process that
connects receptor function with transcriptional regulation. Best characterized in Notch
signaling pathway, RIP consists of regulated shedding of the ectodomain by matrix
metalloproteases (MMP) followed by γ-secretase-mediated proteolysis of the resulting
membrane-associated fragment and release of the c-terminal, cytosolic domain [80]. There is
evidence suggesting that megalin is also subjected to RIP in proximal tubule epithelial cells
and in liver macrophages [81], [82], [83], [84]. In this case, MMP-dependent shedding of
megalin ectodomain is regulated by typical PKCs at the plasma membrane and the remaining
40-45 kDa megalin c-terminal fragment (MCTF) becomes substrate of γ-secretase activity,
which liberates megalin intracellular domain (MICD) into the cytoplasm and allows its
translocation to the nucleus (Figure 9). Despite the inability to detect endogenous MICD due
to fast degradation, overexpression of this fragment showed a marked reduction in megalin
and Na+/H+ exchanger 3 (NHE3) mRNA expression, indicating a regulatory role of
transcription [81].
Neither the identity of the MMPs responsible of megalin shedding nor the specific
mechanisms by which MICD induces transcriptional repression of certain genes have been yet
elucidated. Furthermore, other target genes of MICD or which kind of events may induce and
regulate megalin shedding remain unknown. However, it has been suggested that genes
involved in vitamin D metabolism could be regulated by megalin cytoplasmic domain, as
vitamin D binding protein (DBP) can activate RIP of megalin and as megalin binding protein
(MegBP) interacts with both MICD and SHI- interacting protein, which is a transcriptional
regulator and co-activator of vitamin D receptor [85], [86]. Thus, ligand-mediated RIP could
be an important mechanism of megalin regulation, which is probably also induced or
repressed by other ligands different from DBP. Interestingly, other studies have demonstrated
that ligand-independent megalin RIP could be also possible, as RIP of LRP-1 in response to
TNF-α was observed in lung fibroblasts [87].
Finally, as it was mentioned before, megalin together with other members of the LDL
receptor family mediate a variety of cellular processes through interaction with cytosolic
adaptors and scaffold proteins that bind to the PDZ domains in the cytoplasmic tail of the

Introduction
20
receptors. Such interactions allow signal transduction driven by ligands that modulate
organization of the cytoskeleton, cell adhesion, proliferation and death [77].
Figure 9. Megalin Notch-like signaling pathway. Metalloprotease (MMP) activity, activated by
ligand binding (1) and regulated by protein kinase C, results in ectodomain shedding (2) of megalin.
Ectodomain shedding produces an MCTF. The MCTF in turn becomes the substrate for γ-secretase
activity acting in the membrane and releasing the ‘free’ C-terminal intracellular domain (megalin
intracellular domain) into the cytosol (MICD) (3). The MICD translocates (4) to the nucleus where it
may act as a transcriptional regulator. Presenilin is the active component of the γ-secretase protein
complex and is specifically inhibited by Compound E. Adapted from Biemesderfer, Kidney
international, 2006 [82].
1.10. Ubiquitin-proteasome degradation system
The ubiquitin-proteasome system is utterly significant for degradation of misfolded, damaged
or dysfunctional proteins, as well as for protein turnover, in order to keep cell viability.
Furthermore, with or without degradation, the ubiquitin system is crucial in regulation of
multiple cellular signaling pathways [88].
The ubiquitin system is an enzymatic cascade that covalently conjugates ubiquitin subunits to
the protein substrate. This reaction occurs between the c-terminal glycine of 8,5 kDa ubiquitin
to the ε-amino group of the targeted proteins. Transference of ubiquitin requires its activation
by E1 ubiquitin-activating enzyme in an ATP-dependent manner. Ubiquitin is then bound to
the E2 ubiquitin-conjugating enzyme, which in turn will transfer ubiquitin onto the protein

Introduction
21
substrate in a reaction catalyzed by an E3 ubiquitin-ligase that specifically recognizes the
targeted proteins (Figure 10) [89], [90].
The specificity and diversity of the effects of ubiquitination is determined by 1) the
hierarchical cascade of ubiquitin conjugation; there are no more than two E1s, meanwhile,
around 100 of E2 and more than 1000 of E3 enzymes have been discovered; and by 2) the
variety of ubiquitin tags; single (monoubiquitination) or multiple lysin residues (multi-
monoubiquitination) can be linked to ubiquitin on the same protein substrate, also ubiquitin
itself can be attached to another ubiquitin subunits at any of the seven lysin residues of its
sequence (K6, K11, K27, K29, K33, K48, and K63), forming ramifications of ubiquitin
conjugated to the target protein (polyubiquitination) [91], [92], reviewed in [93]. Certain
polyubiquitination events provide a recognition motif for the 26S proteasome system (Figure
11).
The proteasome system is one of the proteolytical machineries for ubiquitinated proteins
degradation. The catalytic region is formed by β subunits flanked by gatekeeper α subunits,
composing the 20S proteasome. Two 19S subunits are located at both sides of the 20S and are
responsible of ubiquitinated proteins recognition and unfolding [88], [93], [94]. The
proteasome cleaves the tagged proteins into smaller peptides while ubiquitins are detached
and recycled [95]. Although polyubiquitin ramifications usually drive proteasomal
degradation, not all the ubiquitin tags exert the same function. Monoubiquitination (K63) of
proteins regulates their intracellular trafficking, such as endocytosis, sorting to endosomes and
Golgi-to-endosomes translocation. Single (K63) or oligo (K29) ubiquitin tags sort internalized
proteins to lysosomal degradation. Moreover, not only the number of ubiquitins but also the
way ubiquitins are bound to each other determine the proteins destination. For example, K48-
linked polyubiquitin ramifications generally target proteins for proteasomal degradation,
whereas K63-linked polyubiquitin ramifications modify the protein function but do not induce
its degradation [88], [90], [93], [96]. Finally, there is a novel E3 ligase named LUBAC able to
generate linear ubiquitination of certain proteins [97]. The physiological relevance of such a
pattern of ubiquitination is still not clear, however, some evidence suggests that it may be
implicated in inflammation and modulation of immune responses [98]–[100].

Introduction
22
Figure 10. The ubiquitin system. Protein ubiquitination consists of activation of 8.5 kDa ubiquitin
units by ATP-dependent binding to E1 ubiquitin-activating enzymes. Then the activation step is
followed by transfer of ubiquitin to an ubiquitin-protein carrier, E2 ubiquitin-conjugating enzyme. The
E2 enzyme and the protein substrate both bind specifically to an ubiquitin-protein ligase, E3, and the
activated ubiquitin is then transferred to the protein substrate. The pattern of ubiquitination will define
the protein final destination into the cell: proteasomal or lysosomal degradation, endocytosis or
trafficking. Adapted from Ciechanover, Nat Rev Mol Cell Biol, 2005 [90].
Figure 11. The proteasome system.
The 26S proteasome is the machinery
associated with degradation of
ubiquitinated proteins. It consists of two
19S subunits at either side of a single
20S subunit. The catalytic activity held
by the 19S allows ATP-dependent
unfolding of proteins to easily enter the
20S barrel, where the proteolytic activity
resides within the two β rings. The α
rings act as “gatekeepers” that maintain
the inner hole of the 20S opened.
Adapted from Herrmann et al,
Circulation research, 2007 [88].

Introduction
23
1.11 Role of matrix-metalloproteases in ARDS
Matrix-metalloproteases (MMPs) are zinc dependent endopeptidases able to degrade most of
the components of the extracellular matrix (ECM). This family of proteins comprises more
than 20 members that can be classified according to substrate specificity in gelatinases,
collagenases, stromelysins, matrilysins, membrane type (MT)-MMPs and elastases. Upon
release into the extracellular space as pro-enzymes proteolytic processing in needed for their
activation [101], [102]; except for MT-MMPs which are already active when anchored to the
plasma membrane [103]. These enzymes are synthetized by a variety of cells including
immune cells, alveolar fibroblasts, endothelial and alveolar epithelial cells [102], [104].
MMPs represent a group of enzymes that participate in tissue remodeling in many pathologies
like ARDS. During the acute phase of ARDS and reconstitution of the alveolar-capillary
barrier, MMPs play a critical role in remodeling the ECM allowing migration of alveolar
epithelial cells to denudated areas of the basal membrane and replacement of provisional
ECM by type IV collagen, laminin and nidogen [102]. However, excess levels of these
proteins are associated with ECM destruction, cellular disruption and enhanced inflammation
[105].
Gelatinases MMP-2 and -9 have been widely studied as higher levels of these enzymes have
been measured in the BAL of patients with ARDS [106]–[108]. Furthermore, progression of
fibrosis was associated with elevated levels as a consequence of chronic injury and persistent
lung inflammation.
1.12. Modulation of LRPs function by MMPs
Recent studies have shown that secreted MMPs not only act within the ECM but also bind to
specific cell surface receptors, membrane-anchored proteins or cell-associated ECM.
Moreover, secreted MMPs may be recruited back to the local cell environment by interactions
with cell surface proteins such as the LDL-receptor related protein family of receptors [109].
From this family, only LRP-1, LRP-1b and LRP-2 have been described to physically interact
with MMPs [110].
As it was mentioned before, MMPs modulate LRPs function by shedding of their ectodomain.
It has been reported that LRP-1 and -1b are targets of MMP-14, ADAM-10 and -17 [110],
[87]; meanwhile, the identity of the MMP responsible of LRP-2 (megalin) extracellular
domain shedding remains unknown. Notably, the interacting LRPs are also capable of

Introduction
24
regulating MMPs activity and extracellular abundance by mediating their endocytosis or the
endocytosis of their inhibitors. More specifically, LRP-1 endocytoses MMP-2, -9, -13,
ADAMTS-4 and -5, and some MMPs inhibitors. Alternatively, LRP-1b and LRP-2, are
associated with the clearance of MMP-2 and MMP-9, respectively [110].
1.13. MMPs and TGF-β reciprocal regulation
The interaction between MMPs and TGF-β has been extensively investigated in the context of
tumor progression. Both molecules integrate an interplay loop that tightly regulates malignant
transitions. On one hand, latent TGF-β sequestered within the ECM is proteolytically
activated by a subset of MMPs: MMP-2, -9, -13 and -14 [111], [112]. The released active
cytokine could then promote or repress tumor cell growth and invasiveness depending on the
stage of the tumor. On the other hand, TGF-β regulates MMPs and their inhibitors expression
in both tumor and stromal cells; MMP-2, -9 and -14 are critical elements in progression of
angiogenesis expression of which is increased by TGF-β [113], [114].
Remodeling of the ECM to promote epithelial-to-mesenchymal transition and cell migration
also requires activation of MMP-2 and -9 by TGF-β, leading to degradation of type IV
collagen fibers [115], [116]. Furthermore, cardiac remodeling after heart failure is induced by
TGF-β-dependent MMP-2 and-14 activation in cardiac fibroblasts [117]. A recent study
demonstrated that inhibition of MMP-9 by quercetin downregulated the expression of both
MMP-9 and TGF-β in A549 cells, thereby impairing tumor progression [118]. In contrast,
another group reported that inhibition of TGF-β/Smad pathway induced MMP-9 expression
and activation mainly in airway epithelial cells, vascular smooth muscle cells and
inflammatory cells, causing increased permeability of the pulmonary blood vessels,
degradation of the extracellular matrix and destruction of the normal lung tissue structures
[119]. Thus, reciprocal regulation of MMp-9 and TGF-β may differ depending on the
stimulus, cell type and activated signaling pathways.
1.14. Regulation of MMPs by PKCs
The protein kinase C (PKC) family of serine/threonine kinases comprises 11 isoforms
encoded by 9 genes and grouped into 4 classes – classical (cPKCs-α, βI, βII, γ), novel
(nPKCs-δ, ϵ, η, θ), atypical (aPKCs-ζ, ι/λ), and PKCμ [120]; which are key mediators of
various intracellular pathways, including the MMPs signaling pathway. It has been reported
that inhibition of PKC also inhibits the production of some MMPs like -1, -3, -9, -10 and -11
in the context of angiogenesis and tumor metastasis [121], [122]. Additionally, recent studies

Introduction
25
have demonstrated that MMP-9 expression and activity are increased by different PKC-
dependent signaling pathways that promote malignant cells invasion in breast cancer and
neuroblastoma models [123]–[125].
The role of PKCs in the pathogenesis of ARDS has been investigated and both
pharmacological modulation of PKC activity and development of PKC knockout mice were
correlated with improvements in experimental models of acute lung injury [126]. However,
regulation of MMPs by PKCs in this context remains unclear.
1.15. TGF-β regulation of PKC and γ-secretase activity
Many PKC isoforms have been described to act downstream of TGF-β in signaling pathways.
For example, cell migration is enhanced when calcium-dependent PKC-α activation is
promoted by TGF-β in pancreatic cancer cells [127]; PKC-δ is specifically activated by TGF-
β in mesangial and smooth muscle cells where it interacts with the Smad pathway [128]–
[130]. Alternatively, it has been suggested that PKC could regulate TGF-β signaling by
altering TGF-β receptors trafficking and degradation, thereby extending TGF-β-dependent
Smad-2 phosphorylation, and by phosphorylation and inactivation of GSK3-β [131], [132].
Moreover, atypical PKCs have been reported to be important in TGF-β-induced epithelial-to-
mesenchymal transition through recruitment of ubiquitin ligases that drive degradation of the
small GTPase RhoA and epithelial cell plasticity [133], [134].
Although there is some evidence that TGF-β increases γ-secretase activity and expression in
cancer cells, which mediates intramembrane proteolysis of TGF-β receptor I [135], further
studies are necessary to specifically address the connection between these two factors.
1.16. Hypothesis
Based on the existing evidence that 1) accumulation of protein-rich edema fluid in the distal
airways strongly contributes to enhanced inflammation and alveolar-capillary barrier damage;
2) TGF-β is a key regulator of the pathogenesis of ARDS; 3) there is evidence of TGF-β-
induced downregulation of the transmembrane endocytic receptor megalin in kidney proximal
tubules; 4) the main function of this receptor involves proteins retrieval from urine back to
circulation; 5) megalin is expressed in alveolar epithelial type II cells where it contributes to
the maintenance of barrier homeostasis;
Introduction
26
We hypothesize that:
TGF-β induces megalin downregulation in alveolar type II epithelial cells, thereby impairing
clearance of excess proteins out of the alveolar space, promoting inflammation and barrier
destruction.
1.17. Aims
In order to test the hypothesis above, the following main objectives were formulated:
➢ To elucidate if megalin cell surface abundance and turnover are altered in the presence
of TGF-β.
➢ To determine if megalin is prone to be ubiquitinated and if such process can be
enhanced by TGF-β.
➢ If megalin is ubiquitinated in response to TGF-β, to investigate which lysines in the c-
terminal tail of megalin are critical for this post-translational modification and which
ones are indeed regulated by this cytokine.
➢ To prove if TGF-β can also exert a long-term effect on megalin downregulation by
controlling the receptor expression through shedding and RIP.
➢ To identify which molecular events upon megalin shedding and RIP are regulated by
TGF-β: PKC/MMPs-induced shedding, γ-secretase activity, megalin and mRNA
expression reduction.

Materials and methods
27
2. Materials and methods
2.1. Chemicals, reagents and methodologies
2.1.1. General reagents
All chemical reagents used in this project were of analytical purity and will be described in
detail along the section.
2.1.2. Drugs
Drug Application Final concentration Vehicle Company
Chloroquine Lysosome inhibition 100 uM Water Sigma-Aldrich
Complete Proteases inhibition 1 tablet/2ml, 1X Water Sigma-Aldrich
Compound E γ-secretase activity inhibition 1 uM DMSO Enzo Life Sciences
gö6976 PKC inhibition 1,3 uM DMSO Calbiochem
MG-132 Proteasome inhibition 10 uM DMSO Calbiochem
NEM Deubiquitinases inhibition 5 mM Ethanol Sigma-Aldrich
hr-TGF-β-1 Cell treatment 20 ng/ml Water R and D
Table II. List of drugs used for cell treatment.
2.1.3. Antibodies
Antibody Species Dilution (WB) MW (kDa) Company
Primary 20S Preoteasome α3 (D3) Mouse 1:200 27 Santa Cruz
Cathepsin B (FL-339) Rabbit 1:200 25 Santa Cruz
Fibrillarin (C13C3) Rabbit 1:1000 37 C. Signalling
LAMP-2 (H-207) Rabbit 1:200 120 Santa Cruz
Megalin Rabbit 1:1000 600 Proteintech
MMP-14 Rabbit 1:1000/1:100 (IP) 66 T. Fisher
MMP-2 Rabbit 3 ug (IP) 63-72 Proteintech
MMP-2 Rabbit 1:200 63-72 Santa Cruz
MMP-9 Rabbit 1:200 92-120 Santa Cruz
PKC α/β Rabbit 1:200 80 Santa Cruz
Presenilin 1 (C-20) Goat 1:200 47 Santa Cruz
Rab 11 (A-6) Mouse 1:200 25 Santa Cruz
Rab 35 Rabbit 1:1000 23 Proteintech
Na/K ATPase α-1 Mouse 1:1000 110 Millipore
Transferrin receptor Mouse 1:1000 95 Invitrogen
Ubiquitin Mouse 1:200 - Santa Cruz
β-actin Rabbit 1:1000 42 Sigma
β-actin Mouse 1:50 (IF) 42 Sigma
Mouse IgG control Mouse 1:50 (IF)or 3ug (IP) - T. Fisher
Rabbit IgG control Rabbit 1:50 (IF)or 3ug (IP) - T. Fisher
Secondary Anti-rabbit Goat 1:10.000 - C. Signalling
Anti-mouse Rabbit 1:10.000 - T. Fisher
Anti-goat Donkey 1:10.000 - Santa Cruz
Alexa Fluor 488 anti-rabbit Goat 1:500 (IF) - T. Fisher
Alexa Fluor 594 anti-mouse Donkey 1:500 (IF) - T. Fisher
Table III. List of antibodies used for Western blot (WB), immunoprecipitation (IP) and
immunofluorescence (IF) assays. MW: molecular weight.

Materials and methods
28
2.1.4. Rat lung epithelial cell line
The RLE-6TN (rat lung epithelial-T-antigen negative) cell line was obtained from the
American Type Culture Collection (ATCC). These cells were derived from alveolar type II
cells isolated from a 56-day old male F344 rat using airway perfusion with a pronase solution.
The cell line exhibits characteristics of alveolar type II cells such as lipid-containing inclusion
bodies and expression of cytokeratin 8 and 19; the cells do not express alkaline phosphatase
but express several chemotactic cytokines that are similar to those of primary culture of
alveolar type II cells.
After defreezing, cells were kept in culture from passage 5 to 8. Once in passage 9, cells were
suitable for transfection till passage 15 and from passages 10 to 15 for regular experiments.
After passage 15 cells were not used as cellular morphology and response were not optimal
for in vitro experiments.
2.1.5. Rat primary alveolar epithelial cells
Isolations were performed from male Sprague-Dawley rats not older than three weeks (140-
160g). 24 hours after isolation culture media was replaced by fresh one and cells were kept in
culture for 72 hours before use. Transfection of cells was performed 24 hours after isolation
and cells were processed 24 hours later (48 hours after isolation).
2.1.6. Primary ATII cells isolation from rat lung
Alveolar type II cells were isolated as previously described [20], [136]. Briefly, lungs were
surgically removed from anesthetized male Sprague-Dawley rats and lavaged 8 times with
solution I and 2 times with solution II. Then lungs were perfused with elastase solution in a
solution III bath at 37°C and incubated for no more than 20 minutes. After digestion, lungs
were collected in sterile cups and trachea, small bronchus and vessels were removed under
sterile conditions. Lung lobes were then shred for approximately 10 minutes, rinsed with
serum-free Dulbecco’s Modified Eagle Medium (DMEM high glucose, Life Technology
GmbH, Darmstadt, Germany) containing DNAse (Serva electrophoresis, Heidelberg,
Germany) and smashed again. DNAse activity was stopped with 10% fetal bovine serum
(FBS, PAA Laboratories, Egelsbach, Germany) and tissue homogenates were filtered in 100
um cell strainer (BD Falcon, Heidelberg, Germany), then 40 um cell strainer (BD Falcon,
Heidelberg, Germany), and finally, 10 um syringe filter (PALL Life Science, Dreieich,
Germany). Filtered homogenates were centrifuged for 20 minutes at 1200 rpm and 20°C.

Materials and methods
29
Supernatants were discarded and pellets resuspended in serum-free DMEM with DNAse.
Cells were plated on rat IgG (Sigma-Aldrich, Germany) pre-coated plates and incubated at
37°C for 1.5 hours. After incubation, cell suspension was collected into a 50 ml falcon tube
(BD Falcon, Heidelberg, Germany), together with 5 ml washing (serum-free DMEM with
DNAse) of the plates and centrifuged as before. Pellets were resuspended in conditioned
DMEM containing 10% FBS and 1% penicillin (100 U/ml)/streptomycin (100 ug/ml) (PAN-
Biotech, Aidenbach, Germany) and quantified with Nile red. Approximately, 2 to 4 million of
cells were plated in 60 mm petri dishes (Sarstedt, Nümbrecht, Germany) or 200.000 to
500.000 in 6 well plates (BD Falcon, Heidelberg, Germany).
2.1.7. Cell culture
RLE-6TN and rat primary ATII cells were incubated at 37°C, room air 5% carbon dioxide
and 80-90% humidity. Cell culture conditions were kept in a Haereus cell culture incubator
(Haereus Instruments, Hanau, Germany). Nutrients were provided in conditioned low glucose
DMEM (Life Technology GmbH, Darmstadt, Germany) culture medium containing 10% FBS
Solution I 0,5% NaCl (Sigma, St. Luis, USA)
3 mM KCl (Sigma, St. Luis, USA)
1,6 mM Na2HPO4 (Sigma, St. Luis, USA)
0,12
mM EGTA
5 mM
HEPES pH 7.4 (Roth, Karlsruhe,
Germany)
0,06% Penicillin/Streptomycin
Glucose (Sigma, St. Luis, USA)
Solution II 0,7% NaCl
5 mM KCl
2,4 mM Na2HPO4
2 mM CaCl2 (Sigma, St. Luis, USA)
10 mM HEPES pH 7.4
0,1% Penicillin/Streptomycin
Glucose
Solution III 0,9% NaCl
12 mM HEPES pH 7.4
0,1% Penicillin/Streptomycin
Glucose
Elatase solution 0,02% in solution II

Materials and methods
30
and 1% penicillin/streptomycin antibiotics. Culture medium was replaced every two days for
cell culture maintenance.
For sub culturing, cells were rinsed once with sterile phosphate saline buffer 1X (PBS, Life
Technology GmbH, Darmstadt, Germany) and incubated for 5 minutes with 0,25% trypsin-
EDTA (Life Technology GmbH, Darmstadt, Germany) for cellular detachment. Digestion
was stopped by adding conditioned DMEM onto the plates and cellular aggregates
resuspended by pipetting. Resuspended cells were plated as needed in appropriate petri
dishes, 6 well plates or microscopy slides.
2.1.8. Total protein quantification
Protein concentration from whole cell lysates, subcellular fractions and concentrated cell
culture supernatants was measured by Bradford assay (BioRad, Hercules, CA, USA)
according to manufacturer recommendations. Samples were diluted from 1:10 to 1:20 in 1 ml
of Bradford reagent and incubated for 20 minutes at room temperature, protected from light.
Measurements of absorbance were done in a spectrophotometer (Eppendorf, Hamburg,
Germany).
2.1.9. SDS-PAGE and Western blotting
Equal amounts of proteins (ug) were loaded in all the cases. Total proteins were separated in
10% poly-acrylamide (Roth, Karslruhe, Germany) gels unless other concentration was
specified. For detection of megalin, 4 to 16% or 4 to 10% poly-acrylamide gradient gels were
prepared. After separation proteins were transfer to nitrocellulose membranes (BioRad,
Hercules, CA, USA) for 1 to 2,5 hours and blocked for 1 hour in 5% skim milk (Sigma, St.
Luis, USA) T-TBS buffer. After washing of excess blocking solution, membranes were
incubated overnight with specific antibodies at 4°C. First antibodies were washed in T-TBS
for half an hour and incubated for 1 hour at room temperature with second antibodies
conjugated to horseradish peroxidase (HRP). Then membranes were washed as before and
developed with SuperSignal West Pico or Femto Chemiluminescent Substrate detection kit
(Thermo Scientific, Waltham, MA, USA), as recommended by the manufacturer, in a CP
1000 automatic film processor (AGFA, Mortsel, Belgium).

Materials and methods
31
T-TBS (Tween 20-Tris Buffer Saline)
50 mM Tris pH 7,6 (Roth, Karslruhe, Germany)
150 mM NaCl (Sigma, St. Luis, USA)
0,05% Tween 20 (Sigma, St. Luis, USA)
2.1.10. Coomassie brilliant blue staining
Loading control of fractionation experiments were performed by Coomassie brilliant blue 250
(Sigma, St. Luis, USA) staining of the membranes. Once all the proteins of interest were
detected by Western blotting, membranes were rinsed in distilled water for 5 minutes and
incubated for 5 minutes with 0,1% Coomassie brilliant blue 250 in 40% methanol-1% acetic
acid. Membranes were then washed 3 times 5 minutes with 50% methanol-1% acetic acid
(Sigma, St. Luis, USA). Finally, a last washing with distilled water was performed prior
scanning the membranes.
2.1.11. Densitometry
Quantification of the intensity of the bands obtained by Western blot was performed by
densitometry, employing Image J software (National Institutes of Health, Bethesda,
Maryland, USA).
2.1.12. Plasmidic DNA amplification in E. coli
A shorter variant of megalin has been generated by Dr. Marzolo (Pontificia Universidad
Católica of Chile, Chile) [70], who kindly shared this construct with us, as full length megalin
was too long to be properly sub cloned and mutated. As it is shown in figure 12, the construct
consists of megalin transmembrane and cytosolic domains fused to green fluorescent protein,
GFP, instead of megalin ectodomain. The construct (received dried on paper) was
resuspended overnight in distillated water. After resuspention it was cloned and amplified in
JM109 competent strain of E. coli (Promega, Wisconsin, USA). Briefly, JM109 competent
bacteria were thawed on ice for 5-10 minutes and 1 µg of plasmid was added to 50 µl of
JM109 cells suspension. After 30 minute of incubation on ice, cells were heat shocked for 90
seconds at 42°C a water bath and placed again on ice for 5 minutes before adding 100ul of LB
broth medium (Sigma, St. Luis, USA) to the transformed bacteria. Bacteria were allowed to
recover by agitation at 250 rpm, 37°C for 30 minutes. Then the suspension was plated in LB
agar (Sigma, St. Luis, USA) containing 100 ug/ml ampicillin (Sigma, St. Luis, USA).

Materials and methods
32
Resulting colonies were amplified in liquid LB broth medium for 24 hours and glycerol
stocks were prepared and stored at -70°C.
Figure 12. Schematic representation of a plasmid containing megalin transmembrane and cytosolic
domain downstream GFP. This construct was a gift from Dr. Marzolo, Pontificia Universidad
Católica de Chile, Santiago, Chile.
2.1.13. Site-directed mutagenesis (SDM)
In order to study the functionality of certain amino acid residues in megalin c-terminal tail, we
specifically replaced them by Quick-Change Site-Directed Mutagenesis kit (Stratagene, La
Jolla, California, USA) . The procedure is based on the amplification of a plasmid (coding for
a protein of interest) by PCR (polymerase chain reaction) with primers containing a point
mutation in the nucleotidic sequence that will replace amino acids at protein level.
Primers were design following the kit instructions (Table V), and synthetized by Metabion
(Martinsried, Germany).
Once primers were ready, the PCR reaction was performed as follows:
Reagents Volume for 50 ul (ul)
10X Q5 reaction buffer 5
Plasmid template (50 ng) 2 (from 1:100 dil of stock)
Primer forward (125 ng) 1,4
Primer reverse (125 ng) 1,4
dNTPs mix 1
Pfu Turbo DNA polymerase 1
Distilled water 38
Table IV. Reaction mix for site-directed mutagenesis.

Materials and methods
33
Conditions:
Initial denaturation: 95°C for 1 min.
Denaturation: 95°C for 30 sec.
Annealing: 55°C for 1 min. x 12 or 16
Extension: 68°C for 7 min
Hold: 4°C infinite
Table V. List of primers used for SDM. All these primers were design according to manufacturer
instructions. S: serine; A: alanine; D: aspartate; K: lysine; For: forward; Rev: reverse.
GFP-Meg-TMT plasmid was used as DNA template and all the point mutations and single
amino acid changes were located at the c-terminal tail of megalin.
After temperature cycling, reaction tubes were placed on ice and treated for 1 hour at 37°C
with 1 ul of Dpn I restriction enzyme (10 U/ul, provided with the kit) to digest methylated
parental supercoiled double strand DNA. Dpn I-treated DNA was then transformed into 50 ul
of XL1-Blue super competent bacteria (provided with the kit), that were previously thawed on
ice, and incubated on ice for 30 minute. After incubation, transformation reactions were heat
shocked for 45 seconds at 42°C and then placed on ice for 2 minutes before 1 hour incubation
at 37°C, 250 rpm, in NZY+ broth medium. Finally, transformed bacteria were plated on LB
agar plates containing 100 ug/ml of ampicillin and incubated at 37°C. 24 hours later, colonies
Mutation Exchanged
amino acids
Primer Sequence
PPPAP S (TCA) to A
(GCA)
For 5'-GTGTTGCTGCGACACCACCTCCAGCACCTTCGCTCCCTGCTAAGCCTA-3'
Rev 5'-TAGGCTTAGCAGGGAGCGAAGGTGCTGGAGGTGGTGTCGCAGCAACAC-3'
PPPDP S (TCA) to D (GAC)
For 5'-GTGTTGCTGCGACACCACCTCCAGACCCTTCGCTCCCTGCTAAGCCTA-3'
Rev 5'-TAGGCTTAGCAGGGAGCGAAGGGTCTGGAGGTGGTGTCGCAGCAACAC-3'
K14 K (AAA; AAG) to R (AGA,AGA)
For 5'-T CCCTTTTGCC TGCTCTGCCCAGGCTGCCAA GCTTAAGCAG TCTC-3'
Rev 5'-GAGACTGCTTAAGCTTGGCAGCCTGGGCAGAGCAGGCAAAAGGGA-3'
K23 K (AAA; AAG) to R (AGA,AGA)
For 5'-CCAAGCTTAAGCAGTCTCGTCAGGCCCTCTGAAAATGGGAATGGG -3'
Rev 5'-CCCATTCCCATTTTCAGAGGGCCTGACGAGACTGCTTAAGCTTGG-3' K88 K (AAA; AAG) to
R (AGA,AGA)
Fow 5'-TCAGCCAGAGACAGTGCTGTCAGAGTGGTTCAGCCAATCCAGGTG-3'
Rev 5'-CACCTGGATTGGCTGAACCACTCTGACAGCACTGTCTCTGGCTGA-3' K197 K (AAA; AAG) to
R (AGA,AGA)
For 5'-TCTGCAACAGAAGACACTTTTAGAGACACCGCAAATCTTGTTAAA-3'
Rev 5'-TTTAACAAGATTTGCGGTGTCTCTAAAAGTGTCTTCTGTTGCAGA-3' K204 K (AAA; AAG) to
R (AGA,AGA)
For 5'-AGAGACACCGCAAATCTTGTTAGAGAAGACTCTGAAGTA-3'
Rev 5'-TACTTCAGAGTCTTCTCTAACAAGATTTGCGGTGTCTTT-3'
K138-142 K (AAA; AAG) to
R (AGA,AGA)
Fow 5'-AAATGGAATCTCTTCAGACGAAAATCTAGACAAACTACCAACTTTG-3'
Rev 5'-CAAAGTTGGTAGTTTGTCTAGATTTTCGTCTGAAGAGATTCCATTT-3' K176-178 K (AAA; AAG) to
R (AGA,AGA)
For 5'-ATCACCTTCGCTCCCTGCTAGGCCTAGGCCTCCTTCGAGAAGAGAC-3'
Rev 5'-GTCTCTTCTCGAAGGAGGCCTAGGCCTAGCAGGGAGCGAAGGTGAT-3'

Materials and methods
34
were amplified in liquid culture medium with antibiotics for sequencing and glycerol stocks
preparation.
NZY+ broth: 40 mM NZ amine pH 7.5 (Roth, Karlsruhe, Germany)
5 g/L yeast extract
85 mM NaCl (Sigma, St. Luis, USA)
12.5 mM MgCl2. 6H2O (Sigma, St. Luis, USA)
12.5 mM MgSO4 (1M) (Sigma, St. Luis, USA)
20 M Glucose (Sigma, St. Luis, USA)
Confirmation of proper mutation was performed by single strand sequencing (Microsynth,
Switzerland) with EGFP-C-for standard primers provided by the sequencing service.
2.1.14. Short scale plasmid isolation
Small quantities of mutated plasmidic DNA needed for sequencing was obtained from 5 ml
transformed bacteria in LB liquid culture plus antibiotics. QIAprep Spin Miniprep kit
(Qiagen, Hilden, Netherlands) was used according to manufacturer instructions.
Briefly, 5 ml of overnight bacterial culture were centrifuged at 6800 x g for 3 minutes and the
pellet resuspended in 250 ul of buffer P1 (provided with the kit). 250 ul of lysis buffer P2
(provided with the kit) were added to the suspension, mixed thoroughly and incubated for no
longer than 5 minutes. Bacterial lysis was stopped by addition of 350 ul of buffer N3
(provided with the kit), followed by mixing and centrifugation for 10 minutes at 17.900 x g.
Supernatant was applied to a QIAprep spin column (provided with the kit) and centrifuged for
1 minute. The column was washed twice with buffers PB and PE (provided with the kit),
followed by 1 minute of centrifugation in each case. Finally, the column was centrifuged for 1
minute at maximal speed to remove residual washing buffer and plasmidic DNA was eluted
with 50 ul buffer EB (provided with the kit) and subsequent centrifugation.
DNA concentration was measured by absorbance in NanoDrop ND-1000 (Thermo Fisher,
Massachusetts, USA).
2.1.15. Large scale plasmid isolation
Large amounts of plasmidic DNA needed for cellular experiments were obtained with
QIAGEN plasmid Maxi kit (Qiagen, Hilden, Netherlands).

Materials and methods
35
Briefly, 100 ml of transformed bacterial culture were harvested by centrifugation at 6000 x g
and the pellet resuspended in 10 ml of buffer P1 (provided with the kit). Bacterial lysis was
done by addition of 10 ml of buffer P2 (provided with the kit) to the suspension and mixed
thoroughly. After 5 minute of incubation, 10 ml of buffer P3 (provided with the kit) were
added to stop the reaction, mixed and incubated for 20 minutes on ice. The resulting
suspension was centrifuged for 30 minutes at 20.000 x g 4°C and the supernatant was re-
centrifuged for an extra 15 minutes. The supernatant was applied to the top of a QIAGEN-tip
(provided with the kit) and allowed to decant by gravity flow. The column was then washed
twice with 30 ml of buffer QC (provided with the kit) and the DNA was eluted to a clean tube
with 15 ml of buffer QF (provided with the kit). DNA was precipitated by addition of 10.5 ml
of iso-propanol (Sigma, St. Luis, USA) and centrifugation at 15.000 x g for 30 minutes.
Supernatant was carefully decanted and the pellet washed with 5 ml of 70 % ethanol (Sigma,
St. Luis, USA). Finally, the pellet was dried at room temperature and resuspended in a proper
amount of TE buffer (provided with the kit). Total DNA was quantified by NanoDrop.
2.1.16. Total RNA isolation
To evaluate gene expression by real time PCR, total RNA isolation was required. For this
purpose, we used the RNeasy Plus Mini Kit (Qiagen, Hilden, Netherlands).
RLE-6TN or rat primary ATII cells plated on a 60mm petri dish were harvested with 350 ul of
lysis buffer RLT (provided with the kit) and applied to a QIAshredder column (Qiagen,
Hilden, Netherlands) to remove debris. After 1 minute of centrifugation at 8000 x g, the flow
through was mixed with one volume of 70% ethanol and transfer to an RNeasy spin column
(provided with the kit), followed by 15 seconds of centrifugation at 8000 x g. The RNeasy
spin column was washed with 700 ul of buffer RW1 (provided with the kit) and with 500 ul of
buffer RPE by centrifugation at 8000 x g. A final wash was done with 500 ul of buffer RPE
(provided with the kit) minutes at the same speed. After washing, the RNeasy spin column
was placed in a clean 1,5 ml collection tube and RNA was eluted twice with the same volume
of RNase-free water (provided with the kit). Total RNA was quantified by NanoDrop and
stored at -70°C.
2.1.17. cDNA preparation (reverse transcription)
Because double stranded DNA is required to perform a real time-PCR, total RNA isolated
from cell culture was transformed into DNA by reverse transcription.

Materials and methods
36
To obtain the cDNA, iScript cDNA Synthesis kit (Biorad, Hercules, California, USA) was
employed, following the manufacturer instructions. Chemicals needed to conduct the reaction
are listed in table VI. cDNA products were stored at -20°C.
Reagents Volume for 20 ul (ul)
5x iScript reaction mix 4
Reverse transcriptase 1
Nuclease free water 14
RNA template (1ug) 1
Table VI. Reaction mix for reverse transcription.
Conditions:
25°C for 5 min.
42°C for 30 min.
85°C 5 min.
4°C infinite hold
2.1.18. Real time polymerase chain reaction
To assess the relative expression of certain genes we performed real time-PCR using the
SYBR Green Master Mix (Biorad, Hercules, California, USA) according to the manufacturer
instructions. Primers were design and synthetized by Metabion in order to specifically amplify
the genes listed in table VII.
Gene Primer Sequence Species
Megalin Forward 5'-AAAGTGGCCCTGGCAGTTC-3' Rat
Reverse 5'-GAAGGATCTATGGGCCTTCCA-3' Rat
Nhe3 Forward 5'-ACTGCTTAATGACGCGGTGACTGT-3' Rat
Reverse 5'-AAAGACGAAGCCAGGCTCGATGAT-3' Rat
Gapdh Forward 5'-GGCAAGTTCAAGGGCACAGT-3' Rat
Reverse 5'-TGGTGAAGACGCCAGTAGACTC-3' Rat
Table VII. List of primers used for rt-PCR.
To determine the amount of cDNA template required for proper detection of all the genes and
to test primer efficiency, five serial dilutions were done from a control cDNA template and
specific genes were amplified. Ct values were collected at the end of the measurements and
plotted against the known cDNA concentrations. The slope of each of the standard curves
obtained for each pair of primers was calculated by linear regression and compared to the
others. When the values of the slopes were very similar or identical to each other, same

Materials and methods
37
primer efficiency was considered for all the pairs of primers. Regarding the proper dilution of
the template, 1 into 5 dilution ratio was selected.
Real time-PCR reactions were performed in 96 well plates (Thermo Fisher, Massachusetts,
USA) where 24 ul of the following master mix were added per well:
Reagents Volume for 24 ul (ul)
SyBr Green super mix 12,5
Primer forward 1 (1:10 stock dil.)
Primer reverse 1 (1:10 stock dil.)
Nuclease free water 10,5
Table VIII. Reaction mix for rt-PCR.
1 ul of 1:5 dilution of the cDNA template was added per well and the reaction was performed
under the conditions bellow:
Initial denaturation: 95°C for 10 min.
95°C for 15 secs.
55°C for 1 min.
Melting curve
Fluorescence readouts were done with a real time thermocycler device from Stratagene (San
Diego, California, USA).
2.1.19. Specific mRNA knockdown (siRNA)
To evaluate the function of the proteins listed in table VIII, specific knockdown was
performed with small interference RNA technology.
siRNA Final concentration pmol
MMP-2 40 nM 100
MMP-9 40 nM 100
MMP-14 30 nM 75
PKC 40 nM 100
Presenilin-1 40 nM 100
Table IX. List of siRNA employed for knockdown. All of them were purchased from Santa Cruz
Biotechnology (California, USA). Scrambled siRNA was used for control.
Cells were plated 24 hours before transfection in 60 mm petri dishes or 6 well plates, to reach
70 to 80 % confluency the day of the experiment. Transfection complexes were formed at
room temperature following table X.
x 40

Materials and methods
38
Reagents Volume (ul)/ 60 mm Volume (ul)/ well (6 well plate)
Tube 1 OptiMEM 200 150
Lipofectamine RNAiMAX 15 9
Tube 2 OptiMEM 200 150
siRNA (10 uM stock) 10 -12,5 6 -7,5
Table X. Reaction mix for siRNA transfection. OptiMEM (Life Technology GmbH, Darmstadt,
Germany) is serum-free culture medium. Lipofectamine RNAiMAX was purchased from Thermo
Fisher (Massachusetts, USA).
After five minutes of incubation, tube 1 and tube 2 contents were mixed and incubated at
room temperature for 30 minutes. Meanwhile, culture medium from cells was replaced for
fresh conditioned low glucose DMEM. Once incubation time was over, lipofectamine-siRNA
complexes were dropped on top of the cells and incubated for another 6 hours at 37°C. Then,
culture medium was removed and replaced for fresh conditioned low glucose DMEM.
Transfected cells were incubated at 37°C for 72 hours.
2.1.20. RLE-6TN and rat primary ATII cells transfection
Plasmidic DNA was introduced into RLE and rat primary ATII cells by nucleofection with
the P3 Primary cell transfection kit (Lonza, Basel, Switzerland) as it was described before.
This method allows direct transfection into the cell nucleus and the cytoplasm without relying
onto cell division.
Cell were plated 24 hours before the transfection to be 50% confluent the day after. Before
transfection, cells were washed with 1 X PBS without calcium and magnesium and
trypsinized. Cells were resuspended in 2 ml of conditioned low glucose DMEM per 100 mm
plate and collected in a 15 ml tube. An aliquot of the cell suspension was taken to quantify the
number of cells in a Neubauer chamber and to calculate the volume required to obtain 4
million cells per reaction. Then, cells were centrifuged at 90 x g for 10 minutes at room
temperature. After centrifugation, the pellet was resuspended in P3 transfection buffer
(provided with the kit) and plasmidic DNA was added at a ratio of 6 ug every 100 ul of the
cell suspension. Each reaction was conducted in a single cuvette (provided with the kit) where
100 ul of cell suspension plus DNA was applied, followed by electroporation with the 4D-
nucleofector device (Lonza, Basel, Switzerland). Once transfected, cells were allowed to
recover for 10 minutes at room temperature and incubated at 37°C in normal DMEM till the
day of processing.

Materials and methods
39
2.1.21. Cell surface proteins biotinylation
To study megalin cell surface stability we performed biotin-streptavidin pulldown of total
proteins at the plasma membrane as previously described [136]. This method is based on
labelling of cell surface proteins with a solution of biotins, followed by pulldown with
streptavidin beads that will bind to the biotinylated proteins. Pulled down proteins are then
separated by SDS-PAGE and blotted with specific antibodies.
RLE-6TN and rat primary ATII cells were rinsed 3 times with PBS with Ca++/Mg++ (Life
Technology GmbH, Darmstadt, Germany) on ice. A solution of EZ-link NHS-LC-biotin
(Thermo Fisher Scientific, Waltham, Massachusetts, USA) 1 mg/ml in PBS with Ca++/Mg++
was added on top of the cells and incubated on ice for 20 minutes. After incubation, cells were
washed 3 times for 10 minutes with 100 mM glycine in PBS with Ca++/Mg++ and one time
with PBS with Ca++/Mg++ only. Then, cells were lysed with mRIPA buffer and centrifuged at
full speed for 10 minutes 4°C. Whole cell homogenates were quantified and 50 to 500 ug of
total protein were rotated overnight with streptavidin agarose beads (Thermo Fisher
Scientific, Waltham, Massachusetts, USA).
mRIPA buffer
50 mM Tris-HCl, pH 8
150 mM NaCl
1% NP-40 (Sigma, St. Luis, USA)
1% sodium deoxycholate (Sigma, St. Luis, USA)
Protease inhibitors
Beads were washed as follows:
Buffer A: 150 mM NaCl
1X 50 mM Tris pH 7,4
5 mM EDTA pH 8
Buffer B: 500 mM NaCl
2X 50 mM Tris pH 7,4
5 mM EDTA pH 8
Buffer C: 500 mM NaCl
3X 20 mM Tris pH 7,4
0,2% BSA
1X 10 mM Tris pH 7,4

Materials and methods
40
and cracked with 30 ul of 4X Laemmli sample buffer :
100 mM Tris, 6,8 pH
4% SDS (Roth, Karlsruhe, Germany)
0.02% bromophenol blue (Merck, New Jersey, USA)
20% Glycerol (Sigma, St. Luis, USA)
10% β-mercaptoethenol (Sigma, St. Luis, USA)
0,2 M DTT (Sigma, St. Luis, USA)
Samples were incubated for 20 minutes at 37°C, 550 rpm in a heating block. Proteins were
separated by SDS-PAGE and detected by Western blotting.
In case of endogenous megalin pulldown, transferrin receptor (Tfr) was used as loading
control, however, for pulldown of transfected GFP-TM-Megalin, the amount of GFP-TM-
Megalin in the input was consider a better loading control, as transfection efficiency was
contemplated as well.
2.1.22. Confocal microscopy
To investigate the subcellular localization of megalin and the effect of TGF-β on megalin
trafficking, RLE-6TN or rat ATII cells were stained with specific antibodies for megalin or β-
actin and the signal was amplified with secondary antibodies attached to green or red
fluorophores, respectively. Fluorescence detection was performed by a laser scanning
confocal microscope (Olympus, Shinjuku, Tokyo, Japan). Adapted from Novus biological
protocols.
RLE-6TN and rat primary ATII cells were plated the day before in 8 wells Lab-Tek chamber
slides with Permanox (Thermo Fisher, Massachusetts, USA) to reach a confluency of 40 to
60%. Prior staining, cells were incubated with TGF-β as stated previously and washed 3 times
with PBS without Ca++/Mg++ (room temperature), immediately after treatment. Cells were
fixed in 1:1 methanol: acetone for 5 minutes and washed 3 times with PBS without
Ca++/Mg++. After fixation, cells were permeabilized with 0,1% Triton X-100 in PBS without
Ca++/Mg++ for 10 minutes. Cells were washed 3 times with PBS without Ca++/Mg++ and
blocked for 1 hour with 1% BSA in 0,1% Tween 20 (Sigma, St. Luis, USA) in PBS without
Ca++/Mg++ . Blocking buffer was aspirated after incubation and cells were washed 3 times
with Tween-PBS. Cells were then incubated overnight with primary antibodies against
megalin diluted 1:50 in Tween-PBS at 4°C. The next day, primary antibodies were removed

Materials and methods
41
and cells washed 3 times with Tween-PBS, prior to the incubation with anti-rabbit secondary
antibodies Alexa-fluor 488 in Tween-PBS for 1 hour. Cells were washed 3 times with Tween-
PBS and incubated overnight 4°C with primary antibodies against β-actin (Marker of the
plasma membrane and the cytoskeleton). Anti-mouse secondary antibodies Alexa-fluor 594
were added after washing 3 times with Tween-PBS and incubated for 1 hour. Cells were
finally washed and incubated with DAPI (Thermo Fisher, Massachusetts, USA) in PBS for 10
minutes for nuclear staining. After staining, cells were mounted with Vectashield mounting
medium for fluorescence (Vector laboratories, Burlingame, California, USA) and cover with
coverslips (R. Langenbrick, Emmendingen, Germany). Fluorescence was detected by
confocal microscopy.
2.1.23. Complete subcellular fractionation
To assess megalin trafficking in the presence of TGF-β, isopycnic subcellular fractionation
experiments in sucrose (Sigma, St. Luis, USA) and Nycodenz (Axis Shield, Oslo, Norway)
gradients were performed. This protocol was adapted from Song et al (Proteomics 2006)
[137] in combination with Cox and Emili (Nature Protocols, 2006) [138], Stasyk et al
(Molecular and Cellular Proteomics, 2007) [139] and Holden and Horton (BMC Research
Notes, 2009) [140].
All steps were performed at 4°C in an Optima MAX XP ultracentrifuge (Beckman Coulter,
Brea, California, USA), unless specified otherwise. MLA-150 or MLA-55 fixed angle rotors
(Beckman Coulter, Brea, California, USA) were used for centrifugation bottles or tubes,
respectively.
RLE-6TN cells were plated in 100 mm petri dishes 24 hours before the experiment to reach
90% confluency the next day. Cells were treated with TGF-β, washed 3 times with PBS with
Ca++/Mg++ on ice and incubated with HB buffer for 10 minutes before scrapping. Whole
homogenates were collected in a tube and homogenized by 26 gauge-needle syringe to better
disrupt cells. An aliquot of this mixture was taken as a whole homogenate sample (WH)
before centrifugation at 9800 x g for 10 minutes in a benchtop centrifuge. Two fractions were
obtained: the supernatant (S1) containing cytoplasmic proteins, endosomes and small
organelles, and the pellet (P1) containing the nuclear fraction plus the reticulum and Golgi,
the plasma membrane fraction and unbroken cells. An aliquot of S1 was taken as a sample of
crude endosomal fraction (CE) and the rest was kept on ice to be processed later. Meanwhile,
P1 was resuspended in HB and passed through 18 gauge-needle syringe for homogenization.

Materials and methods
42
Then, 2 ml of HS buffer were placed at the bottom of a centrifuge bottle of polycarbonate 11
x 76 mm (Beckman Coulter, Brea, California, USA) and 2 ml of LS buffer pre-mixed with
resuspended P1 were gently placed on top to avoid mixing of phases. Centrifugation of the
bottles was done at 71.000 x g for 90 minutes in an ultracentrifuge. The resulting interphase
and the pellet were collected and re-centrifuged under the same conditions for better
purification. After the second round of centrifugation, the interphase was collected and
resuspended with HB buffer plus 0,5% NP-40 for purified plasma membrane proteins
isolation. The nuclear pellet was resuspended in 5 volumes of NE buffer for nuclear proteins
isolation. Samples were then centrifuged at 100.000 x g for 30 minutes. Supernatants were
kept as purified nuclear (N) and plasma membrane proteins (PM), respectively.
Endosomes were purified from S1 fraction in a Nycodenz gradient. S1 was placed on top of 5
to 35% Nycodenz gradient and centrifuged at 85.000 x g for 45 minutes. The resulting
interphase (I4) was collected, mixed with 5 volumes of 0,25 M SHE and centrifuged at
100.000 x g for 10 minutes. The pellet was resuspended in ME buffer and incubated on ice for
30 minutes. A final step of centrifugation at 100.000 x g for 10 minutes was done to keep the
purified microsomal proteins (E) in the supernatant.
All the fractions obtained after subcellular fractionation were quantified by Breadford,
denaturalized with 30 ul of Laemmli buffer at 37°C for 20 minutes, 550 rpm, and separated by
SDS-PAGE in 4 to 16% gradient gels. Specific antibodies were used for detection of megalin
and fraction markers (see table XI). Coomassie brilliant blue staining was used as loading
control.
Fraction Marker MW (kDa)
Plasma membrane N/K ATPase α-1 110
Early endosomes Rab 35 23
Recycling endosomes Rab11/ Tfr 24/ 95
Lysosomes LAMP-2/ Catepsin B 120/ 25
Proteasome 20S 27
Nucleus Fibrillarin 37
Table XI. List of protein markers of each of the isolated fractions. MW: molecular weight. Tfr:
transferrin receptor.

Materials and methods
43
Homogenization buffer (HB)
Buffer SHE
0,25 M Sucrose
0,25 M Sucrose
3 mM Imidazol
10 mM HEPES pH 7,5
1 mM EDTA
1 mM EDTA
Protease inhibitors
Protease inhibitors
Phosphatase inhibitors
Phosphatase inhibitors
pH 7,4-7,5
Buffer LS
Buffer NE
0,3 M Sucrose
20 mM HEPES pH 7,5
50 mM Tris pH 7,5
1,5 mM MgCl2
3 mM MgCl2
0,5 M NaCl
Protease inhibitors
0,2 mM EDTA
Phosphatase inhibitors
20% Glycerol
Buffer HS
Buffer ME
1,8 M Sucrose
20 mM Tris-HCl pH 7,8
50 mM Tris pH 7,5
0,4 M NaCl
3 mM MgCl2
15% glycerol
Protease inhibitors
1 mM DTT
Phosphatase inhibitors
1 mM PMSF
1,50% Triton-X-100
2.1.24. Proteasome purification
Purification of proteasomes from whole cell homogenates was performed by differential
centrifugation in an Optima MAX XP ultracentrifuge, employing polyallomer centrifuge
tubes (Beckman Coulter, Brea, California, USA) and MLA-150 fixed angle rotor. This
protocol is a combination of isolation protocols from Gaczynska et al (JBC, 1996) [141], To
et al (FEBS, 1997) [142] and Dai et al (JBC, 1998) [143]. All steps were performed at 4°C.
RLE-6TN cells were plated in 100 mm petri dishes 24 hours before the experiment to reach
90% confluency the next day. TGF-β treatment was performed as described before and cells
were rinsed 3 times with PBS with Ca++/Mg++ on ice, immediately after treatment. Cells were
homogenized in buffer A + protease inhibitors and 20% glycerol on ice for 10 min. Whole
cell homogenates were cleared by centrifugation at 10.000 x g for 20 minutes in a benchtop
centrifuge. An aliquot of the supernatant (S1) was taken as a sample of whole homogenate
(WH) and the rest was collected in a polyallomer centrifuge tube for centrifugation at 100.000
x g for 1 hour in an ultracentrifuge, to remove the remaining plasma membrane and nuclei.
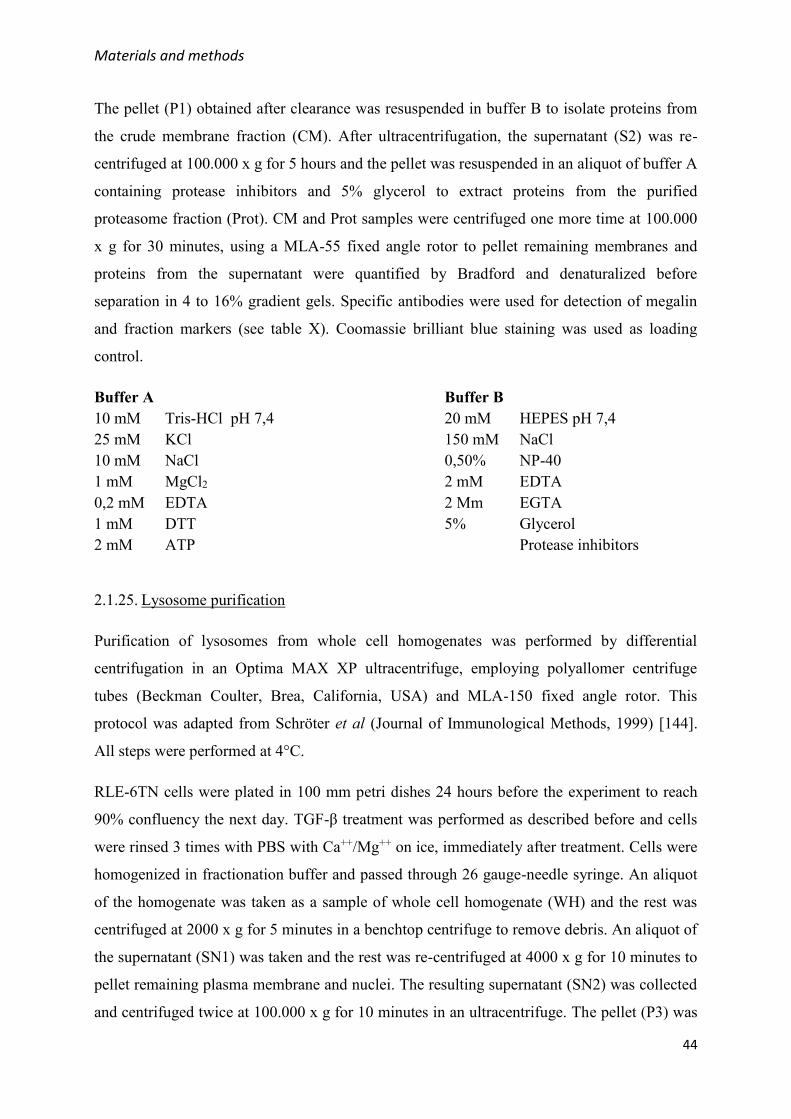
Materials and methods
44
The pellet (P1) obtained after clearance was resuspended in buffer B to isolate proteins from
the crude membrane fraction (CM). After ultracentrifugation, the supernatant (S2) was re-
centrifuged at 100.000 x g for 5 hours and the pellet was resuspended in an aliquot of buffer A
containing protease inhibitors and 5% glycerol to extract proteins from the purified
proteasome fraction (Prot). CM and Prot samples were centrifuged one more time at 100.000
x g for 30 minutes, using a MLA-55 fixed angle rotor to pellet remaining membranes and
proteins from the supernatant were quantified by Bradford and denaturalized before
separation in 4 to 16% gradient gels. Specific antibodies were used for detection of megalin
and fraction markers (see table X). Coomassie brilliant blue staining was used as loading
control.
2.1.25. Lysosome purification
Purification of lysosomes from whole cell homogenates was performed by differential
centrifugation in an Optima MAX XP ultracentrifuge, employing polyallomer centrifuge
tubes (Beckman Coulter, Brea, California, USA) and MLA-150 fixed angle rotor. This
protocol was adapted from Schröter et al (Journal of Immunological Methods, 1999) [144].
All steps were performed at 4°C.
RLE-6TN cells were plated in 100 mm petri dishes 24 hours before the experiment to reach
90% confluency the next day. TGF-β treatment was performed as described before and cells
were rinsed 3 times with PBS with Ca++/Mg++ on ice, immediately after treatment. Cells were
homogenized in fractionation buffer and passed through 26 gauge-needle syringe. An aliquot
of the homogenate was taken as a sample of whole cell homogenate (WH) and the rest was
centrifuged at 2000 x g for 5 minutes in a benchtop centrifuge to remove debris. An aliquot of
the supernatant (SN1) was taken and the rest was re-centrifuged at 4000 x g for 10 minutes to
pellet remaining plasma membrane and nuclei. The resulting supernatant (SN2) was collected
and centrifuged twice at 100.000 x g for 10 minutes in an ultracentrifuge. The pellet (P3) was
Buffer A
Buffer B
10 mM Tris-HCl pH 7,4
20 mM HEPES pH 7,4
25 mM KCl
150 mM NaCl
10 mM NaCl
0,50% NP-40
1 mM MgCl2
2 mM EDTA
0,2 mM EDTA
2 Mm EGTA
1 mM DTT
5% Glycerol
2 mM ATP
Protease inhibitors

Materials and methods
45
resuspended in 3 to 5 volumes of distilled water and kept on ice for 10 minutes for hypotonic
lysis of lysosomes. A final centrifugation at 100.000 x g for 10 minutes was done to isolate
proteins from the lysosome fraction (Lys). Proteins from the supernatant were quantified by
Bradford and denaturalized before separation in 4 to 16% gradient gels. Specific antibodies
were used for detection of megalin and fraction markers (see table X). Coomassie brilliant
blue staining was used as loading control.
Fractionation buffer
10 mM Tris(hydroxymethyl)aminomethane/acetic acid pH 7,0
0,25 M sucrose
2.1.26. Plasma membrane purification
To study the subcellular localization of proteins implicated in megalin shedding and RIP in
the presence of TGF-β, plasma membrane purification assays were done as described in the
previous section (Refer to “Complete subcellular fractionation”). In this case, RLE-6TN cells
were treated with TGF-β for 10 hours instead of 30 minutes and the WH fraction was
additionally centrifuged at 100.000 x g for 30 minutes to remove remaining plasma membrane
and nuclei (Cytoplasmic fraction).
2.1.27. In silico analysis of megalin c-terminal tail ubiquitination
Megalin c-terminal tail was analyzed with the PPSP prediction program (Computational
Prediction of Protein Ubiquitination Sites with a Bayesian Discriminant Method) to find out
potential ubiquitination sites [145].
The sequence analyzed contained the last 209 aminoacids of megalin primary structure
(UniProtKB/Swiss-Prot: P98164.3).
2.1.28. Ubiquitinated proteins specific pulldown
Megalin ubiquitination enhanced by TGF-β was studied by pulldown of total poly-
ubiquitinated proteins with an ubiquitinated protein enrichment kit (Calbiochem, San Diego,
USA).
RLE-6TN cells were plated in 100 mm petri dishes 24 hours before the experiment to reach
90% confluency the next day. TGF-β treatment was performed as described before and cells
were rinsed 3 times with PBS with Ca++/Mg++ on ice, immediately after treatment. Cells were

Materials and methods
46
lysed with IP buffer plus NEM, scrapped and centrifuged at full speed x g for 10 minutes at
4°C to remove debris. Proteins from the supernatant were quantified and 2 mg of total
homogenate were rotated overnight at 4°C with 80 ul of poly-ubiquitin affinity beads
(provided with the kit) or control beads (provided with the kit). Beads were then washed 5
times with IP buffer plus NEM and resuspended in Laemmli buffer for protein
denaturalization. Total poly-ubiquitinated proteins were separated in 4 to 16% gradient gel
and specific antibodies to detect megalin were employed.
IP buffer
20 mM HEPES pH 7,4
150 mM NaCl
0,50% NP-40
2 mM EDTA
2 Mm EGTA
5% Glycerol
Protease inhibitor
2.1.29. Co-immunoprecipitation of proteins from enriched plasma membrane fraction
In order to study protein-protein physical interactions at the plasma membrane, co-
immunoprecipitation (co-IP) of cell surface proteins was performed from a fraction enriched
in plasma membrane.
RLE-6TN cells were plated in 100 mm petri dishes 24 hours before the experiment to reach
90% confluency the next day. TGF-β treatment was performed as described above and cells
were rinsed 3 times with PBS with Ca++/Mg++ on ice, immediately after treatment. Whole
cells lysates were obtained with HB buffer (Refer to “Complete subcellular fractionation”
section) and subsequent scrapping. Whole cell homogenates were passed through 18 gauge-
needle syringe and centrifuged at 9800 x g for 10 minutes. The pellet was resuspended in IP
buffer, passed through 26 gauge-needle syringe and kept on ice for 10 minutes to isolate
plasma membrane proteins from this fraction. The homogenate was then centrifuged at full
speed for 15 minutes in a benchtop centrifuge. Proteins in the supernatant were quantified by
Bradford and 1,5 to 2 mg of plasma membrane proteins were rotated at 14 rpm for 2 hours at
4°C with A/G protein agarose beads (Santa Cruz, Dallas, Texas, USA) in IP buffer to remove
unspecific bindings. Beads were then pulled down by centrifugation at 5000 x g for 5 minutes
and supernatants were incubated overnight with specific antibodies for megalin, MMP-2,
MMP-14 or anti-rabbit IgG negative control at 4°C with rotation. After incubation, 90 ul of
A/G protein agarose beads were added to the samples and rotated for 3 hours at 4°C. Beads

Materials and methods
47
were washed 5 times for 10 minutes with IP buffer and pulled down proteins were
denaturalized in Laemmli buffer at 65°C for 30 minutes. Protein resolution was done by SDS-
PAGE in 4 to 10% gradient gels and detection was performed with specific antibodies for
each of the mentioned proteins.
2.1.30. Zymography
Because TGF-β could be regulating MMP-2 and MMP-9 proteolytic activities, aliquots of the
SNs collected before were analyzed by in gel zymography. This protocol was adapted from
Toth and Fridman (Methods Mol Med, 2001).
5 to 10 ug of total proteins from SNs were mixed with non-denaturing Laemmli buffer and
incubated at room temperature for 15 minutes. Samples were loaded in 10% acrylamide gels
containing 0,1% of gelatin from porcine skin (Sigma, St. Luis, USA) and run at 125 V for 1,5
hours. After separating the proteins, gels were washed with 100 ml of renaturing solution for
30 minutes with gentle agitation. Solution was removed and gels were then washed 3 times
with distilled water prior to the incubation with 100 ml of developing buffer for 30 minutes at
room temperature. Developing buffer was replaced by 100 ml of fresh buffer and gels were
incubated for 20 hours at 37°C to allow digestion. The next day, gels were stained for 2 hours
with staining solution and washed with destaining solution till gelatinolytic areas appear as
clear sharp bands. Gels were finally scanned with the Molecular Imager ChemiDoc XRS+
(BioRad, Hercules, CA, USA).
Renaturing solution
Staining solution
2,5% Triton X-100
0,5% Coomassie blue
Distilled water
5% Methanol
10% Acetic acid
Distilled water
Developing buffer
Destaining solution
50 mM Tris-HCl pH 7,8
10% Methanol
0,2 M NaCl
5% Acetic acid
5 mM CaCl2
Distilled water
0,02% Brij 35 (Santa Cruz, Dallas, Texas, USA)
2.1.31. FITC-albumin binding and uptake
Megalin functionality was measured by in vitro binding and uptake of FITC-albumin. This
protocol was adapted from Yumoto R et al (AM J Physiol Lung Cell Mol Phhysiol, 2006).
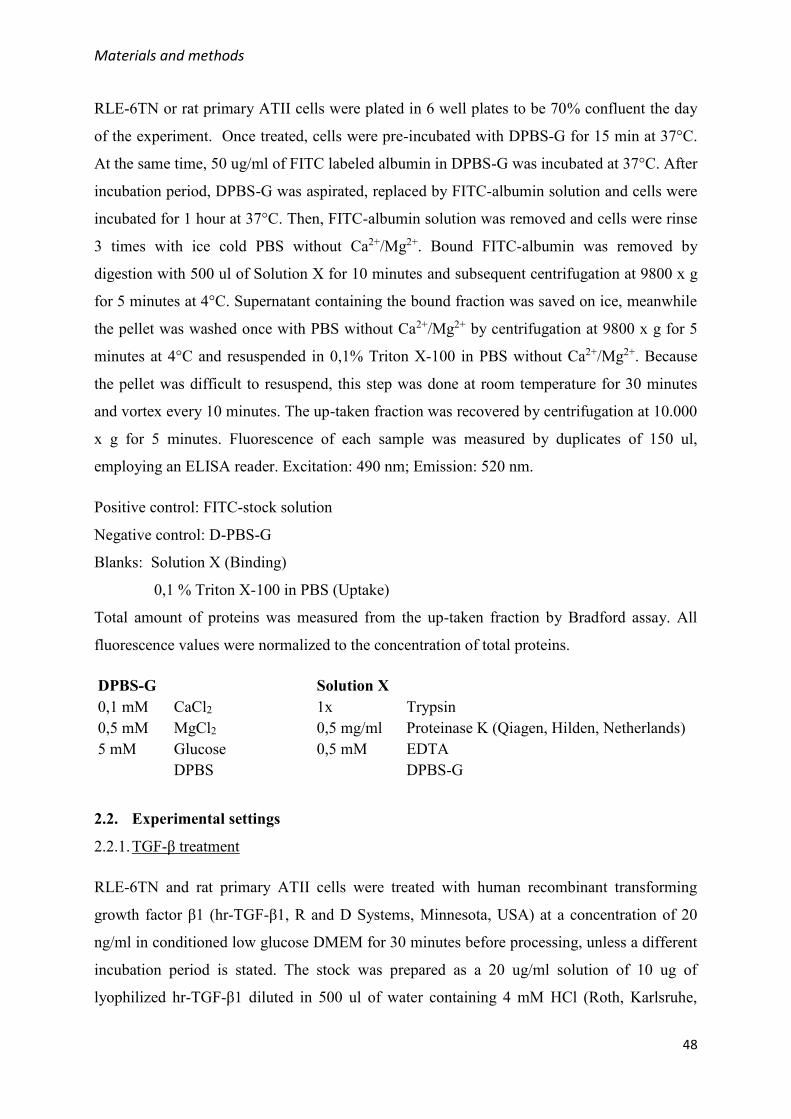
Materials and methods
48
RLE-6TN or rat primary ATII cells were plated in 6 well plates to be 70% confluent the day
of the experiment. Once treated, cells were pre-incubated with DPBS-G for 15 min at 37°C.
At the same time, 50 ug/ml of FITC labeled albumin in DPBS-G was incubated at 37°C. After
incubation period, DPBS-G was aspirated, replaced by FITC-albumin solution and cells were
incubated for 1 hour at 37°C. Then, FITC-albumin solution was removed and cells were rinse
3 times with ice cold PBS without Ca2+/Mg2+. Bound FITC-albumin was removed by
digestion with 500 ul of Solution X for 10 minutes and subsequent centrifugation at 9800 x g
for 5 minutes at 4°C. Supernatant containing the bound fraction was saved on ice, meanwhile
the pellet was washed once with PBS without Ca2+/Mg2+ by centrifugation at 9800 x g for 5
minutes at 4°C and resuspended in 0,1% Triton X-100 in PBS without Ca2+/Mg2+. Because
the pellet was difficult to resuspend, this step was done at room temperature for 30 minutes
and vortex every 10 minutes. The up-taken fraction was recovered by centrifugation at 10.000
x g for 5 minutes. Fluorescence of each sample was measured by duplicates of 150 ul,
employing an ELISA reader. Excitation: 490 nm; Emission: 520 nm.
Positive control: FITC-stock solution
Negative control: D-PBS-G
Blanks: Solution X (Binding)
0,1 % Triton X-100 in PBS (Uptake)
Total amount of proteins was measured from the up-taken fraction by Bradford assay. All
fluorescence values were normalized to the concentration of total proteins.
DPBS-G
Solution X
0,1 mM CaCl2
1x Trypsin
0,5 mM MgCl2
0,5 mg/ml Proteinase K (Qiagen, Hilden, Netherlands)
5 mM Glucose
0,5 mM EDTA
DPBS
DPBS-G
2.2. Experimental settings
2.2.1. TGF-β treatment
RLE-6TN and rat primary ATII cells were treated with human recombinant transforming
growth factor β1 (hr-TGF-β1, R and D Systems, Minnesota, USA) at a concentration of 20
ng/ml in conditioned low glucose DMEM for 30 minutes before processing, unless a different
incubation period is stated. The stock was prepared as a 20 ug/ml solution of 10 ug of
lyophilized hr-TGF-β1 diluted in 500 ul of water containing 4 mM HCl (Roth, Karlsruhe,

Materials and methods
49
Germany) and 1 mg/ml BSA (PAA Laboratories, Egelsbach, Germany), aliquoted and stored
at -20°C.
2.2.2. Megalin turnover analysis
To analyze the effect of TGF-β on megalin half-life at plasma membrane, turnover
experiments of cell surface megalin were performed. This procedure was based on pre-
labelling of megalin at the cell surface by biotinylation, treatment with TGF-β during different
time points and detection of megalin cell surface amount after streptavidin pulldown.
RLE-6TN cells were plated in 60 mm petri dishes 24 hours before the experiment to reach
70% confluency the next day. Immediately before treatment, cells were rinsed 3 times with
PBS with Ca++/Mg++on ice and pre-labelled with a solution of EZ-link NHS-LC-biotin 1
mg/ml in PBS with Ca++/Mg++ for 20 minutes at 37°C. After incubation, cells were washed 3
times for 10 minutes with 100 mM glycine in PBS with Ca++/Mg++ and one time with PBS
with Ca++/Mg++ only. Once total cell-surface proteins were pre-labelled, cells were incubated
with TGF-β 20 ng/ml at 37°C during different time points from 0 to 24 hours. At the end of
each time point, cells were washed times with PBS with Ca++/Mg++ on ice, lysed with mRIPA
buffer and centrifuged at full speed for 10 minutes 4°C. Whole cell homogenates were kept at
4°C till the end of the entire experiment and quantified by Bradford. 100 to 200 ug of total
proteins were prepared for streptavidin pulldown with 60 to 80 ul of streptavidin beads.
Samples were rotated overnight at 4°C and washed as describe above (Refer to “Cell surface
proteins biotinylation” section). Pulled down proteins were denaturalized, separated by SDS-
PAGE in 4 to 16% gradient gels and specific antibodies against megalin were used for
detection. Due to the fact that it was hard to find a plasma membrane protein with a longer
half-life than megalin and not affected by TGF-β, Coomassie blue staining of the pulled down
fraction was used as loading control.
Prior to any calculation, megalin cell surface abundance at each time point was normalized
respect to the cero point (“0h”) from each condition. Thus, time points from control and TGF-
β treatment were considered independent from each other (between conditions). To evaluate
the effect of TGF-β on cell surface megalin degradation, the average amount of megalin was
calculated at each time point, for control and treated conditions. With all these data points, an
average time course was built for each condition and linear regression was applied to obtain
the absolute value of the slope of each time course. Thus, to determine TGF-β effect we
consider that, the biggest the value of the slope, the faster is the degradation of cell surface

Materials and methods
50
megalin. At the same time, average cell surface megalin half-life was calculated by
interpolation into the equations obtained by linear regression from the time courses of each
experiment.
2.2.3. Megalin turnover inhibition
To investigate if the ubiquitin-proteasome system was implicated in TGF-β-induced megalin
degradation, cell surface megalin turnover experiments were repeated in presence or absence
of proteasome or lysosome inhibitors.
RLE-6TN cells were plated as before and pre-treated with 10 uM of MG-132 (Sigma, St.
Luis, USA), 100 uM of chloroquine or vehicle in conditioned low glucose DMEM for 4 hours
at 37°C in order to inhibit the proteasome or the lysosome, respectively. After the incubation
period, cell surface proteins were pre-labelled with biotins as explained above and treated
with TGF-β in combination with the inhibitors for 13 hours. Samples were then lysed with
mRIPA, quantified and incubated overnight with streptavidin beads. After washing, pulled
down proteins were denaturalized, separated by SDS-PAGE in 4 to 16% gradient gels and
specific antibodies against megalin were used for detection. Coomassie brilliant blue staining
was used as loading control.
2.2.4. PKC activity inhibition
To determine which possible molecular mechanisms were regulated by TGF-β to induced
megalin shedding, chemical inhibition of PKC activity and subsequent detection of MCTF at
different time points were performed.
RLE-6TN cells at passages 10 to 13 were plated in 60 mm petri dishes 24 hours before the
experiment to reach 80% confluency the next day. Prior TGF-β treatment, cells were
incubated with 1,3 uM of PKC inhibitor, gö6976 (Calbiochem, San Diego, USA), or vehicle
for 1,5 hours in conditioned low glucose DMEM at 37°C. After pre-treatment, cells were
incubated with TGF-β in presence of the inhibitor from 0 to 4 hours. Plates were collected at
each time point, washed 3 times with cold PBS with Ca++/Mg++ and frozen till the end of the
experiment. Cells were lysed with IP buffer for 10 minutes on ice and scraped. Whole cell
homogenates were centrifuged at full speed for 10 minutes and quantified. Finally, proteins
were denaturalized in Laemmli buffer and separated by SDS-PAGE in 16% gels. Specific
antibodies for megalin c-terminal tail and β-actin were used for Western blot detection.

Materials and methods
51
It is important to note that gö6976 inhibitor was unstable in culture medium for more than 4
hours, as it was demonstrated in our preliminar experiments.
2.2.5. γ-secretase activity inhibition
In line with the previous experiments, the regulatory effect of TGF-β on γ-secretase activity
was tested following the same methodology. In this case, RLE-6TN cells were pre-treated
with 1 uM of γ-secretase activity inhibitor, Compound E (CE) (Calbiochem, San Diego,
USA), or vehicle for 1,5 hours in conditioned low glucose DMEM at 37°C. Due to the fact
that CE was stable in culture medium, after pre-treatment, cells were incubated with TGF-β in
presence of the inhibitor from 0 to 48 hours. For dection of MCTF, samples were processed
exactly the same way than before.
2.2.6. MCTF, MMP-2, -9 and -14 detection
To evaluate if TGF-β was responsible of enhancing megalin RIP and shedding, the amount of
megalin c-terminal fragment (MCTF), MMP-2, -9 and -14 were measured after treatment of
cells with TGF-β during different time points.
RLE-6TN cells at passages 10 to 13 were plated in 60 mm petri dishes 24 hours before the
experiment to reach 80% confluency the next day. Cells were then treated with TGF-β in
serum-free low glucose DMEM from 0 to 48 hours, collected at each time point and frozen
after 3 washings with PBS with Ca++/Mg++. Once all the plates were collected, cells were
lysed with IP buffer for 10 minutes on ice and scraped. Whole cell homogenates were
centrifuged at full speed for 10 minutes and quantified. Finally, proteins were denaturalized in
Laemmli buffer and separated by SDS-PAGE in 16% gels. Specific antibodies for megalin c-
terminal tail and β-actin were used for Western blot detection.
The amount of each protein (MMP-2, -9 or -14) at each time point was normalized to the cero
point (“0h”) from each condition. Thus, time points from control and TGF-β treatment were
considered independent from each other (between conditions).
2.2.7. MMP-2 and MMP-9 specific ELISA
To measure the amount of matrix-metalloproteases (MMP) 2 and 9 in cell culture
supernatants a specific ELISA kit (R and D Systems, Minneapolis, USA) for each of these
enzymes was employed.

Materials and methods
52
Supernatants (SNs) were collected from the same experiments where the abundance MCTF,
MMP-2, -9 and -14 was measured from whole cell homogenates (Refer to the previous
section). Immediately after collection, SNs were centrifuged at full speed for 10 minutes in a
Rotina 46 R centrifuge (Hettich, Germany), to remove debris, and frozen. Before the ELISA,
SNs were concentrated from 5 ml to 500-300 ul by centrifugation at full speed in 6 ml
Vivaspin concentrators (Sartorius, Göttingen, Germany), total proteins were quantified and
SN were aliquoted in equal volumes.
ELISA procedures were done following the manufacturer instructions. Briefly, reactives,
standards and samples were prepared as recommended before starting. 50 ul of standards and
undiluted samples were added in duplicates to the pre-coated 96 well plate (provided with the
kits) and incubated for 2 hours at room temperature plus shaking at 500 rpm. Then, the
content of each well was aspirated and washed 4 times with washing buffer (provided with the
kits), before adding total MMP-2 or MMP-9 conjugate (provided with the kits) to each well.
The plate was incubated for another 2 hours in the same conditions than before, washed and
incubated for 30 minutes with substrate solution (provided with the kits), on the benchtop and
protected from light. Stop solution (provided with the kit) was then added and optical density
was determined by Infinite M200 ELISA reader (TECAN, Männedorf, Switzerland) at 450
nm. Wavelength correction was done by subtracting readings at 540 nm from the readings at
450 nm.
MMP-2 and -9 concentrations were calculated by interpolation of the absorbance readings of
each sample into the equation of the standard curve built, in each case, with the standards
provided with the kits. Concentration values in ng/ml of MMP-2 or -9 were normalized to the
concentration values of total proteins in the SN.
2.2.8. Megalin ectodomain specific ELISA
To prove that TGF-β was able to regulate megalin shedding, the abundance of megalin
ectodomain in cell culture SNs was measured by specific ELISA kit from LSBio (Seattle,
USA). Aliquots from the SNs collected before were used.
ELISA procedures were done following the manufacturer instructions. Briefly, reactives,
standards and samples were prepared as recommended before starting. 100 ul of standards and
1:20 diluted samples were added in duplicates to the pre-coated 96 well plate (provided with
the kit) and incubated for 1 hour at 37°C plus shaking at 500 rpm. Then, the content of each

Materials and methods
53
well was aspirated and reagent A (provided with the kits) was added to each well. The plate
was incubated for 1 hour in the same conditions than before, washed 3 times with washing
buffer (provided with the kit) and incubated for 1 hour with reagent B (provided with the
kits). Washings were repeated and wells were incubated with substrate solution for 30 minute
at 37°C on the benchtop, protected from light. Stop solution (provided with the kit) was then
added and optical density was determined by Infinite M200 ELISA reader (TECAN,
Männedorf, Switzerland) at 450 nm. Wavelength correction was done by subtracting readings
at 540 nm from the readings at 450 nm.
Concentration of megalin ectodomain in SNs was calculated as explained before and
normalized to total proteins concentration.
2.2.9. MICD treatment
To compare the effects of megalin intracellular domain (MICD) and TGF-β on megalin cell
surface abundance and functionality, RLE-6TN cells were treated with a synthetic version of
MICD peptide (Biomatik, Ontario, Canada) during passages 10 to 13 for optimal response.
RLE-6TN or rat primary ATII cells were plated in 60 mm petri dishes or 6 well plates to be
70% confluent the next day. Treatment with MICD peptide was done 24 hours after seeding
of cells, employing a peptide delivery reagent (PULSin, Polyplus, Illkirch, France) and with
the following reaction mix:
Reagents Volume (ul)/ 60 mm Volume (ul)/ well (6 well plate)
20 mM HEPES 200 150
MICD peptide (1,2 ug/ul) 3 (3,8 ug) 2 (2,4 ug)
PULSin 14,4 10
Table XII. Reaction mix for MICD treatment.
Before treatment, MICD was diluted in HEPES buffer prior to the addition of the
corresponding volume of PULSin. The reaction mix was incubated at room temperature for
15 minutes to allow the formation of MICD-PULSin complexes. These complexes were then
added on top of the cells cultured in serum- and antibiotics-free low glucose DMEM and
incubated at 37°C for 4 hours. After the incubation period, cells were treated with TGF-β in
fresh conditioned low glucose DMEM for 10 hours and processed. The potential effect of the
delivery reagent on cellular responses to TGF-β was evaluated and no significant changes
were observed.

Materials and methods
54
2.3. Statistical analysis
In all the cases, results were plotted as mean ± standard error of the mean (SEM). For
statistical analysis and plotting of the data, GraphPad Prism 5 for Windows software was
employed. Comparisons between two groups were done by paired (matched samples) or
unpaired (independent samples), two-tailed Student´s t-test. Control and TGF-β treated
samples were consider to be matched to each other when coming from the same cellular
passage and when handled simultaneously and in pairs along the experiment. In this case,
TGF-β effect is shown as relative to the control group. On the other hand, control and TGF-β
treated samples were considered to be independent when, even if coming from the same
cellular passage, each control and TGF-β treated sample needed to been normalized to an
internal control of each data set (usually, “0h”) before normalizing the treated group relative
to the control group. Comparisons between more than two groups were done by One- or Two-
way ANOVA and Tukey's or Sidak´s multiple comparisons, or Dunnett´s multiple
comparisons when means were compared to the same control group. Statistical significance
was defined as *p<0,05; **p<0,01; ***p<0,001; ****p<0,0001.

Results
55
3. Results
3.1. Short term effect of TGF-β on megalin cell surface stability
3.1.1. TGF-β reduces megalin cell surface abundance
Because high concentrations of TGF-β impair megalin function in the kidney [51], [52], we
hypothesized that similar effects may be found in the lung where TGF-β expression is
upregulated under pathological conditions like ARDS. To answer this question, rat alveolar
epithelial cells were treated with TGF-β (20 ng/ml for 30 minutes) and megalin cell surface
abundance was measured by streptavidin pull-down of cell surface biotinylated proteins and
immunoblotting, as described in the Materials and methods section. We observed a significant
decrease in megalin abundance at the plasma membrane after treatment with TGF-β, in both
RLE-6TN and primary rat ATII cells (Figure 13A and 13B). These results were confirmed by
immunofluorescence and confocal microscopy where translocation of megalin towards the
cytoplasm was observed (Figure 14A and 14B). Unspecific staining was tested by naïve
mouse or rabbit IgG as shown in isotype controls (Figure 15A and 15B).
Figure 13. TGF-β impairs megalin cell surface stability. RLE-6TN (A) or primary rat ATII cells
(B) were treated with TGF-β (20 ng/ml) for 30 minutes. Megalin cell surface abundance was measured
by biotin-streptavidin pulldown (PD) followed by IB. Representative blots are shown. Results were
plotted as mean ± SEM. A: Paired t-test, *p<0,05; n=4; B: Paired t-test, *p<0,05; n=4.
* *
A
75
C TGF-β
IB: megalin
IB: tfr
PD
Input
IB: megalin
100
600
600
C TGF-β
IB: megalin
IB: tfr
PD
Input
IB: megalin
100 75
600
600
B
MW (kDa) MW (kDa)

Results
56
Figure 14. TGF-β impairs megalin cell surface stability. Megalin cell surface localization was also
assessed by immunofluorescence and confocal microscopy in RLE-6TN (A) and primary rat ATII
cells (B). Green: megalin, red: F-actin, blue: DAPI. Scale bar = 20 μm.
Control TGF-β A
Control TGF-β B

Results
57
Figure 15. TGF-β impairs megalin cell surface stability. A. Rabbit and mouse IgG controls in RLE
cells. B. Rabbit and mouse IgG controls in ATII primary cells.
Internalization of certain protein receptors requires activation of signaling pathways that
induce phosphorylation and subsequent endocytosis. Our group and others have previously
shown that megalin c-terminal tail is specifically phosphorylated by GSK-3β at the PPPSP
motif [75], which can be regulated by TGF-β, thereby impairing megalin function
(Vohwinckel et al, under revision). We then set out to investigate if the serine (Ser) of this
particular motif was critical for megalin endocytosis by replacing it for alanine (Ala), a
constitutively unphosphorylated residue. For this purpose, a plasmid containing a GFP-fusion
protein consisting of the megalin transmembrane domain plus the c-terminal tail tagged with
GFP was used (Figure 16A). Point mutations were performed by SDM and plasmids were
transfected separately into RLE-6TN or primary ATII cells. Cells were treated with TGF-β
(20 ng/ml for 30 min) and biotin-streptavidin pulldown assays were performed to assess
Rabbit IgG
Alexa 488 DAPI Merge
Mouse IgG
Alexa 594
A
Rabbit IgG
Alexa 488 DAPI Merge
Alexa 594
Mouse IgG
B

Results
58
megalin cell surface abundance. Mutation of serine at PPPSP motif prevented megalin
endocytosis in both cell types as it is shown in figures 16B and 17. Similar results have been
obtained by other groups, which will be discussed in detail in the following section.
Figure 16. Megalin internalization induced by TGF-β requires phosphorylation of the receptor
c-terminal. A. Schematic representation of Gfp-TM-Megalin construct containing megalin
transmembrane and cytosolic domains fused to GFP. B. RLE-6TN were transfected with the construct
depicted in A containing a point mutation at the PPPSP motif replacing S by A. 24 hours later cells
were treated with TGF-β (20 ng/ml) for 30 minutes. Biotin-streptavidin pulldown (PD) of cell surface
proteins was performed followed by IB. Representative blots are shown. Results were plotted as mean
± SEM. B: Paired t-test, *p<0,05; n=4, C: Paired t-test, *p<0,05; n=4. EV: empty vector.
HA Megalin Tm GFP
A
*
B
37
C TGF-β
IB: GFP-TM-megalin
IB: GFP-TM-megalin
PD
Input
IB: β-actin
50
50
50
WT C TGF-β
IB: GFP-TM-megalin
IB: GFP-TM-megalin
PD
Input
IB: β-actin
50
50
50
PPPAP
37
C TGF-β C TGF-β
PD Input EV
IB: GFP-TM-megalin
IB: β-actin
MW (kDa) MW (kDa)
37
50
50
MW (kDa)
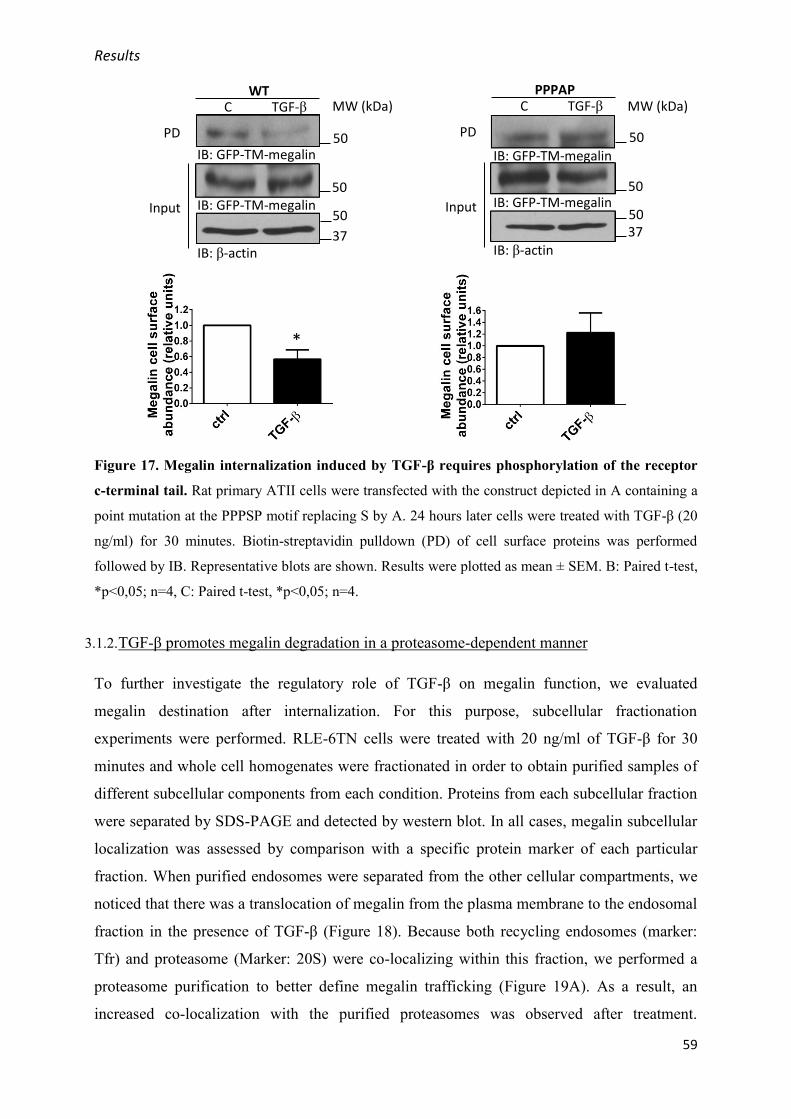
Results
59
Figure 17. Megalin internalization induced by TGF-β requires phosphorylation of the receptor
c-terminal tail. Rat primary ATII cells were transfected with the construct depicted in A containing a
point mutation at the PPPSP motif replacing S by A. 24 hours later cells were treated with TGF-β (20
ng/ml) for 30 minutes. Biotin-streptavidin pulldown (PD) of cell surface proteins was performed
followed by IB. Representative blots are shown. Results were plotted as mean ± SEM. B: Paired t-test,
*p<0,05; n=4, C: Paired t-test, *p<0,05; n=4.
3.1.2. TGF-β promotes megalin degradation in a proteasome-dependent manner
To further investigate the regulatory role of TGF-β on megalin function, we evaluated
megalin destination after internalization. For this purpose, subcellular fractionation
experiments were performed. RLE-6TN cells were treated with 20 ng/ml of TGF-β for 30
minutes and whole cell homogenates were fractionated in order to obtain purified samples of
different subcellular components from each condition. Proteins from each subcellular fraction
were separated by SDS-PAGE and detected by western blot. In all cases, megalin subcellular
localization was assessed by comparison with a specific protein marker of each particular
fraction. When purified endosomes were separated from the other cellular compartments, we
noticed that there was a translocation of megalin from the plasma membrane to the endosomal
fraction in the presence of TGF-β (Figure 18). Because both recycling endosomes (marker:
Tfr) and proteasome (Marker: 20S) were co-localizing within this fraction, we performed a
proteasome purification to better define megalin trafficking (Figure 19A). As a result, an
increased co-localization with the purified proteasomes was observed after treatment.
*
C TGF-β
IB: GFP-TM-megalin
IB: GFP-TM-megalin
PD
Input
IB: β-actin
50
50
50
WT
37
MW (kDa) C TGF-β
IB: GFP-TM-megalin
IB: GFP-TM-megalin
PD
Input
IB: β-actin
50
50
50
PPPAP
37
MW (kDa)

Results
60
Consistently with the previous results, megalin was almost absent in the purified lysosomal
fraction under treated conditions; however, it was detected in the absence of TGF-β (control
group; Figure 19B). This may be explained by the fact that endocytic receptors, such as
megalin are internalized together with the ligand and fused to lysosomes for degradation,
unless recycled back to the plasma membrane.
Figure 18. TGF-β induces megalin translocation to the endosomal fraction where it co-localizes
with the proteasome. RLE-6TN cells were treated with TGF-β (20 ng/ml) for 30 minutes and cell
homogenates (A) were fractionated by isopycnic centrifugation in sucrose and Nycodenz (endosomal
purification) gradients. Fractions were processed by SDS-PAGE in 4-16% gradient gels followed by
IB. Total proteins were stained by Coomassie. Representative blots are shown in all the cases. N=4.
WH: whole homogenate, PM: purified plasma membrane, CE: crude endosomes, E: purified
endosomes, N: nuclear fraction.
Generally, proteins that are translocated to the proteasome will be degraded [90], [94]. Thus,
in order to confirm that TGF-β induces megalin endocytosis and subsequent translocation to
the proteasome, we tested whether or not cell surface megalin half-life was affected by TGF-β
by turnover experiments. Briefly, cell surface megalin was pre-labelled in RLE-6TN cells
with biotin for 20 minutes and washed as described in the Materials and methods section.
Immediately after, cells were incubated with TGF-β (20 ng/ml from 0 to 24 hours) and whole
cell lysates were collected at the different time points. Cell surface proteins were pulled down
WH PM CE E N WH PM CE E N ctrl TGF-β
IB: 20 S
IB: Na/K ATPase
IB: megalin
IB: fibrillarin
IB: tfr
IB: Rab 11/Rab 35
IB: LAMP-2
Coomassie
600
75 100
50 75
25 37
25
25
100
MW (kDa)

Results
61
with streptavidin-conjugated beads overnight, separated by SDS-PAGE and blotted. As
shown in figures 20A and 20B, megalin turnover was faster after treatment with TGF-β
(higher absolute value of the slope) and cell surface megalin half-life was reduced from 16 to
13 hours.
Figure 19. TGF-β induces megalin translocation to the proteasomal fraction. RLE-6TN cells were
treated with TGF-β (20 ng/ml) for 30 minutes. Proteasomal (B) and lysosomal (C) fractions were
purified by differential centrifugation from RLE-6TN cell homogenates after treatment. Fractions were
processed by SDS-PAGE in 4-16% gradient gels followed by IB. Total proteins were stained by
Coomassie. Representative blots are shown in all the cases. N=4. WH: whole homogenate, CM: crude
membrane fraction, Prot: purified proteasomal fraction, SN1: supernatant 1, Lys: purified lysosomal
fraction.
We then evaluated if megalin degradation was specifically dependent on the ubiquitin-
proteasome system by pre-treatment of cells with MG-132 (proteasome inhibitor) or
chloroquine (lysosome inhibitor) for 4 hours prior to pre-labelling of cell surface proteins; and
together with TGF-β for another 13 hours, after pre-labelling with biotin (Figure 21). We
observed that inhibition of the proteasome but not the lysosome prevented TGF-β-induced
degradation of megalin. Of note, treatment of the cells with MG-132 significantly reduced the
basal levels of megalin at the plasma membrane (DMSO control), probably due to the fact
that inhibition of the proteasome also impairs proteins trafficking. This point will be further
discussed in the Discussion section.
100
25
A B
ctrl TGF-β WH CM Prot WH CM Prot
600
25 25
100 150
25 37
100
150
IB: megalin
IB: 20 S
IB: Rab 11
IB: Na/K ATPase
IB: fibrillarin
IB: LAMP-2
Coomassie
MW (kDa)
ctrl TGF-β WH SN1 Lys WH SN1 Lys
600
25
100
25
75
IB: Cathepsin B (active form)
IB: megalin
IB: LAMP-2
IB: fibrillarin/ 20S
IB: Na/K ATPase
IB: Rab 11
Coomassie
MW (kDa)

Results
62
Figure 20: TGF-β reduces megalin half-life by increasing the receptor turnover. A. Cell surface
megalin degradation was assessed in RLE-6TN cells by pre-labelling with biotin prior treatment with
TGF-β (20 ng/ml) and subsequent streptavidin pulldown (PD) at different time points. B. Linear
regression was applied to the average time course obtained in each condition. Cell surface megalin
half-life was calculated by interpolation into the equations obtained by linear regression from each
experiment. Results were plotted as mean ± SEM. Unpaired t-test, *p<0,05; **p<0.01, n=6. Total
proteins were stained by Coomassie. Representative blots are shown.
**
A
0 8 10 13 16 18 20 22 24
0 8 10 13 16 18 20 22 24
Control
TGF-β
IB: megalin
Coomassie
IB: megalin
Coomassie
600
600
MW (kDa) Time(h)
PD
PD
B
* * * * * * *

Results
63
Figure 21: TGF-β reduces megalin half-lif e by promoting its degradation into the proteasome.
RLE-6TN cells were pre-treated with MG-132 (10 uM) or chloroquine (100 uM) for 4 hours (h) in
order to inhibit the proteasome or the lysosome, respectively. Immediately after pre-labelling with
biotins, cells were treated with TGF-β (20 ng/ml) for 13h in presence of the inhibitors and precipitated
with streptavidin beads. Results are plotted as mean ± SEM. Two-way ANOVA and Sidak´s multiple
comparisons, **p<0,01; ***p<0,001; ****p<0,0001; n=6. Total proteins were stained by Coomassie.
Representative blots are shown. C: Control. L.exp.: longer exposition.
Taken together, these findings suggest that TGF-β promotes megalin endocytosis and
translocation into the proteasome for subsequent degradation.
3.1.3. TGF-β enhances megalin c-terminal tail ubiquitination
Degradation in the proteasome requires post-translational modifications that consist of a
covalent binding of 8.5 kDa ubiquitin proteins to specific lysine (K) residues in the primary
structure of proteins [88]–[90]. Because we have already proven that TGF-β induces megalin
*** **
****
ns
**
C TGF-β DMSO MG132 Cloroquine
C TGF-β C TGF-β
IB: megalin
600 PD
MW (kDa)
L. exp.
Coomassie
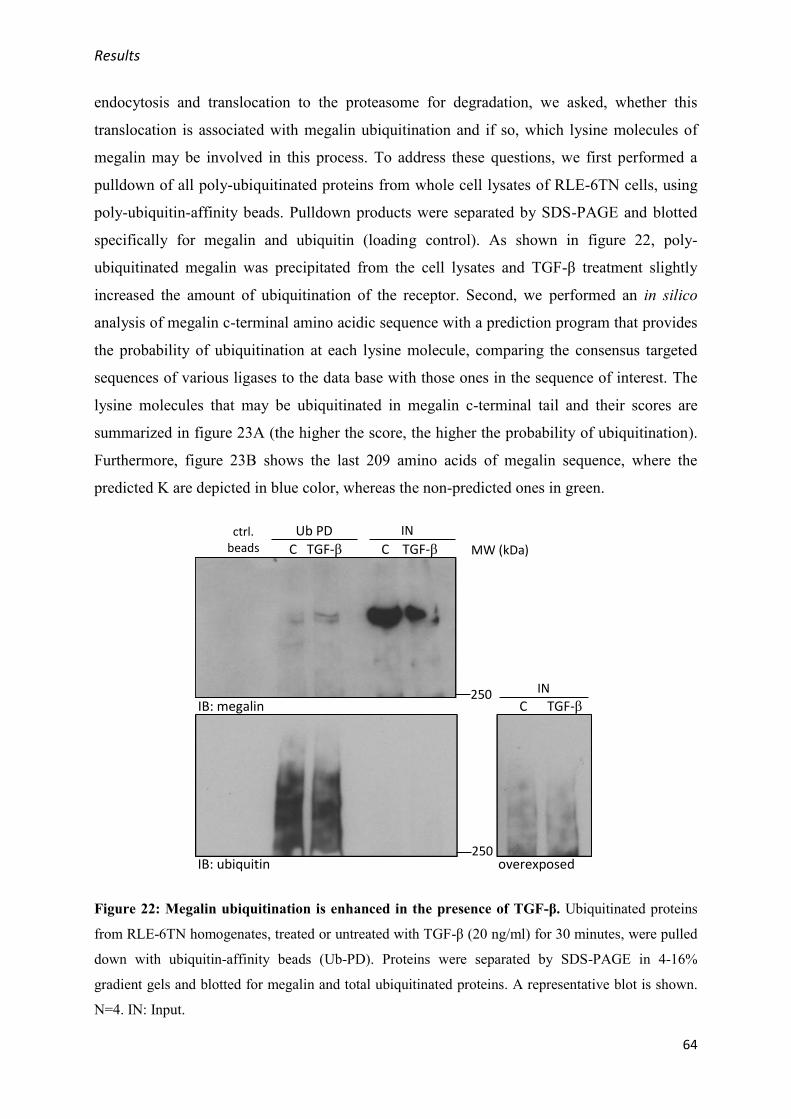
Results
64
endocytosis and translocation to the proteasome for degradation, we asked, whether this
translocation is associated with megalin ubiquitination and if so, which lysine molecules of
megalin may be involved in this process. To address these questions, we first performed a
pulldown of all poly-ubiquitinated proteins from whole cell lysates of RLE-6TN cells, using
poly-ubiquitin-affinity beads. Pulldown products were separated by SDS-PAGE and blotted
specifically for megalin and ubiquitin (loading control). As shown in figure 22, poly-
ubiquitinated megalin was precipitated from the cell lysates and TGF-β treatment slightly
increased the amount of ubiquitination of the receptor. Second, we performed an in silico
analysis of megalin c-terminal amino acidic sequence with a prediction program that provides
the probability of ubiquitination at each lysine molecule, comparing the consensus targeted
sequences of various ligases to the data base with those ones in the sequence of interest. The
lysine molecules that may be ubiquitinated in megalin c-terminal tail and their scores are
summarized in figure 23A (the higher the score, the higher the probability of ubiquitination).
Furthermore, figure 23B shows the last 209 amino acids of megalin sequence, where the
predicted K are depicted in blue color, whereas the non-predicted ones in green.
Figure 22: Megalin ubiquitination is enhanced in the presence of TGF-β. Ubiquitinated proteins
from RLE-6TN homogenates, treated or untreated with TGF-β (20 ng/ml) for 30 minutes, were pulled
down with ubiquitin-affinity beads (Ub-PD). Proteins were separated by SDS-PAGE in 4-16%
gradient gels and blotted for megalin and total ubiquitinated proteins. A representative blot is shown.
N=4. IN: Input.
Ub PD IN ctrl. beads
IB: megalin
IB: ubiquitin
C TGF-β C TGF-β
IN
C TGF-β
overexposed
250
250
MW (kDa)

Results
65
Figure 23: Megalin c-terminal tail contains few lysine residues that can potentially be
ubiquitinated. A. In silico prediction of the lysines on megalin c-terminus that can potentially be
ubiquitinated (in red). Scores were calculated by PPSP prediction program (Computational Prediction
of Protein Ubiquitination Sites with a Bayesian Discriminant Method). C. Amino acidic sequence of
megalin c-terminal tail. In blue: predicted lysines (K), in green: unpredicted lysines and in red: GSK-
3β phosphorylation site.
In order to study which of the predicted lysines were required for megalin ubiquitination and
to understand if the ubiquitination of any of them was regulated by TGF-β, ubiquitin-
pulldown experiments were performed using the above mentioned GFP-fused megalin
constructs, but in this case, containing individual point mutation to each of the predicted
lysines. Briefly, RLE-6TN cells were transfected with each of these plasmids and incubated
with TGF-β 20 ng/ml for 30 minutes, 24 hours after transfection. Whole cells lysates were
collected and incubated with poly-ubiquitin-affinity beads as described before. Protein
separation and blotting have shown that treatment with TGF-β increased the density of the
polyubiquitin smear over the 52 kDa band of wildtype (WT) GFP-fused megalin, suggesting
increased ubiquitination (Figure 24). This confirmed our previous results with the endogenous
megalin, where a higher amount of polyubiquitinated megalin was pulled down after TGF-β
treatment. Furthermore, we observed that several point mutations led to an alteration of the
ubiquitination pattern seen in the WT group. The most significant modifications occurred
after mutation of lysines 14, 23 and 88, where smears almost disappeared regardless of TGF-β
treatment, indicating that these lysines may be implicated in the steady-state of megalin
HYRRTGSLLPALPKLPSLSSLVKPSENGNGVTFRSGADLNMDIGVSGFGPETAIDRSMAMSEDFVMEMGKQPIIFENPMYSARDSAVKVVQPIQVTVSENVDNKNYGSPINPSEIVPETNPTSPAADGTQVTKWNLFKRKSKQTTNFENPIYAQMENEQKESVAATPPPSPSLPAKPKPPSRRDPTPTYSATEDTFKDTANLVKEDSEV
A
B

Results
66
and/or in priming events of ubiquitination after which ubiquitination of other lysines may
happen. In the case of mutation of lysines 197 and 204, TGF-β effect on megalin
ubiquitination appeared to be impaired compared to WT, however, mutation of lysines 138-
142 and 176-178 did not show any obvious alteration of the polyubiquitin pattern. Thus,
ubiquitination of lysines 197 and 204 on megalin c-terminal tail could be regulated by TGF-β
and be responsible of TGF-β-induced megalin degradation.
Figure 24. Megalin ubiquitination could be prevented by mutation of lysine residues at the c-
terminus. The construct depicted in figure 15A was used to individually mutate lysines on megalin c-
terminus to arginine (R) and the resulting mutants were then transfected into RLE-6TN cells. 24 hours
after transfection cells were treated with TGF-β (20 ng/ml) for 30 min and proteins from whole cell
homogenates were pulled down with ubiquitin-affinity beads (Ub-PD) and blotted for megalin and
total ubiquitinated proteins. A representative blot is shown. N=6. Blank (B) (pulldown from lysis
buffer) and (-) (pulldown with unspecific beads) were used as negative controls. C: control; T: TGF-β.
Even though it was possible to identify which lysines could be critical for megalin
ubiquitination under normal conditions (independently of TGF-β treatment), it was not that
easy to determine which ones were modified in response to TGF-β. For this reason, we further
studied the role of each K in TGF-β-induced megalin downregulation by measuring megalin
cell surface stability after mutation of these particular residues.
As previously described, RLE-6TN cells were transfected with plasmids containing point
mutations for each of the lysines mentioned before and treated with TGF-β 20 ng/ml for 30
minutes, 24 hours after transfection. GFP-fused megalin cell surface abundance was detected
WT
C T C T C T C T C T
K14R K23R K88R K197R K204R
K138-142R
K176-178R
C T C T C T (-) B
MW (kDa)
Ub-PD IB: GFP-TM-Megalin
IB: Ubiquitin
IB: β-actin
Input IB: GFP-TM-Megalin
50
50
50
37
75 100
150 250
75 100
150 250

Results
67
by biotin-streptavidin pulldown as it was already explained. Consistently with our previous
findings on endogenous megalin, TGF-β reduced GFP-fused megalin cell surface abundance,
which was prevented by mutation of lysines 14, 23, 197, 204, 176 and 178, but not by lysines
138 and 142 (Figure 24). Surprisingly, mutation of K 88 was unable to prevent the TGF-β-
induced endocytosis of GFP-fused megalin, even though we have shown before that it avoids
megalin ubiquitination independently of TGF-β treatment (Figure 25). In order to confirm our
results, these experiments were also performed in primary ATII cells (Figure 26), which
showed the same effects.
** ** *
Figure 25. Megalin cell
surface stability is enhanced
when c-terminal lysine
residues are mutated. RLE-
6TN cell were transfected with
plasmids containing mutated
lysines as described before. 24
hours later cells were treated
with TGF-β (20 ng/ml) for 30
min. and biotin-streptavidin
pulldown assay was performed.
Results were plotted as mean ±
SEM. Paired t-test, *p<0,05;
**p<0,01; n=8. Representative
blots are shown.
37
IB: GFP-TM-megalin
C TGF-β
IB: GFP-TM-megalin
PD
Input
IB: β-actin
50
50
50
WT
37
IB: GFP-TM-megalin
C TGF-β
IB: GFP-TM-megalin
PD
Input
IB: β-actin
50
50
50
K14R
37
IB: GFP-TM-megalin
C TGF-β
IB: GFP-TM-megalin
PD
Input
IB: β-actin
50
50
50
K23R
37
IB: GFP-TM-megalin
C TGF-β
IB: GFP-TM-megalin
PD
Input
IB: β-actin
50
50
50
K88R
37
IB: GFP-TM-megalin
C TGF-β
IB: GFP-TM-megalin
PD
Input
IB: β-actin
50
50
50
K197R
37
IB: GFP-TM-megalin
C TGF-β
IB: GFP-TM-megalin
PD
Input
IB: β-actin
50
50
50
K204R
37
IB: GFP-TM-megalin
C TGF-β
IB: GFP-TM-megalin
PD
Input
IB: β-actin
50
50
50
K138-142R
37
IB: GFP-TM-megalin
C TGF-β
IB: GFP-TM-megalin
PD
Input
IB: β-actin
50
50
50
K176-178R

Results
68
Figure 26. Megalin cell surface stability is enhanced when c-terminal lysine residues are
mutated. Primary ATII cell were transfected with plasmids containing mutated lysines as described
before. 24 hours later cells were treated with TGF-β (20 ng/ml) for 30 min. and biotin-streptavidin
pulldown assay was performed. Results were plotted as mean ± SEM. Paired t-test, *p<0,05;
**p<0,01; n=8. Representative blots are shown.
* * *
37
IB: GFP-TM-megalin
C TGF-β
IB: GFP-TM-megalin
PD
Input
IB: β-actin
50
50
50
WT
37
IB: GFP-TM-megalin
C TGF-β
IB: GFP-TM-megalin
PD
Input
IB: β-actin
50
50
50
K14R
37
IB: GFP-TM-megalin
C TGF-β
IB: GFP-TM-megalin
PD
Input
IB: β-actin
50
50
50
K23R
37
IB: GFP-TM-megalin
C TGF-β
IB: GFP-TM-megalin
PD
Input
IB: β-actin
50
50
50
K88R
37
IB: GFP-TM-megalin
C TGF-β
IB: GFP-TM-megalin
PD
Input
IB: β-actin
50
50
50
K197R
37
IB: GFP-TM-megalin
C TGF-β
IB: GFP-TM-megalin
PD
Input
IB: β-actin
50
50
50
K204R
37
IB: GFP-TM-megalin
C TGF-β
IB: GFP-TM-megalin
PD
Input
IB: β-actin
50
50
50
K138-142R
37
IB: GFP-TM-megalin
C TGF-β
IB: GFP-TM-megalin
PD
Input
IB: β-actin
50
50
50
K176-178R

Results
69
Altogether these findings suggest that TGF-β could be responsible for regulating poly-
ubiquitination of lysines 197 and 204, as mutation of these residues prevents both
ubiquitination and endocytosis of megalin. Lysines 14, 23 and 88 could be involved in
priming events of megalin ubiquitination, independently of TGF-β, which could be critical for
endocytosis and poly-ubiquitination for subsequent degradation.
3.2. Long term effect of TGF-β on megalin downregulation: shedding and intracellular
proteolysis
3.2.1. TGF-β reduces megalin gene expression by increasing the release of megalin
intracellular domain
It has been previously described that megalin expression can be regulated in a Notch-like
manner. Shortly, shedding of the megalin ectodomain in response to different stimuli initiates
a signaling cascade that activates γ-secretase activity of presenilin-1, promoting a second
event of proteolysis (RIP; regulated intramembrane proteolysis) that releases megalin
intracellular domain (MICD) into the cytoplasm. It was suggested that MICD may translocate
into the nucleus and specifically downregulate gene expression of megalin [70], [81], [82].
Thus, in order to find a connection between release of MICD and TGF-β we evaluated mRNA
expression of megalin after treatment with TGF-β 20 ng/ml for 24 or 48 hours. As shown in
figures 27 and 28, TGF-β treatment led to downregulation of megalin gene expression after
24 and 48 hours in both RLE-6TN and primary ATII cells.
Figure 27. TGF-β reduces megalin transcriptional expression after 24 and 48 hours of treatment.
Total RNA from RLE-6TN cells was isolated after TGF-β (20 ng/ml) treatment for 24 or 48 hours.
Real-time PCR was performed after cDNA preparation. Gapdh was used as housekeeping gene. ΔCt=
gapdhCt - megalinCt. Results were plotted as mean ± SEM. Paired t-test, *p<0,05; **p<0,01; n=7.
** *

Results
70
Figure 28. TGF-β reduces megalin transcriptional expression after 24 and 48 hours of treatment.
Total RNA from primary rat ATII cells was isolated after TGF-β (20 ng/ml) treatment for 24 or 48
hours. Real-time PCR was performed after cDNA preparation. Gapdh was used as housekeeping gene.
ΔCt= gapdhCt - megalinCt. Results were plotted as mean ± SEM. Paired t-test, *p<0,05; **p<0,01; n=7.
To further test the hypothesis that TGF-β may reduce megalin mRNA levels by promoting the
release of MICD, we measured the abundance of the MICD precursor, MCTF (megalin c-
terminal fragment), in whole cell homogenates from RLE-6TN cells. Detection of MICD is
not feasible due to its low abundance and fast degradation. Cells were treated with TGF-β
from 0 to 48 hours and cell lysates were obtained at different time points. We observed a
time-dependent regulation of MCTF abundance after TGF-β treatment that was characterized
by significant increase of the amount of the small protein from 4 to 24 hours, showing a
maximum between 8 and 12 hours after exposure to TGF-β (Figure 29).
Up to this point, we were able to prove that TGF-β was responsible for both downregulation
of megalin expression and higher release of megalin c-terminal fragment; however, a direct
connection between this to events was not yet demonstrated. Thus, we next aimed to prove
that megalin mRNA downregulation in the presence of TGF-β is indeed a consequence of an
enhanced release of MICD and translocation into the nucleus. For this purpose, we measured
gene expression of the sodium/proton exchanger channel (NHE3), which was described to be
a target of MICD, in presence or absence of TGF-β (20 ng/ml) or synthetic MICD (1,2 ug/ul),
for 24 hours. In figures 30A and 30B a marked reduction of megalin mRNA levels was seen
both in RLE-6TN and ATII cells when treated with TGF-β or synthetic MICD. In contrast,
the effect of treatment on NHE3 expression was less prominent, except for the MICD
treatment in RLE-6TN cells. Considering that synthetic MICD was added in excess and that it
targets the pathway much more downstream than TGF-β does, we next asked whether this
* *

Results
71
unexpected lack of effect of TGF-β on NHE3 gene expression was dependent on the time of
exposure. To answer this question we repeated the measurements after 48 hours instead of 24
and detected that in fact TGF-β significantly downregulates NHE3 expression in both cell
types after 48 hours of treatment (Figures 30C and 30D).
Figure 29. Megalin c-terminal fragment (MCTF) abundance is differentially regulated in the
presence of TGF-β. RLE-6TN cells were treated with TGF-β (20 ng/ml) during different time points
up to 48 hours. Whole cell homogenates were processed by SDS-PAGE in 16% gels and blotted.
Representative blots are shown. Results were plotted as mean ± SEM. One-way ANOVA and Tukey´s
multiple comparisons, *p<0,05; **p<0,01; ***p<0,001; n=6.
***
**
*
**
**
*
0 0.5 4 8 12 24 48 0 0.5 4 8 12 24 48
IB: megalin c-terminal fragment
IB: β-actin
TGF-β Control
37
37
MW (kDa) Time (h)

Results
72
Figure 30. TGF-β impairs both megalin and NHE3 mRNA expression by promoting megalin
intracellular domain (MICD) release into the cytoplasm. Cells were treated with MICD (1,2ug/ul)
or TGF-β (20ng/ml) and total RNA was isolated. Megalin and Nhe3 expression were measured by real
time-PCR with specific primers after reverse transcription. Results were plotted as mean ± SEM. A.
RLE-6TN cells treated for 24 hours. B. ATII cells treated for 24 hours. One-way ANOVA and
Dunnett´s multiple comparisons, *p<0,05; **p<0,01; n=5. C. Nhe3 expression measured from RLE-
6TN cells treated for 48 hours. D. Nhe3 expression measured from ATII cells treated for 48 hours.
Paired t-test, *p<0,05; n=5.
C D
**
* ***
* *
*
*
A
B

Results
73
Collectively, these results suggest that TGF-β may exert a long-term effect on megalin
downregulation by inducing the receptor c-terminal tail release into the cytoplasm and
subsequent translocation into the nucleus and thus inhibition of megalin and nhe3 gene
expression.
In order to further characterize the effects of MICD on megalin downregulation, we evaluated
the cell surface stability of megalin in the presence of this synthetic protein, compared with
TGF-β. RLE-6TN or ATII cells were treated with synthetic MICD (1,2 ug/ul) or TGF-β (20
ng/ml) for 10 hours (a time point between 8 and 12 hours where maximum abundance of
MCTF was detected) and a biotin-streptavidin pulldown assay was performed to detect
megalin cell surface abundance. Interestingly, figures 31A and 31B show that exogenous
MICD reduced megalin cell surface stability comparably to TGF-β treatment, in both RLE-
6TN and ATII cells. Because the time required for protein downregulation after mRNA
transcription impairment is not established, these results could indicate that 1) MICD may be
able to downregulate cell surface megalin expression through impairment of mRNA
transcription after 10 hours; 2) that MICD may also participate in an unknown signaling
cascade that downregulates megalin at the protein level; 3) or both. Thus, to partially address
these possibilities, we measured megalin and NHE3 gene expression after 10 hours of MICD
or TGF-β treatment. Importantly, both treatments were able to significantly reduce megalin
mRNA levels, which supports the first hypothesis.
Taken together, these results suggest that TGF-β-induced release of MICD reduces both
megalin mRNA expression and cell surface stability by a mechanism that may implicate
translocation to the nucleus and shut down of mRNA synthesis together with interaction
between the peptide and other yet unidentified proteins in the cytoplasm that may induce
megalin endocytosis.

Results
74
Figure 31. Exogenous application of MICD reduces the cell surface abundance of megalin. RLE-
6TN (A) or primary ATII (B) cells were treated with a synthetic protein containing megalin
intracellular domain (MICD) sequence (1,2ug/ul) or with TGF-β (20ng/ml) for 10 hours. Cell surface
proteins were labelled with biotin and pulled down (PD) with streptavidin beads. Pulled down proteins
were separated by SDS-PAGE in 4-16% gradient gel and blotted with specific antibodies for megalin,
transferrin receptor (Tfr) or β-actin. C. RLE-6TN cells were treated with MICD (1,2ug/ul) or TGF-β
(20ng/ml) for 10 hours and total RNA was isolated. Megalin and Nhe3 expression were measured by
real time-PCR with specific primers after reverse transcription. Results were plotted as mean ± SEM.
One-way ANOVA and Dunnett´s multiple comparisons, *p<0,05; **p< 0,01; ****p<0,0001; n=5.
** **
****
****
*
*
A
B
C
IB: megalin
IB: tfr IB: β-actin
C MICD TGF-β C MICD TGF-β
PD Input
50
37 75
MW (kDa)
600
50
37
600
75
MW (kDa)
IB: megalin
IB: tfr IB: β-actin
C MICD TGF-β C MICD TGF-β PD Input

Results
75
To complement the previous data, functional experiments were also performed. Considering
that albumin is the most abundant protein in plasma that can bind to megalin, binding and
uptake of FITC-albumin were measured in order to test cell surface megalin functionality in
the presence and absence of MICD or TGF-β. RLE-6TN or ATII cells were treated as
described above and subsequently incubated with FITC-albumin for 1 hour. Bound and taken
up fractions were collected and fluorescence intensity was measured. Consistently with the
effects of MICD and TGF-β on megalin cell surface abundance, both binding and uptake of
FITC-albumin showed a reduction when RLE-6TN or ATII cells were treated with either
MICD peptide or TGF-β (Figure 32A and 32B). These effects, albeit significant, were not as
pronounced as the effects of MICD or TGF-β on the cell surface abundance of megalin. A
possible explanation for this may be the presence of other albumin receptors at the plasma
membrane, such as members of the LRP family, which may also be able to bind and
endocytose the protein.
Figure 32. Exogenous application of MICD reduces albumin binding and uptake. RLE-6TN (A)
or primary ATII (B) cells were treated with the synthetic MICD (1,2ug/ul) or with TGF-β (20ng/ml)
for 10 hours. Cells were then incubated with FITC-albumin, bound and taken up fractions were
collected and FITC fluorescence was quantified. Fluorescence readouts were normalized to total
protein amount from the taken up fraction. Results were plotted as mean ± SEM. One-way ANOVA
and Tukey´s multiple comparisons, *p< 0,05; **p<0,01; ****p<0,0001; n=5.
A
B
**
* *
*
*
**** **
*

Results
76
3.2.2. TGF-β-induced megalin downregulation requires PKC and γ-secretase activity
We have previously mentioned that shedding and RIP of megalin are dependent on the
coordination of PKC and γ-secretase activities. The regulation of these two processes
determines the intracellular amounts of either MCTF or MICD. For this reason, we decided to
investigate the regulatory role of TGF-β in both processes by measuring MCTF abundance in
the presence or absence of specific inhibitors of the enzymes.
To test the role of γ-secretase activity in TGF-β-induced MCTF release, RLE-6TN cells were
pre-incubated with compound E (CE, γ-secretase activity inhibitor) or vehicle (DMSO) for 4
hours and treated with TGF-β during different time points in combination with the inhibitor.
Whole cell lysates were obtained at the end of the treatment and processed for MCTF
detection. As it is shown in figure 33, TGF-β treatment induced an increase in MCTF
abundance compared to control group (that remained unchanged); which had a peek at 8
hours of exposure, consistently with our data shown above. Furthermore, when cells were
treated with the γ-secretase activity inhibitor, CE, a continuous increase in MCTF abundance
from 0 to 48 hours of treatment was observed. As expected, blocking of proteolytic
processing of MCTF to release MICD into the cytoplasm led to an accumulation of MCTF
within the plasma membrane. In contrast, when cells were treated with TGF-β in the presence
of CE, MCTF abundance was comparable to controls, indicating that the TGF-β –induced
effect was fully inhibited.
To further confirm our previous findings, specific knockdown (KD) experiments were
performed. For this purpose, RLE-6TN cells were transfected with a siRNA against
presenilin-1, an enzyme responsible for the γ-secretase activity in the proteolytic complex,
and megalin cell surface stability was evaluated. Figure 34A shows that the TGF-β-dependent
megalin endocytosis was abolished after 10 hours of treatment. Furthermore, specific KD of
presenilin-1 also impaired TGF-β effect on megalin binding and uptake of FITC-albumin
(Figure 34B). Thus, γ-secretase activity represents an important mediator of TGF-β on
megalin downregulation.

Results
77
Figure 33. Inhibition of γ-secretase activity impairs TGF-β effect on MCTF abundance. RLE-
6TN cells were pre-treated for 4 hours with 1uM of a γ-secretase activity inhibitor, compound E (CE),
and subsequently treated with TGF-β (20 ng/ml) plus the inhibitor during different time points up to
48 hours. Whole cell homogenates were processed by SDS-PAGE in 16% gels and IB. Results were
plotted as mean ± SEM. Two-way ANOVA and Tukey's multiple comparisons test, *p<0,05;
**p<0,01; ***p<0,001; ****p<0,0001; n=6.
*
** ***
****
* *
* ****
0 0.5 4 6 8 24 48 TGF-β Control
0 0.5 4 6 8 24 48
IB: β-actin
IB: megalin c-terminal fragment
IB: megalin c-terminal fragment
IB: β-actin
0 0.5 4 6 8 24 48 0 0.5 4 6 8 24 48 CE CE + TGFβ
37
37
MW (kDa)
37
37
Time(h)

Results
78
Figure 34. Impairment of γ-secretase activity by presenilin-1 knockdown prevents TGF-β-
induced megalin endocytosis. RLE-6TN cells were transfected with presenilin-1 siRNA for 72 hours
and treated with TGF-β (20 ng/ml) for 10 hours. A. Megalin cell surface stability was measured by
biotin-streptavidin pulldown assay and detected by SDS-PAGE and IB. B. Cells were incubated with
FITC-albumin, bound and taken up fractions were collected and FITC fluorescence was quantified.
Fluorescence readouts were normalized to total protein amounts from the taken up fraction. Results
were plotted as mean ± SEM. Two-way ANOVA and Sidak´s multiple comparisons, *p<0,05;
**p<0,01; n=5. Scr: Scramble siRNA.
To assess the role of PKC in the TGF-β-induced downregulation of megalin, RLE-6TN cells
were pre-incubated with gö6976 (PKC inhibitor) or vehicle (DMSO) for 4 hours and treated
with TGF-β for different time points in combination with the inhibitor. Importantly, reduced
cell culture stability of gö6976 forced us to shorten the experimental setting from 0-48 to 0-4
**
*
A B
*
Presenilin-1 siRNA
C TGF-β C TGF-β
scr
IB: megalin
IB: tfr
IB: megalin
IB: Presenilin-1
IB: β-actin
IB: β-actin
IN
PD
KD
MW (kDa)
600
600
100 75
50
37
75
37

Results
79
hours. In line with our previous findings, an increase in MCTF abundance was evidentafter
cells were exposed to TGF-β for up to 4 hours, when compared to controls (Figure 35). Of
note, cells treated with gö6976 showed a continuous decrease in MCTF signal, consistent with
our hypothesis that impairment of PKC-mediated shedding of megalin ectodomain may
reduce the amount of released MCTF. Finally, TGF-β treatment in the presence of the PKC
inhibitor did not lead to increasing MCTF levels in contrast to TGF-β treatment alonegroup in
the first 2 hours. From 2 to 4 hours MCFT amounts started to increase and the differences
between these 2 groups started to vanish, probably due to the reversible inhibition of PKC.
Figure 35. Inhibition of PKC activity impairs TGF-β effect on MCTF abundance. RLE-6TN cells
were pre-treated for 4 hours with 1,3uM of a PKC inhibitor, gö6976, and subsequently treated with
TGF-β (20 ng/ml) plus the inhibitor during different time points up to 48 hours. Whole cell
homogenates were processed by SDS-PAGE in 16% gels and IB. Results were plotted as mean ±
SEM. Two-way ANOVA and Tukey's multiple comparisons test, *p<0,05; **p<0,01; ***p<0,001;
****p<0,0001; n=5.
**** **** *
****
**
*
****
***
****
0 0.5 1 2 3 4 0 0.5 1 2 3 4 PKCα/β inhibitor PKCα/β inhibitor + TGF-β
0 0.5 1 2 3 4 0 0.5 1 2 3 4
Control TGF-β
Time(h)
IB: β-actin
IB: megalin c-terminal fragment
IB: megalin c-terminal fragment
IB: β-actin
37
37
MW (kDa)
37
37

Results
80
Knockdown experiments further supported the idea that PKC is required for TGF-β-induced
megalin shedding. Figures 36A and 36B, respectively, show that the lack of PKC prevented
TGF-β-dependent megalin endocytosis and impairment of albumin binding and uptake.
Figure 36. PKC knockdown prevents TGF-β-induced megalin endocytosis. RLE-6TN cells were
transfected with PKC-α and -β siRNA for 72 hours and treated with TGF-β (20 ng/ml) for 10 hours. A.
Megalin cell surface stability was measured by biotin-streptavidin pulldown assay and detected by
SDS-PAGE and IB. B. Cells were incubated with FITC-albumin, bound and taken up fractions were
collected and FITC fluorescence was quantified. Fluorescence readouts were normalized to total
protein amount from the taken up fraction. Results were plotted as mean ± SEM. Two-way ANOVA
and Sidak´s multiple comparisons, *p< 0,05; **p<0,01; n=5. Scr: Scramble siRNA.
To conclude, these results confirm that PKC and γ-secretase activities at the plasma
membrane are key regulatory targets of TGF-β-induced megalin shedding and RIP.
*
A B
*
** **
PKC siRNA scr
C TGF-β C TGF-β MW (kDa)
IB: megalin
IB: tfr
IB: megalin
IB: PKC
IB: β-actin
IB: β-actin
IN
PD
KD
600
100 75
600
50
37
37
75

Results
81
3.2.3. Megalin shedding is enhanced in the presence of TGF-β
We have shown that TGF-β promotes megalin downregulation by increasing megalin c-
terminal tail release into the cytoplasm through regulation of PKC and γ-secretase activities at
the plasma membrane. Next, we aimed to confirm these results by directly detecting the
release of megalin ectodomain into the cell culture supernatant in the presence of TGF-β. For
this purpose, we incubated RLE-6TN cells with TGF-β 20 ng/ml for different time points.
Cell culture supernatants were collected after treatment, concentrated, quantified and applied
to an ELISA plate pre-coated with specific antibodies binding the megalin ectodomain. After
chemiluminescence detection we observed a higher abundance of the megalin ectodomain in
the supernatant after cells were treated with TGF-β (Figure 37), indicating that exposure to
this cytokine increased megalin shedding and release of the ectodomain into the extracellular
space.
Figure 37. Megalin ectodomain shedding is increased by TGF-β. RLE-6TN cells were treated with
TGF-β (20 ng/ml) during different time points up to 48 hours. Supernatants (SN) were collected at
each time point, centrifuged to remove debris and concentrated for subsequent ELISA analysis,
specific for megalin ectodomain. Chemiluminescent units were normalized to protein concentration in
the SN. Results were plotted as mean ± SEM. Two-way ANOVA and Sidak´s multiple comparisons,
****p<0, 0001; n=5.
3.2.4. TGF-β regulates MMPs expression, activity and subcellular localization
It has been described before that PKC regulates shedding of plasma membrane receptors by
activation of membrane-associated matrix metalloproteases (MMP) [70], [82]. Therefore, we
next asked whether these enzymes are implicated in the TGF-β-induced megalin shedding.
To address this question, we first evaluated the intracellular protein expression of MMP-2 and
MMP-9, which are characteristic matrix remodelers in acute lung injury [102], and MMP-14,
****

Results
82
which was found to be responsible for shedding of LRP-1 that is structurally similar to
megalin [87]. RLE-6TN cells were incubated with TGF-β 20 ng/ml for different time points
and whole cell homogenates were processed after treatment for detection of the above
mentioned MMPs. Exposure of cells to TGF-β increased MMP-2 and MMP-14 protein
amount from 0 to 4 hours of treatment (Figure 38A and 38C). In contrast, MMP-9 expression
seemed to be differently regulated as protein expression was increased from 4 to 12 hours
after TGF-β treatment (Figure 38B). These results suggest that TGF-β may increase
expression of MMPs few hours before the peak of MCTF release takes place (8 hours),
supporting the idea that either of these enzymes or even all of them could be implicated in
megalin shedding.
To further test our hypothesis, we measured the effects of TGF-β on MMP-2 and MMP-9
exocytosis by specific ELISA from cell culture supernatant using the same time course as
above. As it can be seen in figure 39A, only MMP-2 showed a differential regulation in the
presence of TGF-β compared to control, where a peak of release into the extracellular space
correlated with the upregulation of intracellular protein levels that we have seen before.
Regarding MMP-9, although there was a continuous exocytosis of the enzyme, differences
between control and TGF-β treatment were indistinguishable. We next aimed to study
activation of MMP-2 and MMP-9 under the same circumstances. For this, zymography assays
were performed with aliquots of the supernatants from the previous experiments. Consistently
with the ELISA assays, MMP-2 showed a higher activation from 4 to 12 hours after TGF-β
treatment. In contrast, MMP-9 activity remained low after TGF-β treatment, comparable to
control values (Figure 39B).
Because MMP-14 remains attached to the cell surface, it is not feasible to detect this protease
in cell culture supernatants. Therefore, we studied MMP-14 translocation to the plasma
membrane after treatment with TGF-β. RLE-6TN cells were exposed to 20 ng/ml of TGF-β
for 10 hours (a time point between 8 and 12 hours where maximum abundance of MCTF was
detected) and the plasma membrane fraction was purified from whole cell lysates. In line with
our previous findings, we observed a higher co-localization of MMP-14 with the purified
plasma membrane fraction after TGF-β exposure (Figure 40). Interestingly, we also detected
an increased abundance of MMP-9 and PKC-α and -β at the cell surface, suggesting that TGF-
β could promote translocation of these proteins to the plasma membrane, although exocytosis
and activation MMP-9 were not enhanced.

Results
83
Figure 38. TGF-β regulates intra-cellular expression of matrix-metalloprotease-2, 9 and 14.
RLE-6TN cells were treated with TGF-β (20 ng/ml) up to 48 hours. Whole cell homogenates were
processed by SDS-PAGE in 16% gels and IB for MMP-2 (A), MMP-9 (B) and MMP-14 (C).
Representative blots are shown. Results were plotted as mean ± SEM. One-way ANOVA and
Dunnett´s multiple comparisons, *p<0,05; n=5, respectively.
100 120
37 50
75
*
*
A
B
C
MW (kDa) 0 0.5 4 8 12 24 48
Control
IB: β-actin
IB: MMP-2
Time(h) 75
50 37
0 0.5 4 8 12 24 48 TGF-β
IB: MMP-2
IB: β-actin
MW (kDa) 0 0.5 4 8 12 24 48
Control
IB: β-actin
IB: MMP-9
Time(h)
50 37
0 0.5 4 8 12 24 48 TGF-β
50 37
120 100
IB: β-actin
IB: MMP-9
MW (kDa) 0 0.5 4 8 12 24 48 Control
IB: β-actin
IB: MMP-14
Time(h)
50 37
50
0 0.5 4 8 12 24 48
TGF-β
50
37
50
IB: β-actin
IB: MMP-14

Results
84
Figure 39. MMP-2 extracellular release and activity are increased by TGF-β. A. RLE-6TN cells
were treated with TGF-β (20 ng/ml) up to 48 hours. Supernatants (SN) were collected, centrifuged to
remove debris and concentrated for subsequent ELISA analysis, specific for MMP-2 and 9.
Chemiluminescent units were normalized to protein concentration in the SN. Results were plotted as
mean ± SEM. Two-way ANOVA and Sidak´s multiple comparisons, *p<0, 05; n=5. B. Representative
zymography of SN in A. N=5.
**
A
B
Figure 40. TGF-β promotes translocation of
PKC, MMP-9 and 14 to the plasma
membrane. RLE-6TN cells were treated with
TGF-β (20 ng/ml) for 10 hours and whole cell
homogenates were fractionated by isopycnic
(sucrose gradient) or differential centrifugation.
Cytoplasm (endosomes-free) (C), plasma
membrane (PM) and nucleus (N) were purified.
Fractions were processed by SDS-PAGE in 4-
16% gradient gels followed by IB. Total proteins
were stained by Coomassie. Representative blots
are shown. N=5.
0 0.5 4 8 12 24 48
MMP-9 MW
(kDa) 0 0.5 4 8 12 24 48
MMP-2
Time (h)
Control
TGF-β
75
50
75
50
150
100
150
100
C PM N C PM N Control TGF-β
MW (kDa)
IB: MMP-14
IB: fibrillarin
IB: β-actin
IB: Na/K ATPase α-1
IB: PKC-α/β
IB: MMP-9
IB: MMP-2
Coomassie
50
150
100 75
75
37
37
100 75

Results
85
Taken together, these data indicate that TGF-β may regulate MMP-2 release and activation,
and may induce translocation of MMP-14 to the plasma membrane. A significant regulation
of MMP-9 release and activation was not observed, however, TGF-β treatment increased
MMP-9 cell surface abundance.
As we found that MMP-2 and -14 activities were upregulated by TGF-β and considering that
physical interaction of two proteins might be necessary for proteolysis, we tested direct
interaction of MMP-2 and -14 with megalin by co-immunoprecipitation (co-IP) assays from
plasma-membrane-enriched fractions after 10h of treatment with TGF-β. As it can be seen in
figures 41A and 41B, both MMP-2 and MMP-14 were pulled down with megalin when
specific antibodies for the receptor were used for IP. Moreover, reverse IPs were able to pull
down megalin when MMP-2 or MMP-14 were immunoprecipitated (Figures 42A and 42B).
A
B
Figure 41. Megalin interacts with
MMP-2 and MMP-14 at the plasma
membrane. RLE-6TN cells were
treated with TGF-β (20ng/ml) for 10
hours and the crude plasma membrane
fraction was obtained from whole cell
lysates. Proteins were extracted and
immunoprecipitation (IP) with specific
antibodies for megalin was performed.
Co-IP was assessed by immunobloting
with specific antibodies for MMP-2
(A) or MMP-14 (B). Representative
blots are shown. N=5.
MW (kDa) Input
IB: megalin
IB: MMP-2
IgG ctrl. C T C T
megalin IP
IgG
IgG
250
75
50
100
MW (kDa)
IB: megalin
IB: MMP-14
Input IgG ctrl. C T C T
megalin IP
250 150
75
50
100
IgG

Results
86
These data suggest that MMP-2 and MMP-14 are able to physically interact with megalin at
the cell surface. This together with the finding that MMP-2 and MMP-14 are upregulated in
presence of TGF-β suggests that these two enzymes may be novel candidates responsible for
megalin shedding.
3.2.5. Megalin downregulation induced by TGF-β is impaired by KD of MMPs
As it has been demonstrated that MMPs are tightly regulated by TGF-β, the effect of the
cytokine on megalin endocytosis and function in the absence of MMP-2, -9 and -14 was next
studied.
RLE-6TN cells were transfected with different siRNA sequences to specifically downregulate
MMP-2, -9 or -14 mRNA levels for 72 hours. TGF-β treatment was conducted for 10 hours
before the end of the knockdown period and cells were immediately processed for megalin
A
B
Figure 42. Megalin interacts with
MMP-2 and MMP-14 at the plasma
membrane. RLE-6TN cells were
treated with TGF-β (20 ng/ml) for 10
hours and crude plasma membrane
fractions were obtained by
centrifugation from whole cell lysates.
Proteins from the crude plasma
membrane fraction were extracted and
immunoprecipitation (IP) with specific
antibodies for MMP-2 (A) or MMP-14
(B) was performed. Co-IP was
assessed by immunobloting with
specific antibodies for megalin.
Representative blots are shown. N=5.
IB: megalin
IB: MMP-2
IgG ctrl.
C T C T MMP-2 IP Input
MW (kDa)
250
75
50
IB: megalin
IgG ctrl. C T C T
MMP-14 IP Input MW (kDa)
IB: MMP-14
250
150
IgG
75
50

Results
87
cell surface detection or FITC-albumin binding and uptake experiments (Figures 43A and
43B, respectively). As expected, loss of MMP-2 and -14 expression rescued megalin cell
surface stability in presence of TGF-β and consequently, restored control levels of albumin
binding and uptake. Interestingly, downregulation of MMP-9 expression had the same effect
on TGF-β-induced megalin endocytosis and function than the other two enzymes, even when
TGF-β showed no effect on MMP-9 extracellular release and activity.
Taken together, these results suggest that TGF-β promotes megalin shedding and subsequent
downregulation by modulating matrix-metalloproteases-2, -9 and -14 localization and activity.
Nonetheless, the specific mechanism by which these three enzymes are coordinated to
mediate megalin shedding in response to TGF-β remains unclear.

Results
88
Figure 43. MMPs knockdown prevents TGF-β effect on megalin cell surface stability and
function. RLE-6TN cells were transfected with MMP-2, -9 or -14 siRNA for 72 hours and treated
with TGF-β (20 ng/ml) for 10 hours. A. Megalin cell surface stability was measured by biotin-
streptavidin pulldown assay and IB. B. Cells were incubated with FITC-albumin, bound and taken up
fractions were collected and FITC fluorescence was quantified. Fluorescence readouts were
normalized to total protein amounts from the taken up fraction. Results were plotted as mean ± SEM.
Two-way ANOVA and Sidak´s multiple comparisons, *p< 0,05; n=5. PD:
Pulldown; IN: Input; KD: Knockdown.
C TGF-β C TGF-β
* *
*
A
B
* *
*
C TGF-β C TGF-β scr MMP-2 siRNA scr
C TGF-β C TGF-β MMP-9 siRNA MW
(kDa) scr MMP-14 siRNA
IB: MMP-9
IB: β-actin
IB: megalin
IB: β-actin
IB: megalin
IB: tfr
IB: MMP-2
IB: β-actin
IB: megalin
IB: tfr
IB: megalin
IB: β-actin
IB: MMP-14
IB: β-actin
IB: megalin
IB: β-actin
IB: megalin
IB: tfr
KD
IN
PD
37
75
75 100
37
600
600
100 50

Discussion
89
4. Discussion
Here we provide evidence that TGF-β, a key player in the pathogenesis of ARDS [47],
significantly impairs alveolar protein clearance by downregulation of the endocytic receptor
megalin in alveolar epithelial cells. Megalin function was found to be critical for the
maintenance of homeostasis in many organs where the negative effects of TGF-β on its
function have been described [52], [70]. However, the exact mechanisms underlying TGF-β-
dependent megalin downregulation was previously unknown. Our novel data suggest that
TGF-β rapidly induces megalin endocytosis (within 30 minutes) and subsequently promotes
its degradation in a ubiquitin-proteasome-dependent manner. Furthermore, prolonged
exposition to this cytokine promotes shedding of the megalin ectodomain and intramembrane
proteolysis (RIP) of the remaining fragment, resulting in the release of a soluble variant of
megalin c-terminal tail that translocates into the nucleus and regulates gene expression,
including repression of megalin mRNA transcription. We also demonstrate that TGF-β-
induced megalin shedding and RIP require PKC and γ-secretase activities; as well as
regulation of the expression, activity and localization of matrix-metalloproteases (MMPs)-2, -
9 and -14.
4.1. TGF-β reduces megalin cell surface stability by promoting endocytosis and
proteasomal degradation of the receptor
The role of TGF-β in the pathogenesis of ARDS has been associated with downregulation of
the expression and function of many well-characterized ion transporters, responsible for the
directional flow of ions and fluid across the alveolar epithelial barrier; thus, contributing to
formation and persistence of alveolar edema and loss of integrity of the alveolar-capillary
barrier [45], [48]–[50]. However, not only ions and fluid can move through the barrier but
also proteins [19], [146], (Vohwinkel et al, in revision). Though many mechanisms involved
in alveolar protein uptake from the distal airways have been suggested, receptor-mediated
endocytosis seems to represent the most relevant function, regarding the physiological rates of
alveolar protein clearance reported in animal models [16]. Megalin is a multi-ligand endocytic
receptor that is expressed in alveolar epithelial cells [61]. Because previous studies have
reported that this receptor is downregulated as a consequence of elevated TGF-β levels in
kidney and gallbladder diseases [70], we hypothesized that this cytokine may impair alveolar
protein clearance through a similar mechanism.

Discussion
90
In order to test this hypothesis, we evaluated megalin cell surface stability in alveolar
epithelial cells. Our studies demonstrated that TGF-β increases megalin endocytosis, thereby
reducing the abundance of the receptor at the plasma membrane. Extensive research has
shown that the regulatory domain of megalin trafficking is located at the cytoplasmic tail of
the protein. Moreover, Yuseff et al. (2007) [75] identified a PPPSP motif in this sequence as a
target for GSK-3β phosphorylation that negatively regulates cell surface stability of megalin
with minor participation of other phosphorylation motifs. Previous work from our group has
shown that inhibition of GSK-3β rescues the TGF-β-induced megalin downregulation, and
restores albumin binding and uptake in ATII cells [20], (Vohwinkel et al, in revision). These
data suggested that TGF-β may induce megalin endocytosis through GSK-3β-dependent
phosphorylation of the PPPSP motif in megalin tail. Consistently, we were able to show that
biotin-streptavidin pulldown of constitutively un-phosphorylated megalin (PPPAP mutants)
prevents the negative effect of TGF-β on the receptor cell surface abundance. These results
are supported by previous research from Dr. Marzolo group, where PPPAP mutants increased
megalin cell surface expression and fastened the recycling of the receptor in kidney cell lines
[75].
Internalized proteins in response to a stimulus generally co-localize with recycling or
degradation endosomes depending on the signals activated by the stimulus. When the fate of
these proteins is degradation, co-localization with the lysosome or with the proteasome can be
often observed [90]. Considering that TGF-β reduces megalin cell surface abundance by
inducing its internalization, we asked whether the receptor would then be directed to any of
the degradation machineries. Our subcellular fractionation experiments showed that megalin
is accumulated in the endosomal fraction, where it co-localizes with recycling endosomes and
the proteasome but not with lysosomes. These results were confirmed by individual isolation
and purification of both the proteasomal and the lysosomal fractions, where we found that
megalin is directly translocated to the proteasome in response to TGF-β. Of note, we also
observed that under normal conditions megalin may be traslocated into the lysosomes. This
finding is in line with the general knowledge that endocytic receptors may traffic to
lysosomes when internalized with their ligands [147].
The finding that TGF-β promotes megalin cell surface instability through endocytosis and
translocation to the proteasome, raised the question whether this cytokine was responsible of
regulating cell surface megalin turnover and degradation. To addresses this question, pulse-
chase experiments of pre-labelled cell surface megalin were conducted. In line with our

Discussion
91
previous findings, we observed that treatment with TGF-β increases the rate of cell surface
megalin turnover, reducing its half-life approximately by 20% (16 to 13 hours) when
compared to untreated conditions. Additionally, pulse-chase experiments after 13 hours of
treatment in the presence or absence of proteasome or lysosome inhibitors supported the
hypothesis that TGF-β induces megalin degradation in a proteasome-dependent manner.
Studies in renal proximal tubule cells reported a total megalin half-life ranging from 9 to 12
hours [148]; few hours less than that of cell surface megalin, probably because higher stability
is required for efficient protein reabsorption at the plasma membrane. In line with our studies
of megalin localization under control conditions (Figure 19B), the authors also observed that
degradation of megalin and chloride channel 5 (ClC5) in response to cadmium was dependent
on the lysosome instead of the proteasome, indicating that differential processing of the same
elements is possible depending on the type of stimulus.
Interestingly, it seemed that treatment with MG-132 not only inhibited the TGF-β-induced
endocytosis of megalin but also partially prevented trafficking of the receptor to the plasma
membrane, as lower basal levels of cell surface megalin were detected after inhibiting the
proteasome. However, as MG-132 inhibits the function of the proteasome, which is required
in a myriad of cellular processes, it is plausible that the stability of other proteins related to
trafficking events will also be altered, which may explain the reduced delivery of megalin to
the cell surface in the presence of MG-132. In any case, data obtained with such inhibitors
should be interpreted with caution as the non-specific effects may significantly alter the
readouts.
Most recent studies about megalin recycling in kidney cells support our findings that megalin
is a receptor with a long half-life and a fast rate of endocytosis; which is consistent with a
physiologically relevant role of this receptor in protein reabsorption [152].
4.2. Megalin downregulation induced by TGF-β requires specific ubiquitination of the
receptor c-terminal tail
Certain intracellular events must occur prior to induction of endocytosis and degradation of
transmembrane proteins. This sequence of events normally starts with phosphorylation and/or
monoubiquitination of specific residues within the cytoplasmic domain of these proteins,
which promote internalization. Subsequent additional events of ubiquitination will then
determine whether a protein will be degraded in the lysosomes or the proteasome [147],
[153], [154]. Up to this point, we have demonstrated that TGF-β treatment of alveolar
Discussion
92
epithelial cells induces megalin endocytosis through phosphorylation of the PPPSP motif and
subsequent proteasomal degradation; however, the underlying molecular mechanisms
remained to be elucidated. We next hypothesized that the lysines (K) in the c-terminal tail of
magelin are potential targets of ubiquitination processes induced by TGF-β.
To address this point, we first determined if megalin was indeed ubiquitinated in response to
TGF-β. Polyubiquitin pulldown assays supported our hypothesis as higher amounts of
megalin were precipitated after treatment. In addition, in silico analysis of the last 209 amino
acids on the megalin c-terminal tail revealed that 9 out 13 Ks represent potential targets of
ubiquitination, regarding all the consensus sequences known to be ubiquitinated by different
ligases. Polyubiquitin pulldown assays from mutants for each K suggested that 1) K14, K23
and K88 may be needed for normal, ubiquitination-mediated turnover of megalin, as
polyubiquitin smears disappeared regardless of the treatment conditions when these Ks are
replaced by arginine (R); 2) ubiquitination of K197 and K204 seems to be regulated by TGF-
β as the TGF-β induced polyubiquitination of megalin was prevented in these mutants without
altering baseline ubiquitination rates of the receptor; 3) K138-142 and K176-178 appear to be
irrelevant in TGF-β-signaling as mutations of these residues did not alter the TGF-β-induced
ubiquitination pattern of megalin. As discussed above, inhibition of ubiquitination events may
not only prevent degradation but also endocytosis [155], thereby increasing cell surface
stability of transmembrane proteins. Thus, in order to validate our results, the localization of
each of the mutants at the plasma membrane in the presence of TGF-β was studied.
Consistently with our previous findings, we observed that replacement of Ks 14, 23, 197 and
204 impairs the TGF-β-induced endocytosis of megalin, increasing the receptor cell surface
stability. In contrast, although mutation of K88 prevents megalin from ubiquitination
independently of TGF-β, K88R does not seem to interfere with TGF-β-induced megalin
endocytosis. Moreover, these results allowed as to conclude that mutation of K 138 and 142
has no effect on either megalin ubiquitination or endocytosis, however, K176-178R stabilizes
megalin at the plasma membrane even though no effect on the receptor ubiquitination state is
evident. Clearly, further studies will be necessary to tease out the exact ways by which these
lysine molecules are involved in the TGF-β-induced ubiquitination and endocytosis of
megalin also considering the role of K proximity to the plasma membrane and to other
regulatory motifs that dictate trafficking and cellular fate of the receptor for example with the
use of the 3D structure of the megalin tail. Also, to determine the ubiquitination pattern of
each K, itwould be important to specify in which processes they are involved in (e.g.
endocytosis, recycling or degradation), which are the E3 ligases that promote ubiquitination at

Discussion
93
a particular residue and how to interfere with such processes if required. Finally, combined
mutation of the Ks in megalin c-terminal tail should be useful to test the hypothesis that
spatial distribution plays a role in the above mentioned events and that regulation of
ubiquitination may rely in more than one single residue and that all these could represent
another source of specificity for the activity of E3 ligases.
4.3. Persistance of TGF-β stimulus reduces megalin gene expression by increasing the
release of megalin intracellular domain
Notch-like processing of megalin has been previously investigated in the context of kidney
diseases, where release of its extracellular domain is a consequence of matrix-
metalloproteases-dependent shedding, followed by regulated intramembrane proteolysis (RIP)
of the membrane-bound c-terminal tail (MCTF) and cytoplasmic delivery of the remaining
protein [82], [84]. This cytoplasmic variant of megalin (MICD) has been suggested to
translocate into the nucleus and negatively regulate gene expression of megalin [81].
Furthermore, TGF-β has been associated with Smad-independent downregulation of the
megalin promoter in diabetic nephropathy [51], [52]. Moreover, we have recently
demonstrated that TGF-β exerts a short-term downregulation of megalin in lung epithelium.
Taken together, these findings led us to hypothesize that megalin downregulation in response
to TGF-β may also be a consequence of a long-term effect of the cytokine, which could alter
megalin gene expression by regulation of shedding and RIP in alveolar epithelial cells.
We started to evaluate this hypothesis by measuring mRNA levels of megalin after treatment
with TGF-β for 24 and 48 hours. Interestingly, we observed that megalin gene expression is
significantly reduced in presence of TGF-β. To further test our hypothesis, we aimed to find a
link between the TGF-β-induced mRNA downregulation and the release of the megalin c-
terminal domain. Considering that MICD is difficult to detect because of its fast degradation,
we evaluated the abundance of the membrane-bound precursor, MCTF. In line with our
previous results, we found that the amount of megalin cytoplasmic domain is regulated by
TGF-β in a time-dependent manner, showing a peak of maximum abundance between 8 and
12 hours after treatment; which correlated with a marked reduction of megalin cell surface
stability after 10 hours of exposition to TGF-β. These findings were complemented by
detection of higher amounts of the megalin ectodomain in cell culture supernatants of TGF-β-
treated cells. We confirmed the effect of TGF-β on the receptor transcriptional
downregulation when cells treated with either exogenous MICD or TGF-β showed
comparable reduced levels of megalin mRNA. Furthermore, we observed that MICD release
Discussion
94
into the cytoplasm not only reduces megalin gene expression after 24 or 48 hours but also
contributes to its cell surface instability and reduced functionality after 10 hours, similarly to
TGF-β. Although protein levels could be downregulated through impairment of transcription
within a few hours, it is unlikely that the differences we observed in megalin cell surface
abundance between control and TGF-β-treated groups after 10 hours are solely a consequence
of altered transcription. Thus, we hypothesized that MICD release into the cytoplasm in
response to a stimulus could also be in part a consequence of a yet unidentified mechanism
that promotes megalin endocytosis.
We demonstrated that TGF-β impairs megalin mRNA transcription by promoting the
cytoplasmic release of the receptor intracellular domain in alveolar epithelial cells. However,
other targets of MICD transcriptional regulation have been previously discovered in the
proximal tubules [81]. One of them is the sodium/proton exchanger 3 (NHE3) that is
expressed in the apical surface of various epithelia including the renal proximal tubules and
the alveolar epithelium [156], [157]; where it co-localizes with megalin and is associated with
regulation of pH [158]. In the current study, we were able to show that both megalin and
NHE3 transcriptional levels are reduced in presence of excess MICD or TGF-β. The
physiological relevance of MICD-induced downregulation of NHE3 gene expression or how
these proteins are functionally connected to each other are still not known, however, it has
been reported that NHE3 is mostly sequestered into recycling endosomes suggesting that it
could be implicated in pH-dependent release of megalin ligands prior to their lysosomal
degradation or transepithelial transport [159]. Alternatively, regulation of NHE3
transcriptional levels by MICD has also been considered to be an indirect process, given that
inhibition of megalin RIP does not prevent downregulation of nhe3 [81].
4.4. TGF-β-induced megalin shedding and RIP require PKC and γ-secretase activity
Ectodomain shedding of transmembrane receptors is regulated by different isoforms of PKC
that present selective affinity for specific substrates. These protein kinases are responsible for
activating sheddases through phosphorylation of their cytoplasmic tails and promote substrate
recognition by conformational changes due to phosphorylation [160]. Ectodomain shedding
represents a regulatory mechanism of γ-secretase activity at the plasma membrane, however,
ligand-dependent recruitment of these enzymes to the cell surface was reported as well [161].
Megalin shedding and RIP are dependent on the coordinated function of classical PKCs and
γ-secretase activity, respectively [82], [84]. Although some evidence regarding reciprocal
regulation between these enzymes and TGF-β is available, the signaling cascade that

Discussion
95
specifically relates these factors with megalin processing in ARDS is not yet clear. To address
this, we hypothesized that TGF-β regulates megalin shedding through modulation of the
activity of the PKC-α/β and γ-secretase complex in alveolar epithelial cells.
Our studies demonstrate that both PKC and γ-secretase activity are required for TGF-β-
induced megalin processing as specific chemical inhibition of either of these factors impaired
the effect of TGF-β on megalin c-terminal fragment abundance. Further knockdown
experiments confirmed these results in which TGF-β treatment of cells transfected with
specific siRNA against PKC-α/β or presenilin-1 (responsible of γ-secretase activity) was
unable to reduce the amount of megalin at the plasma membrane, thereby rescuing cell
surface stability of the receptor and consequently, restoring its functionality. Despite the fact
that we have confirmed that PKC and γ-secretase activity are connected to TGF-β through the
same pathway and that regulation of their function is important for modulation of megalin
shedding and RIP, no studies addressing the mechanisms involved in the regulation of these
events were performed. Nevertheless, considering that both PKC and γ-secretase complex are
located at the plasma membrane, we suggest that transactivation of these proteins in response
to TGF-β may be a TβRI/II-Smad-dependent process [34]. Additional evidence of the
negative effects of TGF-β on E-cadherin expression [162], [163]; which also undergo
shedding and RIP in response to injury of the lung epithelium [164], supports our hypothesis
that TGF-β may downregulate megalin expression thought induction of shedding and RIP of
the receptor.
Furthermore, it will be important to evaluate the role of other PKC isoforms, in TGF-β-
dependent megalin shedding since inhibition of PKC-θ and-ζ but not –δ were described to
reduce the expression and activity of two typical sheddases, MMP-2 and MMP-9 [165], [166].
4.5. MMPs expression, activity and localization are modulated by TGF-β
Activity of MMPs represents another critical regulatory step of megalin shedding. As
described above, PKC isoforms regulate ectodomain shedding of transmembrane receptors by
phosphorylation and subsequent activation of various MMPs that mediate numerous
responses to acute lung injury, such as cell elongation, migration, tissue remodelling and
repair [160]. Recent studies have shown that secreted MMPs not only act pericellularly within
the extracellular matrix (ECM) but also bind to specific cell surface receptors, membrane-
anchored proteins or cell-associated ECM. It has been suggested that secreted MMPs may be
recruited back to the local cell environment by interactions with cell surface proteins [109].

Discussion
96
Mutual regulation between MMPs and TGF-β has been already reported in other systems
[111]–[119]. Thus, we hypothesized that TGF-β not only regulates megalin shedding and RIP
through PKC and γ-secretase activity but also through modulation of MMP function.
In the present study, we were able to show that TGF-β upregulates total protein expression of
MMP-2 and -9 after 4 hours of treatment in alveolar epithelial cells. Interestingly, detection of
total MMP-2 and -9 in cell culture supernatants partially supported the previous results since
upregulation of extracellular abundance and activity was only detected for MMP-2 (but not
MMP-9). Of note, a correlation between MMP-2 levels and megalin ectodomain release into
the extracellular space was found as well. Consistently with our findings, even if both MMP-2
and -9 have been reported to be highly expressed in the broncho-alveolar lavage (BAL) of
patients with ARDS [106]–[108], TGF-β treatment of A549 cells caused only an increase of
MMP-2 expression and activity; leaving MMP-9 levels unaltered [167]. To further support
our findings, TGF-β effect on megalin cell surface stability and function was measured after
transfection of specific siRNA against MMP-2 or MMP-9. As expected, MMP-2 knockdown
(KD) prevented TGF-β-induced megalin endocytosis, restoring its functionality; however,
MMP-9 KD appeared to have the same effect regardless the fact that neither its extracellular
release nor its activity was regulated by TGF-β. It is possible that MMP-9 was indirectly
implicated in megalin shedding by activating other MMPs directly involved in the process;
thus TGF-β may be responsible of regulating MMP-9 interaction with other MMPs instead of
regulating its expression or activity. Moreover, MMP-9 has been already reported to bind
megalin ectodomain since this receptor mediates MMP-9 clearance from the alveolar space
[110]; TGF-β could also be enhancing such interaction, thereby promoting megalin shedding.
These last two notions are supported by our observations that TGF-β increases MMP-9 co-
localization with the plasma membrane, facilitating its interaction with megalin and other
MMPs. Finally, taking into account that MMPs should physically bind the receptor to catalyse
its shedding, we assessed the interaction of MMP-2 with megalin at the plasma membrane of
alveolar epithelial cells. In line with the previous findings, we observed that megalin and
MMP-2 interact with each other. The data reported here serves also as a confirmation of the
autocrine role of MMP-2 and MMP-9 catalytic activity in view of the absence of any
additional source of these enzymes other than the alveolar epithelial cells cultured on the
plates.
MMP-14 is a membrane-anchored MMP that has been found in alveolar epithelial cells
together with MMP-2; which is activated by MMP-14 in response to bleomycin [168].

Discussion
97
Additionally, MMP-14 mediates the shedding of another member of the LRP family, LRP-1,
in human lung fibroblasts [87]. In the current study, we demonstrate that TGF-β treatment not
only upregulates MMP-2 and -9 total protein levels but MMP-14 expression as well.
Furthermore, MMP-14 translocation to the plasma membrane was increased in the presence of
TGF-β and the effect of this cytokine on megalin endocytosis was impaired when MMP-14
KD was performed. In line with these results and similarly to MMP-2, direct physical
interaction between MMP-14 and megalin was proven at the plasma membrane of alveolar
epithelial cells. Considering that MMP-14 is required to proteolytically activate MMP-2, these
findings may suggest that megalin could serve as a scaffold that allows interaction and
activation of the enzymes that later mediate shedding of its ectodomain.
Collectively, these data confirmed our hypothesis about the regulatory role of TGF-β on
megalin shedding through modulation of MMPs. Importantly; we were able to identify two
putative mediators of megalin shedding, MMP-2 and MMP-14. Both enzymes are required for
TGF-β-induced megalin downregulation and directly interact with the receptor at the plasma
membrane. Although the signaling pathways responsible of coordinating these enzymes in
order to remove the ectodomain of megalin still need to be tested, based on previously
published data, we propose that PKC-dependent MMP-14 activation may enhance pro-MMP-
2 proteolytic processing, thereby activating MMP-2 [160], [168], [169].
5. Concluding remarks
To summarize, in the present study we sought to describe novel regulatory mechanisms of
protein clearance from the alveolar space. We provide evidence that elevated levels of TGF-β
promote downregulation of the endocytic receptor megalin in alveolar epithelial cells through
two different pathways: A) Rapid megalin endocytosis and subsequent degradation dependent
on the ubiquitin-proteasome system; B) Long-term effect of TGF-β on megalin expression
caused by induction of Notch-like processing of the receptor (Figures 44 and 45).
These short- and long-term effects of TGF-β on megalin contribute to the impairment of
alveolar protein clearance, accumulation of protein-rich edema in distal airways, and
disruption of the alveolar-capillary barrier; which consequently impairs gas exchange.
Understanding the molecular mechanisms underlying the TGF-β-induced megalin
downregulation may hold a therapeutic promise.

Discussion
98
Figure 44. TGF-β promotes downregulation of the endocytic receptor megalin in alveolar
epithelial cells through rapid megalin endocytosis and subsequent degradation dependent on the
ubiquitin-proteasome system. We establish that TGF-β reduces megalin cell surface stability through
activation of GSK-3β (1); which mediates the phosphorylation of the serine (S) within the PPPSP
motif, located at the c-terminal tail of the receptor (2). Furthermore, we demonstrate that TGF-β
promotes ubiquitination of different lysine (K) residues in the megalin c-terminal tail that regulate
endocytosis (3) of the receptor and subsequent degradation in the proteasome (4); thereby impairing
megalin function, reducing alveolar protein clearance and consequently, enhancing the severity of
ARDS.

Discussion
99
Figure 45. Long-term effect of TGF-β on
megalin expression caused by induction
of Notch-like processing of the
receptor. In the present study, we show
that persistence of TGF-β stimulus
enhances shedding of megalin
ectodomain (2) through increased
expression and activation of matrix-
metalloproteases (MMP) 2, 9 and 14;
which interact with the receptor at the
plasma membrane (1). TGF-β effect on
megalin shedding requires activation of
protein kinase C α and β (1) that
mediate the phosphorylation and
activation of the MMPs (and probably
the substrate) in order to facilitate the
removal of megalin ectodomain. The
remaining membrane-bound piece of
megalin (MCTF) will then be
proteolytically processed by the γ-
secretase complex (3), releasing megalin
c-terminal domain (MICD) into the
cytoplasm. MICD translocate into the
nucleus, where it participates in the
regulation of gene expression, including
downregulation of megalin own
expression.

References
100
6. References
[1] D. G. Ashbaugh, D. B. Bigelow, T. L. Petty, and B. E. Levine, “Acute respiratory
distress in adults,” Lancet, vol. 7, no. 1, pp. 60–61, Mar. 1967.
[2] D. P. Schuster, “What Is Acute Lung Injury?,” Chest, vol. 107, no. 6, pp. 1721–1726,
Jun. 1995.
[3] M. A. Matthay and G. A. Zimmerman, “Acute lung injury and the acute respiratory
distress syndrome: Four decades of inquiry into pathogenesis and rational
management,” Am. J. Respir. Cell Mol. Biol., vol. 33, no. 4, pp. 319–327, 2005.
[4] The ARDS Definition Task Force*, “Acute Respiratory Distress
Syndrome<subtitle>The Berlin Definition</subtitle><alt-title>The Berlin Definition of
ARDS</alt-title>,” JAMA J. Am. Med. Assoc., p. 1, 2012.
[5] F. Aeffner, B. Bolon, and I. C. Davis, “Mouse Models of Acute Respiratory Distress
Syndrome: A Review of Analytical Approaches, Pathologic Features, and Common
Measurements,” Toxicol. Pathol., pp. 1074–1092, 2015.
[6] E. Jesu´s Villara, b, c, Demet Sulemanjid, e, and Robert M. Kacmarekd, “The acute
respiratory distress syndrome: incidence and mortality, has it changed?,” Curr. Opin.
Crit. Care, vol. 20, no. 1, p. 3, Feb. 2014.
[7] N. D. Ferguson, E. Fan, L. Camporota, M. Antonelli, A. Anzueto, R. Beale, L.
Brochard, R. Brower, A. Esteban, L. Gattinoni, A. Rhodes, A. S. Slutsky, J. L. Vincent,
G. D. Rubenfeld, B. Taylor Thompson, and V. Marco Ranieri, “The Berlin definition
of ARDS: An expanded rationale, justification, and supplementary material,” Intensive
Care Med., vol. 38, no. 10, pp. 1573–1582, 2012.
[8] E. L. Scholten, J. R. Beitler, G. K. Prisk, and A. Malhotra, “Treatment of Acute
Respiratory Distress Syndrome with Prone Positioning,” Chest, Jul. 2016.
[9] L. Raman and H. J. Dalton, “Year in Review 2015: Extracorporeal Membrane
Oxygenation.,” Respir. Care, vol. 61, no. 7, pp. 986–91, Jul. 2016.
[10] D. J. Ciesla, E. E. Moore, J. L. Johnson, J. M. Burch, C. C. Cothren, and A. Sauaia,
“The role of the lung in postinjury multiple organ failure,” Surgery, vol. 138, no. 4, pp.
749–758, Oct. 2005.
[11] M. Perl, C. Hohmann, S. Denk, P. Kellermann, D. Lu, S. Braumuller, M. G. Bachem, J.
Thomas, M. W. Knoferl, A. Ayala, F. Gebhard, and M. S. Huber-Lang, “Role of
activated neutrophils in chest trauma-induced septic acute lung injury,” Shock, vol. 38,
no. 1, pp. 98–106, Jul. 2012.
[12] and K. H. A. Staub, N. C., The structure of the lungs relative to their principal
functions, vol. 12–36. Philadelphia: Textbook of Respiratory Medicine, 1988.
[13] C. H. Banov, “Anatomy and physiology of the lower and upper airway.,” J. Allergy
Clin. Immunol., vol. 84, no. 6 Pt 2, pp. 1044–6, Dec. 1989.
[14] J. S. Patton and R. M. Platz, “(D) Routes of delivery: Case studies. (2) Pulmonary
delivery of peptides and proteins for systemic action,” Advanced Drug Delivery
Reviews, vol. 8, no. 2–3. pp. 179–196, 1992.
[15] W. S. Tyler, “Comparative subgross anatomy of lungs. Pleuras, interlobular septa, and
distal airways,” Am. Rev. Respir. Dis., vol. 128, no. 2 Pt 2, pp. S32-6, Aug. 1983.
[16] H. G. Folkesson, M. A. Matthay, B. R. Weström, K. J. Kim, B. W. Karlsson, and R. H.
Hastings, “Alveolar epithelial clearance of protein.,” J. Appl. Physiol., vol. 80, no. 5,
pp. 1431–1445, 1996.
[17] E. E. Schneeberger and R. D. Lynch, “Structure, function, and regulation of cellular
tight junctions.,” Am. J. Physiol., vol. 262, no. 6 Pt 1, pp. L647–L661, Jun. 1992.
[18] M. A. Matthay, “Resolution of pulmonary edema thirty years of progress,” American
Journal of Respiratory and Critical Care Medicine, vol. 189, no. 11. pp. 1301–1308,

References
101
2014.
[19] Y. Berthiaume, K. H. Albertine, M. Grady, G. Fick, and M. a Matthay, “Protein
clearance from the air spaces and lungs of unanesthetized sheep over 144 h.,” J. Appl.
Physiol., vol. 67, no. 5, pp. 1887–1897, 1989.
[20] Y. Buchäckert, S. Rummel, C. U. Vohwinkel, N. M. Gabrielli, B. A. Grzesik, K.
Mayer, S. Herold, R. E. Morty, W. Seeger, and I. Vadász, “Megalin mediates
transepithelial albumin clearance from the alveolar space of intact rabbit lungs,” J.
Physiol., vol. 590, no. 20, pp. 5167–5181, Oct. 2012.
[21] I. Kolleck, P. Sinha, and B. Rüstow, “Vitamin E as an antioxidant of the lung:
Mechanisms of vitamin E delivery to alveolar type II cells,” Am. J. Respir. Crit. Care
Med., vol. 166, no. 12 II, pp. 62–66, 2002.
[22] K.-J. Kim, Y. Matsukawa, H. Yamahara, V. K. Kalra, V. H. L. Lee, and E. D. Crandall,
“Absorption of intact albumin across rat alveolar epithelial cell monolayers.,” Am. J.
Physiol. Lung Cell. Mol. Physiol., vol. 284, no. 3, pp. L458–L465, 2003.
[23] Y. Butt, A. Kurdowska, and T. C. Allen, “Acute Lung Injury: A Clinical and Molecular
Review,” Arch. Pathol. Lab. Med., vol. 140, no. 4, pp. 345–350, Apr. 2016.
[24] S. Herold, N. M. Gabrielli, and I. Vadasz, “Novel concepts of acute lung injury and
alveolar-capillary barrier dysfunction,” Am J Physiol Lung Cell Mol Physiol, vol. 305,
no. 10, pp. L665-81, 2013.
[25] L. B. Ware and M. A. Matthay, “Alveolar fluid clearance is impaired in the majority of
patients with acute lung injury and the acute respiratory distress syndrome.,” Am J
Respir Crit Care Med, vol. 163, no. 2, pp. 1376–1383, 2001.
[26] M. Bachofen and E. R. Weibel, “Structural alterations of lung parenchyma in the adult
respiratory distress syndrome.,” Clin. Chest Med., vol. 3, no. 1, pp. 35–56, Jan. 1982.
[27] M. Bachofen and E. R. Weibel, “Alterations of the Gas Exchange Apparatus in Adult
Respiratory Insufficiency Associated with Septicemia,” Am. Rev. Respir. Dis., vol. 116,
no. 4, pp. 589–615, Oct. 1977.
[28] L. Ware and M. Matthay, “The acute respiratory distress syndrome,” N. Engl. J. Med.,
vol. 342, no. 18, pp. 1334–1349, May 2000.
[29] M. A. Matthay, G. A. Zimmerman, C. Esmon, J. Bhattacharya, B. Coller, C. M.
Doerschuk, J. Floros, M. A. Gimbrone, E. Hoffman, R. D. Hubmayr, M. Leppert, S.
Matalon, R. Munford, P. Parsons, A. S. Slutsky, K. J. Tracey, P. Ward, D. B. Gail, and
A. L. Harabin, “Future research directions in acute lung injury: Summary of a National
Heart, Lung, and Blood Institute Working Group,” in American Journal of Respiratory
and Critical Care Medicine, 2003, vol. 167, no. 7, pp. 1027–1035.
[30] A. Fein, R. F. Grossman, J. G. Jones, E. Overland, L. Pitts, J. F. Murray, and N. C.
Staub, “The value of edema fluid protein measurement in patients with pulmonary
edema,” Am. J. Med., vol. 67, no. 1, pp. 32–38, Jul. 1979.
[31] J. P. Annes, J. S. Munger, and D. B. Rifkin, “Making sense of latent TGFbeta
activation.,” J. Cell Sci., vol. 116, no. Pt 2, pp. 217–24, Jan. 2003.
[32] A. LEASK, “TGF- signaling and the fibrotic response,” FASEB J., vol. 18, no. 7, pp.
816–827, 2004.
[33] D. Mu, S. Cambier, L. Fjellbirkeland, J. L. Baron, J. S. Munger, H. Kawakatsu, D.
Sheppard, V. Courtney Broaddus, and S. L. Nishimura, “The integrin alpha(v)beta8
mediates epithelial homeostasis through MT1-MMP-dependent activation of TGF-
beta1,” J. Cell Biol., vol. 157, no. 3, pp. 493–507, Apr. 2002.
[34] J. Massagué, “TGF-beta signal transduction.,” Annu. Rev. Biochem., vol. 67, pp. 753–
91, 1998.
[35] A. Nakao, M. Afrakhte, A. Morén, T. Nakayama, J. L. Christian, R. Heuchel, S. Itoh,
M. Kawabata, N.-E. Heldin, C.-H. Heldin, and P. ten Dijke, “Identification of Smad7, a
TGFbeta-inducible antagonist of TGF-beta signalling.,” Nature, vol. 389, no. October,

References
102
pp. 631–635, 1997.
[36] M. Nomura and E. Li, “Smad2 role in mesoderm formation, left-right patterning and
craniofacial development,” Nature, vol. 393, no. 6687, pp. 786–790, 1998.
[37] Y. Zhu, J. A. Richardson, L. F. Parada, and J. M. Graff, “Smad3 Mutant Mice Develop
Metastatic Colorectal Cancer,” Cell, vol. 94, no. 6, pp. 703–714, 1998.
[38] G. Von Gersdorff, K. Susztak, F. Rezvani, M. Bitzer, D. Liang, and E. P. B??ttinger,
“Smad3 and Smad4 mediate transcriptional activation of the human Smad7 promoter
by transforming growth factor ??,” J. Biol. Chem., vol. 275, no. 15, pp. 11320–11326,
2000.
[39] K. M. Mulder, “Role of Ras and Mapks in TGF?? signaling,” Cytokine and Growth
Factor Reviews, vol. 11, no. 1–2. pp. 23–35, 2000.
[40] J. Zhang, X.-J. Tian, and J. Xing, “Signal Transduction Pathways of EMT Induced by
TGF-β, SHH, and WNT and Their Crosstalks,” J. Clin. Med., vol. 5, no. 4, p. 41, 2016.
[41] F. Caraci, E. Gili, M. Calafiore, M. Failla, C. La Rosa, N. Crimi, M. A. Sortino, F.
Nicoletti, A. Copani, and C. Vancheri, “TGF-B1 targets the GSK-3B/B-catenin
pathway via ERK activation in the transition of human lung fibroblasts into
myofibroblasts,” Pharmacol. Res., vol. 57, no. 4, pp. 274–282, Apr. 2008.
[42] X. Guo, A. Ramirez, D. S. Waddell, Z. Li, X. Liu, and X. F. Wang, “Axin and GSK3-β
control Smad3 protein stability and modulate TGF-β signaling,” Genes Dev., vol. 22,
no. 1, pp. 106–120, 2008.
[43] G. R. S. Budinger, N. S. Chandel, H. K. Donnelly, J. Eisenbart, M. Oberoi, and M.
Jain, “Active transforming growth factor-??1 activates the procollagen I promoter in
patients with acute lung injury,” Intensive Care Med., vol. 31, no. 1, pp. 121–128, Jan.
2005.
[44] R. J. Fahy, F. Lichtenberger, C. B. McKeegan, G. J. Nuovo, C. B. Marsh, and M. D.
Wewers, “The acute respiratory distress syndrome: a role for transforming growth
factor-beta 1.,” Am. J. Respir. Cell Mol. Biol., vol. 28, no. 4, pp. 499–503, Apr. 2003.
[45] J. Frank, J. Roux, H. Kawakatsu, G. Su, A. Dagenais, Y. Berthiaume, M. Howard, C.
M. Canessa, X. Fang, D. Sheppard, M. A. Matthay, and J. F. Pittet, “Transforming
Growth Factor-β1 Decreases Expression of the Epithelial Sodium Channel αENaC and
Alveolar Epithelial Vectorial Sodium and Fluid Transport via an ERK1/2-dependent
Mechanism,” J. Biol. Chem., vol. 278, no. 45, pp. 43939–43950, 2003.
[46] R. G. Jenkins, X. Su, G. Su, C. J. Scotton, E. Camerer, G. J. Laurent, G. E. Davis, R. C.
Chambers, M. A. Matthay, and D. Sheppard, “Ligation of protease-activated receptor 1
enhances alpha(v)beta6 integrin-dependent TGF-beta activation and promotes acute
lung injury.,” J. Clin. Invest., vol. 116, no. 6, pp. 1606–14, Jun. 2006.
[47] J. F. Pittet, M. J. Griffiths, T. Geiser, N. Kaminski, S. L. Dalton, X. Huang, L. A.
Brown, P. J. Gotwals, V. E. Koteliansky, M. A. Matthay, and D. Sheppard, “TGF-beta
is a critical mediator of acute lung injury.,” J. Clin. Invest., vol. 107, no. 12, pp. 1537–
44, Jun. 2001.
[48] J. Roux, M. Carles, H. Koh, A. Goolaerts, M. T. Ganter, B. B. Chesebro, M. Howard,
B. T. Houseman, W. Finkbeiner, K. M. Shokat, A. C. Paquet, M. A. Matthay, and J. F.
Pittet, “Transforming growth factor β1 inhibits cystic fibrosis transmembrane
conductance regulator-dependent cAMP-stimulated alveolar epithelial fluid transport
via a phosphatidylinositol 3-kinase-dependent mechanism,” J. Biol. Chem., vol. 285,
no. 7, pp. 4278–4290, Feb. 2010.
[49] B. C. Willis, K.-J. Kim, X. Li, J. Liebler, E. D. Crandall, and Z. Borok, “Modulation of
ion conductance and active transport by TGF-beta 1 in alveolar epithelial cell
monolayers.,” Am. J. Physiol. Lung Cell. Mol. Physiol., vol. 285, no. 6, pp. L1192-200,
Dec. 2003.
[50] D. M. Peters, I. Vadász, L. Wujak, M. Wygrecka, A. Olschewski, C. Becker, S. Herold,

References
103
R. Papp, K. Mayer, S. Rummel, R. P. Brandes, A. Günther, S. Waldegger, O.
Eickelberg, W. Seeger, and R. E. Morty, “TGF-β directs trafficking of the epithelial
sodium channel ENaC which has implications for ion and fluid transport in acute lung
injury.,” Proc. Natl. Acad. Sci. U. S. A., vol. 111, no. 3, pp. E374-83, 2014.
[51] R. Diwakar, A. L. Pearson, P. Colville-Nash, N. J. Brunskill, and M. E. C. Dockrell,
“The role played by endocytosis in albumin-induced secretion of TGF-beta1 by
proximal tubular epithelial cells.,” Am. J. Physiol. Renal Physiol., vol. 292, no. 5, pp.
F1464-70, May 2007.
[52] M. Gekle, P. Knaus, R. Nielsen, S. Mildenberger, R. Freudinger, V. Wohlfarth, C.
Sauvant, and E. I. Christensen, “Transforming growth factor- b 1 reduces megalin- and
cubilin- mediated endocytosis of albumin in proximal-tubule-derived opossum kidney
cells,” Society, vol. 552, no. Pt 2, pp. 471–481, Oct. 2003.
[53] C. Caruso-Neves, A. A. S. Pinheiro, H. Cai, J. Souza-Menezes, and W. B. Guggino,
“PKB and megalin determine the survival or death of renal proximal tubule cells.,”
Proc. Natl. Acad. Sci. U. S. A., vol. 103, no. 49, pp. 18810–5, 2006.
[54] L. M. Russo, E. Del Re, D. Brown, and H. Y. Lin, “Evidence for a role of transforming
growth factor (TGF)-??1 in the induction of postglomerular albuminuria in diabetic
nephropathy: Amelioration by soluble TGF-?? type II receptor,” Diabetes, vol. 56, no.
2, pp. 380–388, Feb. 2007.
[55] M. S. Brown and J. L. Goldstein, “A receptor-mediated pathway for cholesterol
homeostasis.,” Science, vol. 232, no. 4746, pp. 34–47, Apr. 1986.
[56] T. E. Willnow, A. Nykjaer, and J. Herz, “Lipoprotein receptors: new roles for ancient
proteins.,” Nat. Cell Biol., vol. 1, no. 6, pp. E157-62, 1999.
[57] J. Gliemann, “Receptors of the Low Density Lipoprotein (LDL) Receptor Family in
Man. Multiple Functions of the Large Family Members via Interaction with Complex
Ligands,” Biol. Chem., vol. 379, no. 8–9, pp. 951–964, 1998.
[58] D. Kerjaschki and M. G. Farquhar, “Immunocytochemical localization of the Heymann
nephritis antigen (GP330) in glomerular epithelial cells of normal Lewis rats.,” J. Exp.
Med., vol. 157, no. 2, pp. 667–86, Feb. 1983.
[59] D. Kerjaschki and M. G. Farquhar, “The pathogenic antigen of Heymann nephritis is a
membrane glycoprotein of the renal proximal tubule brush border,” Proc. Natl. Acad.
Sci. U. S. A., vol. 79, no. 18 I, pp. 5557–5561, Sep. 1982.
[60] E. I. Christensen, H. Birn, T. Storm, K. Weyer, and R. Nielsen, “Endocytic Receptors
in the Renal Proximal Tubule,” Physiology, vol. 27, no. 4, pp. 223–236, 2012.
[61] E. I. Christensen and H. Birn, “Megalin and cubilin: multifunctional endocytic
receptors.,” Nat. Rev. Mol. Cell Biol., vol. 3, no. 4, pp. 256–66, 2002.
[62] P. J. Verroust and E. I. Christensen, “Megalin and cubilin--the story of two
multipurpose receptors unfolds.,” Nephrol. Dial. Transplant, vol. 17, no. 11, pp. 1867–
71, 2002.
[63] T. E. Willnow, A. Hammes, and S. Eaton, “Lipoproteins and their receptors in
embryonic development: more than cholesterol clearance.,” Development, vol. 134, no.
18, pp. 3239–3249, Sep. 2007.
[64] E. I. Christensen and H. Birn, “Megalin and cubilin: synergistic endocytic receptors in
renal proximal tubule.,” Am. J. Physiol. Renal Physiol., vol. 280, no. 4, pp. F562-73,
Apr. 2001.
[65] T. E. Willnow, J. Hilpert, S. A. Armstrong, A. Rohlmann, R. E. Hammer, D. K. Burns,
and J. Herz, “Defective forebrain development in mice lacking gp330/megalin.,” Proc.
Natl. Acad. Sci. U. S. A., vol. 93, no. 16, pp. 8460–8464, 1996.
[66] A. Knutson, E. Casta??o, T. Oelgeschl??ger, R. G. Roeder, and G. Westin,
“Downstream promoter sequences facilitate the formation of a specific transcription
factor IID-promoter complex topology required for efficient transcription from the

References
104
megalin/low density lipoprotein receptor-related protein 2 promoter,” J. Biol. Chem.,
vol. 275, no. 19, pp. 14190–14197, May 2000.
[67] A. Knutson, P. Hellman, G. Akerström, and G. Westin, “Characterization of the human
Megalin/LRP-2 promoter in vitro and in primary parathyroid cells.,” DNA Cell Biol.,
vol. 17, no. 6, pp. 551–60, Jun. 1998.
[68] A. Knutson, P. Lillhager, and G. Westin, “Identification of a CpG island in the human
LRP-2 gene and analysis of its methylation status in parathyroid adenomas,” Biol
Chem, vol. 381, no. 5–6, pp. 433–438, 2000.
[69] F. Cabezas, J. Lagos, C. Céspedes, C. P. Vio, M. Bronfman, and M. P. Marzolo,
“Megalin/LRP2 expression is induced by peroxisome proliferator-activated receptor -
alpha and -gamma: Implications for PPARs’ roles in renal function,” PLoS One, vol. 6,
no. 2, p. e16794, 2011.
[70] M. P. Marzolo and P. Farfán, “New insights into the roles of megalin/LRP2 and the
regulation of its functional expression,” Biol. Res., vol. 44, no. 1, pp. 89–105, 2011.
[71] W. Liu, W. R. Yu, T. Carling, C. Juhlin, J. Rastad, P. Ridefelt, G. ??kerstr??m, and P.
Hellman, “Regulation of gp330/megalin expression by vitamins A and D,” Eur. J. Clin.
Invest., vol. 28, no. 2, pp. 100–107, Feb. 1998.
[72] H. Ammar and J. L. Closset, “Clusterin activates survival through the
phosphatidylinositol 3-kinase/akt pathway,” J. Biol. Chem., vol. 283, no. 19, pp.
12851–12861, May 2008.
[73] M. Hosojima, H. Sato, K. Yamamoto, R. Kaseda, T. Soma, A. Kobayashi, A. Suzuki,
H. Kabasawa, A. Takeyama, K. Ikuyama, N. Iino, A. Nishiyama, T. J. Thekkumkara,
T. Takeda, Y. Suzuki, F. Gejyo, and A. Saito, “Regulation of megalin expression in
cultured proximal tubule cells by angiotensin II type 1A receptor- And insulin-
mediated signaling cross talk,” Endocrinology, vol. 150, no. 2, pp. 871–878, Feb. 2009.
[74] T. Takeda, H. Yamazaki, and M. G. Farquhar, “Identification of an apical sorting
determinant in the cytoplasmic tail of megalin,” Am. J. Physiol. - Cell Physiol., vol.
284, no. 5, pp. C1105–C1113, 2003.
[75] M. I. Yuseff, P. Farfan, G. Bu, and M. P. Marzolo, “A cytoplasmic PPPSP motif
determines megalin’s phosphorylation and regulates receptor’s recycling and surface
expression,” Traffic, vol. 8, no. 9, pp. 1215–1230, Sep. 2007.
[76] G. Bu, H. J. Geuze, G. J. Strous, and A. L. Schwartz, “39 kDa receptor-associated
protein is an ER resident protein and molecular chaperone for LDL receptor-related
protein.,” EMBO J., vol. 14, no. 10, pp. 2269–80, 1995.
[77] M. Gotthardt, M. Trommsdorff, M. F. Nevitt, J. Shelton, J. A. Richardson, W.
Stockinger, J. Nimpf, and J. Herz, “Interactions of the low density lipoprotein receptor
gene family with cytosolic adaptor and scaffold proteins suggest diverse biological
functions in cellular communication and signal transduction,” J. Biol. Chem., vol. 275,
no. 33, pp. 25616–25624, 2000.
[78] A. V Oleinikov, J. Zhao, and S. P. Makker, “Cytosolic adaptor protein Dab2 is an
intracellular ligand of endocytic receptor gp600/megalin.,” Biochem. J., vol. 347 Pt 3,
pp. 613–21, May 2000.
[79] K. M. Patrie, A. J. Drescher, M. Goyal, R. C. Wiggins, and B. Margolis, “The
membrane-associated guanylate kinase protein MAGI-1 binds megalin and is present in
glomerular podocytes.,” J. Am. Soc. Nephrol., vol. 12, no. 4, pp. 667–677, Apr. 2001.
[80] E. H. Schroeter, J. A. Kisslinger, and R. Kopan, “Notch-1 signalling requires ligand-
induced proteolytic release of intracellular domain,” Nature, vol. 393, no. 6683, pp.
382–386, May 1998.
[81] Y. Li, R. Cong, and D. Biemesderfer, “The COOH terminus of megalin regulates gene
expression in opossum kidney proximal tubule cells.,” Am. J. Physiol. Cell Physiol.,
vol. 295, no. 2, pp. C529–C537, 2008.

References
105
[82] D. Biemesderfer, “Regulated intramembrane proteolysis of megalin: linking urinary
protein and gene regulation in proximal tubule?,” Kidney Int., vol. 69, no. 10, pp.
1717–1721, 2006.
[83] U. Pieper-Fürst, R. Hall, S. Huss, K. Hochrath, H. P. Fischer, F. Tacke, R.
Weiskirchen, and F. Lammert, “Expression of the megalin C-terminal fragment by
macrophages during liver fibrogenesis in mice,” Biochim. Biophys. Acta - Mol. Basis
Dis., vol. 1812, no. 12, pp. 1640–1648, 2011.
[84] Z. Zou, B. Chung, T. Nguyen, S. Mentone, B. Thomson, and D. Biemesderfer,
“Linking receptor-mediated endocytosis and cell signaling: Evidence for regulated
intramembrane proteolysis of megalin in proximal tubule,” J. Biol. Chem., vol. 279, no.
33, pp. 34302–34310, 2004.
[85] P. May, H. H. Bock, and J. Herz, “Integration of endocytosis and signal transduction
by lipoprotein receptors.,” Sci. STKE, vol. 2003, no. 176, p. PE12, Apr. 2003.
[86] H. H. Petersen, J. Hilpert, D. Militz, V. Zandler, C. Jacobsen, A. J. M. Roebroek, and
T. E. Willnow, “Functional interaction of megalin with the megalinbinding protein
(MegBP), a novel tetratrico peptide repeat-containing adaptor molecule,” J. Cell Sci.,
vol. 116, no. 3, pp. 453–461, Feb. 2002.
[87] M. Wygrecka, J. Wilhelm, E. Jablonska, D. Zakrzewicz, K. T. Preissner, W. Seeger, A.
Guenther, and P. Markart, “Shedding of low-density lipoprotein receptor-related
protein-1 in acute respiratory distress syndrome,” Am. J. Respir. Crit. Care Med., vol.
184, no. 4, pp. 438–448, 2011.
[88] J. Herrmann, L. O. Lerman, and A. Lerman, “Ubiquitin and ubiquitin-like proteins in
protein regulation,” Circ. Res., vol. 100, no. 9, pp. 1276–1291, 2007.
[89] A. Hershko and C. Aaron, “the Ubiquitin System,” Annu. Rev. Biochem., vol. 67, pp.
425–79, 1998.
[90] A. Ciechanover, “Proteolysis: from the lysosome to ubiquitin and the proteasome.,”
Nat. Rev. Mol. Cell Biol., vol. 6, no. 1, pp. 79–87, 2005.
[91] J. M. Winget and T. Mayor, “The Diversity of Ubiquitin Recognition: Hot Spots and
Varied Specificity,” Molecular Cell, vol. 38, no. 5. pp. 627–635, 11-Jun-2010.
[92] P. Xu, D. M. Duong, N. T. Seyfried, D. Cheng, Y. Xie, J. Robert, J. Rush, M.
Hochstrasser, D. Finley, and J. Peng, “Quantitative Proteomics Reveals the Function of
Unconventional Ubiquitin Chains in Proteasomal Degradation,” Cell, vol. 137, no. 1,
pp. 133–145, Apr. 2009.
[93] I. Vadász, C. H. Weiss, and J. I. Sznajder, “Ubiquitination and proteolysis in acute lung
injury,” Chest, vol. 141, no. 3. pp. 763–771, 2012.
[94] S. H. Lecker, “Protein Degradation by the Ubiquitin-Proteasome Pathway in Normal
and Disease States,” J. Am. Soc. Nephrol., vol. 17, no. 7, pp. 1807–1819, 2006.
[95] S. Nickell, F. Beck, S. H. W. Scheres, A. Korinek, F. Förster, K. Lasker, O. Mihalache,
N. Sun, I. Nagy, A. Sali, J. M. Plitzko, J.-M. Carazo, M. Mann, and W. Baumeister,
“Insights into the molecular architecture of the 26S proteasome,” Proc. Natl. Acad. Sci.
U. S. A., vol. 106, no. 29, pp. 11943–11947, Jul. 2009.
[96] L. Hicke and R. Dunn, “REGULATION OF MEMBRANE PROTEIN TRANSPORT
BY U BIQUITIN AND UBIQUITIN-B INDING PROTEINS,” Annu. Rev. Cell Dev.
Biol., vol. 19, no. 1, pp. 141–172, 2003.
[97] F. Tokunaga and K. Iwai, “LUBAC, a novel ubiquitin ligase for linear ubiquitination,
is crucial for inflammation and immune responses.,” Microbes Infect., vol. 14, no. 7–8,
pp. 563–72, Jul. 2012.
[98] D. E. Spratt, H. Walden, and G. S. Shaw, “RBR E3 ubiquitin ligases: new structures,
new insights, new questions.,” Biochem. J., vol. 458, no. 3, pp. 421–37, Mar. 2014.
[99] Y. Kulathu and D. Komander, “Atypical ubiquitylation — the unexplored world of
polyubiquitin beyond Lys48 and Lys63 linkages,” Nat. Rev. Mol. Cell Biol., vol. 13,

References
106
no. 8, pp. 508–523, 2012.
[100] E. Rieser, S. M. Cordier, and H. Walczak, “Linear ubiquitination: a newly discovered
regulator of cell signalling.,” Trends Biochem. Sci., vol. 38, no. 2, pp. 94–102, Feb.
2013.
[101] J. F. Woessner, “The family of matrix metalloproteinases,” in Annals of the New York
Academy of Sciences, 1994, vol. 732, pp. 11–21.
[102] M. Corbel, E. Boichot, and V. Lagente, “Role of gelatinases MMP-2 and MMP-9 in
tissue remodeling following acute lung injury.,” Braz. J. Med. Biol. Res., vol. 33, no. 7,
pp. 749–54, 2000.
[103] S. Zucker, D. Pei, J. Cao, and C. Lopez-Otin, “Membrane type-matrix
metalloproteinases (MT-MMP).,” Curr. Top. Dev. Biol., vol. 54, pp. 1–74, 2003.
[104] O. Boucherat, J. R. Bourbon, A.-M. Barlier-Mur, B. Chailley-Heu, M.-P. D’Ortho, and
C. Delacourt, “Differential expression of matrix metalloproteinases and inhibitors in
developing rat lung mesenchymal and epithelial cells.,” Pediatr. Res., vol. 62, no. 1,
pp. 20–25, 2007.
[105] T D TetleY, “Proteiinase imbalance: its role in lung disease,” Thorax, vol. 48, pp. 560–
565, 1993.
[106] C. Delclaux, M. P. D’Ortho, C. Delacourt, F. Lebargy, C. Brun-Buisson, L. Brochard,
F. Lemaire, C. Lafuma, and A. Harf, “Gelatinases in epithelial lining fluid of patients
with adult respiratory distress syndrome,” Am J Physiol, vol. 272, no. 3 Pt 1, pp. L442-
51, Mar. 1997.
[107] B. Ricou, L. Nicod, S. Lacraz, H. G. Welgus, P. M. Suter, and J. M. Dayer, “Matrix
metalloproteinases and TIMP in acute respiratory distress syndrome,” Am J Respir Crit
Care Med, vol. 154, no. 2 Pt 1, pp. 346–352, Aug. 1996.
[108] K. Torii, K. Iida, Y. Miyazaki, S. Saga, Y. Kondoh, H. Taniguchi, F. Taki, K. Takagi,
M. Matsuyama, and R. Suzuki, “Higher concentrations of matrix metalloproteinases in
bronchoalveolar lavage fluid of patients with adult respiratory distress syndrome.,” Am.
J. Respir. Crit. Care Med., vol. 155, no. 1, pp. 43–6, Jan. 1997.
[109] G. Murphy and H. Nagase, “Localizing matrix metalloproteinase activities in the
pericellular environment.,” FEBS J., vol. 278, no. 1, pp. 2–15, Jan. 2011.
[110] H. Emonard and E. Marbaix, “Low-density lipoprotein receptor-related protein in
metalloproteinase-mediated pathologies: recent insights,” Met. Med., vol. Volume 2, p.
9, Feb. 2015.
[111] P. J. Wipff and B. Hinz, “Integrins and the activation of latent transforming growth
factor ??1 - An intimate relationship,” European Journal of Cell Biology, vol. 87, no.
8–9. pp. 601–615, Sep-2008.
[112] G. Jenkins, “The role of proteases in transforming growth factor-beta activation.,” Int.
J. Biochem. Cell Biol., vol. 40, no. 6–7, pp. 1068–78, 2008.
[113] M. Quintanilla, G. Castillo, J. Kocic, and J. F. Santibáñez, “TGF-β and MMPs: A
complex regulatory loop involved in tumor progression,” in Matrix
Metalloproteinases: Biology, Functions and Clinical Implications, 2012, pp. 1–38.
[114] J. Krstic, J. F. Santibanez, J. Krstic, and J. F. Santibanez, “Transforming Growth
Factor-Beta and Matrix Metalloproteinases: Functional Interactions in Tumor Stroma-
Infiltrating Myeloid Cells,” Sci. World J., vol. 2014, pp. 1–14, 2014.
[115] Y. Li, J. Yang, C. Dai, C. Wu, and Y. Liu, “Role for integrin-linked kinase in
mediating tubular epithelial to mesenchymal transition and renal interstitial
fibrogenesis,” J. Clin. Invest., vol. 112, no. 4, pp. 503–516, 2003.
[116] F. Strutz, M. Zeisberg, F. N. Ziyadeh, C.-Q. Yang, R. Kalluri, G. A. Müller, and E. G.
Neilson, “Role of basic fibroblast growth factor-2 in epithelial-mesenchymal
transformation.,” Kidney Int., vol. 61, no. 5, pp. 1714–1728, May 2002.
[117] P. Stawowy, C. Margeta, H. Kallisch, N. G. Seidah, M. Chrétien, E. Fleck, and K.

References
107
Graf, “Regulation of matrix metalloproteinase MT1-MMP/MMP-2 in cardiac
fibroblasts by TGF-β1 involves furin-convertase,” Cardiovasc. Res., vol. 63, no. 1, pp.
87–97, 2004.
[118] X. Zhao and J. Zhang, “[Mechanisms for quercetin in prevention of lung cancer cell
growth and metastasis].,” Zhong Nan Da Xue Xue Bao. Yi Xue Ban, vol. 40, no. 6, pp.
592–7, Jun. 2015.
[119] B. Ma, P. Y. Zhou, W. Ni, W. Wei, D. F. Ben, W. Lu, and Z. F. Xia, “Inhibition of
activin receptor-like kinase 5 induces matrix metallopeptidase 9 expression and
aggravates lipopolysaccharide-induced pulmonary injury in mice,” Eur. Rev. Med.
Pharmacol. Sci., vol. 17, no. 8, pp. 1051–1059, 2013.
[120] A. Mukherjee, S. Roy, B. Saha, and D. Mukherjee, “Spatio-Temporal Regulation of
PKC Isoforms Imparts Signaling Specificity,” Front. Immunol., vol. 7, no. February,
pp. 1–7, 2016.
[121] S. Chakraborti, M. Mandal, S. Das, A. Mandal, and T. Chakraborti, “Regulation of
matrix metalloproteinases. An overview,” Molecular and Cellular Biochemistry, vol.
253, no. 1–2. pp. 269–285, Nov-2003.
[122] S. M. Wojtowicz-Praga, R. B. Dickson, and M. J. Hawkins, “Matrix metalloproteinase
inhibitors.,” Invest. New Drugs, vol. 15, no. 1, pp. 61–75, 1997.
[123] C. C. Yang, C. C. Lin, P. T. Y. Chien, L. Der Hsiao, and C. M. Yang,
“Thrombin/Matrix Metalloproteinase-9-Dependent SK-N-SH Cell Migration is
Mediated Through a PLC/PKC/MAPKs/NF-??B Cascade,” Molecular Neurobiology,
26-Oct-2015.
[124] E. M. Noh, Y. J. Park, J. M. Kim, M. S. Kim, H. R. Kim, H. K. Song, O. Y. Hong, H.
S. So, S. H. Yang, J. S. Kim, S. H. Park, H. J. Youn, Y. O. You, K. B. Choi, K. B.
Kwon, and Y. R. Lee, “Fisetin regulates TPA-induced breast cell invasion by
suppressing matrix metalloproteinase-9 activation via the PKC/ROS/MAPK
pathways,” Eur. J. Pharmacol., vol. 764, pp. 79–86, Oct. 2015.
[125] E.-M. Noh, Y.-R. Lee, O.-Y. Hong, S. H. Jung, H. J. Youn, and J.-S. Kim, “Aurora
kinases are essential for PKC-induced invasion and matrix metalloproteinase-9
expression in MCF-7 breast cancer cells.,” Oncol. Rep., vol. 34, no. 2, pp. 803–810,
Aug. 2015.
[126] M. J. Mondrinos, P. A. Kennedy, M. Lyons, C. S. Deutschman, and L. E. Kilpatrick,
“Protein Kinase C and Acute Respiratory Distress Syndrome,” Shock, vol. 39, no. 6,
pp. 467–479, 2013.
[127] J. Y. C. Chow, H. Dong, K. T. Quach, P. N. Van Nguyen, K. Chen, and J. M.
Carethers, “TGF-beta mediates PTEN suppression and cell motility through calcium-
dependent PKC-alpha activation in pancreatic cancer cells.,” Am. J. Physiol.
Gastrointest. Liver Physiol., vol. 294, no. 4, pp. G899-905, Apr. 2008.
[128] T. Hayashida and H. W. Schnaper, “High ambient glucose enhances sensitivity to
TGF-beta1 via extracellular signal--regulated kinase and protein kinase Cdelta
activities in human mesangial cells.,” J. Am. Soc. Nephrol., vol. 15, no. 8, pp. 2032–41,
Aug. 2004.
[129] C. E. Runyan, H. W. Schnaper, and A.-C. Poncelet, “Smad3 and PKCdelta mediate
TGF-beta1-induced collagen I expression in human mesangial cells.,” Am. J. Physiol.
Renal Physiol., vol. 285, no. 3, pp. F413-22, Sep. 2003.
[130] E. J. Ryer, R. P. Hom, K. Sakakibara, K. I. Nakayama, K. Nakayama, P. L. Faries, B.
Liu, and K. C. Kent, “PKCδ is necessary for Smad3 expression and transforming
growth factor β-induced fibronectin synthesis in vascular smooth muscle cells,”
Arterioscler. Thromb. Vasc. Biol., vol. 26, no. 4, pp. 780–786, 2006.
[131] A. Gunaratne, H. Benchabane, and G. M. Di Guglielmo, “Regulation of TGF??
receptor trafficking and signaling by atypical protein kinase C,” Cell. Signal., vol. 24,

References
108
no. 1, pp. 119–130, 2012.
[132] P. J. Goode, N.; Hughes, K.; Woodgett, J. R. ; Parkeri, “Differential Regulation of
Glycogen Synthase Kinase-3B by Protein Kinase C Isotypes,” J. Biol. Chem., vol. 267,
no. 25, pp. 16878–16882, 1992.
[133] B. Ozdamar, R. Bose, M. Barrios-Rodiles, H.-R. Wang, Y. Zhang, and J. L. Wrana,
“Regulation of the polarity protein Par6 by TGFbeta receptors controls epithelial cell
plasticity.,” Science, vol. 307, no. 5715, pp. 1603–9, Mar. 2005.
[134] H.-R. Wang, Y. Zhang, B. Ozdamar, A. A. Ogunjimi, E. Alexandrova, G. H. Thomsen,
and J. L. Wrana, “Regulation of cell polarity and protrusion formation by targeting
RhoA for degradation.,” Science, vol. 302, no. 5651, pp. 1775–1779, Dec. 2003.
[135] S. K. Gudey, R. Sundar, Y. Mu, A. Wallenius, G. Zang, A. Bergh, C.-H. Heldin, and
M. Landström, “TRAF6 Stimulates the Tumor-Promoting Effects of TGFβ Type I
Receptor Through Polyubiquitination and Activation of Presenilin 1.,” Sci. Signal., vol.
7, no. 307, p. ra2, Jan. 2014.
[136] I. Vadász, L. a Dada, A. Briva, H. E. Trejo, L. C. Welch, J. Chen, P. T. Tóth, E.
Lecuona, L. a Witters, P. T. Schumacker, N. S. Chandel, W. Seeger, J. I. Sznajder, I.
Vadasz, and P. T. Toth, “AMP-activated protein kinase regulates CO 2 -induced
alveolar epithelial dysfunction in rats and human cells by promoting Na,K-ATPase
endocytosis,” J. Clin. Invest., vol. 118, no. 2, pp. 752–762, 2008.
[137] Y. Song, Y. Hao, A. Sun, T. Li, W. Li, L. Guo, Y. Yan, C. Geng, N. Chen, F. Zhong,
H. Wei, Y. Jiang, and F. He, “Sample preparation project for the subcellular proteome
of mouse liver,” Proteomics, vol. 6, no. 19, pp. 5269–5277, Oct. 2006.
[138] B. Cox and A. Emili, “Tissue subcellular fractionation and protein extraction for use in
mass-spectrometry-based proteomics.,” Nat. Protoc., vol. 1, no. 4, pp. 1872–8, 2006.
[139] T. Stasyk, N. Schiefermeier, S. Skvortsov, H. Zwierzina, J. Peränen, G. K. Bonn, and
L. A. Huber, “Identification of endosomal epidermal growth factor receptor signaling
targets by functional organelle proteomics.,” Mol. Cell. Proteomics, vol. 6, pp. 908–
922, 2007.
[140] P. Holden and W. A. Horton, “Crude subcellular fractionation of cultured mammalian
cell lines.,” BMC Res. Notes, vol. 2, p. 243, 2009.
[141] M. Gaczynska, A. L. Goldberg, K. Tanaka, K. B. Hendil, and K. L. Rock, “Proteasome
subunits X and Y alter peptidase activities in opposite ways to the interferon-??-
induced subunits LMP2 and LMP7,” J. Biol. Chem., vol. 271, no. 29, pp. 17275–
17280, 1996.
[142] W. Y. To and C. C. Wang, “Identification and characterization of an activated 20S
proteasome in Trypanosoma brucei.,” FEBS Lett., vol. 404, no. 2–3, pp. 253–62, Mar.
1997.
[143] R. M. Dai, E. Chen, D. L. Longo, C. M. Gorbea, and C. C. H. Li, “Involvement of
valosin-containing protein, an ATPase co-purified with I??B?? and 26 S proteasome, in
ubiquitin-proteasome-mediated degradation of I??B??,” J. Biol. Chem., vol. 273, no. 6,
pp. 3562–3573, 1998.
[144] C. J. Schröter, M. Braun, J. Englert, H. Beck, H. Schmid, and H. Kalbacher, “A rapid
method to separate endosomes from lysosomal contents using differential
centrifugation and hypotonic lysis of lysosomes,” J. Immunol. Methods, vol. 227, no.
1–2, pp. 161–168, 1999.
[145] Y. Xue, A. Li, L. Wang, H. Feng, and X. Yao, “PPSP: prediction of PK-specific
phosphorylation site with Bayesian decision theory.,” BMC Bioinformatics, vol. 7, p.
163, 2006.
[146] M. A. Matthay, Y. Berthiaume, and N. C. Staub, “Long-term clearance of liquid and
protein from the lungs of unanesthetized sheep.,” J. Appl. Physiol., vol. 59, no. 3, pp.
928–34, 1985.

References
109
[147] T. Wileman, C. Harding, and P. Stahl, “Receptor-mediated endocytosis.,” Biochem. J.,
vol. 232, no. 1, p. 1, 1985.
[148] P. Gena, G. Calamita, and W. B. Guggino, “Cadmium impairs albumin reabsorption by
down-regulating megalin and clc5 channels in renal proximal tubule cells,” Environ.
Health Perspect., vol. 118, no. 11, pp. 1551–1556, Nov. 2010.
[149] V. I. Korolchuk, F. M. Menzies, and D. C. Rubinsztein, “Mechanisms of cross-talk
between the ubiquitin-proteasome and autophagy-lysosome systems,” FEBS Letters,
vol. 584, no. 7. pp. 1393–1398, 2010.
[150] W.-X. Ding, H.-M. Ni, W. Gao, T. Yoshimori, D. B. Stolz, D. Ron, and X.-M. Yin,
“Linking of autophagy to ubiquitin-proteasome system is important for the regulation
of endoplasmic reticulum stress and cell viability.,” Am. J. Pathol., vol. 171, no. 2, pp.
513–24, 2007.
[151] A. Iwata, B. E. Riley, J. A. Johnston, and R. R. Kopito, “HDAC6 and microtubules are
required for autophagic degradation of aggregated Huntingtin,” J. Biol. Chem., vol.
280, no. 48, pp. 40282–40292, 2005.
[152] A. E. Perez Bay, R. Schreiner, I. Benedicto, M. Paz Marzolo, J. Banfelder, A. M.
Weinstein, and E. J. Rodriguez-Boulan, “The fast-recycling receptor Megalin defines
the apical recycling pathway of epithelial cells,” Nat. Commun., vol. 7, no. May, p.
11550, 2016.
[153] R. C. Piper, I. Dikic, and G. L. Lukacs, “Ubiquitin-dependent sorting in endocytosis.,”
Cold Spring Harb. Perspect. Biol., vol. 6, no. 1, 2014.
[154] M. Becuwe, A. Herrador, R. Haguenauer-Tsapis, O. Vincent, and S. L??on,
“Ubiquitin-mediated regulation of endocytosis by proteins of the arrestin family,”
Biochem. Res. Int., vol. 2012, 2012.
[155] G. J. Strous and R. Govers, “The ubiquitin-proteasome system and endocytosis,” J.
Cell Sci., vol. 1423, pp. 1417–1423, 1999.
[156] D. Biemesderfer, J. Pizzonia, A. Abu-Alfa, M. Exner, R. Reilly, P. Igarashi, and P. S.
Aronson, “NHE3: a Na+/H+ exchanger isoform of renal brush border.,” Am. J.
Physiol., vol. 265, no. 5 Pt 2, pp. F736–F742, Nov. 1993.
[157] E. P. Nord, S. E. Brown, and E. D. Crandall, “Characterization of Na+-H+ antiport in
type II alveolar epithelial cells,” Am. J. Physiol., vol. 252, no. 5 Pt 1, pp. C490-498,
1987.
[158] D. Biemesderfer, B. DeGray, and P. S. Aronson, “Active (9.6 S) and Inactive (21 S)
Oligomers of NHE3 in Microdomains of the Renal Brush Border,” J. Biol. Chem., vol.
276, no. 13, pp. 10161–10167, 2001.
[159] C. W. Chow, “Regulation and intracellular localization of the epithelial isoforms of the
Na+/H+ exchangers NHE2 and NHE3,” Clin. Investig. Med., vol. 22, no. 5, pp. 195–
206, 1999.
[160] K. Hayashida, A. H. Bartlett, Y. Chen, and P. W. Park, “Molecular and Cellular
Mechanisms of Ectodomain Shedding,” Anat. Rec., vol. 293, no. 6, pp. 925–937, 2010.
[161] R. Kopan and M. X. G. Ilagan, “Gamma-secretase: proteasome of the membrane?,”
Nat. Rev. Mol. Cell Biol., vol. 5, no. 6, pp. 499–504, 2004.
[162] E. Fransvea, U. Angelotti, S. Antonaci, and G. Giannelli, “Blocking transforming
growth factor-beta up-regulates E-cadherin and reduces migration and invasion of
hepatocellular carcinoma cells,” Hepatology, vol. 47, no. 5, pp. 1557–1566, May 2008.
[163] R. Vogelmann, M.-D. Nguyen-tat, K. Giehl, G. Adler, D. Wedlich, and A. Menke,
“TGF-β induced downregulation of E-cadherin-based cell-cell adhesion depends on
PI3-kinase and PTEN,” J. Cell Sci., vol. 118, no. 20, pp. 4901–4912, Oct. 2005.
[164] J. K. McGuire, Q. Li, and W. C. Parks, “Matrilysin (matrix metalloproteinase-7)
mediates E-cadherin ectodomain shedding in injured lung epithelium.,” Am. J. Pathol.,
vol. 162, no. 6, pp. 1831–43, Jun. 2003.

References
110
[165] S. Chakraborti, A. Mandal, S. Das, and T. Chakraborti, “Role of MMP-2 in PKCδ-
mediated inhibition of Na+ dependent Ca2+ uptake in microsomes of pulmonary
smooth muscle: Involvement of a pertussis toxin sensitive protein,” Mol. Cell.
Biochem., vol. 280, no. 1–2, pp. 107–117, Dec. 2005.
[166] Z. Xie, M. Singh, and K. Singh, “Differential regulation of matrix metalloproteinase-2
and -9 expression and activity in adult rat cardiac fibroblasts in response to interleukin-
1beta.,” J. Biol. Chem., vol. 279, no. 38, pp. 39513–9, Sep. 2004.
[167] H. Kasai, J. T. Allen, R. M. Mason, T. Kamimura, and Z. Zhang, “TGF-beta1 induces
human alveolar epithelial to mesenchymal cell transition (EMT).,” Respir. Res., vol. 6,
p. 56, 2005.
[168] S. Kunugi, Y. Fukuda, M. Ishizaki, and N. Yamanaka, “Role of MMP-2 in alveolar
epithelial cell repair after bleomycin administration in rabbits,” Lab Invest, vol. 81, no.
9, pp. 1309–1318, 2001.
[169] H. Nagase, “Cell surface activation of progelatinase A (proMMP-2) and cell
migration.,” Cell Res., vol. 8, no. 3, pp. 179–86, Sep. 1998.

Acknowledgments
111
7. Acknowledgments
In first place, I would like to express my gratitude to Prof. Dr. Werner Seeger for his
supervision of my PhD studies, for his support and advice.
I am also grateful to Prof. Dr. Martin Diener for his co-supervision of my PhD studies.
I would like to especially thank Dr. István Vadász for the opportunity of continuing my career
abroad, for his close supervision of my work, for his advice, support and patience.
I am also very grateful to Dr. Rory Morty for giving me the chance to actively participate in
the MBML program and for taking care of us.
My special thanks to the members of the MBML committee Dr. Dorothea Peters and Dr.
Florian Veit for organizing the lectures, tutorials and symposiums so efficiently, for your
advice and support.
I would like to thank Dr. María Paz Marzolo from Universidad Pontificia of Chile for sharing
megalin plasmid with us.
Thanks a lot to Miriam Wessendorf for her technical support, friendship and “German-to-
English translations”.
Thanks to my all friends from the MBML program and from the Max Planck Institute for
making my stay in Giessen much more enjoyable, and to my lab mates for being there.
To my volleyball team mates and coach, Thomas, thank you for teaching me the good things
of the German culture.
I am entirely thankful to all my family members, particularly, to my sister, my father, my
cousins, my aunts and uncles, my grand and godparents for their priceless support and good
wishes along all these years.
To my unconditional friends Carla, Nano and Sergio, thank you for being so close in the
distance and for remembering me.
I am deeply grateful to my dear husband for his advice, support and love without limits, but
most of all, for being always by my side no matter what.
Finally, I would like to dedicate this thesis to my mother, a clear example of courage, strength
and love. Thank you for all your effort and patience. Love you mum.

Der Lebenslauf wurde aus der elektronischen Version der Arbeit entfernt.
The curriculum vitae was removed from the electronic version of the paper.

112