tfrss oir ro 196507
TRANSCRIPT
Treasury-Federal Reserve Study of the U.S. Government Securities Market
EFFECTS OF OPERATIONS IN COUPON ISSUES ON INTEREST RATES AND FLOWS OF FUNDS OVER SHORTER TIME INTERVALS
Staff Study prepared by Jack C. Rothwell Economist Federal Reserve Bank of Philadelphia July 1965
Digitized for FRASER http://fraser.stlouisfed.org/ Federal Reserve Bank of St. Louis

THE FEDERAL
RESERVE BANK of ST. LOUIS
Research Library
Digitized for FRASER http://fraser.stlouisfed.org/ Federal Reserve Bank of St. Louis

EFFECTS OF OPERATIONS IN COUPON ISSUES ON INTEREST RATES AND FLOWS OF FUNDS
OVER SHORTER TIME INTERVALS
by Jack C. Rothwell, Economist
Federal Reserve Bank of Philadelphia
Operations in coupon issues, undertaken upon occasion since early 1961,
have had the following purpose, as stated in the Board of Governors Annual Report
for 1961:
...the purchasing of securities in the intermediate- and longer-term areas, as contrasted with the short-term area, offered the possibility of supplying reserves without creating direct pressure on short-term rates. Also, such purchases, by having a moderating influence on long-term interest rates relative to short-term rates, might have the effect of facilitating the flow of funds through the capital and. mortgage markets, thereby encouraging the progress of recovery.
In this paper an attempt is made to evaluate the extent to which these
policy objectives have been achieved over shorter time periods.
At the outset, it should be noted that conclusions with respect to the
success of operations in coupon issues can at best be only tentative. The short
period of time over which the policy has been administered provides relatively
few observations to test against prior experience. Moreover, the behavior of
interest rates and flows of funds is a very complex multivariate function. It is
extremely difficult even to identify all of the variables affecting these magnitudes,
much less to discern the precise quantitative significance of each. Still it is
important to investigate the effect of operations in coupon issues. Partial know-
ledge, though inconclusive, is a better guide to policy than no knowledge at all.
With respect to procedure, two types of tests axe employed, both involving
comparison of periods in which coupon operations were relatively intense to periods
in which they were not. First, we look at the early phase of the present cyclical
-Board of Governors of the Federal Reserve System, Annual Report, 1961, p. 40.
Digitized for FRASER http://fraser.stlouisfed.org/ Federal Reserve Bank of St. Louis
2
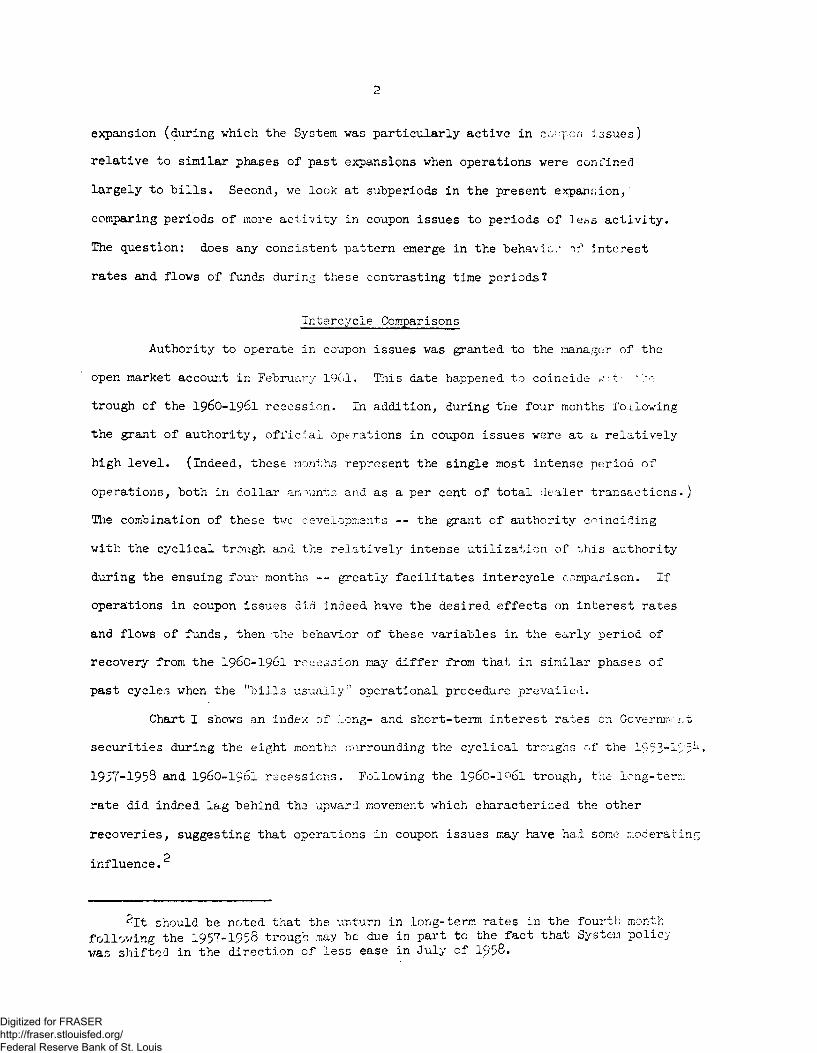
expansion (during which the System was particularly active in coupon issues)
relative to similar phases of past expansions when operations were confined
largely to bills. Second, we look at subperiods in the present expansion,
comparing periods of more activity in coupon issues to periods of 1ebs activity.
The question: does any consistent pattern emerge in the behavior if interest
rates and flows of funds during these contrasting time periods?
Intercycle Comparisons
Authority to operate in coupon issues was granted to the manager of the
open market account in February IQol. This date happened, to coincide w t- rno
trough of the 1960-1961 recession. In addition, during the four months following
the grant of authority, official operations in coupon issues were at a relatively
high level, (indeed,, these months represent the single most intense period of
operations, both in dollar amounts and as a per cent of total dealer transactions.)
The combination of these two developments -- the grant of authority coinciding
with the cyclical trough and the relatively intense utilization of this authority
during the ensuing four months -- greatly facilitates intercycle comparison. If
operations in coupon issues did. indeed have the desired effects on interest rates
and flows of funds, then the behavior of these variables in the early period of
recovery from the I96O-I96I recession may differ from that in similar phases of
past cycles when the "bills usually" operational procedure prevailed.
Chart I shows an index of long- and short-term interest rates on Governir/,:.t
securities during the eight months surrounding the cyclical troughs of the 1953-195^,
1957-1958 and I96O-I96I recessions. Following the 196C-I96I trough, the long-term
rate did indeed lag behind the upward movement which characterized the other
recoveries, suggesting that operations in coupon issues may have had some moderating p
influence.
^It should be noted, that the upturn in long-term rates in the fourth month following the 1957-1958 trough may be due in part to the fact that System policy was shifted in the direction of less ease in July cf 1958.
Digitized for FRASER http://fraser.stlouisfed.org/ Federal Reserve Bank of St. Louis

3 The behavior of rates on short-term Governments is shown in the second
panel of Chart I. During the early months of 1961, when rather heavy official
purchases of coupon issues took place, the short-term rate remained relatively
stable at a level above that of 1957-1958 and only slightly below 1953-195^- This
could be interpreted in several ways. By purchasing coupon issues, the System may
have helped keep downward pressures off short-term rates thus helping to maintain
rates at the generally higher levels prevailing during the 1960-1961 recession;
in the absence of System action, rates might have fallen. Alternatively, one
could reason that, though the index of short-term rates remained at a high and
more stable level in 1961 than in 1957-1958, the 1961 performance differed little
from that in 1953-195^, hence one cannot conclude with a high degree of certainty
tha.t operations in coupon issues served to differentiate the 1961 experience from
earlier periods. Certainly the effect of operations in coupon issues appears to
be less clear-cut in the case of short-term than in long-term rates.
With respect to flows of funds, System action was designed to "ha.ve a
moderating influence on long-term interest rates relative to short-term rates,
^which7 might have the effect of facilitating the flow of funds through the
capital and mortgage markets..." If the action were indeed successful, one might
expect a relatively large flow of funds in the 1961 recovery in those markets
sensitive to such a "moderating influence," that is, in the markets for corporate
bonds, state and local government securities, and mortgages.
Chart H shows an index of the cumulative flow of funds through these three
markets during the four months following the cyclical troughs of the 1953-195^*
1957-1958, and I96O-I96I recessions. During the 1961 recovery, with the System
active in coupon issues, corporate bond flotations were substantially larger
than in the earlier periods.^ Real estate credit extended was roughly similar in
3In the corporate bond index, two different base periods were used: (a) average of flotations during the trough month and months immediately preceeding and following the trough, (b) average of flotations during the three months preceeding the trough. The second, base period was employed, both in the corporate index and. in the total index because flotations in the first base period appeared abnormally depressed..
Digitized for FRASER http://fraser.stlouisfed.org/ Federal Reserve Bank of St. Louis

k
all three periods. State and local flotations in 1961 lagged behind the 195^
period hut exceeded the 1958 experience. Finally, a combination of the three
flows into a single cumulative index (the last panel of Chart n), produces a margin
in favor of the 1961 recovery period.
In summary, then, a cycle-to-cycle comparison of early recovery periods
yields some indication that operations in coupon issues may have had some effect
in the direction envisaged by the System. The index of long-term interest rates
remained relatively stable; though the index of short-term rates was not con-
sistently higher than in past recovery periods, there was little downward pressure
on these rates; indexes4of flows of funds, both in important individual sectors
and in the aggregate were relatively large in the 1961 recovery.
Again it should be emphasized, however, that the available evidence
should be classified more as indicative than conclusive. The observations are
few in number; there were many forces influencing interest rates and flows of
funds in the various cycles so that it becomes difficult indeed to disentangle
the specific results of official operations in coupon issues.
From the intercycle comparisons, let us now turn to intracycle data.
Does there appear to be some differential impact on interest rates and flows of
funds in periods of greater and lesser intensity of coupon purchases during the
present business expansion?
Intracycle Comparisons
To throw some light on this question, the present cyclical expansion
was divided into four subperiods reflecting considerable variation in intensity
of operations in coupon issues. These periods were as follows:
Digitized for FRASER http://fraser.stlouisfed.org/ Federal Reserve Bank of St. Louis

5
Table 1
Monthly Average of Net Offical Purchases of Coupon Issues
1 Year and Over to Maturity, 5 Years and Over to Mat urity Per Cent of Per Cent of
Dollar Amount Total Dealer Dollar Amount Total Dealer (millions) Transactions (millions) Transactions
1. March 1961 through July 1961 ... Active Phase 515.2 6.9 272.7 13.5
2. Jan. 1962 through July 1962 ... Passive Phase 134.9 2.0 14.4 0.5
3. Aug. 1963 through Nov. 1963 ... Active Phase 336.7 4.5 249.9 6.5
4. Dec. 1963 through May 1964 ... Passive Phase 51.5 0.6 52.4 1.2
The behavior of interest rates during these periods is shown in Chart III.
Rates on long-term governments (computed on an index basis with the first month
of each period as base) shows a pattern of upward rather than downward pressure
during the periods of active official operations in coupon issues. This upward
pressure is evident relative bouh to the base periods of the active phases and
relative to the behavior of interest rates in the passive periods.
At least two interpretations of the behavior of long-term rates are
possible. On the one hand, it could be argued that official operations had little
effect in moderating upward pressures in the long end of the market during the
active phases. On the other hand, one could argue that it was the very rise
in rates that brought official action into the market in the first place, and that
in the absence of official action, rates would probably have gone even higher
than they did. One thing may be said in any case: the effect of official action
is less than clear-cut.
This latter statement also holds true for the behavior of short-term
Government rates. (Panel 2 of Chart III). In the first active phase, short
rates held at a low level both relative to the base month and relative to
the behavior of rates in the passive periods. In the second active phase,
Digitized for FRASER http://fraser.stlouisfed.org/ Federal Reserve Bank of St. Louis

6
short rates rose relative to the base month and relative to one of the passive
periods. Such disparate behavior complicates any effort to assess the effect
of System action on short-term rates.
An examination of weekly changes in interest rates on government
securities likewise produces no clear cut conclusion with respect to the inter-
action of official operations in coupon issues and the behavior of interest rates«
Table II compared the direction of movement in official purchases
and in rates on Government securities during the active and passive
periods.
Table 2
Comparison of Direction of Movement in Official Operations in Coupon Issues and Long-Term
Interest Rates on Government Securities During Periods of Active and Passive Official Operations, 1961-196^
sasonally Adjusted) Movements in Movements in
Opposite Opposite Direction Direction and Indeterminate Weeks
Indeterminate as a % of Total as a % of Total
( W e e k l y Hwta -
Moved in Moved in Total No. Opposite Same of Weeks Direction Direction
39 9 14
56 19 23
Active Periods 39 9 14 16 23 64
Passive Periods 56 19 23 14 34 59
If official operations did indeed have a directly ascertainable in-
fluence on long rates, one might expect this effect to show more clearly in the
periods of active operations, when official purchases were more extensive and
prolonged. During these active periods, one might expect official operations and
long-term rates to move more consistently in opposite directions, an increase
in purchases producing a decline (or at least no change) in rates and a decrease
in purchases removing downward pressures on rates.
Digitized for FRASER http://fraser.stlouisfed.org/ Federal Reserve Bank of St. Louis

7
In fact, and as may be seen in Table 2, movements in an opposite
direction occurred in only 23 per cent of the active weeks and in 3^ per cent
of the passive weeks. If the indeterminate weeks (weeks in which no change
occurred in interest rates) are added in with the opposite direction weeks
(on the theory that no change indicates downward pressure in the expansion
phase of the cycle), then the active periods are brought more into line with
the passive periods. Sixty-four per cent of the weeks in the active period
were opposite or no change; fifty-nine per cent of the weeks in the passive
period were opposite or no change. Yet still, one would hardly be justified
in labeling this difference ((& vs 59) significant. On the basis of this test,
there again appears no clear-cut evidence of the effectiveness of official
operations in coupon issues.
The same direction of movement test applied to short-term rates on
Government securities is shown in Table 3 .
Active Periods
Passive Periods
Table 3
Comparison of Direction of Movement in Official Operations in Coupon Issues and Short-Term Interest
Rates on Government Securities During Periods of Active and Passive Official Operations, 1961-1964
(weekly Data - Seasonally Adjusted) Moved in Moved in
Moved in Moved in Same Same Direction Total No. Same Opposite Direction and Indeterminate Wks, of Weeks Direction Direction Indeterminate As a % of Total As a % of Total
39
56 19
26
13 18
5
12
9 62
66.
Here, too, there is little suggestion that a moderation of official opera-
tions in bills significantly relieves downward rate pressures and hence permits
bill rates to rise more than they otherwise might. Bill rates and coupon
Digitized for FRASER http://fraser.stlouisfed.org/ Federal Reserve Bank of St. Louis

8
purchases move in the same direction in 49 per cent of the active weeks and
in k6 per cent of the passive weeks. When indeterminate weeks (no change in
rates) are added in "both the active and passive periods, the relative per-
centages change only slightly: in the active phase, 62 per cent of the weeks
were in the same direction or indeterminate; in the passive phase, 68 per cent
of the weeks moved in the same direction or were indeterminate
If no clear-cut impact on interest rates appears immediately evident
as a result of official operations in coupon issues, is there still some reason
to expect that differences in flows of funds might be observable in the active
and passive phases? There indeed is such reason. The impact of official opera-
tions on the interest rate structure may be masked by other market factors,
yet the impact may in fact exist and may influence the flow of funds. Long
rates, for example, could rise despite heavy operations in coupon issues, but
the rise could be moderated "by official action and this moderated rise could
stimulate a greater flow of funds in the period of active operations.
Alternatively, it is possible for the effect of official operations on flows of
funds to be transmitted to the market more through expectation than through
some immediately observable impact on interest rates. Official operations, for
example, could give rise to expectations of stability in capital and mortgage
markets and thus to confidence in the continuity of a given range of rates.
Such confidence could encourage flows of funds during active phases of official
operations.
How in fact did flows of funds behave during the active and passive
periods? Is there any significant difference in the two phases which could
support the hypothesis that official operations do in fact have an impact on
flows of funds?
Digitized for FRASER http://fraser.stlouisfed.org/ Federal Reserve Bank of St. Louis

9
As a first approach to answering these questipns, simple percentage
differences were computed between average monthly flows of funds in the active
and passive phases of official operations. The results are shown in the table
below.
Table k
Per Cent Change in Flows of Funds Average Month in Passive Periods
to Average Month in Active Periods
Heal Estate Credit + l A Corporate Bonds +12.8 State and Local Government Securities - 5.5
Total of Heal Estate and Securities Flotations + 3-5
As may be seen in Table k, flows of funds were greater in the aver-
age month for the active periods in all sectors except state and local govern-
ment flotations. Especially notable is the 12.8 per cent by which corporate
bond flotations in the average active month exceeded corporate flotations in
the average passive month. Also notable, any influence of trend in the flota-
tions series would tend to work in favor of greater flows in passive rather than
active periods because the sequence of phases ran: active, passive, active,
passive.
A further attempt to isolate any significant difference in flows dur-
ing the active and passive phases was made by examining deviation of monthly
flows from trend. As shown in Chart IV, trend lines were fitted by the least
squares method to the real estate series, corporate bond flotations, state and
local government issues, and to the total of the three. If System operations
did tend to stimulate greater flows of funds, then flows during the active phase
months should be more often above the trend line than flows during the passive
Digitized for FRASER http://fraser.stlouisfed.org/ Federal Reserve Bank of St. Louis

10
phase months, or for that matter, flows during months of "moderate" System
operations. Summary results of the trend line test are shown in Table 5-
Table 5
Trend vs. Actual Flows of Funds During Periods of Active, Moderate, and Passive Operations in Coupon Issues, 1961-196^ (Monthly Data, Seasonally Adjusted)*
I. Flows of funds coterminous with System operations Per Cent of Months Above the Trend Line Active Moderate Passive
Operations Operations Operations
Real Estate 67 59 38 Corporate Bonds 67 35 38 State and Local hk 65 5^ Total of Real Estate and Securities Flotations 56 59 31
II. Flows of funds lagged one month behind System operations Per Cent of Months Above the Trend Line Active Moderate Passive
Operations Operations Operations
Real Estate 67 59 33 Corporate Bonds 78 29 k-2 State and Local 33 71 50 Total of Real Estate and Securities Flotations 67 59 33
III. Flows of funds lagged two months behind System operations
Active Moderate Passive Operations Operations Operations
Real Estate $6 65 36 Corporate Bonds 67 kl 27 State and Local 56 71 36 Total of Real Estate and Securities Flotations 56' 65 18
*The number of months included in the three phases are as follows: Coterminous 1 month lag 2 month lag:
Active Phase 9 9 9 Moderate Phase 19 19 19 Passive Phase 13 12 11
Digitized for FRASER http://fraser.stlouisfed.org/ Federal Reserve Bank of St. Louis
11
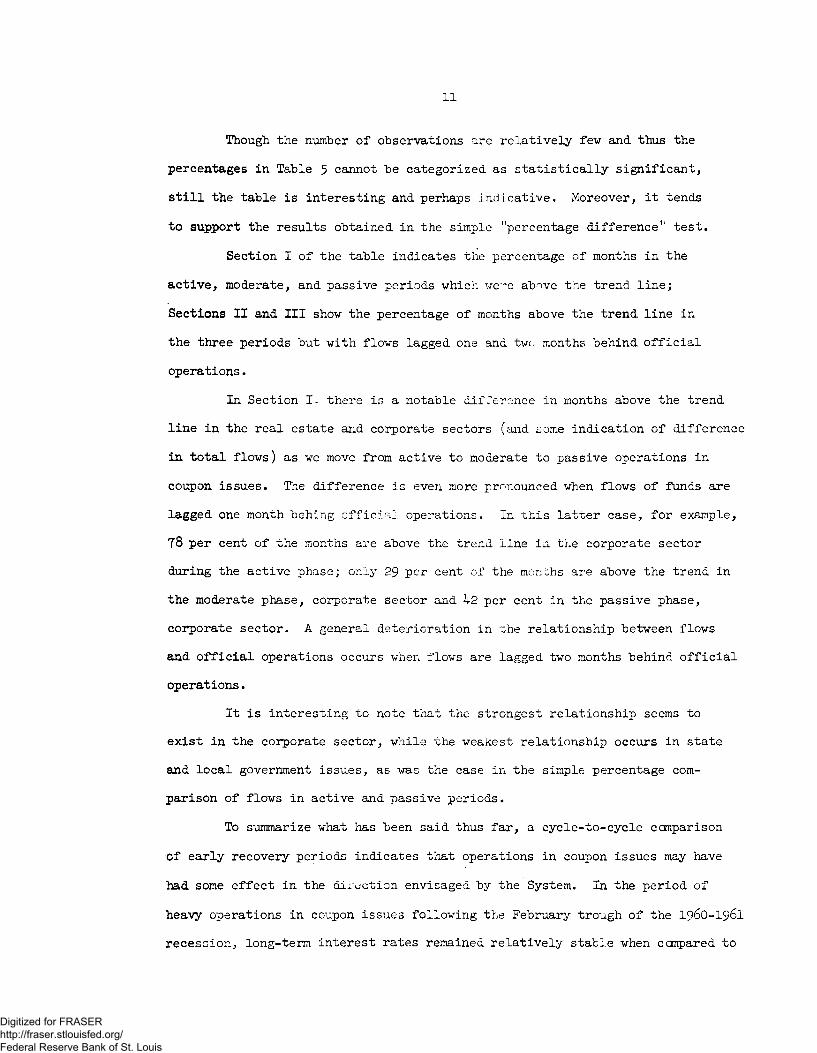
Though the number of observations are relatively few and thus the
percentages in Table 5 cannot be categorized as statistically significant,
still the table is interesting and perhaps indicative. Moreover, it tends
to support the results obtained in the simple "percentage difference" test.
Section I of the table indicates the percentage of months in the
active, moderate, and passive periods which w e above the trend line;
Sections II and III show the percentage of months above the trend line in
the three periods but with flows lagged one and two months behind official
operations.
In Section there is a notable dif ference in months above the trend
line in the real estate and corporate sectors (and some indication of difference
in total flows) as we move from active to moderate to passive operations in
coupon issues. The difference is even more pronounced when flows of funds are
lagged one month behing official operations. In this latter case, for example,
78 per cent of the months are above the trend line in the corporate sector
during the active phase; only 29 per cent of the months are above the trend in
the moderate phase, corporate sector and k2 per cent in the passive phase,
corporate sector. A general deterioration in uhe relationship between flows
and official operations occurs when flows are lagged two months behind official
operations.
It is interesting to note that the strongest relationship seems to
exist in the corporate sector, while the weakest relationship occurs in state
and local government issues, as was the case in the simple percentage com-
parison of flows in active and. passive periods.
To summarize what has been said thus far, a cycle-to-cycle comparison
of early recovery periods indicates that operations in coupon issues may have
had some effect in the direction envisaged by the System. In the period of
heavy operations in coupon issues following the February trough of the I96O-I96I
recession, long-term interest rates remained relatively stable when compared to
Digitized for FRASER http://fraser.stlouisfed.org/ Federal Reserve Bank of St. Louis

12
similar phases of past recovery periods, and short-term rates, though not
consistently higher than in past recovery periods, exhibited little indication
of downward pressure. Moreover, flows of funds in several of the individual
sectors and in the aggregate were relatively large in the 1961 recovery.
During active and passive phases of System coupon purchases in the 1961-1964
period there was little clear-cut evidence of a differential effect of coupon
purchases on interest rates. However, there was a definite suggestion that
the System may have had an impact on flows of funds.
Thus far we have "been concerned with shorter time spans within the
1961-1964 period of official participation in the coupon market. It also may
be instructive to view the period as a whole. An examination of the entire
period provides a greater number of observations with respect to official
operations, interest rates, and flows of funds. One might have greater con-
fidence in the relationships already suggested if these same relationships
can be shown to exist for the period as a whole.
The 1961-1964 Period Viewed as a Whole
Month-to-month comparisons of changes in the level of official
operations and in long-term interest rates over the 1961-1964 period yield
the following results. Ta,ble 6
Comparison of Direction of Movement in Official Operations in Coupon Issues and Long-Term Interest Rates on Gov't Securities, Feb. 1961-May 1964.
(Monthly data, seasonally adjusted) Moved in
Moved in Opposite Dir. Opposite Dir. & Indeter-
Total No. Moved in Moved in Indeter- as $ of minate as a $ of Months Opposite Dir. Same Dir. minate Total of Total
Purchase of Issues Maturing in
1 Yr. & over 40 17 19 4 43 53 5 Yrs. & Over 40 17 19 4 43 53
Digitized for FRASER http://fraser.stlouisfed.org/ Federal Reserve Bank of St. Louis

13
The direct relationship between long-terra rates and official opera-
tions does not appear to be significant. Even if the indeterminate movements
are included, with the opposite-direction movements, the relationship is no
more than could be expected on the basis of chance (53 per cent of movements
in an "opposite" direction).
Would the relationship be improved if only those months were selected
for comparison which were above average for the period in terms of the volume
of official coupon purchases? The following table throws some light on this
question. T a b l e ?
Comparison of Direction of Movement in Official Operations in Coupon Issues and Long-Term Interest Rates on Gov't Securities, Feb. 1961-May 196 b
(Months in Which Official Operations Were Above Average for Period, Seasonally Adjusted)
Moved in Opposite Dir.
Moved in & Indeter-Total No. Moved in Moved in Indeter- Opposite Dir. minate as cJo of Months Opposite Dir. Same Dir. minate as jo of Total of Total
1 Yr. 80 over 21 10 9 2 hQ 57 5 Yrs. & over Ik 7 6 1 50 57
Again, the direct relationship does not appear to be a significant one,
and the relationship is little improved by counting "indeterminate" months in
with "opposite direction5' months.
Is there likely to be any improvement if we select from the total of
all months certain sets of months in which there was a "continuous" change in
the volume of official coupon purchases? In the table below, a "continuous"
period is defined as three months or more, with each month showing a continuous
change either in the direction of greater or lesser purchases of coupon issues.
Digitized for FRASER http://fraser.stlouisfed.org/ Federal Reserve Bank of St. Louis

14
How did. long-term rates behave during these months of "continuous" official
purchases? Table 8
Comparisons of Direction of Movement in Official Operations in Coupon Issues and Long-Term
Interest Rates on Government Securities During "Continuous" Period
(Monthly data, seasonally adjusted) Moved in
Moved in Opposite Dir. Opposite Dir. & Indeter-
Total No. Moved in Moved in Indeter- as $ of minate as $ of Months Opposite Dir. Same Dir. minate Total of Total
Purchases of Issues Maturing in
1 Yr. & over 3 3 0 0 100 100 5 Yrs. & over IT 9 6 2 53 65
Some improvement in the relationship does occur, but the improvement is
not marked. Still, the combination of opposite direction and indeterminate months
accounts for 65 per cent of total months in the five-year-and-over category. The
one-year-and-over category, with only three months, cannot be considered meaningful.
One of the continuous periods selected, happened to coincide with the period
during 1961-1964 when official purchases hit a low point. If we eliminate this
period, we have 13 months for observation in the "five-year-and-over" category.
EUring these 13 months, movement was in the opposite direction or indeterminate
in 10 months or about 77 per cent of the time. This provides some indication that
official operations in coupon issues, if pursued in the same direction over a con-
tinuous period of time, produce results which would be theoretically expected..*
*0n the basis of 5- and -over issues, we have 17 months in the continuous-period classification.
Periods of continuously increasing purchases included 7 months and for these months alone the distribution of signs was as follows:
Opposite as a °jo Opposite & Indeterminate Total Opposite Same Indeterminate of Total as a jo of Total
7 4 2 1 57 71
(footnote continued)
Digitized for FRASER http://fraser.stlouisfed.org/ Federal Reserve Bank of St. Louis

15
Applying the same direction of change tests to flows of funds
through the mortgage and capital markets during the period 1961-1964,
rather inconclusive results appear. Table 9 compares monthly changes in
official purchases of coupon issues to monthly changes in new corporate bond
flotations, new issues of state and local Government securities, new real
estate credit granted, and the total of these three flows. If official opera-
tions in coupon issues did indeed have an effect on these flows, we would expect
movement in the same direction, i.e., increased purchases of coupon issues
should stimulate new security flotations. What in fact happened?
(footnote continued) * Periods of continuously declining purchases included 10 months
and for these months alone the distribution of signs was as follows:
Opposite as a $ Opposite & Indeterminate Total Opposite Same Indeterminate of Total as a jo of Total 10 5 1 1 50 60
But if we delete the period of lowest official purchases which occurred in the "declining purchases" category we get the following results:
Opposite as a $ Opposite & Indeterminate Total Opposite Same Indeterminate of Total as a j> of Total 6 4 1 1 67 83
Digitized for FRASER http://fraser.stlouisfed.org/ Federal Reserve Bank of St. Louis

Table 10
Real Estate
Purchases of coupon issues maturing in
1 Yr, & ever 5 Yrs. & over
Corporate Bonds Purchases of
coupon issues maturing in
1 Yr. & over 5 Yrs. & over
State & Local Purchases of
coupon issues maturing in
1 Yrt & over 5 Yrs, & over
Total Purchases of
coupon issues maturing in
1 Yr. & over 5 Yrs. & over
Comparisons of Direction of Movements in Official Net Purchases of Coupon Issues and Flows of Funds Through the Mortgage and Capital Markets, Feb. 196l-May 196^
(Monthly data, seasonally adjusted)
Coterminous 1 Month Lag
Moved in Movement Moved in Same as % of Opposite
Direction Total Direction
Moved in Opposite Direction
Moved in Same
Direction
Same Movement Moved in as % of Opposite Total Direction
2 Months Lag
Moved in Same
Direction
same Movement as % of Total
21 23
19 17
17 42
20 20
19 19
Os ^9 19
16 16
22 22
58 58
19 19
21 21
52 52
20 18
19 21
49 51
23 21
15 17
39 45
20 20
20 20
50 50
22 22
17 17
44 44
14 16
24 22
63 58
21 21
19 19
17 17
21 19
18 20
46 51
17 19
21 19
55 50
Digitized for FRASER http://fraser.stlouisfed.org/ Federal Reserve Bank of St. Louis

17
Table 9 , on the whole, shows no close relationship between
purchases and flows of funds. The highest percentage of movements in the
same direction occurs in the real estate and state and local flows, with the
flows lagged two months behind official purchases (63 per cent of movements
in the same direction for both flows, calculated on the basis of the 1-year-
and-over maturity classification). Total flows show no apparent relationship
to official purchases.
Table 10 (page 18), compares changes in official purchases to flows
of funds during months characterized by above average official purchases.
There appears to be some improvement in the relationship when only
"above average months" are considered. The improvement is registered in all
classes of flows and is most apparent on a one-month-lag basis in the five-
year -and- over maturity classification (6^ per cent of movements in the same
direction for the real estate flows, 71 per cent for corporate bonds, 71 per
cent for state and local issues and 86 per cent for the tptal of the three
flows).
Finally, a comparison of flows and official purchases during periods
of "continuous" official purchases (3 or more months moving in the same direction)
yields the following results. (Table 11, page 1 9 ) .
Digitized for FRASER http://fraser.stlouisfed.org/ Federal Reserve Bank of St. Louis

Table 10
Comparisons of Direction of Movements in Official Net Purchases of Coupon Issues and Flows of Funds
Through the Mortgage and Capital Markets, Feb. 1961-May 1964 (Monthly data, seasonally adjusted, above average months)
Coterminous 1 Month Lag 2 Months Lag
Moved in Opposite Direction
Moved in Same
Direction
Same Movement Moved in as % of Opposite Total Direction
Moved in Same
Direction
Same Movement Moved in as % of Opposite Total Direction
Moved in Same
Direction
Same Movement as % of Total
Real Estate 1 Yr. & over 5 Yrs. & over
Corporate Bonds 1 Yr. & over 5 Yrs. & over
State & Local 1 Yr. & over 5 Yrs. & over
Total 1 Yr. & over 5 Yrs. 6c over
10 11
12
10 9
10 9
11 3
11 5
11 5
52 21
43 43
52 36
52 36
11 5
11 4
10 2
10 9
12 10
10 10
11 12
48 64
57 71
48 71
52 86
14 10
12 8
7 4
14 9
12 6
57 57
33 29
67 64
57 43
Digitized for FRASER http://fraser.stlouisfed.org/ Federal Reserve Bank of St. Louis
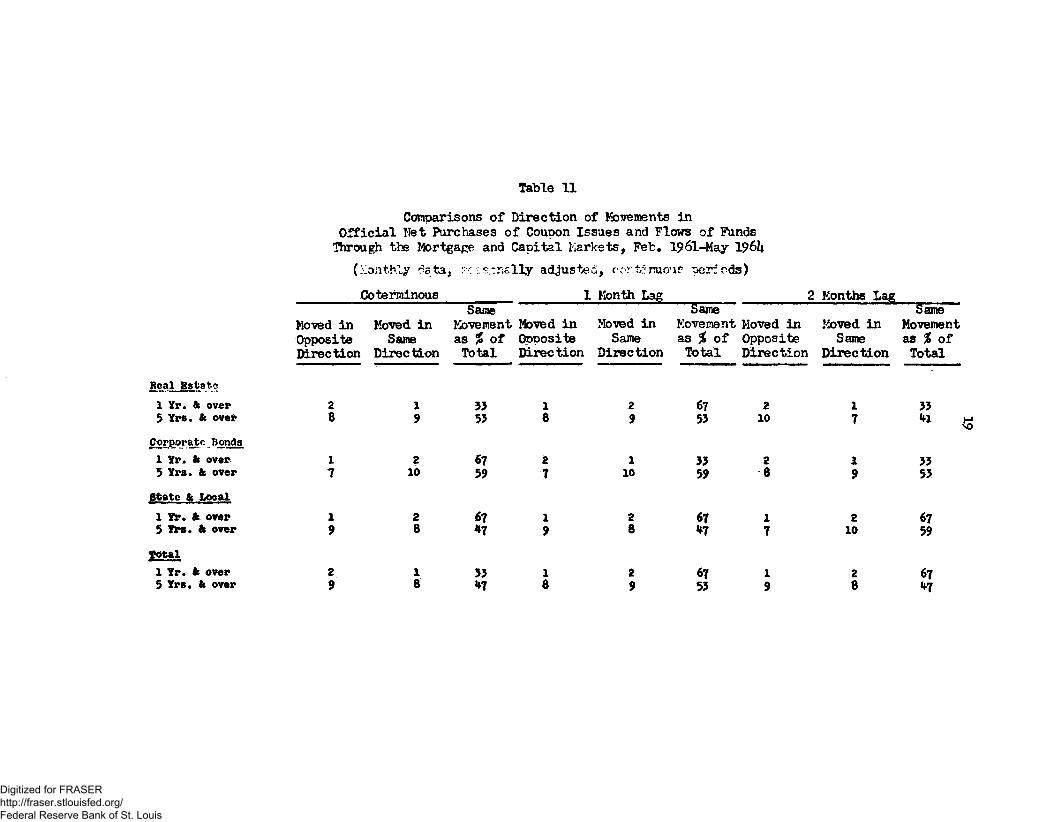
Table 11
Comparisons of Direction of Movements in Official Net Purchases of Coupon Issues and Flows of Funds Through the Mortgage and Capital Markets, Feb. 196l-May 1961*
(Monthly data. : : s^nally adjusted, c:->r.timow periods) Coterminous
Moved in Opposite Direction
Moved in Same
Direction
Same Movement Moved in as % of Opposite Total Direction
1 Month Lag iSame
2 Months Lag
Moved in Same
Direction
Movement Moved in as % of Opposite Total Direction
Moved in
Direction
Movement as % of Total
Real Estate 1 Yr. ft over 5 Yrs. ft over
Corporate ..Bonds 1 Yr. ft over 5 Yrs. ft over
State ft Local 1 Yr. ft over $ Yrs. ft over
1 Yr. ft over 5 Yrs. ft over
2 8
1 7
2 9
1 5
2 10
2 8
1 8
33
67 59
67 47
33 ^7
1 8
2 7
1 9
1 8
2 9
1 10
2 8
2 9
67 53
33 59
67 47
67 53
2 10
2 8
1 7
1 9
2 10
2 8
33 41
33 53
67 59
67 47
vO
Digitized for FRASER http://fraser.stlouisfed.org/ Federal Reserve Bank of St. Louis

20
Concentrating on the five-year-and-over category ("because of the paucity
of observations in the one-year-and-over class), there appears to be little direct
relationship between flows of funds and continuing official purchases.
Once more to summarize briefly, the cycle-to-cycle comparison of early
recovery periods suggests that official operations in coupon issues may have had
some effect in the direction envisaged by the System. The comparison of active,
moderate, and passive phases of official operations during the I96I-I96I+ period
provides no statistically conclusive evidence to support the hypothesis, but still,
there is a suggestion that official purchases may have had some impact on flows of
funds. Looking at the entire period subsequent to the abandonment of "bills usually,"
there is a suggestion that "continuous" official operations may have some impact
on long-term rates and that months of "above average" official purchases — especially
"above average" purchases of issues maturing in five years and over — may have some
impact on flows of funds.
In addition to the direction of change comparisons thus far used, to investi-
gate the relationship between official purchases, interest rates, and. flows of funds,
least-square regressions were run to see if further evidence of relationship could
be established. Following is a summary of the regression results.
Official Purchases, Interest Rates, and. Flows of Funds:. Regression Tests
Tablel2 lists the coefficients of determination found for the various
rates and flows during periods of active, moderate, and passive periods of official
operations, both on a coterminous basis and with a one-month lag in rates and flows.
Digitized for FRASER http://fraser.stlouisfed.org/ Federal Reserve Bank of St. Louis

2k
Table 17
Coefficients of Determination; Official Purchases and Various Financial Variables, Jan. 1961 - May 1964
(Monthly data, seasonally adjusted)
Coterminous
Official Purchases and Real Estate
Corporate Bonds State & local Total flows Long rate Short rate
Active Period
(-).2362 (- )• 002.2 (-). 2025 ( ~ >.2480 (0-5127* (-).2550
Moderate Period
+).0317 + )f 2937* -).0002 0.0635 +).0320 0-0734
Passive Period
0-2052 -).ll42 O.0543 -).2694* -).2025 -).2256
Official Purchases and Real Estate
Corporate Bonds State & local Total flows Long rate Short rate
With One-Month Lag
(0.1664 (+).066l (O.0190 (+).CO45 (-0 .01.49 (+) .0166 (O.0671 (+).0506 (0.3399 (+).0708 (O.l84o (+).0686
-).156O -).09l2 .).1274 0-2550* 0-3102* .).1260
^Statistically significant at the 5 per cent level.
As can be seen, most of the coefficients are quite low. It is notable,
however, that the long-term rate comparison in the active, coterminous, phase is
statistically significant at the 5 per cent level, with a coefficient of .51.
Table 13 shows the coefficients of determination between official pur-
chases and the financial variables when all months in the 1961-1964 period are
included (instead of only months in active, moderate, and passive phases).
Digitized for FRASER http://fraser.stlouisfed.org/ Federal Reserve Bank of St. Louis

2k
Table 17
Coefficients of Determination Between Official Purchases and Financial Variables - Jan. 1961 to May I96U
(Monthly data, seasonally adjusted)
Coterminous One-Month Lag
Official Purchases and Real Estate
Corporate bonds State & local Total flows Long rate Short rate
Original Series
(-).0309 (+).0620 (-J.0139 (-).OlOk
5.1369* (-).0259
First Difference
(-).0276 (+).023^ (-).OOOO (-).00l6 (-).005U (-).OOOl
Original • Series
(-).OllT (+).0328 (+).0159 (O.0515 (-).0692* (-).0137
First Difference
(+).0l69 (-).ooVr (+).0121 (+).0090 (+).0207 (+).0000
^Statistically significant at 5 per cent level.
Once more the coefficients are quite low. Yet as before, long-term rates are
at least statistically significant.
Would the coefficients be improved if we compared official purchases during I!above average" months and "continuous" periods to flows and rates during these
same months? First, let us look at the "above average" months in Table lk.
Table lk
Coefficients of Determination Between Official Purchases and Financial Variables for Months of Above-Average Purchases
Jan. 1961 to May 1964 (Monthly data, seasonally adjusted)
One-Month Coterminous
Official Purchases and Real Es tate
Corporate Bonds State & local Total Long-rate Short-rate
(-).0190 (+).12l8 (-).OUk (-).OOOl (-).162U*
(-).0098 (+>.0357 (-r ) . 0090 (-).oooo (-).0756 (->.023^
•^Statistically significant at 5 per cent level.
Digitized for FRASER http://fraser.stlouisfed.org/ Federal Reserve Bank of St. Louis

23
Again the coefficients are low, with long-term rates the only variable
passing the test for statistical significance. The same low coefficients are
also obtained when the financial variables are regressed with official purchases
of 5-years-and-over to maturity, as shown below*
Table 15
Coefficients of Determination Between Official Purchases of Securities of 5 Years and Over to Maturity and
Financial Variables for Months of Above-Average Purchases January 1961 to May 196k
(Monthly data, seasonally adjusted)
Official Purchases and Real j&scv'ce
Corporate Bonds State & local Tota^ flows Longdate Short-rate
Coterminous
(+).Q0l4 (+)<0339 (-).0062 (+).0029 (-).03S6 (+).0000
One-Month Lag
(-).0003 (+).1116 (+).2773* (+)-0437-( - ) •0041 (^).0048
^Statistically significant at 5 per cent level.
Turning now to official purchases during "continuous periods," the
regressions produced the following results.
Table 16
Coefficients of Deterrriination Between Official Purchases Maturing in Five Yean; or More and. Selected Financial
Variables for Periods of Continuous Purchases February I.96I to May 1964
(Monthly data, seasonally adjusted)
Official Purchases ana Real Estate
Corporate bonds State L local Total flows Long-rate Short-race
Coterminous
(+). 1831* (+X0130 (-O.0000 (0.1936* (-J.0119
One-Month Lag
(-0.0511 (+J.1892* (- ).0112 (-).OOIO (•O.O58I
•^Statistically significant at 5 per cent level.
Digitized for FRASER http://fraser.stlouisfed.org/ Federal Reserve Bank of St. Louis

2k
Table 17
Continuous Period Excluding a Four-Month Hun of Low Purchases
Coterminous One-Month
Lag
Official Purchases and Heal Estate (-).035T (-).0497
(+).150k (+).1267 (+).0072 (-).0092 (-).0008 (->.0052 (-).2256* M.0660 (.).0092 (-).0043
Corporate bonds State & local Total Long-rate Short-r&te
^Statistically signi: cant at 5 per cent level.
As in the other comparisons, the coefficients for continous
periods are low, though some slight correlation is evident for long-term rates ana
corporate bond issues.
The regression results, on balance, appear to provide less support than
the non-parametric tests for the general hypothesis that a relationship exists
between official purchases of coupon issues on the one hand and
flows of funds on the other. In interpreting these findings, however, several
factors should be kept in mind.
First of all, one probably should not expect to find more than a marginal
relationship beween offlcia. pur cesses the financial variables, the latter
being subject to so many and alvc.rso influences. Under such conditions, it might
reasonably be said that the- discovery of c,:-?y relationship, even a slight one, is
significant. Second, it is interesting to note that the one relationship which
c^s appear zo be at least of some significance — that existing between official
...perations and long-term rates — is apparent throughout practically all of the
various regressions.
In Conclusion
Digitized for FRASER http://fraser.stlouisfed.org/ Federal Reserve Bank of St. Louis

25
With respect to flows of funds and official purchases, the regressions show
virtually no correlation while the direction-of-change comparisons suggest that
official purchases may have had. some impact on flows. In which test is one to
place his confidence? Before answering this question, one should consider several
points.
1. The simple regression tests do not necessarily tell us that no
relationship exists between purchases and flows, they tell us that
if such a relationship does exist, the regressions were unable to find
it, perhaps because (a) there were insufficient observations, or (b)
other factors interfered, to obscure a relationship which in fact exists.
Hence, what the regressions failed to find., the other tests may have
uncovered, even if the findings of the non-parametric tests must still
be considered tentative.
2. A possible reason why the direction-of-change comparisons appear to
lend more support to the thesis than the regressions concerns the
nature of the two measures of association. The regression measure
seeks to establish a relationship between the independent and dependent
variables based, 'both upon the direction of change and the magnitude of
change. The non-parametric tests do not consider magnitude, only
direction. Since we mow from the non-parametric tests that the
direction-of-ehange comparisons often favor the hypothesis that
official operations are effective, then the inconclusive results of
the regressions may be due in large measure to magnitudes, i.e.,
"unfavorable" movements may be in disproportionate amounts (the
less frequent case of "unfavorable" movements may be in such large
amounts as to "overshadow" the more frequent case of "favorable"
movements). But in whatever way magnitude may tend to offset direction,
Digitized for FRASER http://fraser.stlouisfed.org/ Federal Reserve Bank of St. Louis

26
it would appear from the tests that official operations are more
effective in influencing the direction of movement than in influencing
the magnitude of movement of the financial variables. To say this
another way, the "unweighted" movements provide more support for the
theoretical expectation than the "weighted" movements.
In conclusion, then, if one were asked to answer whether sufficient con-
fidence exists in the effectiveness of official operations to warrant their
continuance, one might reason as follows:
a. There is little evidence that official operations produce an unfavorable
economic effect.
b. There.is some suggestion, though often not statistically significant,
that official operations produce a favorable effect.
c. One reason why the favorable effect may not be statistically significant
is that other factors may sometimes mask a significant relationship
in direction of movement between purchases and the other variables.
That is, the effect of official purchases may indeed exist but may
sometimes be submerged by greater forces of opposing movement.
d. Since there is little evidence of harm, some evidence of benefit, and
some reason to expect that the benefit may be understated, then it
would seem that the probability of gain from coupon operations is
greater than the probability of loss and thus that operations in
coupon issues should continue as long as "the combination of problems
responsible for initiation of the program continues.
Digitized for FRASER http://fraser.stlouisfed.org/ Federal Reserve Bank of St. Louis