tfl 52 cmi plot analysis final - british columbia · analyses adequately reflect the actual gy of...
TRANSCRIPT

TFL 52 Change Monitoring Inventory Plot
Analysis – Final Report
Prepared For: Earl Spielman, RPF West Fraser Mills Ltd. 1250 Brownmiller Road Quesnel, BC V2J 3K9
Date: April 19, 2007
Prepared By: 2599 McCullough Road, Nanaimo BC V9S 4M9 Ph: 250-760-1070 Toll free: 1-877-377-9786 Fax: 250-760-1071 Email: [email protected] www.drsystemsinc.com Contact: Mark Perdue

TFL 52 CMI Plot Analysis April 2007
Page i
Executive Summary
Twenty four Inventory Monitoring plots were established randomly in West Fraser’s Mills Ltd TFL 52 second growth stands in 2001 and remeasured in 2006. The growth and yield monitoring program’s goals were to: “to provide a high level-of-comfort that growth and yield (GY) estimates used in timber supply analyses adequately reflect the actual GY of trees and post-harvest regenerated (PHR) stands on the
TFL. The GYM program is designed to detect practically significant differences1 between actual and predicted changes in key attributes; it does not explain why potential difference may exist. Thus, the GYM program functions as an early warning system to detect differences that may impact forest management on the TFL.”(West Frazer Mill Ltd TFL 52 Growth and Yield Monitoring Sample Plan Third Year, May 29, 2003, J.S. Thrower and Associates.) Primary interest was in net volume growth compared to management plan growth projections. Secondary interest was second growth stand site index compared to expected values. Data were compiled to VRI standards and MoFR site index equations were used to estimate site index. Three plots showed a decrease in volume, all pine stands (two due to beetle infestation, one due to harvesting of residuals). Site index was calculated for the primary species by basal area per plot. Total age was based on site tree bh age and a years to breast height correction factor. For the SBS zone SI=22, age=31 years; for ESSF SI=21, age= 28 years. Yearly net volume growth averaged over the 5 years for stems 12.5 cm dbh+ was: ongrowth: 3.5 m
3/ha/year; ingrowth: 0 m
3/ha/year; mortality-standing: 1.1 m
3/ha/year; mortality-down: 0.1
m3/ha/year. (Ongrowth is growth over the measurement period of live trees tallied at the starting
measurement). Growth on the plots was compared to yield table current (VDYP) and future (TIPSY) yield projections. Three plots apparently used residual trees for site index resulting in an older age. An attempt was made to correct these data. After this correction net volume growth (12.5 cm dbh) was insignificantly different to both management plan current and future yield tables. Future improvements would be to use establishment date to attach the yield tables rather than site index derived stand age. Overall site index measured was 2.3 m higher than expected from assigned yield table site indices than expected (21.2 m measured and 18.9 m expected): this general trend was consistent across all species although the small size of the data set is suggestive only and needs to be confirmed with a larger data set. Some field measurement suggestions are made in the Appendix.
1 Practically significant differences (as opposed to statistically significant differences) are defined as ones large enough to impact management decisions. Timber supply sensitivity analyses can be used to determine practically significant differences.
TFL 52 CMI Plot Analysis April 2007
Page ii
Table of Contents
Executive Summary ..................................................................................................................... i
Objective .................................................................................................................................... 1
Methods ..................................................................................................................................... 1
Results ....................................................................................................................................... 2
Conclusions ..............................................................................................................................10
Appendices ...............................................................................................................................11
Appendix 1 CMI Field Data Review Results .........................................................................11
Appendix 2 Compilation Summary Results ...........................................................................15
Appendix 3 Issues encountered while checking the CMI data for TFL 52. ............................26
Appendix 4 Analysis of possible residual or veteran trees. ...................................................28

TFL 52 CMI Plot Analysis April 2007
Page 1
Objective
To present analysis of West Fraser Mills Ltd Change Monitoring Inventory plots, to examine aspects relating to stand growth, implications for timber supply analysis and practical technical aspects.
The West Fraser Mills Ltd. growth and yield monitoring program’s goals are: “to provide a high level-of-comfort that growth and yield (GY) estimates used in timber supply analyses adequately reflect the actual GY of trees and post-harvest regenerated (PHR) stands on the TFL. The GYM program is designed to
detect practically significant differences2 between actual and predicted changes in key attributes; it does not explain why potential difference may exist. Thus, the GYM program functions as an early warning system to detect differences that may impact forest management on the TFL.”(West Frazer Mill Ltd TFL 52 Growth and Yield Monitoring Sample Plan Third Year, May 29, 2003, J.S. Thrower and Associates.) Primary interest was in net volume growth compared to management plan growth projections. Secondary interest was second growth stand site index compared to expected values.
Methods
Twenty-four random fixed area plots were established within managed portions of TFL 52 in 2001 and remeasured in 2006. The plots were part of the BC Vegetation Resource Inventory change monitoring program for which standards are still in development. There were some departures from CMI field standards for this study, notably in putting nails at breast height and in not using the 5.64 m radius plots to collect site index data. All standing stems => 9 cm were measured in 11.28 m radius plots (0.04ha or 1/25
th ha) while all standing stems =>4 cm and <9 cm were measured on 5.64 m radius plots (0.01 or
1/100th ha). Smaller stems and stumps are collected in 2.5 m radius plots and are not analysed here.
Volume was compiled using Kozak V5. Total volume was compiled including tips and stumps. Merchantable volume was calculated as total volume minus 30 cm stump and 10 cm top. Cruiser call net factors (decay) were used to reduce merchantable volume to give net volume. Site index was calculated based on the major species for live stems >12.5 cm dbh. Standard MoF curves were used based on Site Tools. BEC variant was determined using a BEC/plot overlay. Site index was based on the 11.48 m radius plot ‘quadrant’ site trees. Note that cruise data was checked for any errors prior to any analysis, anomalies are noted and the corrections used can be found in the Appendix 1.
2 Practically significant differences (as opposed to statistically significant differences) are defined as ones large enough to impact management decisions. Timber supply sensitivity analyses can be used to determine practically significant differences.

TFL 52 CMI Plot Analysis April 2007
Page 2
Results
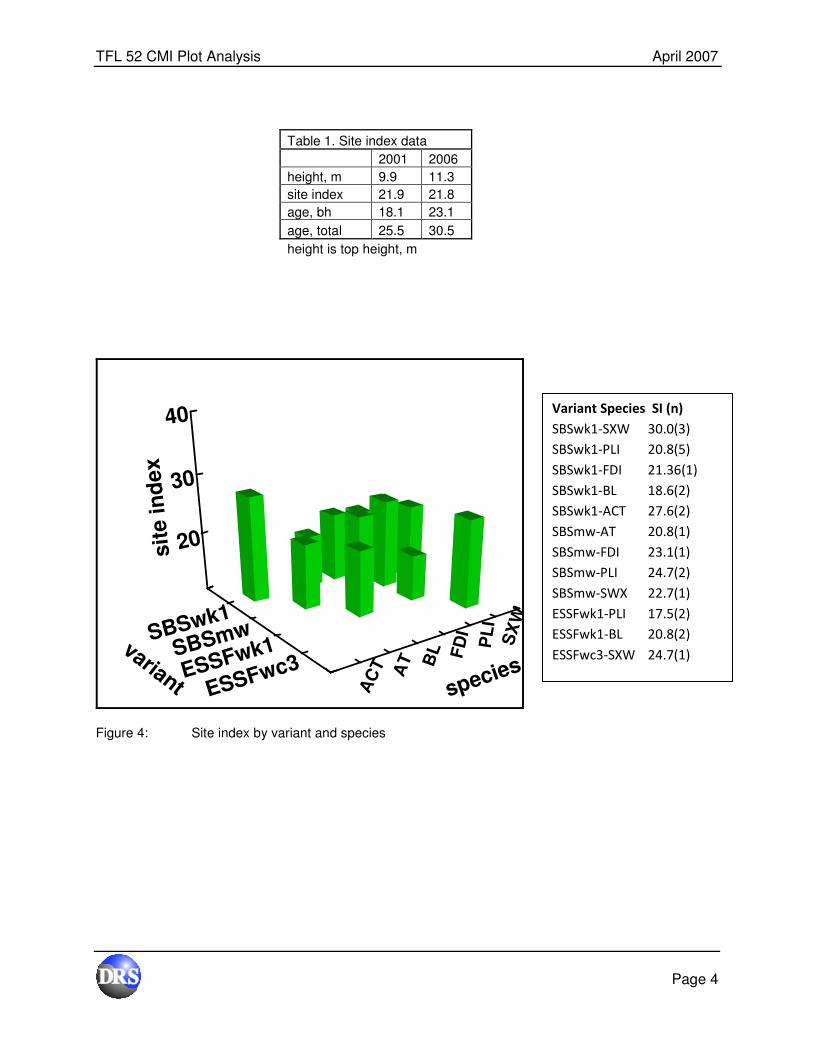
Figure 1 shows site index versus age (mean 22 m at 50 years bh age, and mean age 30.5 years total age in 2006). For the SBS zone SI=22 m, age=31 years; for ESSF SI=21 m, age= 28 years. Figure 2 shows the distribution by species and biogeoclimatic zone. Figure 3 shows site index by species and biogeoclimatic variant while Figure 4 shows site index against both species and variant. Three plots (see Figure 1) were close to or older than 50 years- this will be discussed in later in relation to the timber supply yield tables. Figure 5 shows annual live tree merchantable growth by age. There were 3 plots with a net loss of volume, plots 1002, 1006 and 1012 (all leading pine at 4 cm dbh+). There were no field notes for plot 1002 suggesting any beetle kill; plot 1006 notes suggested 20% ‘red attack’, while plot 1012 had several trees cut due to adjacent logging. Plot 1012 data is shown in the site index graphs but is not included in any further volume analyses. Four plots were noted for beetle attack: 1006, 1007, 1009 and 1012. Table 1 shows site index data while Table 2 shows volume summary data.
10 20 30 40 50 60 70
total age, years
10
20
30
40
sit
e i
nd
ex
1016
1014
1019
1010
1020
1018
1012
1011
1015
1022
1023
1004
1017
1021
1002
1003
1007
1008
1006
1005
1024
1013
1001
1009
Figure 1: Plot site index versus total age (from site index and bh age corrections)

TFL 52 CMI Plot Analysis April 2007
Page 3
ACT AT BLFDI
PLISXW
species
0
2
4
6
8
10
12n
o.
plo
ts
ESSFwc3
ESSFwk1
SBSmw
SBSwk1
variant
0
5
10
15
no. p
lots
Figure 2: Leading species trees 12.5 cm dbh+ in 2006 and plots per BEC zone.
ACT AT BLFDI
PLISXW
species
10
20
30
40
sit
e i
nd
ex
ESSFwc3
ESSFwk1
SBSmw
SBSwk1
variant
10
20
30
40
sit
e in
dex
Figure 3: Site index by leading species (trees 12.5 cm dbh+) and biogeoclimatic variant in 2006.
TFL 52 CMI Plot Analysis April 2007
Page 4
Table 1. Site index data
2001 2006
height, m 9.9 11.3
site index 21.9 21.8
age, bh 18.1 23.1
age, total 25.5 30.5
height is top height, m
AC
T AT B
L FD
I
PL
IS
XW
speciesESSFwc3ESSFwk1SBSmwSBSwk1
variant
20
30
40
sit
e i
nd
ex
Figure 4: Site index by variant and species
Variant Species SI (n)
SBSwk1-SXW 30.0(3)
SBSwk1-PLI 20.8(5)
SBSwk1-FDI 21.36(1)
SBSwk1-BL 18.6(2)
SBSwk1-ACT 27.6(2)
SBSmw-AT 20.8(1)
SBSmw-FDI 23.1(1)
SBSmw-PLI 24.7(2)
SBSmw-SWX 22.7(1)
ESSFwk1-PLI 17.5(2)
ESSFwk1-BL 20.8(2)
ESSFwc3-SXW 24.7(1)
TFL 52 CMI Plot Analysis April 2007
Page 5
10 20 30 40 50 60 70
total age, yrs
-10
0
10
20
me
rch
. v
ol.
gro
wth
, m
3/h
a/y
ea
r
1016
1014
1011
10231004
10031008
1006
1024
10011009
10191010
1020
10181015
1022
1017
1021
1002
1007
1005
1013
SprucePine
TYPE
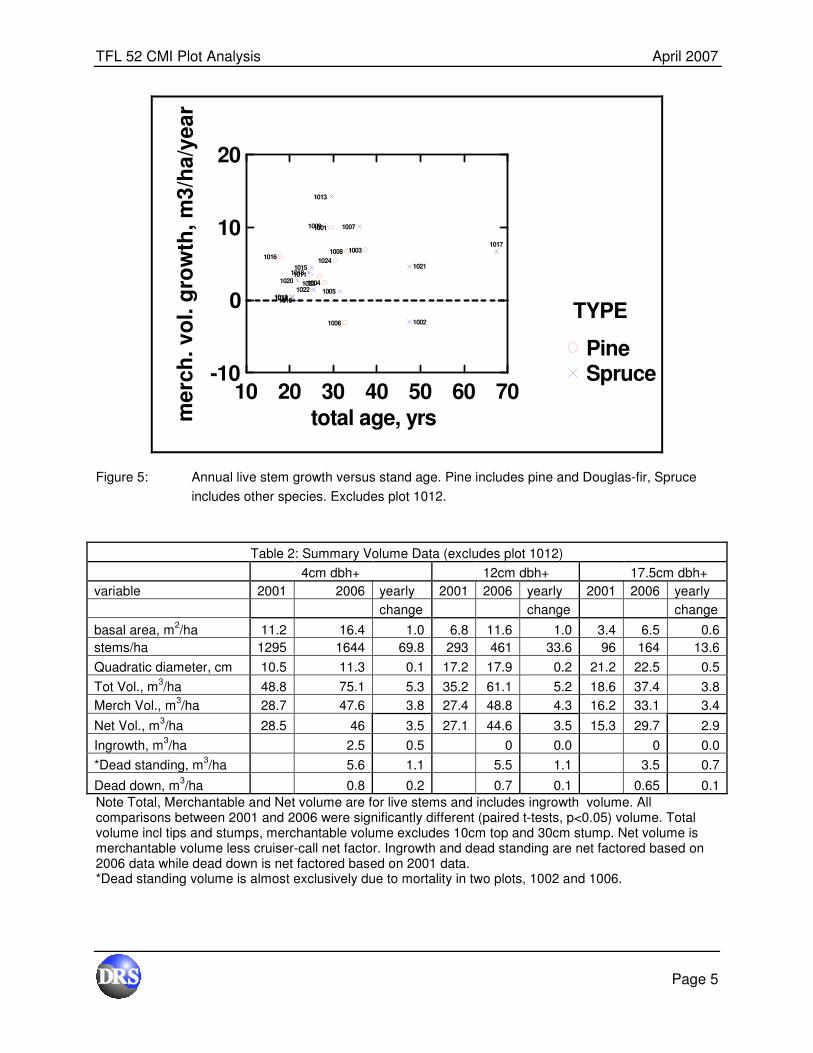
Figure 5: Annual live stem growth versus stand age. Pine includes pine and Douglas-fir, Spruce
includes other species. Excludes plot 1012.
Table 2: Summary Volume Data (excludes plot 1012)
4cm dbh+ 12cm dbh+ 17.5cm dbh+
variable 2001 2006 yearly 2001 2006 yearly 2001 2006 yearly
change change change
basal area, m2/ha 11.2 16.4 1.0 6.8 11.6 1.0 3.4 6.5 0.6
stems/ha 1295 1644 69.8 293 461 33.6 96 164 13.6
Quadratic diameter, cm 10.5 11.3 0.1 17.2 17.9 0.2 21.2 22.5 0.5
Tot Vol., m3/ha 48.8 75.1 5.3 35.2 61.1 5.2 18.6 37.4 3.8
Merch Vol., m3/ha 28.7 47.6 3.8 27.4 48.8 4.3 16.2 33.1 3.4
Net Vol., m3/ha 28.5 46 3.5 27.1 44.6 3.5 15.3 29.7 2.9
Ingrowth, m3/ha 2.5 0.5 0 0.0 0 0.0
*Dead standing, m3/ha 5.6 1.1 5.5 1.1 3.5 0.7
Dead down, m3/ha 0.8 0.2 0.7 0.1 0.65 0.1
Note Total, Merchantable and Net volume are for live stems and includes ingrowth volume. All comparisons between 2001 and 2006 were significantly different (paired t-tests, p<0.05) volume. Total volume incl tips and stumps, merchantable volume excludes 10cm top and 30cm stump. Net volume is merchantable volume less cruiser-call net factor. Ingrowth and dead standing are net factored based on 2006 data while dead down is net factored based on 2001 data. *Dead standing volume is almost exclusively due to mortality in two plots, 1002 and 1006.
TFL 52 CMI Plot Analysis April 2007
Page 6
dead down
dead standingrowth
ongrowth
dead down
dead standingrowth
ongrowth
dead down
dead standingrowth
ongrowth
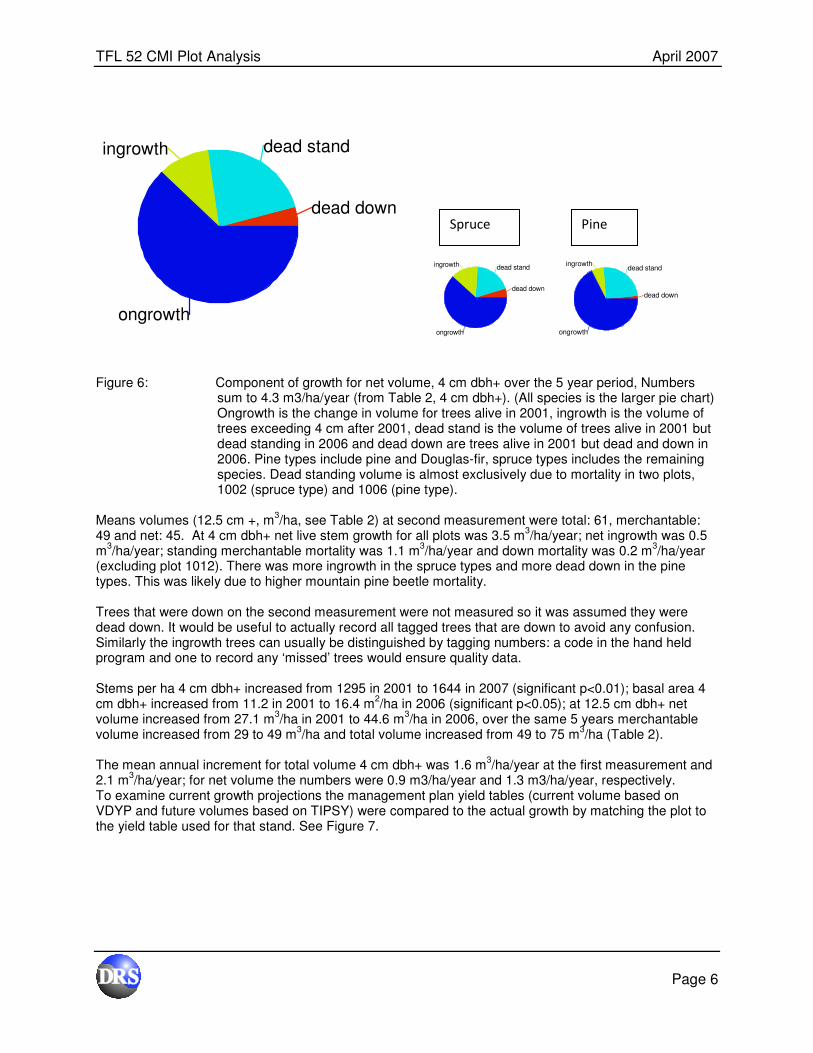
Figure 6: Component of growth for net volume, 4 cm dbh+ over the 5 year period, Numbers
sum to 4.3 m3/ha/year (from Table 2, 4 cm dbh+). (All species is the larger pie chart) Ongrowth is the change in volume for trees alive in 2001, ingrowth is the volume of trees exceeding 4 cm after 2001, dead stand is the volume of trees alive in 2001 but dead standing in 2006 and dead down are trees alive in 2001 but dead and down in 2006. Pine types include pine and Douglas-fir, spruce types includes the remaining species. Dead standing volume is almost exclusively due to mortality in two plots, 1002 (spruce type) and 1006 (pine type).
Means volumes (12.5 cm +, m
3/ha, see Table 2) at second measurement were total: 61, merchantable:
49 and net: 45. At 4 cm dbh+ net live stem growth for all plots was 3.5 m3/ha/year; net ingrowth was 0.5
m3/ha/year; standing merchantable mortality was 1.1 m
3/ha/year and down mortality was 0.2 m
3/ha/year
(excluding plot 1012). There was more ingrowth in the spruce types and more dead down in the pine types. This was likely due to higher mountain pine beetle mortality. Trees that were down on the second measurement were not measured so it was assumed they were dead down. It would be useful to actually record all tagged trees that are down to avoid any confusion. Similarly the ingrowth trees can usually be distinguished by tagging numbers: a code in the hand held program and one to record any ‘missed’ trees would ensure quality data. Stems per ha 4 cm dbh+ increased from 1295 in 2001 to 1644 in 2007 (significant p<0.01); basal area 4 cm dbh+ increased from 11.2 in 2001 to 16.4 m
2/ha in 2006 (significant p<0.05); at 12.5 cm dbh+ net
volume increased from 27.1 m3/ha in 2001 to 44.6 m
3/ha in 2006, over the same 5 years merchantable
volume increased from 29 to 49 m3/ha and total volume increased from 49 to 75 m
3/ha (Table 2).
The mean annual increment for total volume 4 cm dbh+ was 1.6 m
3/ha/year at the first measurement and
2.1 m3/ha/year; for net volume the numbers were 0.9 m3/ha/year and 1.3 m3/ha/year, respectively.
To examine current growth projections the management plan yield tables (current volume based on VDYP and future volumes based on TIPSY) were compared to the actual growth by matching the plot to the yield table used for that stand. See Figure 7.
Spruce Pine

TFL 52 CMI Plot Analysis April 2007
Page 7
Table 3. Comparing CMI and Yield Table Projections
Year CMI Plot Yield Table-Current Yield Table-Future
Net Volume m
3/ha
2001 27.1 31.3 ns
47.9ns
2006 44.5 45.6 ns
76.2*
Net Volume "adjusted" m
3/ha
2001 27.1 11.78 ns
28.7 ns
2006 44.5 24.5 ns
52.4 ns
Excludes 1012. ‘adjusted ‘ are refits of site index to 1002,1017 and 1021 (older plots). * indicates significantly different from CMI plots data. t-test, p<0.05 compared to CMI data. ns
indicates no significant difference, t-test p<0.05 compared to CMI data.
Table 3 shows the average results of the CMI data and the associated yield tables. It appears that the field sampling procedure may have resulted in the selection of some residual trees for 3 of the plots, 1002, 1017 and 1021 (Figure 7). When fitted to the yield tables an apparent over prediction of yields, compared to actual CMI plot yields, resulted. Refitting the 3 plots (see Appendix 4) that may contain residual (veteran) trees gave a closer agreement between CMI plot and yield table yields and projections. See Table4 (Appendix 4), Figure 7, Figure 9 and Figure 10 (Appendix 4).

TFL 52 CMI Plot Analysis April 2007
Page 8
0 20 40 60 80 100
age, years
0
100
200
300
vo
lum
e,
m3
/ha
1002
1017
1021
0 20 40 60 80 100
age, years
0
100
200
300
volu
me, m
3/h
a
1002
1017
1021
0 20 40 60 80 100
age, years
0
100
200
300
vo
lum
e,
m3
/ha 1002
1017
1021
Figure 7: Projections using actual plot data (top left) and Management Plan 3 current growth projections (top right) using VDYP and Management Plan 3 future growth (bottom left) using TIPSY for the stand that the plot was in (ages were matched). Excludes plot 1012. Uses net volume.
The unadjusted CMI plot data are mid-way between the current and future yield table in 2001 and close to the current yields in 2006: statistically they are not significantly different from the current yield tables (VDYP) but were significantly different to the future volumes (TIPSY) in 2006 only. The “adjusted” CMI data (Appendix 4) was insignificantly different from both the current and future yield tables, although the data were closer to the future yield tables. A more conclusive test would be to obtain date of establishment from silvicultural records to determine stand age.
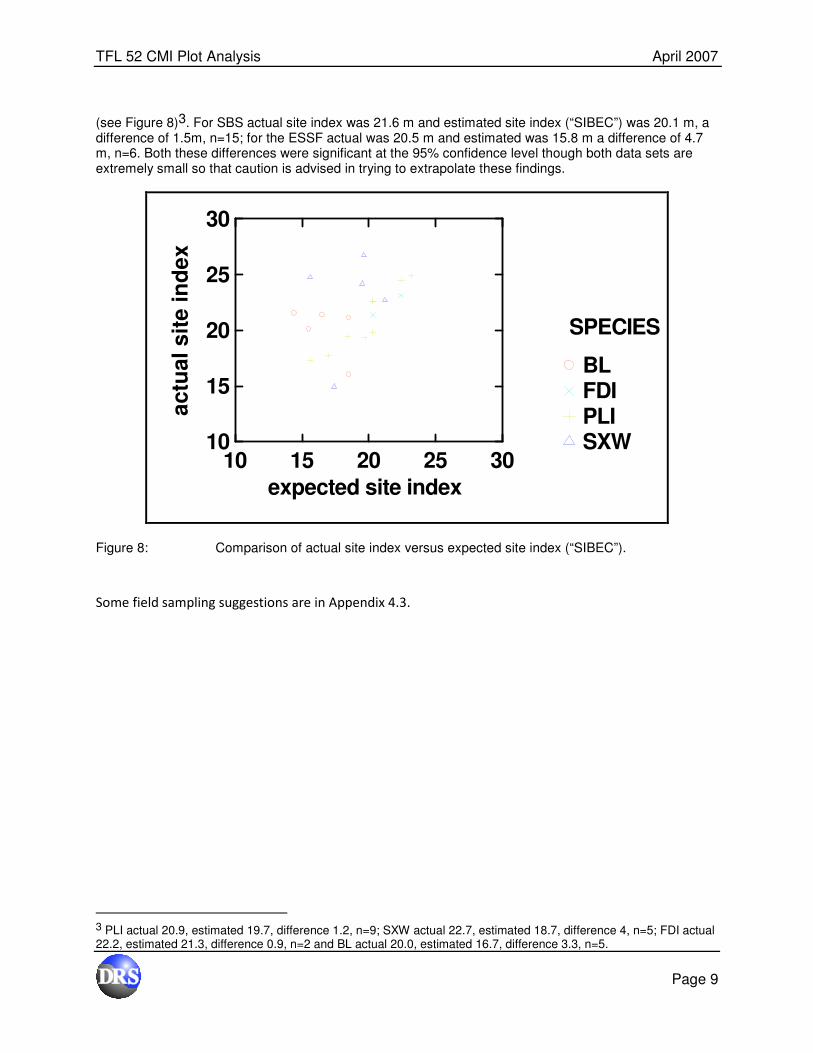
Site index estimates for the stands for attaching yield tables were provided by Timberline, called the “SIBEC” approach. Figure 8 shows a comparison. The mean estimated site index (“SIBEC”) was 18.9 m while the actual measured site index was 21.2 m, a difference of 2.3 m. The data were significantly different (P<0.01, t=3.6, n=21. There were 21 observations (3 estimated site index values were missing for 1007, 1013 and 1019). There were not enough data to undertake a meaningful species comparison. However, the measured site index was higher compared to expected for BL and SXW than it was for PLI
Actual CMI plot
data
Yield Table data-
current volume
Yield Table data-future
volume
TFL 52 CMI Plot Analysis April 2007
Page 9
(see Figure 8)3. For SBS actual site index was 21.6 m and estimated site index (“SIBEC”) was 20.1 m, a difference of 1.5m, n=15; for the ESSF actual was 20.5 m and estimated was 15.8 m a difference of 4.7 m, n=6. Both these differences were significant at the 95% confidence level though both data sets are extremely small so that caution is advised in trying to extrapolate these findings.
10 15 20 25 30
expected site index
10
15
20
25
30
actu
al
sit
e in
de
x
SXWPLIFDIBL
SPECIES
Figure 8: Comparison of actual site index versus expected site index (“SIBEC”).
Some field sampling suggestions are in Appendix 4.3.
3 PLI actual 20.9, estimated 19.7, difference 1.2, n=9; SXW actual 22.7, estimated 18.7, difference 4, n=5; FDI actual 22.2, estimated 21.3, difference 0.9, n=2 and BL actual 20.0, estimated 16.7, difference 3.3, n=5.
TFL 52 CMI Plot Analysis April 2007
Page 10
Conclusions
This is the first remeasurement analysis of the Inventory Monitoring plots for West Fraser: as such some of the analyses are investigative rather than confirmatory. The stand composition was quite variable with several site species. Two stands had a significant net loss of volume while one was partly harvested. These data are highly variable and net merchantable volume is only just starting to be recorded. The sample size is also on the small side to enable conclusive tests to be undertaken. Several plots have zero volume assigned by the current or future yield model allocation. This high level of variability and small sample size made it difficult to discriminate statistically significant differences. It also serves as a caution not to expect to reach strong unequivocal conclusions on this first remeasurement. Nevertheless certain trends are evident. Plot growth appeared to partly confirm the allocated managed (TIPSY) yields (after adjustment for 3 plots with residual trees) although the data were not significantly different from the current (VDYP) yields either. In summary the early results from the growth data do not indicate any unexpected discrepancies with current allocation of yield tables for timber supply analysis. Note that this comparison is very sensitive to the assigned stand age: in this analysis stand age was based on site index trees rather than date of establishment which was not available. Overall site index measured was 2.3 m higher than expected from assigned yield table site indices than expected (21.2 m measured and 18.9 m expected): this general trend was consistent across all species although the small size of the data set is suggestive only and needs to be confirmed with a larger data set. For a technical aspect it would be useful to examine the choice of site trees: generally a 5.64 m radius plot was not used instead trees were taken in multiple “quartered” sectors in a 0.04 ha plot. Choosing the largest trees in a sector quadrant may have meant that some residual trees were chosen. Similarly if a tree died and was down at second measurement then it was not recorded: it was assumed to be dead and down but may have been missed. A confirmation of ingrowth tag numbers in the comments file would ensue that no mistake are made when tallying ingrowth trees.

TFL 52 CMI Plot Analysis April 2007
Page 11
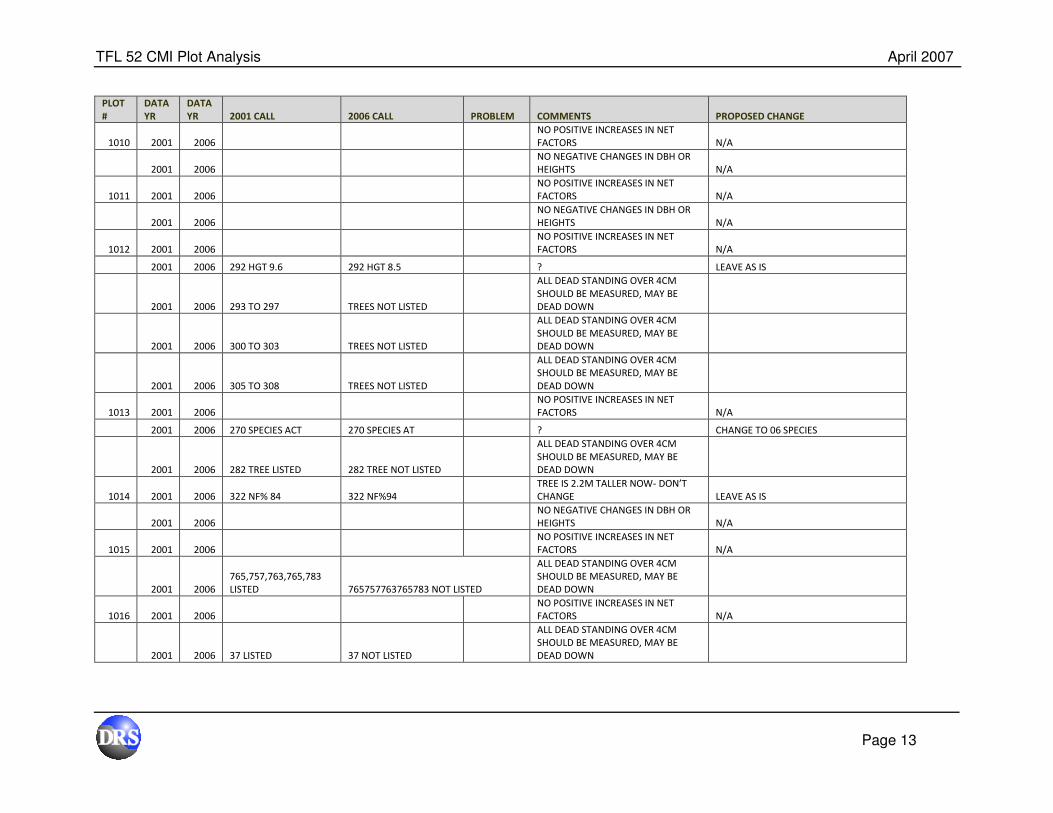
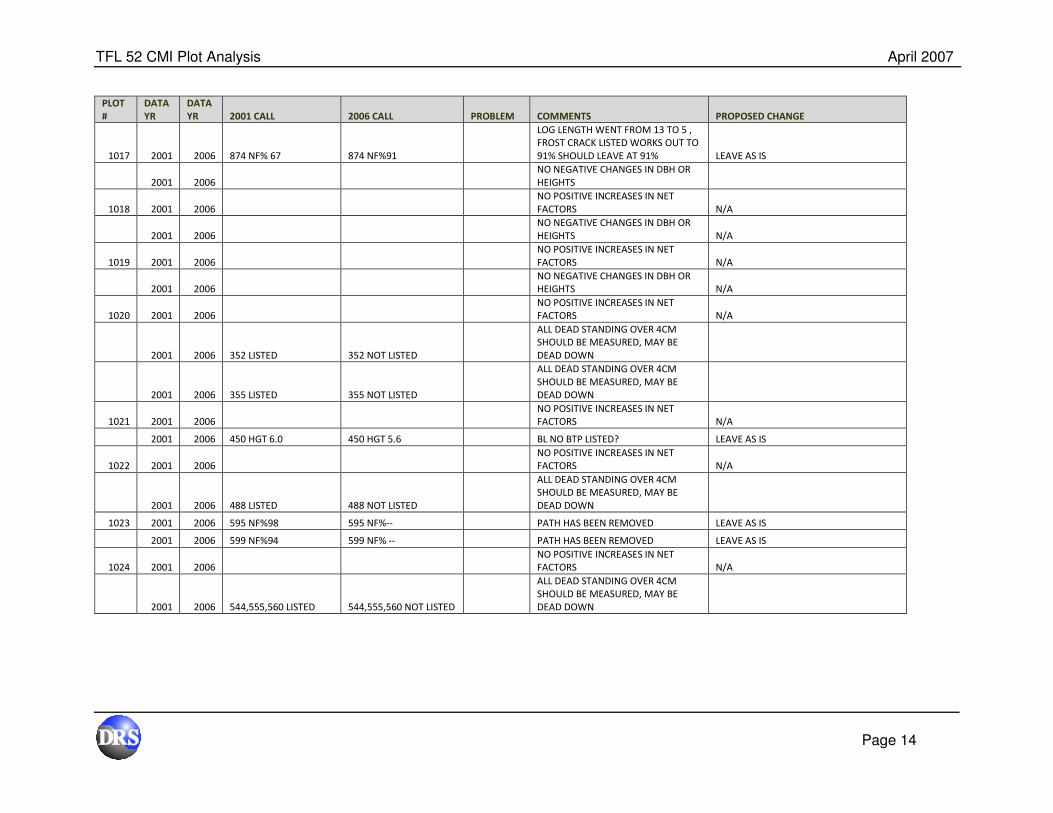
Appendices
Appendix 1 CMI Field Data Review Results PLOT
#
DATA
YR
DATA
YR 2001 CALL 2006 CALL PROBLEM COMMENTS PROPOSED CHANGE
1001 2001 2006
NO POSITIVE INCREASES IN NET
FACTORS, N/A
1001 2001 2006 #105 DBH 4.4 HGT 8.6 #105 DBH 4.3 HGT 8.3
TREE IS NOT DEAD AND HAS NO BTP
LISTED LEAVE AS IS
1001 2001 2006 TREE 106 LISTED NO TREE 106 LISTED
ALL DEAD STANDING OVER 4CM
SHOULD BE MEASURED, MAY BE
DEAD DOWN
SHOULD HAVE A FIELD COMMENT OF
DEAD FALLEN
1002 2001 2006
NO POSITIVE INCREASES IN NET
FACTORS, N/A
1002 2001 2006 385 SPECIES PLI 385 SPECIES BL CHANGE TO 06 SPECIES
1002 2001 2006 401 DBH 5.0 HGT 3.6 401 DBH 4.7 HGT 3.1
TREE IS DEAD NOW BUT NO BTP
LISTED LEAVE AS IS
1002 2001 2006 414 LISTED 414 NOT LISTED
ALL DEAD STANDING OVER 4CM
SHOULD BE MEASURED, MAY BE
DEAD DOWN
SHOULD HAVE A FIELD COMMENT OF
DEAD FALLEN
1002 2001 2006 431 DBH 4.7 HGT 5.2 431 DBH 4.6 HGT 4.7
TREE IS DEAD NOW BUT NO BTP
LISTED LEAVE AS IS
1002 2001 2006 304 NOT LISTED 304 LISTED
COULD BE INGROWTH BUT IS
MISSING INFORMATION, OFFICE
ADDED DATA IS ESTIMATED AND IS E
FOR DBH CODE, -- FOR BARK %, E FOR
HEIGHT CODE, P99-- FOR GRADE,
11110-- FOR WILDLIFE, 0 FOR
DAMAGE , STEM MAP ?
CHANGE DATA AS ESTIMATED IN OFFICE
TO REFLECT
1003 2001 2006
NO POSITIVE INCREASES IN NET
FACTORS, N/A
1003 2001 2006 494 DBH 4.8 494 DBH 4.7 LIVE TREE STILL DBH SHRUNK? LEAVE AS IS
1003 2001 2006 540 DBH 14.7 HGT 9.9 540 DBH 9.3 HGT 9.7
LIVE TREE STILL, APPEARS DATA HAS
BEEN DUPLICATED FROM TREE
BEFORE THIS ONE #828 INGROWTH.
CHANGE DATA AS ESTIMATED IN OFFICE
TO REFLECT
1004 2001 2006
NO P0SITIVE INCREASES IN NET
FACTORS, N/A
2001 2006 357 DBH 49.0 357 DBH 38.7 DEAD TREE DBH SHRUNK LEAVE AS IS

TFL 52 CMI Plot Analysis April 2007
Page 12
PLOT
#
DATA
YR
DATA
YR 2001 CALL 2006 CALL PROBLEM COMMENTS PROPOSED CHANGE
2001 2006 358 SPECIES BL 358 SPECIES FDI CHANG TO 06 SPECIES
2001 2006 359 SPECIES BL 359 SPECIES FDI CHANGE TO 06 SPECIES
2001 2006 356 LISTED 356 NOT LISTED
ALL DEAD STANDING OVER 4CM
SHOULD BE MEASURED, MAY BE
DEAD DOWN
2001 2006 363 SPECIES BL 363 SPECIES FDI CHANGE TO 06 SPECIES
2001 2006 365 LISTED 365 LISTED
ALL DEAD STANDING OVER 4CM
SHOULD BE MEASURED, MAY BE
DEAD DOWN
1005 2001 2006
NO POSITIVE INCREASES IN NET
FACTORS N/A
2001 2006
NO NEGATIVE CHANGES IN DBH OR
HEIGHTS N/A
1006 2001 2006
NO POSITIVE INCREASES IN NET
FACTORS N/A
2001 2006
NO NEGATIVE CHANGES IN DBH OR
HEIGHTS N/A
1007 2001 2006
NO NEGATIVE INCREASES IN NET
FACTORS N/A
2001 2006 814 HGT 5.8 814 HGT 5.4
NOT BROKEN BUT IS AN ASPEN
STAND LEAVE AS IS
2001 2006 817 HGT 13.7 817 HGT 13.6
NOT BROKEN BUT IS AN ASPEN
STAND LEAVE AS IS
2001 2006 828 HGT 17.1 828 HGT 15.5
NOT BROKEN BUT IS AN ASPEN
STAND LEAVE AS IS
2001 2006 836 DBH 13.3 HGT 15.1 836 DBH HGT 13.0
NOT BROKEN BUT IS AN ASPEN
STAND LEAVE AS IS
2001 2006 837 HGT 15.7 837 HGT 15.1
NOT BROKEN BUT IS AN ASPEN
STAND LEAVE AS IS
2001 2006 839
GRADE NOT
RIGHT CHANGE IN OFFICE TO R05-- N9900
CHANGE DATA AS ESTIMATED IN OFFICE
TO REFLECT
2001 2006 840 LISTED 840 NOT LISTED
ALL DEAD STANDING OVER 4CM
SHOULD BE MEASURED, MAY BE
DEAD DOWN
1008 2001 2006
NO POSITIVE INCREASES IN NET
FACTORS N/A
2001 2006 989 DBH 18.9 989 DBH 18.7
POSSIBLY OVER A STUB THE FIRST
TIME?
CHANGE DATA AS ESTIMATED IN OFFICE
TO REFLECT
1009 2001 2006
NO POSITIVE INCREASES IN NET
FACTORS N/A
2001 2006
NO NEGATIVE CHANGES IN DBH OR
HEIGHTS N/A
TFL 52 CMI Plot Analysis April 2007
Page 13
PLOT
#
DATA
YR
DATA
YR 2001 CALL 2006 CALL PROBLEM COMMENTS PROPOSED CHANGE
1010 2001 2006
NO POSITIVE INCREASES IN NET
FACTORS N/A
2001 2006
NO NEGATIVE CHANGES IN DBH OR
HEIGHTS N/A
1011 2001 2006
NO POSITIVE INCREASES IN NET
FACTORS N/A
2001 2006
NO NEGATIVE CHANGES IN DBH OR
HEIGHTS N/A
1012 2001 2006
NO POSITIVE INCREASES IN NET
FACTORS N/A
2001 2006 292 HGT 9.6 292 HGT 8.5 ? LEAVE AS IS
2001 2006 293 TO 297 TREES NOT LISTED
ALL DEAD STANDING OVER 4CM
SHOULD BE MEASURED, MAY BE
DEAD DOWN
2001 2006 300 TO 303 TREES NOT LISTED
ALL DEAD STANDING OVER 4CM
SHOULD BE MEASURED, MAY BE
DEAD DOWN
2001 2006 305 TO 308 TREES NOT LISTED
ALL DEAD STANDING OVER 4CM
SHOULD BE MEASURED, MAY BE
DEAD DOWN
1013 2001 2006
NO POSITIVE INCREASES IN NET
FACTORS N/A
2001 2006 270 SPECIES ACT 270 SPECIES AT ? CHANGE TO 06 SPECIES
2001 2006 282 TREE LISTED 282 TREE NOT LISTED
ALL DEAD STANDING OVER 4CM
SHOULD BE MEASURED, MAY BE
DEAD DOWN
1014 2001 2006 322 NF% 84 322 NF%94
TREE IS 2.2M TALLER NOW- DON’T
CHANGE LEAVE AS IS
2001 2006
NO NEGATIVE CHANGES IN DBH OR
HEIGHTS N/A
1015 2001 2006
NO POSITIVE INCREASES IN NET
FACTORS N/A
2001 2006
765,757,763,765,783
LISTED 765757763765783 NOT LISTED
ALL DEAD STANDING OVER 4CM
SHOULD BE MEASURED, MAY BE
DEAD DOWN
1016 2001 2006
NO POSITIVE INCREASES IN NET
FACTORS N/A
2001 2006 37 LISTED 37 NOT LISTED
ALL DEAD STANDING OVER 4CM
SHOULD BE MEASURED, MAY BE
DEAD DOWN
TFL 52 CMI Plot Analysis April 2007
Page 14
PLOT
#
DATA
YR
DATA
YR 2001 CALL 2006 CALL PROBLEM COMMENTS PROPOSED CHANGE
1017 2001 2006 874 NF% 67 874 NF%91
LOG LENGTH WENT FROM 13 TO 5 ,
FROST CRACK LISTED WORKS OUT TO
91% SHOULD LEAVE AT 91% LEAVE AS IS
2001 2006
NO NEGATIVE CHANGES IN DBH OR
HEIGHTS
1018 2001 2006
NO POSITIVE INCREASES IN NET
FACTORS N/A
2001 2006
NO NEGATIVE CHANGES IN DBH OR
HEIGHTS N/A
1019 2001 2006
NO POSITIVE INCREASES IN NET
FACTORS N/A
2001 2006
NO NEGATIVE CHANGES IN DBH OR
HEIGHTS N/A
1020 2001 2006
NO POSITIVE INCREASES IN NET
FACTORS N/A
2001 2006 352 LISTED 352 NOT LISTED
ALL DEAD STANDING OVER 4CM
SHOULD BE MEASURED, MAY BE
DEAD DOWN
2001 2006 355 LISTED 355 NOT LISTED
ALL DEAD STANDING OVER 4CM
SHOULD BE MEASURED, MAY BE
DEAD DOWN
1021 2001 2006
NO POSITIVE INCREASES IN NET
FACTORS N/A
2001 2006 450 HGT 6.0 450 HGT 5.6 BL NO BTP LISTED? LEAVE AS IS
1022 2001 2006
NO POSITIVE INCREASES IN NET
FACTORS N/A
2001 2006 488 LISTED 488 NOT LISTED
ALL DEAD STANDING OVER 4CM
SHOULD BE MEASURED, MAY BE
DEAD DOWN
1023 2001 2006 595 NF%98 595 NF%-- PATH HAS BEEN REMOVED LEAVE AS IS
2001 2006 599 NF%94 599 NF% -- PATH HAS BEEN REMOVED LEAVE AS IS
1024 2001 2006
NO POSITIVE INCREASES IN NET
FACTORS N/A
2001 2006 544,555,560 LISTED 544,555,560 NOT LISTED
ALL DEAD STANDING OVER 4CM
SHOULD BE MEASURED, MAY BE
DEAD DOWN
TFL 52 CMI Plot Analysis April 2007
Page 15
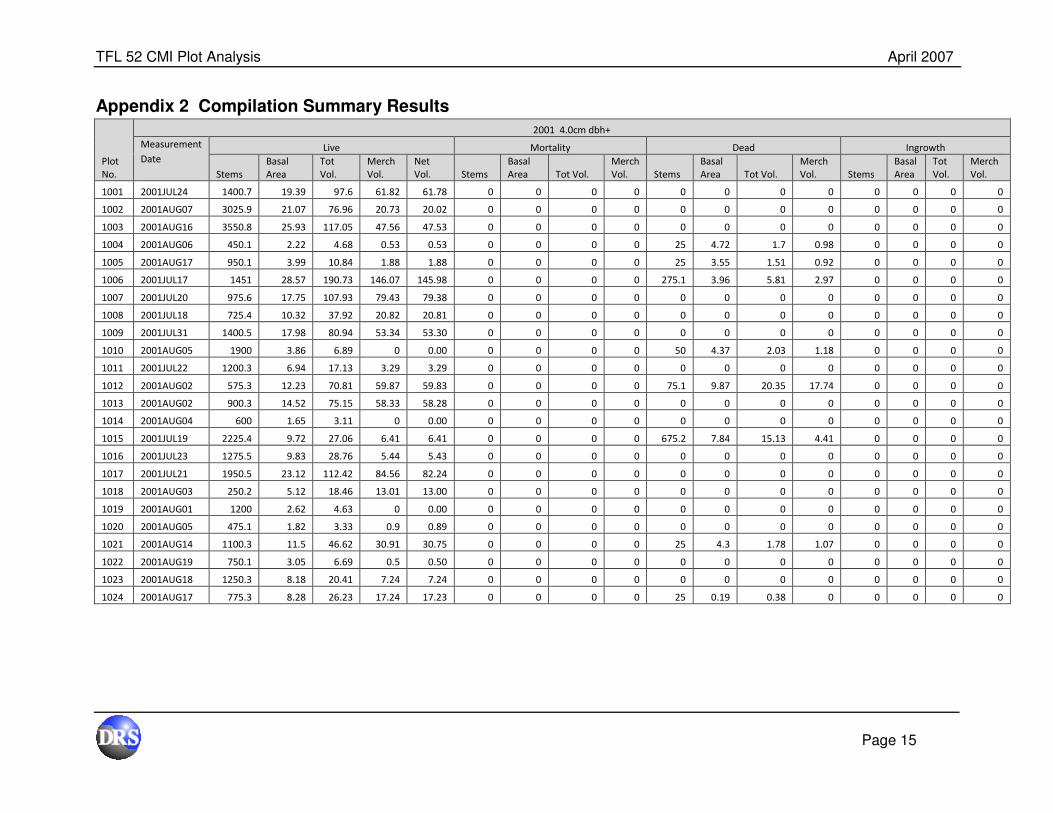
Appendix 2 Compilation Summary Results
Plot
No.
2001 4.0cm dbh+
Measurement
Date Live Mortality Dead Ingrowth
Stems
Basal
Area
Tot
Vol.
Merch
Vol.
Net
Vol. Stems
Basal
Area Tot Vol.
Merch
Vol. Stems
Basal
Area Tot Vol.
Merch
Vol. Stems
Basal
Area
Tot
Vol.
Merch
Vol.
1001 2001JUL24 1400.7 19.39 97.6 61.82 61.78 0 0 0 0 0 0 0 0 0 0 0 0
1002 2001AUG07 3025.9 21.07 76.96 20.73 20.02 0 0 0 0 0 0 0 0 0 0 0 0
1003 2001AUG16 3550.8 25.93 117.05 47.56 47.53 0 0 0 0 0 0 0 0 0 0 0 0
1004 2001AUG06 450.1 2.22 4.68 0.53 0.53 0 0 0 0 25 4.72 1.7 0.98 0 0 0 0
1005 2001AUG17 950.1 3.99 10.84 1.88 1.88 0 0 0 0 25 3.55 1.51 0.92 0 0 0 0
1006 2001JUL17 1451 28.57 190.73 146.07 145.98 0 0 0 0 275.1 3.96 5.81 2.97 0 0 0 0
1007 2001JUL20 975.6 17.75 107.93 79.43 79.38 0 0 0 0 0 0 0 0 0 0 0 0
1008 2001JUL18 725.4 10.32 37.92 20.82 20.81 0 0 0 0 0 0 0 0 0 0 0 0
1009 2001JUL31 1400.5 17.98 80.94 53.34 53.30 0 0 0 0 0 0 0 0 0 0 0 0
1010 2001AUG05 1900 3.86 6.89 0 0.00 0 0 0 0 50 4.37 2.03 1.18 0 0 0 0
1011 2001JUL22 1200.3 6.94 17.13 3.29 3.29 0 0 0 0 0 0 0 0 0 0 0 0
1012 2001AUG02 575.3 12.23 70.81 59.87 59.83 0 0 0 0 75.1 9.87 20.35 17.74 0 0 0 0
1013 2001AUG02 900.3 14.52 75.15 58.33 58.28 0 0 0 0 0 0 0 0 0 0 0 0
1014 2001AUG04 600 1.65 3.11 0 0.00 0 0 0 0 0 0 0 0 0 0 0 0
1015 2001JUL19 2225.4 9.72 27.06 6.41 6.41 0 0 0 0 675.2 7.84 15.13 4.41 0 0 0 0
1016 2001JUL23 1275.5 9.83 28.76 5.44 5.43 0 0 0 0 0 0 0 0 0 0 0 0
1017 2001JUL21 1950.5 23.12 112.42 84.56 82.24 0 0 0 0 0 0 0 0 0 0 0 0
1018 2001AUG03 250.2 5.12 18.46 13.01 13.00 0 0 0 0 0 0 0 0 0 0 0 0
1019 2001AUG01 1200 2.62 4.63 0 0.00 0 0 0 0 0 0 0 0 0 0 0 0
1020 2001AUG05 475.1 1.82 3.33 0.9 0.89 0 0 0 0 0 0 0 0 0 0 0 0
1021 2001AUG14 1100.3 11.5 46.62 30.91 30.75 0 0 0 0 25 4.3 1.78 1.07 0 0 0 0
1022 2001AUG19 750.1 3.05 6.69 0.5 0.50 0 0 0 0 0 0 0 0 0 0 0 0
1023 2001AUG18 1250.3 8.18 20.41 7.24 7.24 0 0 0 0 0 0 0 0 0 0 0 0
1024 2001AUG17 775.3 8.28 26.23 17.24 17.23 0 0 0 0 25 0.19 0.38 0 0 0 0 0

TFL 52 CMI Plot Analysis April 2007
Page 16
Plot
No.
2001 12.5cm dbh+
Measurement
Date Live Mortality Dead Ingrowth
Stems
Basal
Area
Tot
Vol.
Merch
Vol.
Net
Vol. Stems
Basal
Area Tot Vol.
Merch
Vol. Stems
Basal
Area Tot Vol.
Merch
Vol. Stems
Basal
Area
Tot
Vol.
Merch
Vol.
1001 2001JUL24 675.5 14.72 76.45 57.65 57.61 0 0 0 0 0 0 0 0 0 0 0 0
1002 2001AUG07 475.3 7.65 28.13 16.59 16.02 0 0 0 0 0 0 0 0 0 0 0 0
1003 2001AUG16 600.4 11.93 58.17 42.53 42.50 0 0 0 0 0 0 0 0 0 0 0 0
1004 2001AUG06 50 0.66 1.59 0.36 0.53 0 0 0 0 25 4.72 1.7 0.98 0 0 0 0
1005 2001AUG17 25 0.44 1.62 1.13 1.13 0 0 0 0 25 3.55 1.51 0.92 0 0 0 0
1006 2001JUL17 1275.9 26.84 180.34 142.63 142.54 0 0 0 0 50 2.93 3.69 2.93 0 0 0 0
1007 2001JUL20 675.5 15.56 99.1 77.78 77.72 0 0 0 0 0 0 0 0 0 0 0 0
1008 2001JUL18 325.2 7.35 29.18 20.36 20.35 0 0 0 0 0 0 0 0 0 0 0 0
1009 2001JUL31 575.4 13.54 65.04 50.74 47.64 0 0 0 0 0 0 0 0 0 0 0 0
1010 2001AUG05 0 0 0 0 0.00 0 0 0 0 50 4.37 2.03 1.18 0 0 0 0
1011 2001JUL22 100.1 1.63 5.03 2.81 2.81 0 0 0 0 0 0 0 0 0 0 0 0
1012 2001AUG02 250.2 10.54 66.8 59.48 59.44 0 0 0 0 75.1 9.87 20.35 17.74 0 0 0 0
1013 2001AUG02 325.2 11.39 66.49 57.58 57.55 0 0 0 0 0 0 0 0 0 0 0 0
1014 2001AUG04 0 0 0 0 0.00 0 0 0 0 0 0 0 0 0 0 0 0
1015 2001JUL19 50 1.53 6.88 5.58 5.57 0 0 0 0 75.1 4.48 4.77 2.92 0 0 0 0
1016 2001JUL23 175.1 2.43 7.68 3.49 3.49 0 0 0 0 0 0 0 0 0 0 0 0
1017 2001JUL21 500.3 17.34 95.96 83 80.68 0 0 0 0 0 0 0 0 0 0 0 0
1018 2001AUG03 150.1 4.14 15.66 12.41 12.40 0 0 0 0 0 0 0 0 0 0 0 0
1019 2001AUG01 0 0 0 0 0.00 0 0 0 0 0 0 0 0 0 0 0 0
1020 2001AUG05 25 0.59 1.32 0.9 0.89 0 0 0 0 0 0 0 0 0 0 0 0
1021 2001AUG14 250.2 7.94 36.78 30.69 30.52 0 0 0 0 25 4.3 1.78 1.07 0 0 0 0
1022 2001AUG19 0 0 0 0 0.00 0 0 0 0 0 0 0 0 0 0 0 0
1023 2001AUG18 225.2 4.2 11.3 6.98 6.98 0 0 0 0 0 0 0 0 0 0 0 0
1024 2001AUG17 275.2 6.56 22.24 16.79 16.77 0 0 0 0 0 0 0 0 0 0 0 0
TFL 52 CMI Plot Analysis April 2007
Page 17
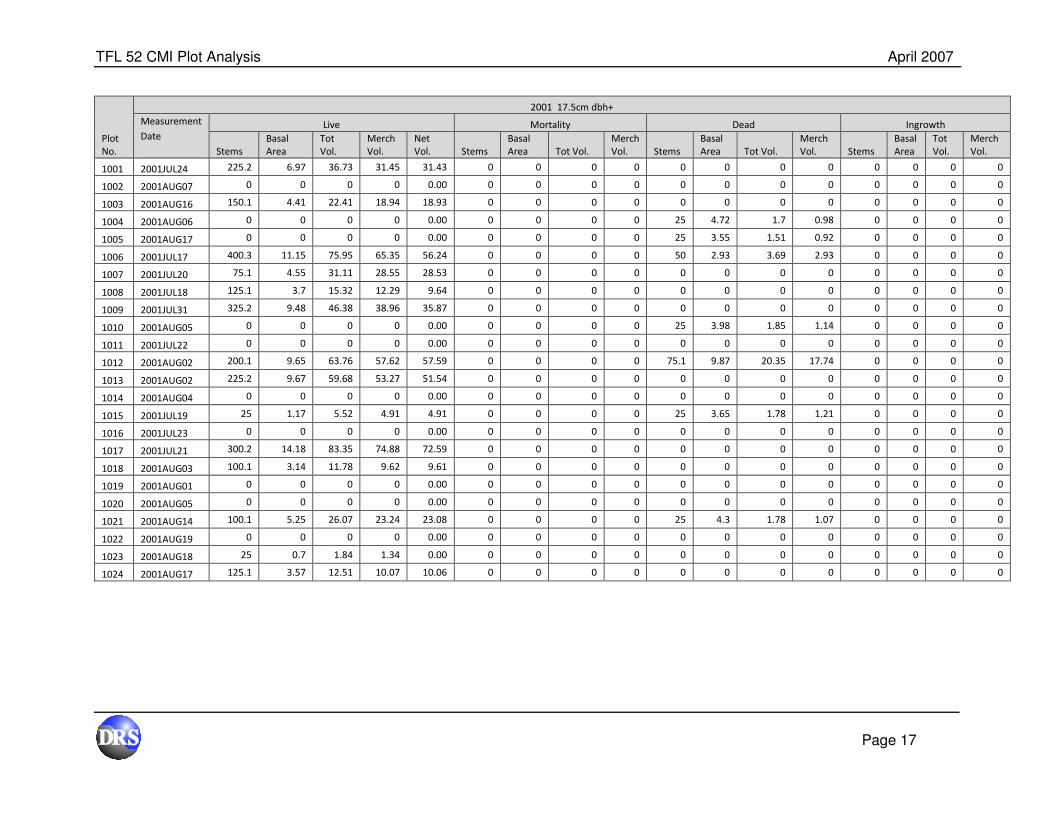
Plot
No.
2001 17.5cm dbh+
Measurement
Date Live Mortality Dead Ingrowth
Stems
Basal
Area
Tot
Vol.
Merch
Vol.
Net
Vol. Stems
Basal
Area Tot Vol.
Merch
Vol. Stems
Basal
Area Tot Vol.
Merch
Vol. Stems
Basal
Area
Tot
Vol.
Merch
Vol.
1001 2001JUL24 225.2 6.97 36.73 31.45 31.43 0 0 0 0 0 0 0 0 0 0 0 0
1002 2001AUG07 0 0 0 0 0.00 0 0 0 0 0 0 0 0 0 0 0 0
1003 2001AUG16 150.1 4.41 22.41 18.94 18.93 0 0 0 0 0 0 0 0 0 0 0 0
1004 2001AUG06 0 0 0 0 0.00 0 0 0 0 25 4.72 1.7 0.98 0 0 0 0
1005 2001AUG17 0 0 0 0 0.00 0 0 0 0 25 3.55 1.51 0.92 0 0 0 0
1006 2001JUL17 400.3 11.15 75.95 65.35 56.24 0 0 0 0 50 2.93 3.69 2.93 0 0 0 0
1007 2001JUL20 75.1 4.55 31.11 28.55 28.53 0 0 0 0 0 0 0 0 0 0 0 0
1008 2001JUL18 125.1 3.7 15.32 12.29 9.64 0 0 0 0 0 0 0 0 0 0 0 0
1009 2001JUL31 325.2 9.48 46.38 38.96 35.87 0 0 0 0 0 0 0 0 0 0 0 0
1010 2001AUG05 0 0 0 0 0.00 0 0 0 0 25 3.98 1.85 1.14 0 0 0 0
1011 2001JUL22 0 0 0 0 0.00 0 0 0 0 0 0 0 0 0 0 0 0
1012 2001AUG02 200.1 9.65 63.76 57.62 57.59 0 0 0 0 75.1 9.87 20.35 17.74 0 0 0 0
1013 2001AUG02 225.2 9.67 59.68 53.27 51.54 0 0 0 0 0 0 0 0 0 0 0 0
1014 2001AUG04 0 0 0 0 0.00 0 0 0 0 0 0 0 0 0 0 0 0
1015 2001JUL19 25 1.17 5.52 4.91 4.91 0 0 0 0 25 3.65 1.78 1.21 0 0 0 0
1016 2001JUL23 0 0 0 0 0.00 0 0 0 0 0 0 0 0 0 0 0 0
1017 2001JUL21 300.2 14.18 83.35 74.88 72.59 0 0 0 0 0 0 0 0 0 0 0 0
1018 2001AUG03 100.1 3.14 11.78 9.62 9.61 0 0 0 0 0 0 0 0 0 0 0 0
1019 2001AUG01 0 0 0 0 0.00 0 0 0 0 0 0 0 0 0 0 0 0
1020 2001AUG05 0 0 0 0 0.00 0 0 0 0 0 0 0 0 0 0 0 0
1021 2001AUG14 100.1 5.25 26.07 23.24 23.08 0 0 0 0 25 4.3 1.78 1.07 0 0 0 0
1022 2001AUG19 0 0 0 0 0.00 0 0 0 0 0 0 0 0 0 0 0 0
1023 2001AUG18 25 0.7 1.84 1.34 0.00 0 0 0 0 0 0 0 0 0 0 0 0
1024 2001AUG17 125.1 3.57 12.51 10.07 10.06 0 0 0 0 0 0 0 0 0 0 0 0

TFL 52 CMI Plot Analysis April 2007
Page 18
Plot
No.
2006 4.0cm dbh+
Measurement
Date Live Mortality Dead Ingrowth
Stems
Basal
Area
Tot
Vol.
Merch
Vol. Net Vol. Stems
Basal
Area Tot Vol.
Merch
Vol. Stems
Basal
Area Tot Vol.
Merch
Vol. Stems
Basal
Area
Tot
Vol.
Merch
Vol.
1001 2006OCT21 1650.8 25.86 152.43 110.73 110.6543 0 0 0 0 0 0 0 0 350 1.42 5.43 0
1002 2006OCT22 1125.1 5.52 22.53 2.2 2.201525 1575.9 19.46 90.44 49.06 0 0 0 0 100 0.53 2.71 0
1003 2006OCT01 3801 30.67 160.91 80.16 80.10635 0 0 0 0 0 0 0 0 475.1 2.07 8.65 2.41
1004 2006OCT16 1550.2 9.53 23.17 9.21 9.203075 0 0 0 0 25 2.94 1.09 0.62 1225.2 5.72 12.61 3.42
1005 2006OCT19 1400.3 7.82 26.17 8.97 8.959875 0 0 0 0 25 3.63 1.03 0.58 750.2 3.11 9.6 1.32
1006 2006OCT20 950.6 20.31 156.53 126.96 92.94573 425.3 12.12 92.03 79.84 0 0 0 0 0 0 0 0
1007 2006OCT16 1125.6 22.04 142.98 112.79 112.7105 25 0.41 0.67 0.29 0 0 0 0 200.1 3.04 19.7 15.99
1008 2006OCT24 875.5 16.63 75.63 53.65 53.61655 0 0 0 0 0 0 0 0 150 0.7 2.7 0.78
1009 2006OCT17 1475.6 24.62 136.51 102.79 102.7218 0 0 0 0 0 0 0 0 150 0.63 1.79 0
1010 2006OCT17 3750.4 15.13 40.24 0.74 0.737875 0 0 0 0 50 4.42 2.05 1.19 2375.3 7.71 20.35 0.64
1011 2006OCT19 1600.7 15.93 48.21 20.64 20.62385 0 0 0 0 0 0 0 0 775.3 5.97 15.63 3
1012 2006OCT21 350.2 4.34 12.03 6.17 6.164875 0 0 0 0 0 0 0 0 200.1 2.15 3.9 1.01
1013 2006OCT20 925.4 21.62 136.17 116.33 116.0423 0 0 0 0 0 0 0 0 425.2 4.99 19.06 12.61
1014 2006OCT30 1475.3 7.33 17.48 2.13 2.1246 0 0 0 0 0 0 0 0 1250.2 5.86 13.48 1.54
1015 2006OCT22 2475.7 20.16 71.03 28.74 28.71648 0 0 0 0 0 0 0 0 625.3 4.56 16.88 5.05
1016 2006OCT17 1250.8 16.47 64.41 34.64 34.61958 0 0 0 0 0 0 0 0 375.2 2.55 8.93 0.96
1017 2006OCT18 2275.7 30.99 158.39 117.98 116.3835 0 0 0 0 0 0 0 0 475.1 2.37 7.12 1.21
1018 2006OCT17 725.2 9.74 40.26 31.04 29.82383 25 0.31 1.07 0.4 0 0 0 0 500.1 1.77 4.11 0.44
1019 2006OCT20 2125.2 8.06 18.1 1.66 1.65765 0 0 0 0 0 0 0 0 1225.2 3.66 8.08 0.76
1020 2006OCT18 1600.3 10.5 25.93 8.57 8.568275 0 0 0 0 0 0 0 0 1400.3 8.39 20.55 6.71
1021 2006OCT21 1325.4 17.34 77.56 55.74 55.08055 0 0 0 0 25 4.41 1.96 1.21 450.1 1.72 5.49 0.73
1022 2006OCT21 1175.5 9.72 29.45 8.53 8.52065 0 0 0 0 0 0 0 0 775.4 5.79 17.44 3.9
1023 2006OCT20 1775.5 15.92 48.73 24.2 24.1851 0 0 0 0 0 0 0 0 675.1 2.56 6.24 1.07
1024 2006OCT19 1375.3 14.1 55.2 37.37 37.00355 0 0 0 0 25 0.19 0.4 0 750.1 4.1 15.36 7.27

TFL 52 CMI Plot Analysis April 2007
Page 19
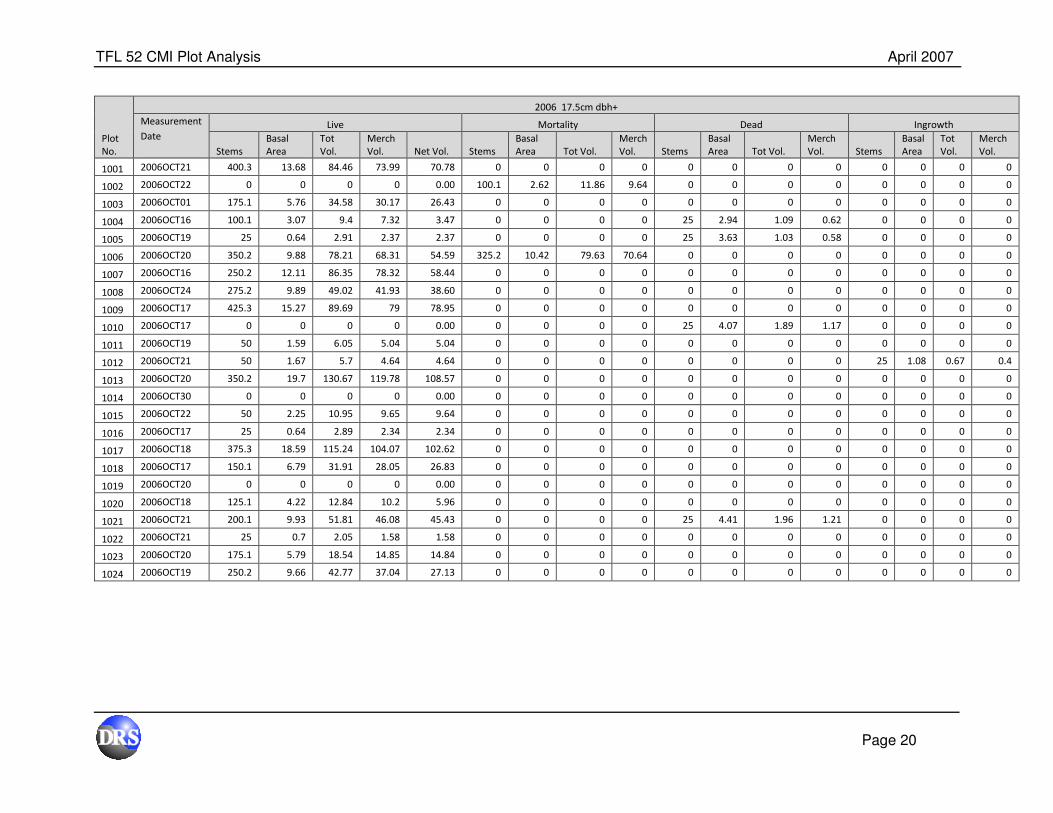
Plot
No.
2006 12.5cm dbh+
Measurement
Date Live Mortality Dead Ingrowth
Stems
Basal
Area
Tot
Vol.
Merch
Vol. Net Vol. Stems
Basal
Area Tot Vol.
Merch
Vol. Stems
Basal
Area Tot Vol.
Merch
Vol. Stems
Basal
Area
Tot
Vol.
Merch
Vol.
1001 2006OCT21 900.6 21.93 133.91 107.45 107.37 0 0 0 0 0 0 0 0 0 0 0 0
1002 2006OCT22 50 0.69 2.9 1.63 0.62 775.5 14.13 65.62 45.12 0 0 0 0 0 0 0 0
1003 2006OCT01 875.6 17.93 101.69 76.97 75.01 0 0 0 0 0 0 0 0 0 0 0 0
1004 2006OCT16 250.2 5.96 17.64 12.34 8.98 0 0 0 0 25 2.94 1.09 0.62 0 0 0 0
1005 2006OCT19 175.1 2.89 11.83 7.31 6.89 0 0 0 0 25 3.63 1.03 0.58 0 0 0 0
1006 2006OCT20 925.6 20.14 155.42 126.96 92.95 400.3 11.95 91.05 79.84 0 0 0 0 0 0 0 0
1007 2006OCT16 825.6 22.76 153.95 128.27 109.48 25 0.41 0.67 0.29 0 0 0 0 0 0 0 0
1008 2006OCT24 575.4 14.97 70.31 53.87 53.06 0 0 0 0 0 0 0 0 0 0 0 0
1009 2006OCT17 750.5 20.92 121.88 101.86 101.79 0 0 0 0 0 0 0 0 0 0 0 0
1010 2006OCT17 0 0 0 0 0.00 0 0 0 0 50 4.42 2.05 1.19 0 0 0 0
1011 2006OCT19 625.4 10.37 34.77 20.51 18.58 0 0 0 0 0 0 0 0 0 0 0 0
1012 2006OCT21 75.1 2.15 6.26 4.93 4.93 0 0 0 0 0 0 0 0 25 1.08 0.67 0.4
1013 2006OCT20 500.3 22.51 143.34 128.65 115.85 0 0 0 0 0 0 0 0 0 0 0 0
1014 2006OCT30 100.1 1.62 3.42 1.53 0.76 0 0 0 0 0 0 0 0 0 0 0 0
1015 2006OCT22 500.3 9.8 42.03 28.18 28.72 0 0 0 0 0 0 0 0 0 0 0 0
1016 2006OCT17 750.5 12.95 51.57 33.39 33.00 0 0 0 0 0 0 0 0 0 0 0 0
1017 2006OCT18 700.5 24.04 135.13 116.76 114.20 0 0 0 0 0 0 0 0 0 0 0 0
1018 2006OCT17 275.2 8.58 38.27 31.41 29.79 25 0.31 1.07 0.4 0 0 0 0 0 0 0 0
1019 2006OCT20 125.1 1.78 5.13 2.24 1.45 0 0 0 0 0 0 0 0 0 0 0 0
1020 2006OCT18 275.2 6.9 19.97 14.37 7.43 0 0 0 0 0 0 0 0 0 0 0 0
1021 2006OCT21 350.2 12.67 63.15 54.08 53.43 0 0 0 0 25 4.41 1.96 1.21 0 0 0 0
1022 2006OCT21 175.1 3.32 10.73 7.36 5.84 0 0 0 0 0 0 0 0 0 0 0 0
1023 2006OCT20 475.3 10.48 33.69 23.25 22.86 0 0 0 0 0 0 0 0 0 0 0 0
1024 2006OCT19 425.3 12.69 53.96 44.08 36.52 0 0 0 0 0 0 0 0 0 0 0 0
TFL 52 CMI Plot Analysis April 2007
Page 20
Plot
No.
2006 17.5cm dbh+
Measurement
Date Live Mortality Dead Ingrowth
Stems
Basal
Area
Tot
Vol.
Merch
Vol. Net Vol. Stems
Basal
Area Tot Vol.
Merch
Vol. Stems
Basal
Area Tot Vol.
Merch
Vol. Stems
Basal
Area
Tot
Vol.
Merch
Vol.
1001 2006OCT21 400.3 13.68 84.46 73.99 70.78 0 0 0 0 0 0 0 0 0 0 0 0
1002 2006OCT22 0 0 0 0 0.00 100.1 2.62 11.86 9.64 0 0 0 0 0 0 0 0
1003 2006OCT01 175.1 5.76 34.58 30.17 26.43 0 0 0 0 0 0 0 0 0 0 0 0
1004 2006OCT16 100.1 3.07 9.4 7.32 3.47 0 0 0 0 25 2.94 1.09 0.62 0 0 0 0
1005 2006OCT19 25 0.64 2.91 2.37 2.37 0 0 0 0 25 3.63 1.03 0.58 0 0 0 0
1006 2006OCT20 350.2 9.88 78.21 68.31 54.59 325.2 10.42 79.63 70.64 0 0 0 0 0 0 0 0
1007 2006OCT16 250.2 12.11 86.35 78.32 58.44 0 0 0 0 0 0 0 0 0 0 0 0
1008 2006OCT24 275.2 9.89 49.02 41.93 38.60 0 0 0 0 0 0 0 0 0 0 0 0
1009 2006OCT17 425.3 15.27 89.69 79 78.95 0 0 0 0 0 0 0 0 0 0 0 0
1010 2006OCT17 0 0 0 0 0.00 0 0 0 0 25 4.07 1.89 1.17 0 0 0 0
1011 2006OCT19 50 1.59 6.05 5.04 5.04 0 0 0 0 0 0 0 0 0 0 0 0
1012 2006OCT21 50 1.67 5.7 4.64 4.64 0 0 0 0 0 0 0 0 25 1.08 0.67 0.4
1013 2006OCT20 350.2 19.7 130.67 119.78 108.57 0 0 0 0 0 0 0 0 0 0 0 0
1014 2006OCT30 0 0 0 0 0.00 0 0 0 0 0 0 0 0 0 0 0 0
1015 2006OCT22 50 2.25 10.95 9.65 9.64 0 0 0 0 0 0 0 0 0 0 0 0
1016 2006OCT17 25 0.64 2.89 2.34 2.34 0 0 0 0 0 0 0 0 0 0 0 0
1017 2006OCT18 375.3 18.59 115.24 104.07 102.62 0 0 0 0 0 0 0 0 0 0 0 0
1018 2006OCT17 150.1 6.79 31.91 28.05 26.83 0 0 0 0 0 0 0 0 0 0 0 0
1019 2006OCT20 0 0 0 0 0.00 0 0 0 0 0 0 0 0 0 0 0 0
1020 2006OCT18 125.1 4.22 12.84 10.2 5.96 0 0 0 0 0 0 0 0 0 0 0 0
1021 2006OCT21 200.1 9.93 51.81 46.08 45.43 0 0 0 0 25 4.41 1.96 1.21 0 0 0 0
1022 2006OCT21 25 0.7 2.05 1.58 1.58 0 0 0 0 0 0 0 0 0 0 0 0
1023 2006OCT20 175.1 5.79 18.54 14.85 14.84 0 0 0 0 0 0 0 0 0 0 0 0
1024 2006OCT19 250.2 9.66 42.77 37.04 27.13 0 0 0 0 0 0 0 0 0 0 0 0

TFL 52 CMI Plot Analysis April 2007
Page 21
Plot
No.
Measurement
Date
4.0 cm+ 12.5 cm+ 17.5cm+
Stems
Basal
Area
Tot
Vol.
Merch
Vol.
% live-
>dead Stems
Basal
Area Tot Vol.
Merch
Vol. Stems
Basal
Area Tot Vol.
Merch
Vol.
1001 2006OCT21 100 0.13 0.3 0 100 0 0 0 0 0 0 0 0
1002 2006OCT22 125 0.4 1.57 0.35 100 0 0 0 0 0 0 0 0
1003 2006OCT01 0 0 0 0 100 0 0 0 0 0 0 0 0
1004 2006OCT16 50 0.49 1.13 0.17 100 0 0 0 0 0 0 0 0
1005 2006OCT19 0 0 0 0 100 0 0 0 0 0 0 0 0
1006 2006OCT20 75.1 0.8 4.76 1.58 79 0 0 0 0 0 0 0 0
1007 2006OCT16 25 1.83 12.67 11.77 100 25 1.83 12.67 11.77 25 1.83 12.67 11.77
1008 2006OCT24 0 0 0 0 100 0 0 0 0 0 0 0 0
1009 2006OCT17 0 0 0 0 100 0 0 0 0 0 0 0 0
1010 2006OCT17 0 0 0 0 100 0 0 0 0 0 0 0 0
1011 2006OCT19 0 0 0 0 100 0 0 0 0 0 0 0 0
1012 2006OCT21 250.2 9.73 64 56.6 75 200.1 9.34 62.81 56.53 175.1 9.02 61.31 55.7
1013 2006OCT20 325.1 3.34 10.64 5.54 100 75.1 2.03 6.67 5.04 50 1.51 4.78 3.72
1014 2006OCT30 0 0 0 0 100 0 0 0 0 0 0 0 0
1015 2006OCT22 0 0 0 0 0 0 0 0 0 0 0 0 0
1016 2006OCT17 25 0.22 0.6 0.02 100 0 0 0 0 0 0 0 0
1017 2006OCT18 0 0 0 0 100 0 0 0 0 0 0 0 0
1018 2006OCT17 0 0 0 0 100 0 0 0 0 0 0 0 0
1019 2006OCT20 0 0 0 0 100 0 0 0 0 0 0 0 0
1020 2006OCT18 50 0.81 1.78 0.9 100 25 0.59 1.32 0.9 0 0 0 0
1021 2006OCT21 0 0 0 0 100 0 0 0 0 0 0 0 0
1022 2006OCT21 125 0.43 0.97 0 100 0 0 0 0 0 0 0 0
1023 2006OCT20 0 0 0 0 100 0 0 0 0 0 0 0 0
1024 2006OCT19 75.1 1.32 4.79 3.31 100 25 0.87 3.81 3.26 25 0.87 3.81 3.26
Down at second measurement (tree not recorded at second measurement).
TFL 52 CMI Plot Analysis April 2007
Page 22
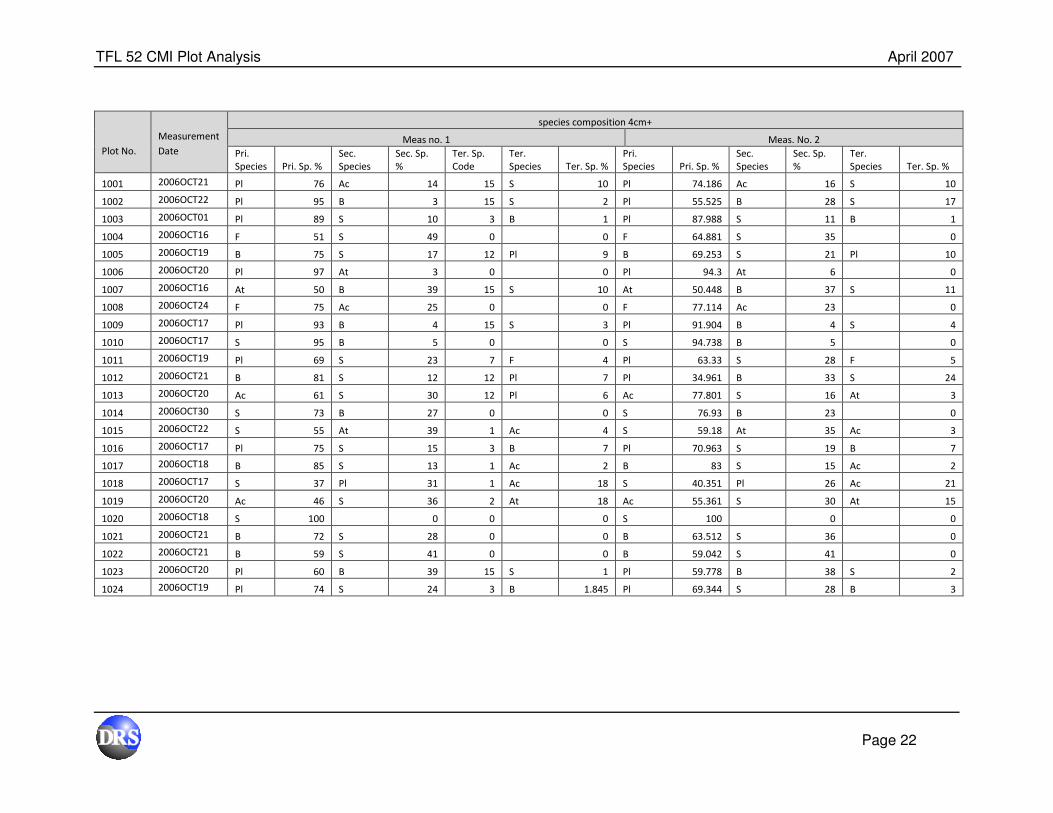
Plot No.
Measurement
Date
species composition 4cm+
Meas no. 1 Meas. No. 2
Pri.
Species Pri. Sp. %
Sec.
Species
Sec. Sp.
%
Ter. Sp.
Code
Ter.
Species Ter. Sp. %
Pri.
Species Pri. Sp. %
Sec.
Species
Sec. Sp.
%
Ter.
Species Ter. Sp. %
1001 2006OCT21 Pl 76 Ac 14 15 S 10 Pl 74.186 Ac 16 S 10
1002 2006OCT22 Pl 95 B 3 15 S 2 Pl 55.525 B 28 S 17
1003 2006OCT01 Pl 89 S 10 3 B 1 Pl 87.988 S 11 B 1
1004 2006OCT16 F 51 S 49 0 0 F 64.881 S 35 0
1005 2006OCT19 B 75 S 17 12 Pl 9 B 69.253 S 21 Pl 10
1006 2006OCT20 Pl 97 At 3 0 0 Pl 94.3 At 6 0
1007 2006OCT16 At 50 B 39 15 S 10 At 50.448 B 37 S 11
1008 2006OCT24 F 75 Ac 25 0 0 F 77.114 Ac 23 0
1009 2006OCT17 Pl 93 B 4 15 S 3 Pl 91.904 B 4 S 4
1010 2006OCT17 S 95 B 5 0 0 S 94.738 B 5 0
1011 2006OCT19 Pl 69 S 23 7 F 4 Pl 63.33 S 28 F 5
1012 2006OCT21 B 81 S 12 12 Pl 7 Pl 34.961 B 33 S 24
1013 2006OCT20 Ac 61 S 30 12 Pl 6 Ac 77.801 S 16 At 3
1014 2006OCT30 S 73 B 27 0 0 S 76.93 B 23 0
1015 2006OCT22 S 55 At 39 1 Ac 4 S 59.18 At 35 Ac 3
1016 2006OCT17 Pl 75 S 15 3 B 7 Pl 70.963 S 19 B 7
1017 2006OCT18 B 85 S 13 1 Ac 2 B 83 S 15 Ac 2
1018 2006OCT17 S 37 Pl 31 1 Ac 18 S 40.351 Pl 26 Ac 21
1019 2006OCT20 Ac 46 S 36 2 At 18 Ac 55.361 S 30 At 15
1020 2006OCT18 S 100 0 0 0 S 100 0 0
1021 2006OCT21 B 72 S 28 0 0 B 63.512 S 36 0
1022 2006OCT21 B 59 S 41 0 0 B 59.042 S 41 0
1023 2006OCT20 Pl 60 B 39 15 S 1 Pl 59.778 B 38 S 2
1024 2006OCT19 Pl 74 S 24 3 B 1.845 Pl 69.344 S 28 B 3
TFL 52 CMI Plot Analysis April 2007
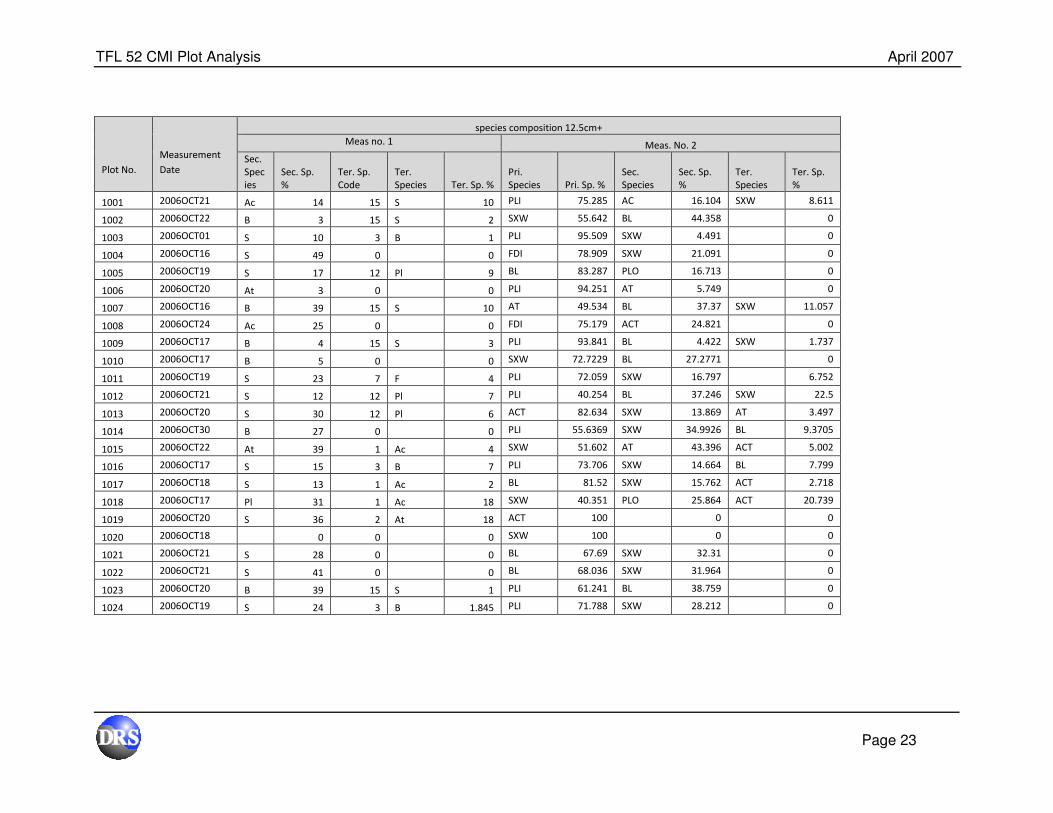
Page 23
Plot No.
Measurement
Date
species composition 12.5cm+
Meas no. 1 Meas. No. 2
Sec.
Spec
ies
Sec. Sp.
%
Ter. Sp.
Code
Ter.
Species Ter. Sp. %
Pri.
Species Pri. Sp. %
Sec.
Species
Sec. Sp.
%
Ter.
Species
Ter. Sp.
%
1001 2006OCT21 Ac 14 15 S 10 PLI 75.285 AC 16.104 SXW 8.611
1002 2006OCT22 B 3 15 S 2 SXW 55.642 BL 44.358 0
1003 2006OCT01 S 10 3 B 1 PLI 95.509 SXW 4.491 0
1004 2006OCT16 S 49 0 0 FDI 78.909 SXW 21.091 0
1005 2006OCT19 S 17 12 Pl 9 BL 83.287 PLO 16.713 0
1006 2006OCT20 At 3 0 0 PLI 94.251 AT 5.749 0
1007 2006OCT16 B 39 15 S 10 AT 49.534 BL 37.37 SXW 11.057
1008 2006OCT24 Ac 25 0 0 FDI 75.179 ACT 24.821 0
1009 2006OCT17 B 4 15 S 3 PLI 93.841 BL 4.422 SXW 1.737
1010 2006OCT17 B 5 0 0 SXW 72.7229 BL 27.2771 0
1011 2006OCT19 S 23 7 F 4 PLI 72.059 SXW 16.797 6.752
1012 2006OCT21 S 12 12 Pl 7 PLI 40.254 BL 37.246 SXW 22.5
1013 2006OCT20 S 30 12 Pl 6 ACT 82.634 SXW 13.869 AT 3.497
1014 2006OCT30 B 27 0 0 PLI 55.6369 SXW 34.9926 BL 9.3705
1015 2006OCT22 At 39 1 Ac 4 SXW 51.602 AT 43.396 ACT 5.002
1016 2006OCT17 S 15 3 B 7 PLI 73.706 SXW 14.664 BL 7.799
1017 2006OCT18 S 13 1 Ac 2 BL 81.52 SXW 15.762 ACT 2.718
1018 2006OCT17 Pl 31 1 Ac 18 SXW 40.351 PLO 25.864 ACT 20.739
1019 2006OCT20 S 36 2 At 18 ACT 100 0 0
1020 2006OCT18 0 0 0 SXW 100 0 0
1021 2006OCT21 S 28 0 0 BL 67.69 SXW 32.31 0
1022 2006OCT21 S 41 0 0 BL 68.036 SXW 31.964 0
1023 2006OCT20 B 39 15 S 1 PLI 61.241 BL 38.759 0
1024 2006OCT19 S 24 3 B 1.845 PLI 71.788 SXW 28.212 0
TFL 52 CMI Plot Analysis April 2007
Page 24
Plot
No.
Measurement
Date
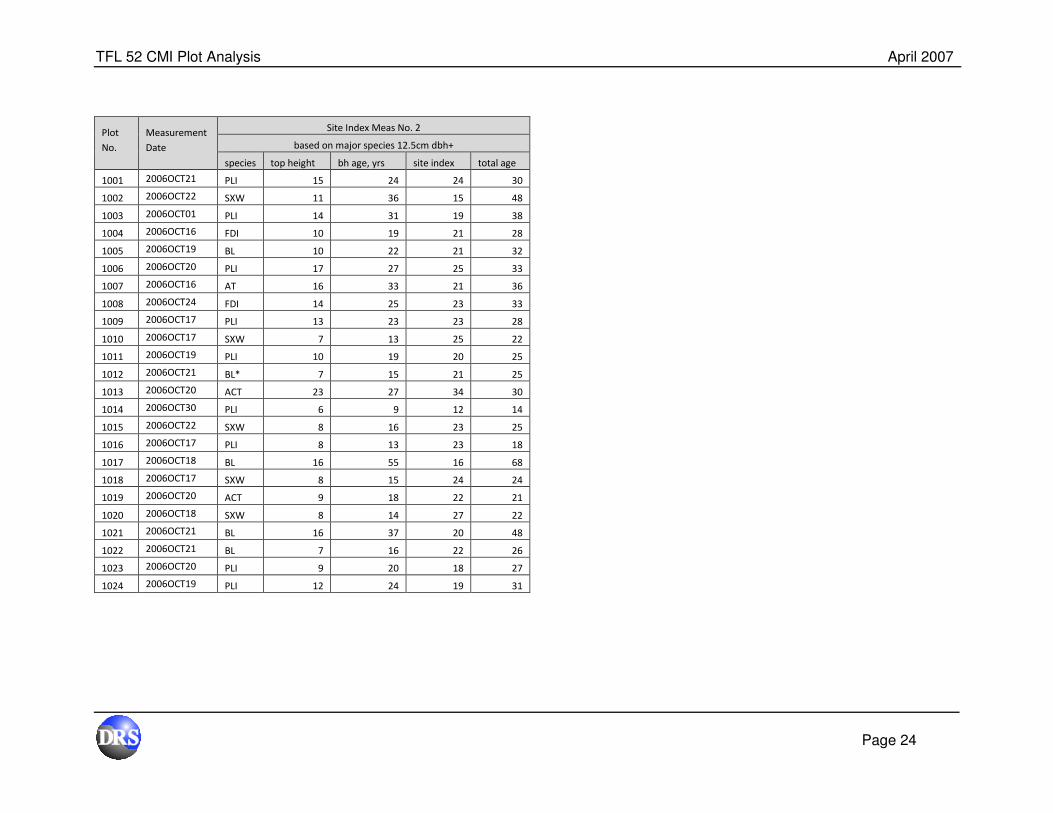
Site Index Meas No. 2
based on major species 12.5cm dbh+
species top height bh age, yrs site index total age
1001 2006OCT21 PLI 15 24 24 30
1002 2006OCT22 SXW 11 36 15 48
1003 2006OCT01 PLI 14 31 19 38
1004 2006OCT16 FDI 10 19 21 28
1005 2006OCT19 BL 10 22 21 32
1006 2006OCT20 PLI 17 27 25 33
1007 2006OCT16 AT 16 33 21 36
1008 2006OCT24 FDI 14 25 23 33
1009 2006OCT17 PLI 13 23 23 28
1010 2006OCT17 SXW 7 13 25 22
1011 2006OCT19 PLI 10 19 20 25
1012 2006OCT21 BL* 7 15 21 25
1013 2006OCT20 ACT 23 27 34 30
1014 2006OCT30 PLI 6 9 12 14
1015 2006OCT22 SXW 8 16 23 25
1016 2006OCT17 PLI 8 13 23 18
1017 2006OCT18 BL 16 55 16 68
1018 2006OCT17 SXW 8 15 24 24
1019 2006OCT20 ACT 9 18 22 21
1020 2006OCT18 SXW 8 14 27 22
1021 2006OCT21 BL 16 37 20 48
1022 2006OCT21 BL 7 16 22 26
1023 2006OCT20 PLI 9 20 18 27
1024 2006OCT19 PLI 12 24 19 31
TFL 52 CMI Plot Analysis April 2007
Page 25
Plot
No.
Measurement
Date
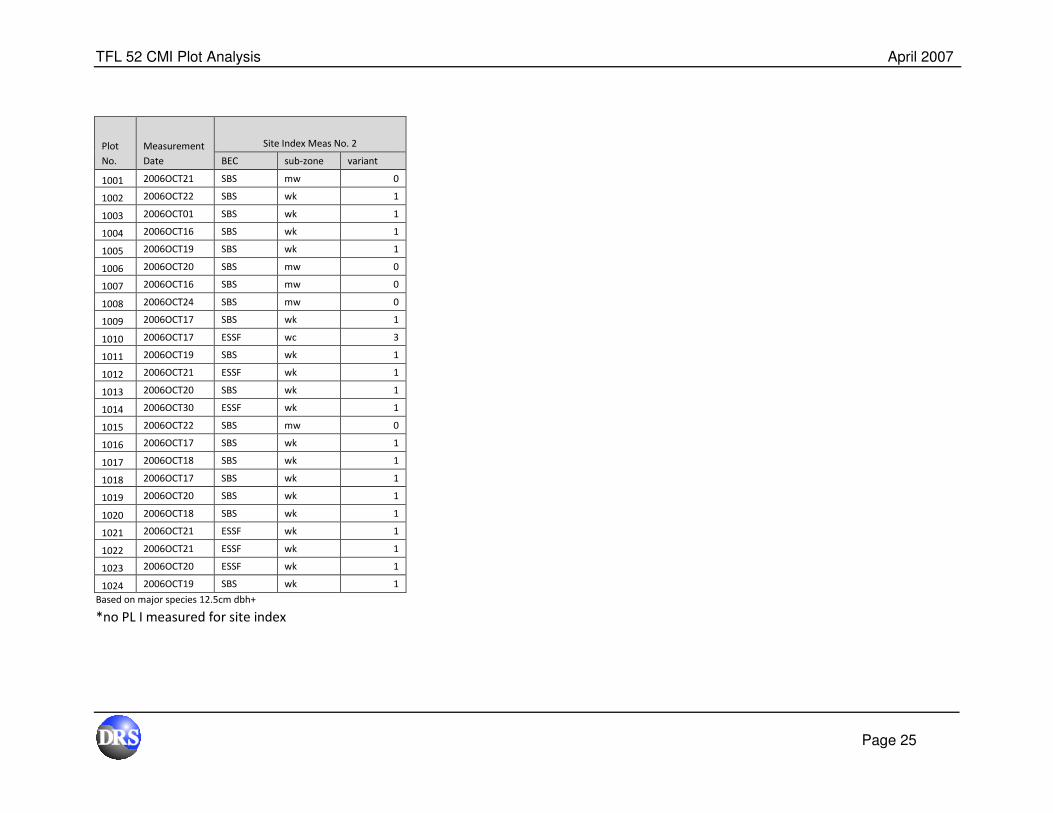
Site Index Meas No. 2
BEC sub-zone variant
1001 2006OCT21 SBS mw 0
1002 2006OCT22 SBS wk 1
1003 2006OCT01 SBS wk 1
1004 2006OCT16 SBS wk 1
1005 2006OCT19 SBS wk 1
1006 2006OCT20 SBS mw 0
1007 2006OCT16 SBS mw 0
1008 2006OCT24 SBS mw 0
1009 2006OCT17 SBS wk 1
1010 2006OCT17 ESSF wc 3
1011 2006OCT19 SBS wk 1
1012 2006OCT21 ESSF wk 1
1013 2006OCT20 SBS wk 1
1014 2006OCT30 ESSF wk 1
1015 2006OCT22 SBS mw 0
1016 2006OCT17 SBS wk 1
1017 2006OCT18 SBS wk 1
1018 2006OCT17 SBS wk 1
1019 2006OCT20 SBS wk 1
1020 2006OCT18 SBS wk 1
1021 2006OCT21 ESSF wk 1
1022 2006OCT21 ESSF wk 1
1023 2006OCT20 ESSF wk 1
1024 2006OCT19 SBS wk 1
Based on major species 12.5cm dbh+
*no PL I measured for site index

TFL 52 CMI Plot Analysis April 2007
Page 26
Appendix 3 Issues encountered while checking the CMI data for TFL 52.
WHILE CHECKING THE CMI DATA I FOUND A NUMBER OF DISCREPANCIES BETWEEN THE PREVIOUS AND CURRENT MEASUREMENTS. SOME OF THE COMMON DIFFERENCES ENCOUNTERED ARE:
• DBH MEASUREMENT IN 2006 SMALLER THAN 2001
• HEIGHTS IN 2006 SMALLER THAN 2001
• TREES THAT DO NOT EXIST IN DATA SET IN 2006 BUT ARE PRESENT IN 2001
• SPECIES CHANGE FROM 2001 TO 2006
• MISSING OR INVALID GRADES FOR SIZE OF STEMS.
• LOSS INDICATORS THAT EXISTED IN 2001 WITH NET FACTORING HAVE BEEN REMOVED IN SOME CASES IN 2006.
SOME OF THESE DIFFERENCES COULD NOT BE CORRECTED AS THERE WAS NOT ANYWAY OF KNOWING WHICH WAS THE CORRECT DATA (SUCH AS DBH OR HEIGHT, ETC) IN THE OFFICE. I THINK A LOT OF THE DIFFERENCES AND INCOMPLETE DATA COULD HAVE BEEN TAKEN CARE OF WITH A COUPLE OF CHANGES TO THE DATA ENTRY PROGRAM.
• USING A HANDHELD VERSION OF GY HOST (GROWTH AND YIELD) WITH A COUPLE OF MODIFICATIONS, OR MODIFYING TIMVEG TO ACCEPT OTHER DATA AND EDITS / VALIDATIONS SIMILAR TO THE GROWTH AND YIELD PROGRAM. ASSUMING THAT THE CMI DATA CAN BE INCORPORATED INTO THE GY HOST \ HAND PROGRAM MOST OF THESE EDITS \ VALIDATIONS, ALREADY EXIST. OR THE TIMVEG PROGRAM COULD BE ALTERED TO FUNCTION IN A SIMILAR WAY.
HAVING THE PROGRAM ABLE TO ACCOMMODATE THE PREVIOUS MEASUREMENTS LOADED INTO IT SO DIFFERENCES CAN BE CONFIRMED ON VALIDATIONS SIMILAR TO THE GROWTH AND YIELD PROGRAM. THIS WOULD ALLOW YOU TO CONFIRM DIFFERENCES AND DATA IS CORRECT IN THE FIELD RATHER THAN BACK AT THE OFFICE WHERE YOU CANNOT SEE THE TREE.
WHEN A DBH MEASUREMENT OR HEIGHT IS SMALLER THAN THE PREVIOUS MEASURE THE HANDHELD PROGRAM WILL BEEP TO WARN YOU, AND YOU CAN VERIFY THE DATA WHILE ON SITE AND PLACE A COMMENT LIKE DBH CHECK (CANNED NOTES) SO THAT AN OFFICE CHECK WOULD KNOW WHICH DATA IS CORRECT.

TFL 52 CMI Plot Analysis April 2007
Page 27
SIMILAR TO ABOVE VALIDATIONS COULD BE USED FOR SPECIES CHANGES, PATH CHANGES OR MISSING LOSS INDICATORS, DAMAGE AGENTS AND MISSING OR INVALID GRADES (SIMILAR TO SOME OF THE CRUISE PROGRAMS AVAILABLE), IF THE HEIGHT IS SHORTER THAN PREVIOUS, IS THERE A BROKEN TOP? EXCESSIVE NET FACTOR DIFFERENCES COULD PROMPT YOU TO VERIFY CORRECT.
BY HAVING THESE VALIDATIONS IN THE FIELD, IT WOULD HELP TO DRASTICALLY REDUCE KEYPUNCHING ERRORS.
• THERE WERE SOME TREES MISSING FROM THE CURRENT DATA SET THAT ARE ASSUMED TO HAVE DIED AND FALLEN SINCE PREVIOUS MEASUREMENT, BECAUSE OF THIS THERE ARE NO INDICATIONS WHETHER THE TREE WAS MISSED OR IS DEAD AND FALLEN. WITH THE PREVIOUS DATA IN THE HANDHELD, A NOTE COULD BE PLACED FROM A CANNED LIST, (SUCH AS TREE IS NOW DEAD AND FALLEN) THAT WOULD ALLOW QUICK AND EASY VERIFICATION, THAT THE VALIDATION WARNING HAD BEEN RECOGNIZED (THESE COULD ALL BE CANNED NOTES, BUT THE AVAILABILITY TO TYPE IN YOUR OWN COMMENTS FOR SOME CIRCUMSTANCES WOULD ALSO BE HELPFUL).

TFL 52 CMI Plot Analysis April 2007
Page 28
Appendix 4 Analysis of possible residual or veteran trees.
0 50 100 150
age, years
0
10
20
30
t op
he
igt,
m
Figure 9: All site trees for the 24 plots (309 trees) showing that some residual (veteran) trees may have been selected. Total age is derived from breast height age and a correction factor.
TFL 52 CMI Plot Analysis April 2007
Page 29
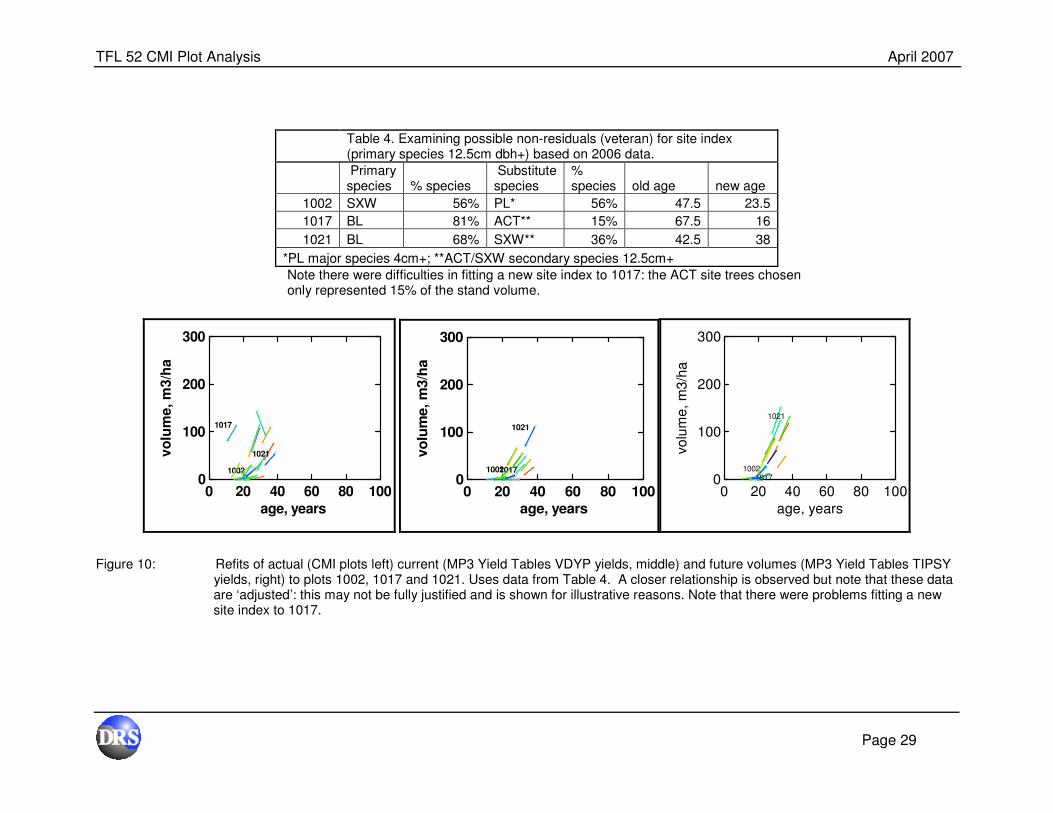
Table 4. Examining possible non-residuals (veteran) for site index (primary species 12.5cm dbh+) based on 2006 data.
Primary species % species
Substitute species
% species old age new age
1002 SXW 56% PL* 56% 47.5 23.5
1017 BL 81% ACT** 15% 67.5 16
1021 BL 68% SXW** 36% 42.5 38
*PL major species 4cm+; **ACT/SXW secondary species 12.5cm+
Note there were difficulties in fitting a new site index to 1017: the ACT site trees chosen only represented 15% of the stand volume.
0 20 40 60 80 100
age, years
0
100
200
300
vo
lum
e,
m3
/ha
1002
1017
1021
0 20 40 60 80 100
age, years
0
100
200
300
vo
lum
e, m
3/h
a
10021017
1021
0 20 40 60 80 100
age, years
0
100
200
300
vo
lum
e,
m3
/ha
10021017
1021
Figure 10: Refits of actual (CMI plots left) current (MP3 Yield Tables VDYP yields, middle) and future volumes (MP3 Yield Tables TIPSY yields, right) to plots 1002, 1017 and 1021. Uses data from Table 4. A closer relationship is observed but note that these data are ‘adjusted’: this may not be fully justified and is shown for illustrative reasons. Note that there were problems fitting a new site index to 1017.