tfcrs final all - unep · april 2002 teap task forces report i unep april 2002 report of the...
TRANSCRIPT

MONTREAL PROTOCOL
ON SUBSTANCES THAT DEPLETE
THE OZONE LAYER
UNEPREPORT OF THE
TECHNOLOGY AND ECONOMIC ASSESSMENT PANEL
APRIL 2002
VOLUME 3A
REPORT OF THETASK FORCE ON COLLECTION, RECOVERY AND STORAGE


April 2002 TEAP Task Forces Report i
UNEPAPRIL 2002 REPORT OF THE
TECHNOLOGY AND ECONOMIC
ASSESSMENT PANEL
VOLUME 3A
REPORT OF THE TASK FORCE ON
COLLECTION, RECOVERY AND STORAGE

April 2002 TEAP Task Forces Report ii
Montreal ProtocolOn Substances that Deplete the Ozone Layer
Report of theUNEP Technology and Economic Assessment Panel
April 2002
VOLUME 3A
REPORT OF THE TASK FORCE ON COLLECTION, RECOVERY AND STORAGE
The text of this report is composed in Times New Roman.
Co-ordination: TEAP and its Task Force on Collection,Recovery and Storage
Composition of the report: Walter BrunnerJose PonsStephen O. Andersen
Layout: Walter Brunner, envico. Zurich
Reproduction: UNON Nairobi
Date: June 2002
Under certain conditions, printed copies of this report are available from:
UNITED NATIONS ENVIRONMENT PROGRAMMEOzone Secretariat, P.O. Box 30552, Nairobi, Kenya
Normally from SMI Distribution Service Ltd., Stevenage, Hertfordshire, UKfax: + 44 1438 748844
This document is also available in portable document format from
http://www.teap.org
No copyright involved. This publication may be freely copied, abstracted andcited, with acknowledgement of the source of the material.
ISBN: 92-807-2229-8

April 2002 TEAP Task Forces Report iii
UNEPAPRIL 2002 REPORT OF THE
TECHNOLOGY AND ECONOMIC
ASSESSMENT PANEL
VOLUME 3A
REPORT OF THE TASK FORCE ON
COLLECTION, RECOVERY AND STORAGE

iv April 2002 TEAP Task Forces Report
Disclaimer
The United Nations Environment Programme (UNEP), the Technology andEconomic Assessment Panel (TEAP) Co-chairs and members, the TEAP TaskForces Co-chairs and members, and the companies and organisations that employthem do not endorse the performance, worker safety, or environmentalacceptability of any of the technical options discussed. Every industrial operationrequires consideration of worker safety and proper disposal of contaminants andwaste products. Moreover, as work continues - including additional toxicityevaluation - more information on health, environmental and safety effects ofalternatives and replacements will become available for use in selecting among theoptions discussed in this document.
UNEP, the TEAP Co-chairs and members, and the Technology and EconomicAssessment Panel Task Forces Co-chairs and members, in furnishing or distributingthis information, do not make any warranty or representation, either express orimplied, with respect to the accuracy, completeness, or utility; nor do they assumeany liability of any kind whatsoever resulting from the use or reliance upon anyinformation, material, or procedure contained herein, including but not limited toany claims regarding health, safety, environmental effect or fate, efficacy, orperformance, made by the source of information.
Mention of any company, association, or product in this document is forinformation purposes only and does not constitute a recommendation of any suchcompany, association, or product, either express or implied by UNEP, theTechnology and Economic Assessment Panel Co-chairs or members, the TEAPTask Forces Co-chairs or members or the companies or organisations that employthem.
Acknowledgement
The Task Forces Co-chairs and members acknowledges with thanks the outstandingcontributions from all of the individuals and organisations who provided support toCo-chairs and members. The opinions expressed are those of the Task Forces anddo not necessarily reflect the reviews of any sponsoring or supporting organisation.The TEAP thanks GTZ, Eschborn, Germany, and the US EPA, Washington D.C.,for hosting the meetings, where this report was discussed, and composed.
The TEAP thanks the Hungarian Ministry for Environment for hosting the TEAPmeeting in Budapest, Hungary, where this report was reviewed, and finalised.

April 2002 TEAP Task Forces Report 1
Foreword
The April 2002 TEAP Report
The April 2002 TEAP Report consists of three volumes:
Volume 1: April 2002 TEAP Progress Report
Volume 2: April 2002 TEAP Replenishment Task Force Report
Volume 3: April 2002 TEAP Task Force on Collection, Reclamation andStorage Report, together with the
April 2002 TEAP Task Force on Destruction Technologies Report
Volume 1
Volume 1 contains an Executive Summary of all TEAP Report topics, as well asthe Executive Summaries of Volumes 2 and 3.
Volume 1 contains
� An accounting framework for ODS production, consumption and emissions(being developed in co-ordination with the SAP);
� recommendations for essential use nominations;� an update on laboratory and analytical uses (as requested in Decisions XI/13,
X/19);� a chapter on Campaign Production for MDIs (as requested in Decision
XIII/10);� the annual update on nPB production, use and emissions (as requested in
Decision XIII/7);� additional reports on process agent uses (as requested in Decisions X/14 and
XIII/13).
Volume 1 also contains progress reports of TEAP Technical Options Committees(according to Decision VII/34). Finally, it presents an update on TEAP�s changingmembership and gives background and contact information for TEAP and TOCmembers (Decision VII/34).
Volume 2
Volume 2 is the Assessment Report of the TEAP Replenishment Task Force of theFunding Requirement for the Replenishment of the Multilateral Fund during 2003-2005, in response to Decision XIII/1.
Volume 3
Volume 3 includes reports of the Task Force on Destruction Technologies (TFDT)and the Task Force on Collection, Reclamation and Storage (TFCRS), in responseto Decision XII/8.

2 April 2002 TEAP Task Forces Report
April 2002
The UNEP Technology and Economic Assessment Panel (including its alternatesTamás Lotz and Masaaki Yamabe):
Stephen O. Andersen, co-chair USA Mohinder Malik DSuely M. Carvalho, co-chair BRA Nahum Marban Mendoza MEXLambert Kuijpers, co-chair NL Thomas Morehouse USA
Jose Pons Pons VENRadhey Agarwal IND Miguel Quintero COLPaul Ashford UK K. Madhava Sarma INDJonathan Banks AUS Sateeaved Seebaluck MAUWalter Brunner CH Gary Taylor CDNJorge Corona MEX Helen Tope AUSLászló Dobó H Robert van Slooten UKYuichi Fujimoto J Ashley Woodcock UKBarbara Kucnerowicz-Polak PL Masaaki Yamabe JTamás Lotz H Shiqiu Zhang PRC
The TEAP Task Force on Collection, Recovery, and Storage:
Stephen O. Andersen, co-chair USA Mike Jeffs BWalter Brunne, co-chairr CH Brian Hobsbawn AUSJose Pons Pons, co-chair VEN Robert Chin-Hsing Huang CDN
Lambert Kuijpers NLPaul Ashford UK Ronald Sibley USAD.D. Arora IND Stephan Sicars GMr. Teruo Fukada J Hiroshi Tsujita JLászló Gaal H Paulo Vodianitskaia BRAZ

April 2002 Task Force on Collection, Recovery, and Storage Report 3
UNEPAPRIL 2002 REPORT OF THE
TECHNOLOGY AND ECONOMIC ASSESSMENT PANEL
VOLUME 3A
REPORT OF THE TASK FORCE ON
COLLECTION, RECOVERY AND STORAGE
Table of Contents Page
FOREWORD.........................................................................................1
EXECUTIVE SUMMARY.......................................................................7
1 INTRODUCTION ................................................................................ 111.1 DECISION XII/8 ...................................................................................... 111.2 SCOPE OF WORK..................................................................................... 121.3 MEANING OF TERMS USED IN THE REPORT................................................... 131.4 DESCRIPTION OF CHAPTERS....................................................................... 14
2 REFRIGERATION .............................................................................. 152.1 INTRODUCTION ...................................................................................... 152.2 BANK OF CFCS IN THE REFRIGERATION SECTOR............................................ 162.3 ODS FLOW IN THE REFRIGERATION SECTOR ................................................. 18
2.3.1 Equipment Manufacturing........................................................................ 182.3.2 Service and Maintenance.......................................................................... 21
2.4 POTENTIAL FOR DESTRUCTION OF ODS FROM THE REFRIGERATION SECTOR ...... 232.4.1 Regional Patterns................................................................................... 232.4.2 Sector Distribution................................................................................. 24
2.5 MOBILE AIR CONDITIONING..................................................................... 262.6 RECOVERY AND RECYCLING IN ARTICLE 5 AND COUNTRIES AND
COUNTRIES WITH ECONOMIES IN TRANSITION.............................................. 28
3 FOAMS............................................................................................... 333.1 USE OF OZONE DEPLETING SUBSTANCES IN FOAMS ....................................... 33
3.1.1 Polyurethane Elastomers ......................................................................... 343.1.2 Flexible Foams ...................................................................................... 343.1.3 Rigid Foams.......................................................................................... 35
3.2 BASELINE EMISSIONS ESTIMATES FROM FOAMS.............................................. 363.3 OPTIONS AT END OF DESIGN LIFE............................................................... 40
3.3.1 Abandonment......................................................................................... 423.3.2 Secondary Use ....................................................................................... 433.3.3 Landfill ................................................................................................ 443.3.4 Direct Incineration (with energy recovery)................................................... 453.3.5 Component Recovery and Recycling/Destruction........................................... 47
3.4 MAXIMISING PREVENTION OF EMISSIONS.................................................... 483.5 FORECAST MATERIAL FLOWS ................................................................... 523.6 CONCLUSIONS........................................................................................ 54

4 April 2002 TEAP Task Forces Report
4 HALONS............................................................................................. 574.1 INTRODUCTION ...................................................................................... 574.2 USE PATTERNS AND HALON MANAGEMENT................................................. 57
4.2.1 Canada: ............................................................................................... 584.2.2 USA..................................................................................................... 584.2.3 Australia .............................................................................................. 594.2.4 Switzerland........................................................................................... 594.2.5 European Union..................................................................................... 59
4.3 LIFE CYCLE FOR HALON SYSTEMS.............................................................. 594.4 COLLECTION ......................................................................................... 60
4.4.1 Fixed halon installations (halon 1301)....................................................... 604.4.2 Portable fire extinguishers(Halon 1211) ..................................................... 61
4.5 RECOVERY AND RECLAMATION ................................................................ 624.5.1 Halon 1301from fixed Systems.................................................................. 624.5.2 Halon 1211 from portable extinguishers..................................................... 62
4.6 STORAGE.............................................................................................. 624.7 HALON INVENTORIES .............................................................................. 63
5 AEROSOLS AND MDIS....................................................................... 655.1 NON MDI AEROSOLS............................................................................... 655.2 MDIS: INTRODUCTORY NOTES.................................................................. 655.3 SUPPLY OF PHARMACEUTICAL- GRADE CFCS ............................................... 655.4 STORAGE REQUIREMENTS......................................................................... 665.5 RECOMMENDATIONS............................................................................... 665.6 EXPERIENCE WITH LONG TERM STORAGE..................................................... 675.7 DISPOSAL OF UNUSED MDIS ..................................................................... 68
6 SOLVENTS......................................................................................... 696.1 INTRODUCTION ...................................................................................... 696.2 THE RECOVERY AND COLLECTION OF USED SOLVENTS.................................. 696.3 THE DESTRUCTION OF USED SOLVENTS....................................................... 706.4 THE RECYCLING OF USED SOLVENTS.......................................................... 70
6.4.1 Azeotropic blends................................................................................... 716.4.2 Zeotropic blends .................................................................................... 716.4.3 Purity of the distillate ............................................................................. 71
6.5 CHOICE OF EXTERNAL RECYCLER.............................................................. 726.6 MAJOR SUB-SECTORS............................................................................... 72
6.6.1 Electronics defluxing............................................................................... 726.6.2 Precision cleaning.................................................................................. 736.6.3 Metal cleaning....................................................................................... 736.6.4 Dry cleaning.......................................................................................... 736.6.5 Adhesives and coatings............................................................................ 736.6.6 Oxygen systems and heat exchangers.......................................................... 746.6.7 Aerosol spraying of solvents..................................................................... 74
7 METHYL BROMIDE........................................................................... 757.1 GENERAL SCOPE OF USE............................................................................ 757.2 SUPPLY AND STORAGE OF METHYL BROMIDE................................................ 757.3 USE PROCESSES....................................................................................... 76
7.3.1 Manual application to soils ..................................................................... 767.3.2 Mechanised injection to soils.................................................................... 777.3.3 Application to commodities, structures and transport ................................... 77
7.4 ESTIMATES OF QUANTITIES OF METHYL BROMIDE RECOVERABLE AFTER USE ....... 78

April 2002 Task Force on Collection, Recovery, and Storage Report 5
7.5 COLLECTION AND RECLAMATION OF METHYL BROMIDE FOR REUSE................... 807.6 DESTRUCTION TECHNOLOGIES................................................................... 817.7 REFERENCES.......................................................................................... 83
8 TRANSPORTATION REGULATION ................................................... 858.1 DANGEROUS GOODS REGULATION............................................................. 858.2 LABELLING ........................................................................................... 858.3 SHIPPING DOCUMENTS............................................................................. 86
9 THE BASEL CONVENTION ............................................................... 879.1 HISTORY AND BASIC PRINCIPLES ............................................................... 879.2 CONTROL OF ODS UNDER THE BASEL CONVENTION..................................... 879.3 ACTIONS BY THE BASEL SECRETARIAT TO HARMONISE WITH THE
MONTREAL PROTOCOL............................................................................ 88
APPENDIX A: STANDARDS FOR THE RECLAMATION OF BLOWINGAGENTS FROM REFRIGERATOR FOAMS......................................... 91
PURPOSE AND SCOPE ............................................................................................. 91THE BASIC PROCESS .............................................................................................. 91POTENTIAL SOURCES OF EMISSION........................................................................... 92
Foams remaining attached to Metallic Materials...................................................... 92Foams remaining attached to Plastic Materials ....................................................... 93Blowing Agents in Air Exhaust Flows.................................................................... 93Blowing Agents in Waste Water Outputs................................................................. 94Residual blowing agent in the Polyurethane matrix .................................................. 95Fugitive Losses .................................................................................................. 96
OVERALL ASSESSMENT OF LOSSES ............................................................................ 97MONITORING AND REPORTING OF PERFORMANCE ....................................................... 98OTHER SAFETY AND ENVIRONMENTAL CONSIDERATIONS............................................. 99CONCLUSIONS...................................................................................................... 99
APPENDIX B: TASK FORCE MEMBERS ............................................................ 103


April 2002 Task Force on Collection, Recovery, and Storage Report 7
Executive Summary
The TFCRS assessed use patterns, associated emissions and aspects of collectionand storage of ODS from all relevant use sectors. The assessment takes intoaccount the different situations in Article 5(1) Parties, where production takesplace for the Article 5(1) Parties (under �Basic Domestic Needs�), and in non-Article 5(1) Parties, where ODS production is still continuing.
This TFCRS Report also presents an overview of ODS inventories and theirmanagement in the different sectors and provides first estimates of historic andactual emission patterns from the different use sectors.
Types of Emission
ODS can be emitted at various stages in the lifecycle of production, distribution,use, and disposal. Emission estimates for any given year need to account for earlyemissions of recently �consumed� ODS as well as delayed emissions of historicallyused ODS. This means that there are emissions from both developed and deve-loping countries for many years after the phase-out of ODS production.
This Report splits the use sectors into those with early emissions and thoseprimarily with delayed emissions. Where it concerns early emissions, the focus ison non-Article 5(1) Parties essential uses and on current and/or recent use in Article5(1) Parties. Meanwhile, where it relates to delayed emissions the focus is oninventories of ODS originating from sustained non-Article 5(1) portfolios and theincreasing inventories present in the same applications in Article 5(1) Parties.
Uses with early emissions include solvents, aerosol products including MDIs,methyl bromide, and flexible foams. Delayed emissions are found in refrigerationand air conditioning equipment, rigid foams, and halon equipment.
For self-evident reasons, the main focus of interest under any review of collection,recovery and storage issues is on those applications that lead to delayed emissionsand that are therefore characterised by considerable ODS inventories.
Technical feasibility of Collection, Recovery & Storage
It is technically feasible to collect and recover all forms of ODS retained ininventories characterised by delayed emissions. In some cases (e.g. refrigerationand halon equipment) the ODS is already contained in readily accessible containers.In the case of other applications, the ODS can be in locations which are much moredifficult to access (e.g. cavity wall rigid foam insulation).

8 April 2002 Task Force on Collection, Recovery, and Storage Report
For many rigid foams including those contained in refrigerators, the recovery anddestruction steps can be combined and the decision may be made that it is morecost-effective to directly incinerate a product containing the ODS than to extractthe ODS for subsequent destruction.
Methyl bromide used as a post harvest, structural or transport fumigation (about30% of current methyl bromide uses) offers the broadest potential for collectionand subsequent destruction. The surplus methyl bromide can be adsorbed and thendirectly treated for destruction either chemically or by incineration.
Inventories and Collection Potential
It is known for quite some time that the ODS inventories stored in delayedemission applications are substantial. For certain cases, this assessment has beenable to quantify these amounts. Inevitably, the assessment has involved acombination of �top-down� and �bottom-up� modelling and will be the subject ofcontinuous refinement as more information emerges.
� Between 350,000 and 400,000 ODP-tonnes of CFCs are estimated to becontained in refrigeration equipment in 2002;
� 1.25 million ODP-tonnes of CFC-11 are still remaining in installed foams inyear 2010;
� 450,000 ODP-tonnes of halon 1301 and 330,000 ODP-tonnes of halon 1211are installed in fire fighting equipment in year 2002.
However, it is important to recognise that not all of this material will be accessiblefor collection and recovery, since decommissioning at end-of-life needs to takeplace first. The annual quantities of refrigerants potentially available fordestruction are estimated to be around 9,000 ODP-tonnes. The quantities ofblowing agents expected to be recovered from domestic refrigerators are expected toreach a rate of between 10,000 and 11,000 ODP-tonnes per annum with thecurrently installed recovery capacity. This could be increased by furtherinvestment but is likely to require additional local legislation. Sizeable amounts ofhalon 1211 could be collected for subsequent destruction.
Economic Implications of Collection, Recovery & Storage
This report has not been able to make a detailed assessment of the costs of collec-tion, recovery and storage at the global level, since the range of technical optionsavailable and the cost of local logistics are highly variable.
Economic feasibility is demonstrated by examples of established commercialinfrastructures. These exist in several sectors and in several regions of the world.

April 2002 Task Force on Collection, Recovery, and Storage Report 9
The recovery of blowing agents from refrigerator cabinets costs approximatelyUS$60-100 per kg of CFC-11. The cost equates to approximately US$25-35 pertonne of CO2 equivalent. This is well within the range of investments beingconsidered for CO2 emission abatement in other sectors.
Barriers to Collection, Recovery & Storage
There are many barriers to the application of effective collection, recovery andstorage. Examples of these can be listed as follows:
� Lack of appropriate legislation and infra-structures to ensure end-of-lifedecommissioning;
� Financial resistance where the �polluter� (manufacturer or owner) has to pay;
� Installations of rigid construction foam can be within building structures thatprohibit effective collection;
� Waste transportation management restricts movements within some countriesand internationally.
Conclusions
The collection, recovery and storage of ODS is technically feasible and economi-cally viable. The adoption of such measures depends to a large degree on theregulatory structures, the collection and recovery infrastructures and the way inwhich the financial burden is allocated.
Parties may wish to consider whether there is an over-arching role for the MontrealProtocol in stimulating this area of activity or whether, in fact, regional variations inboth installed inventories and local logistics make action at the regional level moreappropriate.


April 2002 Task Force on Collection, Recovery, and Storage Report 11
1 Introduction
1.1 Decision XII/8
The Twelfth Meeting of the Parties made the following requests to TEAP inDecision XII/8:
(a) To evaluate the technical and economic feasibility for the long-termmanagement of contaminated and surplus ozone-depleting substances inArticle 5 and non-Article 5 countries, including options such as long-termstorage, transport, collection, reclamation and disposal of such ozone-depleting substances;
1. To consider possible linkages to the Basel Convention on the Control ofTransboundary Movements of Hazardous Wastes and Their Disposal andother international treaties as appropriate regarding the issue of disposal;
2. To report to the Parties on these issues at their Fourteenth Meeting in2002.
TEAP recognised that two separate task forces would be needed to cover all theissues covered by Decision XII/8 and set up the Task Force for Collection,Recovery and Storage (TFCRS) to cover these issues in the context of the Decision.TEAP complemented the expertise that was available from members of the TEAPand its TOCs with the inclusion of external experts. A balanced membership wassought from the various sectors and geographic regions. Members of the TFCRSare specialists on refrigerants, foams, halons, aerosols and solvents; their countriesof origin are Australia, Belgium, Brazil, Canada, Denmark, Germany, Hungary,India, Japan, Netherlands, Switzerland, United Kingdom, United States, andVenezuela. A detailed list of members is presented in Annex 1. This reportcomplements the report of the Task Force on Destruction Technologies.
The task forces met in Frankfurt on October 23rd- 24th, 2001 and in Washington onMarch 21st-22nd, 2002. Three experts (Paul Ashford, Lambert Kuijpers and RonaldSibley) worked in both Task Forces to improve co-ordination between them and toavoid duplication effort.
The authors recognise that this work does not completely answer the requestscontained in Decision XII/8. However, it is believed that the report discusses themost important issues raised in the decision.

12 April 2002 Task Force on Collection, Recovery, and Storage Report
1.2 Scope of Work
Production of halons and CFCs was phased out in non-Article 5(1) Parties in 1994and 1996 respectively except for essential domestic uses. Some Parties arecompelling the early decommissioning of equipment that uses ODS. This equip-ment may impose particular logistic requirements to safely recover, store andtransport ODS to an intermediate collection centre and to their destruction facility.In many other Parties, substantial recovery and recycle activities are encouraged tokeep operating the equipment that relies on these substances. These activitiesproduce streams of contaminated ODS unsuitable for reuse which need to bedestroyed. In Article 5(1) Parties recovery and recycling facilities and activities arebeing installed and implemented, preferably under comprehensive managementplans. All these activities might affect the rate at which ODS from insulating foam,halon, and refrigeration and AC equipment are emitted and if not done responsiblycould cause an unnecessary surge in atmospheric emissions.
The TFCRS had to identify and, if possible, quantify the inventories of ODSsusceptible to be collected. Once inventory sizes were defined, it should bepossible to estimate the requirements for destruction capacity. An analysis of usepatterns in the different ODS-sectors reveals two distinctive groups. Firstly thereare the "early-emission-uses" where the ODS are utilised in applications with directemissions. Methyl Bromide, aerosols, MDIs and solvents fall into this category.The common characteristic of these uses is that there are only small to negligibleamounts of surplus or contaminated materials. Recycling is not done nor does itappear to be practical in most cases; collection and disposal of remaining ODS afteruse is relatively simple.
Secondly there are the "late-emissions-uses" in foams, refrigeration and fire protec-tion. Typically, the ODS here are enclosed for either the exploitation of therephysical properties in closed systems (foams and refrigeration) or for their releasein the case of a fire (halons). In some cases, such as in refrigerants these inventoriesare disperse in a great number of machines most of which are operating. In othercases, such as in halons, there has already been a collection effort in some Parties.In the case of foams the ODS may be trapped in appliances, buildings and insulatedequipment whose useful life has ended and whose disposal may be controlled.
The report puts its main emphasis on the latter group where recycling of ODSoccurs and where problems of collection, storage and aspects of contamination haveto be dealt with.
ODS are in general, chemically stable substances, particularly when stored in a purestate. However, when they are recovered they are often contaminated with oils,water or other organic substances. The type and degree of contamination willdetermine whether they can be reused or not. If ODS are stored with these conta-

April 2002 Task Force on Collection, Recovery, and Storage Report 13
minants, chemical reactions may occur which can corrode containers and causeundesired emissions. There is also the possibility that if large amounts of ODS arestored in centralised locations a large undesired emission could occur as the result ofa catastrophic failure or fire.
1.3 Meaning of Terms Used in the Report
Collection encompasses all activities related to bring ODS containing equipment ormaterials back to either destruction facilities or to recovery and/or reclamationfacilities. Here factors from transport safety for transport of pressurised gases topractical aspects of collecting foams from building insulation for example have to beconsidered
Transport will include both collection of equipment which contains ODS fordisassembly at specialised facilities as well as transport of recovered ODS tocentres for storage and/or destruction. In this latter case the ODS may be eithercompressed gases or liquids with low boiling points. Applicable regulations willdepend on whether the substances are considered goods or wastes. In someinstances national and international transport regulations must be taken intoconsideration.
Recovery activities include all action that extract ODS from equipment or materialsand bring it back in liquid or gaseous form. This ranges from adsorption at activatedcharcoal as in the case of Methyl Bromide to decanting of halons from portableextinguishers.
Reclamation is the process of bringing recovered ODS back to original specificationso that the ODS in question can be used again for its originally intended purpose.
Storage of ODS is used in this report both for keeping recovered ODS forsubsequent destruction (either in its application form or gas/liquid forms), and alsofor storage and management of newly produced or reclaimed ODS for later use innew or refilled applications.

14 April 2002 Task Force on Collection, Recovery, and Storage Report
1.4 Description of Chapters
Chapter 1: Introduction refers to Decision XII/8 which based this report andpresents the setting of the Task Force and the Scope of Work
Chapter 2 - 7: Sectorial Descriptions, including a qualitative analysis of the usecharacteristics and specific circumstances for Refrigeration, Foams, Halons,Aerosols and MDIs, Solvents and CTC, and Methyl Bromide. The long termintegrity and suitability of stored ODS is also dealt by sector in these chapters
Chapter 8: Transport and Exports, deals with relevant regulations and logistics.The Task Force unsuccessfully attempted to co-ordinate work in this area withexperts form the Basel Convention.
Chapter 9: Basel Convention, with a short description of history and scope andinformation on the regulation of ODS under the Convention.

April 2002 Task Force on Collection, Recovery, and Storage Report 15
2 Refrigeration
2.1 Introduction
One of the most important sectors consuming ODS is the refrigeration sector.There is a major difference between the refrigeration sector and almost all othersectors where ODS are used: Refrigeration, being important for public health andfood supply, needs CFCs not only for new equipment, but also to maintainexisting equipment. In most other sectors, a phase-out of the use of CFCs inproduction of goods leads to an immediate phase-out of the consumption. Therefrigeration sector is unique in the combination of two characteristics:
� In refrigeration, CFCs are needed many years after a product has beenmanufactured for its maintenance, or the product manufactured for use withCFCs needs to undergo a complicated conversion procedure (retrofit). Thereis still a considerable number of CFC contained in existing equipment inArticle 2 Countries, and the bank in Article 5 countries is still increasing inseveral cases; consequently, the service needs are also significant.
� The amount of CFC per system or even per owner in the refrigeration sectoris relatively small, making interactions very widespread and thus difficult tocover substantive parts of the very large affected populace.
These two characteristics in combination with other technical challenges make itdifficult to address the total phase-out of CFCs..
An analysis of the CFC quantities which might be potentially available fordestruction was performed. This potential defines the amount of CFCs which canreasonably be expected for destruction if logistics and incentives are existing toenable and encourage CFC recovery and collection for destruction. Consequently,in reality this potential will probably not be reached. Presently, only the EuropeanUnion and Canada require destruction of all CFCs collected; the other countries usethe bulk of refrigerant recovered to support existing CFC equipment. It wasassumed that no additional medium and large CFC consuming countries will requestmandatory destruction of CFCs recovered.
In Europe, it is actually not allowed to service CFC refrigeration equipment at all,and recovered CFCs have to be destroyed. Due to this regulation, there is a largepotential for destruction until about 2005. From 2006 onwards, the estimatedpotential for destruction stabilizes at below 3000 tons of ODS world wide, to bereduced further in the beginning of the second decade of the century to valuesbelow 1000 tons per year. Comparing the amount of CFCs to be destroyed to thepresent bank of equipment, about 14% of that bank will be available fordestruction. Given that the equipment will be in operation for many more years,with significant emissions during service and because of leakage, this result is not
16 April 2002 Task Force on Collection, Recovery, and Storage Report
surprising. The main contributors to the potential for destruction are the domestic,industrial refrigeration and the chiller sectors. In case of domestic refrigerators,waste incineration might be used as one alternative where recycling of othermaterials is not considered to be a priority objective. In all other cases, therefrigerant for destruction will be available only in its liquefied state, i.e. thedestruction equipment used has to be able to handle such refrigerant streams. Therefrigerant for destruction will be very likely contaminated by refrigeration oil,water, and other contaminants.
2.2 Bank of CFCs in the refrigeration sector
In order to provide an overview about the bank of CFC refrigerant on an worldwide basis, published data1 has been analysed and extrapolated into the future aspart of the work for this report. This estimate has been performed by region andsub-sector based on known trends, regulations etc. Important considerationsinclude the typical lifetime of equipment in the different regions and sub-sectors,legal requirements (in particular the ban of CFC use in the European Union from2001 onwards2). The production of new equipment has been converted in Article 2Countries to non-CFCs from 1994 onwards, alternative refrigerants have been usedfor the majority of new equipment in most applications latest from 1996 onwards.In Article 5 Countries, the production of new equipment using CFCs has ceased inmany countries and sectors, with only small production of new equipment beingleft after 2003.
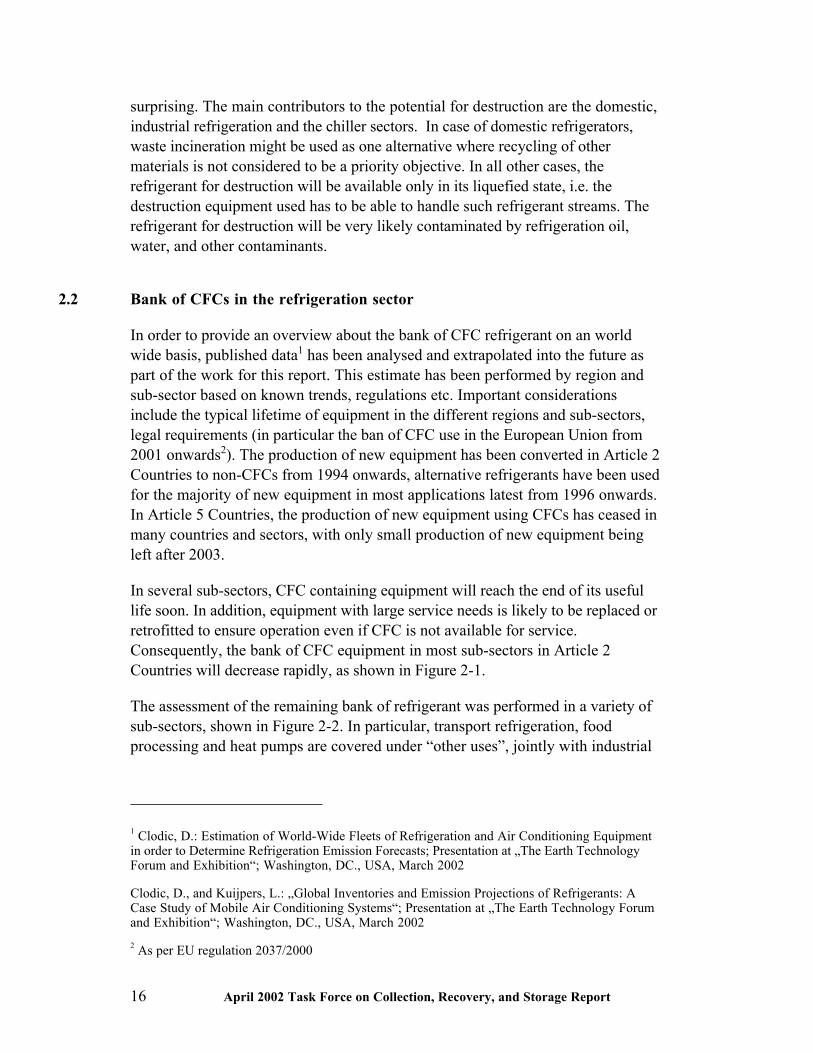
In several sub-sectors, CFC containing equipment will reach the end of its usefullife soon. In addition, equipment with large service needs is likely to be replaced orretrofitted to ensure operation even if CFC is not available for service.Consequently, the bank of CFC equipment in most sub-sectors in Article 2Countries will decrease rapidly, as shown in Figure 2-1.
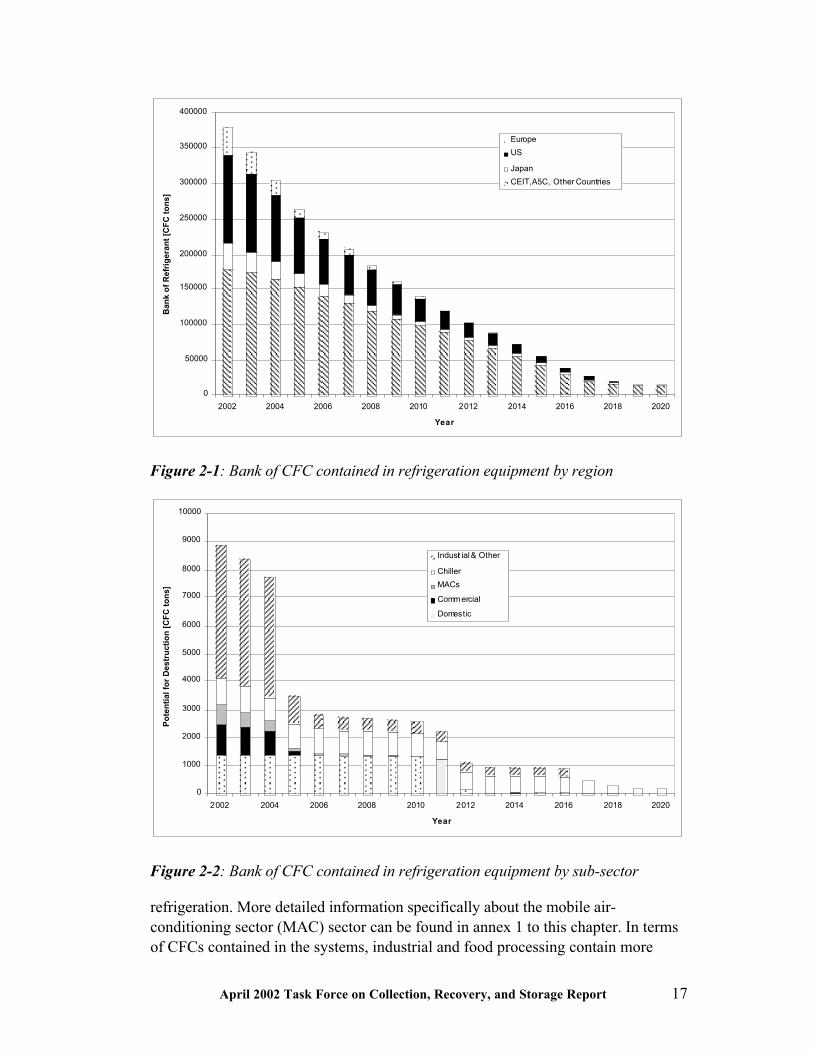
The assessment of the remaining bank of refrigerant was performed in a variety ofsub-sectors, shown in Figure 2-2. In particular, transport refrigeration, foodprocessing and heat pumps are covered under �other uses�, jointly with industrial
1 Clodic, D.: Estimation of World-Wide Fleets of Refrigeration and Air Conditioning Equipmentin order to Determine Refrigeration Emission Forecasts; Presentation at �The Earth TechnologyForum and Exhibition�; Washington, DC., USA, March 2002
Clodic, D., and Kuijpers, L.: �Global Inventories and Emission Projections of Refrigerants: ACase Study of Mobile Air Conditioning Systems�; Presentation at �The Earth Technology Forumand Exhibition�; Washington, DC., USA, March 2002
2 As per EU regulation 2037/2000
April 2002 Task Force on Collection, Recovery, and Storage Report 17
0
50000
100000
150000
200000
250000
300000
350000
400000
2002 2004 2006 2008 2010 2012 2014 2016 2018 2020
Year
Ban
k o
f R
efri
ger
ant
[CF
C t
on
s]
Europe
US
Japan
CEIT, A5C, Other Countries
Figure 2-1: Bank of CFC contained in refrigeration equipment by region
0
1000
2000
3000
4000
5000
6000
7000
8000
9000
10000
2002 2004 2006 2008 2010 2012 2014 2016 2018 2020
Year
Po
ten
tial
fo
r D
estr
uct
ion
[C
FC
to
ns]
Industr ial & Other
Chiller
MACs
Commercial
Domestic
Figure 2-2: Bank of CFC contained in refrigeration equipment by sub-sector
refrigeration. More detailed information specifically about the mobile air-conditioning sector (MAC) sector can be found in annex 1 to this chapter. In termsof CFCs contained in the systems, industrial and food processing contain more

18 April 2002 Task Force on Collection, Recovery, and Storage Report
than 85% of the CFCs in this group. It was assumed that in Article 2 Countries,larger systems would be rapidly phased out, while systems in Article 5 Countriesand small systems are likely to remain in operation for several more years.Chillers, the more modern ones being typically fairly leak tight systems, are likelyto remain in operation in the US (67% of the total bank in chillers) for severalyears; the same is valid for Article 5 Countries, CEIT and the remaining countries(23% of the total bank in chillers).Until 1996, all major manufacturers of mobile airconditioning systems including all suppliers in Article 2 Countries and CEITconverted their production to HFC-134a, and also a large part of the manufacturersin Article 5 countries. Limited production remained in some Article 5 Countriesuntil today, but on a global scale, most CFC-12 equipment in cars is reaching theend of its useful life within the next 6 years. Commercial CFC equipment in Article5 Countries (less than 20% of the total bank in commercial refrigeration systemsworld wide is CFC in Article 5 Countries) is expected to decline from 2003, whilein the other countries a strong decline is already existing resulting in a CFC phase-out in the commercial sub-sector before 2007. The domestic market has a very largeand considerable bank of refrigerant within its systems. It was assumed thatsystems have a lifetime of 15 years on average and decrease according to theirproduction numbers in earlier years.
2.3 ODS flow in the refrigeration sector
The flow of ODS in refrigeration systems is very complicated, its collection fordestruction, reuse or emission caused by a number of events and decisions. In orderto enable interpretation of the numbers for refrigerant potentially available fordestruction, it is important to visualize the possible ramifications in the flow ofrefrigerant. Several events and decisions (such as occurrence of a leak or an accident,decision of the technician how to handle unusable, contaminated refrigerant)determine if there might be potential for refrigerant destruction, or if the refrigerantis being emitted.
2.3.1 Equipment Manufacturing
The Original Equipment Manufacturer (OEM) produces the system � typicallyassociated with some emission of the refrigerant used. In its lifetime, therefrigeration system emits ODS through leakages and service needs. The service �aside from unintended refrigerant use like cleaning � might not be in the position toperform recovery of the refrigerant; and even if the service is capable of doing so, itmight be uneconomical, too time consuming etc. Consequently, there are a numberof possible scenarios leading either to refrigerant reuse, emission or availability fordestruction. Similar considerations apply to the end of life of the equipment, where

April 2002 Task Force on Collection, Recovery, and Storage Report 19
again a number of scenarios are possible, only some of them making refrigerantavailable for destruction. A detailed overview is provided in Figure 2-3.
Main ODS uses in refrigeration are:
� CFC-11 (centrifugal chillers),
� CFC-12 (general purpose, normal refrigeration, tropical ambienttemperatures, mobile air conditioning) and
� HCFC-22 (air conditioning).
Other ODS refrigerants which are used to a lesser extent are
� CFC-114 (high temperature applications, heat pumps),
� CFC-115 (within R-502 refrigerant, used mainly in European lowtemperature commercial refrigeration),
� HCFC-123 (in centrifugal chillers as CFC-11 replacement),
� BFC-13B1 (low temperatures, laboratory equipment)
� CFC-13 (low temperatures, laboratory equipment, only in combination witha second refrigerant in a cascade system)
These refrigerants, the first three covering the vast majority of systems, are beingused by the manufacturer or assembler to charge new refrigeration systems at thebeginning of the systems lifetime. The charging process is typically associated witha minor leakage.
During the lifetime of the product, refrigerant is emitted through unintended leaksto the atmosphere. These leaks might be small, caused by the assembly of theproduct, seals or other leaking connections; they might also be very significant,caused by accidents or ruptures. Typically, stationary, OEM controlled systemssuch as refrigerators or chillers can be built with very little leaks, while systemsassembled on site (commercial equipment), installed in mobile environments (cars,trucks, trains, �) tend to leak more, often substantially.

20 April 2002 Task Force on Collection, Recovery, and Storage Report
Figure 2-3: Schematic of CFC supply, emission and destruction in refrigerationequipment
April 2002 Task Force on Collection, Recovery, and Storage Report 21
2.3.2 Service and Maintenance
Over the lifetime of the system, some service might be necessary. Service refershere to maintenance which includes work on the refrigeration cycle. Suchmaintenance might be necessary due to malfunction of components (compressorburnout due to voltage fluctuations, valve problems, ...), repair of leaks, changes insystem configuration etc. Before the end of the 1980s, it was customary to releasethe refrigerant contained in a system before service, and to recharge with newrefrigerant (well designed refrigeration systems in some sub-sectors also allowed totrap refrigerant in some parts of the system, thus necessitating only some refill incase of service). Today, it is in many countries attempted to recover the refrigerantmainly for immediate or later reuse. This is limited by some factors, in particularavailability of recovery equipment and refrigerant specific recovery containers(mobility!), as well as time constraints � mid and
large size refrigeration systems, typically connected to an enterprises turnover, cannot be stopped over prolonged periods of time. In these cases, release of refrigerantto the atmosphere is still not uncommon, although some countries, in particular theUS, have reported good success with stringent enforcement measures. A smallquantity of refrigerant will remain in the system and will not be recovered, causingsome losses.
Certain defects such as compressor burnout, incorrect charging of the equipment(e.g. mixing of CFC-12 and HCFC-22 or HFC-134a in one refrigeration cycle) orother contamination might render recovered refrigerant unusable by heavycontamination. This poses a logistical problem for the refrigeration technician, sincehe can not use the recovery bottle for further recoveries until the contaminatedrefrigerant has been removed. Depending on the set-up of a recovery and recyclingsystem in the different countries (if any), contaminated refrigerant � being oftenonly of negative commercial value since it usually has to be destroyed � offers littleincentive for collection. Nevertheless, in several countries, legal or artificialcommercial incentives are provided to recover unusable refrigerant and collect it forlater destruction.
If the refrigerant is recovered and is not heavily contaminated, it might be reusedimmediately by charging the system after repair with the same refrigerant, it mightbe collected for destruction, or it might be recycled or reclaimed. Recyclingmachines allow cleaning of the refrigerant, removal of minor contaminants, inparticular water and most of the refrigeration oil. Recycling machines are in manycases owned by service shops with a certain refrigerant turnover, in particular inthe MAC sector � though they are often used for HFC-134a recycling. Reclamationis a difficult reformulation and de-contamination of the refrigerant back to theoriginal specifications, requiring major efforts. Reclamation is typically carried outonly in case of good logistics for refrigerant and refrigerant bottle exchange as well

22 April 2002 Task Force on Collection, Recovery, and Storage Report
as sufficient transport means. Both recycled as well as reclaimed refrigerant reducethe need for consumption of ODS in the refrigeration sector. In case of bothrecycling as well as reclamation, unusable refrigerant or remains from the processmight be collected for destruction.
Refrigerant available for recovery will typically be less than the refrigerant chargeddue to the refrigerant losses between the beginning of the lifetime or the last serviceand this current service. Typically, recovery of refrigerant in case of service playsa certain role for centrally serviced or mobile equipment (central repair facilities forrefrigerators or air conditioners, mobile air conditioners) as well as for largeequipment serviced by highly skilled and well equipped technicians (chillers, largecommercial systems), since there are often inherent economical benefits from therecovery. The recovery from other systems depends mainly on incentives such aslegal requirements combined with enforcement measures, deposits for refrigerantsetc. In many cases there are only limited incentives for collection of unusablerefrigerant during service.
At the end of the lifetime of refrigeration equipment, different options are available.Specifically domestic refrigerators or similar systems of limited outside dimensionsmight be incinerated completely in specific waste incineration plants suitable forthat purpose. This allows for this limited sector the complete destruction of therefrigerant remaining in the refrigerator, without prior recovery of refrigerant. WhileJapan intends to use such systems, the European Union requires recycling of theplastics etc., leading to a destruction of the refrigerator (crushing) and a manualrecovery of refrigerant before destruction. While in Europe all CFCs recovered haveto be destroyed, it can be assumed that the incineration might lead to a slightlyhigher yield in terms of destroyed CFCs (no CFC remains in oil etc.), provided thatthe refrigeration cycles are not damaged during the loading of the incineration plant.The amount of CFCs in the refrigeration cycle of domestic refrigerators andfreezers to retire until 2011 will be approximately 1650 tons per year in WesternEurope, 950 tons in the US 450 tons in Japan; in Article 5 Countries, Countrieswith Economies in Transition and in other countries, the amount of CFC refrige-rators retiring is likely to increase until 2016, from around 2000 tons to more than9000 tons. This increase is caused by the very significant increase in refrigeratorproduction for developing country markets, now being almost a third of the refri-gerator market. Until recently, the majority of these refrigerators were containingCFCs. Limited accessibility, illegal dumping and similar problems will lead to asmaller amount available for destruction than actually retiring. Detailed informationabout the situation in Article 5 Countries and Countries with Economies inTransition is provided in Annex 2 to this chapter.
All other refrigerant to be destroyed will only be available after recovery of therefrigerant from the refrigeration system. Retired systems will have experienced

April 2002 Task Force on Collection, Recovery, and Storage Report 23
some leakage, some � like automotive air conditioners � will hardly have refrigerantleft for recovery, since typically the systems are not serviced in the last 6 years ofthe cars life. It is assumed that in most economies, usable refrigerant is actuallyrecycled, reclaimed or reused in order to service existing CFC refrigeration systems.According to experience, about 10% of the recovered refrigerant reaching recyclingor reclamation facilities is reported to be unusable and is therefore available fordestruction. Important exemptions are e.g. the European Union and Canada, whererecycled refrigerant can not be reused and has to be destroyed.
2.4 Potential for Destruction of ODS from the Refrigeration Sector
The potential for CFC destruction is shown in Figure 2-4 to Figure 2-6. Theyrepresent a realistic estimate of the potential for destruction. Nevertheless, in orderto utilise this potential, extensive logistics as well as sufficient incentives forrecovery and collection also of unusable refrigerant have to be in place in thedifferent regions. Looking at the present situation, the potential given below willtherefore probably not be fully utilised.
The potential for CFC destruction consists of refrigerant recovered during serviceand refrigerant recovered at the end of life of the equipment. Except for Canada andthe European Union, it was assumed that the first priority for recovered refrigerantwas to reuse it in existing CFC systems (directly or after recycling), rather thandestroying it. In order to calculate the potential amounts of refrigerant for destruc-tion, sector and region specific data and realistic assumptions were combined,consisting of typical service rates, resp. typical retirement rates, the refrigerantremaining in the system when the service/retirement occurs, the share of recoveryexpected in the sector, and the share of the destruction vs. reuse of refrigerant. Suchcalculations have been performed separately for service and retirement ofequipment.
2.4.1 Regional Patterns
Figure 2-4, showing a distribution of the potential for CFC destruction by region,clearly displays the result of the European regulation 2937/2000, which does notallow charging of refrigeration equipment after service with CFCs, nor export ofrecovered CFCs. Consequently, it is expected that CFC phase-out in Europe willbe rapid, with 100% destruction of the recovered refrigerant. In most sectors inother parts of the world, the bank of refrigerant is reduced more slowly, and therefrigerant recovered is reused instead of being destroyed.
Once the large potential in Europe has ceased in 2005/2006, the remaining potentialfor destruction of CFC refrigerant is likely to stay below 3000 tons per year,

24 April 2002 Task Force on Collection, Recovery, and Storage Report
decreasing further after 2012. Article 5 Countries, being � due to data availability �combined in these graphs with CEIT and Other Countries, have very significantamounts of CFCs banked in larger refrigeration systems, such as chillers or foodprocessing equipment. These amounts, being accessible for recovery and laterdestruction, are the main contributors to the potential for destruction. Othersectors will contribute only to significantly smaller extents to the potential for CFCdestruction.
0
1000
2000
3000
4000
5000
6000
7000
8000
9000
10000
2002 2004 2006 2008 2010 2012 2014 2016 2018 2020
Year
Po
ten
tial
fo
r D
estr
uct
ion
[C
FC
to
ns]
Europe
US
Japan
CEIT, A5C, Other Countries
Figure 2-4: Potential for CFC destruction from refrigeration sector by region
2.4.2 Sector Distribution
The sector wise distribution as shown in Figure 2-5 shows that the sectors coveredin industrial and other as well as the chiller sector have the ability to provide themost steady flow of CFC refrigerant to be destroyed. The low potential indomestic refrigeration after 2012 is not only based on the assumption of a loweraverage collection rate in the remaining countries than in Western Europe, Japanand US, but also on the fact, that most of the refrigerant will be reused, while incase of Japan and Europe it will be destroyed. The refrigerant coming back fromMACs for destruction will be minimal because of the little refrigerant remaining inthe system and its typically sufficient quality for reuse (no motor burn-outs). Onthe other hand refrigerant coming back from commercial refrigeration is limitedbecause of leakage rates and relatively short life of the equipment.
April 2002 Task Force on Collection, Recovery, and Storage Report 25
0
1000
2000
3000
4000
5000
6000
7000
8000
9000
10000
2002 2004 2006 2008 2010 2012 2014 2016 2018 2020
Year
Po
ten
tial
fo
r D
estr
uct
ion
[C
FC
to
ns]
Europe
US
Japan
CEIT, A5C, Other Countries
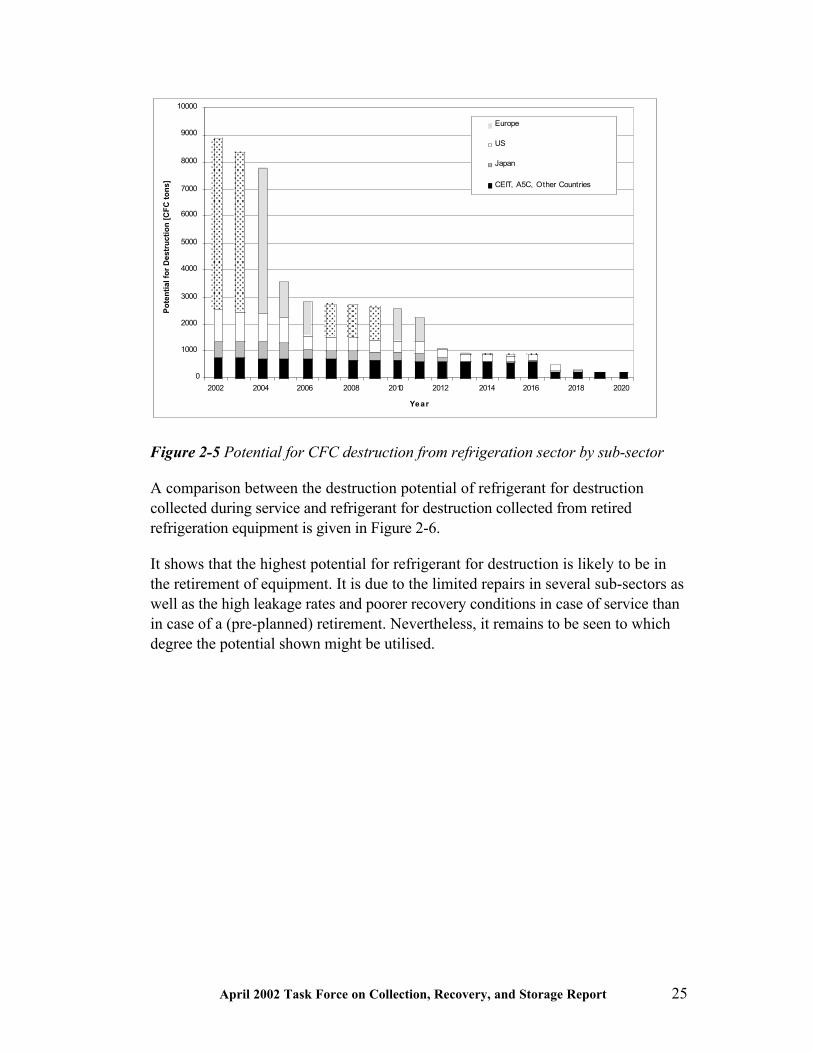
Figure 2-5 Potential for CFC destruction from refrigeration sector by sub-sector
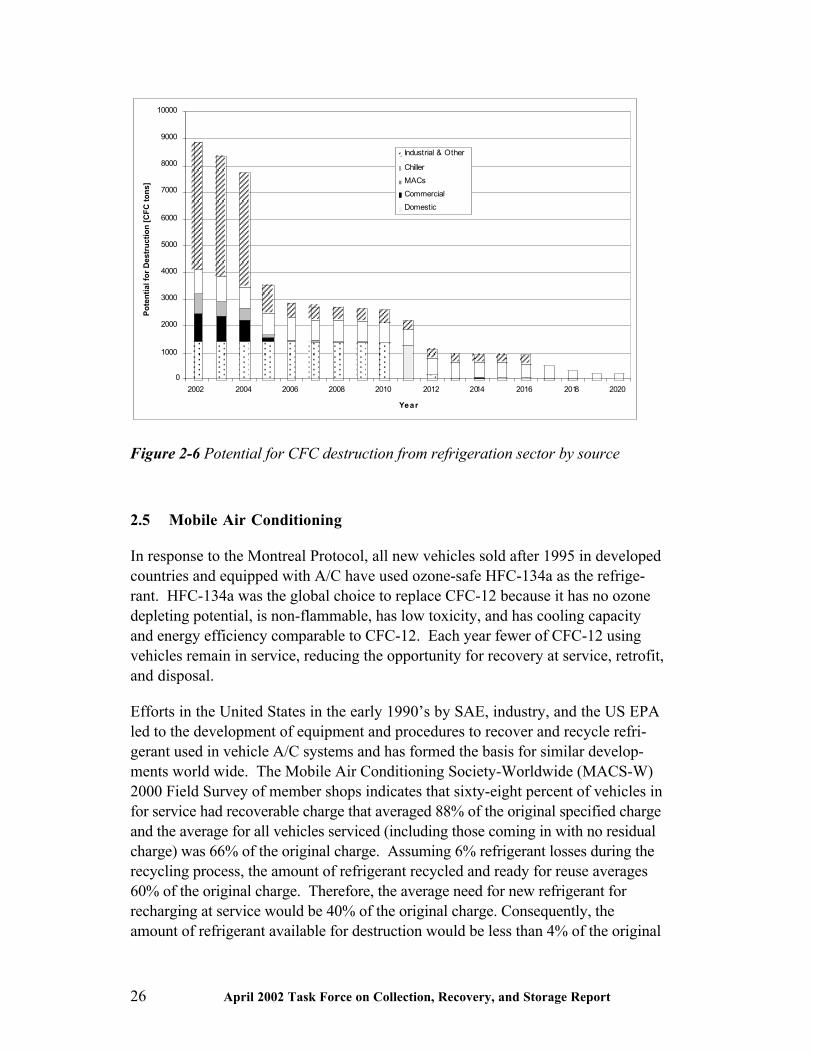
A comparison between the destruction potential of refrigerant for destructioncollected during service and refrigerant for destruction collected from retiredrefrigeration equipment is given in Figure 2-6.
It shows that the highest potential for refrigerant for destruction is likely to be inthe retirement of equipment. It is due to the limited repairs in several sub-sectors aswell as the high leakage rates and poorer recovery conditions in case of service thanin case of a (pre-planned) retirement. Nevertheless, it remains to be seen to whichdegree the potential shown might be utilised.
26 April 2002 Task Force on Collection, Recovery, and Storage Report
0
1000
2000
3000
4000
5000
6000
7000
8000
9000
10000
2002 2004 2006 2008 2010 2012 2014 2016 2018 2020
Year
Po
ten
tial
fo
r D
estr
uct
ion
[C
FC
to
ns]
Industrial & Other
Chiller
MACs
Commercial
Domestic
Figure 2-6 Potential for CFC destruction from refrigeration sector by source
2.5 Mobile Air Conditioning
In response to the Montreal Protocol, all new vehicles sold after 1995 in developedcountries and equipped with A/C have used ozone-safe HFC-134a as the refrige-rant. HFC-134a was the global choice to replace CFC-12 because it has no ozonedepleting potential, is non-flammable, has low toxicity, and has cooling capacityand energy efficiency comparable to CFC-12. Each year fewer of CFC-12 usingvehicles remain in service, reducing the opportunity for recovery at service, retrofit,and disposal.
Efforts in the United States in the early 1990�s by SAE, industry, and the US EPAled to the development of equipment and procedures to recover and recycle refri-gerant used in vehicle A/C systems and has formed the basis for similar develop-ments world wide. The Mobile Air Conditioning Society-Worldwide (MACS-W)2000 Field Survey of member shops indicates that sixty-eight percent of vehicles infor service had recoverable charge that averaged 88% of the original specified chargeand the average for all vehicles serviced (including those coming in with no residualcharge) was 66% of the original charge. Assuming 6% refrigerant losses during therecycling process, the amount of refrigerant recycled and ready for reuse averages60% of the original charge. Therefore, the average need for new refrigerant forrecharging at service would be 40% of the original charge. Consequently, theamount of refrigerant available for destruction would be less than 4% of the original

April 2002 Task Force on Collection, Recovery, and Storage Report 27
charge, depending on how much refrigerant is being emitted during recycling andhow much is being separated for later destruction. The average amount ofrefrigerant charge in current vehicles is 1.05 kg for CFC-12 systems.
It is technically and economically feasible to substantially reduce global emissionsof CFCs from vehicle air conditioning (A/C). CFC recovery at the time of ACretrofit to another refrigerant or at system deactivation or disposal can result insubstances available for disposal. However, so far worldwide, very little CFCrecovered from vehicles has been destroyed; almost all is recycled to vehicle ACuse.
Recycling is currently required in the European Union, Japan, the United States,and some other nations of the world. In the past, 50% of the world�s populationof vehicles with A/C was located in the U.S. As the world vehicle populationreaches the anticipated one billion by 2015, over 2/3 of these vehicles will resideoutside of the United States. Given this, refrigerant recovery/recycling in alldeveloped and developing countries must be considered, and, where possible,should be made mandatory to minimize the release of refrigerant to the atmosphere.
Recovery and reuse by vehicle service personal is the least costly strategy, with thevalue of reclaimed refrigerant higher than the cost of equipment and labor indeveloped countries where CFC-12 frequently sells for higher prices (currently upto US$14 per kilogram). Costs of collection and off-site storage and destruction arenot documented, since this rarely occurs.
Refrigerant management can substantially reduce emissions by:
� not allowing service recharging without repairing leaking systems,
� recovery and recycle at service and vehicle disposal,
� prohibiting small disposable cans that encourage car owners to recharge theirown systems without repair,
� encouraging that only quality parts be used for repair, and
� creating incentives to recover CFC from inoperable AC systems before it allleaks out.
The situation in developing countries differs significantly from that of developedcountries. Developing countries tend to have older vehicles with air conditionersthat are not as well maintained. A/C service often consists of simply addingrefrigerant to a leaky system without repairing the leak. Service without recoveryand recycle equipment means refrigerant must be vented into the atmosphere.CFC-12 is sometimes used to refill HFC-134a systems, due to its lower price andgreater availability.
28 April 2002 Task Force on Collection, Recovery, and Storage Report
The low cost and availability of CFC-12 in developing countries discouragesrecovery and recycle. Mandatory programs can result in increased use of recoveryand recycle, but may be difficult to enforce. It is expected in the future that thedecreasing supply of CFC-12 and the higher cost of HFC-134a, combined withinternational political pressure to limit emissions, will provide added incentives.
2.6 Recovery and Recycling in Article 5 and Countries and Countries withEconomies in Transition
The designation �Recovery and recycling� for certain types of projects in CEITand A5C describes today a variety of different measures. It ranges from procure-ment of equipment, set-up of logistics, and training. Not exactly in line with theoriginal definitions, the use of the designation �Recovery and Recycling� coverssometimes also simpler measures such as reuse of refrigerant, and more complicatedones such as reclamation. Reflecting this reality, this chapter uses a wide definitionof Recovery and Recycling, which includes Reuse and Reclamation. All thesemeasures are meant to conserve refrigerant already within refrigeration systemsinstead of releasing it.
Recovery designates the extraction of refrigerant from the system into a separatecontainer, which could be e.g. a suitable refrigerant bottle or a refrigerant bag. The(minimum) equipment needed for recovery of small amounts (up to a kg) is verysimple and can be assembled for low costs within minutes from a refrigerationtechnician, potentially even using to a large extent used refrigeration components.
Reuse designates the use of recovered refrigerant with no or absolutely minimalpurification for charging of a refrigeration system, often the same from which therefrigerant was recovered in the first place. This combination of recovery and reuseshould be common practice for service calls, e.g. in case of repair of parts of therefrigeration cycle itself. Nevertheless, in many countries, this is typically not donedue to the transport need of the recovery machine as well as the increase indowntime of the system.
Recycling is defined similar to reuse, except that the refrigerant undergoes a purifi-cation process to remove oil, moisture and acids. The recycling equipment providedunder the MLF funded projects is typically performing refrigerant recovery andcan increase the speed of that process greatly, allowing also evacuation of equip-ment etc. In addition, these machines typically allow also for recycling of refri-gerant recovered elsewhere.
Reclamation requires complicated thermophysical purification processes, since it isthe objective to deliver refrigerant meeting the original specifications. Due to the

April 2002 Task Force on Collection, Recovery, and Storage Report 29
investments involved, reclamation clearly requires a centralized set-up of R&Rsystems.
R&R systems can be set up in a dispersed or a centralized way. Centralizedsystems provide typically better refrigerant quality with similar investment levelsin comparison to dispersed systems, since only a few systems have to be financed,and quality control of incoming and outgoing refrigerant as well as maintenance ofthe equipment is better. The disadvantage of centralized systems are the higheroperational costs on the side of the service enterprises because of
Increased logistics are necessary, including significant transport capacities on theside of technicians
� Loss of work time, often in the peak season
� Quality control of incoming refrigerant necessary
� Disincentive in case of delivery of unusable refrigerant (disposal costs have tobe buried, often by technician)
� Disputes with the customer because �valuable� refrigerant is carried awayfrom the site, leading to an suspected income for the technician.
If centralized systems are envisaged, the need for logistics might require a limitationto areas with a large population of refrigeration equipment attractive for R&R.Thus, centralized systems are largely found in urban areas; in the countryside,either decentralized equipment is used, or only recovery and reuse is beingperformed.
The alternative to centralization is to establish a dispersed, decentralized system.This can be achieved e.g. by providing one recycling machine per company, orseveral companies located close to each other can share one machine. The latterpossibility turned out to be relatively ineffective, since the owner of the equipmentoften tries to limit access of his competitors.
Systems where only recovery and reuse was carried out have not been widelysupported, maybe largely due to political reasons, but are a valid alternativereducing costs and achieving an excellent CFC saving in comparison to the fundingused.
Recovery machines are typically smaller than recycling machines, but even thesecompact designs add very significantly to the equipment that a technician has tocarry to the customer. Taking into account the lower mobility in many A5C andCEIT, the additional equipment plus one refrigerant container per refrigerant usedon top of the necessary repair equipment are not easily carried and thus are adisincentive for recovery and reuse on site, or subsequent transport to a recyclingmachine/reclamation center. In absence of strong legislation and enforcement of

30 April 2002 Task Force on Collection, Recovery, and Storage Report
requirements for recycling, this disincentive is only overcome if a system containseven in case of a failure sufficient refrigerant of acceptable quality and if the ownercan wait for the recovery (downtime of system � threat to perishable products,turnover, �). Compressor burnout, being quite frequent in case of small equipmentand unstable electric grids with voltage fluctuations, cause the refrigerant filling tobe completely unusable. All these points lead to recovery and recycling on sitebeing economically clearly unattractive for systems below approximately 10 kg(border varies depending on the conditions in the individual country), and beingclearly attractive for systems containing more than approximately 100 kg (bordervaries depending on the conditions in the individual country). Such an amount offilling can be found e.g. in large air conditioning systems, industrial and food storageapplications and some commercial equipment. In the industrial and food storageequipment, other refrigerant than CFCs have frequently been used.
The alternative to carrying a recovery machine to the equipment is to bring theequipment to the recovery machine. This is possible for almost all mobile equip-ment (car, bus and train air conditioning, refrigerated road and rail transport, �).Domestic refrigerators and small commercial equipment are sometimes alsotransported to a repair facility. This is insofar problematic as there is a high riskinvolved of damaging the equipment during transport, releasing the filling in theambient. In addition, the filling to be recaptured is limited: The refrigerant originallycontained in the system is small (approximately 200g CFC for large refrigerators),from this amount, leaked refrigerant has to be deducted. In addition, another 20g to30 g might remain dissolved in the compressor oil, leaving very limited potential forrecovery.
In several African countries, it was observed that nearly 60 to 70% of domesticrefrigerators are serviced due to leaking or burnt out compressors, leaving allrefrigerant within the system unusable. The remaining need for servicing is due toblockage in capillaries (rare) or due to electrical faults which do not require therefrigerant side to be touched.
In case of recovery and recycling, there is actually only a small margin betweenconditions which are economically unattractive and those economically attractive.This margin is where projects of institutions like GEF or Multilateral Fund shouldsupport enterprises, where support in equipment will provide the increment incosts to make out of a non-profitable a profitable project. But this role is difficultto define, since recovery equipment can be built by the individual entrepreneurwith little effort and minimum costs basically from leftovers of prior repairs, ifR&R is economically feasible. The role of training in that regard is important, sinceit raises awareness and can provide important information concerning designconsiderations for recovery equipment.

April 2002 Task Force on Collection, Recovery, and Storage Report 31
While recycling machines might be used with different refrigerants, switchingbetween refrigerants requires some major cleaning effort and replacement of anumber of consumables. Thus, recycling machines are typically used only for onetype of refrigerant at a time. For any shop owner, it is most economical toconcentrate on the highest value refrigerant. HFC-134a recovered from systemsother than MAC is comparably small because stationary HFC containing systemshave only been introduced into the markets recently. Consequently, cases areknown where recycling equipment meant for CFC-12 has actually been used eitherfor HCFC or for HFC. While this can be seen as a certain positive effect in generalenvironmental terms, it does not reduce the consumption of virgin CFCs.
The limited economic incentive for R&R in some countries is also illustrated bycases where the government, in its efforts to ensure that the equipment would beproperly utilised, required security deposits from the enterprises interested inutilizing the equipment. Since no interest was shown on the part of theseenterprises to follow this procedure, the project did not start.
But there are also positive signs. In some countries, it was found in evaluationmissions that there was good utilization of equipment and the equipment was wellmaintained, typically in the MAC sub-sector.
A number of interesting lessons were presented by U.S. EPA concerning lessonslearnt in commercial refrigeration servicing projects in China and the DominicanRepublic which presented a number of obstacles in comparison to MAC projects:
(a) "Equipment owners and service technicians may be resistant to the use ofrecycled refrigerant. This does not seem to be an unreasonable position,given owners� substantial investments in refrigeration equipment, theeconomic importance of reliable system performance in most commercialrefrigeration applications (i.e. the risk of spoiled food, unhappycustomers), and the fact that refrigerant is a relatively small part of eachrepair bill. This appears to be a distinctly different situation than in theMAC sector, where recycled refrigerant is widely accepted, partly throughthe efforts of automobile manufacturers. Business owners may also findthe potential cost savings of recycled refrigerant less attractive thanautomobile owners.
(b) The percentage of repair jobs, which involve a recovery opportunity,seems to be substantially less than in the MAC sector.
(c) Because the recovery equipment tends to be cumbersome, and refrigerationequipment is often inconveniently located, it is difficult to motivate thetechnicians to take a recovery machine to every repair job. In the MAC
32 April 2002 Task Force on Collection, Recovery, and Storage Report
sector, the recovery/recycle machine is readily available on the shop floorand can be easily brought over to each car being repaired.
If the recovered refrigerant must be recycled before re-use, this means that therefrigerant must be transported to a recycling machine, recycled, then transportedagain to refrigeration equipment before it can be re-used. It is difficult to structureincentives to assure that this will be done, particularly if the economic value of therecycled refrigerant is low. No movement of refrigerant is required in the MACsector."

April 2002 Task Force on Collection, Recovery, and Storage Report 33
3 Foams
3.1 Use of Ozone Depleting Substances in Foams
The use of CFCs and HCFCs as foam blowing agents spans several generic producttypes. These can be summarized as:
Table 3-1: Generic Foam Types Using CFCs and HCFCs
Generic Product Typical Blowing Agents
CFCs HCFCs
Polyurethane Elastomers CFC-11 HCFC-141b
Flexible Polyurethane CFC-11 Little used
Rigid Polyurethane CFC-11 HCFC-141b, 22
Extruded Polystyrene Sheet CFC-12 Not used
Extruded Polystyrene Board CFC-12 HCFC-142b, 22
Polyethylene CFC-12 HCFC-142b, 22
Phenolic CFC-11/CFC-113 HCFC-141b
In the base year for the Montreal Protocol (1986), the consumption of CFCs infoams was as follows:
CFC Usage by Product Type in the Foam Sector (1986)(total 267,400 tonnes)
Polyurethane78%
Polyolefin7%
Extruded Polystyrene
14%
Phenolic1%
Figure 3-1: CFC Consumption in the foam sector in 1986
As illustrated in Table 3-1, the polyurethane sector splits into two prime sub-sectors: - flexible and rigid. Flexible foams include foams for furniture, bedding

34 April 2002 Task Force on Collection, Recovery, and Storage Report
carpet underlay and vehicle seats. In addition, flexible integral skin systems(elastomeric) provide shoe soles, furniture mouldings and automotive fascias andsteering wheels.
3.1.1 Polyurethane Elastomers
CFC-11 has been used for several applications in this sector. When CFC-11 wasphased-out in the EU, HCFCs were only allowed in integral skin transportationsafety applications. In the US this use was only allowed until 1996. In othercounries and in developing countries, the use of HCFCs has continued, albeit at alow level. Non-ODS technology is becoming dominant in these sectors too. Theapplication is fairly emissive and little blowing agent remains in the foam after oneto two years (see Table 1-2).
3.1.2 Flexible Foams
Although flexible polyurethane foams represent the largest polyurethane sector(65%), the use of CFC-11 was primarily as an auxiliary blowing agent, whichmeant that the consumption of blowing agent was always significantly lower thanthat for rigid polyurethane foams. This is illustrated in Figure 3-1 below:
Figure 3-2: Comparative consumption of CFCs in rigid and flexible foams
As can be seen from Figure 3-2, the use of CFCs in flexible foams was virtuallyeliminated by the early 1990s as the industry moved to methylene chloride andlatterly to liquid CO2 technologies. Since the application was essentially emissivein nature, there is now no opportunity to minimise emissions from existing foamstocks. This is in strong contrast to the situation with rigid foams.
Use of CFCs in Foams (1976-1999)
0
50000
100000
150000
200000
250000
300000
350000
1976
1980
1984
1988
1992
1996
Year
Vo
lum
e (t
on
nes
)
Flexible Foams
Rigid Foams

April 2002 Task Force on Collection, Recovery, and Storage Report 35
3.1.3 Rigid Foams
CFCs have been used in rigid foams since the late 1950s. They have provided thefollowing:
� Lower thermal conductivity than other blowing agent alternatives
� Stable thermal conductivity performance with time
� Ease of processing (suitable boiling points, non-flammability, low toxicityetc.)
� Good product properties (fire performance, dimensional stability, strengthetc.)
However, the emergence of ozone depletion as an issue, singled out CFCs for earlyaction and the foam sector in developed countries was obliged to phase out theiruse by 1996 under the Montreal Protocol. Foam manufacturers in developingcountries have longer to respond to the requirements of the Montreal Protocol withCFC phase-out not mandated until 2010. The regional variation in phase-out isshown in Figure 3-3.
Phase-out of CFC Blowing Agents in Rigid Foams
0
50000
100000
150000
200000
250000
1960
1962
1964
1966
1968
1970
1972
1974
1976
1978
1980
1982
1984
1986
1988
1990
1992
1994
1996
1998
2000
2002
2004
2006
2008
2010
Year
An
nu
al C
on
sum
pti
on
(O
DP
To
nn
es)
Developing Countries
J apan
North America
Europe
Figure 3-3: Regional variation of global CFC phase-out
In many cases, the initial replacements were HCFCs, which offered similarproperties to the CFCs they replaced but with only 5-12% of the impact on theozone layer. Some sectors such as the extruded polystyrene sheet sector and theEuropean appliance manufacturers were able to make transitions directly to non-ozone depleting substances, thereby saving the need to make two transitions. In

36 April 2002 Task Force on Collection, Recovery, and Storage Report
most developed countries, HCFC phase-out in the foam sector will occur before2010. However, use in developing countries is permitted until 2040, albeit with afreeze on consumption at 2015. Figure 3-4 illustrates the expected consumptiontrends for the global foam sector to 2010.
CFC/HCFC Blowing Agents in use globally in Rigid Foams
0
50000
100000
150000
200000
250000
1960
1962
1964
1966
1968
1970
1972
1974
1976
1978
1980
1982
1984
1986
1988
1990
1992
1994
1996
1998
2000
2002
2004
2006
2008
2010
Year
Blo
win
g a
gen
t u
sag
e (m
etri
c to
nn
es)
Total HCFCs
Total CFCs
Figure 3-4: Growth of CFC use in rigid foams and the subsequent demisefollowing HCFC introduction
3.2 Baseline emissions estimates from foams
Although the Montreal Protocol is fundamentally a consumption-based control, itis recognised that the rate of emission of CFCs and HCFCs from applications is thekey factor in assessing the impact of these ozone-depleting substances on thestratospheric ozone layer. While many applications lead to immediate emission(e.g. aerosols), the nature of rigid insulation foams is such that, in many applica-tions, the blowing agent remains in the foam for extended periods. Depending onthe lifetime of the application, this can be upwards of 50 years in some cases.Accordingly, much of the foam manufactured using CFCs in the period 1960-1995is likely to be still in use today. This provides a substantial opportunity forrecovery of blowing agent at end-of-life. However, to assess this opportunity andto focus recovery activities in the most appropriate places, it is important to beable to model anticipated retention levels in differing product types.
In assessing emissions from foams, it is recognised that there are three primephases in which emissions can occur. These are:

April 2002 Task Force on Collection, Recovery, and Storage Report 37
� Foam production and installation (first year losses)
� Installed foam during its use phase
� Decommissioning at end of life
Depending on the application and product type in question, these areas of emission(known as emission functions) can vary substantially. In view of the increasingimportance being placed on quantifying emissions (particularly under the operationof the Kyoto Protocol), there has been increased interest over the last few years todevelop appropriate emission functions for a variety of product types and enduses.
As part of an on-going study carried out for AFEAS over the past five years, thefollowing emission functions for various foam applications have been derived andrefined (see Table 3-2).
Table 3-2: Emission functions derived for various foam types and applications
Foam Type First yearrelease
(%)
ReleaseRate(%/yr)
Time toTotal
Release1
(yrs)
Lifetime ofFoam(yrs)
Total remainingat
decommissioning(%)
PU Integral Skin 95 2.5 2 15 0PU Cont. Panel 5 0.5 190 50 70PU Disc. Panel 6 0.5 188 50 69PU Appliance 4 0.25 384 15 92PU Com. Refrig. 6 0.25 376 15 90PU Cont. Block 35 0.75 86 15 54PU Disc. Block 40 0.75 80 15 49PU Cont. Lam. 6 1 94 50 44PU Spray 25 1.5 50 50 0PU Reefers & Trans 6 0.5 188 15 86.5PU OCF 100 N/A 0 50 0PU Pipe in Pipe 6 0.25 376 50 81.5Phen. Cont. Lam. 6 1 94 50 44Phen. Disc Block 40 0.75 80 15 49XPS Board 25 2.5 30 50 0PE Board 90 5 2 50 0PE Pipe 100 N/A 0 15 0
The applications where there are significant amounts of ozone depleting substancesto recover at end-of-life are shaded yellow in Table 3-2. The retention withindomestic appliances is particularly high because of the metal/plastic encapsulationof the foam. These retention levels have been verified by the appliance industrythrough cross checks on 25 year-old units blown with CFC-11. Using these basicemission functions and the historic usage patterns of CFCs and HCFCs within thevarious foam types and applications, it is possible to create a projected emissionpattern of the type shown in Figure 3-5 below.

38 April 2002 Task Force on Collection, Recovery, and Storage Report
Emissions of Blowing Agent in Actual Tonnes
0
10000
20000
30000
40000
50000
60000
70000
1987
1988
1989
1990
1991
1992
1993
1994
1995
1996
1997
1998
1999
2000
2001
2002
2003
2004
2005
2006
2007
2008
2009
2010
Year
To
nn
es
CFC-11
CFC-12
HCFC-141b
HCFC-142b
HCFC-22
HFC-134a
Figure 3-5: Projected emissions estimates for various CFCs and HCFCs to 2010
Figure 3-5 should, however, be used with caution because it assumes that, at theend of design life, release of the encapsulated CFC is instantaneous which, inreality, it certainly is not. There are two categories of reason why this is not thecase:
� Incidental outcomes of non-intervention at the end of design life
� Specific initiatives to reduce emissions at the end of design life
In essence, these two categories summarise two alternative strategies best definedas �leave well alone� and �manage all end-of-life processes�. At their extremes, bothof these routes can be highly effective in minimising emissions. In reality, however,even the processes of landfill and other apparently non-interventionist approacheshave impacts on emissions because of poor handling and the damage resulting.Similarly, interventionist approaches such as mechanical recovery need to be highlyengineered to avoid accelerating emissions unduly. These issues are addressed inmore detail in the next section. Suffice it to say for the moment, that the emissionprofile shown in Figure x-5 represents a genuine �worst case� scenario at end-of-life. Nonetheless, the graph provides a good indication of the potential scale of theemissions challenge over the next eight years. Even in 2010, there is still likely to bewell over 1 million tonnes of CFC-11 remaining in rigid foams globally evenassuming that most blowing agent in refrigerator foam in developed countries hasbeen either dealt with or released by that time. The distribution of this CFC-11 isindicated in Figure 3-6 below:

April 2002 Task Force on Collection, Recovery, and Storage Report 39
Global CFC-11 projected in installed foams as at 2010 (approx 1.12M tonnes)
PU Cont. Panel12%
PU Disc. Panel
16%
PU Appliance8%PU Cont. Laminate
56%
PU Spray6%
Other2%
Figure 3-6: Remaining CFC-11 in installed foams at 2010
Although this is a very significant quantity, it is worth reflecting that, at their peakCFCs were being sold into the rigid foam sector at over 200,000 tonnes per annum.Accordingly, the projected CFCs remaining in 2010 represents around 5 yearsworth of peak supply.
An interesting further fact is that the burden of recovery, particularly in theappliance sector, will have switched from developed to developing countries.Figure 3-7 illustrates the likely split of CFC-11 banks in 2010. This split does nottake into account any trade which may have taken place in second-handrefrigerators exported from developed to developing countries for re-use. Thepicture illustrates the importance of phasing out the use of CFC-11 in refrigeratorplants in developing countries at the earliest possible opportunity. The currentdata set was compiled in 1998 on the basis of the best available information ontransitioning at that time. Further work is now required to determine how theseprojected CFC-11 banks in 2010 might be altered by the latest projections for CFCphase-out.

40 April 2002 Task Force on Collection, Recovery, and Storage Report
Global CFC-11 projected in foams at 2010 by Regional Classification(total 1.12 Mtonnes)
Developed Countries68%
Developing Countries32%
Figure 3-7: Remaining CFC-11 in foams by Regional Classification
3.3 Options at End of Design Life
Blowing agent recovery, while not mandated under the Montreal Protocol, has beenrecognised by many Parties as worth pursuing and several initiatives have beentaken at national and regional level to take advantage of the excellent blowing agentretention of many rigid foam applications. However, the physical challenge ofretrieving the installed foams from within structural building projects and otherequally inaccessible locations has led to some severe questions about thepracticality and cost effectiveness of such initiatives. In contrast, foams withindomestic and small commercial refrigerators and freezers are considerably moreaccessible, particularly where units are already collected for recovery of refrigerantor for other material recycling reasons. Nonetheless, the potential for recovery ofblowing agents from any foam source depends on the following factors:
� Quality of the foam cell structure and resulting diffusion rates
� Solubility of the blowing agent in the matrix
� Thickness of foam sections
� Types of facing materials
� Other materials adhered to the foam or facing materials
It is important to note that blowing agent recovery need not necessarily beundertaken at the end of a product�s designed use, since secondary usage can be aserious option in some cases. In addition, any attempt to recover blowing agent,

April 2002 Task Force on Collection, Recovery, and Storage Report 41
even when mandated by regulation, will not be 100% effective. The following flow-chart (Figure 3-8) illustrates the �real life� material flows for foamed products,including continued losses through abandonment and landfill:
Initial ODS'Footprint'
OEMProduct
Losses in OEMManufacture
Losses in usephase
End of design use
Secondaryuse
Inaccessible for collection
MunicipalWaste
Incinerator
Rotary KilnIncinerator
Other
DirectIncineration
LandfillComponent recovery &
recycling
Metals Plastics Blowing Agents
PU Others
(abandonment)
Figure 3-8: Typical Lifecycle and Disposal Routes for Foam Products

42 April 2002 Task Force on Collection, Recovery, and Storage Report
The flow-chart illustrates that there are five prime end-of-life scenarios for foams(shaded yellow). These are:
� Abandonment
� Secondary use
� Landfill
� Direct incineration (with energy recovery)
� Component recovery and recycling/destruction
3.3.1 Abandonment
Abandonment is a fact of life and will continue to be so, even within the moststringent regulatory framework. In general terms, there are two sources of theproblem:
Accidental : � This arises when the foam in question is inaccessible or in caseswhere its presence is unknown and/or undetected
Deliberate : - This occurs when, for reasons of economy or social irresponsibility,the foam in question is disposed of in an uncontrolled fashion.
Quantifying the amount of foam abandoned in any application or region isextremely difficult because, by its very nature, it is uncontrolled. The only knownmethod of gaining some insight into the practice is from the experience of localauthorities called to clear up �fly tips� and other impromptu collections of disposedwaste. Even in these cases, it is seldom that the collection is either systematic orquantitative. Accordingly, it is typically necessary to make an assessment ofabandoned foam products by inference from other data sources. However, this isinevitably an approximation because the precise amount of foam beingdecommissioned either accidentally or deliberately is never completely known.
While absolute values are difficult to specify, trends can be easier to spot. In some,but not all, societies, the tendency towards �fly tipping� increases with theregulatory and, most importantly, financial burden placed on the individualdisposing of the foam in question. Thus, if some sort of disposal tax is charged,there can be a reaction from the general public and individual corporations againstincurring these costs resulting in the disposal of the foam in an uncontrolledmanner. However, this is less the case in more disciplined and responsible societiessuch as Japan, where disposal taxation can be made to work.
To avoid such behavioural effects, the more widely used approach is to incorporateany element of disposal taxation into the purchase price of a replacement unit. Thisworks particularly well if the tax can be sufficiently well targeted to apply only to

April 2002 Task Force on Collection, Recovery, and Storage Report 43
the products leading to a disposal problem. However, more typically it will not bepossible to focus taxation measures so tightly and the tax may only act as a generaldisincentive to replace existing products. This can be environmentally counter-productive if less energy efficient products are currently in use.
As developed later, much of the current regulation governing disposal is driven notonly by consideration of ODS recovery but also by more comprehensive resourcerecovery targets for recycling. In this case, more widespread taxation is justified.
3.3.2 Secondary Use
The ability to re-use a foam-based product depends on the way it is manufacturedand installed in the first instance. The prime requirement for such a product is thatit can be transposed from one application point to another without disrupting theintegrity of the product itself. Historically, such characteristics have been thepreserve of genuinely self-contained items such as refrigerators and, indeed, asignificant trade in second-hand refrigerators has developed across regions of theworld. Additionally, there is a significant trade within a country where units aresold on to poorer sections of the population. Nonetheless, the most commonoccurrence with refrigerators is their continuing use within a household after a newunit has been purchased.
Where units are traded between the Article 2 and Article 5(i) or CEIT countries,this practice has created a dilemma for regulators under the Montreal Protocol. Onthe one hand, the units provide access to improved standards of living for manyresidents in developing countries at affordable prices. In addition, the practice is aclassic example of extending the use period of a product and avoiding prematureobsolescence. On the other hand, the practice often extends the use of less energyefficient equipment and effectively exports a future disposal problem to a deve-loping country. This latter problem is of particular significance in the case ofrefrigerators using CFC refrigerants where rapid fugitive emission is more likelythan with the foams themselves. In general, the Ozone Regulators in developingcountries have come down against the practice of such trade and this position hasnow been supported by the prohibition of exports of used refrigerators from theEuropean Union under the recent Regulation 2037/2000. The decision, however,remains a controversial one and even some environmental NGOs consider that itwould be better to maintain the trade and install suitable recovery equipment forend-of-life management. The practicality and cost of so-doing remains the keybarrier.
Another opportunity for life extension is the potential for re-use of buildinginsulation elements. The growth of use of PU composite panels in Europe pointsstrongly to the cost-effectiveness of this approach in the first instance with theadded value of being able to dismantle these elements from the supporting structure

44 April 2002 Task Force on Collection, Recovery, and Storage Report
and re-using them at the end of the building�s life. Obviously, such practiceassumes that the effective lifecycle of the insulation element itself will be longerthan the building in which it is used. With the performance standards of theseelements increasing progressively and the duration of practical building utilitydecreasing, the assumption is becoming ever more applicable.
3.3.3 Landfill
Landfill has been the traditional destination of most of the foam productsdecommissioned over the last 30 years, including many products containing CFCsand HCFCs. Although the regulations surrounding the location and management oflandfills has improved considerably over this period, there is still little measure-ment or control of specific materials entering into a given site in many countries.The exception in this respect is where materials are determined to be hazardous orspecial waste (e.g. asbestos based). In these cases, regulatory controls haveincreased substantially. For example, regulations in several European countriesprohibit the landfill of combustible materials. This is already the case in theNetherlands, Sweden, Denmark and Switzerland. Austria and Germany will followin 2004 and 2005 respectively. The new EU Directive will prohibit the placing inlandfills of materials of high carbon content, which will include foams.
One of the options for monitoring the movement of CFC and HCFC-containingfoams onto landfill sites would be to classify the material as hazardous or specialwaste. In some countries, this has been done and with significant effect. In othercountries, thresholds have been set for foams to qualify as hazardous or specialwaste (typically at 5% by weight of CFCs). However, because the composition offoam waste is not easily determined, and is not instantaneously recognisable fromits exterior appearance, such thresholds are hard to apply in practice.
In general, the attitude of a Party to the prospect of landfilling foams is largelydependent on their wider approach to landfilling as part of their waste strategy. Inthe United States, for example, there is such substantial capacity for landfill that itis unlikely that alternative strategies will be pursued unless the case for bettercontrol of CFC emissions from landfill is compelling. Nonetheless, there are banson the landfilling of refrigerators in 13 states. To further understand the efectrs ofthe landfilling of foams, the American Home Appliance Manufacturers (AHAM)commissioned a study at the Danish Technical University (DTU) in 2000 toinvestigate the rate of emission of CFCs from shredded foams3.
3 �Determination of the fraction of blowing agent released from refrigerator/freezer foam afterdecommissioning the product� Kjeldsen & Scheutz (2002)

April 2002 Task Force on Collection, Recovery, and Storage Report 45
The study has produced two key conclusions that are relevant to this discussion:
� That blowing agent releases from the shredded foam are not high during thefirst six weeks after cutting
� That the rate of release is highly dependent on the particle size of theshredded element
A further conclusion from a separate study conducted by the DTU shows thatthere are anaerobic mechanisms whereby CFCs can be largely broken down byenzymes and bacteria. This has the effect of restricting the ultimate release of CFCsto the atmosphere
These are important conclusions when considering the future role of landfillactivities in the management of CFC and HCFC containing foam. However, issuessuch as the identification of the breakdown products resulting from the anaerobicdegradation of the halocarbons needs to be addressed before this method ofapproach can be endorsed fully.
Of course, in the case of refrigerator cabinets, there is an even stronger argument forthe disposal of the cabinet in its manufactured form rather than in shredded orcrushed form, since in its manufactured form the rate of release in disposal will beno different to its rate of release in use. On the basis that the major issue influen-cing the recovery of the ozone layer is not specifically the total chlorine loadingemitted but the rate at which it is emitted, there is a school of thought whichsuggests that it is better not to disturb the CFCs in disposed foams unless and untilcost-effective techniques are available to recover the blowing agent without any riskof fugitive emission.
3.3.4 Direct Incineration (with energy recovery)
Direct incineration of foams is distinguished from other incineration options by thefact that, in the case of direct incineration techniques, no attempt is made toseparate the foam matrix from the blowing agent prior to incineration. There maybe some accidental separation in some facilities as pre-shredding takes place priorto feeding into the incinerator.
In the context of the Montreal Protocol, the destruction of blowing agents in thisdiffuse form has been less well studied than for concentrated and re-concentratedstreams of ODS. This has led to the TEAP Task Force on Destruction Techno-logies (TFDT) assigning a relatively cautious minimum Destruction and RemovalEfficiency (DRE) of 95% for qualifying processes. Even with such a low threshold,only two processes have been shown to meet the requirements � namely MunicipalSolid Waste Incineration and Rotary Kiln Incineration. These two stand out fromthe many other theoretical options because they have the ability to handle solid

46 April 2002 Task Force on Collection, Recovery, and Storage Report
waste streams. Reactor cracking facilities may also provide potential in future, butthere is little available data as yet on this process.
Despite the caution of the TFDT, work in Europe as early as 1993 indicated thatdestruction of diffuse CFC-11 in a Municipal Waste Incinerator was 99.95 ±0.04 % when processed in the temperature range of 800-1100 ºC. This comparedwith a destruction efficiency of 99.97 ± 0.03% for concentrated and re-concen-trated sources.
More recent studies such as that carried out at the Karlsruhe Facility (Tamara)used construction foams containing significant quantities of fire retardant todemonstrate the granulated foams up to 3% by weight of waste feed (30% byvolume) could be disposed of at a rate of 146 to 225 kg/hr. Destruction efficienciesfor other ODS were observed to augment the original 1993 data on CFC-11. Theresults showed that the CFC-12 DRE exceeded 99.9% at 900 ºC, while bothHCFC-22 and HCFC-142b achieved 99.99% levels at 850 ºC, reflecting the overalllower stability of the hydrogen containing ODS.
Primary?@crusher
Secondary?@crusher
Disman tling
CFC/HCFC( refrigerant)
oil
Compressor
Refrigerat ors(crushed?@chip)
Fluorocarbon blowing agen t wi th air
Polyurethaneform
OtherWasteRefrigerat ors
Incinerat orplan t
Rod?@and?@t ube?@mill
Primary?@crusher
Secondary?@crusher
Disman tling
CFC/HCFC( refrigerant)
oil
Compressor
Refrigerat ors(crushed?@chip)
Fluorocarbon blowing agen t wi th air
Polyurethaneform
OtherWasteRefrigerat orsRefrigerat ors
Incinerat orplan t
Rod?@and?@t ube?@mill
Figure 3-9: Direct Incineration from shredded foam
In Japan there is also considerable experience with rotary kiln incinerators, whichare often used destroy foam outputs from closed shredding units without priorseparation of blowing agent from the foam matrix. Figure 3-9 illustrates theprocess. Test reports on trials carried out in March 2000 by Matsushita

April 2002 Task Force on Collection, Recovery, and Storage Report 47
(Panasonic) and Dowa Mining Company show destruction levels of better than99.95%.
Direct incineration of complete refrigerators has been applied, both in the Nether-lands and in Denmark.
Recent information suggests that one facility in the Netherlands has ceasedprocessing refrigerators in this way because of the problems with slag build-up.Where the technique continues to be practiced (e.g. in Denmark), throughputs arekept at a low level.
In summary, therefore, direct incineration is seen as a viable method for thedestruction of foams and is particularly effective where the foam can be separatedfrom other components prior to incineration. Costs depend significantly on theavailable capacity for MSW incineration, but the technique can be highly compe-titive if the capacity is available.
3.3.5 Component Recovery and Recycling/Destruction
This method of handling foam waste has grown in technical integrity and environ-mental acceptability during the 1990s as the demand for high levels of materialrecycling has increased. This is particularly the case for domestic refrigeratorswhere the concentration of metals and other plastics is of significance to nationalrecycling targets. Indeed, in Japan, the current legislation demanding the componentrecovery from domestic appliances is driven by material recovery and recyclingtargets rather than by the management of ODS. Similar pressures are likely inEurope as the WEEE Directive is introduced within the next 2-3 years. A distinc-tion between the regions is that, in contrast with Europe, ODS recovery fromappliance foams in Japan remains voluntary. Nonetheless most responsible invest-ments already include the facility to recover the blowing agents. It is likely thatsuch recovery will become mandatory in Japan in the near future � at the very leastfor refrigerators and possibly even for building and construction waste. Such a stepwould be unique in the world, since most other regulators have viewed the econo-mics of recovery from buildings as, at best, marginal. The current EuropeanRegulation (2037/2000) which is viewed as progressive in this area only calls forthe mandatory recovery and disposal of ODS in domestic and commercialrefrigerators, leaving the recovery of blowing agents from building products onlyrequired �if practicable�. This phrase carries with it both technical and economicconnotations and provides an opt-out for most European Member States at thistime. However, the growth in use of pre-fabricated elements in building construc-tion could potentially increase the practicability of blowing agent recovery (andpossibly product re-use) over time. Accordingly, the mechanisms for collection andrecovery of building waste will become increasingly visible in the next 5-10 years.
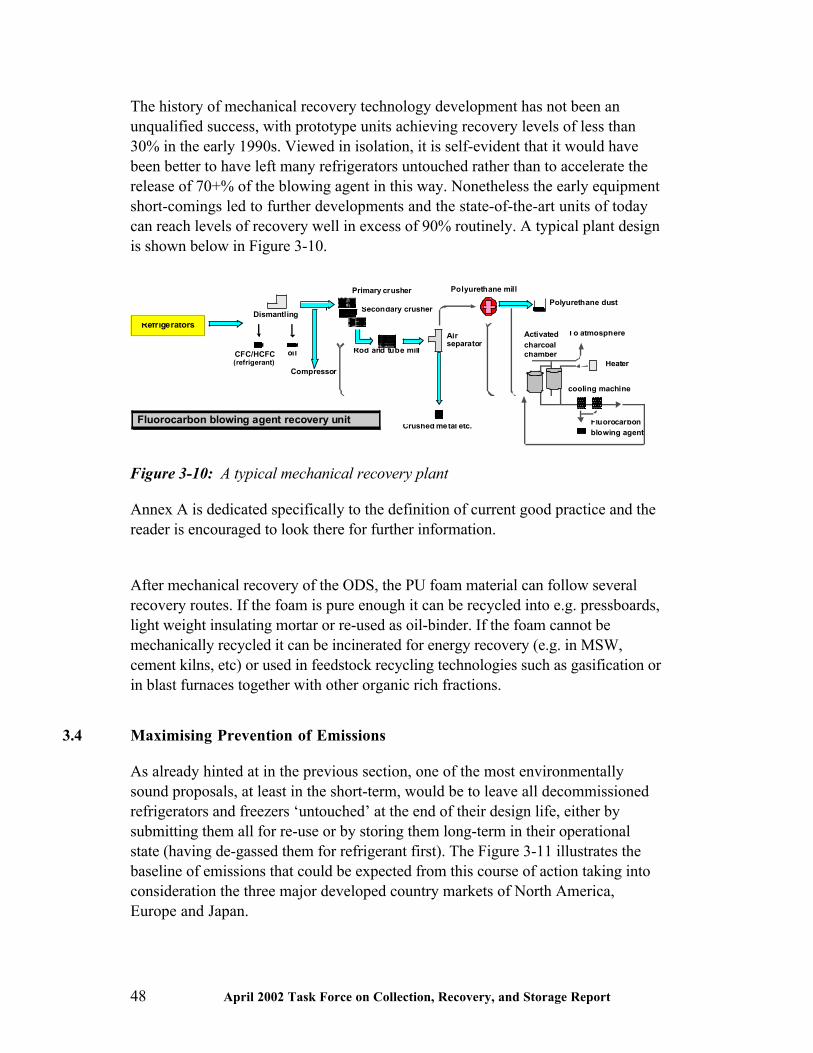
48 April 2002 Task Force on Collection, Recovery, and Storage Report
The history of mechanical recovery technology development has not been anunqualified success, with prototype units achieving recovery levels of less than30% in the early 1990s. Viewed in isolation, it is self-evident that it would havebeen better to have left many refrigerators untouched rather than to accelerate therelease of 70+% of the blowing agent in this way. Nonetheless the early equipmentshort-comings led to further developments and the state-of-the-art units of todaycan reach levels of recovery well in excess of 90% routinely. A typical plant designis shown below in Figure 3-10.
Primary crusher
Secondary crusher
Polyurethane mill Polyurethane dust
Dismantling
CFC/HCFC (refrigerant)
oil
Compressor
Crushed metal etc.
Fluorocarbon blowing agent recovery unit
Rod and tube mill
Air
separator Activated charcoal chamber
Fluorocarbon blowing agent
Heater
cooling machine
To atmosphere Refrigerators
Figure 3-10: A typical mechanical recovery plant
Annex A is dedicated specifically to the definition of current good practice and thereader is encouraged to look there for further information.
After mechanical recovery of the ODS, the PU foam material can follow severalrecovery routes. If the foam is pure enough it can be recycled into e.g. pressboards,light weight insulating mortar or re-used as oil-binder. If the foam cannot bemechanically recycled it can be incinerated for energy recovery (e.g. in MSW,cement kilns, etc) or used in feedstock recycling technologies such as gasification orin blast furnaces together with other organic rich fractions.
3.4 Maximising Prevention of Emissions
As already hinted at in the previous section, one of the most environmentallysound proposals, at least in the short-term, would be to leave all decommissionedrefrigerators and freezers �untouched� at the end of their design life, either bysubmitting them all for re-use or by storing them long-term in their operationalstate (having de-gassed them for refrigerant first). The Figure 3-11 illustrates thebaseline of emissions that could be expected from this course of action taking intoconsideration the three major developed country markets of North America,Europe and Japan.

April 2002 Task Force on Collection, Recovery, and Storage Report 49
CFC-11 Emissions - Appliances 'Leave Alone' option
0
200
400
600
800
1000
1200
1400
1600
1800
1960
1962
1964
1966
1968
1970
1972
1974
1976
1978
1980
1982
1984
1986
1988
1990
1992
1994
1996
1998
2000
2002
2004
2006
2008
2010
Year
CF
C-1
1 E
mit
ted
(to
nn
es)
JapanNorth America
Europe
Figure 3-11: On-going emissions from �leave alone� option
It can be seen that emissions of CFC-11 would be maintained below 1,000 tonnesper annum from here on, but that the rate of decrease of emissions would be slowand no ultimate reduction in emissions would result. This is in contrast with othermeasures that might slightly accelerate releases in the short-term, but reduce themin the medium to long-term. 100% mechanical recovery is a case in point, as shownin Figure 3-12.
CFC-11 Emissions - Appliances (100% Mechanical Recovery)
0
500
1000
1500
2000
2500
1960
1962
1964
1966
1968
1970
1972
1974
1976
1978
1980
1982
1984
1986
1988
1990
1992
1994
1996
1998
2000
2002
2004
2006
2008
2010
Year
CF
C-1
1 E
mit
ted
(to
nn
es)
Japan
North America
Europe
Figure 3-12: Emissions scenario for 100% mechanical recovery option
50 April 2002 Task Force on Collection, Recovery, and Storage Report
In this case, it can be seen that the emissions for the period 2000 to 2005 areincreased to around 1,500 tonnes per annum, but the benefit is shown after 2005when CFC-11 emissions reduce to levels well below 500 tonnes per annum withthe balance of the blowing agent being destroyed by incineration of the re-concentrate.
The effectiveness of landfill as an emission reduction option depends heavily onthe integrity of the foam being landfilled. In the case of a refrigerator, an in-tactcabinet will act in the same way as that considered in the �leave-alone� option. Ineffect, the landfill site is being used as a giant storage space for low-level releases.At its worst, landfill can lead to the accelerated release of blowing agent througheither accidental but severe damage to cabinets or by deliberate crushing and/orshredding of the units in order to save space. The work of the Danish TechnicalUniversity2 in this field is important because it revealed that emissions would beaccelerated substantially in shredded foams having lower particle size distribution.For the purposes of this review, any consideration of releases from landfill sourceshas considered that the split between the five particle ranges4 is distributed equally.This is undoubtedly an over-simplification and pessimists suggest that the particlesize range could be heavily skewed to the smaller components.
For direct incineration processes, much depends on the assumptions made for theDRE in the foam in the incineration step itself. The figure of 95% adopted as aminimum by the TFDT makes direct incineration appear less attractive than itprobably is. In addition, consideration has to be given to the way in which the foamis introduced into the incineration waste stream. Some sources suggest that thedisposal levels of refrigerator foam through incinerators are quite high (e.g. up to20% of total refrigerator disposal in the United States). However, if the refrige-rators are shredded in an open environment prior to incineration, the recovery anddestruction rates could be quite low. Further work is necessary to provide betterinformation in this area but, for the moment, this review assumes that directincineration processes involve the emission of 5-10% of available blowing agentduring processing (a probable best case scenario).
Having briefly compared the options, in isolation, we now have to acknowledgethat every region of the world operates a mix of these end-of-life strategies and thatthese strategies are, in many cases, still under development. The revised flow-chart(Figure 3-13)shows the Task Force�s best estimate of the current split of activity(i.e. in 2001) in the three main developed country regions. There is less informationfrom developing country sources at this time, but efforts are on-going in highpopulation areas such as Brazil and China to develop management strategies for
4 <4mm, 4-8mm, 8-16mm, 16-32mm & >32mm

April 2002 Task Force on Collection, Recovery, and Storage Report 51
refrigerators recently manufactured using CFCs and likely to be disposed of withinthe next 20 years.
Initial ODS'Footprint'
OEMProduct
Losses in OEMManufacture
Losses in usephase
End of design use
Secondaryuse
Inaccessible for collection
DirectIncineration
LandfillComponent recovery &
recycling
Metals Plastics Blowing Agents
PU Others
(abandonment)
Europe 20%
Europe 60%
Europe 5%
Europe 10%
Europe 5%
N. America 20%
N. America 55%
N. America 20%
N. America 0%
N. America 5%
Japan 20%
Japan 0%
Japan 5%
Japan 60%
Japan 15%
MunicipalWaste
Incinerators
Rotary KilnIncinerators
Others
Figure 3-13: Split of management strategies by region in 2001
Figure 3-13 reflects the situation immediately prior to the introduction of themandatory recovery requirement in the European Union and hence the split isexpected to change dramatically in the next 2-3 years. However, one of theproblems in making such a rapid transition is that, for some Member States, theconcept of recovery of blowing agents is quite new, while for others it has beenpractised for some time. No formal standards exist for recovery processes at this

52 April 2002 Task Force on Collection, Recovery, and Storage Report
time and one of the purposes of Annex �x� is to provide guidance for newinvestment in mechanical recovery processes, whether in Europe or elsewhere. Itmay be that similar documentation could be developed for other processes in time,including direct incineration and possibly even managed landfill � particularly if theearly work at the Danish Technical University on the possible amelioration ofCFCs by anaerobic degradation can be characterised and promoted in more depth.
As the strategies in various regions of the world further emerge, it will be possibleto predict the likely peaks in emission with more accuracy. For the moment, it isclear that the worst-case approach of 100% emissions at the end of design life is farfrom appropriate, even with a low level of emission minimisation measures inplace. Figure 3-14 shows the estimated combined emissions from CFC-11 inappliances from the three regions studied in detail. The effects of the measures inEurope and Japan can be clearly seen in the global assessment of �actual/projected�emissions.
Global Emissions Scenarios for CFC-11 from Refrigerators
0
5000
10000
15000
20000
25000
1960
1962
1964
1966
1968
1970
1972
1974
1976
1978
1980
1982
1984
1986
1988
1990
1992
1994
1996
1998
2000
2002
2004
2006
2008
2010
Year
CF
C-1
1 (t
on
nes
)
100% Mechanical Recovery
Actual/Projected
Worst Case
'Leave Alone'
Figure 3-14: Global emissions scenarios for CFC-11 from refrigerators
3.5 Forecast Material Flows
The implication of introducing additional mechanical recovery and direct incine-ration requirements into key regional markets will be to increase the flow of bothre-concentrated ODS and blowing agent containing foams to the existing incineratorstock. Although capacity considerations are considered more fully in the TFDTreport, the forecast flows can clearly be depicted from the models already created.Figure 3-15 illustrates the likely situation.

April 2002 Task Force on Collection, Recovery, and Storage Report 53
Global Recovery of CFC-11 from foam by Method
0
1000
2000
3000
4000
5000
6000
7000
8000
9000
1990 1991 1992 1993 1994 1995 1996 1997 1998 1999 2000 2001 2002 2003 2004 2005 2006 2007 2008 2009 2010
Year
CF
C-1
1 (t
on
nes
)
M echanical Recovery
Direct Foam Inc ineration
Figure 3-15: Expected global recovery of CFC-11 from foams by method
It should be noted that the bulk of this material is expected to come from the stockof domestic refrigeration units targeted by the existing legislation in both Europeand Japan. There will also be some flows from commercial refrigeration units inEurope, which are also included under Reg. 2037/2000. No significant allowance ismade, however, for recovery and destruction from existing building stock. As notedpreviously, this is primarily on the basis of the cost and practicality of recovery.The drivers in Japan could change if wider regulations were introduced coveringbuilding insulation. However, the economic implications of such a move wouldneed careful assessment prior to enactment.
Referring again to Figure 3-15, the direct foam incineration assessment may beover-stated because of the uncertainties surrounding the current practices in theUnited States. However, it is worth noting that 3,000 tonnes of CFC-11 wouldequate to ~850,000m3 of foam processed per year. The flow of re-concentratedmaterial from mechanical recovery alone is expected to reach 7,500-8,000 tonnesper annum at its peak in 2003. This is compared with the annual emissions for thesame stock in Figure 3-16.

54 April 2002 Task Force on Collection, Recovery, and Storage Report
CFC-11 recaptured/destroyed through Recovery Processes
0
2000
4000
6000
8000
10000
12000
1960
1962
1964
1966
1968
1970
1972
1974
1976
1978
1980
1982
1984
1986
1988
1990
1992
1994
1996
1998
2000
2002
2004
2006
2008
2010
Year
CF
C-1
1 (t
on
nes
) N. America - Direct Foam Incineration
Europe - Direct Foam Incinerat ion
Japan - Direct Foam Incineration
Japan - Mech. Recovery
N. America - Mech. Recovery
Europe - Mech. Recovery
Total Global Emissions
Figure 3-16: CFC-11 recaptured and/or destroyed through Recovery Processes
The absence of mechanical recovery processes in North America is striking in thisgraphic and there may need to be additional steps in this direction if significantfurther reductions in emissions are to be achieved. This presumes that techniquesto better manage landfills are not forthcoming.
3.6 Conclusions
The following conclusions can be drawn from this review of blowing agent recoveryoptions:
� Even without significant emission reduction measures, the actual andprojected emissions from installed foam stock are considerably lower thanassessed by assuming 100% emission at the end of design life (the worst casescenario)
� One of the best short-term options is to �leave well alone� but this isrecognised as impractical under normal waste management strategies
� Re-use of refrigerators has some advantages in terms of short-term emissionreduction but this can transport the final disposal problem to areas of theworld less equipped to manage it.
� Processes to recover foams must be engineered to a stringent minimumstandard in order to avoid accelerating short-term releases. Open processesfor the shredding and crushing of foams must be avoided.

April 2002 Task Force on Collection, Recovery, and Storage Report 55
� There is a need to better understand the current methods of disposal beingpractised in North America.
� Both direct incineration of foam granulate and full mechanical recoveryprocesses are well proven. Incineration is capable of extremely high ODSdestruction efficiency. Direct incineration of full refrigerator cabinets iscommercially practised but there are current shortfalls in the capacities andnumbers of Municipal Solid Waste Incinerators to handle significant numbersof refrigerators routinely.
� Once blowing agent extracted from foams is re-concentrated, it can be safelystored in order to overcome any short-term restrictions in destructioncapacity.
� The technical and economic practicality of recovering blowing agents fromfoams other than those contained in appliances is yet to be fully established.
It would seem useful to revisit this issue periodically in order to review the effectsof these and further strategy developments. Although a reduction of less than 5,000tonnes in annual emissions of CFC-11 might seem modest against a 50,000 tonnebaseline, it represents a saving in CO2 equivalent emissions of in excess of 8-10Mtons annually at a cost of $25-35 per tonne of CO2. This is clearly well withinthe range of investments being made elsewhere to mitigate climate change.


April 2002 Task Force on Collection, Recovery, and Storage Report 57
4 Halons
4.1 Introduction
Halons are used nearly exclusively in fire protection, only minor amounts are usedas refrigerants. Halons are halogenated hydrocarbons, first introduced into commer-cial use during the 1960s, which exhibit exceptional effectiveness in fire extingui-shing and explosion prevention and suppression. They are clean, electrically non-conductive, and leave no residue. Halon 1301 has proven safe for human exposureat concentrations sufficient for fire extinguishing. This unrivalled combination ofdesirable properties led to the selection of these agents for many fire protectionapplications. Halon 1211, a vaporising liquid at room temperature, has been widelyused in portable fire extinguishers, and to a lesser extent in fixed extinguishingsystems for unoccupied areas. Halon 1301, a gas at room temperature, has seenwidespread use in fixed systems throughout the industrial, commercial, marine,defence and aviation industries. Halon 2402, a low-boiling liquid, has primarilybeen used in the defence, industrial, marine, and aviation sectors in Russia and othercountries of the former Soviet Union.
As controlled substances under the Montreal protocol, the production of halons innon-Article 5(1) countries has been banned as of January 1, 1994. Production isstill allowed in article 5(1) Parties. Production in these countries is declining aswell. The only remaining major manufacturer, China, will halt its halon 1211 pro-duction in 2006, the 1301 production will cease in 2010 under the Chinese SectorPlan for Halon.
The experience in the management of halon varies throughout the world. Thereport draws on this variety and points to appropriate annexes for context.
4.2 Use Patterns and Halon Management
Fire extinguishing systems are overall emissive uses: They exhibit their desiredeffects through discharges in case of a fire. Released gases cannot be recovered oncethe systems have been activated to extinguish a fire. On the other hand it is ofoutmost importance, that the halon quantities in extinguishing system aremaintained at their design capacity, especially in fixed installations. The success ofan extinguishing attempt depends on the concentration achieved at the location ofthe fire. Halon based fire protection systems are still installed worldwide and arecarefully maintained. They are very important, as there are still applications, whereno alternatives as safely of secure as halons exist (e.g. oil and gas industry, airtransport, and military applications).

58 April 2002 Task Force on Collection, Recovery, and Storage Report
The 1994 halon phaseout was made possible by the fact, that these inventories canbe seen as a "halon-bank" to be drawn from. Over time this �banked� halon hasmigrated from applications with less critical uses to more critical uses. Thesechanging uses frees installed halons to be recycled and reused in other applicationswhere acceptable alternatives have yet to be developed. This is accomplished byrecovery and recycle. The extent of this shift has been reported by the HalonsTechnical Options Committee in their 1998 Assessment Report.
Management has been achieved through codes of practice developed with the fireprotection industry or by regulation to ensure the safe and environmentally soundtransfer of recovered halons. Halon banking programs have been established in mostcountries and halon emissions from normal operation have been cut drastically (see1998 Report of the Halons Technical Options Committee for details). Just a fewcases are documented here as examples.
4.2.1 Canada:
Environment Canada published the Environmental Code of Practice on Halons in1996, which specifies the following requirements with respect of halonmanagement in Canada:
� No release of halons except for fire fighting
� Mandatory reporting of halon release
� No new fire protection equipment containing halons
� Mandatory halon recovery
� Certification to service fire protection equipment
� No leak testing with halons
� No halon topping up of leaking fire protection equipment
� No non-refillable containers
� Mandatory labelling of fire protection equipment
� Mandatory plan to manage and eliminate halons
4.2.2 USA
Regulation of emissions are routed in the Clean Air Act amendments of 1990 andbacked by Industry Codes of Practice designed to minimise emissions. These ruleshave been supplemented by regulations restricted venting of halon and requirecertification of service technicians.

April 2002 Task Force on Collection, Recovery, and Storage Report 59
4.2.3 Australia
State/Territory legislation requires the licensing of technicians working with ODS,as well as the trade, ownership and disposal of ODS and prohibits the venting ofany ODS. The legislation in most States and Territories requires that halon fireprotection systems are decommissioned and the proper disposed of halon. Thereare special exemptions for agreed �essential uses�. An independent panel of expertsassesses the essential nature of halon applications. State and Territory authoritiesuse the panel�s decisions to guide the continued use of halon within their juris-dictions. The panel originally focused on industry sectors and more recently on thefew remaining agreed essential uses. These include light and commercial aviation,ocean going ships (for existing vessels only) and military applications.
4.2.4 Switzerland
Starting in 1992, Switzerland stopped all imports of halons and banned all newinstallations with the exception of critical installation in military vehicles, aircraftsor nuclear power plants. Furthermore, testing and training was banned at the sametime. Existing installations can still be recharged until the end of the year 2002.
All systems have to be serviced by qualified companies every 3 years. In addition,all systems have to be registered and owners have to report discharges, decom-missioning and eventual destruction of the ODS.
4.2.5 European Union
The European Union has been relying on regulations of their member states until2001. A mix of government regulations and industry codes of practice have beenapplied in the different countries. As of 1st October 2001, a new EU-regulationrequires all but critical use systems to be decommissioned before the end 2003.
4.3 Life Cycle for Halon Systems
The "halon bank" represents a very valuable asset, as such, procedures have beendeveloped to ensure safe collection and secure storage of recovered halons. Halonfire protection equipment, both fixed, total flooding installations and handheld ormobile extinguishers have to be serviced regularly to comply with local regulations.
Installers of clean-agent fire protection systems very often act as service providersas well. As such, during decommissioning of halon fire protection systems thehalon is normally recovered and re-deployed for applications where acceptablealternatives are not yet available.

60 April 2002 Task Force on Collection, Recovery, and Storage Report
The fire protection industries in many countries have developed similar approachesto a responsible management of the remaining halon uses. These approachesencompass education of users about the ozone depleting nature of the extinguishingas and the need to minimise emissions during the life of the fire protection systembut also of the obligation to recover and recycle/safely destroy surplus halon.
In the life cycle of halon systems losses of ODS can occur at several steps (seeFigure 4-1). Several countries have implemented licensing systems (based on Codesof Practice) to maintain the quality of the servicing companies and help owners ofsystems to obtain qualified support for their systems.
Production
Use
Manufacturing losses
ServiceService losses
Contaminated
Use losses- leakage- false discharge- fires
End of Usefull Life
Disposal
Storage
Collection
Reclamation Reclamation losses
Storage losses
Destruction losses
Product Disposal
Scrap
Recovery Recovery losses
Figure 4-1: Life cycle of halon installations
4.4 Collection
4.4.1 Fixed halon installations (halon 1301)
Fixed halon extinguishing systems represent a major asset in the risk managementportfolio of an enterprise. They are often well maintained and registered withservicing companies. As these companies very often act as extinguishant systemmanufacturers too, the collection and re-introduction of surplus halon into the usecycle is facilitated.

April 2002 Task Force on Collection, Recovery, and Storage Report 61
Halon 1301 is stored in pressurised cylinders with nitrogen added as an expellant.Pressurised cylinders can be dangerous devices if safe handling procedures areignored. In the case of halon systems, additional facts have to be taken intoaccount: To initiate a discharge, several systems exist for activation; includingexplosive actuation devices (squibs). The first step in collection of halons fromfixed installations is the de-activation of the system. This should only be done byqualified service personnel, as the dangers of incidental activation of releasemechanisms cannot be overestimated. Several severe incidents have been reported(see 1998 HTOC-report).
For detailed information on decommissioning of halon systems and the safehandling of cylinders seehttps://www.denix.osd.mil/denix/Public/News/DLA/Halon/hal1.html
Collection of halons from decommissioned systems has been very successful overthe past decade. As long as the extinguishing gas can be reclaimed and brought backinto other, more critical applications it represents a value and is treated accordingly.
4.4.2 Portable fire extinguishers(Halon 1211)
Portable extinguishers are a widely dispersed use. They are found in factories andoffice spaces, on board ships and aircraft but there is also a widespread domesticuse. Depending on country specific regulations the cylinders have to inspected andtested for pressure-security on regular intervals. However, the connection betweenmanufacturer and users may be much looser than in the case of fixed extinguishingsystems.
Collection of handheld extinguishers has proven to be rather difficult. Whereas largeorganisations or companies have developed fairly successful internal programs forcollecting extinguishers either for use on critical facilities or for subsequentdestruction, such programs involving the general public have been much lesssuccessful. In the USA for example, a program driven by an NGO (Friends of theEarth) has yielded disappointing results. Australia on the other side has been fairlysuccessful with its collection program in the early 90s. It appears to be of crucialimportance to establish adequate collection and storage programs and to provideadequate funding at the same time (see also TEAP Report 2001, Response toDecision XII/7)

62 April 2002 Task Force on Collection, Recovery, and Storage Report
4.5 Recovery and Reclamation
Recovery and reclamation activities for halons should only be done by instructedand qualified personnel. Care has to be taken to avoid accidents and to reducelosses of ODS to the absolute minimum.
4.5.1 Halon 1301from fixed Systems
Recovery and reclamation for halon are often done in a single step. As halon 1301cylinders are pressurised with nitrogen this has to be separated out in the process.The pressure can be relieved before decanting takes place, or as part of thedecanting process depending on the recovery process used. The gas mixtures haveto be cooled down to allow the halon to condense fully. Then the nitrogen can beblown off and the pressure is reduced. The remaining halon gas can now be cleanedby putting it through several filters that remove water, oil and other impurities.Cross contamination can be removed by secondary distillation. The resulting gas isnow, depending on the thoroughness of the process, brought back to the requiredspecifications. It is then stored under low pressure in large containers.
4.5.2 Halon 1211 from portable extinguishers
Halon 1211 extinguishers may contain nitrogen as a pressurising agent, althoughthis is not always the case as the vapour pressure is such as to allow operationwithout external overpressure. It can be decanted using standardised equipment andis subsequently stored in containers.
4.6 Storage
Halon is a gas at ambient temperature. For efficient storage it is condensed to aliquid phase (approx. 42 bar). It should be pure with no overpressure gassespresent. Total flooding system containers are not suitable for long-term storagebecause they contain nitrogen (or another overpressure gas) which need not bestored. Valves are prone to leakage and accidental breaks may produce severedamage to people and installations.
Long term storage requires emission controls. Control measures include routineweighing to verify the weight balance of the container; leak monitoring using halonsensors, fixed ground level sensors, liquid level detection. All these methods shouldinclude regular visual inspections to monitor the physical condition of thecontainers. Equipment and empty containers must be available to transfer productfrom any leaking container

April 2002 Task Force on Collection, Recovery, and Storage Report 63
Accurate inventory controls are essential to ensure the integrity of the monitoringregime.
4.7 Halon Inventories
For the past several years the HTOC has used a computer program to estimate thesize of the halon "bank" and the annual transfer of halon from less critical to morecritical applications. The computer program uses historic production data andestimated recovery and emission factors for halons. It is based on a steady stateflow of halon fire protection equipment reaching the end of its useful life, when thehalon is then recovered, recycled and reused for more critical and essential uses.
In the following table, estimated cumulative production, emissions and remaininginventories for halon 1301 are compiled for 5 regions of the world.
There is evidence that supplies of halon have been set aside and not declared byindustry and users. As time passes these stocks are drawn down for use. Thisundeclared use tends to mask the actual usage of halon.
Table 4-1: Global Halon 1301 inventory (in actual tonnes)
EuropeAustralia
Japan NorthAmerica
CEIT Art 5(1) Total
CumulativeProduction
30'661 20'444 51'102 8'199 35'259 145'665
CumulativeEmissions
21'071 10'152 35'861 5'312 27'817 100'213
ActualInventory
9'590 10'289 15'241 2'887 7'442 45'449
However, two events have recently taken place that have drastically changed thispattern. Firstly, the US Military established its own halon bank and has built areserve adequate for the expected life of critical equipment. This decision hasresulted in a much larger than expected flow of halon from existing installations intoa single bank. Secondly, the newly adopted EC-regulation that mandates thedecommissioning of all but critical halon system before the end of 2003 has resultedin a collapse of the market for recovered and recycled halons in Europe.
Taking these limitations into consideration, the HTOC plans to redesign the modeland hopes to present new future projections of the halon inventory in its 2002assessment report. However, the data for 2000 appear still to be valid.

64 April 2002 Task Force on Collection, Recovery, and Storage Report
Table 4-2: Global Halon 1211 inventory (in actual tonnes)
EuropeAustralia
Japan NorthAmerica
CEIT Art 5(1) Total
CumulativeProduction
68'969 9'853 59'117 10'893 137'305 286'137
CumulativeEmissions
44'095 5'731 37796 8'752 80'118 176'492
ActualInventory
24'874 4'121 21321 2'141 57'187 109'644
The total inventory of installed and stored halon in the world was estimated atroughly 780'000 ODP tonnes. The ODP of halon 1301 is 10 and for halon 1211 is3.
As explained earlier, the regulations in the European Union require earlydecommissioning of halon systems and the destruction of surplus halons. Thispolicy will certainly lead to a reduction of the inventory in Europe.
As of now, there is no quantitative information available on the effect of theimplementation of the measure.

April 2002 Task Force on Collection, Recovery, and Storage Report 65
5 Aerosols and MDIs
5.1 Non MDI Aerosols
Limited quantities of CFC containing aerosols are still produced in Article 5(1)parties; these aerosols are usually either industrial specialities or non-MDIpharmaceutical products. Like all aerosols these are totally emissive products andtherefore of little relevance to the TFCSR.
5.2 MDIs: Introductory notes
A unique situation exists with MDIs, which require Pharmaceutical-grade CFCs,which are produced under Good Manufacturing Practices with sufficient purity sothat they are acceptable to health regulatory authorities for use in human inhalationproducts. These regulations vary between countries. At the present time, four CFCproduction facilities all situated in the European Union, produce and supply CFC-11 and CFC-12 to pharmaceutical firms that manufacture CFC MDIs. Another unitin the USA produces CFC-114, but does not produce CFC-11 or CFC-12. Thesefacilities also export to Article 5(1) countries to meet their basic domestic needsincluding pharmaceutical use. Some facilities located in Article 5(1) countries alsoproduce pharmaceutical-grade CFCs which are used in these countries.
The largest manufacturer of pharmaceutical-grade CFCs announced the closure ofits factory in Netherlands by 2005. This factory is currently the only supplier ofpharmaceutical grade CFC-11and CFC-12 to the U.S. It is highly unlikely that theU.S. will have finished its transition out of CFC MDIs by 2005. Theoretically theU.S. can follow three different approaches, none of which are exclusive of theothers, to avoid running out of medication for its asthma and COPD patients:
� Seek alternate suppliers that meet FDA standards for pharmaceutical gradeCFCs, as there are others in producers in Europe and in Article 5(1) Parties.
� Seek FDA approval for the finished products (MDIs) and import them.
� Seek to set up enough storage of pharmaceutical- grade CFCs either in theUSA or at the EU or a combination of both.
5.3 Supply of pharmaceutical- grade CFCs
Currently, production of pharmaceutical-grade CFCs occurs on a campaign basis(meaning that a CFC production plant operates during a defined time period toproduce a specific quantity of pharmaceutical-grade CFCs for future use, afterwhich the facility is switched over to produce another product(s) or shut-downuntil further production of the desired CFCs is required).

66 April 2002 Task Force on Collection, Recovery, and Storage Report
If there were an unexpected failure, delay or quality problem in any of thesefactories (particularly in the largest facility) there could be supply problems. As aprotection against unexpected events MDI manufacturers around the worldcurrently keep CFC reserves, sometimes this represents up to one year ofproduction needs .
One particular concern at the beginning of the reformulation process was the possi-bility that there could be a few drugs that could prove impossible to reformulate asnon-CFC MDIs, and therefore require CFCs for a few years while alternativemedications were developed and approved. It will be important to see whetherthose countries, which are more advanced in the transition, face unexpecteddifficulties in reformulating all their MDIs. If this is not the case, then the concernfor a long-term storage (more than three or four years) is considerably reduced.
5.4 Storage requirements
If some storage were needed to assure supply of pharmaceutical-grade CFCs in theU.S., its size will depend on the cumulative requirements expected beyond 2005.Predicting the actual consumption of pharmaceutical CFCs after 2005 in the U.S. isdifficult as it depends of approval of new drugs (including non-MDI alternatives)by FDA and their acceptance by the users. In its 2001 report TEAP recognisedthat: �While the quantities of CFCs requested by non-Article 5(1) Parties for themanufacture of CFC MDIs has been reduced substantially over the past five years,it has proven to be extremely difficult to predict future requirements for CFCs.�
However, it seems likely that by 2005 the U.S. requirements for pharmaceutical-grade CFC should be less than 1000 metric tones. It is even harder to estimate forhow long CFCs will be required in the USA after 2005 and at which rate their usewill decline. It is not unreasonable to assume that up to 3000 metric tones of CFCscould be the total needed to meet the cumulative USA requirements beyond 2005to produce CFC MDIs, but there is also a risk that this figure could be too high. AsUSA MDI producers held an inventory of close to 2000 metric tones at the end of2001, a storage of this size should not pose great operative problems. It isimportant to stress that any excess CFC will have to be destroyed and the cost ofdestruction may need to be borne by the MDI manufacturer that requested itsproduction.
5.5 Recommendations
In its 2001 Report ATOC evaluated the merits of �Just-in-time supply� � definedas the supply of the quantity of CFC required by a MDI manufacturer to assurecontinuous production of CFC MDIs � against �Final Campaign Production�. This

April 2002 Task Force on Collection, Recovery, and Storage Report 67
approach requires that at a given point in time a stock is built up to meet the totalprojected CFC requirements for all future production of CFC MDIs. ATOCrecommended that Parties may wish to consider the following
Continue just-in-time supply for as long as possible;Any Final Campaign Production should be done preferably as late as possibleinto the transition;
Should a Final Campaign be needed in the future, and recognising that thiscould not be implemented quickly, the Parties may wish to consider changes tothe legal framework of the Montreal Protocol to facilitate Final CampaignProduction.
These legal issues that would need to be resolved if the Final Campaign Productionoption was chosen arise from the fact that this option not only involves theEssential Use Exemption process of the Montreal Protocol, which allows multipleyear requests, but also the current European Union system of granting ProductionLicenses. In this case, the European Union would have to allow a CFC producer tomanufacture in a given year (2005) the total amount requested for several years inthe future.
5.6 Experience with long term storage
Although the satisfactory storage of pharmaceutical-grade CFCs for extendedperiods, e.g. 3-5 years under controlled conditions appears possible, it is not clearthat some product would not be lost.
Stockpiles of CFCs are currently being held by a number of pharmaceuticalcompanies, and some of these companies have been using some stockpiled material.The material from the stockpiles for use has generally met specification and beensuitable for use. However, there have been a number of exceptions to this, whichlonger-term storage may only exacerbate. Problems include
Odour � This is one of the most persistent storage problems for pharmaceuticalCFCs, particularly for CFC-12, which can develop a strong odour onstorage. This makes it unsuitable for use in MDIs. There have beeninstances where substantial quantities of CFC 12 have �gone off� in thisway. It is sometimes possible to remove such odour by �polishing� it outwith adsorbents, but the approach is not reliable, and material �reworked�in this way may not be acceptable in countries with exactingpharmaceutical standards.
Related impurities � CFCs are chemically stable, and are unlikely to undergosignificant chemical change on storage. In recent years, analytical methods

68 April 2002 Task Force on Collection, Recovery, and Storage Report
(Gas Chromatography) have been developed to a very high level and arecurrently �state of the art�. There have been previous instances of CFCstockpiles effectively becoming out of specification on impurity contentduring storage. This has been attributed to the improvements in analyticaltechniques over the duration of the storage period and not to any change inthe material.
5.7 Disposal of unused MDIs
In the specific case of pharmaceutical aerosols, some MDI units may not beconsumed prior to their expiration dates. It is common practice that such expiredproducts will be collected and recovered by pharmaceutical companies. Technicallyit is possible to recover the propellants contained in these MDIs, but if CFCsproduced under the Essential Use Allowances were used to manufacture theseMDIs they cannot be recycled, but must be destroyed

April 2002 Task Force on Collection, Recovery, and Storage Report 69
6 Solvents
6.1 Introduction
Generally, most OD solvents are eventually emitted in both Article 5(1) and othercountries. A small quantity is destroyed, either deliberately or concomitantly withthe destruction of other products.
In some cases, the solvent can be recycled a number of times, but there is always anoverall loss of anything from 5 per cent up to 50 per cent at each recycling stage.There are 16 identified solvents sub-sectors and the possibilities of recovery andrecycling are different in each one. Furthermore, the economies of scale are veryimportant. The biggest problem is with the Small and Medium User (SMU), whererecovery and recycling are frequently almost impossible and certainlyuneconomical.
The recovery of solvents is often very costly. It therefore requires something morethan economic incentives to �sell� the idea. There have been a few �carrots� andsome �sticks� used to do this. These may be subsidies, larger allocations, freerecycling or sanctions against users who do not comply. This is often poorlyreceived by industry as all the methods involve some degree of bureaucracy. Itrequires both incentives and sanctions to apply successful measures but becauseeach sub-sector uses the solvents in different ways, there can be no general ruleapplicable to all. It therefore requires human skills to show each kind of user howhe can best co-operate.
6.2 The Recovery and Collection of Used Solvents
Very large users (say, more than 25 tonnes of recoverable solvents per year) willprobably have in-house collection and recycling and consequently have their ownmeans and methods. Smaller users (say, down to about 5 tonnes per year of carbontetrachloride or 1,1,1-trichloroethane or 1 tonne per year of CFC-113) willgenerally collect the used solvent in 200 litre drums for transport to an externalrecycler. Some recyclers insist on minimal quantities per batch, which may varyfrom one to four drums, so this should be considered. Drums used for storingsolvents prior to recycling should be in good condition and stored in coolconditions where an accidental leak or spill can be contained.
It is of prime importance to have separate drums for each type and blend of usedsolvent. Any mixture of used solvents cannot be economically recycled and must bedestroyed.

70 April 2002 Task Force on Collection, Recovery, and Storage Report
6.3 The Destruction of Used Solvents
Small quantities of pure solvents or solvent blends are not destroyed: it is muchmore usual to recycle them.
Solvents contaminated with, for example, radioactive waste or severely toxic andpersistent chemicals are destroyed according to the nature of the contaminant,rather than that of the solvent.
Most often, it is products contaminated with solvents that are destroyed. Forexample, after recycling (distillation) or use in a vapour-phase cleaning machine, the�bottoms� (the residue left at the bottom of the still or the machine) consists of,e.g., oil, grease, wax or resins, often mixed with solids, such as earth or sand. If it isa clean, light oil from a degreasing operation, the quantity of residual solvent maybe very small, less than two per cent. On the other hand, heavy greases, waxes andresins may need as much as 50 per cent solvents content to keep the bottoms liquidenough to handle.
These bottoms are mostly combustible, sometimes flammable, and are often addedto fuel oil used for calcining cement, up to one or two percent. There are twoproblems with such destruction: the generation of toxic and corrosive gases fromthe pyrolysis of the solvent and any heavy metal content, frequently found in stillbottoms. This implies that the kiln flue must be fitted with electrostaticprecipitators and scrubbers to capture the noxious compounds, so that they maybe treated as hazardous waste. To burn still bottoms without these precautionsmay be dangerous.
Unfortunately, it is much more usual to put the still bottoms into old oil drums andlandfill them. Within a short time, the steel will rust and perforate or the drum willbe crushed by the weight of vehicles and the contents will escape. The volatilesolvents will eventually percolate to the surface, where they will be emitted.
6.4 The Recycling of Used Solvents
As a rule, used solvents can be recycled by distillation. This requires expertknowledge because recycled solvents may not be as pure as virgin ones and maytherefore be more limited for critical applications. Good recyclers always analyseeach distilled batch to ensure that it meets minimal specifications for a givenapplication. The analysis should include composition, residual volatile and non-volatile impurities, stabiliser content etc. The recycled solvent can then becategorised as suitable for given applications. For example, poor quality recycledsolvents will be useful for gross cleaning of, say, engine blocks from earth-movingmachinery, whereas the best quality can be reserved for more critical applications.

April 2002 Task Force on Collection, Recovery, and Storage Report 71
Some critical applications may require only extra-pure virgin solvents, e.g.,laboratory analyses.
A distinction should be made between azeotropic and zeotropic blends duringrecovery.
6.4.1 Azeotropic blends
An azeotropic blend is a mixture of solvents whose vapour phase has the samecomposition as the liquid phase. An example is a blend of CFC-113 with about 6.1per cent of methanol, often used for defluxing. Theoretically, the distillate will havethe same composition as the original solvent, provided there is no water present.However, such blends frequently contain small quantities of water which willreduce the methanol content of the distillate, because a secondary azeotrope ofwater and methanol would remain in the still bottoms: this would mean that therecycler would need to add more methanol if the distillate were to be reused fordefluxing. Small quantities of stabilisers, such as nitromethane, are present in theoriginal solvent and the quantity in the distillate may be insufficient to ensure anadequate working life, requiring replenishment.
6.4.2 Zeotropic blends
A zeotropic blend is a mixture of solvents, which fractionates during distillation.Some of the fractions may be azeotropes and others single components. Oneexample is a mixture of 35% ethanol in CFC-113, also used for defluxing. Duringdistillation, the first fraction is an azeotropic blend of CFC-113 with 3.9 percentethanol and the second fraction is pure ethanol. In practice, only the first fraction isrecycled because it is not economical to recover the ethanol, which is highlyflammable, unless costly, special stills are used. If only the first fraction is distilled,the bottoms must be considered as flammable.
6.4.3 Purity of the distillate
Low-cost stills consist of a boiling sump and a condenser. The vapour is generatedclose to the heat source in the sump and bubbles rise through the liquid, where theyburst on reaching the surface of the liquid. The bursting bubbles project contami-nated liquid into the vapour zone and there is an exchange of solvent between thisliquid and the vapour. Some of the contaminant will reach the condenser and enterin the distillate. More sophisticated stills may reduce the quantity of contaminantin the distillate, sometimes to near-zero, by the use of various reflux techniques.Some such stills can also distill and separate all the fractions of zeotropes. Thepurity of the distillate is a function of the still design.

72 April 2002 Task Force on Collection, Recovery, and Storage Report
It should be noted that reflux stills are less energy-efficient (i.e., the quantity ofdistillate recovered per kWh of energy used is lower), potentially contributing toclimate change where the primary energy source is derived from fossil fuels.
6.5 Choice of External Recycler
Some recycling companies have �high-tech� facilities with correctly equippedanalytical laboratories. They also ensure that environmental and health and safetyregulations are respected. Their distillates, meeting given specifications, are usuallysold at prices between 75 and 95 percent of that of virgin solvents, often withminimal profit margins.
Other companies have a simple alembic, no laboratory and do not respect theregulations. The quality of their distillates is often very mediocre, with little or nostabilisation. Although they may be cheaper to buy, these solvents may be morecostly to use, even for gross degreasing, because excess acids may damage theequipment or the parts being cleaned. This kind of recycler is more profitable.
A major contribution to the cost of recycling is the transport of used solvents anddistillate. Some recyclers make regular collection and delivery rounds, say, once permonth to each district, to minimise these costs (and the consequent emission ofgreenhouse gases).
It is recommended that solvents users choose carefully their recycler, where achoice is possible, preferably with a visit to the facility, to ensure that the qualityof the recycled solvent meets their requirements and that the price of the recycledsolvent is proportional to the quality.
6.6 Major Sub-sectors
6.6.1 Electronics defluxing
This is usually done either by vapour-phase cleaning with CFC-113 or coldcleaning with 1,1,1-trichloroethane, though there are no sharp distinctions. Themajor problem of recovery and recycling is that the still bottoms are essentiallywood rosin, some fluxing chemicals and by-products, including toxic heavy metalsalts and a large percentage of solvent to maintain the residues liquid.
Because of the complex geometry of the parts, the drag-out of solvent or its vapourin the workshop may be considerable. Active carbon filters in the exhaustventilation system may theoretically recover this, but it is not economically viableunless the emissions are several tens of tonnes of single solvents per year.

April 2002 Task Force on Collection, Recovery, and Storage Report 73
Cold cleaning produces larger quantities of solvent for recycling because theprocess does not incorporate inbuilt purification, as does vapour-phase cleaning.
6.6.2 Precision cleaning
By definition, much precision cleaning cannot be done with recycled solvents.However, the used solvents are usually of excellent quality for recycling. Thisparadox can often be overcome by using recycled solvent for the earlier, less criticalprocesses in the production line, reserving the virgin solvent for the final stages.
There is one application within this sub-sector that requires special mention: thegrinding and polishing of optical components. This process uses a heavy wax tohold the components onto the jigs and 1,1,1-trichloroethane is often used for bothremoving the wax and any residues from the diamond pastes and slurries. Recycledsolvents are good for the dewaxing and cleaning, but may leave �drying spots� orother residues. This may be overcome by having a second, small, vapour degreaserwith virgin solvent by the main machine, with a transfer of the parts from the mainmachine to just the vapour zone of the second machine to ensure spot-free optics.
6.6.3 Metal cleaning
It is usually possible to use recycled solvents for all forms of metal cleaning,whether vapour phase or cold cleaning. The general remarks otherwise applicable todefluxing are also applicable to this sub-sector.
Some metal cleaning is done by hand-wiping. It is unlikely that there will be anysignificant recovery possible, although recycled solvents are usable for this, in mostcases.
6.6.4 Dry cleaning
Dry cleaning may use well-recycled carbon tetrachloride, CFC-113 or 1,1,1-trichlo-roethane. Some additives specific to this sub-sector may be needed. The stillbottoms from the machines would be insufficient in volume to justify recoveryfrom small enterprises, unless the solvents recyclers specifically collected them ona routine round and �averaged� them with similar small amounts from a plurality ofshops.
6.6.5 Adhesives and coatings
These applications are usually totally emissive and the users do not purchase thesolvents as such. Whether the product manufacturers can use recycled solvents ornot can only be judged by themselves. Very large users may use extraction systemswith active carbon filters to reduce emissions. The filters would require regene-ration with superheated steam either in situ or at a plant of a specialist third party,

74 April 2002 Task Force on Collection, Recovery, and Storage Report
depending on the type of installation. However, the condensate from this regene-ration could be recycled only if all the products used in the plant were composedwith the same solvent. Otherwise, they would need to be destroyed.
6.6.6 Oxygen systems and heat exchangers
This is a specialist form of metal cleaning, where the solvent is pumped along metaltubing, which is then dried with hot air or gas. Oxygen systems need to be cleanedof any trace of organic products to eliminate the risk of explosion. Only virginsolvents are admissible for the final rinse, although recycled solvents may beusable, subject to specifications for the first clean. The solvent can be recovered forrecycling for other applications. This is a lossy operation and emissions are great.For heat exchangers, the operation is similar although less critical but care must betaken for compatibility if recycled solvents are used for aluminium or light alloyexchangers.
6.6.7 Aerosol spraying of solvents
This is usually a totally emissive sub-sector with no possibility for recovery orrecycling. Because the can fillers cannot judge what their products will be used for,their professional ethics would dictate their using only virgin solvents.

April 2002 Task Force on Collection, Recovery, and Storage Report 75
7 Methyl Bromide
7.1 General scope of use
Methyl bromide is used as a fumigant against a wide spectrum of pests, includingpathogens (fungi, bacteria and soil-borne viruses), insects, mites, nematodes androdents. These pests may be in soil, in durable or perishable commodities or instructures and transportation vehicles.
It has features that make it a versatile and convenient material for several specia-lised applications. As a fumigant, it is quite penetrative, thus reaching pests in soil,commodities and structures often at a considerable distance from the applicationpoint and inaccessible to many other control measures (e.g. contact insecticides,fungicides and nematicides of low volatility). Also, it is active against most pests atlow concentrations, though there is a broad range of susceptibility. Exposures forcommodity and space treatments typically range from an hour up to 2 days withconcentrations ranging from 10 to 150 g m-3 and, for soils, some days withapplication rates of 20 to 100 g m-2. Exposure periods and concentrations usedtypically are varied within these ranges depending on system under treatment,target pest, and quarantine, contractual and other specifications and regulations.Further details of its scope of application and reasons for preferred use can befound in the MBTOC Assessment Reports.
7.2 Supply and storage of methyl bromide
Methyl bromide has a boiling point of 4oC. It is normally supplied and transportedas a liquid in pressurised steel cylinders or cans. Typically the cylinders used rangein size from 10 kg to 200 kg capacity. There is also trade in larger cylinders of up to18 t capacity and in small disposable steel cans, typically of 0.4 - 1 kg capacity. Ingeneral, use of these small cans is restricted to some Article 5(1) countries, and hasbeen discontinued in developed countries.
Methyl bromide is usually applied directly from the cans or cylinders in which it istransported, though it may also be decanted from large cylinders from which it isthen directly applied. Decanting is not permitted in some countries.
Fumigant grade methyl bromide is typically stored indefinitely in the containers inwhich it is normally supplied and transported. As pure methyl bromide, it is stableindefinitely, though the cylinders and cans require protection from excessivemoisture in storage. Moisture can cause rusting, rendering the cans or cylindersunsafe. In severe cases this can lead to rupture or leakage of the fumigant. Impuremethyl bromide containing moisture on charging the cylinders may turn brownish in

76 April 2002 Task Force on Collection, Recovery, and Storage Report
storage with formation of HBr and di-methyl ether with corrosion risk from theHBr.5
It is not uncommon to encounter cylinders of methyl bromide that have been heldfor several years close to the end of the methyl bromide supply chain. However,this is likely to be only a small fraction of the methyl bromide annual consumption.Most methyl bromide is consumed within a year or so of manufacture. At present,there is no �bank� of unused methyl bromide, though there is potential for somestockpiling as phaseout approaches. This is constrained by lack of supply, sinceProtocol control measures on production and consumption limit the material nowavailable for stockpiling.
7.3 Use processes
7.3.1 Manual application to soils
Two types of process are used for manual application to soils � direct applicationand the �hot gas� process. In the 'hot gas' method, liquid MB from cylinders underpressure is vaporised in a vaporising device (heat exchanger) and then introducedunder a plastic cover laid over the soil area to be treated, to retain the gas during theexposure period.
Worldwide, outside USA, this is the principal method of application and almostexclusively the only method used in fumigating soil in greenhouses (glass andplastic houses). In many countries, this method is widely used also for outdoorfumigations. In some situations, field fumigation is carried out with mulched strips(strip fumigation) of 0.80 - 1.20m wide, instead of completely sheeting the treatedarea.
When applied from small steel cans of less than 1 kg capacity, the methyl bromideis not normally vaporised, but discharged directly as a liquid from the can under itsown pressure using a special dispenser. This can be done so as to release methylbromide under the plastic cover without damage to the cover.
Methyl bromide may be supplied as a mixture containing 2% chloropicrin (added asa warning agent) when used for manual application.
5 Note: Principal risk from leakage is toxicity

April 2002 Task Force on Collection, Recovery, and Storage Report 77
7.3.2 Mechanised injection to soils
In this method, MB from cylinders is applied by injecting the fumigant to a depthof around 20 cm into the soil (shallow injection). The treated area is simultaneouslycovered by plastic sheeting to restrict gas loss. The process is normally carried outas a broad-acre fumigation where one sheet is glued to the previous one. However,some application is done under strips of plastic, with the edges of the strips buriedby the machinery in the soil.
Another system of mechanised injection is deep placement (approx. 80 cm) of thefumigant without covering the area with plastic sheets, though the soil surface maybe compacted to attempt to restrict gas loss. The deep injection of MB is carriedout mainly prior to planting and replanting in deciduous orchards, vineyards andother plantations, mainly in U.S.A.
Mechanised injection is carried out with outdoor fumigation only, and is thedominant method in U.S.A. It is also used in some European countries, Israel,Australia and South Africa.
A variety of mixtures of MB and chloropicrin are increasingly used in this type offumigation. Use of such mixtures is allows continued fumigation practice whilereducing consumption of MB to meed Protocol requirements. Mixtures of up to75% chloropicrin are in use.
7.3.3 Application to commodities, structures and transport
Methyl bromide is typically applied by the �hot gas� process. The methylbromide, as a liquid from the supply cylinder, is passed through a heated vaporiser(heat exchanger) which vaporises the fumigant before it is applied through suitablyperforated distribution pipes, laid out in such a way as to facilitate good distri-bution. In best practice, the mixing of the fumigant is further assisted by forcedrecirculation or with a fan within the fumigation enclosure.
More rarely, methyl bromide applied directly from the cylinder through a narrowbore application line (or series of lines) culminating in an atomising jet or series ofjets which are designed to enhance the speed of vaporisation of the fumigant. Therate at which the liquid fumigant becomes a vapour is largely dependent on theambient air temperature. These lines and jets are laid out either on top of thecommodity, or throughout the structure to try to ensure an even distribution offumigant
For commodity treatments, the enclosures vary from gastight purpose builtfumigation chambers (portable and fixed) to very poorly sealed bagged stacks. Inbetween these extremes, are ship's holds (sometimes very gas tight, but not

78 April 2002 Task Force on Collection, Recovery, and Storage Report
always), freight containers (often not very gas tight), and well sealed, sheetedbagged stacks (can be very gas tight). The level of sealing has an important effect onthe retention of the gas during the fumigation, as thus the proportion of the methylbromide applied that is subsequently available for recapture.
In the case of treatment of structures, the gastightness varies from aircraft(sometimes very gastight), ship's holds, modern food factories and mills (can bevery gastight) to older buildings such as many flour mills (often not very gastightand, in many cases, expensive to make more than partially gastight).
In most countries, commodity and structural treatments are carried out with 100%methyl bromide formulations, superseding the formulation that contained 2%chloropicrin as a warning agent.
7.4 Estimates of quantities of methyl bromide recoverable after use
Estimates of the proportion of the applied methyl bromide released into theatmosphere from fumigation vary widely. Part of this variation is a true variationreflecting the wide variety of soils, commodities and structures treated with methylbromide, and part is a variation in opinion amongst experts as to the mostappropriate figures to use to best reflect the average proportion emitted. Good dataon the fraction of methyl bromide emitted by particular treatments is very scarce orabsent.
During any fumigation operation there are three distinct opportunities for methylbromide to be emitted to the atmosphere:
� by inadvertent leakage during the actual fumigation treatment.
� during venting of the fumigation space immediately after fumigation orremoval of the cover sheets when a deliberate discharge to the atmospheretake place.
� following treatment, when the treated soil, commodity or structure slowlyemits any sorbed methyl bromide.
Practically, the scope for recovery of methyl bromide after fumigations is likely tobe restricted to treatments carried out in enclosures i.e. space fumigations ofcommodities, structures and transport. At this time no system for recovery ofmethyl bromide from soil fumigation has been commercialised and there appears tobe no system at an advanced developmental stage. Furthermore, since the phaseoutof methyl bromide for soil uses in non-Article 5(1) is imminent (2005), suchsystems are unlikely to be developed.

April 2002 Task Force on Collection, Recovery, and Storage Report 79
Best practice for commodities, transport and structural uses require treatments tobe carried out in well sealed systems, limiting leakage and thus maximising thefraction of the methyl bromide initially applied that is theoretically available forrecapture. Leakage rates from well sealed rigid enclosures are typically <10% d-1
and optimally <5% d-1. This leakage limits the total methyl bromide available forrecapture (exposures range from 2-48 hours in general for commodity and structuraltreatments - the exposure period being commodity and situation dependent).
The availability of methyl bromide for recapture is also limited by the reactivity ofthe methyl bromide with the treated commodity, associated packaging and dunnageand with the fabric of the fumigation enclosure. It is not unusual to lose most of themethyl bromide applied (>80%) from reaction in some of the more reactivecommodities that may be fumigated (e.g. oilseed meals)6.
A further constraint on recapture is the reversible sorption of methyl bromide ontreated commodities. Methyl bromide is taken up by physical sorption includingadsorption and dissolution in fats and also by reversible chemical bonding. Thissorption reduces the free space concentration resulting from a dosage of methylbromide. Because desorption can be slow and rate limited by diffusion, recapture ofa high percentage of the methyl bromide remaining after a fumigation can be a slowprocess. Removal of methyl bromide down to workspace and health maximumlimits in air, typically 5 ppm v/v or less, may take 3 or more days from treatedgrains or timber.
For 1998 usage patterns, MBTOC (1998) estimated the proportions of appliedMB eventually emitted to the atmosphere to be 31 - 88%, 85 - 95%, 69 � 79% and90 - 95% of applied dosage for soil, perishable commodities, durable commoditiesand structural treatments respectively. These figures, weighted for proportion ofuse and particular treatments, correspond to a range of 43 - 87% overall emissionfrom agricultural and related uses, with a best estimate of overall emissions of 73%.Since 1998, the proportion of methyl bromide used in soil applications has fallen,in response to control measures under the Protocol for non-Article 5(1) countries,while both the proportion and absolute tonnage used in perishables and QPS ondurables has risen.
With current control schedules and lack of systems for recapture from soil appli-cations, the scope for recovery of methyl bromide is limited to space fumigations inArticle 5 countries, and those space fumigations exempt from phaseout in non-Article 5(1) countries. MBTOC (1998, p. 308) gave a range of estimated emissionsfrom these applications as 51-95% of applied material. This suggests a potential
6 Other fumigants may be more appropriate, but methyl bromide may be used from tradition orbecause of specification by buyers

80 April 2002 Task Force on Collection, Recovery, and Storage Report
recovery overall of around 86%, range 81-91%, applied (weighted mean of figuresgiven for space fumigations (durables, structural and perishables) given in MBTOC(1998, Table 9.1).
The potential recoverable estimate of 86% includes methyl bromide lost by leakageduring the fumigation period and all of the desorbable fumigant. In practice someleakage is inevitable and the time required for total desorption may be excessive. Onthe basis that 15% (10% loss from leakage, 6% residual material and otherinefficiencies) of the potentially recoverable material is not recoverable in practice,it is estimated that 70% of applied material can be recovered from the spacefumigations referred to above.
In 1998, total space treatments in Article 5(1) countries were estimated to beapproximately 5,290 tonnes, while QPS uses in non-A5 have been estimated atabout 7,998 � 11190 tonnes, giving a total of 13,288 � 16480 tonnes. On the basisof 70% recapturable methyl bromide, this corresponds to an emission of approxi-mately 9.300 � 11.535 tonnes that could be reduced or prevented.
7.5 Collection and reclamation of methyl bromide for reuse
The use process for methyl bromide is such that collection of methyl bromide inconcentrated form is unlikely to occur. Methyl bromide is intentionally dischargeddirectly from supply containers into air and is not normally used as a concentratedfluid contained within a system. However, it is feasible, technically, to recapturemethyl bromide from the dilute streams resulting after a fumigation is complete andthen to reclaim the pure material.
At this time the cost of reclamation of methyl bromide for reuse is substantialcompared with the cost of new material, and reclamation is in use in only a veryfew, specialised plants. The systems have been installed to meet local environ-mental standards, not for ozone-protection reasons.
Two processes have been demonstrated commercially � sorption on a zeolite, anddirect condensation. Both require substantial capital investment. Additionally, it ispossible to desorb and reclaim methyl bromide after recapture on activated carbon.These processes are described further in MBTOC (1998).
An issue with these processes, and any other aimed at recycling MB, is whetherthe recovered MB is sufficiently pure to be able to be reused as �pure MB� tocomply with the specifications for fumigant use, particularly established quarantineschedules. Also it may not meet the labelling requirements of individual countries,including approval by the original manufacturer.

April 2002 Task Force on Collection, Recovery, and Storage Report 81
Some fixed fumigation installations have provision of transferring remaining methylbromide in dilute form to another chamber, with top up with methyl bromide fromconcentrate (i.e. cylinders) to reach target fumigant concentrations. Scope for thistype of reuse is limited principally to the few fixed facilities that conduct manyfumigations in succession.
As a result of lack of supply of recycled material, it is most unlikely that theinterim needs of Article 5(1) countries for MB can be met even in part by �banks�of recycled material. At this time, trade in recycled methyl bromide is not an issueof concern, again due to the lack of recycled material.
7.6 Destruction technologies
Destruction of unused methyl bromide. Presumably technologies suited to destruc-tion of CFCs and volatile halons are also suited to destruction of unused methylbromide, itself correctly described as halon 1001. To the knowledge of TEAP, thishas not been tested specifically. There is also potential to use unwanted methylbromide in non-A5 countries for domestic needs of A5 or for QPS purposes innon-A5.
Destruction of methyl bromide after use. Three systems are in commercial use fordestruction of methyl bromide in dilute form after fumigations are complete.
Recapture on activated charcoal followed by incineration or catalytic destruction. Aprocess recently developed in the USA uses activated carbon to capture MBfollowed by thermal destruction. The intention of developers has been to provide asupply and disposal service by transporting the MB-laden carbon to a centralprocessing site where it would be reprocessed or destroyed (Knapp et al. 1998,Leesch et al. 2000). A small commercial unit is in operation at Dallas/Fort Worthairport capturing MB from quarantine operations (McAllister and Knapp 1999)and a larger unit is now operating at a commercial berry fruit exporter�s site inWatsonville, California (Knapp (2001). Both plants reduce the MB concentrationin the fumigation chambers down to a level of 500 ppm before venting theremainder. Once each plant has processed sufficient MB to fully load the activatedcarbon beds, they are shipped to Pennsylvania to be incinerated. Preliminary datasuggested that in excess of 95% of the MB being vented could be removed. Afterallowing for MB lost by adsorption into the commodities being fumigated, theWatsonville plant has achieved a recovery of 80% of the original dose applied.
One of the critical features of this process is the environmental impact (truck fuel,energy use) of transporting equipment containing the activated carbon bedssaturated with MB over some distance to the reprocessing or destruction plant.While it may be feasible to consider this technology in the continental USA and

82 April 2002 Task Force on Collection, Recovery, and Storage Report
other areas where quarantine treatments are concentrated, it is unlikely to be costeffective in other parts of the world.
There is present research in Japan on the catalytic decomposition of MB. Promi-sing recent results from using new Mn/Cu-zeolites indicate that satisfactory levelsof destruction can be obtained at lower temperatures than previously achieved andthe production of CO will be minimised. This research is still at an early stage ofdevelopment.
New research from Japan has been reported in which MB that has been previouslycaptured on activated carbon or zeolite is introduced to a reactor heated to 400 �500 oC and decomposed with CaO to inorganic salts (Yahata, Tsuchiya and Toba(2001)). A bench scale apparatus has been described that gave MB concentrationreductions of 99.99%.
Recapture on activated charcoal followed by destruction by chemical reagent.Recovery and destruction systems are now being sold based on MB capture fromfumigation operations using activated carbon followed by direct destruction of thesorbed MB by treatment of the carbon with aqueous sodium thiosulphate solution(Nordiko 2001). Commercial units have been installed in the ports of Hobart andMelbourne in Australia. Some recovery/destruction units are designed to be clip-onunits for fixed or container-based fumigation installations and are completely self-contained. The spent carbon can be regenerated for reuse by rinsing with water anddrying with air at 40oC.
Detailed recovery data for this process has not been published but is said to behigh.
Mixing with ozone. A plant using ozone to destroy methyl bromide was installedin 1996 at a fumigation facility in California, USA. The facility is used for importand export fumigation of a variety of commodities. Ozone is added to the dischargeand air washes from the vacuum fumigation chambers to destroy the most of theMB present. Activated carbon is used to scrub any residual traces of MB from thedischarge air stream. Results from two monitored trials indicated that in excess of90% of MB used was destroyed.
In addition to the destruction technologies noted above, there have been severalattempts to remove methyl bromide from fumigation enclosures post-treatmentusing reactive liquid scrubbing, usually amines such as mono-ethanolamine. Theseare discussed further in MBTOC (1995, 1998).

April 2002 Task Force on Collection, Recovery, and Storage Report 83
7.7 References
Knapp G. (2001) Commercial methyl bromide recapture. Annual InternationalResearch Conference on Methyl Bromide Alternatives and EmissionsReductions. San Diego, Nov. 5 � 9, 2001. Paper 116
Knapp G. F., McAllister D. L. and Leesch G. J. (1998) Methyl bromide recovery.Annual International Research Conference on Methyl Bromide Alternativesand Emissions Reductions. Orlando, Dec. 7 � 9, 1998. Paper 58.
Leesch J. G., Knapp G. F. and Mackey B. E. (2000). Methyl bromide adsorptionon activated carbon to control emissions from commodity fumigations.Journal of Stored Product Research, 36, 65-74.
MBTOC (1995) 1994 Report of the Methyl Bromide Technical OptionsCommittee. 1995 Assessment. (J. Banks, co-ordinator). UNEP, Nairobi.
MBTOC (1998) Report of the Methyl Bromide Technical Options Committee.1998 Assessment of Alternatives to Methyl Bromide. (T. Batchelor, co-ordinator). UNEP, Nairobi.
McAllister D. L. and Knapp G. F. (1999) A commercial recapture system formethyl bromide at Dallas/Ft. Worth International Airport. AnnualInternational Research Conference on Methyl Bromide Alternatives andEmissions Reductions. San Diego, Nov. 1 � 4, 1999. Paper 56.
Nordiko (2001) Nordiko Quarantine Systems. http://www.nordiko.com.au/
Yahata T., Tsuchiya Y. and Toba M. (2001) Development of emissions reducingmethod and apparatus for volatile organic halides. Annual InternationalResearch Conference on Methyl Bromide Alternatives and EmissionsReductions. San Diego, Nov. 5 � 9, 2001. Paper 119.


April 2002 Task Force on Collection, Recovery, and Storage Report 85
8 Transportation Regulation
8.1 Dangerous Goods Regulation
The United Nations Transportation of Dangerous Good Model Regulations wereprepared as guidance for the development of national regulations. The ModelRegulations regulate the classification, documentation, safety marks, means ofcontainment, training, emergency response, and reporting requirements for safetytransport and accidental release of dangerous goods. According to the ModelRegulations, an ODS is classified as a dangerous good (or a commodity), Class 2.2,compressed gas, non-flammable and non-toxic material. Shipment of the materialrequires a shipping document, not a waste manifest.
There are three major categories of ODS,
� low pressure CFCs,
� high pressure CFCs and halons and
� toxic substances such as methyl Chloroform and Methyl Bromide).
Low pressure CFCs that are liquids at room temperature (e.g., R-11, R-113 and R-123) are not specifically controlled by the Model Regulations. Such ODS may bestored and handled in regular drums with adequate labelling as per normalcommercial practices, similar to the containers and labelling procedures used whenpurchasing the virgin or reclaimed product. They may be transported without anyspecific manifesting requirements.
High pressure CFCs and halons that are compressed gases at room temperature(e.g., R-12, R-22, R-114, R-500, R-502, and halons 1211 and 1301) are consideredas dangerous goods under the Model Regulations. Specifically, they are consideredeither Class 2.2 compressed gases (non-flammable, non-toxic) The toxic substancesare classed under 2.3 for MeBr and or Class 6.1 for toxic substances.
The Model Regulations describe the specific requirements for cylinders that maybe used to contain the ODS. Cylinders to be used for containing, storing, andtransporting CFCs and halons that are compressed gases must meet the appro-priate pressure rating. The pressure rating for most CFCs is typically 260-400pounds per square inch (psi), and the pressure rating for R-13 is 1800 psi. R-13 isa refrigerant that is used for very low temperature in special applications.
8.2 Labelling
The safe transportation of goods requires that Dangerous Goods be identified. Astandard label must be placed on each individual container and on external
86 April 2002 Task Force on Collection, Recovery, and Storage Report
packaging to indicate the contents. For class 2.2 materials the label is a greendiamond shape marked with a gas cylinder graphic and the numbers 2.2.
8.3 Shipping documents
The Dangerous Goods transport documents should include a certification ordeclaration that the consignment is acceptable for transport and that the goods areproperly packaged, marked and labelled. Emergency response information is alsoto be provided. This can be in the form of a material data sheet, notation in thetransport document or contact telephone number depending on the nationalregulations applicable.
The International Civil Aviation Organisation and the International MaritimeOrganisation require specialised information sets to accompany any shipment ofdangerous goods.

April 2002 Task Force on Collection, Recovery, and Storage Report 87
9 The Basel Convention
9.1 History and Basic Principles
The Basel Convention was adopted in 1989 as an international initiative to imple-ment and control the treatment and disposal of hazardous wastes. The Conventionwas organised to attempt to minimise transboundary movement and the generationof hazardous wastes. As of March 2002, 150 Parties from five world regions haveratified the Convention.7 The Parties agreed to manage the transport and disposalof specified chemicals in an environmentally sound manner, as decreed by theConvention.
There are 3 overarching principles for operating under the Basel Convention:
1. Minimise hazardous waste generation
2. Treat and dispose of waste in its country of origin
3. Minimise transboundary hazardous waste shipments, but if necessary movewaste to a place it can be disposed of in a manner consistent withenvironmentally sound management (ESM) principles.
In addition to disposing of materials in a way that is protective of the environment,the treaty requires basic safety documentation such as manifests and approvalsfrom disposal facilities in advance of waste arriving for disposal.
9.2 Control of ODS under the Basel Convention
Under the Basel Convention, chlorofluorocarbons and halons are not contained inAnnex VIII (list of hazardous wastes) and there are no technical guidelines for theenvironmentally sound management of wastes consisting of or containing ODS.Since ODS are not definitively controlled by the Basel Convention, the individualparties have determined independently whether certain ODS are to be consideredhazardous materials. In the case of transboundary movement of ODS for reuse andrecycle, the chemicals are not controlled under the Convention. However, in thecase of exportation for disposal, parties located in select regions, such as Europe,have chosen to identify refrigerants and other ODS as hazardous materials and thusplaces them under regulation by the Convention. European controls exist under theEC Waste Shipment Regulation (Council Regulation (EEC) No 259/93) and under
7 The Parties include 34 countries from the region of Africa; 37 from Asia and Pacific; 28 fromWestern Europe and Others; 21 from Central and Eastern Europe; and 29 from Latin America andCaribbean.

88 April 2002 Task Force on Collection, Recovery, and Storage Report
the OECD Decision C(2001)107. In both texts, chlorofluorocarbons (AC 150) andhalons (AC 160) are controlled as hazardous wastes. The export of these wastesfrom the EU to non-OECD countries is prohibited.
Future ODS destruction options under the Basel Convention could include thefollowing steps.
a) All wastes consisting of or containing ODS may be ecotoxic and thereforecould be identified under category Y 45 of Annex I of the Basel Convention(Organohalogen compounds other than substances referred to in this Annex).Therefore all wastes consisting of or containing ODS could be listed in AnnexVIII of the Basel Convention which would lead to the world-wide control oftransboundary movements of these wastes. An application to this effectcould be made to the Technical Working Group of the Basel Convention.Some experts have argued that gases may not be included in Annex I of theBasel Convention. However, gases are not excluded from the scope of theBasel Convention and ODS may change physical state under differentpressure and temperature.
b) Technical guidelines for the environmentally sound management of wastesconsisting of or containing ODS could be developed similar to the technicalguidelines for the environmentally sound management of wastes consistingof, containing, or contaminated with POPs.
c) A working relationship between the bodies of the Montreal Protocol and thebodies of the Basel Convention could be established to provide for ameaningful division of labour in order to avoid duplication of efforts.
9.3 Actions by the Basel Secretariat to Harmonise with the Montreal Protocol
At the Technical Working Group of the Basel Convention, Nineteenth Session inGeneva, 14-15 January 2002, Item 8 of the provisional agenda took up the issue ofco-operation with the Montreal Protocol. It noted that the Montreal ProtocolTechnology and Economics Assessment Panel formed two Task Forces; onDestruction Technologies and on Storage, Collection and Reclamation; and that thechairs of the task forces requested the secretariat of the Basel Convention, throughthe Ozone secretariat, nominate an expert to serve on each of the two Task Forces.The Technical Working Group reported in its report that �Currently, in co-operation with the Chairman of the Technical Working Group, the secretariat isconsulting with a number of Parties regarding the nomination of two experts toassist in each of the Task Forces set up by the TEAP�. The Basel report goes onto say:
April 2002 Task Force on Collection, Recovery, and Storage Report 89
�Preliminary consultations undertaken by the secretariat with Parties provides forthe following views:
(a) Annex VIII to the Basel Convention does not include halons because thereis no consensus that halons in general possess Basel Convention hazardouscharacteristics. Annex IX to the Basel Convention does not include halonsbecause there is no consensus that halons in general are not Basel wastes. Ata practical level, the transfrontier movement and disposal of waste halons isadequately covered by the Montreal Protocol and there is no need to duplicatethe Montreal Protocol provisions with the Basel Convention provisions.Therefore, it is not appropriate to develop guidelines on halons in the contextof the Basel Convention. However, it should be stated that the Basel Conven-tion has prepared technical guidelines on non-hazardous wastes, such astyres when Parties found such guidelines to be helpful.
(b) The development of guidelines on halons would be appropriate and useful.However, this should only be done if Gases are added to Annexes I and III ofthe Basel Convention. Halons would not be considered hazardous wastes.�
The report also provides for the following actions.
�The Technical Working Group may wish to:
(a) Take note of the ongoing cooperation with the Montreal Protocol onsubstances that deplete the ozone layer;
(b) Provide any guidance to the secretariat on the development of cooperationwith the Montreal Protocol;
(c) Also provide any guidance to the secretariat in regard to its response tothe Ozone secretariat concerning the appropriateness and usefulness ofconsidering the development of technical guidelines on halons.�


April 2002 Task Force on Collection, Recovery, and Storage Report 91
APPENDIX A: Standards for the Reclamation of BlowingAgents from Refrigerator Foams
Purpose and Scope
In providing this Annex, the Task Force is not seeking to endorse the mechanicalrecovery approach over that of direct incineration or other disposal technique. Itsprime purpose is, in recognition of the fact that mechanical recovery is by far themost common method in use for the recovery of blowing agent at this time, to setout issues which should be considered in seeking to set standards which can beconsidered as �environmentally acceptable� and, as far as possible, encourage theadoption of best practice in this important and growing field.
In addition, it is recognised that many technologies are still under developmentand/or refinement, making the application of best practice guidelines premature insome cases. This is particularly the case in Japan, where the recovery of blowingagents is voluntary and plants are still constructed primarily to maximise materialrecycling levels. In such cases, the adoption of the more rigorous elements of theseguidelines, particularly as they relate to the on-going verification of performance, isnot likely to take place in the immediate future.
Many such mechanical recovery plants combine the extraction and recovery ofrefrigerant with that of the collection and recovery of blowing agent. This Annexonly relates to the blowing agent segment of performance. However, it should benoted that several of the existing standards referred to in this text cover bothelements of recovery.
The Basic Process
Although mechanical recovery equipment can vary substantially in its detaileddesign, the basic principles tend to be common. The following flow-chart of aJapanese plant is fairly typical:

92 April 2002 Task Force on Collection, Recovery, and Storage Report
Primary crusher
Secondary crusher
Polyurethane mill Polyurethane dust
Dismantling
CFC/HCFC (refrigerant)
oil
Compressor
Crushed metal etc.
Fluorocarbon blowing agent recovery unit
Rod and tube mill
Air separator
Activated charcoal chamber
Fluorocarbon blowing agent
Heater
cooling machine
To atmosphere Refrigerators
Figure 1: Typical Mechanical Recovery Plant
Potential Sources of Emission
Mindful that fugitive emissions from the equipment itself can be the largest singlesource of losses, the other key area of blowing agent loss are:
� In foams remaining attached to metallic materials following the shreddingprocess
� In foams remaining attached to plastic materials following the shredding process
� In air exhausted from the plant after passage through an appropriate absorber
� In waste water outputs from the equipment
� As residual blowing agent in the polyurethane matrix emerging from theprocess.
Before dealing with the management of fugitive emissions, this annex will deal witheach of these identified sources of emission in turn.
Foams remaining attached to Metallic Materials
The process of shredding the refrigerator �box� can vary substantially from oneequipment design to the other. However, the general forces involved and therelatively low compressive strength of the foam insulation are usually sufficient toensure that the major bulk of the foam is removed from the metal surfaces. A fewexisting draft standards make reference to this area of loss (see Table 1) but onlyTA Luft and the draft DIN standard put a value to a maximum permissible losswhich is expressed as a percentage of the total weight of metal. In these respectivecases, 0.5% and 1% are noted as the proposed maxima.
At first sight, because of the substantially different specific densities a quantity offoam expressed as a percentage of metal by weight seems excessive. However, asseen in the summary of losses later in this Annex (Figure 2), the fact that we are

April 2002 Task Force on Collection, Recovery, and Storage Report 93
dealing with a total foam metric rather than a blowing agent metric leads to lowerblowing agent losses by this route than would otherwise have been anticipated.Nevertheless, opportunities to reduce it should be taken since Figure 2 indicatesthat the current contribution from this source, based on a 0.5% limit, can be asmuch as one third of the total.
The method of measuring the percentage loss is assumed to be by simple weightloss measurements following solvent extraction or high temperature treatment.However, there are no specific methods of test yet identified.
Foams remaining attached to Plastic Materials
The inner liners of most domestic refrigerators have been designed from plasticmaterials for many years. Typical choices include ABS and high impactpolystyrene (HIPS). During the shredding process, most plants separate outferrous and non-ferrous metal from the shredded outputs leaving the plasticmaterials remaining. However, this stream tends to be less pure than others since itoften contains synthetic rubber items such as door trims etc.
For these reasons, it initially seems less valuable to try to set a limit on foamoutputs in this stream, particularly since there is no obvious method of identifyingthe attached foam other than by physical removal by hand and subsequentweighing. However, this is the method proposed and currently practised inGermany, allowing the setting of maximum permissible percentage losses in thedraft TA Luft standard of 0.5%.
Blowing Agents in Air Exhaust Flows
Although designs may vary, most currently commercial units use re-generablecarbon absorption units to extract the blowing agents from the air stream. Mostsuppliers guarantee a maximum concentration in the airflow on the outlet side ofthe carbon absorber. A typical value for such a guarantee is 50mg/m3 and it is notedthat most of the references in existing and draft European standards refer toconcentrations (see table 1), often driven by local air quality regulations rather thanby wider Montreal Protocol considerations.
It is the view of the Task Force that this source of loss should always be consi-dered in mass balance terms because of the likely variations in air flow rate fromplant to plant. Accordingly, reference to blowing agent loss per hour or blowingagent loss per unit processed is essential. Of course, the two are linked by thenumber of units processed per hour and, in reality, it will always be possible todeduce the key parameter of losses per unit. Currently, most standards and draftstandards in Europe define this parameter in terms of blowing agent lost in gramsper hour. The range of allowable losses is substantial from 0.5g/hour in the case of

94 April 2002 Task Force on Collection, Recovery, and Storage Report
the LAGA guidelines to 75g/hour in the case of the draft DIN standard. However,most proposals lie below 10g/hour. Figure 2 illustrates the significance of losses incomparison with other sources arising from the adoption of a 5g/hour limit basedon a throughput of 60 units/hour. It shows that the losses under these assumptionsrepresent less than 1% of the total losses of typical mechanical recovery. Accor-dingly, the guideline of 5g/hour may be considered to be unnecessarily stringent bysome.
Of more specific importance is the design of the adsorption system. In a re-generable carbon system, it is normal for one bed to be in adsorption mode whilethe other is in desorption mode. Once a carbon bed is saturated, there is a risk of�breakthrough�, where considerably higher concentrations of blowing agent reachthe outlet stream. When this happens, it is essential to have an alternative pathwayfor the air to flow. This can be done by building into the system a re-circulatingloop but is more typically achieved by having a third carbon adsorption bedavailable for such emergencies. The value of this approach is that the productivityof the process is not interrupted. One of the vital aspects of any such design is thatthere is an appropriate alarm to indicate immediately when �breakthrough� hasoccurred.
Blowing Agents in Waste Water Outputs
The immediate question arising under this heading is �what sources of water exist inthe process?�. Experience shows that levels of water of around 1litre per unit aretypically recovered from refrigerators put through a mechanical recovery plant. Thesource of this water is often from the storage conditions of the unit prior toprocessing but some water may also be present in the foam and in other parts ofthe equipment. In some processes, the bulk of the wastewater is taken out at the airseparation stage and water remaining in the polyurethane matrix at this stage iscaptured later in the blowing agent catchment vessel. It is assumed that anydestruction technology used for the blowing agent itself will then deal with thecontaminated water.
As for the water extracted at the air separation stage, it is found in the case of CFC-11 that the immiscibility of the two components is such that they can be easilyseparated and that the remaining CFC-11 in the water phase is less than 100 g/litre.Of course, such low solubilities cannot be assumed for all blowing agents and careshould be taken to ensure that all wastewater handled at the air separation stage isregularly tested for content after any separation processes have been completed.
One factor which may influence this overview is the method by which desorptionof carbon beds is achieved. Some methods are reported to use steam to flushthrough the carbon adsorbers and, in this case, wastewater management will need tobe carefully considered to avoid significant further losses through this route.

April 2002 Task Force on Collection, Recovery, and Storage Report 95
No standard or draft standard so far considered has included any formal limitationon blowing agent losses in water. However, it is the view of the Task Force that theabsence of such a provision violates the integrity of a mass balance approach andneeds to be included. As in the case of airflow, it is proposed that such a maximumpermissible loss should be expressed in either grams per hour or grams per unit.However, it seems rational to set a guideline in line with the likely performance of atypical plant in order to avoid the permission of unnecessary losses. At this stage,1g/hour seems a rational starting point.
Residual blowing agent in the Polyurethane matrix
Most mechanical recovery plants focus on the importance of extracting as muchblowing agent from the polyurethane matrix as possible. Figure 2 illustrates thatthis focus is well founded, as blowing agent retention in the polyurethane matrixcontinues to be the most concentrated area of loss. The challenge of extractingblowing agent is complicated in polyurethane matrices by the fact that blowingagents are often soluble in the matrix. This means that grinding and other processesneed to be applied to accelerate the release of blowing agent and this is commonpractice by various methods.
Current standards and draft standards focus on a maximum residual weight ofblowing agent remaining in the matrix after extraction - usually as a percentage. Thecurrent maximum permitted range is from 0.1% to 0.5%. It is the considered viewof the Task Force that the sensitivity of the overall recovery performance to thisparameter is such that a limit of 0.5% is probably too great bearing in mind thestate of technology as it current exists. A guideline of 0.2% is therefore believed tobe a more appropriate figure (as reflected in Figure 2), particularly in view of thefact that <0.1% is currently considered the best practice. There are two reasonswhy 0.1% is not proposed as the definitive performance level. These are:
� There is some concern that existing methods of test may not be accuratebelow the 0.1% level.
� The cost/abatement curve associated with higher recovery levels needs to beconsidered on a plant-by-plant basis. The Task Force are aware that, in manyparts of the world, financial considerations could dissuade recovery in other-wise viable sectors.
There is a view among some equipment manufacturers and potential operators thatthe limit of 0.2% should not apply to PU dust being taken forward for incinerationor similar destruction technique. This position is supported by the Task Forceprovided that clear evidence can be provided of material control between the outputof the mechanical recovery equipment and the final destruction point. In order toavoid risk of significant inadvertent losses from potentially hot PU dust with high

96 April 2002 Task Force on Collection, Recovery, and Storage Report
exposed surface area it is proposed that, even under these circumstances, themaximum level of retained blowing agent should not exceed 0.5% by weight.
In respect of test methods for measuring residual blowing agent in foam, the TaskForce is aware of three8 current methods. All are based on head-space analysis ofblowing agent extracted by the use of solvent. The main differences appear to be inthe size and form of the sample introduced and the choice of solvent. A �roundrobin� of test procedures might be useful to compare methods in order to make anyfurther recommendations on test selection.
With respect to cost/abatement considerations, some process operators have notedthat the extraction of blowing agent from the polyurethane matrix is not a rate-determining step for the plant and, accordingly, there is limited incremental cost inmoving to the higher recovery standard. However, the Task Force considers that itis too early to extend this observation across the wider range of mechanicalrecovery equipment potentially covered by this Annex.
Fugitive Losses
The issue of fugitive losses was raised at the outset of this review and deferreduntil this point. It is self-evident that leaks within the mechanical recoveryequipment could swamp the effects of other losses covered so far in this Annex.However, it is believed to be totally feasible to design and monitor plant in such away as to ensure that leaks do not occur and, if they do, that they are detected andresponded to promptly. It is inappropriate, however, for guidance such as this tomake any prescription on how this should be achieved. Notwithstanding this, theTask Force believes that the onus should be clearly on the mechanical recoveryequipment manufacturers and operators to demonstrate compliance with the basicprinciples outlined below:
� That the plant should be comprehensively monitored by suitable gasdetectors
� That the detectors should be set to detect emissions at a concentration whichassures the minimum loss of blowing agent in the event of a leak.
� That, where appropriate, the plant should be shut down on the detection of aleak.
� Where shutdown is not appropriate, written instructions should be keptavailable to ensure that operators know precisely how to act in the event of aleak.
8 One test method has been developed by Butterworth in the UK, another is as currently practisedin Germany and the third is an internal method agreed by the producers of PU foams and rawmaterials.

April 2002 Task Force on Collection, Recovery, and Storage Report 97
In the absence of non-standard excursions, it is expected that baseline fugitivelosses can be maintained below 5g/hour or 125mg/unit. This level is reflected inFigure 1. Some mechanical recovery equipment manufacturers are suggesting that azero leakage unit can be engineered. However, the Task Force feels it inappropriateto reflect this target in its expectation for plant performance at this time, althoughcommending it as an objective provided that it can be achieved cost-effectively.
Overall Assessment of Losses
The various potentials for loss reviewed in the last section can be accumulatedtogether as shown in Figure 2.
Adherence to metal33.5%
Adherence to plastic
8.4%
Residual in PU matrix56.5%
Losses to air0.7%
Losses to water0.1%
Fugitive losses0.7%
Figure 2: Potential Sources of Blowing Agent Loss during Mechanical Recovery(total 10-11 g/unit)
This assessment leads immediately to the conclusion that the anticipated loss perunit is typically 10-11 grams/unit. The next question is, of course, whether thislevel of loss is permissible in macro terms.
Significant work has been conducted by the German refrigeration industry duringthe last five years on establishing the average amount of foam injected into theirunits. The existing RAL standard defines three types of unit. These are:
Type 1: Domestic refrigeratorstypical for domestic use with a load capacity of up to 180 litres
Type 2: Domestic Fridge-Freezerstypical for domestic use with a load capacity of 180 � 350 litres

98 April 2002 Task Force on Collection, Recovery, and Storage Report
Type 3: Domestic Chest Freezerstypical for domestic use with a load capacity of up to 500 litres
Using these basic �types� and the product mix sold in the market, the Germanindustry has been able to estimate an average of 300-340g of blowing agent acrossthe range of units sold. Using 320g as the basis for the calculation, it can be seenthat a loss of 11 grams represents 3.4% of the original charge. However, taking intoaccount emission functions identified in previous TEAP publications (0.25% peryear), and assuming a 20-year life, the recoverable blowing agent becomes 304g andthe 11g loss equivalent to 3.6%. However, while recognising that any loss isregrettable, it is viewed that such losses would be acceptable as the ongoing basis ofa minimum standard.
Monitoring and Reporting of Performance
The Task Force believes that it is not possible to frame any guidelines in this fieldon the basis of overall percentage recovery because the inputs to the process arenot well enough defined. There are three problem areas:
� The density of foam varies within the cabinet, making representative samplesdifficult to select
� The product mix of refrigerator units (i.e. CFC, HCFC, HFC, HC blown) willbe unknown if mandatory labelling has not been in place historically.
� The product mix will depart from CFC predominance over time andproportions of HCFC, HFC & HC will increase in line with MontrealProtocol initiatives.
Having said this, work carried out in the development of the RAL QualityAssurance Standard RAL-GZ 728 has shown that with large enough sample sizes(600 Type 1; 250 Type 2; and 150 Type 3) it is possible to smooth out thesevariations.
As a macro cross-check of on-going performance of mechanical recoveryequipment, it would be possible to use the RAL 1000 unit recovery test, conductedevery 3-6 months, and the results recorded for reporting purposes only. Not onlywould this serve as an internal check against any equipment problems that may bedeveloping but would also serve to provide regulators with information about theoverall effectiveness of their recovery schemes. Additionally, it would show long-term trends of the type suggested under item (iii) in this section. It should bestressed that no pass/fail criterion should be implied by this suggestion. In manycases, manufacturers would not wish to be bound in such a way because of all ofthe uncertainties outlined above.

April 2002 Task Force on Collection, Recovery, and Storage Report 99
Other Safety and Environmental Considerations
In preparing this review of issues to be considered in setting guidelines formechanical recovery equipment, the Task Force would wish to draw attention tothe fact that this Annex does not represent any type of design guide for suchplants. Issues such as plant safety and energy efficiency are not explicitly dealtwith in any detail.
However, the Task Force would wish to draw the attention of interested parties tothe fact that equipment of this type will be increasingly dealing with product mixesbased on hydrocarbon blown foams. Accordingly, they need to be designed in thelight of the potential handling of typically low concentrations of cyclo-pentane,iso- & n-pentanes and even iso-butane.
On the energy efficiency side, equipment designers need to be mindful that one ofthe arguments against this form of recovery is that the energy consumed in theprocess heavily offsets the environmental gain. This is a strong argument for directincineration, although this too has its constraints. Equipment manufacturerstherefore need to strive for the lowest energy consumptions wherever possible andin its recommended that average energy consumption data per unit be establishedand published on all appropriate literature relating to the equipment beingpurchased.
Conclusions
It is the view of the Task Force that there are current performance guidelines, basedon limiting losses at various points of the plant, that can be applied to newcapacity being installed today. These do not fully represent best practice at thisstage but provide an adequate screening of existing equipment performance to avoidthe perpetuation of poorer quality designs.
The following table (Table 1) illustrates the view of the Task Force concerningthese current recommendations for new capacity installed within the next five yearsand the potential target for future capacity thereafter.

100 April 2002 Task Force on Collection, Recovery, and Storage Report
Table 1: Recommendations
Parameter Current Recommendation Future Target
Adherence to metal <0.5% by weight <0.25% by weightAdherence to plastic <0.5% by weight <0.25% by weightResidual blowing agent inPU
<0.2% <0.1%
Losses to Process Air 125 mg/unit 125 mg/unitLosses to Waste Water 25mg/unit 25mg/unitFugitive Emissions 125 mg/unit 100 mg/unit
Additional requirements include minimisation of fugitive losses through propermonitoring and management of non-standard events. These conclusions willdoubtless remain under review. However, the purpose of this Annex is to providesufficient guidance to allow regulators and investors to agree on minimumperformance criteria for the current investment cycle.

Apr
il 20
02 T
ask
For
ce o
n C
olle
ctio
n, R
ecov
ery,
and
Sto
rage
Rep
ort
101
Tab
le 2
: C
ompa
riso
n of
diff
eren
t Eur
opea
n Q
ualit
y St
anda
rds
(and
dra
fts)
rela
ting
to F
ridg
e de
stru
ctio
n
a) E
XIS
TIN
G S
TA
ND
AR
DS:
CF
CV
olum
es i
nSt
ep 2
(Ins
ulat
ion)
CF
CV
olum
es i
nSt
ep 1
(Coo
ling
Cir
cuit)
Man
dato
ry te
stm
etho
d to
dete
rmin
e C
FCva
lues
in S
teps
1 &
2
Res
idua
lR
12 i
nC
ooli
ng O
il
Res
idue
R11
in
dega
ssed
PUR
Foa
m
Res
idua
lC
once
ntra
tion
s of
CFC
in
the
Atm
osph
ere
Mas
s-fl
ow o
fC
FC i
n th
eA
tmos
pher
e
Adh
eren
cePU
R o
nM
etal
was
tefr
actio
ns
Adh
eren
cePU
R o
nPl
astic
was
tefr
actio
ns
Oth
er p
oint
s
RA
L G
Z72
8(0
8/20
01)
283
gram
sR
11/u
nit
115
gram
sR
12/u
nit
1000
uni
ts/m
anda
tory
mix
60%
smal
l(ty
pe1)
;25
% m
ediu
m(t
ype2
; 15%
larg
e (t
ype
3) -
(Ste
p 1
mus
tdo
�10
0 un
itte
st�)
(St
ep 2
mus
t do
addi
tiona
l 100
unit
test
)
<0.
1 w
eigh
t%
<0.
2 w
eigh
t%
no d
etai
ls (
asa
rule
<20
mg/
m3)
<5
gram
sC
FC
/hou
r(c
ontin
uous
mea
sure
men
t)
met
al f
ract
ion
shou
ld b
e as
unco
ntam
inat
ed a
s po
ssib
le
plas
tics
frac
tion
shou
ld b
e as
unco
ntam
i-na
ted
aspo
ssib
le
Com
preh
en-
sive
mon
itori
ng o
fal
l mat
eria
lfl
ows
man
date
dA
nnua
l che
ckon
thi
s
Fede
ral
Env
iron
men
tM
inis
try
Gui
danc
e(0
1/19
98)
283
gram
sR
11/u
nit
115
gram
sR
12/u
nit
1000
uni
t/m
anda
tory
mix
60/2
5/15
%
no d
etai
ls<
0.1
wei
ght
% f
easi
ble;
<0.
5 w
eigh
t%
not
to b
eex
ceed
ed
no d
etai
lsno
det
ails
no d
etai
lsno
det
ails
LA
GA
-G
uide
lines
(09/
2000
)
283
gram
sR
11/u
nit
115
gram
sR
12/u
nit
1000
uni
t/m
anda
tory
mix
60/2
5/15
%
<0.
1 w
eigh
t%
as a
bove
no d
etai
ls<
0.5
gram
sC
FC
/hou
rno
det
ails
no d
etai
ls
Aus
tria
nm
inim
umre
quir
emen
ts
283
gram
sR
11/u
nit
115
gram
sR
12/u
nit
1000
uni
ts/
man
dato
ry m
ix60
/25/
15%
<0.
1 w
eigh
t%
<0.
2 w
eigh
t%
<15
0 m
g/m
3(y
earl
ym
easu
rem
ent)
no d
etai
lsno
det
ails
no d
etai
ls

102
Apr
il 20
02 T
ask
For
ce o
n C
olle
ctio
n, R
ecov
ery,
and
Sto
rage
Rep
ort
(b)
STA
ND
AR
DS
UN
DE
R D
EV
EL
OP
ME
NT
/IN
DIS
CU
SSIO
N
CF
CV
olum
es i
nSt
ep 2
(Ins
ulat
ion
CF
CV
olum
es i
nSt
ep 1
(Coo
ling
Cir
cuit
Man
dato
ryte
st m
etho
dto
det
erm
ine
CFC
val
ues
in S
teps
1 &
2
Res
idua
l R
12in
Coo
ling
Oil
Res
idue
R11
in d
egas
sed
PUR
Foa
m
Res
idua
lC
once
ntra
tion
s of
CFC
in
the
Atm
osph
ere
Mas
s-fl
ow o
fC
FC i
n th
eA
tmos
pher
e
Adh
eren
cePU
R o
nM
etal
was
tefr
actio
ns
Adh
eren
ce P
UR
on P
last
ic w
aste
frac
tions
TA
Luf
t(G
erm
anR
egul
atio
nD
raft
09/2
0001
)
no d
etai
ls10
0 un
it te
stfr
om R
AL
no d
etai
ls<
0.2
wei
ght
% to
tal
halo
gen
cont
ent
<0.
2 w
eigh
t%
<20
mg/
m3
<10
gra
ms
CF
C/h
our
<0.
5 w
eigh
t%
<0.
5 w
eigh
t %
DIN
897
5-12
no d
etai
lsno
det
ails
no d
etai
ls<
0.2
wei
ght
% to
tal
halo
gen
cont
ent
<0.
5 w
eigh
t%
<15
0mg/
m3
(no
cont
inuo
usm
easu
rem
ent)
no d
etai
ls(b
ut w
ith
this
mas
sco
ncen
trat
ion
this
sho
uld
be <
75 g
ram
sC
FC
/hou
r
<1
wei
ght %
no d
etai
ls

April 2002 Task Force on Collection, Recovery, and Storage Report 103
APPENDIX B: Task Force Members
Task Force Co-chairs
Dr. Stephen O. Andersen,(TEAP Co-Chair)Climate Protection Partnership DivisionUnited States Environmental Protection Agency1200 Pennsylvania Avenue, N.W.Washington, DC 20744Phone: 1-202-564-9069Fax: 1-202 565-2135Email: [email protected]
Dr. Walter Brunner(Halons TOC Co-Chair)envico AGGasometerstrasse 9CH - 8031 ZurichSwitzerlandPhone 41 1 272 7475Fax 41 1 272 8872e-mail [email protected]
Mr. Jose Pons Pons(Aerosol Products TOC Co-chair)Spray Quimica C.A.URB.IND.SOCO Calle Sur #14Edo Aragua, La VictoriaVenezuelaPhone 58 244 3223297 or 3214079 or 3223891Fax 58 244 3220192e-mail [email protected]

104 April 2002 Task Force on Collection, Recovery, and Storage Report
Task Force Members
Mr. Paul Ashford(Foams TOC Co-chair)Principal ConsultantCaleb Management Services Ltd.Grovelands HouseWoodlands Green, Woodlands LaneAlmondsbury, Bristol BS32 4JTUnited KingdomPhone 44 1454 610 220Fax 44 1454 610 240E-mail [email protected]
D.D. Arora(Aerosols TOC)Consultant, Tata Energy Research InstituteA-404, Hibiscus, Off Yari RoadVersova, Bombay - 400 061IndiaPhone 91 - 22 - 6333861Fax 91 - 22 - 6333861 / 2872796E-mail [email protected]
Mr. Teruo FukadaDirector, EnvironmentJapan Electrical Manufacturers AssociationE-mail: [email protected]
László GaalHungarian Refrigeration and Air Conditioning AssociationFo Utca 68H-1027 BudapestE-mail: [email protected]/Fax: : 36- 1 201 7137
Dr. Mike JeffsHuntsman PolyurethanesEverslaan 45 � B-3078EverbergBelgiumPhone 32 2 758-9394Fax 32 2 758 9013E-mail: [email protected]

April 2002 Task Force on Collection, Recovery, and Storage Report 105
Mr. Brian HobsbawnAssistant Director Ozone ProtectionEnvironment AustraliaGPO 780CANBERRA ACT 2601Phone +61 2 62741495Fax +61 2 62741172e-mail [email protected]
Dr. Robert Chin-Hsing HuangAlberta Environment, Canada9820 - 106 Street, 4th FloorEdmonton, Alberta T5K 2J6Phone 1-780-427-0637Fax 1-780-422-4192email [email protected]
Dr. Lambert Kuijpers(TEAP and Refrigeration TOC Co-Chair, Task Force on Destruction Co-Chair)Technical University Pav A58P.O. Box 513NL - 5600 MB EindhovenThe NetherlandsPhone 31 49 247 6371 / 31 40 247 4463Fax 31 40 246 6627E-Mail [email protected]
Ronald Sibley(Member HTOC)DoD Ozone Depleting Substances ReserveDefense Supply Center RichmondAttn: DSCR-RP,8000 Jefferson Davis HighwayRichmond, VA 23297phone 1-804-279-4525FAX 1-804-279-4970email [email protected]
Dipl.-Ing. Stephan SicarsSiccars ConsultingP.O. Box 1470, 61454 KönigsteinGermanyP: +49 (0) 6174 - 29 3636F: +49 (0) 6174 - 29 3737email: [email protected]

106 April 2002 Task Force on Collection, Recovery, and Storage Report
Hiroshi TsujitaMathushita Refrigeration Company2-3-1-2 Nojihigashi,Kusatsu City, Shiga 525-8555JapanP: +81 77-562-7602F: +81 77-562-7619email: [email protected]
Paulo Vodianitskaia(Member RTOC)Multibras SA EletrodomesticosRua Dona Francisca 7200CEP 89219-900 Joinville SCBrazilPhone 55-474-414-514Fax 55-474-414-7000email [email protected]