tf green airport air monitoring study
TRANSCRIPT
1
TF Green Airport Air Monitoring Study
EPA Air Toxics Data Analysis WorkshopOctober 3, 2007
Barbara MorinRhode Island Dept. of Environmental Management

2
Motiviation for Study
• TF Green Airport is located in the center of Warwick, RI, surrounded by dense residential and commercial areas
• Long-term concern about airport effects (noise, air pollution, water pollution) from neighbors and elected officials
• RI Dept. of Health lung cancer analysis• Proposed airport modifications

3

4
Main Study Goals
• Determine the levels and health risks of air toxics in Warwick neighborhoods, particularly in neighborhoods near the airport and in areas with elevated lung cancer rates
• To the extent possible, determine the sources of those toxics
• Recommend responses and next steps (further study, regulatory action, etc.)

5
Study Design• Designed as one year study, monitoring for
some pollutants extended to 18 months• Advisory group• 5 Warwick sites (4 near airport, 1 distant)• Intermittent monitors (VOC, carbonyls) – every
sixth day (24-hour, some 3-hour)• Continuous samplers for Black Carbon (BC) and
PM2.5 • Cerex open-path optical system • QAPP based on NATTS/PAMS QAPP

6
Pollutant Selection
• Pollutant were selected considering:– Toxics in aircraft emissions– Toxic emissions from other nearby sources– Risk drivers identified in previous airport
studies– Concurrent measurement at other RI
locations (context and experience)

7
Site Selection Criteria
• Sites were selected considering:– Proximity to airport– Proximity to other stationary & mobile sources– Areas with elevated lung cancer rates– Flight patterns– “Sea breeze effect”– Upwind/downwind pairs
• Omission – no site directly east of airport

8
Sites
• Four sites near airport– Fire Station – NW of airport, E of industrial
sources– Field View, near main taxiway and runway– Smith St. –SW of main runway– Lydick Ave. – NE of main runway
• One Warwick site farther from airport –– Draper – >2 miles SE, near coast, in high lung
cancer census tract

9Smith St.. Draper

10
LydickFire Station
FieldView
Smith
Draper
HEALTH Lung Cancer Map

11
Health Benchmarks
• To evaluate health impacts of VOCs and carbonyls:– Average levels measured were compared to:
• 10-6 cancer risk levels derived by EPA and California
• EPA RfCs, ATSDR MRLs and California RELs for chronic noncancer effects
– Maximum concentrations were compared to:• ATSDR acute MRLs, California acute RELs,
occupational levels

12
Volatile Organic Compounds (VOC)
• EPA Method TO-15• Approximately 70 VOCs (PAMS/NATTS list)• Samples every 6th day at all 5 sites
• 24-hour samples April 2005 – May 2006• 3-hour samples (6:00 – 9:00 AM) June- August 2006
• Concurrent measurements at comparison sites– Pawtucket, adjacent to I-95– Providence, urban residential (NATTS site)– E. Providence, suburban downwind (Type II PAMS)– Alton Jones, W. Greenwich, rural (Type I PAMS)

13
Noncancer Health Effects - VOCs
• No VOC levels exceeded the acute or chronic noncancer health benchmarks
• Benzene levels came closest to these benchmarks– Average Warwick benzene levels were 7- 9%
of the chronic noncancer benchmark– Maximum Warwick benzene levels were 8 –
12% of the acute benchmark

14
Cancer Benchmark Comparisons -VOCs
• Average concentrations of 5 VOCs at the Warwick and comparison sites were higher than the cancer benchmark (10-6
risk). These pollutants were:– benzene and 1,3-butadiene (mainly mobile
source related)– chloroform and carbon tetrachloride (mainly
background) and– perchloroethylene (industrial and dry cleaning
solvent)
15
Other VOCs of Interest
• Patterns of other mobile source pollutants (e.g. toluene, ethyl benzene, xylenes and MBTE) were evaluated for source identification
• Two other chlorinated solvents, trichloroethylene and dichloromethane, were evaluated because levels were close to the cancer benchmark

16
Mobile Source VOCs• Mobile source VOC levels were:
– Significantly lower at all Warwick sites than at the Providence (urban) and Pawtucket (highway dominated) sites
– Significantly higher at all Warwick sites than at Alton Jones (rural) site
– Significantly higher at Field View than at the other Warwick sites and at E. Providence (suburban) site
– Significantly lower at Draper (Warwick site distant from airport) than at the other Warwick sites and E. Providence
– Other Warwick sites similar to E. Providence

17
Average Benzene Concentrations (6/9/05-6/4/06)
0.21
0.260.24
0.270.25
0.13
0.24
0.36
0.44
0.00
0.05
0.10
0.15
0.20
0.25
0.30
0.35
0.40
0.45
0.50
Draper Smith Fire Station Field View Lydick Alton Jones E Providence Providence Pawtucket
ppb
Cancer benchmark ( 0.04 ppb )

18
Average 1,3-Butadiene (6/9/05- 6/4/06)
0.028
0.037 0.038 0.039 0.037
0.013
0.037
0.063
0.095
0.00
0.01
0.02
0.03
0.04
0.05
0.06
0.07
0.08
0.09
0.10
Draper Smith Fire Station Field View Lydick Alton Jones E Providence Providence Pawtucket
ppb
cancer benchmark = 0.015 ppb

19
Mobile Source VOCs - Sources• Slightly higher mobile source VOC levels at Field View
site suggests possible airport influence• However, no relationship was identified between
elevated levels of VOC and wind direction, even in 3-hour samples
• Aircraft emit many of the same VOCs that are emitted from other mobile sources, like cars and trucks.
• We were not able to separate aircraft impacts from impacts from other mobile sources
• VOC sampling with continuous instrumentation or more short period VOC sampling might help to identify sources of mobile source VOCs.

20
Chloroform & Carbon Tetrachloride
• Chloroform was significantly lower at Alton Jones (rural) site than at Warwick sites and other comparison sites
• Chloroform levels were statistically equivalent at Warwick sites and other comparison sites
• Chloroform is primarily a background pollutant, but local sources, like off-gassing from chlorinated water, contribute to ambient levels
• Mean levels of chloroform throughout the State were above 10-6 cancer risk level
• Average levels of carbon tetrachloride were equivalent throughout the State, approximately 8 times higher than the cancer benchmark
• Carbon tetrachloride is a background pollutant that is persistent in the atmosphere

21
Chlorinated Solvents - PCE• Average levels of perchloroethylene were:
– significantly higher at Lydick than at other Warwick and comparison sites
– Significantly higher at Fire Station than at Field View, Smith and Draper sites in Warwick and suburban & rural comparison sites
– Above 10-6 cancer risk at Lydick, Fire Station and urban and suburban comparison sites
• Unable to definitively identify source contributions, but likely sources are a dry cleaner and small industrial sources in the area

22
Chlorinated Solvents – TCE & MC
• At Fire Station:– Trichloroethylene (TCE) was significantly higher than
at other Warwick sites, E. Providence (suburban) and Alton Jones (rural)
– Dichloromethane (MC) was significantly higher than at other Warwick sites and all comparison sites
• Average TCE and MC levels below 10-6 risk level• Several small industrial sources in area,
residences between sources & monitor – risk may be higher at those locations

23
Average Perchloroethylene
0.02 0.01
0.04
0.02
0.06
0.01
0.03
0.05
0.04
0.00
0.01
0.02
0.03
0.04
0.05
0.06
Draper Smith Fire Station Field View Lydick Alton Jones E Providence Providence Pawtucket
ppb
Cancer benchmark = 0.025 ppb

24
Average Trichloroethylene
0.00
0.01
0.07
0.020.03
0.00
0.02
0.04
0.06
0.00
0.01
0.02
0.03
0.04
0.05
0.06
0.07
0.08
0.09
Draper Smith Fire Station Field View Lydick Alton Jones E Providence Providence Pawtucket
ppb
Cancer benchmark=0.09 ppb

25
Average Dichloromethane (Cancer Benchmark = 0.6 ppb)
0.07
0.08
0.11
0.090.08
0.04
0.07
0.090.10
0.00
0.02
0.04
0.06
0.08
0.10
0.12
0.14
Draper Smith Fire Station Field View Lydick Alton Jones E Providence Providence Pawtucket
ppb

26
Carbonyls
• EPA Method TO-11A• Formaldehyde, acetaldehyde, acetone• Every 6th day, 24-hour samples, all sites, April
2005 – August 2006• Comparison sites
– Providence NATTS (urban)– E. Providence Type II PAMS (suburban, frequently
downwind of Providence metropolitan area)• Some data loss in summer of 2005 due to
humidity/condensation problems

27
Formaldehyde
• Formaldehyde concentrations were significantly higher at Field View than at any of the other sites, including the comparison sites in Providence and E. Providence.
• Levels of formaldehyde are highest at all sites in the summer due to photochemical formation reactions

28
Formaldehyde – Health
• Average formaldehyde levels at all sites were more than 10 times higher than the 10-6 cancer risk benchmark (based on the IRIS potency factor)
• Average formaldehyde levels at Warwick sites were 21 – 33% of chronic noncancer benchmarks
• Maximum Warwick formaldehyde levels were 11 – 16% of acute benchmarks
• Respiratory irritant

29
Average Formaldehyde Levels
1.81.8
1.8
2.7
1.7 1.6
2.3
0.0
0.5
1.0
1.5
2.0
2.5
3.0
Draper Smith FireStation FieldView Lydick E Providence Providence
ppb
Cancer benchmark = 0.06 ppb

30
Formaldehyde at Field View
• On cool days, formaldehyde levels at Field View were similar to those at the other Warwick sites
• When the temperature was above 50o F, formaldehyde levels at Field View were approximately 1 ppb higher than at the other Warwick sites

31
Formaldehyde Levels by Temperature
0.0
1.0
2.0
3.0
4.0
5.0
6.0
30-39 40-49 50-59 60-69 70-79 80-89 90-100
Maximum Daily Temperature (degrees F)
Ave
rage
For
mal
dehy
de C
once
ntra
tion
(ppb
)
Draper FieldView Smith FireStation Lydick

32
Acetaldehyde and Acetone
• Mean acetaldehyde levels were 0.7 -0.8 ppb at all of the Warwick sites and 0.9 ppb at the Providence and E Providence sites.
• These values are 2.5 – 3 times higher than the cancer benchmark and 14 – 17% of the chronic noncancer benchmark.
• Acetone levels were similar at the Warwick and E Providence sites and considerably below the health benchmarks.

33
Average Acetaldehyde Levels
0.84
0.72
0.800.84
0.68
0.90 0.89
0.0
0.1
0.2
0.3
0.4
0.5
0.6
0.7
0.8
0.9
1.0
Draper Smith FireStation FieldView Lydick E Providence Providence
ppb
Cancer benchmark = 0.3 ppb

34
Average Acetone Levels
0.0
0.2
0.4
0.6
0.8
1.0
1.2
1.4
1.6
Draper Smith FireStation FieldView Lydick E Providence Providence
ppb
Chronic Benchmark =13,000 ppb

35
Why Were Formaldehyde Levels Elevated at Field View?
• Possible explanations:– Bias in sampling equipment at site– Influence of airport or other off-property
source• Formaldehyde is emitted in aircraft exhaust and
Field View is the site closest to the main runway and taxiway
– Localized source close to the monitor (e.g. off-gassing)
36
Is the Formaldehyde Elevation at Field View Due to Sampling Bias?
• If the difference between Field View and other sites was due to differences in the sampling equipment, we would expect to see similar elevations of acetaldehyde and acetone, which are collected on the same traps.
• Since acetaldehyde and acetone do not show this pattern, it is unlikely that this elevation is due to sampling error.

37
Are Elevated Formaldehyde Levels at Field View due to the Airport?
• If the airport caused the elevations, we would expect the difference between levels at Field View and at other sites to be larger when Field View is downwind of the airport
• An attempt to correlate daily formaldehyde concentrations with wind directions did not show a link between differences in levels at the sites and wind direction.
• However, since the samples were taken for 24-hour periods and winds vary during most days, we cannot rule out the airport as the source.

38

39
Other Possible Sources
• It is possible that a very localized source (e.g. off-gassing from a structure on the property) contributed to the formaldehyde levels at Field View.
• The Field View property has, since the study ended, been purchased by RIAC and the buildings on that property have been removed.

40

41

42
Formaldehyde Follow-up
• Since the buildings on the Field View property have been removed, further sampling with TO-11A method could help to determine whether local off-gassing from those buildings contributed to the levels measured at that site.
• Monitoring with continuous instruments would help to show the contribution of various sources to formaldehyde levels.

43
Particulate Pollutants
• Fine Particulate Matter (PM2.5)– Beta Attenuation Monitors (BAMs)– Hourly measurements at two sites
• Black Carbon– Aethalometers at all sites– Indicator of diesel and jet engine exhaust– Correlates with ultrafine particles and
polycyclic aromatic hydrocarbons – 1-minute average resolution
44
Black Carbon (BC) Results• BC was measured continuously at all of the Warwick
sites and at comparison sites in Providence and E. Providence
• The mean concentration of BC at Warwick sites was highest at the Fire Station site.
• The Fire Station mean was similar to that at the urban Providence site.
• The mean levels at Field View and Lydick were lower than in Providence by higher than E. Providence.
• The mean levels at Smith and Draper were equal to and lower than, respectively, that at the E. Providence suburban downwind site.

45
Mean Black Carbon Concentrations at Warwick and Comparison Sites
0.42
0.54
0.60
0.54
0.50
0.61
0.50
0.00
0.10
0.20
0.30
0.40
0.50
0.60
0.70
Draper Field View Fire Station Lydick Smith Providence E Providence
ug/m
3

46
Black Carbon Trends
• Average BC levels peak in early morning (during morning rush hour)– 7:00 – 8:00 AM– More pronounced on weekdays

47
Mean Weekday BC Concentration by Time of Day
0
0.2
0.4
0.6
0.8
1
1.2
0:00
1:00
2:00
3:00
4:00
5:00
6:00
7:00
8:00
9:00
10:00
11:00
12:00
13:00
14:00
15:00
16:00
17:00
18:00
19:00
20:00
21:00
22:00
23:00
ug/m
3
Draper Field View Fire Station Lydick Smith Providence E Providence
7:00 AM

48
Mean Weekend BC Concentration by Time of Day
0
0.1
0.2
0.3
0.4
0.5
0.6
0.7
0.8
0.9
0:00
1:00
2:00
3:00
4:00
5:00
6:00
7:00
8:00
9:00
10:00
11:00
12:00
13:00
14:00
15:00
16:00
17:00
18:00
19:00
20:00
21:00
22:00
23:00
ug/m
3
Draper Field View Fire Station Lydick Smith Providence E Providence
7:00 AM

49
BC Trends (cont)
• BC levels are highest at all Warwick and comparison sites when wind speed is low

50
Mean Black Carbon Concentrations by Wind Speed
0
0.2
0.4
0.6
0.8
1
1.2
1.4
0 3 4 5 6 7 8 9 10 11 12 13 14 15 16 17 18 19 20 21 22 23 24
Knots
ug/m
3
Draper Field View Fire Station Lydick Smith Providence E Providence

51
BC Wind Direction Trend
• Average BC levels vary with wind direction in a pattern consistent with airport influence– N, NNE, NE, ENE, E, ESE wind – Field View elevated
(downwind of airport)• NNE & NE wind - Smith also elevated and downwind of
airport)
– S, SSE and SE wind – Fire Station highest (downwind of airport)
– SW and WSW wind – Lydick highest (downwind of airport)

52Smith St.. Draper

53
Further Evidence of TF Green Influence on BC Levels
• Flights begin take off at 6:00 AM• Black carbon data show sudden increase at
about this time. For instance, this occurs:– At Lydick on some days when wind is from SW and
Runway 23 is in use– At Field View on some days when wind is from NE
and Runway 5 is in use• Field View increase occurs a few minutes before
6:00, may be the result of idling on the taxiway

54
7/2/06, 2:00 - 9:00 AM EDT, SW Wind, Runway 23 in Use
0
0.5
1
1.5
2
2.5
3
3.5
2:00 2:30 3:00 3:30 4:00 4:30 5:00 5:30 6:00 6:30 7:00 7:30 8:00 8:30 9:00
ug/m
3
Field View Lydick

55
5/3/06 2:00 - 9:00 AM EDT, NNE Wind, Runway 5 in Use
0
0.2
0.4
0.6
0.8
1
1.2
1.4
1.6
1.8
2
2:00 2:30 3:00 3:30 4:00 4:30 5:00 5:30 6:00 6:30 7:00 7:30 8:00 8:30 9:00
ug/m
3
FieldView Lydick

56
Fine Particulate Matter (PM2.5)
• PM2.5 was measured at the Lydick and Field View sites using continuous Beta Attenuation Monitors (BAMs)
• PM2.5 is also measured using the same equipment in sites in Providence (urban), Narragansett (coastal) and Alton Jones (rural)

57
PM2.5 Standards
• The US EPA has established the following National Ambient Air Quality Standards (NAAQS) for PM2.5:– 15 µg/m3 as an annual average– 35 µg/m3 as a 24-hour average (at 98th
percentile)– The EPA’s Clean Air Science Advisory
Committee recommended levels of:– 13 - 14 µg/m3 as an annual average– 30 - 35 µg/m3 as a 24-hour average
58
Comparison to NAAQS
• PM2.5 levels measured at all sites were below the annual and 24-hour NAAQS
• These data are not directly comparable to the NAAQS, because the NAAQS is based on FRM sampling method
• In general, the continuous monitors used in this study (BAMs) measure higher levels than the FRM method

59
Comparison of PM2.5 at Sites
• Average PM2.5 concentration at the Warwick sites were similar to each other and to the levels at the Providence and Narragansett sites and were higher than at Alton Jones
• 24-Hour PM2.5 levels (98th percentile) at the Warwick sites were similar to each other and to Narragansett, slightly lower than Providence, and higher than Alton Jones

60
Average PM2.5 Levels (Continuous BAM Monitor, 10/19/05 - 8/24/06)
1112
10
11
1212
11
9
10
12
0
2
4
6
8
10
12
14
16
Lydick FieldView AltonJones Narragansett Providence
ug/m
3
All Data Hours with Data at LY and FV
Annual Average NAAQS = 15 ug/m3(Different method, so not directly comparable)

61
24-Hour PM2.5 Concentrations (98th percentile value, 10/19/05 -8/24/06)
31 31
28
3133
0
4
8
12
16
20
24
28
32
36
Lydick FieldView Alton Jones Narragansett Providence
ug/m
3
24-hour NAAQS = 35 ug/m3Data not directly comparable

62
PM2.5 Trends
• As with BC, average PM2.5 levels at the Warwick and Providence sites peak in the early morning and are higher with low wind speed.
• These effects are less pronounced with PM2.5 than with BC and do not occur or occur minimally at Alton Jones and Narragansett.
• PM2.5 consists of a large regional component with smaller local contribution in urban areas and near sources

63
Average Weekday BAM PM2.5 by Time of Day
0
2
4
6
8
10
12
14
16
0:00
1:00
2:00
3:00
4:00
5:00
6:00
7:00
8:00
9:00
10:00
11:00
12:00
13:00
14:00
15:00
16:00
17:00
18:00
19:00
20:00
21:00
22:00
23:00
ug/m
3
Lydick Field View Alton Jones Narragansett Providence
7:00

64
PM2.5 by Wind Speed
0
5
10
15
20
25
0 3 4 5 6 7 8 9 10 11 12 13 14 15 16 17 >=18
knots
ug/m
3
Lydick FieldView Alton Jones Narragansett Providence

65
PM2.5 – Wind Direction
• PM2.5 concentrations vary with wind direction but, unlike with BC, concentration differences are not consistent with an airport influence (levels are not higher when sites are downwind of the airport)
• Wind directions with largest differential between sites are W and SW – average at Field View are 1.5 – 1.6 µg/m3 higher than at Lydick. Not consistent with airport influence.
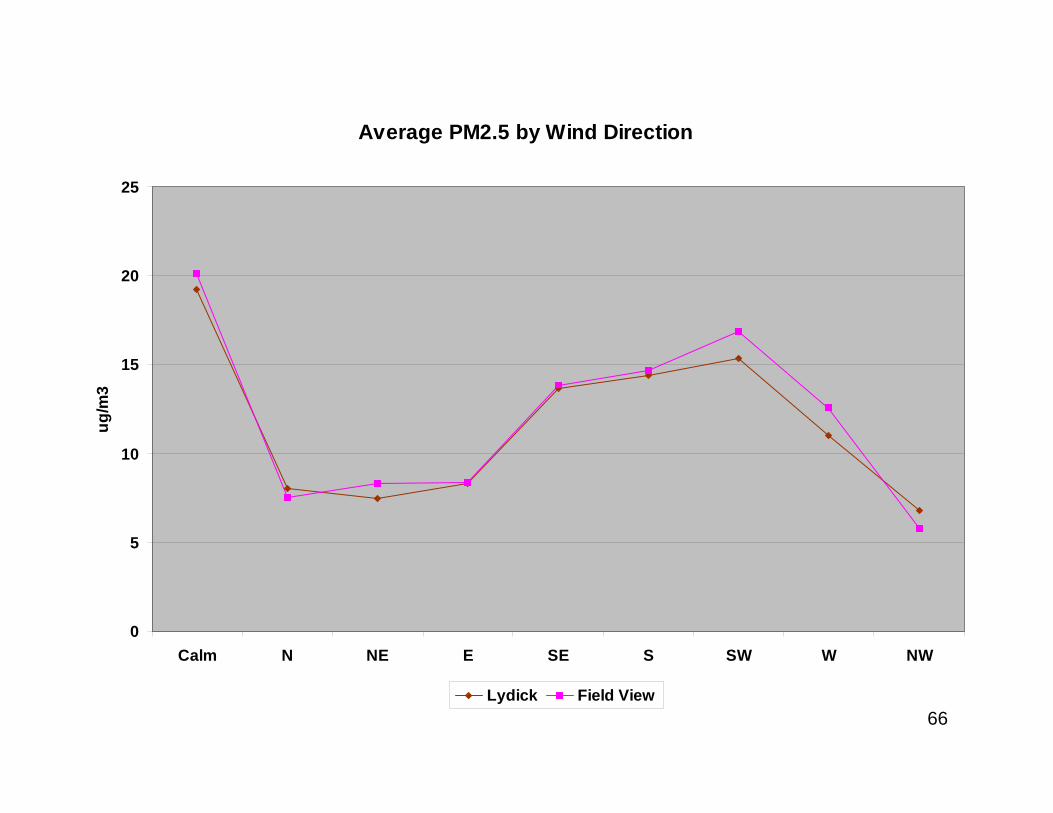
66
Average PM2.5 by Wind Direction
0
5
10
15
20
25
Calm N NE E SE S SW W NW
ug/m
3
Lydick Field View

67
What Worked?
• After start-up issues, measurements of VOC, carbonyls and BC were within QA/QC goals and yielded important information
• Precision was calculated from colocatedsampler results at Smith St. site
• Accuracy was determined by EPA audit program

68
Precision
73Trichloroethylene75Perchloroethylene87Black carbon (1-hr)901,3-Butadiene93Formaldehyde95Chloroform97Benzene97Acetaldehyde
Percent of Samples within 30% Precision CriterionPollutant

69
What Didn’t Work?• Major disappointment – optical open-path
system• Deployed on TF Green property, next to primary
runway• Hoped to be able to see several pollutants
(benzene, toluene, acrolein, formaldehyde)• Difficulty in maintaining alignment• Higher detection limits and more noise than
expected • Other than occasional NO spike, no usable data
collected

70
Next Steps: Further Analysis of Data Collected
• Monitoring results, hourly meteorological data and detailed flight information have been compiled in an Access database
• A group at the Harvard School of Public Health, (HSPH) under contract with the FAA, is now analyzing the BC data using regression techniques to attempt to further elucidate sources, and for use in conjunction with modeling predictions
• The data will also be used in planned health studies and will be publicly available for additional analysis by other parties

71
Next Steps – Identification of Solvent Sources
• As resources permit, RI DEM is inspecting sources of chlorinated solvents in the Warwick area to determine compliance with air pollution regulations and reduce emissions where required

72
Next Steps – Monitoring (RIAC)• The RI General Assembly passed a law in 2006 requiring the RI
Airport Corp. (RIAC), the agency that operates TF Green, to establish a long-term air monitoring system around the airport beginning 1/1/08.
• RIAC plans to monitor at 4 locations using the shelters RI DEM purchased for the study. The locations are Lydick, Field View, Fire Station and a site east of the airport.
• The RIAC monitoring will include the following pollutants:– VOCs (TO-15)– Carbonyls (TO-11a)– PM2.5 (FRM)– Ultrafine particulate matter (particle counters)– PAHs/semivolatiles (TO-13a and continuous particle-bound PAH
monitors)– Black carbon (aethalometers)
73
Next Steps – Monitoring (FAA)• The HSPH, working for FAA, plans to conduct 3 one-week sampling
campaigns in fall 2007 and winter and spring 2008.• At 2 fixed sites, they will measure BC, PM2.5 (continuous), ultrafine
particles (UF-PM), PAHs and nitro-PAHs (12-hr avg), VOCs (6-hr avg), carbonyls (24-hr avg), NO, CO2 and meteorological parameters
• Palmes tubes will be used to collect 200 one-week integrated passive NOx samples throughout the area to study spatial variations of pollutant levels
• Also plan to conduct mobile monitoring (on foot/in vehicle) to evaluate spatial variance (UF-PM, PM2.5, EC and CO2)
• Purpose of FAA monitoring:– Develop techniques to better determine contribution of airport emissions
to community-scale exposures– Build a model to estimate the de minimis emission rates of air toxics
from airports
74
Next Steps – Monitoring (RI DEM)
• RI DEM was tentatively approved for a second EPA Community Assessment grant to conduct follow-up monitoring around TF Green in 2008
• Grant application focused on gathering data needed to further understand the health implications of the BC results in the first study (continuous PAH, UF PM –particle count and surface area, BC and PM2.5)
• In view of new RIAC monitoring requirements and FAA study, RI DEM plans to either withdraw grant application or request a reduced scope that would supplement rather than duplicate other efforts

75
Next Steps – Health Assessment
• Airport legislation also required RIAC to fund RI Dept. of Health (HEALTH) up to $200,000 over 2 year period for health studies around TF Green
• HEALTH plans to:• Continue investigation of lung cancer data
over time.• Investigate hospital discharge, emergency
room and other surveillance data for diseases other than cancer in Warwick