textile industry: profile and dsm options - infohouseinfohouse.p2ric.org/ref/28/27014.pdftextile...
TRANSCRIPT

Electric Power Research Institute
TEXTILE INDUSTRY: PROFILE AND DSM OPTIONS
Prepared by RESOURCE DYNAMICS CORPORATION and BATrELLE-COLUMBUS DIVISION

R E P O R T S U M M A R Y SUBJECTS Demand-side planning / Industrial / Market assessment
TOPICS Demand-side management Industrial technology alternatives Demand-side planning Marketing Electrotechnology Load management
AUDIENCE Customer service representatives / Demand-side, R&D, and corporate planners / Marketing managers
Textile Industry: Profile and DSM Options Demand-side management approaches and emerging electro- technologies promise to increase the efficiency and productivity of the textile industry. This guidebook provides utilities with a comprehensive overview of the textile industry's challenges, manufacturing processes, technologies, and energy-use patterns, as well as opportunities for electrotechnologies and demand-side management options.
BACKGROUND Throughout the utility industry, demand-side management (DSM) is gain- ing greater acceptance as a resource that promotes value for utilities as well as their customers. The great diversity in industrial business situations and energy-use patterns, however, often makes it difficult to understand how to apply DSM in the industrial sector. By better understanding their customers' needs and the technology options available, utilities can develop programs that are more successful in promoting DSM and electrotechnology applications.
OBJECTIVES To identify opportunities for improving energy efficiency, enhancing pro- ductivity, and promoting load management objectives.
-To help utilities develop and implement DSM programs.
APPROACH On the basis of literature surveys and interviews with experts in the textile and utility industries, investigators created this guidebook to describe the textile industry and advise on the selection of appropriate DSM and electro- technology approaches. As background for their research, they relied on the DSM framework developed under EPRl's DSM project (report -
.~ EAIEM-3597).
RESULTS This guidebook presents a detailed profile of the textile industry, providing information about the markets, processes, technologies, and energy-usage patterns of the major types of customers in this industry. Following the
- ~
framework of the DSM project, it presents the DSM technologies and market implementation methods appropriate for achieving the various load-shape objectives within the textile industry. It describes a step-by-step approach for the development of a DSM plan that can help not only the utility but
~
EPRl CU-6789s Electric Power Research Institute

~~~ ~
also textile customers, through lower energy costs, greater productivity, and improved product quality.
This textile industry guidebook is part of a broad framework of tools and data designed to assist utilities in working with the industrial sec- tor. These products help utilities better understand and meet the needs of their industrial customers. They also suggest how utilities can help achieve their load-shape objectives in the industrial sector. Among EPRl's other industry-related products is IMlS (Industrial Market Infor- mation System software), available through the Electric Power Software Center, to help utilities identify markets for various electrotechnologies. In addition, lndustrial Load Shaping: An lndustrial Application of DSM (report CU-6726) describes a methodology and real-world applications of DSM in the industrial sector. Tech Applications and Tech Commentaries, available through EPRl's Centers for Materials Production and Materials Fabrication, further explain how industries can benefit from electrotech- nologies. And lndustry Briefs, currently under development and available in mid-1990, will provide insight into industrial processes, technologies, and energy-use patterns at the three- and four-digit SIC level. When used together, these documents will aid in development of DSM pro- grams that will benefit both utilities and their industrial customers.
EPRl PERSPECTIVE
-~ ~ ~~~
~
~~
~
PROJECT RP2885-1 EPRl Project Manager: Paul C. Meagher Customer Systems Division Contractors: Resource Dynamics Corporation; Battelle-Columbus Division
For further information on EPRl research programs, call EPRl Technical Information Specialists (415) 855-2411.

Textile Industry: Profile and DSM Options
CU-6789 Research Project 2885-1
Final Report, July 1990
Prepared by
RESOURCE DYNAMICS CORPORATION 8605 Westwood Center Drive
Vienna, Virginia 22180
BATTELLE-COLUMBUS DIVISION 505 King Avenue
Columbus, Ohio 43201
Prepared for
Electric Power Research Institute 3412 Hillview Avenue
Palo Alto, California 94304
EPRl Project Manager P C. Meagher
Demand-Side Planning Program Customer Systems Division

ORDERING INFORMATION
Requests for copies of this report should be directed to Research Reports Center . (RRC), Box 50490, Palo Alto, CA 94303, (415) 965-4081. There is no charge for reports requested by EPRl member utilities and affiliates, U.S. utility associations, U.S. government agencies (federal, state, and local), media, and foreign organizations with which EPRl has an information exchange agreement. On request, RRC will send a catalog of EPRl reports.
Clecinc Power Research Institute and EPRl are registewd service mark of Electric Power Research Institute, Inc
Copyright 0 1990 Electric Power Research Institute, Inc All rights reserved
NOTICE This report was prepared by the organmtion(s) named below as an account Of w r k sponsored by the Electr~c Power Research Institute. Inc (EPRI) Neither EPRI, members of EPRI. the arganiralion(s) named below, nor any pefson acting on behalf Of any of them, (a) makes any warranty, enpress or impled. with respect to the use of any information. apparatus. method. or process disclosed in this repon 01 that such use may not infringe privately owned rights: or (b) assumes any liabilities with respect to the use of, or lor damages resulting from the use of. any information. apparatus. method, or process disclosed in this report.
Prepared by Resource Dynamics Corporation Vienna. Virginia and Banelie-Columbus Division Columbus, Ohio

ABSTRACT
The T e x t i l e I n d u s t r y Guidebook provides e l e c t r i c u t i l i t y p lanning, marketing, and customer serv ice s t a f f w i t h a p r a c t i c a l t o o l t o b e t t e r understand the t e x t i l e indus t ry and t h e chal lenges i t faces: i t s manufacturing processes, technologies, and energy use; and i t s o p p o r t u n i t i e s f o r demand-side management (DSM). concludes w i t h guidance and summary data f o r developing and eva lua t ing DSM plans t o r e a l i z e such oppor tun i t ies .
The Guidebook
iii

ACKNOWLEDGMENTS
The Resource Dynamics Corporat ion and Battelle-Columbus D i v i s i o n wish t o thank t h e numerous t e x t i l e companies, associat ions, equipment supp l i e rs , government agencies and u t i l i t i e s t h a t ass i s ted i n p rov id ing in format ion used i n t h i s study. p a r t i c u l a r no te were t h e con t r i bu t i ons o f D r . Gary N. Mock o f North Caro l ina State U n i v e r s i t y and N. James Covington.
O f
Paul Meagher o f t h e Demand-Side Planning Program o f t h e Customer Systems D i v i s i o n (CSD) coordinated t h i s p ro jec t . I. L e s l i e Harry and K. R. Amarnath o f CSD's I n d u s t r i a l Program provided va luable review and inpu t , as w e l l as t h e T e x t i l e Indus t r y Scoping Study, an important precursor t o t h i s Guidebook.
Resource Dynamics Corporat ion B a t t e l le-Columbus D i v i s i o n February, 1990
V

CONTENTS
Sect i o n
EXECUTIVE SUMMARY Purpose o f t h e Guidebook The T e x t i l e Indus t r y Business and Product Trends Manufacturing Processes and Energy Use Ge t t i ng Star ted : Charac ter iz ing Potent i a1 DSM Oppor tun i t ies
1 OVERVIEW OF THE TEXTILE INDUSTRY Purpose o f the Guidebook The T e x t i l e Indus t r y Business and Product Trends E l e c t r i c i t y ' s Role i n Improving Competit iveness Oppor tun i t ies f o r the E l e c t r i c U t i l i t y I ndus t r y How t o Use t h i s Guidebook Organizat ion o f t h i s Guidebook
2 MEETING TEXTILE-CUSTOMER NEEDS THROUGH ELECTRICITY T e x t i l e E l e c t r i c i t y Use by Indus t r y Segment and Process Importance o f E l e c t r i c i t y Competing Technologies and Energy Sources Technology Acqu is i t i on and Decision Making A b i l i t y t o Modify E l e c t r i c i t y Use DSM Program Oppor tun i t ies and Constraints
3 DSM PLANNING AND IMPLEMENTATION S e t t i n g DSM Object ives I d e n t i f i c a t i o n o f Appropr iate DSM Programs Eva lua t ion and Se lec t ion o f DSM Programs Program Implementation Program Moni to r ing
5-1 5-1 5-1 5-5 5-8 5-13
1-1 1-1 1 - 2 1-3 1-5 1-6 1 - 7 1-10
2-1 2 - 3 2 - 3 2 - 5 2 - 7 2 - 9 2-11
3 - 1 3-2 3- 2 3 - 3 3-8 3-8
v i i

CONTENTS (Continued)
Section
4 DEVELOPING A DSM PLAN FOR THE TEXTILE INDUSTRY Organiz ing f o r DSM Step 1. I d e n t i f y and Character ize T e x t i l e Customers Step 2. Analyze T e x t i l e E l e c t r i c Loads and End Uses Step 3. I d e n t i f y Appl icable DSM Technologies and Process Changes Step 4. I d e n t i f y Market Implementation Methods Step 5. Evaluate and Select DSM Programs Step 6. Develop Tex t i l e - Indus t r y DSM Plan
APPENDIX A OVERVIEW OF THE TEXTILE INDUSTRY The T e x t i l e Indus t r y Supp l ie rs t o t h e T e x t i l e Indus t r y Major Markets and End Uses o f T e x t i l e M i l l Products
Regional Impacts o f T e x t i l e Production Segmentation and Spec ia l i za t i on Indus t r y Concentrat ion Competit ive Forces and Imports Cost-Based Competit ion Impact o f Competit ive Responses Business and Product Trends
APPENDIX B MANUFACTURING PROCESSES AND ENERGY USE U n i t Processes i n Dry Processing U n i t Processes i n Wet Processing T e x t i l e Production Costs T e x t i l e Manufacturing Processes and Technologies Energy Consumption in t h e T e x t i l e Indus t r y
E l e c t r i c i t y Use i n t h e T e x t i l e Indus t r y Energy Consumption by S p e c i f i c Processes
4 - 1 4 - 1 4 - 2 4 - 5 4-8 4 - 9 4-15 4-18
A- 1 A - 1 A - 3 A - 5 A-8 A-12 A-13 A-14 A-17 A-22 A-25
8- 1 B-8 8-12 8-14 6-17 B-19 8-25 B-30
v i i i

CONTENTS (Continued)
Sect ion
APPENDIX C TEXTILE INDUSTRY ELECTROTECHNOLOGY EQUIPMENT SUPPLIERS Adjustable Speed Dr ive Equipment Suppl iers Heat Exchangers and Heat Recovery Equipment Suppl iers I n f r a r e d Processing Equipment Suppl iers I n d u s t r i a l Process Heat Pump Equipment Suppl iers Microwave Heating and Drying Equipment Suppl iers Radiofrequency Heating and Dry ing Equipment Suppl iers
U l t r a v i o l e t Cur ing Equipment Suppl iers
APPENDIX D DESCRIPTIONS OF SELECTED ELECTROTECHNOLOGIES FOR THE TEXTILE INDUSTRY
Radiofrequency Drying and Heating I n d u s t r i a l Process Heat Pumps Membrane Processes U l t r a v i o l e t Cur ing
Microwave Processing
c -1 c - 3 c - 4
C-6 c - 7 C-8 c -9
D - 1
0- 1 0-6 D-17 D-32 D-42
i x

ILLUSTRATIONS
Fiqure
5-1
5-2
5-3
5-4
2-1
2-2
4-1
4-2
4-3
A - 1
A-2
A-3
8-1
8-2
8-3
8-4
B-5
8-6
8-7
8-8
B-9
The T e x t i l e Complex
Import Share o f T e x t i l e Markets
Basic Processes i n T e x t i l e Manufacturing
Importance o f E l e c t r i c i t y as an Energy Source:
Basic Processes i n T e x t i l e Manufacturing
Importance o f E l e c t r i c i t y as an Energy Source
Load P r o f i l e s f o r T e x t i l e M i l l s
U t i l i t y vs. Customer Benef i t s
I l l u s t r a t i v e DSM Plan: S t ra teg i c Conversation
The T e x t i l e Complex
End Uses o f T e x t i l e M i l l Products
1985 T e x t i l e Indus t r y Shipments by Sta te
Basic Processes i n T e x t i l e Manufacturing
Yarn Formation: Process Flow, Energy Inputs, and Process Outputs
Fabr ic Formation: Process Flow, Energy Inputs, and Process Outputs
F loo r Coverings: Process Flow, Energy Inputs, and Process Outputs
Nonwovens: Process Flow, Energy Inputs, and Process Outputs
T e x t i l e F in ish ing : Process Flow, Energy Inputs , and Process Outputs
1985 T e x t i l e Energy Use
1985 T e x t i l e Indus t r y E l e c t r i c i t y End Uses
1985 Manufacturing E l e c t r i c i t y Use by Region
T e x t i l e Indus t r y
5-2
5-5
5-8
s- 10
2-1
2-4
4-6
4-18
4-20
A - 2
A - 7
A-8
8-1
8-3
8-4
8-5
8-6
8-7
8-26
8-27
8-29
x i

ILLUSTRATIONS (Continued)
Figure
B-10
D- 1
D-2
D-3
0-4
D-5
D-6
D-7
D-8
D-9
D-10
D-11
D-12
D-13
D-14
1985 Process Heat Energy Sources
Dry ing o f T e x t i l e Spools
Closed-Cycle Heat Pump System
Open-Cycle Heat Pump
Open-Cycle I n d u s t r i a l Heat Pump
Permse lec t iv i t y o f RO and UF Membranes
General ized Schematic o f T e x t i l e Treatment Processes
Membrane-Based Hybr id L i q u i d Separation Process
Spiral-Wound, Hollow-Fine-Fiber, and Flat-Element Membrane
Cross Sect ion of a Tubular RO Membrane and Schematic o f a Tubular RO Membrane Module
The Separat ion Spectrum
UV Cur ing Process
Types o f UV Sources
Commercial UV Processor Un i ts
Schematic Representation o f D i e l e c t r i c Hysteres is Heating
D-15 Comparison o f Microwaves and Conventional Drying
B-35
D-3
D-6
0-7
D-10
D-19
D-20
D-23
D-24
D-25
D-27
D-33
D-35
D-36
D-42
D-43
x i i

TABLES
s-1
S-2
s-3
s - 4
1-1
2 - 1
2-2
2-3
2 - 4
4-1
4-2
4 - 3
4-4
4 - 5
A-1
A-2
A-3
A-4
A-5
A-6
A-7
A-8
Textile Industry Summary: Industry Segments
Textile Industry Summary: Unit Processes or End Uses
Textile Industry Summary:
Textile Industry Summary: DSM Market Implementation Methods
Textile Industry Summary:
1985 Electricity Consumption by Specific Textile Processes
1985 Non-Electric Energy Consumption by Specific Textile Processes
Selected Competing Energy Technologies
1985 Textile Industry Electricity Costs and Intensity
Textile Industry Summary: lndustry Segments
Textile Industry Summary:
Textile Industry Summary:
Textile Industry Summary:
Textile Industry Summary:
1985 Overview of the U.S. Textile Industry
1985 Suppliers to the Textile Industry (Projected)
1985 Manufacturing Sector Suppliers to the Textile Industry (Projected)
1985 Manufacturing Sector Buyers of Textile Mill Products (Projected)
1986 Regional Manufacturing Activity
1985 Textile Industry Manufacturing Activity
1986 Regional Impacts o f Textile Manufacturing
Ratios of Primary Product Specialization in Selected Textile Mills (Percent)
DSM Technologies and Process Changes
DSM Technologies and Process Changes
Industry Energy Use
Unit Processes or End Uses
DSM Technologies and Process Changes
DSM Market Implementation Methods
xiii
5-14
5-17
5-20
5-23
1-8
2- 4
2- 6
2- 8
2-12
4- 4
4- 7
4 - 1 0
4 - 1 2
4-16
A- 2
A- 3
A- 4
A- 6
A-10
A-11
A-11
A-13

Table
A-9
A-10
A - 1 1
A-12
A-13
A-14
A-15
A-I6
A-17
B-1
8-2
8-3
8-4
B-5
B-6
8-7
B-8
B-9
B-10
B-11
B-12
TABLES (Continued)
Share o f T e x t i l e Shipments Accounted f o r by 20 Largest Companies (Percent)
Import Share o f T e x t i l e Markets (Percent)
Index o f Production f o r t h e T e x t i l e Indus t r y
Hourly Compensation Rates f o r T e x t i l e Production Workers
1983-1985 Permanent T e x t i l e Plant Closings i n the Southeast
New Cap i ta l Expenditures i n t h e T e x t i l e M i l l I ndus t r y
Trends i n U.S. T e x t i l e Indus t r y P r o d u c t i v i t y ( P r o d u c t i v i t y Indexes - 1977 = 100)
Comparative Rates o f Modernization i n Spinning and Weaving, 1985 (Percent)
Import Share o f T e x t i l e Machinery Market (Percent)
Dry and Wet Processing M i l l s Categories
T e x t i l e Indus t r y Average Costs Per D o l l a r o f Output by Cost Category and 3 - D i g i t S I C , 1985
T e x t i l e Indus t r y U n i t Labor Cost by Type, 1985
Sta te-o f - the-Ar t Text i 1 e Manufacturing Techno1 og i es--Dry Processing
Sta te-o f - the-Ar t T e x t i l e Manufacturing Technologies--Wet Processing
Advanced T e x t i l e Manufacturing Technologies
Tota l Energy Consumption i n t h e T e x t i l e Indus t r y
1985 T e x t i l e Indus t r y Energy Costs and Energy I n t e n s i t y
Energy I n t e n s i t y i n t h e T e x t i l e Indus t r y
Energy P r o d u c t i v i t y Trends i n t h e T e x t i l e Indus t r y
E l e c t r i c i t y Consumption i n t h e T e x t i l e Indus t r y
1985 T e x t i l e Indus t r y E l e c t r i c i t y Use i n t h e Southeast
A-14
A-15
A-16 ~
A-18
A-20
A-21
~
A-23
A-24
A-25
B-8
8-14
8-16
B-18
8-20
B-21
B-22
B-22
B-24
8-24
B-26
8-29
x i v

TABLES (Continued)
6-13 Energy Consumption in Dry Processing Mills
6-14 1985 Electricity Consumption by Specific Textile Operation
6-15 Energy Consumption in Wet Processing Mills
6-16 1985 Non-Electric Energy Consumption by Specific Textile Processes
D-1 Summary of Capital and Operating Costs for Closed-Cycle Heat Pumps
D-2 Summary of Projected Capital Costs for New and Retrofit MVR Systems
D-3 Comparison of Types of Membrane Permeators
D-4 UV Lamp Operating Characteristics
D-5 Comparative Microwave Drying Data
6-31
6-32
6-34
6-36
D-13
0-14
D-28
D-37
D-45
xv

EXECUTIVE SUMMARY
Electricity is more than just the largest energy source for textile manufacturers; it is a unique and invaluable resource for improving their troubled competitive position. promise to increase significantly the efficiency and productivity of the industry.
Automation and emerging electric-based textile processing technologies
PURPOSE OF THE GUIDEBOOK
This Textile Industry Guidebook is designed to provide electric utility planning, marketing, and customer service staff with a practical tool to :
0 Understand the textile industry and the challenges it faces
0 Understand energy use and the different processes and technologies found within the industry
Identify and characterize opportunities for improving energy efficiency, enhancing productivity, and promoting load management as sound approaches that will benefit both the customer and the utility
Help develop a demand-side management (DSM) plan to realize such opportunities.
0
0
The purpose of this Executive Summary is to acquaint the reader with the primary conclusions of the study and the technical information covered in the Guidebook.
THE TEXTILE INOUSTRY
The textile mill industry produces spun yarns, thread, woven and knit fabrics, and floor coverings such as rugs and carpets. as synthetic leathers, and miscellaneous textile products such as tire cord.
It also produces nonwoven fabrics such
The textile mill industry (or for the purposes of this study, simply the textile industry) is part of the "textile complex," a system of independent enterprises
s- 1

involving many segments outside of SIC 22 and tied together by complex business relationships. Figure S-1 highlights some of the relationships between these segments.
Natural Fiber Manmade Fiber Producers Producers SICS 01,02 SIC 28
Furnishings SICS 22.23,25 SICS 26,30,
31,37.39
Figure S-1. The Textile Complex
In addition t o the textile industry (SIC 22), the textile complex consists of suppliers and markets for the textile industry. Suppliers include natural fiber producers in the agriculture industry (SICs 01 and 02), manmade fibers from the chemical industry (SIC 28), and textile machinery producers (SIC 3552). Markets include industrial fabrics (SICS 26, 30, 31, 37, and 39) , home furnishings (SICs 22, 23, and 25), and apparel (SIC 23).
The textile industry is its own biggest supplier, accounting for over 40 percent o f its inputs on a dollar basis. percent, and the agriculture sector accounts for another 8 percent.
The chemical industry represents nearly 30
The three major end-use markets (apparel fabrics, home furnishings, and industry fabrics) each account for about one-third of all textile industry shipments.

Standard Industrial Classification (SIC 22) consists of the following 3-digit SIC sectors:
SIC 221 - Cotton weaving mills SIC 222 - Manmade fiber weaving mills SIC 223 - Wool weaving and finishing mills SIC 224 - Narrow fabric mills SIC 225 - Knitting mills SIC 226 - Textile finishing (except wool) SIC 227 - Floor covering mills SIC 228 - Yarn and thread mills SIC 229 - Miscellaneous textile mills.
Reqional Impacts
Approximately 80 percent of the total U . S . textile shipments originate from the Southeast region, while about 9 percent of shipments originate from the Mid- Atlantic states of New Jersey, New York, and Pennsylvania.
Wool weaving and finishing mills (SIC 223) and narrow fabric mills (SIC 224) are concentrated in New England. This region accounts for 77 percent and 50 percent, respectively, of shipments in these two textile industry sectors. Due to the bulky nature of carpets (SIC 227), transportation costs are high, so floor covering mills are more widely dispersed in the U.S. than textile mills producing other textile products. California, Texas, North Carolina, and Tennessee.
Major carpet and rug mills are found in Georgia,
Industry Concentration
The textile industry consists of about 5,300 companies operating over 7,000 mills, ranging from highly integrated to small, independent plants. companies are small establishments performing single operations on a contract basis for other mills. The most common type of textile mill is the greige mill, in which spinning, knitting, and weaving operations are combined to produce greige goods--unfinished textile products.
Many of these
5-3

Industry concentration varies from segment to segment. The highest concentration ratios are found in the cotton and manmade fiber industries (SICs 221 and 222) where the 50 largest firms accounted for approximately 97 and 90 percent of shipments in those sectors, respectively. The four largest firms accounted for 41 and 40 percent, respectively. The industry segments with the lowest concentration ratios are the knitting mills, textile finishing, and yarn and thread mills. Many of these mills are small, independently owned operations.
With the recent number of mergers and acquisitions, these concentration ratios have increased considerably.
Production Costs
Production costs in the textile industry, as in all other manufacturing sectors, consist of labor, raw material, energy, and other costs such as the cost of financial and insurance services, capital charges, and non-production supplies. Across all 3-digit textile SIC categories, raw material costs account for 40-70 percent of the average costs per dollar of output, averaging about 60 percent.
Raw materials consist mostly of fiber or yarn staple. chemical dyes are also a major raw material. textile sector whose raw materials cost captures the largest share (69 percent) o f
a dollar of output.
In finishing plants, The floor coverings industry is the
Labor costs average about 22 percent per dollar of output in the textile industry, but is as high as 29.7 percent in narrow fabric mills (where considerable detailed work is required to produce specialty items such as laces, beltings, ribbons, and bindings) and as low as 11.9 percent in floor covering mills (SIC 227).
Fossil energy costs average about 1.3 percent of dollar output in SIC 22, but are higher in the textile finishing segment (SIC 226) due to the many fossil-fuel- based finishing and coating processes in that particular segment. Electricity cost per dollar of output in the textile industry as a whole averages about 2.3 percent. sector (SICs 20-39) averages about 1.4 percent. Spinning and weaving mills are the most electricity intensive. electricity costs are 3 . 9 percent, 3.5 percent, and 3.8 percent of shipments, respectively.
Electricity cost per dollar of output for the entire manufacturing
In these mills (SICs 221, 222, and 228)
s-4

BUSINESS AN0 PRODUCT TRENDS
In t h i s , t h e o l d e s t o f American manufacturing i ndus t r i es , many of the bas ic manufacturing methods have no t changed f o r decades o r longer. The t e x t i l e i ndus t r y i s conservat ive and has been slow t o accept techno log ica l change. Recently, however, cheaply produced fo re ign t e x t i l e products have gained a foo tho ld i n many domestic markets f o r c i n g we l l -es tab l i shed manufacturers t o reexamine t h e i r competit iveness. new chemical f i b e r s , and soph is t i ca ted t e x t i l e machinery must now be accommodated. Domestic and i n t e r n a t i o n a l compet i t ion and technology have combined t o fo rce changes i n t e x t i l e manufacturing methods.
R is ing labor costs , a rap id ly -g rowing array o f
R is ing imports o f t e x t i l e products now present a formidable economic t h r e a t desp i te steady increases i n shipments, m i l l consumption o f f i b e r , and capac i ty u t i l i z a t i o n . As shown i n F igure S-2, i n 1975, 14 percent o f a l l t e x t i l e goods so ld i n t h i s count ry were imported; over 37 percent were imported i n 1986. apparel f a b r i c s sector , impor ts captured over 50 percent o f t he market i n 1986.
I n the
Apparel and Apparel Fabric
1970 1975 1980 1985
Year
Figure S-2. import Share o f T e x t i l e Markets
s-5

Most U.S. i n d u s t r i e s have seen domestic market shares he ld by impor ts increase due t o a s t rong U.S. d o l l a r and a U.S. government p o s i t i o n favo r ing f r e e t rade. t e x t i l e i n d u s t r y s i t u a t i o n has been a d d i t i o n a l l y a f f e c t e d by i t s h igh l abo r i n t e n s i t y (some 22 percent o f t o t a l output d o l l a r s ) and by i t s dependence on f o r e i g n sources f o r t e x t i l e machinery. t e x t i l e machinery market. t o seek ways t o improve performance by working towards f i v e impor tant goals described i n t h e f o l l o w i n g paragraphs.
The
Imports ho ld nea r l y 60 percent o f t he This compet i t ion has forced t h e U.S. t e x t i l e i ndus t r y
Improving Labor P r o d u c t i v i t y
I n response t o increased f o r e i g n compet i t ion, t h e i ndus t r y i s now at tempt ing t o reduce the l a b o r content o f i t s products. employment dec l ined 15 percent w h i l e shipments increased by 13 percent. were a l so cut, and constant d o l l a r value-added per f u l l t ime equ iva len t employee i n t h e t e x t i l e i n d u s t r y grew f a s t e r than the average f o r a l l manufacturing. t e x t i l e f i r m s c u t l abo r costs , they increased c a p i t a l expenditures.
Between 1980 and 1985, t e x t i l e i ndus t r y Wages
A s
Improving Process E f f i c i e n c y
T e x t i l e manufacturing invo lves mu1 t i p l e , r e p e t i t i v e batch processing. This genera l l y requ i res considerable manual inspec t ion and i n t e r v e n t i o n because most technologies do n o t perform op t ima l l y o r lend themselves t o automation. In the pas t , workers had t o be employed t o de tec t and r e p a i r breakages r e s u l t i n g from poor f i b e r q u a l i t y and t o avoid over- o r under-processing o f f a b r i c i n the f i n i s h i n g processes. Now, automation i s made poss ib le by the increased use o f syn the t ics , more un i fo rm q u a l i t y i n na tu ra l f i b e r s , and advanced sp inn ing and weaving technologies.
Synthe t ic f i b e r s and improved na tu ra l f i b e r s e l im ina te t h e need f o r constant manual inspec t ion . New technologies o f f e r f a s t e r f i b e r and fab r i c processing speeds and d imin ish the r i s k o f expensive and t ime consuming breakage r e p a i r s . Today, some t e x t i l e producers are experimenting w i t h fas te r -d ry ing dyes and technologies designed t o e l im ina te many in termediate process steps. companies a re a l so moving toward computerized mon i to r ing and c o n t r o l o f product ion processes and automated inspec t ion procedures t o ensure f i b e r , yarn, and f a b r i c q u a l i t y a t a l l p roduc t ion stages.
T e x t i l e
S-6

Improving Product Quality
The development of durable synthetic fibers and higher agricultural standards for natural fibers has yielded improvements in yarn strength, uniformity, and cleanliness. o f which can be attributed to technology advances: improved fiber blends can be achieved by opening and picking equipment; new carding technology achieves better integration of fibers which results in fewer breakages; new loom designs process yarns at faster speeds; and state-of-the-art spinning machines produce first- quality fabric in a shorter period than conventional equipment.
These advances in fiber quality lead to higher fabric quality, much
Reducins Production Costs
Although the U.S. textile industry's productivity level grew at a faster rate than the average for all manufacturing between 1976 and 1986 (5.2 percent annually compared to 2.8 percent), additional productivity improvements must be realized to maintain a presence in today's competitive market. production costs through a number of methods. production processes, for example, combining processes or using faster-drying dyes, would allow products to get to market more quickly. developments in fiber and fabric types require that newly-developed production processes be carefully researched to ensure applicability to all fibers and fabrics.
Textile companies can lower Simplifying and accelerating
Today's rapid
Meeting Environmental Requlations
Electrotechnologies can be used, directly and indirectly, to meet federal, state, and local environmental restrictions placed on the textile industry. Direct environmental benefits from electrotechnologies appear to be promising. For example, membrane separation processes allow for recycling and recovery of useful thermal energy and chemicals used in textile drying and finishing, thus reducing the amount of hazardous chemicals disposed of by mills. Heat exchangers and heat recovery systems perform the same recycling task with similar advantages. Electricity used in lieu of conventional thermal processes eliminates or reduces point-source emissions. of conventional thermal energy processes are replaced with electric-based technologies.
This indirect benefit can be substantial if large numbers
s-7

MANUFACTURING PROCESSES AND ENERGY USE
Floor Covering
Formation -+ Formation Yarn
Typica l t e x t i l e manufacturing f a c i l i t i e s are made up o f one o r more o f f i v e bas ic processes: f a b r i c , f l o o r coverings, and nonwoven f a b r i c ) , and f i n i s h i n g . then be ca tegor ized i n t o two types o f processing, d r y and wet.
yarn formation, t h ree classes o f ma te r ia l format ion (woven/kn i t ted These processes can
I Finishing/
; Dyeing
I
Basic T e x t i l e Processes
I I I
Nonwoven
Figure categor ies.
5-3 dep ic t s t h e r e l a t i o n s h i p among these processes and processing Each o f t h e f i v e bas ic processes i s b r i e f l y descr ibed below.
b Fabric Formation
I
I
Wet Processing (Finishing Mills)
Dry Processing 1- (Greige Mills)
Figure S-3. Basic Processes i n T e x t i l e Manufacturing
Yarn Formation. var ious p i ck ing , combing, and t w i s t i n g processes. as p ick ing , card, and combing machines gather f a b r i c s l oose ly i n t o a c o r d - l i k e form known as a s l i v e r . increase al ignment, then through a rov ing frame t o apply t w i s t .
Natura l o r manmade f i b e r s o r blends are spun i n t o yarn through Yarn format ion equipment such
These s l i v e r s are passed through drawing frames t o
S-8

Woven o r K n i t t e d Fabr ic Formation. Fabr ic format ion i nvo l ves t h e conversion o f yarn i n t o f a b r i c . A warping machine winds numerous separate strands o f yarn onto a beam. s ta rch , wax, o i l s , and water, t o coat and strengthen t h e yarn i n p repara t i on f o r f u r t h e r processing. The yarn i s then woven o r k n i t t e d i n t o grey, o r unf in ished, f a b r i c .
A s lash ing machine t r e a t s t h e yarn w i t h a s ize , which i s a ho t s o l u t i o n o f
F l o o r Covering Formation. t u f t i n g , a process where yarn i s at tached t o t h e carpet backing d i r e c t l y .
F loo r coverings are produced e i t h e r by weaving o r by
Nonwoven Fabr i c Formation. bound toge the r us ing adhesive chemicals o r heat. i n t h e i n d u s t r i a l and home f u r n i s h i n g sectors. p e c u l i a r operat ions t o t h i s process.
I n nonwoven f a b r i c format ion, yarns o r f i b e r s are Nonwoven f a b r i c s a re mainly used
Web forming and bonding are
F in i sh inq . i nc lude bleaching, mercer iz ing, dyeing, san fo r i z ing , and heat s e t t i n g . These operat ions are designed t o impart q u a l i t i e s such as c o l o r fastness, f e e l , and p r o t e c t i o n f rom shrinkage.
F i n i s h i n g processes vary w i t h t h e f a b r i c and product end-use; they
These f i v e bas i c processes i n v o l v e numerous and sometimes r e p e t i t i v e batch operat ions, which can be placed i n t o two broad categor ies--dry and wet, depending on whether o r n o t a l i q u i d i s involved.
Dry processing o f t e n takes p lace i n gre ige m i l l s and inc ludes a l l t h e t e x t i l e processing operat ions t h a t take p lace through t h e stage where t h e yarn i s spun and t h e woven o r k n i t t e d grey f a b r i c i s formed (except s lashing) . opening, blending, carding, spinning, weaving, and k n i t t i n g .
They i nc lude
Wet processing i nvo l ves t h e m a j o r i t y o f processes t h a t dye o r f i n i s h t h e spun yarn o r woven/knit g r e i g e f a b r i c o r f l o o r covering. Also inc luded i n wet processing i s
s lashing, which takes p lace p r i o r t o f a b r i c o r yarn dyeing and/or f i n i s h i n g but invo lves t h e a p p l i c a t i o n o f l i q u i d chemicals t o t h e yarn. in tegrated.
Some m i l l s are now
s-9

T e x t i l e Indus t r y Energy Use
As shown i n F igure 5-4, e l e c t r i c i t y provides 31 percent o f the t o t a l energy used i n t h e t e x t i l e i n d u s t r y and represents t h e i n d u s t r y ' s l a r g e s t source. compares w i t h t h e market share o f 19 percent he ld by e l e c t r i c i t y f o r the e n t i r e manufacturing sec to r (SICS 20-39).
This
Coal 19%
Figure S-4. Importance o f E l e c t r i c i t y T e x t i l e Indus t r y as an Energy Source:
Less than one percent o f e l e c t r i c i t y i s self-generated. t e c h n i c a l l y v i a b l e op t i on f o r meeting some o f t h e i n d u s t r y ' s e l e c t r i c needs, due t o t h e l a r g e amounts o f process steam requ i red f o r d r y i n g and f i n i s h i n g , t h e existence o f waste products ( f i b e r s t h a t can be i nc ine ra ted ) , and t h e presence o f waste heat. However, many t e x t i l e p l a n t s are small establ ishments which may no t be able t o a f f o r d t h e c a p i t a l investment requ i red t o cogenerate.
Cogeneration i s a
The pr imary end uses o f e l e c t r i c i t y i n the t e x t i l e m i l l i ndus t r y are motor d r i v e , l i g h t i n g , and process heat.
e l e c t r i c i t y consumed i n the t e x t i l e m i l l i ndus t ry . L igh t i ng , represent ing 15 percent, i s t h e nex t l a r g e s t e l e c t r i c i t y consumer: process heat ing app l i ca t i ons represent on l y about 2 percent.
Motor d r i v e accounts f o r 83 percent o f t h e
Motor d r i v e e l e c t r i c i t y use i s broken down i n t o ma te r ia l s processing (45 percent ) , ma te r ia l s hand l ing (35 percent) , and pumps, fans, and compressors (about 20
s-10

percent). Materials-processing equipment performs the separating, combing, and other materials-processing steps that are carried out during spinning and weaving. Opening and card machinery, which use their steel fingers for plucking and combing, and spinning machinery, which twists and separates fibers, are materials- processing equipment.
Materials-handling activities take place throughout textile manufacturing, starting from the rotating fiber-opening machinery to finishing, where fabric is printed or heat set using rollers and rolling frames. Materials handling also takes place during fabric formation where bales of fiber are moved through the mill.
Pumps, fans, and compressors account for a large portion of the electricity used in HVAC systems. About 20 percent of the energy used in finishing mills is electricity, mostly to power small motors scattered through the mill. Pumps are used for fluid processing in dyeing to pump dyes, rinse water, and other liquids into and out of dye becks. and finishing and for blowers in opening and blending machines.
Fans are also used in convection ovens used for drying
Textile Plant Enerqy Use and DSM Opportunities
The importance of energy in a particular textile mill depends on the type o f
processing that is done at the mill--wet or dry. In general, dry processes are electricity intensive while wet processes are fossil-energy intensive.
Dry Processing. The spinning, twisting, and weaving processes performed in these mills require considerable amounts of motive power. operations performed in the dry processing mill use electricity as the primary energy source. boilers burning natural gas, coal, fuel oil, or other petroleum products.
Except for slashing, all
Steam used in the slashing operation is usually generated by
Electricity supplies about 80 percent of the total energy requirements in greige mill (dry mills). in dry processing. Most of the increases will come from automation programs. A s more companies automate their plants and install computerized systems for process control, their reliance on uninterrupted electric power will increase, but only slightly.
There are few opportunities for further electricity penetration
New technology developments that might increase electricity consumed by
s-11

drive motors include mechanical moisture-removal devices such as vacuum extractors and roller squeezers.
Since a typical greige mill will have many motors running during a normal work day, there are numerous opportunities for conservation and load management in dry processing. For example, high-efficiency electric motors with adjustable speed drives can help this equipment run more efficiently, reducing overall electricity costs.
HVAC systems are also very important in greige mills because they must work with the machinery to filter out the large amounts of debris, lint, and other material generated during production processes. Impaired air quality from the collection of cotton dust in the air, for example, may create a hazard to operators as well as a risk of potentially fouling the machinery. Opportunities for heat recovery exist for HVAC systems designed to capture waste heat from machinery and redirect it into the ventilation system, thus eliminating hot spots. More-efficient spinning, weaving, and knitting technologies will also provide opportunities for conservation.
Wet Processinq. mainly to heat liquids and chemical dyes and to dry and finish textiles. heating is dominated by fossil fuels because they can heat evenly and inexpensively with readily available technologies. In textile processing, the quantity of heat, temperature, and method of application varies widely. Some methods (such as singeing) require direct applications of open flame, eliminating the possibility of electric process heat applications. Others require steam cans or calendars for the application of heat and pressure. In all cases the application and maintenance of a certain temperature is crucial to avoid over- or under-processing. The design and application flexibility of gas equipment allows ready application of heat in those processes where heat is required.
Wet processing often requires large inputs of thermal energy, Process
The textile firm's ability to modify electricity use is more pronounced in wet processing applications than in dry. spun yarn and woven or knit greige fabric. process called slashing, which takes place prior to fabric or yarn dyeing and/or finishing and involves the application of liquid chemicals to the yarn in order to improve weaving efficiency by strengthening the yarn. technologies now compete with conventional fossil-fuel-fired technologies for
The majority of wet processes dye or finish Also included in this category is a
A variety of electric
5-12

s lash ing , d ry ing , dyeing, and cur ing . Approaches f o r modi fy ing e l e c t r i c i t y use i n wet processing inc lude:
0 Increased app l i ca t i ons o f process heat ing technologies --Radiofrequency - - I n f r a r e d ' - - U l t r a v i o l e t cu r ing
--Membrane s e p a r a t i o d f i l t r a t i o n techniques - - I n d u s t r i a l process heat pumps/heat recovery systems --Thermal energy storage - -U l t rason ics --Process automation.
Examples o f i n s t a l l a t i o n s i nc lude us ing i n d u s t r i a l process heat pumps and
f i l t r a t i o n techniques t o recover waste chemicals and us ing e l e c t r i c heat ing technologies t o rep lace convent ional dyeing and d r y i n g processes. HVAC oppor tun i t i es a l s o e x i s t . t h e removal o f vapors, odors, fumes, and o the r contaminants.
0 Increased app l i ca t i ons o f o the r e lect ro technologies
F i n i s h i n g p lan ts r e q u i r e l a r g e v e n t i l a t i n g systems f o r
GETTING STARTED: CHARACTERIZING POTENTIAL DSM OPPORTUNITIES
As noted p rev ious l y , e l e c t r i c u t i l i t i e s have many oppor tun i t i es t o he lp t h e t e x t i l e i n d u s t r y f u r t h e r improve i t s compet i t ive p o s i t i o n , w h i l e a t t h e same t i m e
advancing u t i l i t y DSM ob jec t i ves . These oppor tun i t i es range from o v e r a l l energy conservat ion, t o load management, t o t h e a p p l i c a t i o n o f s p e c i f i c e l e c t r o - technologies.
I n he lp ing t o understand t h e t e x t i l e i ndus t r y and i t s p o t e n t i a l DSM oppor tun i t i es , a se r ies o f f o u r t a b l e s has been developed t o prov ide a f i r s t s tep i n c h a r a c t e r i z i n g t h e a v a i l a b l e DSM opt ions and t o summarize t h e techn ica l i n fo rma t ion prov ided i n t h i s Guidebook.
Please note t h a t t h e i n fo rma t ion represented i n each o f t h e tab les r e f l e c t s
t y p i c a l t e x t i l e p lan ts . Because s i g n i f i c a n t v a r i a t i o n s i n p l a n t design and processing equipment e x i s t , caut ion i s requi red i n us ing t h i s in format ion.
I ndus t r y Seqments
The f i r s t t a b l e (Table t h r e e - d i g i t S I C segments o f t h e t e x t i l e indus t ry .
S -1 ) summarizes t h e key c h a r a c t e r i s t i c s o f t h e n ine The in format ion includes key
S-13

T a b l e S - l
TEXTILE INDUSTRY SUMMARY: INDUSTRY SEGMENTS
industry Segment
(3-Digit Sic)
industry Trendrl comments
Industry Products
2 1 . Cotton Weaving
),err, uphoirtery. and surgical abricr
Growthin home furnishin in durtrial.and medical mar?&;
De<iinemapparel markets More CanlinuOuS produdion More frequent air changer fOT
Domination byaiviet looms product quality
12 . Manmade Fib, Weaving
I r e s . drapery. upholrlery ibergiarr.ilnd automotive abri'r
Growth in automotive and
More v"nuOus production More frequent air changer for
Domination byair.jet looms
Detline in apparel markets Espetiaily strong Lompetifion
Somespare 'apacityfar DSM Small part of textile industry
industria markets
product quality
from import i
13 - Wool Weavins Finishing
lianketi and overmat material ,nd other woolen fabrics
24. Narrow Fabric Mills
libbonrand bindings Growth in woven label. eiastx tape. and zipper markets
Decline in other markets small partoftextile industry
;iris'. boys', women'r.and men's mriery, bathing suits. neckties. lati, knitted underwear and Lightwear. jersey fabrics. lace ioodr. gloves. mittenr. and
2 5 - Knitting Mills
iedtpr&dr
>ved finished fabrics. dved Growth in blocked knits Batchdyeing has reduced dveina time
1 6 - Textile Finishing
. . ii irhed broadwoven fabrics. 8nd dyed finished narrowfabrics Inb;a& in the ele<trir
requirements from continuous d eing printing,and bLsch;na oro~e ises
Growth in tufted nylon carpst and offire carpet square1 markets
Growth in the YIB of open-end and air-Jet spinning
2 1 - Floor Coverin, Mi lk
Growth in rewing thread and textured nylon markets
Most plants havealready modernized
Growth of opemend spinning Detiine of ring spinning
Growth in syntheticnonwoven felts forautomotive. carpet. andfurniture markets
Decline in lace and upholstery padding
Growth in coated fabrics
28 - Yarnand Thread Mills
farnr, spooled yarnr.and1hread )f allfibertypes
29. Miscellaneou Textiles
mgtalion leather. o i l h t h . tire :ord. bonded fiber fabrics. braidei :ord. feitr. piiiawfiliingr. pips :overing. burlap,and other onw woven fabrics
S-14

Table S - 1 (Continued)
AppraximateAllo~atlonof EnergyUfeAmang Unif Pio~errerorEndUrer. %*
T m
'I. 0 -
/ 51
-
i
/
/
i
i
/
i i
37 -
4
-
23 -
23
-
21
-
32
30
-
25
- 14 and Waste
-
:"el Mark6 Shares by lndurtry
Segment. peK.e"l
5-15

i ndus t r y products, summary i n d i c a t o r s , i ndus t r y t rends , and energy use by u n i t process est imates.
As shown i n Table range from 0.7 percent f o r F loo r Covering M i l l s ( S I C 227) t o 3.9 percent f o r Cotton Weaving ( S I C 221). ( S I C 22) i s 2.3 percent; t h i s percentage i s q u i t e a b i t h ighe r than t h e 1 .4
percent f o r a l l o f manufactur ing ( S I C S 20-39). Th is suggests t h a t , on t h e whole, t e x t i l e customers should be more i n t e r e s t e d i n assessing t h e i r use of e l e c t r i c i t y than t h e average i n d u s t r y customer.
S-1 , f i g u r e s f o r "Purchased E l e c t r i c i t y as a % o f Shipments"
The e l e c t r i c i t y percentage f i g u r e f o r a l l o f t e x t i l e s
The opera t i ng p a t t e r n f i g u r e s d e p i c t t h e t e x t i l e i n d u s t r y as genera l l y running th ree s h i f t s pe r day, f i v e days a week w i t h an e x t r a catch-up and maintenance s h i f t on Saturdays. of p a t t e r n i s genera l l y no t favorable f o r major amounts o f load s h i f t i n g .
As a process i ndus t r y w i t h a h i g h l a b o r i n t e n s i t y , t h i s type
The f i g u r e s r e f l e c t i n g t h e a l l o c a t i o n o f energy use among u n i t process o r end uses c l e a r l y show t h e degree o f e l e c t r i c i t y use i n t h e d r y processing a c t i v i t i e s (spinning, weaving, etc.) versus t h e degree o f f o s s i l - f u e l use i n t h e wet processing a c t i v i t i e s (dyeing, d ry ing , f i n i s h i n g , etc.) . With t h e process heat ing e lec t ro techno log ies (radiofrequency, i n f ra red , etc.) t a rge ted on many o f those wet
processing a c t i v i t i e s , i t i s easy t o see how a small percentage o f market pene t ra t i on by these e lect rotechnologies could y i e l d s i g n i f i c a n t changes i n e l e c t r i c use.
holds a 31-percent f u e l market share, t h e average market share f o r i n d i v i d u a l i ndus t r y segments ( 3 - d i g i t S I C S ) va r ies s i g n i f i c a n t l y f rom 11 percent t o 59 percent.
Even though i n t h e e n t i r e t e x t i l e i n d u s t r y (SIC 2 2 ) , e l e c t r i c i t y
Add i t i ona l i n d u s t r y and business t rend in format ion about t h e t e x t i l e i n d u s t r y i s provided i n Appendix A.
I ndus t r y Processes and End Uses
The second t a b l e (Table processes i n t h e t e x t i l e i ndus t r y . p o t e n t i a l o f each u n i t process f o r achieving a l t e r n a t i v e load shape ob jec t i ves and notes regard ing processing t rends f o r each u n i t process i n t h e t e x t i l e i ndus t r y .
S-2) summarizes t h e c h a r a c t e r i s t i c s o f t h e key u n i t Included are i n d i c a t o r s o f the r e l a t i v e
S-16

- I < A
- r ID 2 5 Y
-i m x 2 r- m
z 0 t VI + W < VI c x zz D
-
2 .. c z -i
m W 0 0 m VI VI m VI
0 W
m z 0 c VI m VI
-

The opportunities for strategic load growth are primarily in the electrification of processes previously served by competing fuels. The most opportune processes include warping/slashing, washing, dyeing, drying, and finishing. of these processes fall into the wet processing category.
Naturally, most
Strategic conservation opportunities exist in wet as well as dry processing. Solid opportunities also exist in plant services, particularly in HVAC and materials hand1 ing.
Load manaqement opportunities are tied to the ability of customers to modify existing loads and/or timing of electricity consumption. management opportunities exist i n plant services.
Most of the load
Flexible load shape programs have only limited application in the textile industry. and finishing.
The major application areas are HVAC, opening/blending/picking, drying,
Some of the major processing trends featured in the table include:
0 Increase of open-end spinning
0 Potential penetration of radiofrequency into warping and slashing processes and into drying of bulky packages of fiber and yarn
0 Growth of air-jet looms
0 Trend toward combining desizing with scouring and bleaching (DSB)
0 Development of more-efficient technologies and processes for dyeing and finishing
Growth of automation and shop floor communications systems for materials handling
0
0 Increased regulatory scrutiny over waste treatment and plant ambient conditions.
Descriptions of these unit processes can be found in Appendix 8; additional process information can be found in the U.S. Department of Energy study on textile industry energy use (1).
S-18

DSM Technologies and Process Chanqes
Numerous opt ions ho ld p o t e n t i a l f o r s i g n i f i c a n t p r o d u c t i v i t y improvements, as
w e l l as p o t e n t i a l f o r some f a i r l y l a rge energy-use changes. The key technologies i n the t e x t i l e i ndus t r y appear t o be t h e process heat ing opt ions ( i n f r a r e d , radiofrequency, u l t r a v i o l e t , and u l t rason ics ) , HVAC-related op t ions ( a i r supply and c h i l l e r system op t im iza t i on ) , and the energy -e f f i c i en t and env i ronmenta l ly o r i en ted opt ions ( i n d u s t r i a l process heat pumps, h i g h - e f f i c i e n c y motors, process automation, and membrane processing).
The t h i r d t a b l e (Table 5-3) summarizes the DSM technology and process change oppor tun i t i es i n t h e t e x t i l e indust ry . The in fo rmat ion inc ludes l i s t s o f t he load shape ob jec t ives , u n i t processes, and indus t r y segments f o r which any o f 30 d i f f e r e n t DSM technologies and process changes are app l icab le . t he p o t e n t i a l impacts, compet i t ion, and t rends associated w i t h the technology.
Also inc luded are
As mentioned be fore , these summary tab les are intended as a s t a r t i n g p o i n t on ly . Var ia t ions i n a p p l i c a b i l i t y may r e s u l t due t o unique cond i t ions a t a customer's p lan t . Add i t i ona l in fo rmat ion about some o f t he process heat ing, energy- e f f i c i e n t , and env i ronmenta l ly o r ien ted opt ions can be found i n Appendix D.
Add i t iona l i n fo rma t ion about the HVAC-related and conservat ion-re la ted opt ions can be found i n Appendix E and i n t h e U.S. Department o f Energy study on t e x t i l e i ndus t r y energy use( ' ) .
DSM Market Implementation Methods
Due t o the h igh d i v e r s i t y o f t h e i n d u s t r i a l sector , customer needs and bene f i t s associated w i t h a DSM program may vary by s i z e and type o f customer. requ' ire d i f f e r e n t market implementation methods f o r d i f f e r e n t customer segments. Applying t h e appropr ia te market implementation method t o a s p e c i f i c techn ica l a l t e r n a t i v e requ i res i n s i g h t s i n t o t h e technology and t h e customer's dec is ion-
making process. appropr ia te implementation methods the re are a few gu ide l ines .
This may
While i t i s d i f f i c u l t t o genera l i ze the se lec t i on o f t he
Market implementation methods are v i t a l i n enhancing t h e market penet ra t ion o f DSM programs. cooperation, customer in fo rmat ion , d i r e c t customer contac t , d i r e c t i ncen t i ves , and a l t e r n a t i v e p r i c i n g .
These methods may be grouped i n t o f i v e major categor ies: t rade a l l y
s-19

T a b l e S-3
T E X T I L E INDUSTRY SUMMARY: DSM TECHNOLOGIES AND PROCESS CHANGES
ApplKable Load Shew Applinble UnitPIoccsIeI olEndUILI Objartwrs
s-20

Table S-3 (Continued)
Appli'abl* Industry Segments I
s-21

The f o u r t h t a b l e (Table methods can be used t o f o s t e r customer adoption o f t h e DSM technology o r process change oppor tun i ty . promoting each o f t h e 30 DSM technologies o r process changes. a l so inc luded t o p rov ide contex t f o r such promotional a c t i v i t i e s .
S-4) summarizes how the var ious market implementation
The in fo rmat ion i nd i ca tes how use fu l each method i s i n Marketing notes a r e
In programs i n v o l v i n g new technologies, customers face considerable u n c e r t a i n t i e s w i t h regard t o performance and appropr ia te app l i ca t i on . technology a p p l i c a t i o n and t e s t i n g centers, case s tud ies , t r a i n i n g seminars, performance warrant ies, and t rade a l l i e s are appropr ia te methods f o r reducing such unce r ta in t y . Customer aud i t s are use fu l i n i d e n t i f y i n g showcase app l i ca t i ons .
Demonstration p r o j e c t s ,
For programs i n v o l v i n g proven technologies, u t i l i t i e s can focus t h e i r resources on q u a l i f y i n g leads and p rov id ing f i n a n c i a l incent ives . De ta i l ed f e a s i b i l i t y s tud ies are needed f o r those proven technologies w i t h app l i ca t i ons and economic assessments t h a t are p a r t i c u l a r l y s i t e - s p e c i f i c o r are being implemented f o r the pr imary purpose o f t a k i n g advantage o f a l t e r n a t i v e p r i c i n g programs o r load management.
Another f a c t o r i n f l u e n c i n g implementation methods i s s e n s i t i v i t y t o cos t . programs focus on a p p l i c a t i o n areas where e l e c t r i c i t y i s i n d i r e c t compet i t ion w i t h o ther f u e l s o r non -e lec t r i c processes. Here f i n a n c i a l i ncen t i ves such as promotional r a t e s o r rebates a re appropr ia te.
Some
F i n a l l y , t he re i s t h e degree o f con t ro l t he u t i l i t y has over the program implementation. In some cases a u t i l i t y w i l l have on ly i n d i r e c t con t ro l over i ndus t r y o r technology trends. For example, t he swi tch t o a i r - j e t processing i n a
t e x t i l e m i l l i s in f luenced by many f a c t o r s ou ts ide the sphere o f i n f l uence o f a
u t i l i t y . However, u t i l i t i e s may in f l uence technology choices i n d i r e c t l y through j o i n t a d v e r t i s i n g programs o r by working w i t h engineering f i r m s o r t rade associat ions.
Special s i t u a t i o n s w i t h regard t o t h e customer o r t he program may warrant dev ia t i on f rom these general gu ide l ines . categor ies o f market implementation methods are provided i n Sect ion 4. equipment vendors f o r severa l o f t h e key DSM technologies i s provided i n Appendix C.
B r i e f desc r ip t i ons o f t he f i v e major A l i s t o f
s-22

Technologies
Changer
Ulilviolet Cvring
Open.End Spinning
Air.leIPiO~esting
Foam Prortrfing
T a i l Lighting
High-Ellicirnry Lightin!
T a b l e S - 4
T E X T I L E INDUSTRY SUMMARY: DSM MARKET IMPLEMENTATION METHODS
ApplVable Marketlmplt

Electric utilities need to work closely with their textile customers to take advantage of DSM opportunities. is a major barrier. Several factors argue for an increased utility focus on textile customers to help overcome this barrier:
Lack of convincing and demonstrable information
Underestimated impact of electricity. The potential impact of electricitv on textile manufacturina is considerablv underestimated bv most textiie firms.
Greater consideration is given to raw materials (such as fiber and chemicals) and labor, yet energy cost per dollar of value added to the textile industry is 9 . 3 percent; significantly higher than the 6 percent value for all manufacturing. Similarly, electricity costs per dollar of value added exceeds that for all manufacturing.
Many textile companies do not consider either energy ~
or electricity to be important inputs to their production process. -~
Lack of widespread information about electrotechnologies and DSM nroorams. New. efficient electrotechnolooies are not beina aoolied in
~ ~d ~~ ~~~ ~ . . . ..... .
iexzile mills as often as they could be. will not sell on their inherent advantages (faster speeds, energy and space savings) alone because the textile industry is not as energy- conscious as many other industry sectors. In addition, cost-cutting opportunities resulting from other DSM programs await action by the industry.
These technologies iipically
Lack of information about electricity consumption. Few firms monitor mill enerav consumotion at the level where energy characteristics for each process are known with certainty. energy standards to facilitate energy cost reduction is hampered.
Without-this information, setting
The electric utility industry can play a significant role in informing its textile customers of the benefits of existing and emerging technologies and DSM programs. This can assist utilities in competing with fossil-fuel technologies, in retaining customers, and in achieving their DSM objectives. The DSM efforts of many utilities (especially those in the Southeast) could be hindered without a strategic plan designed to include textile customers.
REFERENCE
1. Badin, Joseph S . and Lowitt, Howard E., Energetics, Incorporated, The U.S. Textile Industry: An Energy Perspective, U.S. Department of Energy through its Pacific Northwest Laboratory, Report DOE/RL/D1830--T56, Washington, D.C., January 1988. -
s-24

Section 1
OVERVIEW OF THE TEXTILE INDUSTRY
Electric utilities are vital allies of their textile customers. The textile industry relies heavily on electricity. It is used far more than natural gas, fuel oil, or any other single energy source. textile manufacturing processes and faces little competition in many applications.
Electricity powers and controls most
Electricity is more than just another energy source for textile manufacturers; it is a unique and invaluable resource for improving their troubled competitive position. Automation and emerging electric-based textile processing technologies promise to increase the efficiency and productivity of the U.S. textile industry. impacts of electrotechnologies grow, electricity will increase even more in importance to textile producers.
As the
PURPOSE OF THE GUIDEBOOK
This Textile Industry Guidebook is designed to provide utility planning, marketing, and customer service staff with practical information to explore and implement demand-side management (DSM) programs. DSM focuses on planning and implementing utility activities designed to influence customer electricity use in ways that benefit both the utility and the customer. Activities falling under the industrial DSM umbrella include load shaping programs, electrotechnology marketing, rate programs, conservation and productivity audits, rebate and trade ally programs, economic development, standby generation programs, and other customer-oriented programs. representatives, field sales staff, and strategic planners to:
In particular, the Guidebook is designed to aid utility marketing
0
0
Understand the textile industry and the challenges it faces
Understand energy use and the different processes and technologies found within the industry
Identify and characterize opportunities for improving energy efficiency, enhancing productivity, and promoting load management as ways to benefit both the customer and the utility
Develop a demand-side management (DSM) plan to realize such opportunities.
0
0
1-1

The Guidebook exp la ins the s i g n i f i c a n t impacts o f e l e c t r i c i t y on t e x t i l e i ndus t r y p r o d u c t i v i t y and describes t y p i c a l app l i ca t i ons and b e n e f i t s o f e lec t ro techno log ies and DSM programs i n t e x t i l e processing. about t e x t i l e i ndus t r y needs and t h e r o l e o f e l e c t r i c i t y i n meeting these requirements. s t a f f t o i d e n t i f y and work w i t h t h e i r customers' p l a n t managers, energy dec is ion makers, and equipment supp l ie rs t o implement decis ions f o r the mutua l l y b e n e f i c i a l use o f e l e c t r i c i t y i n t e x t i l e m i l l s . Factors and approaches t h a t can enhance t h e t e x t i l e i n d u s t r y ' s acceptance o f u t i l i t y OSM s t ra teg ies and steps t o design and implement a market ing p lan ta rge ted a t t e x t i l e i ndus t r y customers are a l so examined.
The Guidebook provides d e t a i l e d in fo rmat ion
,It a lso provides an easy-to-use se t of gu ide l ines t h a t a l l ow u t i l i t y
THE TEXTILE INDUSTRY
The t e x t i l e i n d u s t r y produces spun yarns, thread, woven and k n i t f a b r i c s , and f l o o r coverings such as rugs and carpets. miscellaneous t e x t i l e products such as t i r e cord, cordage, and twine. I n d u s t r i a l C l a s s i f i c a t i o n (SIC) 22 cons is ts o f the f o l l o w i n g 3 - d i g i t S I C sectors:
It a lso produces nonwoven f a b r i c s and Standard
S I C 221 - Cotton weaving m i l l s
S I C 222 - Manmade f i b e r weaving m i l l s
S I C 223 - Wool weaving and f i n i s h i n g m i l l s
S I C 224 - Narrow f a b r i c m i l l s
S I C 225 - K n i t t i n g m i l l s
S I C 226 - T e x t i l e f i n i s h i n g (except wool)
S I C 227 - F loo r cover ing m i l l s
S I C 228 - Yarn and thread m i l l s
S I C 229 - Miscellaneous t e x t i l e m i l l s .
There are over 7,000 t e x t i l e m i l l s i n t h e Uni ted States. The t e x t i l e i ndus t r y i s highly-concentrated, w i t h about 80 percent o f t h e i n d u s t r y ' s products o r i g i n a t i n g from t h e Southeast. Carol ina, Georgia, Alabama, Tennessee, and V i r g i n i a . I n 1985, t e x t i l e shipments from these s i x s ta tes represented approximately 75 percent o f the t o t a l shipments f o r S I C 22. Apparel f a b r i c s , home fu rn ish ings , and i n d u s t r i a l f a b r i c s , such as f i b e r - r e i n f o r c e d components and f i b e r s used i n the medical, m ic roe lec t ron i c , pharmaceutical, defense, and aerospace sectors, are the l a r g e s t end users of
The m a j o r i t y o f t h e m i l l s are loca ted i n North and South
1-2

manufactured t e x t i l e goods. and 31 percent, respec t i ve l y , o f a l l t e x t i l e m i l l shipments i n 1985.
These th ree major end-use sectors accounted f o r 35, 33 ,
BUSINESS AND PRODUCT TRENDS
In t h i s , t h e o l d e s t o f American manufacturing i n d u s t r i e s , many o f t h e bas ic manufactur ing methods have n o t changed f o r decades o r longer. i s conservat ive and has been slow t o accept technologica l change. however, cheaply produced f o r e i g n t e x t i l e products have gained a foo tho ld i n many domestic markets f o r c i n g wel l -estab l ished manufacturers t o reexamine t h e i r competit iveness. f i b e r s , and soph is t i ca ted t e x t i l e machinery must now be accommodated. i n t e r n a t i o n a l compe t i t i on and technology have combined t o f o r c e changes i n t e x t i l e manufacturing methods.
The t e x t i l e i ndus t r y Recently,
R is ing l abo r cos ts , a r a p i d l y growing a r ray o f new chemical Domestic and
R is ing imports o f t e x t i l e products now present a formidable economic t h r e a t despi te steady increases i n shipments, m i l l consumption o f f i b e r , and capaci ty u t i l i z a t i o n . I n 1975, 14 percent o f a l l t e x t i l e goods so ld i n t h i s country were imported; over 37 percent were imported i n 1986. In t h e apparel f a b r i c s sec tor , impor ts captured over 50 percent o f t h e market i n 1986. Four major f a c t o r s account f o r t h i s sharp r i s e i n imports. F i r s t , a s t rong U.S. d o l l a r du r ing t h e e a r l y 1980s made imports r e l a t i v e l y inexpensive compared t o domestic goods. Second, t h e U.S. Government's p o s i t i o n f a v o r i n g f r e e t r a d e meant t h a t t he re were no b a r r i e r s f o r t e x t i l e producers in newly i n d u s t r i a l i z e d and developing nat ions. the same modern t e x t i l e machinery t h a t has improved t h e U.S. t e x t i l e manufacturing. F i n a l l y , l a b o r costs overseas are o n l y a f r a c t i o n o f those i n t h e United States.
Th i rd , many o f these coun t r i es invested i n
This compet i t ion has fo rced t h e U.S. t e x t i l e i ndus t r y t o reexamine market ing s t r a t e g i e s and t o seek ways t o improve performance by working toward several important goals:
Improvins Labor P r o d u c t i v i t y
T r a d i t i o n a l l y , t h e t e x t i l e i ndus t r y has been h i g h l y l abo r i n tens i ve . ranks s i x t e e n t h i n value o f shipments when compared t o a l l o the r manufacturing i ndus t r i es ; however, i t i s t h e t e n t h l a r g e s t i n d u s t r i a l employer, and over 80 percent o f i t s l a b o r f o r c e i s employed i n product ion.
The indus t r y
In response t o increased
1-3

foreign competition, the industry is now attempting to reduce the labor content of its products. percent while shipments increased by 13 percent. dollar value-added per full time equivalent employee in the textile industry grew faster than the average for all manufacturing. As textile firms cut labor costs, they increased capital expenditures. As a result, the industry's capital ~
expenditure increased from $2,110 per production worker in 1980 to nearly $3,300 per production worker in 1985.
Between 1980 and 1985, textile industry employment declined 15 Wages were also cut, and constant
-~
Improving Process Efficiency
Textile manufacturing involves multiple, repetitive batch processing. This generally requires considerable manual inspection and intervention because most technologies do not perform optimally or lend themselves to automation. In the past, workers had to be employed to detect and repair breakages resulting from poor fiber quality and to avoid over- or under-processing of fabric in the finishing processes. more-uniform quality in natural fibers, and advanced spinning and weaving technologies. constant manual inspection. New technologies offer faster fiber and fabric processing speeds and diminish the risk of expensive and time-consuming breakage repairs. Today, some textile producers are experimenting with faster-drying dyes and technologies designed to eliminate many intermediate process steps. Textile companies are also moving toward computerized monitoring and control of production processes and automated inspection procedures to ensure fiber, yarn, and fabric quality at all production stages.
Now, automation is made possible by the increased use of synthetics,
Synthetic fibers and improved natural fibers eliminate the need for
Improving Product Quality
With the development of durable synthetic fibers and higher agricultural standards for natural fibers, yarn strength, uniformity, and cleanliness have been improved. These advances in fiber quality lead to higher fabric quality, much of which can be - attributed to technology advances: and picking equipment; new carding technology achieves better integration of fibers which results in fewer breakages; new loom designs process yarns at faster speeds; and state-of-the-art spinning machines produce first-quality fabric in a shorter period than conventional equipment.
improved fiber blends can be achieved by opening
-
1-4

Reducing Production Costs
Price competition is a major driving force in the textile industry. Worldwide, producers seek competitive advantages by maintaining tight controls over labor, raw material, and other production costs. Producers in developing countries, especially Asia, have an edge over their American counterparts because their productivity levels have grown faster since the late 1970s. Thus, while the U . S . textile industry's productivity level grew at a faster rate than the average for all manufacturing between 1976 and 1986 (5.2 percent annually compared, to 2.8 percent), additional productivity improvements must be realized to maintain a presence in today's competitive market.
Textile companies can lower production costs through a number of methods. Simplifying and accelerating production processes by, for example, combining processes or using faster-drying dyes, would allow products to get to market more quickly. developed production processes be carefully researched to ensure applicability to all fibers and fabrics.
Today's rapid developments in fiber and fabric types require that newly-
ELECTRICITY'S ROLE IN IMPROVING COMPETITIVENESS
The textile industry consumed 25.9 billion kWh of electricity in 1985. This consumption level represents 31 percent of the industry's total energy requirements. Thus it should not be surprising that changes in the use of electricity through DSM
programs can be of vital importance to the industry. More specifically, textile companies can improve their competitive position by sharpening their capabilities in the following areas:
0 PricefCost Control - Producing at reduced raw material, labor, or other production costs
0 Production Speed - Applying faster, efficient production methods with minimum waste while simultaneously maintaining product quality
0 Process Control - Monitoring and controlling all stages of the lengthy production process to avoid costly mistakes, maintain product quality, and optimize complex operations
Reliability - Ensuring that equipment and processes will operate without over- or under-processing, while maintaining color, yarn, and fabric quality.
0
1-5

The newer, more versatile, and powerful electric-driven machines have faster processing speeds which can increase flexibility and productivity in yarn and fabric formation. inspection procedures at various production stages can ensure yarn and fabric quality. Robotics, for example, are an effective means of efficient yarn quality inspection. Finally, streamlined and accelerated dyeing, drying, and finishing processes can cut down on overall production time and thereby lower costs.
Computerized monitoring and cbntrol of processes and automated
OPPORTUNITIES FOR THE ELECTRIC UTILITY INDUSTRY
Electric utilities have many opportunities to help the textile industry improve its competitive position, while at the same time advancing utility DSM objectives. These opportunities range from overall energy conservation, to load management, to the application of specific electrotechnologies. This Guidebook will help utility staff to understand these DSM opportunities.
Regardless of the types of programs being considered, electric utilities need to work closely with their textile customers to take advantage of DSM opportunities. Lack o f convincing and demonstrable information is a major barrier. Several factors argue for an increased utility focus on textile customers to help overcome this barrier:
0 Underestimated impact of electricity. The potential impact of electricity on textile manufacturinq is considerably underestimated by most textile firms. to be important inputs to their production process. Greater consideration is given to raw materials (such as fiber and chemicals) and labor, yet energy cost per dollar of value added for the textile industry is 9.3 percent;'significantly higher than the 6 percent value for all manufacturing. Similarly, electricity cost per dollar of value added exceeds that for all manufacturing.
0 Lack of widespread information about electrotechnologies and DSM programs. New, efficient electrotechnologies are not being applied in textile mills as often as they could be. These technologies typically will not sell on their inherent advantages (faster speeds and energy and space savings) alone because the textile industry is not as energy-conscious as many other industry sectors. In addition, cost-cutting opportunities resulting from other DSM programs await action by the industry.
Many textile companies do not cbnsider either energy or electricity
0 Lack of information about electricity consumption. enerov consumotion at the level where enerav characteristics for each
Few firms monitor mill
proc& are khown with certainty. standards to facilitate energy cost reduction is hampered.
Without"ihis information, setting energy
1-6

The e l e c t r i c u t i l i t y i n d u s t r y can p l a y a s i g n i f i c a n t r o l e i n in forming i t s t e x t i l e customers o f t h e b e n e f i t s o f e x i s t i n g and emerging technologies and DSM programs. This can a s s i s t u t i l i t i e s i n competing wi th f o s s i l - f u e l technologies, i n r e t a i n i n g customers, and i n achiev ing t h e i r DSM object ives. (espec ia l l y those i n t h e Southeast) could be hindered w i thou t a s t r a t e g i c p l a n designed t o i nc lude t e x t i l e customers.
The DSM e f f o r t s o f many u t i l i t i e s
To a i d t h e p lanner i n i d e n t i f y i n g and q u a n t i f y i n g t h e p o t e n t i a l impact o f DSM oppor tun i t i es , Table 1-1 summarizes key app l i ca t i on , market, and energy c h a r a c t e r i s t i c s o f 30 DSM technologies and process changes.
HOW TO USE THIS GUIDEBOOK
This Guidebook i s designed f o r p lanning and market ing personnel o f e l e c t r i c u t i l i t i e s . abreast o f developments i n t h e t e x t i l e i ndus t r y t h a t may a f f e c t t h e i r energy decis ions. i t s manufactur ing methods and energy use. which technologies and DSM programs are app l i cab le i n t h e t e x t i l e i ndus t r y , t o determine how c r u c i a l they are i n t h e manufacturing process, and t o evaluate t h e impact o f t h e i r adoption. DSM requ i res a unique coupl ing o f u t i l i t y ob jec t i ves , needs, and s t r a t e g i e s w i th those o f i t s customers. personnel developing DSM p lans , t h i s Guidebook l i s t s DSM o p p o r t u n i t i e s i n t h e t e x t i l e i n d u s t r y and conta ins in format ion about how t o l i n k t h e u t i l i t y ' s o v e r a l l DSM e f f o r t s w i t h t h e t e x t i l e customers' product ion processes and app l i ca t i ons . t h e same t ime, i t prov ides a l i s t o f problems and c o n s t r a i n t s associated w i th t h e p lanning o f DSM programs f o r t e x t i l e customers.
The Guidebook a l lows u t i l i t y planners and f i e l d representat ives t o keep
Appendices A and B p rov ide d e t a i l e d i n fo rma t ion about t h e i n d u s t r y and This Guidebook may be used t o i d e n t i f y
For t h e s t r a t e g i c market ing
A t
For t h e f i e l d rep resen ta t i ve who i n t e r a c t s w i t h t e x t i l e customers, t h i s Guidebook prov ides impor tant background in fo rma t ion about t h e t e x t i l e customers' business environment and manufactur ing methods. determine t h e DSM o p p o r t u n i t i e s t h a t are app l i cab le i n s p e c i f i c s i t u a t i o n s , t h e technologies t h a t a re p o t e n t i a l l y appl icable, and t h e l i k e l i h o o d o f adoption. F i n a l l y , f i e l d representat ives can r e f e r customers t o equipment supp l i e rs by using Appendix C, which prov ides a l i s t i n g o f t e x t i l e - i n d u s t r y equipment suppl iers .
This Guidebook can a l s o he lp market ing s t a f f
1-7


Table 1-1 (Continued)
1-9

ORGANIZATION OF T H I S GUIDEBOOK
Sect ion 2 discusses how e l e c t r i c i t y can be used t o meet t e x t i l e customers' needs. It exp la ins t h e r o l e o f e l e c t r i c i t y i n t e x t i l e manufacturing, and examines how t h e t e x t i l e i n d u s t r y makes energy- and technology-choice dec is ions. can be used t o assess t h e l i k e l i h o o d t h a t t e x t i l e i ndus t r y p a r t i c i p a n t s w i l l modify t h e i r e l e c t r i c i t y use. examined, as are DSM oppor tun i t ies , problems, and cons t ra in t s .
This in fo rmat ion
The l i k e l y impacts o f changes i n e l e c t r i c i t y use are a l so
Sect ion 3 focuses on DSM ob jec t i ves and impacts. evo lu t i on o f t h e DSM e f f o r t , from t h e gener ic t o the s p e c i f i c . changes and b e n e f i t s l i k e l y t o r e s u l t from adoption o f DSM plans.
This sec t ion i l l u s t r a t e s the It a lso discusses
Sect ion 4 prov ides d e t a i l s o f DSM s t ra tegy development f o r t h e t e x t i l e i ndus t r y .
l i s t s t h e f a c t o r s and considerat ions f o r des ign ing a d e t a i l e d DSM s t ra tegy f o r t he t e x t i l e i ndus t r y .
I t
Four appendices are prov ided w i t h t h i s Guidebook. of t h e t e x t i l e i ndus t r y . p roduc t ion and g ives an energy-use p r o f i l e o f t he indus t ry . vendors which supply t h e e lec t ro techno log ies t h a t may be ta rge ted t o t h e t e x t i l e - i ndus t r y DSM e f f o r t s .
Appendix A prov ides an overview Appendix B describes the technologies used i n t e x t i l e
Appendix C l i s t s
Appendix D describes some o f these e lect rotechnologies.
1-10

Section 2
MEETING TEXTILE-CUSTOMER NEEDS THROUGH ELECTRICITY
T e x t i l e manufacturing cons is ts o f f i v e bas ic processes as i l l u s t r a t e d i n Figure 2-1. i n t o yarn. Yarn format ion equipment such as p ick ing , carding, and combing machines gather f i b e r s l oose ly i n t o a c o r d - l i k e form known as a s l i v e r . passed through drawing frames t o increase alignment, then through a moving frame t o apply t w i s t .
The manufacturing process s t a r t s w i t h t h e conversion o f raw f i b e r s
These s l i v e r s are
Knitted Fabric
Formation
I Yarn Floor I Finishing/
Dyeing Covering Formation Formation -
I
t
!
4 Dry Processing Wet Processing I (Greige Mills) (Finishing Mills)
Figure 2-1. Basic Processes i n T e x t i l e Manufacturing
The second bas ic p roduc t ion step i s t h e conversion o f yarn i n t o f a b r i c . machine winds numerous separate strands o f yarn onto a beam. A s lash ing machine t r e a t s t h e yarn w i t h a s ize , which i s a ho t s o l u t i o n o f starch, wax, o i l s , and
water, t o coat and strengthen the yarn i n p repara t ion f o r f u r t h e r processing. yarn i s then woven o r k n i t t e d i n t o grey, o r un f in ished, f a b r i c .
A warping
The
2-1

The t h i r d and f o u r t h processes i nvo lve t h e manufacture o f f l o o r coverings and t h e product ion o f nonwovens. Web bonding, heat s e t t i n g , and t u f t i n g are p e c u l i a r t o these two processes.
The f i f t h process i s f i n i s h i n g , which var ies w i t h the f a b r i c and use. F in i sh ing processes i nc lude bleaching, mercer iz ing, dyeing, Sanfor iz ing, and heat s e t t i n g . These processes are designed t o impart q u a l i t i e s such as c o l o r fastness, f e e l , and p r o t e c t i o n from shrinkage. Appendix B.)
(A discussion o f these f i v e bas ic processes i s given i n
The bas ic processes i n v o l v e numerous and sometimes r e p e t i t i v e batch operations. These operat ions can be placed i n t o two broad categor ies--dry and wet--depending on
whether o r n o t a l i q u i d i s involved. Dry processes o f t e n take p lace i n g re ige m i l l s
and wet processes i n f i n i s h i n g m i l l s , although some m i l l s are now in tegra ted .
Energy i s used i n a l l stages o f t e x t i l e manufacturing, s t a r t i n g w i t h the opening, p i ck ing , and b lend ing o f f i b e r s and ending w i t h t h e dyeing, d ry ing , and f i n i s h i n g o f yarns and f a b r i c . The main end uses o f energy i n t h e t e x t i l e m i l l i n d u s t r y are:
Motor d r i v e --Pumps, fans, and compressors - -Mater ia ls handl ing - -Mater ia ls processing
Process Heating --Process steam --Drying --Curing, heat s e t t i n g , and f i n i s h i n g
L i g h t i n g
Space Heating and Cooling (HVAC).
O f these end uses, motor d r i v e , l i g h t i n g , and space coo l i ng are completely e lec t r i c -based, w h i l e process- and space-heating technologies r e l y mainly on f o s s i l f ue l s .
technologies depends on t h e i r thermal energy requirements. f i n i s h i n g , t h e major consumers o f energy i n t h e t e x t i l e manufacturing process, r e q u i r e l a r g e q u a n t i t i e s of thermal energy. b o i l e r s f i r e d by gas, coal , o r o i l . t r i l l i o n Btu o f energy i nc lud ing 197.8 t r i l l i o n Btu suppl ied by f o s s i l f u e l s and 88.3 t r i l l i o n Btu (o r 25.9 b i l l i o n kWh) o f e l e c t r i c i t y .
Thus t h e a p p l i c a b i l i t y o f these end uses t o s p e c i f i c t e x t i l e processes and Dyeing, d ry ing , and
This energy i s o f t e n suppl ied by In 1985, t h e t e x t i l e i ndus t r y consumed 286.1
2-2

TEXTILE ELECTRICITY USE BY INDUSTRY SEGMENT AND PROCESS
A large portion of the 25.9 billion kWh of electricity consumed in 1985 was used by greige mills, i.e., in the production of unfinished woven and knit goods. SICs 221 (cotton weaving), 222 (manmade fiber weaving), 223 (wool weaving), and 228 (yarn and thread mills) are included in the greige mill category. electricity supplying over 50 percent of their total energy requires, are the most electricity intensive of the textile industry. Together, SICs 221, 222, 223, and 228 consumed over 65 percent of the electricity in the entire textile industry in 1985. The spinning, twisting, and weaving processes performed in these mills require considerable amounts of motive power which is supplied by electricity. Table 2-1 presents a breakdown of electricity use by specific textile process. Descriptions of these processes are given in Appendix B.
These mills, with
IMPORTANCE OF ELECTRICITY
The importance of electricity in the textile mill depends on the type of processing that is done at the mill--dry or wet. greige mills, while wet processing takes place in finishing mills. manufacturing steps that take place in dry and wet processing are highlighted below:
Dry processing typically takes place in The
Greige Mills (Dry Processing) Finishing Mills (Wet Processing)
Yarn formation 0 Yarn dyeing 0 Texturizing (manmade 0 Fabric dyeing and finishing
fibers) --Wovens 0 Fabric formation --Knit goods
--Weaving --Floor coverings --Knitting Printing --Nonwovens 0 Finishing
0 Tufting (floor coverings) --Drying --Heat setting
Electricity is the largest single energy source used by the textile industry, providing 31 percent of the total energy used in 1985 (Figure 2-2). almost all of the motive power, powering pumps, fans, and compressors for HVAC systems in textile mills, regardless of whether the production involves dry or wet processing. numerous processing steps. Starting with the initial fiber-processing steps in dry processing mills, electric-based materials-processing equipment plucks, separates, combs, twists, and spins fiber into yarn which is then woven into fabric. Opening and blending machines rely on electric-based fans.
It supplies
Electric-based materials-handling equipment moves the goods through the
2-3

Table 2 - 1
1985 ELECTRICITY CONSUMPTION BY SPECIFIC TEXTILE PROCESSES (Million kWh)
C.idi4 1.Xf.. Finish: I*LPc.* Iu.rpima Iwarima Ioy.imaInaatsrtfl ltighfingl I
I I 'I.m IRWIma I
SIC 1ndrtr)r I Pmp. (Drawlma Ilpimimallriit I S l . l h i m a l K ~ l t f l ~ 1 O ~ ~ i m a ~ Cur. (Tutlinsl W A C I 1maL I
221 cotton u..ring 138 179 821 359 143 7U9 IM 36 610 3.587
222 *.mad. r i t e V.."iIIP 136 M 1,362 1.222 67p 1.630 I n 163 1.15' 6.791
223 wol wwinglFlnishins 17 21 52 IO I4 1% I7 2L 12 364
22' Y . I I O l U b l i C *ill. 27 I7 M SI 27 66 20 IO SI 361
221 Knitting M i l l . 246 183 611 122 113 611 306 306 It9 1.015
226 T e x t i l e finishima 1.m 193 296 1.975
227 f i o e i CoverIra M i l l s 22 11 S I 1W 22 33 1W 15 113 164 1.W1
228 7.m k l h r d H i i i s 397 331 2.311 1,813 132 331 265 W1 6.619
229 *i.S. T.Xtil. 42 125 20(1 729 417 121 42 2.084
Total 1.P2 810 1.531 1.852 1.379 3.9982.570 1.WI SI3 S,MI 25.M7 ............................................................................................ - - - - - - - - - - - .... -.- ...................
* Texturizing + Mercerizing
=e: U . S . Dept. o f Commerce, Bureau o f the Census, Annual Survey-of
Coal 19%
Figure 2-2. Importance o f Electricity as an Energy Source 1985 Energy Use - 286.1 Trillion Btu
2-4

Only about 20 percent o f the energy used i n f i n i s h i n g m i l l s i s e l e c t r i c i t y . However, t h e e lec t r i c -based end uses are v i t a l t o the dyeing processes because the many small motors used i n f i n i s h i n g m i l l s pump r i n s e water and dyes i n t o and out o f dye becks. E l e c t r i c process heat ing methods such as microwave (MW), radiofrequency (RF), and i n f r a r e d ( IR) d ry ing o f f a b r i c s and f l o o r coverings show p o t e n t i a l f o r wider app l i ca t i ons . I n 1985, these technologies consumed 20 percent more
e l e c t r i c i t y than i n 1980.
These e lec t ro techno logy heat ing methods o f f e r product ion advantages such as f a s t e r d ry ing speeds and h igher e f f i c i e n c i e s . These e lec t ro techno log ies are c u r r e n t l y commercially v i a b l e on l y i n selected app l ica t ions , f o r example t h e RF d ry ing o f carpets. technologies such as RF, MW, UV, and I R can be app l ied t o more f i b e r s and f a b r i c types than those t o which they are c u r r e n t l y being applied; however, some f u r t h e r research and development i s required. Therefore, i f these methods are a c t i v e l y promoted, i f they are developed f o r widespread a p p l i c a t i o n t o f i b e r s and f a b r i c types, and i f t e x t i l e manufacturers are provided d e t a i l e d in fo rmat ion about t h e b e n e f i t s o f these technologies o r shown demonstrations o f t h e i r app l i ca t i on , e l e c t r i c i t y can assume an even grea ter r o l e than i t c u r r e n t l y plays.
T e x t i l e i ndus t r y experts agree, t h a t t e c h n i c a l l y , process heat ing
COMPETING TECHNOLOGIES AND ENERGY SOURCES
I n t e x t i l e processing, t h e quan t i t y and temperature o f heat, and t h e method o f a p p l i c a t i o n vary widely. t h e heat necessary t o run process operations. equipment and technologies which guarantee r a p i d and e f f i c i e n t thermal processing w h i l e ensur ing t h e steady a p p l i c a t i o n and maintenance o f c e r t a i n temperatures t h a t can avoid u n s a t i s f a c t o r y processing. Foss i l f u e l s dominate processes r e q u i r i n g e i t h e r d i r e c t - f i r i n g (such as s inge ing) , o r i n d i r e c t app l i ca t i ons o f heat ( l i k e dyeing, d ry ing , and f i n i s h i n g ) . Coal, na tu ra l gas, f u e l o i l , o r some combination o f these are used t o f i r e b o i l e r s , which i n t u r n produce ho t water f o r dyeing o r
r i n s i n g and steam f o r d r y i n g and f i n i s h i n g . f u e l s by 3 - d i g i t S I C i n t h e t e x t i l e i ndus t r y i n 1985.
E l e c t r i c i t y and f o s s i l f u e l s compete t o p rov ide m i l l s w i t h Cost savings are achieved by
Table 2-2 shows t h e end uses o f f o s s i l
Some o f these processes are being replaced by, o r supplemented w i th , e l ec t ro techno l ogies such as microwave, i n f r a r e d , r a d i o f requency , membrane separat ion processes, i n d u s t r i a l process heat pumps, and heat recovery equipment. However,
2-5

Table 2 - 2
1985 NON-ELECTRIC ENERGY CONSUMPTION BY SPECIFIC TEXTILE PROCESSES (Trillion Btu)
221 "al ua.vinp 3.0 0.7 0.7 1.8 0.4 7.6 0.6 16.9
222 b m d r F lk r Yewing 4.0 2.6 7.4 5.2 0.8 20.1
223 yo01 UearimlFinishinp 0.5 0.2 0.2 0.2 0.4 1.4 0.2 1.4 0.1 L.5
224 U a r r a fobcis Mi1111 1.3 0.6 0.6 0.1 2.5
225 Kn i t t i ng M i l l . 2.0 3.3 16.3 9.6 8.1 1.6 40.7
226 T e x t i l e Finishing 2.1 2.6 4.8 3 . 2 1 6 . 4 1 1 . 1 11.1 1.6 52.8
227 limp cov~ i lnp M i l l s 0.6 0.3 1.4 8.3 8.9 2.8 4.4 1.1 27.7
228 *em i 1hre.d M i l l s 0.8 2.3 1.1 5.9 4.7 0.8 15.6
M Mi.5. Text111 0.4 6.6 b.7 5.7 1.5 18.9
1Ot.l 8.0 7.r h.2 11.4 4.0 16.1 56.6 X.8 4.4 8.2 197.8 ........................................... ~ ...............................................................................
=e: U . S . Dept. of Commerce, Bureau of Census, Annual Survey of Manufactures, 1985; U'.S. Dept. of Energy, The U . S . Textile Industry: Perspective, March 1988; American Consulting Engineers Counci 1 , Industrial Market and Energy Manaqement Guide: SIC 22 - Textile Mill Products Industry; Resource Dynamics Corporation estimates.
An Energy
existing fossil-fuel-based method$ have been perfected over the years and have proven their ability to process textile products satisfactorily, albeit with considerable amounts of energy use and some heat losses. Textile manufacturers are accustomed to these production processes and must have some very compelling reasons to switch production processes.
2-6

I n comparison w i t h e x i s t i n g f o s s i l - f u e l - f i r e d equipment, e lec t ro techno log ies must p rov ide manufacturers w i t h one o r more o f the f o l l o w i n g bene f i t s :
0 Improved product q u a l i t y
0 Improved manufacturing coord ina t ion
0
0 Decreased work-in-process t ime
0
0 Reduced energy cos t
0 Enhanced p o t e n t i a l f o r new product development
0
S i m p l i f i e d o r consol idated process operat ions
Reduced p o l l u t i o n emissions and waste water treatment requirements
Demonstrated wide a p p l i c a b i l i t y (across f i b e r , f a b r i c types, and processes).
T e x t i l e p roduc t ion processes i n which e lec t ro techno log ies face competing technologies are shown i n Table 2-3.
TECHNOLOGY ACQUIS IT ION AND DECISION MAKING
T e x t i l e manufacturers are conservat ive i n the technologies they employ f o r a v a r i e t y o f reasons. F i r s t , most t e x t i l e manufacturers view t h e i r product ion methods more as
an a r t than as a science t h a t can be automated. t o i n v e s t i n computerized systems f o r p rec ise c o l o r matching and f a b r i c design than, f o r example, i n an automated system t o s t reaml ine a f i b e r opening room. Second, most manufacturing operat ions requ i re long runs-- the process t ime from the f i b e r format ion stage t o f i n a l woven f a b r i c t h a t meets a s p e c i f i c design can be up t o 3 months. Yet, most f i r m s produce against uncer ta in and seasonal sales i n t h e apparel indus t ry . i ndus t r y and t h e markets they serve by being very conservat ive i n product ion methods and i n cos t c o n t r o l . in tens ive . The na tu re o f employee r e l a t i o n s i n the i ndus t r y means t h a t any n o t i o n o f automation c a r r i e s w i t h i t t h e reduc t ion o f the l abo r content and the p o t e n t i a l o f l a y o f f s . Firms are s e n s i t i v e t o the reac t i on o f t h e i r employees and are o f t e n u n w i l l i n g t o openly discuss automation o r any n o t i o n o f rep lac ing t r a i n e d labo r w i t h machinery. Fourth, companies are r e l u c t a n t t o change product ion methods t o employ emerging technologies because o f the techn ica l r i s k s associated w i t h w h a t they consider t o be unproven equipment. through i n - p l a n t i n s t a l l a t i o n s demonstrating success. what they consider t o be unproven technologies.
These f i r m s would be more l i k e l y
Many f i r m s reac t t o t h i s c y c l i c a l and r e l a t i v e l y unstable nature o f t h e
Th i rd , t h i s i ndus t r y has t r a d i t i o n a l l y been h i g h l y l abo r
For most companies, technologies are proven Few companies w i l l p ioneer
Innovat ive companies t h a t do
2-7

i n s t a l l t e s t equipment have h igh ly p ropr ie ta ry a t t i t udes which hamper the indust ry- wide adoption o f new technologies.
Table 2-3
SELECTED COMPETING ENERGY TECHNOLOGIES
~
PROCESS ELECTRIC TECHNOLOGY COMPETING TECHNOLOGY ~
S1 ash i ng Rad i o f requencyl I n f rared Resistance Heat Gas In f ra red E l e c t r i c Bo i le rs Hot Water Heaters
Foss i l -Fuel -Fired Bo i l e rs
Scouring Heat Pump/Heat Recovery Fossi l -Fuel-Fired Bo i le rs Heat Pump/Thermal Storage E l e c t r i c Bo i le rs
Immersion Heaters Hot Water Heaters
Heat Pump/Heat Recovery Hot Water Heaters Heat Pump/Thermal Storage U1 t rasonics
In f ra red Gas In f ra red Radiofrequency Conduction v i a Steam Cans Resistance Heat Heat Pump/Thermal Storage
Hot Water Heaters
Washing Heat Pump/Heat Recovery Fossi l -Fuel-Fired Bo i le rs
Dyeing Membrane Separation Foss i l -Fuel -Fired Bo i le rs
Drying Microwave Fossi l -Fuel-Fired Ovens
Curing/ U1 t r a v i o l e t P r in t i ng ,Resistance Heat
Gas Curers (Impinged) D i rec t Fossi l -Fuel-Fired
Heater
Space Heating Heat Pumps Fossi l -Fuel-Fired Bo i l e rs Resistance Heating Heat Pump/Heat Recovery Gas In f ra red E l e c t r i c In f ra red
D i rec t Fossi 1 -Fuel - F i red Heaters
Note: Thermal storage systems may u t i l i z e f o s s i l f ue l o r e l e c t r i c energy sources o r may use a combination o f them.
Risk aversion and reluctance t o invest i s re in forced by the c y c l i c a l and uncer ta in - nature o f the t e x t i l e industry. Capi ta l costs associated w i th new equipment a lso hamper technology acqu is i t ion .
exchange rates can force U. S. f i rms purchasing equipment abroad t o pay more fo r equipment than do some fo re ign competitors. Today, it i s mainly la rge companies
operat ing in tegra ted m i l l s t h a t are able t o f inance the la rge cap i ta l expenditures
Most major machines are produced overseas so fo re ign ~
2-a

requ i red t o modernize p l a n t s w i t h new technologies. For example, Dan R iver Inc. has spent more than $150 m i l l i o n on new equipment s ince 1980, and Tu l tex Corp. budgeted $100 m i l l i o n f o r a 3-year modernization program beginning i n 1988. expenditures a re beyond the resources o f smal ler , independent companies s p e c i a l i z i n g i n con t rac t work f o r l a r g e r m i l l s . Many t e x t i l e m i l l s f a l l i n t o the l a t t e r category and cannot a f f o r d l a r g e investment expenditures.
Such
Increas ing emphasis i s now being placed on new technology op t ions as a way t o face the compet i t ion from fo re ign producers. m u l t i p l e , r e p e t i t i v e steps. Raw mate r ia l and work-in-process are f requen t l y
t ranspor ted manually from one u n i t operat ion t o another. coord inate the manufacturing processes; there fore , desp i te i t s conservatism, the i ndus t r y has shown i t s e l f t o be amenable t o proven technologies such as those designed t o s t reaml ine and speed up operations and d i f f e r e n t i a t e products. Newer, f a s t e r sp inn ing and weaving machines such as s h u t t l e l e s s looms, and open-end sp inn ing equipment can now process yarn a t speeds up t o 600 f e e t per minute, more than double the speed o f conventional equipment. depends on t h e a b i l i t y t o ge t h igh -qua l i t y products t o market e a r l i e r and a t a lower cos t than one 's compet i tor so technologies proven t o increase product q u a l i t y and reduce cos t w i l l always be a t t r a c t i v e . t he l abo r content o f operat ions by inc reas ing automation could r e a l i z e cost savings.
T e x t i l e product ion invo lves a se r ies o f
There i s an unmet need t o
I n t h e t e x t i l e i ndus t r y , success
Furthermore, U.S . producers ab le t o reduce
The i m p l i c a t i o n o f t h e foregoing t o e l e c t r i c u t i l i t i e s i s t h a t wh i l e t e x t i l e customers may be r e l u c t a n t t o purchase unproven equipment and equipment r e q u i r i n g l a rge expenditures, they may be recep t i ve t o e lect rotechnology and DSM opt ions o f f e r i n g b e n e f i t s such as cos ts savings, product d i f f e r e n t i a t i o n , s t reaml ined operat ions, speed and e f f i c i e n c y , improved q u a l i t y , and labo r reduct ions. T e x t i l e companies may a l s o favo r modernization so lu t i ons i n t h e form o f moderate c a p i t a l investments i n equipment t h a t can be spread over extended per iods o f t ime. dryers, f o r example, f a l l i n t o t h i s category. The chal lenge fac ing e l e c t r i c u t i l i t i e s i s t o develop DSM programs f o r t e x t i l e customers t h a t w i l l accommodate u t i l i t y goals and customer needs and cons t ra in ts .
I n f r a r e d
ABILITY TO MODIFY ELECTRICITY USE
A t e x t i l e m i l l ' s a b i l i t y t o modify e l e c t r i c i t y use depends on the process category invo lved. e l e c t r i c i t y consumption than d r y processing.
T y p i c a l l y , wet processing o f f e r s more oppor tun i t i es f o r modi fy ing
2-9

Dry Processing
Dry processing activities take place in the greige mill and involve fiber processing, and yarn and fabric formation. With the exception of slashing, all dry processing activities rely on electricity. electricity in these processes is limited because most are already electric driven. Some of the options for modifying electricity use come from increased applications
The ability of firms to switch to
Adjustable speed drives
High-efficiency motors
HVAC optimization
Automation
Efficient lighting systems
Energy management systems
Process re-schedul ing (off-peak production)
Infrared and radiofrequency heating and drying
Industrial heat pumps.
A typical greige mill will have many motors running during a normal work day. High- efficiency electric motors with adjustable speed drives can help this equipment run more efficiently, reducing overall electricity costs. HVAC systems are also very important in greige mills because they must work with the machinery to filter out the large amounts of debris, lint, and other material generated during production. Impaired air quality from the collection of cotton dust, for example, may create a hazard to operators as well as a risk of potentially fouling the machinery. Opportunities for heat recovery exist for HVAC systems designed to capture waste heat from machinery and redirect it into the ventilation system, thus eliminating hot spots.
Increased automation in dry processing may also increase electricity use by applying computerized systems that move and process materials. through textile mills make them ideal candidates for automation. Numerous processes may be linked by the addition of a simple robot or automated carriage. For example, instead of manually replacing a bobbin from a spinning frame, a computerized carriage or robot can be programmed to perform this process much more quickly and cost-effectively. streamline and accelerate operations.
The large flow of material
In addition, automation can help reduce labor intensity and
2-10

Wet Processing
The textile firm's ability to modify electricity use is more pronounced in wet processing applications than in dry. spun yarn and woven or knit greige fabric. process called slashing, which takes place prior to fabric or yarn dyeing and/or finishing and involves the application of liquid chemicals to the yarn to improve weaving efficiency by strengthening the yarn. electrotechnologies now compete with conventional fossil-fuel-fired technologies for slashing, drying, dyeing, and curing. In addition to the alternatives listed under dry processing, some of the opportunities offered by wet processing include:
The majority of wet processes dye or finish Also included in this category is a
As shown in Table 2-3, a variety of
0 Increased applications of process heating technologies --Radiofrequency --Infrared --Ultraviolet
Increased application of other electrotechnologies --Membrane separation /filtration techniques --Industrial process heat pumps/heat recovery systems --Thermal energy storage --U1 trasonics --Process automation.
0
Installations could include, for example, using industrial process heat pumps and filtration techniques to recover waste chemicals, and replacing conventional dyeing and drying processes with electric heating technologies. HVAC opportunities also exist. vapors, odors, fumes, and other contaminants.
Finishing plants require large ventilating systems for the removal of
The electrotechnologies that are potentially applicable in both wet and dry processing can be expensive. A decision to install an RF slasher, for example, would require a capital investment o f hundreds of thousands of dollars. even run well into millions of dollars, depending on the size of the installed u n i t . Technically, textile firms are often able to switch to electric-based technologies, but capital expenditures must be justified by the benefits.
It could
DSM PROGRAM OPPORTUNITIES AND CONSTRAINTS
In general, energy costs for the textile industry are relatively low when compared with the industry's two largest cost components: labor and raw material. However, electricity accounts for approximately 63 percent of the industry's total energy bill. Moreover, electricity accounts for 5.9 percent of the total value added in
2-11

the industry compared to 3.2 percent for all manufacturing industries. comparisons o f the importance of electricity are given in Table 2-4.
Additional
Table 2-4
1985 TEXTILE INDUSTRY ELECTRICITY COSTS AND INTENSITY
Total Energy Electricity ........................................................................ Total Costs costs Per Total Costs Costs Per Cost Per Value Dollar of Cost Per value Dollar of
Sector ($Mils) O f Shipnentr Value Added (mils) Of Shipnts Value Added
Textile ........................................................................................
Industry 1,925 3.6% 9.3% 1,214 2.3% 5.m
Process Icdustries 29,061 3.4% 10.0% 13,176 1.6% 4.6%
A1 1 Manufacturing 59,707 2.6% 6.02 31,595 1.4% 3.2%
=e: U.S. Dept. of Commerce, Bureau of the Census, Annual Survey of Manufactures, 1985.
Opportunities, problems, and constraints for DSM in the textile industry also depend on the DSM options under consideration and the utility's desired load shape. Utility load shape objectives vary among regions. Southeast, utilities have tended to stress load growth and favor DSM plans that encourage their customers to use more electricity. however. Southeast. reducing future capacity requirements. conserve energy have therefore been common in the Northeast. utility characteristics shape the DSM objectives that utility planners set. Generally, however, objectives common to utilities with high concentrations o f textile manufacturing mills can be classified into the four broad categories described below.
In the heavy textile producing
This emphasis is changing,
In the Northeast, utilities have generally been more interested in
. Conservation and load management are attracting increasing interest in the
DSM objectives to reduce peak demand and to A variety of other ,
2-12

Load Manaqement
This DSM oppor tun i t y invo lves achieving load shape changes by reducing peak load (peak c l i p p i n g ) , b u i l d i n g o f f peak-loads ( v a l l e y f i l l i n g ) , o r moving loads from on- peak t o o f f -peak ( l oad s h i f t i n g ) . A l l th ree methods are t i e d t o t h e a b i l i t y o f the customer t o modify i t s e l e c t r i c i t y consumption l eve l s , t im ing , o r both. The t e x t i l e i ndus t r y has embraced t h e concept o f load management on l y i n i t s s implest form. The indus t r y has mod i f ied i t s l i g h t i n g systems, employed t h e use o f h i g h - e f f i c i e n c y motor d r i ves , and made s t r i d e s i n heat recovery systems.
u t i l i t i e s has provided t h e i ndus t r y w i t h p r o f i l e s o f energy usages so t h a t demand con t ro l can be e f f e c t i v e . Where low of f -peak ra tes are o f fe red , a s m a l l percentage o f t h e i n d u s t r y has s h i f t e d load by i n s t a l l i n g thermal storage systems and by opera t ing waste treatment f a c i l i t i e s , b a t t e r y chargers, and h i g h l y energy- intensive operat ions dur ing of f -peak hours. m i l l s w i l l employ thermal storage systems, maintain p roduc t ion equipment, stop b a t t e r y charging operat ions, reduce waste treatment operat ions, c y c l e loads t h a t do
no t r e q u i r e constant operat ion, and slow down ad jus tab le speed motors where possible. Load reduct ions r e s u l t i n g from these ac t ions may amount t o as much as 20 percent o f the uncon t ro l l ed p l a n t demand. Automated load c o n t r o l systems are used t o schedule on-peak load reduct ions i n con junc t ion w i t h maintenance and produc t ion schedules.
Work w i t h e l e c t r i c
During the per iods where on-peak charges apply,
The i n d u s t r y has n o t e lec ted t o use a l l o f t h e load management p o t e n t i a l a v a i l a b l e
t o i t f o r optimum energy use. o f t e n do n o t warrant t h e c a p i t a l expenditures necessary t o make use o f some o f t h e technologies ava i l ab le .
One o f the reasons i s t h a t u t i l i t y r a t e s t ruc tu res
S t ra teq i c Conservation
This DSM o p t i o n invo lves reducing t h e t e x t i l e customer's e l e c t r i c i t y use through conservation measures. L igh t i ng , weather izat ion, con t ro l s , and the use o f h i g h - e f f i c i e n c y motors a re examples o f a c t i v i t i e s t h a t can achieve t h i s goal. oppor tun i t i es e x i s t f o r these conservat ion methods t o be implemented i n the t e x t i l e
indus t ry . p o t e n t i a l t h a t e x i s t s , u t i l i t y representa t ives must work c l o s e l y w i t h t h e i r t e x t i l e customers, perform thorough aud i ts , recommend energy saving ideas, help implement the recommendations, and mon i to r any changes i n equipment o r p l a n t c h a r a c t e r i s t i c s t h a t a re brought about as a r e s u l t o f t h e aud i t .
Many
To f u l l y understand a company's operat ions and t h e energy savings
2-13

Strateqic Load Growth
This DSM strategy involves an increase in electricity sales, mainly through electrification or the substitution of electricity for end uses previously served by competing fuels. Increased application of e lec t ro techno log ies- - in f ra red , microwave, ultraviolet, membrane separation, industrial process heat pumps, and automation-- that can be applied in textile manufacturing could result in strategic load growth. Automation would likely produce moderate increases in electricity use.
automated plant could provide significant new load to utilities if textile plants are run at high capacity around the clock. lack o f information about the applicability and benefits of these technologies and the reluctance on the part of many textile companies to try what they consider to be unproven technologies.
A fully
Problems and constraints relate to a
Capital constraints may also be a problem.
Flexible Load Shape
This objective involves offering customers options as to the variations in the quality or reliability of service in exchange for incentives. be variations of interruptible or curtailable load; concepts of pooled, integrated energy management systems; or individual customer load control devices offering service constraints. Special rates or rate discounts for interruptible or curtailable service are widely available programs.
Programs involved can
The textile industry can only be competitive if it operates at maximum utilization of its capital investment. hours per day and 365 days per year. requirements, changes in product runs, and labor constraints, the modern textile plant designs have reduced labor needs and new equipment has reduced the time required for maintenance. The industry's production load shape is not very flexible due to its need to run as continuously as possible. loads are flexible; these include the plant's waste treatment, battery charging, air conditioning and other support facilities.
The most desirable operation would be to operate 24 While this is not possible due to maintenance
However, portions of the plant
Interruptible rates are often not acceptable to the textile industry because of the need for continuous operation. Shut downs and start ups result in costly labor and maintenance expenses. industry does not have large single loads that may be interrupted. that can be achieved is realized from making selective reductions from support faci 1 ities.
Moreover, this type of rate is not attractive because the Load reduction
2-14

Section 3
DSM PLANNING AND IMPLEMENTATION
Numerous factors shape a utility's DSM programs, including the economic environment of the utility and its customers, the utility's generation options and current capacity, and the industrial sector's technologies and electricity end uses.
Utility demand-side planning and implementation is, of necessity, a highly integrated process. industry should be an integral part of a utility's overall DSM efforts. planning framework can be summarized in the following steps:
Designing and implementing a DSM program for the textile A DSM
0 Setting DSM objectives
0
0
0 Program implementation
0 Program monitoring.
Identifying alternatives for achieving given objectives
Evaluation and selection o f suitable programs
The general DSM planning process, industrial sector technologies, and energy end uses are discussed fully in a number of EPRI publications and summarized here as they apply to the textile industry. used together to help utilities design their own textile DSM programs. Among the relevant EPRI publications are:
EPRI DSM publications and this Guidebook can be
0 Battelle Columbus Division. Resource Dvnamics Corooration. Svneraic Resources Corporation, Env;ro-Managem&t and Reseerch Inc:, bemaid-Side Management Volume 5: Industrial Markets and Proqrams, Electric Power Research Institute, Report EPRI EA/EM-3597, Palo Alto, CA, 1988.
0 Resource Dynamics Corporation, Electrotechnology Reference Guide, Revision - 1, Electric Power Research Institute, Report EPRI EM-4527, Palo Alto, CA, 1988.
0 Resource Dynamics Corporation, Battelle Columbus Division, Technical Assessment Guide, Volume 2 Electricity End-Use: Part 3: Industrial Electricity Use, EPRI P-4463-SR, 1988.
3-1

Much of the following discussion is based on the first reference (EA/EM-3597 Demand- Side Management Volume 5: Industrial Markets and Programs). Thus, the reader should refer to this report if more detailed information is desired.
SETTING DSM OBJECTIVES
The first step in a utility's formal planning process is to establish overall organizational objectives. These objectives are quite broad and generally include items such as:
0 Improving financial performance
0 Promoting economic development
0 Meeting customers' need for economical and reliable service
0 Improving customer relations
0 Increasing utility load factor.
While overall organizational objectives are important guidelines for utility long- range planning, there is a need for a second level of the formal utility planning process in which a utility's objectives are operationalized to guide utility management in taking specific actions. It is at this operational or tactical level that DSM alternatives should be examined and evaluated. For example, an examination of capital investment requirements may show periods of high investment needs. Postponing the need for new construction through a DSM program may reduce investment needs and stabilize the financial future of the utility. Operational objectives are subsequently translated into desired load shape objectives for the utility. Although there is an infinite combination of load shape modifications, the six generic load shape objectives (peak clipping, valley filling, load shifting, strategic conservation, strategic load growth, and flexible load shape) described at the end of Section 2 are often used to illustrate the range of possibilities.
IDENTIFICATION OF APPROPRIATE DSM PROGRAMS
Historically, industrial DSM programs have consisted of alternative rates (namely, time-of-use and interruptible/curtai lable rates) and direct customer contact programs, including audits and routine plant visits. utilities have begun to expand the range of industrial DSM options. as engineering assistance, techno1 ogy training, vendor assistance, demonstrati on
In recent years, however, Programs such
3-2

pro jec ts , spec ia l ra tes , and o ther p roac t i ve customer programs are becoming more commonplace.
The increas ing i n t e r e s t i n i n d u s t r i a l DSM i s b r i ng ing about changes i n t h e marketing approaches used by u t i l i t i e s ; t h i s i s t r u e regardless o f whether t h e DSM programs are d i r e c t e d toward conservation, toward s t r a t e g i c load growth, o r toward one o f the o the r load shape ob jec t ives . A t the core o f these changes i s t h e recogn i t i on t h a t u t i l i t i e s must ga in s i g n i f i c a n t understanding o f t h e i r customers i n o rder t o e f f e c t i v e l y design programs t h a t b e n e f i t both the u t i l i t y and t h e customer. Meeting customer needs i s becoming the standard by which u t i l i t y a c t i v i t i e s are measured. Thus, i d e n t i f y i n g DSM programs f o r t h e t e x t i l e i ndus t r y requ i res an understanding o f
t h e r o l e o f e l e c t r i c i t y i n t h e manufacturing process.
A DSM program can be described i n terms o f f o u r dimensions: (1) a load shape
ob jec t i ve , (2) an under ly ing DSM technology o r process change, (3) a u n i t process o r end use t o which t h i s technology o r change w i l l apply, and (4) one o r more market implementation methods t o promote t h e DSM technology o r process change. example, a DSM program t o encourage s t r a t e g i c conservat ion w i t h i n t h e t e x t i l e i ndus t r y might cons i s t o f the app l i ca t i on o f h igh -e f f i c i ency motors and ad jus tab le speed d r i ves t o m a t e r i a l s processing. program might i nc lude an i n c e n t i v e (such as a rebate) and cooperat ion w i t h t rade a l l i e s (such as equipment vendors).
For
Market implementation methods f o r such a
Section 4 o f t h i s r e p o r t provides d e t a i l s on these f o u r dimensions as they r e l a t e t o t h e t e x t i l e i ndus t r y . technologies/process changes, end uses/uni t processes, and market implementation methods and demonstrates how these f o u r dimensions r e l a t e t o one another.
It i d e n t i f i e s the re levan t load shape ob jec t ives , DSM
EVALUATION AND SELECTION OF DSM PROGRAMS
U t i l i t y DSM programs are der ived from var ious f a c t o r s a f f e c t i n g t h e u t i l i t y and i t s customers. These f a c t o r s he lp t h e u t i l i t y se t c e r t a i n goals f o r which programs are then formulated. t e r r i t o r y and t h e oppor tun i t i es f o r enhanced i n d u s t r i a l development, an e l e c t r i c u t i l i t y aiming a t s t r a t e g i c load growth o r f l e x i b l e load shape may want t o increase t h e use o f e l e c t r i c i t y by i n d u s t r i a l customers o r a t t r a c t new i n d u s t r i a l customers t o the region. generat ing and opera t ing f a c t o r s and decide t o s t a b i l i z e e l e c t r i c i t y sales
For example, a f t e r examining t h e economic c l ima te o f i t s serv ice
A l t e r n a t i v e l y , t h e u t i l i t y ' s planners may evaluate i n t e r n a l
3-3

o r improve load factor . services t h a t might y i e l d mutual benef i t s t o the u t i l i t y and a p a r t i c u l a r group o f customers. e l e c t r i c heat ing technologies i n t e x t i l e drying. appl icat ions would be appropriate i n t h i s instance.
Further, a u t i l i t y may look f o r oppor tun i t ies t o provide
For example, there may be untapped oppor tun i t ies f o r the app l ica t ion o f Promoting electrotechnology
In formulat ing t h e i r i n d u s t r i a l DSM plans, u t i l i t y planners o f ten proceed through
several steps. These steps can include market segmentation, program assessment, and plan development. As the process unfolds, customer and u t i l i t y considerations are cont inua l l y assessed a t an increasing l eve l o f d e t a i l f o r a decreasing number o f DSM
a l te rna t ives and customer segments.
Market Segmentation
Market segmentation simply means i d e n t i f y i n g i n d u s t r i a l customer groups t h a t have s imi la r , d is t ingu ishab le charac ter is t i cs . developing cos t -e f fec t i ve DSM a l te rna t ives tha t match program charac ter is t i cs t o customer needs.
Proper segmentation provides guidance i n
One approach segments customers based on a se t o f common charac ter is t i cs t h a t are i d e n t i f i a b l e and accessible--e.g., customer S I C code, s ize, o r f i nanc ia l condi t ion. This approach i s easy t o implement and makes use o f data o f ten ava i lab le w i t h i n the u t i l i t y . benefits--e.g., i n t e r e s t l eve l i n working w i th leading edge technology, treatment o f
uncertainty, o r payback c r i t e r i a . because i t requi res o f ten subject ive, ye t de ta i led customer informat ion.
A second approach segments customers based on a set o f common needs or
This approach i s more d i f f i c u l t t o implement,
I ndus t r i a l customer needs and benef i t s are o f ten a funct ion o f the fo l low ing factors :
0 Customer type (e.g., S I C , f i nanc ia l condi t ion, company o r indust ry growth ra te , and age o f process equipment)
Customer s ize (e.g., demand leve l , energy consumption, and employment) 0
0 . Technology (e.g., type o f processing equipment used, type o f motor load, and equipment)
0 End uses (e.g., HVAC, l i g h t i n g , process heating, and mater ia ls handling).
Thus, these fac to rs may serve as the s t a r t i n g po in t i n market segmentation.
3-4

The degree of segmentation a utility planner should employ in developing a DSM plan for the textile industry depends to a large extent on the importance of the industry to the utility. total industrial sales, segmenting the industry further may not be prudent.
If the textile industry represents only a small contribution to
Proqram Assessment
One of the most critical parts of the DSM program evaluation and selection process is the assessment of alternative strategies. It is important for utility planners to determine which DSM alternatives represent the greatest benefits for the utility and its customers. These benefits are based on the DSM program's market potential, energy and demand impacts, regulatory acceptance, and cost-effectiveness considerations.
The overall impact of a DSM program depends to a large extent upon the acceptance of the program by the customers and the change in the customers' load shapes resulting from program participation. magnitude of benefits the program yields to the customers. electrotechnologies, for example, may benefit customers by increasing productivity, meeting environmental regulations, and reducing production costs.
Customer acceptance is directly influenced by the Programs involving
Increased Productivity. The wide variations in the quantity of thermal energy and in the temperatures and methods of application in textile processing have a direct impact on the efficiency of the production process and, therefore, on a firm's productivity. Textile processes ( for example, dyeing and drying) can be time- consuming and labor intensive. to be constantly monitored because under-processing is a frequent problem resulting in dyes that do not adhere properly and over-drying is a problem that causes shrinkage. Conventional thermal equipment cannot be as precisely controlled as electric-based equipment. production times and with lower labor inputs.
Fabric or floor coverings being dyed or dried have
Higher production outputs are possible with reduced
Meetinq Environmental Regulations. Electrotechnologies can be used, directly and indirectly, to meet federal, state, and local environmental restrictions placed on the textile industry. to be promising. recovery of useful thermal energy and chemicals used in textile drying and finishing; thus reducing the amount of hazardous chemicals disposed of by mills.
Direct environmental benefits from electrotechnologies appear For example, membrane separation processes allow for recycling and
3-5

Heat exchangers and heat recovery systems perform the same recycling task with similar advantages. Electricity used in lieu of conventional thermal processes eliminates or reduces point-source emissions. substantial if large numbers of conventional thermal energy process are replaced with electric-based technologies.
This indirect benefit can be
Reduction in Production Cost. The reduction in a textile mill's production cost due ~
to an electrotechnology-oriented DSM program is bound to be site-specific and ~~ ~
generalizations can be misleading. Therefore, a starting point in the evaluation should be to list all the cost items associated with a process under consideration for electrification. Cost categories for labor, energy, and raw material should be disaggregated on a before-and-after basis so the impact of an electrotechnology on cost can be clearly assessed. Thermal energy storage systems may be recommended as a way of increasing off-peak consumption, thereby reducing demand charges and overall electricity costs. Heat pumps and high-efficiency electric equipment could lower electricity demand. RF slashing, for example, reduces the amount o f sizing wax required and reduces production cost.
In addition to the cost-effectiveness question, utility planners must ask themselves: how receptive is the textile industry to change, how amenable are textile manufacturing processes to modification, and what are individual customer attitudes toward technological change and innovation? acceptance estimates, planners should factor the conservatism of the industry into their estimates.
In deriving customer
Factors that influence the acceptance of DSM programs include:
Plant size. expenditures, and likelihood of installing advanced equipment.
Plant ownership. company? Autonomy affects the company's decision-making process. In many cases, independently operated plants determine their own investments. This can avoid long lead times for decisions to be approved by headquarters. On the other hand, subsidiaries may have access to more capital through a parent company.
Investment criteria. whether the financial performance of proposed equipment meets the customer's criteria.
This indicates the firm's size, ability to afford investment
Is the plant independently operated or part of a large
This information will help utility planners determine __
Age of equipment. retrofits, or plant remodeling may be needed and may affect capital expenditures for new technologies.
This is a good indication of how soon repairs,
3-6

Equipment type. Plants already automated and using r e l a t i v e l y modern equipment may be more w i l l i n g t o t ry new technologies. The leve l o f e f f o r t required t o convince an innovat ive f i r m t o switch o r modify e l e c t r i c i t y use may not be as high as f o r a more conservative f i r m .
-of t e x t i l e companies t o adopt DSM approaches. Production processes. These determine e l e c t r i c i t y i n t e n s i t y and w i l l
O f equal importance t o customer acceptance, i s the change i n the customer's load shape r e s u l t i n g from pa r t i c i pa t i on i n the DSM program. changes i n the customer's equipment stock and/or changes i n the u t i l i z a t i o n o f the equipment. While load shape changes f o r an e n t i r e 24-hour per iod by day type are des i rab le f o r more de ta i led program analyses, impacts on peak demand and energy
genera l ly are s u f f i c i e n t f o r the more aggregate analysis techniques.
This change i s the r e s u l t o f
Impacts on peak demand and energy may be developed from engineering estimates o f the equipment and i t s proposed u t i l i z a t i o n , informed judgment using customer ins igh ts , and t rans fe r o f resu l t s from other customers w i th s i m i l a r equipment o r processes.
Plan Development
The development o f a program plan document i s the f i n a l a c t i v i t y i n the DSM evaluat ion and se lec t ion step. record o f the market segmentation and program assessment work completed by the u t i l i t y . describes the a c t i v i t i e s t h a t have t o be car r ied out.
The program plan serves as an o f f i c i a l , w r i t t e n
The p lan a lso i d e n t i f i e s the ind iv idua l DSM programs selected and
The actual s t ruc tu re and content o f a u t i l i t y ' s DSM plan can vary widely depending upon the complexity o f the s i t ua t i on , l eve l o f c r e a t i v i t y desired, and the general requirements o f both the i n te rna l and external environment. As a minimum, the program plan should include:
Clear statement o f the u t i l i t y ' s mission
Spec i f i ca t ion o f s t ra teg i c ob ject ives
Spec i f i ca t ion o f DSM program goals
Program descr ipt ions, inc lud ing implementation s t ra teg ies and act ion items
Program milestones
Proposed monitor ing program
Program budget.
3-7

/
PROGRAM IMPLEMENTATION
Program implementation involves bringing a DSM program into the field. implementation includes the many detailed day-to-day decisions that must be made to realize the goals of the program.
Developing, installing, and operating a generating plant takes years of planning, scheduling, analytical modeling, reliability assessment, and strict construction scheduling. replace the need for all or part of a generating plant requires an equally rigorous series of steps. customer acceptance analyses, interdepartmental coordination, and problem complexity are among the challenges that must be faced in DSM implementation.
Program
~
~
In a similar fashion, the implementation of a DSM program intended to
Lack of data, inadequate experience in market assessment and
Careful coordination in the implementation of DSM programs is essential. utility and non-utility participants must be involved in the successful implementation of a DSM program.
Numerous
The implementation phase usually occurs in distinct stages. uncertainty over customer acceptance and response, a DSM program can be introduced gradually. proceed with full-scale implementation and operation.
Due to logistics and
If results from the pilot programs look promising, the utility may
PROGRAM MONITORING
Supply-side alternatives require extensive performance monitoring, and so do demand- side alternatives. deviations from expected performance and to improve both existing and planned demand-side programs.
The ultimate goal of the monitoring program is to identify
While monitoring the installation costs and implementation schedule may, in itself, be straightforward, measuring the resulting changes in the load shape is considerably more difficult. affect the customer's energy use level and pattern of use.
weather conditions, level of plant output, major equipment changes, and changes in utilization can have significant impacts on the load shape. program still in its infancy, these confounding influences may outweigh the impacts resulting from the program. an effective monitoring program.
Numerous factors outside the demand-side program In the short run,
With a demand-side
Nevertheless, it is important to design and carry out
3-a

This sec t i on des
Sect ion 4
DEVELOPING A DSM PLAN FOR THE TEXTILE INDUSTRY
ibes how t o develop a t e x t i l e - i n d u s t r y DSM p lan f o r a u i l i t y g iven i t s o v e r a l l DSM ob jec t i ves and the c h a r a c t e r i s t i c s o f i t s t e x t i l e customer base.
O R G A N I Z I N G FOR DSM
Developing a DSM program f o r t h e t e x t i l e i ndus t r y requ i res inputs from u t i l i t y s t a f f experienced i n engineer ing, economics, marketing, and o the r d i s c i p l i n e s . The f i r s t s tep toward develop ing a t e x t i l e - i n d u s t r y DSM p lan might be the c r e a t i o n o f a
working group represent ing the f o l l o w i n g func t ions :
0 S t r a t e g i c p lanning
0
0 Customer serv ices
0 Market research
0 Load research
0 Load management
0 Finance
0 Communications
0 Rates.
Commerci a1 I i n d u s t r i a1 marketing
This group, or another one l i k e i t , may a l ready e x i s t t o support ongoing DSM a c t i v i t i e s . Inputs from s t a f f w i t h experience from on-going a c t i v i t i e s are inva luab le i n des ign ing a DSM p lan responsive t o t h e u t i l i t y ' s o v e r a l l ob jec t i ves and a v a i l a b l e resources, and the needs o f i t s t e x t i l e i ndus t r y customers.
The development o f a DSM p l a n may be organized i n t o the f o l l o w i n g s i x steps:
1. I d e n t i f y and charac ter ize t e x t i l e customers
2. Analyze t e x t i l e e l e c t r i c loads and end uses
4-1

3 .
4 . Identify market implementation methods
5. Evaluate and select DSM programs
6. Develop textile-industry DSM program plan.
Identify applicable DSM technologies and process changes
STEP 1. IDENTIFY AND CHARACTERIZE TEXTILE CUSTOMERS
The size and characteristics of a utility's textile sector are important inputs to an effective textile-industry DSM plan. available from both internal (within the utility) and external sources. A systematic approach to collecting information about textile customers ensures that all sources of information are fully utilized. reports can provide the initial information on textile customers and their electricity utilization. This information indicates the overall importance of the textile industry's load in a particular service territory. identifying industry segments (at the 3- or 4-digit SIC level) which are likely to be of greatest importance to a DSM plan. Hourly demand data, if available, can be very useful, particularly for utilities pursuing load management objectives.
Information about textile customers is
Utility billing records and call
It can also help in
External sources can be used to supplement internal sources. The focus of external collection efforts should be on business trends and production processes in those segments of the textile industry that the utility serves and that are of importance to the utility.
To the extent possible, the textile sector should be characterized at the 3- or 4 - digit SIC level. to identify and understand individual processes and electricity end uses.
information at high levels of detail (e.g., 4-digit SIC) is often hard to obtain and unreliable. depend on the types and quality of available data and the importance of the industry to the utility.
In general, the more detailed the disaggregation the easier it is However,
Accordingly, the level of disaggregation selected by a utility will
Business Trends
Reviewing regional and national business trends in the textile industry ensures a broader approach to strategy development and provides a good indication as to the
4-2

competitive status of most of the utility's textile customers. Useful sources of information on the textile industry include publications such as Southern Textile News, Textile HiLites, the U.S . Industrial Outlook, and Standard and Poors' Industry Surveys. Reports in local news media are also useful information sources. Information on competitive trends can be obtained from economic publications on the industry such as those issued by the Department of Commerce and by the American Textile Manufacturers Institute. Examples include: U.S . Global Competitiveness: The U . S . Textile Mill Industry, Report to the Senate Committee on Finance, December 1987; and the Office of Technology Assessment, The U . S . Textile and Apparel Industry: A Revolution in Proqress, Washington, D.C., April 1987. The Federal Reserve Board also produces monthly statistical releases including production indices for all manufacturing industries. These industrial production indices provide accurate information about production levels and capacities in the textile i ndus t ry .
Production Processes
Textile production methods determine the end uses and technologies on which DSM
programs should focus. information sources for these types of data. publications, equipment vendors' literature, and most importantly, the textile companies themselves. Information from the textile companies themselves can be gathered through telephone or personal interviews of a representative sample o f
customers. Enough about the production processes must be learned to assess the potential for the adoption of DSM programs. includes: process steps used, types of equipment, capacities and utilization, typical operating schedules, non-electric energy use, and operating problems, constraints, and trends.
More reliance will necessarily be placed on external These sources include EPRI
Information that needs to be gathered
To illustrate the type of information to be collected in this step, Table 4-1 provides a characterization of the textile industry at the national level. should be noted that while national data can provide important insights, local data should be used whenever possible in the design of DSM programs. sufficient differences exist within industry segments that make transfers of data inappropriate.
It
In many cases
4-3

In dust r y Segment
(%Digit SIC)
mary -
' s x
P a .E
p g
25
D L _
.Y
E
E E 2.D
i e
-- 3.9
__
3.5
__ 1.9
__ 2.1
_- 1.4
-
1.7
-
0.7
__
3.8
___
2.0
-
21 - cotton Weaving
Indic
0
0"
.E
p 6 $ 4 2 2 2 :
.Y
iz-
c c
56
59
25
20
16
35
23
64
39
2 2 . Manmade Fibe Weaving
23 - Wool Weaving, Finishing
24- Narrow Fabric Mills
2 5 - Knitting Mills
2 6 - Textile Finishing
21 - Floor Covering Mills
28. Yarn and Thread Mills
29 - Miscellaneous Textiles
T a b l e 4 -1
T E X T I L E INDUSTRY SUMMARY: INDUSTRY SEGMENTS
Industry Products
r e s . upholstery, and rurgiral Ibrici
rerr. drapery. upholstery berglarl. and automotive ibnu
ianketrand overcoat material nd other woolen fabrics
ibbonr and bindings
ih' , bays'. women's. and men's ogiery. bathing suits. neckties. at% knitted underwear and ightwear,jerieyfabri~r. lace 00dI. glover. mittens. and edrpreadr
nd dyed finished narrow fabrics
ugr. carpets. bathmatr. and therfioorcoveringr
arms. rpooied yarnr.and thread f ailfibertypes
nitation leather. oiitloth, tire ord, bonded llber fabrics, braidei 3rd. feitr, piiiow fillings. pipe overing. burlap. and other onwoven fabrics
Growth in automotiveand
More continuous production More frequent air changes for
indurtrial markets
product quality Domination byair.jet loam5
Decline in apparel markets Espe~iallyllrong competition from imports
some rpareapacityfor DIM Small part of textile industry
'.'
. Growth in woven labei.eiaitic tape. and zipper markets
Decline in other markets . Small part of textile industry
Numerous m a i l OperatoR
Growth .n tufted nylon carpet I a n o o H a r e s - . .
markets
and siviet spinning Growth in the use Of open-end
Growth in sewing thread and textured nylon markets . Most dants have already I modernized . Growthof open-endspinning ' I Decline of rina rDinninq
Growth in synthetic nonwoven felts far automotive. carpet. andfurniture markets
Decline in lace and upholstery 14
4-4

STEP 2. ANALYZE TEXTILE ELECTRIC LOADS AND END USES
Having generated a general picture of the textile industry through national and local information, the next step involves generating information on the customer's electricity uses and end-use processes.
Electricity Use and Load Shape
Information about electricity use at the plant or the 3- or 4-digit SIC level helps in identifying DSM opportunities. The starting point for this information is the utility's own records of electricity consumption and billing demand.
The major end use of electricity in textile mills is motor drives used in continuous operations for materials handling and processing. Numerous (often small) motors are run at constant speed in most textile applications. Within a specific mill, changes in production requirements are generally accomplished through adding or subtracting the number of motor-driven textile machines on-line, adding overtime if necessary, and varying the number of shifts worked.
In some cases, load profiles may be available at the plant level. information can be very useful in uncovering DSM opportunities by providing insight into plant operating practices, such as the number and length of the shifts worked. In general, historical profiles show that textile loads tend to be relatively flat during hours of operation. (See Figure 4-1 which shows typical daily load profiles for all the major textile customers in three different service areas.) mills operate one shift, extending to overtime or two shifts to accommodate production surges. employing three shifts per day.
This type of
Most smaller
Large integrated mills tend to be operated continuously,
Electricity End-Uses
Information on how electricity and fossil energy is used by the textile industry i s
required to target potential DSM programs. For example, certain processes such as drying or dyeing are quite amenable to the introduction of electrotechnologies while others such as spinning and weaving/knitting are more amenable to conservation measures.
4-5

1.0 Y m 0) p.
0.6 p Q v) a U c 0.6 M
LC 0
0.4 .r Q u m k 0.2
0.0
Simple Average of - Houston --Georgia ----Consumerr the Three Utility L & P Power Power Load Shapes
-..-.._ _ _ - - - - _ _ _ - - -
-%.
,\. , '. .I ;
.i ; ,,,.*' - .,,.'"''
*. .. -...._ *.... .. ./' : *. . -. .-. ,-. .d'
3.
.I .................... ..
Figure 4-1. Load Profiles for Textile Mills
In addition, it is essential to have approximate electricity usage by these processes to derive an estimate of the magnitude of the load that may be influenced by a DSM program. For example, if the textile industry in the service territory utilizes primarily dry processes, the opportunities for electricity-based drying technologies are limited.
Obtaining electricity use by process and end use is typically a difficult task. To provide the planner with a starting point for these data, Table 4-2 lists processes/end uses for the textile industry, as well as their percentages of electricity and fossil energy consumption. Thus, to obtain energy consumption
4-6


est imates by process/end use, t h e planner must m u l t i p l y t h e e n t r i e s i n Table 4 - 2 by the i n d u s t r y segment's e i e c t r i c i t y and f o s s i l energy use. a v a i l a b l e f rom customer b i l l i n g data, w h i l e t h e f o s s i l use may be obtained froin the customers o r secondary sources.
The e l e c t r i c i t y use i s
It should be noted t h a t Table 4-2 i s based upon t y p i c a l p lan ts . v a r i a t i o n s i n p l a n t design and processing equipment e x i s t , cau t i on i s requ i red i n us ing t h i s in format ion. Add i t i ona l in format ion about energy use by u n i t process f o r ~
var ious t e x t i l e p l a n t con f igu ra t i ons can be obtained from t h e U.S. Department o f
Energy study on t e x t i l e i n d u s t r y energy use(').
Because s i g n i f i c a n t ~
STEP 3. IDENTIFY APPLICABLE DSM TECHNOLOGIES AND PROCESS CHANGES
I d e n t i f y i n g app l i cab le DSM technologies and process changes t o achieve given load shape ob jec t i ves i s t h e next step.
d i s t i n c t phases: (1) i d e n t i f y those u n i t processes t h a t a re most amenable t o given load shape ob jec t i ves , and (2) f o r those u n i t processes i d e n t i f y technology opt ions ab le t o achieve t h e des i red ob jec t i ve .
This i d e n t i f i c a t i o n may be approached i n two
The o p p o r t u n i t i e s f o r s t r a t e g i c load growth are p r i m a r i l y i n t h e e l e c t r i f i c a t i o n of
processes p r e v i o u s l y served by competing fue l s . i nc lude warping/slashing, washing, dyeing, d ry ing , and f i n i s h i n g . N a t u r a l l y , inost o f these processes f a l l i n t o t h e wet processing category.
The most opportune processes
S t ra teg i c conservat ion oppor tun i t i es e x i s t i n wet as w e l l as d ry processing. oppor tun i t i es a l s o e x i s t i n p l a n t serv ices , p a r t i c u l a r l y i n l i g h t i n g and space cond i t i on ing .
So l i d
Load management o p p o r t u n i t i e s a re t i e d t o t h e a b i l i t y o f customers t o modify e x i s t i n g loads and/or t i m i n g o f e l e c t r i c i t y consumption. management o p p o r t u n i t i e s e x i s t i n p l a n t services.
Most o f the load
F l e x i b l e load shape programs have on ly l i m i t e d a p p l i c a t i o n i n t h e t e x t i l e indus t ry . The major a p p l i c a t i o n areas are HVAC, open ing /b lend ing /p ick ing , d ry ing , and f i n i s h i n g .
4-8

To provide the planner with a starting point, processes and applicable load shape objectives and end uses of electricity are listed in Table 4-3. table highlights the production processes that are generally most amenable to achieving a stated load shape objective. found in Appendix 6; additional process information can be found in the U.S. Department of Energy study on textile industry energy use(').
At a glance, this
Descriptions of the unit processes can be
Before proceeding to the technology identification step, it is useful to determine the extent to which the processes are used by the textile industry in the service territory and the amount of energy involved. little and are not expected to grow should be deleted from further consideration.
Clearly, processes that are used very
The final step i s the identification of technology options to achieve the stated load shape objectives. Table 4-4 lists the major DSM technologies and process changes for the textile industry and their general applicability to production processes. As mentioned before, this table is intended as a starting point only. Variations in applicability may result due to unique conditions at a customer's plant.
Additional information about the conservation-related technologies can be found i o
Appendix B and the U.S. Department of Energy study on textile industry use('). Additional information about the strategic load growth-related technologies can be found in Appendix D .
STEP 4. IDENTIFY MARKET IMPLEMENTATION METHODS
There are a number of market implementation methods a utility may use to enhance the market penetration of DSM programs. categories:
These methods may be grouped into five inajor
0 Trade Ally Cooperation
0 Customer Information
0 Direct Customer Contact
0 Direct Incentives
0 Alternative Pricing.
4-9

4 m x 4
r m - - z 0 c VI + W 4
VI c
D P + < e r
m
5 .. 5 c z e - I + w v 31 0 0 m VI VI m VI
0 75
m z 0
c VI m VI
t m-
I

Due to the high diversity of the industrial sector, customer needs and benefits associated with a DSM program may vary by size and type of customer. require different market implementation methods for different customer segments.
This may
Trade Ally Cooperation
A trade ally is defined as any firm, individual, or organization, which has a common interest with the utility to serve a customer and is in a position to influence the customer's decision-making process. Trade allies include equipment vendors, trade associations, and engineering firms. Trade allies can offer utilities marketing leverage and, potentially, third-party endorsements or program funding.
Customer Information
Customer information through education and advertising provides information about the DSM option and the benefits it offers. project case studies, technology demonstration projects, technology application and testing centers, utility or customer staff training seminars, and informational brochures. An education/advertising program is particularly valuable in generating interest in and awareness of a technology or a program. toward a purchase decision, other market implementation methods may become more appropriate.
Education-related programs could include
As the customer moves
Direct Customer Contact
Direct customer contact is the primary market implementation method for industrial programs. Often an individual customer representative is given direct responsibility for large industrial accounts. This representative has frequent contacts with the customer, making him an energy advisor, as well as the contact for the customer for all utility-related matters. contact effort, utilities often offer audits, engineering assistance, and feasibility studies.
As part of the direct customer
4-11

Tab le 4 -4
TEXTILE INDUSTRY SUMMARY: DSM TECHNOLOGIES AND PROCESS CHANGES
Applinbla Lcad Shape obienivei
ADDli(ob1e Unit Pro'anar or End Utes

Table 4-4 (Continued)
Appllrabls Industry Segments Il-nnJ
4-13

Direct Incentives
There are a number of financial incentives available to the utility including l o w
interest loans, no-interest loans, full-interest loans, lease/purchase, rebates, allowances, and buy-backlshared savings. The purpose of these incentives is to reduce the purchase cost and thus improve the financial performance of the investment associated with the DSM alternative. Another form of direct incentive is the use of guarantees or warranties to reduce the customer's perception of risk in making the technology investment.
~
~
Alternative Pricing
Rates are becoming increasingly important as an implementation method. been credited with producing the largest changes in industrial load shapes for most utilities. time-of-use, interrupti b l e/curtai 1 ab1 e, special incentive, stand-by , economic development, and productivity rates. established, requiring review and approval by the regulatory commission.
Rates have
There are a number of rate incentives offered by utilities, including:
New rate programs are generally not easily
Applying Market Implementation Methods
Applying the appropriate market implementation method to a specific technical alternative requires insights into the technology and the customers' decision-making process. appropriate implementation methods, there are a few guidelines.
While it is difficult to generalize the selection of the
In programs involving new technologies, customers face considerable uncertainties with regard to performance and appropriate application. technology application and testing centers, case studies, training seminars, performance warranties, and trade allies are appropriate methods for reducing such uncertainty. Customer audits are useful in identifying show case applications.
Demonstration projects,
For programs involving proven technologies, utilities can focus their resources on qualifying leads and providing financial incentives. Detailed feasibility studies are needed for those proven technologies with applications and economic assess- ments that are particularly site-specific or are being implemented for the primary purpose of taking advantage of alternative pricing programs or load management.
4-14

Another factor influencing implementation methods is sensitivity to cost. programs focus on application areas where electricity is in direct competition with other fuels or non-electric processes. Here financial incentives such as promotional rates or rebates are appropriate.
Some
Finally, there is the degree of control the utility has over the program implementation. In some cases a utility will have only indirect control over industry or technology trends. textile mill is influenced by many factors outside the sphere of influence of a utility. joint advertising programs or by working with engineering firms or trade associations.
For example, the switch to air-jet processing in a
However, utilities may influence technology choices indirectly through
To aid the planner in the selection of appropriate implementation methods, Table 4-5 lists textile industry DSM alternatives and applicable implementation methods. deviation from these general guidelines.
Special situations with regard to the customer or the program may warrant
STEP 5 . EVALUATE AND SELECT DSM PROGRAMS
Prior steps in this evaluation process have characterized the textile industry market segments, the textile industry loads and end-use components, applicable DSM technology and process changes, and appropriate implementation methods. All of these elements are necessary dimensions defining a DSM program.
With the above information in hand, it is now possible to combine the elements to form an appropriate DSM program. This program consists of specific technologies or actions targeted to specific end uses and implemented through applicable market implementation techniques. drying applied to slashing using a performance warranty implementation method. Only after a program has been sufficiently defined is it possible to perform a meaningful evaluation.
For example, a DSM program could consist of infrared
The assessment of DSM programs may be conducted at various levels of detail starting with initiative selection, followed by an aggregate analysis, and ending with a detailed and comprehensive evaluation. Available resources, quality and detail of available data, and importance of the analysis are factors influencing the detail of the assessment. In some cases the program benefits to the utility and the customers are so obvious and clear-cut that little analysis is required to demonstrate this.
4-15

T a b l e 4-5
T E X T I L E INDUSTRY SUMMARY: DSM MARKET IMPLEMENTATION METHODS
Appli'abie Marb
4-16

In other cases the cost of the program may be sufficiently small as to warrant incurring program costs without expensive analysis. Finally, there are programs that require detailed analyses from the customer as well as the utility perspective. Programs where rebates or special rates are involved typically require sufficient detail so as to establish the appropriate incentive level.
In conducting the program assessment it is essential that the program be analyzed from the customers' and the utility perspective. From the customers' perspective the net benefit of participating in the program is the direct cost associated with the program less the cost incurred in maintaining status quo. customer generally consists of:
0 Electricity cost
0 Non-electric fuel cost
0 Operating and maintenance cost
0 Investment cost
0 Cost of process inputs
Other costs.
The cost to the
Comparing these costs on a before-and-after-program basis, and adding any direct incentives or rebates yields the net customer benefit. Programs involving new technologies may have additional customer benefits that are often difficult to quantify, such as improved product quality, increased production flexibility, faster turn-around time, and better manufacturing support and parts availability.
The net benefit to the utility can be calculated in several different ways, but a common one is use of the utility revenue requirements method. In this method the utility's costs are the administrative expenses associated with the program. include management, marketing, monitoring, analysis, and other similar costs. The benefits include items such as reductions in investment for generation, transmission, and distribution equipment and fuel cost savings.
These
Regardless of the manner in which benefits are calculated or expressed, it is useful to plot customer benefits against utility benefits as shown in Figure 4-2. Clearly, programs falling in Quadrant I are the most desirable since they benefit the utility as well as the customers. However, programs falling into Quadrant I1 may be moved into the most attractive quadrant if the utility provides incentives such as lower rates or rebates.
4-17

Positive utility Benefits T
I I I I Negative Positive
Customer Benefits
Negative Utility Benefits
Figure 4-2. U t i l i t y vs. Customer Bene f i t s
A p o s i t i v e customer n e t b e n e f i t does no t necessar i l y mean customer acceptance. Knowledge o f a t e x t i l e f i r m ' s decision-making process and dec i s ion c r i t e r i a i s important i n es t ima t ing customer acceptance. T e x t i l e f i r m s have t h e i r own investment c r i t e r i a such as payback per iod, ne t present value, o r i n t e r n a l r a t e o f re tu rn . I n some cases investment decis ions are made a t t h e p l a n t l e v e l , regardless o f t h e s i z e o f t h e investment. smaller, independently-owned m i l l s . I n o ther cases, a l l investment proposals and p l a n t mod i f i ca t i ons have t o be sent t o a cen t ra l f i n a n c i a l and engineer ing department f o r review and approval. customer investment c r i t e r i a should be e l im ina ted from f u r t h e r considerat ion.
This s i t u a t i o n i s most l i k e l y i n t h e case o f
Regardless, DSM programs t h a t do no t meet
STEP 6. DEVELOP TEXTILE-INDUSTRY DSM PLAN
The f i n a l s tep o f t h i s process i s t h e development o f a DSM p lan f o r t h e t e x t i l e indus t ry . s t r a t e g i c ob jec t i ves , as w e l l as program-specif ic in fo rmat ion i n c l u d i n g general
desc r ip t i on , milestones, monitor ing, and budget. p lan, i t i s use fu l t o l i s t major assumptions and data upon which t h e r e s u l t s a r e predicated.
Th is p lan should i nc lude a c l e a r statement o f t h e u t i l i t y ' s mission and
To a i d i n p e r i o d i c reviews o f t h e
4-18

Goals f o r t h e DSM programs should be s p e c i f i c and q u a n t i f i e d t o a l l ow mon i to r ing o f the programs' e f fec t i veness . Examples o f we l l -de f ined goals are:
0 5-percent annual increase i n t e x t i l e e l e c t r i c process heat ing load
0 10-percent reduc t ion per u n i t i n e l e c t r i c i t y consumption i n g re ige m i l l s over t h e nex t 3 years
10-percent increase i n the number o f i n s t a l l e d radiofrequency u n i t s by 1995
Sign up 5 l a r g e s t t e x t i l e m i l l s t o i n t e r r u p t i b l e r a t e schedule.
0
0
To i l l u s t r a t e t h e content o f a program plan, a hypothe t ica l bu t r e a l i s t i c example i s
shown i n F igure 4-3.
REFERENCE
1. Badin, Joseph S. and Low i t t , Howard E., Energetics, Incorporated, The U.S. T e x t i l e Indus t r y : An Energy Perspective, U.S. Department o f Energy through i t s P a c i f i c Northwest Laboratory, Report DOE/RL/01830--T56, Washington, D.C., January 1988.
4-19

w: Program Objective
Strateg ic Goal:
Tact ica l Goals:
I
Reduce e l e c t r i c usage through the i n s t i l l a t i o n o f adjustable speed dr ives i n the t e x t i l e industry
Have 28 UY o f new Adjustable Speed Drives ( M a ) i n s t i l l e d over t he next four years
C o n t a c t l v i s i t the E P R I T e x t i l e O f f i ce a t Worth Carol ina State Univers i ty t o obta in l a tes t sets o f Tech Commentaries, '28 Questions', case studies, and application, economic, and market reports and t o i den t i f y key industry contacts and equipment w p p l i e rs .
Acquaint E o ~ ~ e r c i s l l i n d u s t r i a l customer representative3 w i th the operational cha rac te r i s t i cs of ASDs and the i c most appropriate app I i c a t ions.
I
I Conduct a t least one saminarlworkshop f o r arch i tects and mechanical, e l e c t r i c a l , and indus t r i a l engineers on appropriate i n s t a l l a t i o n s of MDs.
I
I Survey and q u a l i f y customers f o r po ten t i a l i ns ta l l a t i ons o f ASDs.
I
I
Respond t o requests generated by the sminar(s) f o r possible i n s t a l l a t i o n s o f ASD technology
Develop a case study manual o f actual ASD i n s t a l l a t i o n s i n the region.
Develop I mai l i ng l i s t of a rch i tec ts and anginears t o receive the ASD information inc lud ing case study l a n u I o .
Program kt iii t ies
E n l i s t manufacturers o f ASDs t o conduct a workshop f o r u t i l i t y c ~ ~ ~ s r c i r l l i n d u s t r i s l customer serv ice representatives an the use of ASDs. Workshop top i cs should include successful appl icat ions, performance cha rac te r i s t i cs , advantages and disadvantages. comparisons w i th other type3 o f dr ives (both AC and DC), and c a r t information, the bas is f a r development o f a seminar f o r a rch i tec ts and engineers covering the use o f ASDs as a source o f conservation. The ren inar w i l l include lectures, displays o f equipment, and funct ional appl icat ions. The emphasis o f the lectures w i l l be On proper design and econonic f e a s i b i l i t y . area w i l l be h igh l ighted where possible.
A survey form, t o be conpleted by seminar attendants, w i l l be used t o generate and q u a l i f y leads f o r ASD appl icat ions and the development o f case stud ies.
This workshop N i l I serve as
Ex is t i ng i ns ta l l a t i ons IS we11 I S po ten t ia l i ns ta l l a t i ons i n the service
Leads w i l l be pursued w i th ASD suppl iers .
M i Isstoner
F i n a l i z e Program Contact MD Manufacturers Conduct In-House Seminar Conduct Ssninar f o r Arch i tects and Enaineers Develop Case Study Manual Develop Mai l i ng L i s t and D is t r i bu te Cars Study Manuals
Time Schedule Month
1 2 3 I 6 8
-
Expected Rssults
There are several expected resu l t s o f t h i s program. a rch i tec t and engineering community.
A second r e s u l t f lows from the follow-up o f the seminar survey. between the attendees and the c o ~ i s r c i a I / i n d u P t r i s I customer service representatives. marketing a c t i v i t i e s w i l l have a greater po ten t i a l f o r acceptance and success w i th these t rade a l l i e s .
The two resu l t s above a m near-term and should lead t o the s t ra teg i c goal. increase the energy e f f i c i e n c y of the t e x t i l e industry.
Monitoring 8nd E n l u r t i o n
One of these i s an increased knowledge o f AS0 appl icat ions w i th in the This knowledge w i l l increase oppor tun i t ies for new i ns ta l l a t i ons of ASDs.
This follow-up w i l l promote a closer working re la t ionship With proper fol low-up, addi t ional
The long-term po ten t i a l of the program i s t o
I Monitor attendance a t the seminar I Monitor information requests f o r ASDs and case study manual I Record customer i ns ta l l a t i ons o f ASDs I I
Compare customer energy use and demand before and a f t e r ASDs Estimate customer savings 8s a r e s u l t o f ASD i ns ta l l a t i ons .
Figure 4-3. Illustrative DSM Plan: Strategic Conservation
4-20

Appendix A
OVERVIEW OF THE TEXTILE INDUSTRY


TABLE OF CONTENTS
Section
APPENDIX A
OVERVIEW OF THE TEXTILE INDUSTRY
The Textile Industry Suppliers to the Textile Industry Major Markets and End Uses of Textile Mill Products Regional Impacts o f Textile Production Segmentation and Specialization Industry Concentration Competitive Forces and Imports Cost-Based Competition Impact o f Competitive Responses Business and Product Trends
A- 1
A- 1 A- 3 A- 5 A- 8 A-12 A-13 A-14 A-17 A - 2 2 A-25
A-iii


Appendix A
OVERVIEW OF THE TEXTILE INDUSTRY
The " t e x t i l e complex" i s an i n d u s t r i a l system o f independent en te rp r i ses t i e d together by complex business r e l a t i o n s h i p s and soph is t i ca ted communications networks. It cons is t s o f t h e t e x t i l e machinery producers; raw mate r ia l producers i n t h e a g r i c u l t u r e and chemical indus t r ies ; t e x t i l e m i l l s t h a t produce t e x t i l e yarns, f a b r i c and f l o o r coverings; apparel and home fu rn i sh ings manufacturers; and i n d u s t r i a l f a b r i c s sectors t h a t use t e x t i l e products.
The f l o w o f i n fo rma t ion between the f i b e r , t e x t i l e , apparel, and r e t a i l sectors o f t he t e x t i l e complex i s c r u c i a l t o the e f f i c i e n t operat ion o f t h e e n t i r e " t e x t i l e complex" because i t a l lows companies t o keep inven to r ies low, avoid overstock ing o r stockouts, and ensure t h a t t e x t i l e products are r e a d i l y a v a i l a b l e a t t h e r e t a i l l e v e l .
F igure A - 1 h i g h l i g h t s t h e i n t e r a c t i v e r e l a t i o n s h i p s between segments o f t he " t e x t i l e complex." As noted prev ious ly , f o r t h e purpose o f t h i s repo r t , t h e t e x t i l e i ndus t r y cons is t s o f a c t i v i t i e s r e l a t e d t o yarn and f a b r i c formation, as we l l as dyeing and f i n i s h i n g o f those yarns and fab r i cs .
THE TEXTILE INDUSTRY
The t e x t i l e i n d u s t r y ( S I C 22) produces spun yarns, thread, woven and k n i t f a b r i c s , and carpe ts and rugs. miscel laneous t e x t i l e products such as cordage and twine. t he i ndus t r y i s d i v ided i n t o n ine 3 - d i g i t S I C code categor ies, t he l a r g e s t of which-- in terms o f va lue o f shipments and employment--are k n i t t i n g , manmade f i b e r , f l o o r cover ing, and yarn and thread m i l l s .
It a lso produces nonwoven f a b r i c s , t i r e cords, and As shown i n Table A-1,
A - 1

Natural Fiber Manmade Fiber Producers Producers SICS 01,02
Furnishings SICS 22,23.25 SICS 26,30,
31,37.39
Figure A - I . The Tex t i l e Complex
Table A - 1
1985 OVERVIEW OF THE U.S. TEXTILE INDUSTRY
SIC Code Description
Total Production Value of Shipments Employees Workers
(S Millions) (1,000) (1,000)
22 1 Weaving Mills, Cotton 4,025 62 56 222 Weaving Mills, Manmade Fiber 8,402 I IS 100 223 Weaving, Finishing Mills, Wool 932 13 11
226 Textile Finishing, Except Wool 5,601 52 43
228 Yarn and Thread Mills 8,019 104 94 229 Misc. Textile Goods 5,491 54 43
224 Narrow Fabric Mills 762 17 14 225 Knitting Mills 11,783 193 165
227 Floor Covering Mills 8,060 48 38
All SIC 22 AII Manufacturing
53,075 1,276,013
658 565 18,791 12,171
SIC Percentage o f All Manufacturing 4.2 3.5 4.6
=e: U.S. Department o f Commerce, Bureau o f Census, A n n u a l Survey o f Manufactures, 1985.
A - 2

SUPPLIERS TO THE TEXTILE INDUSTRY
The t e x t i l e i n d u s t r y uses manmade and na tu ra l f i b e r s , chemical dyes, and energy
i npu ts t o manufacture i t s products. indus t ry . many manufacturing and a g r i c u l t u r a l sec tor supp l ie rs . hos ie ry and k n i t goods sec tor are dominated by t h e manufacturing sec tor because t h i s t e x t i l e sec tor produces goods from syn the t i c f i b e r s made by t h e chemical indus t ry .
Table A-2 shows the supp l i e rs t o t h e t e x t i l e Fabr ic , yarn, and thread m i l l s t h a t process wool and co t ton f i b e r s have
Major supp l i e rs t o the
Table A-2
(Percentage Per D o l l a r o f Input ) 1985 SUPPLIERS TO THE TEXTILE INDUSTRY (PROJECTED)
Sector
TEXTILE SECTOR Agri. Constr. Mfp. U t i l i t i e s T r d e F i n m e Servica Other Total
Fabric. Yarn, a d thread m i l l s 13 0 R 4 5 2 3 2 100
Flmr coverims 4 0 87 2 2 1 3 1 100
Misc. tex t i le goods 9 0 74 3 3 3 3 4 100
Hosiery and knit goods 0 0 87 2 2 3 5 1 100
Miss. fabricated tex t i le prod. 0 0 87 2 3 3 3 2 100
. ~~
=e: U . S . Dept. o f Labor, H i s t o r i c a l and Pro jected Input-Output Tables o f t he Economic Growth Pro jec t : Vol. I, Bureau o f Labor S t a t i s t i c s , February 1980.
Table A-3 breaks down supp l i e rs from the manufacturing sectors i n t o S I C codes. i l l u s t r a t e s the t e x t i l e i n d u s t r y ' s r e l i a n c e on t h e chemical i ndus t r y ( S I C 28) f o r suppl ies o f raw mate r ia l s and shows t h e subs tan t i a l amount o f suppl ies coming f r o m w i t h i n t h e i ndus t r y . For example, a major i npu t i n f a b r i c product ion i s syn the t i c yarn produced i n , and suppl ied by, t he t e x t i l e indus t ry .
It
A-3

Table A-3
1985 MANUFACTURING SECTOR SUPPLIERS TO THE TEXTILE INDUSTRY (PROJECTED) (Percentage Per Do l l a r o f Inputs)
Texti le n i l1 S I C Industry category 28 22 23 26 30 Other Total
Fabric, yarn, and thread m i l l s 44 49 1 1 1 5 loo
Floor coverings 29 65 2 1 2 2 100
Misc. t e x t i l e goods 61 22 3 2 4 9 100
Hosiery and kn i t goods 33 60 0 3 0 3 100
Hisc. fabricated t e x t i l e prod. 2 i 7 6 5 5 6 160
KEY:
S I C 28 . Chemicals a d a l l i e d prcducts S I C 22 . Texti le m i l l prodwts S I C 23 . Aware1 and other finished t e x t i l e produsts S I C 26 . P a p r and a l l i e d products S I C 30 . Rubber and miscellaneous plast ics produsts
OTHER:
S I C 20 . Focd and k i d r e d prodwts S I C 21 . Tobacco preducts S I C 24 . L h r a d wood prduc ts (except furniture) S I C 25 . Furniture a d f ixtures S I C 27 . Printing, pbl ishing, a d a l l i e d i d t r i e s S I C 29 . Petrol- ref ining a d related products S I C 31 . Leather and leather products S I C 32 . Stone, clay, glass, a d c w r e t e produsts S I C 33 . Prinmry metal industries S I C 34 . Fabricated m e t a l produsto S I C 35 . Industr ial and c m r c i a l mchinerf S I C 36 . Electronic a d other e lect r ic equipbent S I C 37 ~ Transportation equipmnt S I C 38 . Measuring, analyzing, and control l ing inrtrunnts: photographic,
SIC 39 . Miscell- m f a c t u r i n g i h t r i n d i c a l and w c i c a l o h : natchea url clocks
Source: U.S. Dept. o f Labor, H i s t o r i c a l and Projected Input-Output Tables o f the Economic Growth Project: Vol. I, Bureau o f Labor S t a t i s t i c s , February 1980.
-
A-4

MAJOR MARKETS AND END USES OF TEXTILE MILL PRODUCTS
T e x t i l e m i l l products are used i n a l l sectors o f the U.S. economy. The major buyer o f t e x t i l e m i l l products i s the manufacturing sector, purchasing over 90 percent o f a l l t e x t i l e m i l l products manufactured i n t h e U.S. Wi th in t h e manufacturing sec tor , the t e x t i l e i ndus t r y i t s e l f , and the apparel, rubber and miscel laneous p l a s t i c s , and t r a n s p o r t a t i o n i n d u s t r i e s are among the l a rges t users o f t e x t i l e m i l l products. About 63 percent o f f l o o r cover ing products are used i n t e r n a l l y i n the f l o o r
cover ing i n d u s t r y ( S I C 227). t r a n s p o r t a t i o n equipment sec tor as automotive upholstery.
f o r e s t r y , f i s h i n g , and o ther sectors o f the economy consume on ly small q u a n t i t i e s o f t e x t i l e m i l l products. Cordage, twine, f i b e r cable, f i s h i n g ne ts , and rope are t y p i c a l t e x t i l e products consumed by these sectors. Table A-4 shows major t e x t i l e product ca tegor ies and the main manufacturing sectors f o r which they are produced.
Another 29 percent o f f l o o r cover ings are used by the
The a g r i c u l t u r e ,
T e x t i l e m i l l products are used domest ical ly i n th ree main consumer end uses--home fu rn ish ings , apparel, and i n d u s t r i a l f a b r i c s . They represent 34, 35, and 31 percent, respec t i ve l y , o f a l l t e x t i l e m i l l product end uses. (See Figure A-2.)
Federal and s t a t e laws and consumer preferences p lace c e r t a i n requirements on the f i n i s h i n g processes o f t e x t i l e goods manufactured f o r these end-use categor ies:
Home Furnishings - F i r e Retardant Proper t ies
Home fu rn i sh ings i nc lude upholstery, carpets, and draper ies. They requ i re p r o t e c t i v e p r o p e r t i e s such as f i r e re ta rdants and s t a i n p ro tec t i on . Many o f these q u a l i t i e s are n o t on l y demanded by consumers bu t are requ i red t o ensure compliance
w i t h s t a t e laws and l o c a l b u i l d i n g codes.
A-5

Table A-4
(Percentage Per Dollar o f Output) 1985 MANUFACTURING SECTOR BUYERS OF TEXTILE MILL PRODUCTS (PROJECTED)
Texti le M i l l S I C I d u s t r y Category 20 22 23 25 26 30 31 37 39 Other Tota l
Fabric, yam, a d thread m i l l s 0 54 35 3 O 3 1 0 2 2 100
Floor coverings 0 63 2 0 0 0 3 29 0 3 100
Misc. t e x t i l e goods 0 27 25 7 1 22 6 2 4 6 100
Hosiery and kn i t gods 0 44 52 1 0 0 2 0 1 0 100
Hiss. fabricated t e x t i l e prcd. 5 18 33 7 1 2 7 10 3 13 100
KEY:
S I C 20 . Food and kindred products SIC 22 . Texfile mill products S I C 23 . Appsrel and other finished textile p r o h r t s S 1 C 25 . Furniture and f ixtures SIC 26 . P.PK and a1 1 ied produsts SIC 30 . R u b b s r ard miscellaneous plast ics p r o h r t s SIC 31 . Leather and leather products SIC 37 . T r a m p r t a t i m quiprent S I C 39 . Miscellaneous mnufacturing industries
OTHER: S I C 21 . Tobscco products SIC 24 . Lunber and u d products (except furniture) S I C 2 7 . Printing, publishing, and a l l i e d industries S I C 28 . Chemicals and a l l ied products SIC 29 . Petrol- ref ining and related p r o h r t s Slt 32 . Stme, clay, glass, and concrete p r o h r t s S I C 33 . P r i m a r y metal i d u s t r i e s S I C 34 . Fabricated metal produsts S I C 35 . I d t r i a l and c n r r r c i a l machinery SIC 36 . Electronic and other e lect r ic quimt sxc 38 . Measuring, annlyzing, ard control l ing instrunents: photographic.
medical and optical seeds: uatchea and clocks
=e: U.S. Dept. o f Labor, Historical and Projected Input-Output Tables o f the Economic Growth Project: Vol. I, Bureau o f Labor Statistics, February 1980.
.
A-6

Figure A-2. End Uses Of Textile Mill Products - Source: U.S. Oept. o f Labor, Historical and Projected Input-Output Tables of the
Economic Growth Project: Vol. I , Bureau of Labor Statistics, February 1980.
Industrial Fabrics - Clean Room and Barrier Properties
Textile products are used in the medical, microelectronics, and pharmaceutical sectors for a variety of purposes. Absorption, electrostatic and fibrous filters, and fiber-reinforced composites are examples of specialized uses in the industrial sector. Fabrics with improved particle barriers, low lighting, and antistatic qualities are especially attractive to the pharmaceutical and microelectronics sectors. and thermal stability as well as a measure of flame retardancy.
Most specialized uses require a certain level of yarn and fiber chemical
Apparel Fabrics - Protective Qualities
In the apparel sector, the primary emphasis on product quality is aesthetics. Protective qualities, however, such as weather protection and thermal and chemical hazard protection for functional clothing (such as uniforms), are also required. Apparel fabrics also require qualities that offer protection against discoloration and skin irritation.
A-7

The types of chemical dyes and printing agents, as well as the dyeing and finishing methods used, can affect the protective qualities required by these three major end users and significantly impact all aspects of textile manufacturing. Chemical dyes and treatment have to be applied a t the appropriate stage o f the manufacturing process and i n exact quantities. Manufacturing, production, marketing, and distribution as well as research and development activities all focus on meeting the requirements of these textile product end uses. Textile manufacturers continually conduct assessments o f the structure, property, and performance of various fiber and fabric types in order to manufacture products which meet the qualities that their end users require.
~
~
~
REGIONAL IMPACTS OF TEXTILE PRODUCTION
Textile manufacturing is a highly regionalized activity, concentrated mainly in the Northeast, Southeast, and Mid-Atlantic regions. North and South Carolina, Georgia, Virginia, Alabama, Pennsylvania, New York, Tennessee, Massachusetts, and New Jersey are all major producers. There is a fair amount o f segmentation in the highly concentrated geographic
Figure A-3 shows the largest textile producing states.
Billion $
" NC GA SC VA AL PA NY MA TN NJ CA R I T X ME OH K Y IL MS CT AR NH MCRRest
State
Figure A-3. 1985 Textile Industry Shipments by State
A -8

distribution of the textile industry. across the country. most highly concentrated industry in the U.S. Approximately 80 percent of total U . S . textile mill shipments originate from the Southeast region, while about 9 percent of shipments originate from the Mid-Atlantic states of New Jersey, New York, and Pennsylvania. concentration at the 3-digit SIC level. fabric mills are concentrated in New England. and 50 percent, respectively, of shipments in these two textile industry sectors.
Tables A-5 and A-6 track textile production Table A-5 demonstrates that textile manufacturing is the second
Table A-6 further illustrates the extent of this industry
This region accounts for 77 percent Wool weaving and finishing mills and narrow
Cotton weaving mills are primarily located in the Carolinas, Georgia, and Alabama followed by Pennsylvania and Massachusetts. New York, New Jersey, North and South Carolina, and Tennessee have the largest concentrations of knitting mills, with North Carolina the dominant state. Alabama, Kentucky, New Jersey, Pennsylvania, and South Carolina.
The major states producing nonwoven fabrics are
Textile production dominates the economies of North and South Carolina and Georgia. Over 1,000 textile mills are located in North Carolina alone, employing 24 percent of the state's manufacturing labor force. (See Table A-7.)
There are over 100 floor covering mills in Georgia, most of them in the city of Dalton. coverings is not as heavily concentrated in the Southeast as the production of other textiles. In addition to Georgia, major carpet and rug mills are found in California, Texas, North Carolina, and Tennessee. Tufted carpets account for over 95 percent of the U.S. shipments of floor coverings. tufted carpets, transportation costs are high so floor covering mills are more widely dispersed in the U . S . than textile mills producing other textile products.
Despite this heavy concentration in one city, the production of floor
Due to the bulky nature o f
A-9

Table A-5
1986 REGIONAL MANUFACTURING ACTIVITY (Percentage of Dollar Value of Shipments)
fwth. I a t h H i d Yaw E. YOIth Y. SOuth Y. YOI th 10r.1 7Ol.L s i c east Af lant lc Lt lant lS Emlard Central C n t r a l V a S i t i S Cmtr.1 M M t n i n (I) tmi l i lon I )
20 13 7 13 3 18 11 15 17 4 100 30e.123 21 (UI 12 1 0 0 0 0 0 o 100 19.071 22 M 2 P 6 1 1 0 1 0 100 55,3'9 23 25 5 29 5 IO 9 12 3 1 100 11,919 26 21 5 ' 4 I1 16 31 6 6 100 58.158
26 21 5 14 9 22 10 12 6 1 100 9l,853 27 9 8 27 7 20 6 12 8 3 100 114,57!
29 2 1 9 0 14 51 18 3 3 100 124.378 30 18 I 13 7 30 9 10 7 1 100 73.381 31 12 3 26 22 15 a 0 13 0 100 ?.eov
33 I1 7 18 4 39 7 7 6 3 100 101,6L7
25 27 4 11 3 26 9 12 5 2 io0 31,m
28 18 9 18 3 19 20 6 5 1 100 197.0P1
12 15 8 16 4 11 11 13 e 4 100 11.27:
Y 10 5 14 7 36 8 11 7 2 100 137,976 35 P 6 13 10 29 8 12 10 4 100 20LI.529 34 13 7 15 9 20 9 16 5 4 100 196.2'5
3d 6 3 33 14 12 6 I6 5 6 100 bl,P10 39 9 2 30 16 18 5 11 5 X 100 27,219
37 8 5 6 4 41 6 17 I1 2 IW 311.625
ntg. S X ~ O V i h i p n n t r 326,223 131.617 324,039 129.t42 545.436 2@,454 ZW.06P l(u.808 63.026 ''_ 2,260,315 m (..sim < m i l l i o n I,
=e: U.S. Dept. of Commerce, Bureau of Census, Annual Survey of Manufactures, 1986.
A-10

Table A-6
1985 TEXTILE INDUSTRY MANUFACTURING ACTIVITY (Do l la r Value o f Shipments)
10t.l Shpnts . W t h . W t h Mid In E. North Y. W t h Y. North SIC mlllim I) east A t l a n t i c At lnt ie Ewlnd Cmfr.1 Central P.sifls Cmtr.1 * M t a i n 10c.L
221 4.025 3.954 0 57 0 0 0 14 0 0 4.025 222 11.402 7,4119 0 358 400 0 142 13 0 0 8.402 223 933 130 0 83 719 0 0 0 0 0 933 224 962 193 9 250 481 0 0 30 0 0 962 225 11.7113 7,172 113 3,222 529 2% la9 197 77 0 11.783 226 5,601 4,W 12 596 616 23 0 56 0 0 5,601 227 8.061 6,986 0 352 0 0 0 R2 0 0 8,061 228 8,019 7,312 0 263 303 0 0 141 0 0 8,019 229 5,491 2,5& 97 892 1.029 603 37 201 48 0 5,491
IOTAL 53.276 40,119 229 6,073 4.077 910 362 1,374 125 0 53.276
(Percent of dol lar value of shi-tr)
221 4.025 98 0 1 0 0 0 0 0 0 100 222 8.402 89 0 4 5 0 2 0 0 0 100 223 933 14 0 9 77 0 0 0 0 0 100 224 962 20 1 26 50 0 0 3 0 0 100 225 11.7113 61 1 27 4 2 2 2 1 0 100 226 5,601 n O 11 11 0 0 1 0 0 100 227 8,061 87 0 4 0 0 0 9 0 0 100 228 8,019 91 0 3 4 0 0 2 0 0 100 229 5.491 47 2 16 19 11 1 4 1 0 100
lWAL 53,276
~
Source: U.S. Dept. o f Commerce, Bureau o f Census, Annual Survey o f Manufactures, 1985.
Table A-7
1986 REGIONAL IMPACTS OF TEXTILE MANUFACTURING
TEXTILE M I L L INOUSTRY ALL MNUFACTWllNG TEXTILE M I L L SHARE OF TOTAL IUNUFACNRES
Shi-ts E n p l o y n e n t Shi-ts Employment Shi-ts E n Q l o w t
STATE ( m i l l i o n f) (thousands) (million I) (thousards) ( X ) ( X )
sc 8.406 94 36.098 353 23.3 26.7 CA 11,617 95 65,581 543 17.7 17.4 NC 14.770 194 84,935 803 17.4 24.2 AL 2.756 32 34,009 329 8.1 9.7 VA 3.069 35 46,850 407 6.6 8.6 TN 1.635 21 52,717 467 3.1 4.5
T o t a l SE 42.2TJ 471 320,190 2,901 13.2 16.2 T o t a l us 52.629 676 2,218,507 18,370 2.4 3.7
SE as Z of us 80.3 69.7 14.4 15.8 .. ..
- Source: U . S . Dept. o f Commerce, Bureau o f Census, Annual Survey o f Manufactures,
1986.
A-11

SEGMENTATION AN0 SPECIALIZATION
The textile industry is highly segmented on the basis of fiber content, manufacturing processes, and product end use:
Fiber Content
Weaving and knitting mills are classified according to whether they process cotton, wool, or manmade fiber. accounting for approximately 17 percent of the industry's value of shipments. The U.S. ranks number one worldwide in consumption of manmade fiber (40 lbs. per capita, compared with the global average of about 20 lbs.). made of natural fibers also increased during the 1980s. dramatic rise in the production and shipment of cotton woven and knit goods and woolen fabrics.
Manmade fiber mills have grown considerably recently,
Demand for textile products This growth has caused a
Manufacturinq Process
The textile industry is also segmented according to the manufacturing process employed. knitting, or nonwoven. There is a high degree of vertical integration in the weaving mill sector, where about 90 percent of spun yarn is produced for its own use in woven goods. The level of integration is lower in the knitting sector, mainly because a large share of knitting yarn goes directly to the apparel industry for the production o f knit goods--apparel, hats, and gloves.
Mills are classified by type of fabric formation process: weaving,
Product End Use
Textile mill products are also classified according to their end uses. coverings is one such classification where distinctions are made between tufted carpets, regular carpets, and rugs. least 12 inches wide) and narrow woven fabrics.
Floor
Weaving mills produce broad woven fabric (at
The differences in manufacturing processes, especially fabric formation and finishing, account for this fairly high degree of specialization in the textile mill industry. As shown in Table A-8, the tufted carpet and spun yarn mills segments are the most highly specialized in the textile industry but there is also a considerable
-
i
A-12

spec ia l i za t i on r a t i o " ind ica tes the share o f products shipped by establishments egree o f spec ia l i za t i on i n the nonwoven fab r i cs sector. S I C codes. products w i t h i n t h e i r S I C code, whereas a lower r a t i o imp l ies t h a t the indus t ry produces a v a r i e t y o f products.
The "primary productwithin Indus t r i es w i t h spec ia l i za t i on r a t i o s o f 100 percent produce on ly
Table A-8
R A T I O S OF PRIMARY PRODUCT SPECIALIZATION I N SELECTED TEXTILE MILLS
(Percent)
Industry Sector 1977 1982
Weaving H i l l s , C o t c M 84 84 Ueaving Mi l ls , narmede e4 89 Tufted C a r p W R u g S 96 97 Spun Yarn M i l l s 92 93 Nonwoven Fabrics e4 90
=e: U.S . I n te rna t i ona l Trade Administrat ion, U.S. Global Competitiveness: The U.S . T e x t i l e M i l l Industry, December 1987.
INDUSTRY CONCENTRATION
The t e x t i l e i ndus t r y cons is ts o f about 5,300 companies operat ing over 7,000 m i l l s ,
ranging from h i g h l y in tegra ted t o small , independent plants. companies are small establishments performing s ing le operations on a cont rac t basis f o r o ther m i l l s . The most common type o f t e x t i l e m i l l i s the greige m i l l , i n which spinning, k n i t t i n g , and weaving operations are combined t o produce greige goods--unfinished t e x t i l e products. The highest concentrat ion r a t i o s are i n the co t ton and nonwoven fab r i cs sectors where the 20 l a r g e s t f i rms accounted f o r 85 and 77 percent o f the 1982 shipments i n those sectors, respec t i ve l y (see Table A-9).
Many o f these
Concentration var ies from segment t o segment.
A-13

Table A-9
SHARE OF TEXTILE SHIPMENTS ACCOUNTED FOR BY 20 LARGEST COMPANIES (Percent)
Inds try Sector 1 9TI 1982 ...................................................................... Weaving M i l l s , Cotton 79 a5 Weaving M i l l s , M a d e 16 69 Tufted Carptslaugs 59 65 spv l Yarn M i l l s 51 56 Nowoven Fabrfcs 81 TI
=e: U.S. International Trade Administration, U.S . Global Competitiveness: The U.S. Textile Mill Industry, December 1987.
With the recent spate of mergers and acquisitions, these concentration ratios have changed considerably. are the knitting mills, textile finishing, and yarn and thread mills. are independently-owned operations. sectors has traditionally been very low.
The industry segments with the lowest concentration ratios
As a result, industry concentration in these Many o f these
COMPETITIVE FORCES AND IMPORTS
The U . S . textile industry is being forced to adjust to intense international competition that is eroding the U.S . share of the world textile market and resulting in the importation of vast quantities of inexpensively produced products. addition, increasing domestic competition is threatening profit margins and spurring an unprecedented wave of mergers and acquisitions within the textile industry.
In
A-14

Foreign Competit ion
I n t h e domestic U.S. t e x t i l e market as a whole, t h e share o f impor ts grew from s l i g h t l y under 15 percent i n 1975 t o over 37 percent i n 1986. apparel f a b r i c s sector , t he impor t share reached almost 54 percent (Table A-10).
I n t h e apparel and
Table A - I O
IMPORT SHARE OF TEXTILE MARKETS (Percent)
i 9 n 1974 i 9 n 1976 i 9 n 1978 1 9 ~ 9 1980 1981 1982 1 9 s 1984 1985 1986
Text i les 17.3 15.6 14.2 17.1 16.4 18.5 15.2 16.8 20.0 21.0 25.2 31.7 33.2 37.5
Apparel and apparel fabric 27.7 25.2 23.3 28.1 26.6 30.6 25.5 27.8 32.3 32.4 37.9 46.8 48.0 53.8
I d u s t r i a l fabrics and horns furnishims 5.8 5.1 3.8 4.9 4.9 5.3 4.6 4.7 5.9 6.9 10.7 14.6 16.4 17.9
=e: U.S . O f f i c e o f Technology Assessment, The U.S . T e x t i l e Indus t ry : A Revolut ion i n Progress, Washington, D.C., A p r i l 1987.
The U.S. p o s i t i o n i n t h e wor ld t e x t i l e market has weakened, w h i l e t h e pace o f i n t e r n a t i o n a l compet i t i ve fo rces from both developed and developing coun t r i es has increased. Competit ion from developed coun t r i es such as Germany and I t a l y i s based on t h e i r super io r technology because most o f t h e recent developments i n t e x t i l e manufacturing technology have o r i g i n a t e d i n Europe. Many o f t h e p r o d u c t i v i t y ga ins achieved i n t h e U.S. t e x t i l e i ndus t r y were der ived from equipment imported from German, Swiss, Japanese, and o ther f o r e i g n manufacturers. Competit ion from developing o r newly i n d u s t r i a l i z e d coun t r i es such as Taiwan, Hong Kong, and Korea has a l s o i n t e n s i f i e d . t h e b e n e f i t s o f modern technology t o make subs tan t i a l inroads i n t o g loba l t e x t i l e markets. The t e x t i l e i ndus t r y i s h i g h l y l abo r i n t e n s i v e and, there fore , t h i s labor cos t advantage can have subs tan t i a l impact.
These coun t r i es have combined t h e i r l abo r cos t advantage w i th
A-15

Production costs have become a vital competitive tool in the textile mill industry. High U.S. labor, raw material, and other costs have to be offset by increases in manufacturing productivity for the industry to remain competitive. Between 1975 and 1985, the textile industry's productivity level grew faster than the average for all manufacturing. America and its competitors in Asia and other developing regions shows the need for additional improvement in the U.S. and Canadian textile mill industries' productivity (see Table A-11).
Yet, the comparison of the growth in productivity between North
Table A-11
(1980 Production Output = 100) INDEX OF PRODUCTION FOR THE TEXTILE INDUSTRY
Rwion 1979 1981 1982 l9Bi 19%
N. Am?ica* 105 98 89 102 , 101
Europe 102 96 93 91 94
Developing Countries 98 101 101 105 107
A s i a 96 105 104 114 115
* U.S.A. ard Canada
=e: U.S. International Trade Administration, U.S. Global Competitiveness: The U.S. Textile Mill Industry, December 1987.
By most measures of industrial competitiveness, the U.S. textile mill industry as a whole has not been entirely successful in keeping pace with competitive forces. Despite increases in production, the constant dollar value of U.S. shipments did not rise during the 1983-1987 period as fast as it did during preceding years. The U.S . share of the world textile exports a l so declined, and in terms of production costs, including raw material, labor, and other costs, foreign producers continued to push their advantage over the U.S.
A-16

Domestic Competition
Competition at the domestic level has also intensified. traditionally low profit margins and little product differentiation, cost effectiveness and cost reduction are important strategic weapons. mill industry has become very volatile as a result of this domestic competition. Mergers and acquisitions have increased as companies seek to buy out other profitable companies. processes and implemented quick-response marketing and distribution systems in order to gain rapid access to their consumer markets. Burlington, who choose to challenge hostile take-over attempts, may become financially strapped and not able to make large capital investments in new technologies.
In an industry with
The U . S . textile
Companies wanting to survive have adopted new manufacturing
However, companies such as
COST-BASED COMPETITION
Textile firms are concentrating their competitive strategies on cost reduction. materials and labor, the two largest cost components, are the main targets of these strategies. However, textile firms have also adopted economic and technological measures to respond to competitive threats.
Raw
Raw Material Costs
The largest cost item in textile production is raw material, mainly cotton and man- made fibers. Mill consumption of fiber increased from 9.36 billion lbs. in 1982 t o
almost 12 billion lbs. in 1986, a 27 percent increase. The relative size of raw material costs means that textile companies will examine them first in cost reduction programs. goals.
They look to fiber quality to help them achieve cost reduction
Fiber quality is a major priority for textile producers because higher quality fibers result in fewer breakages and less waste. quality can be significant. combined with computerized monitoring to detect and eliminate fibers of inferior quality, thereby ensuring optimal blends. rapid processing speeds that are attainable with advanced spinning and weaving machinery. stops occur, the cost advantages of newer, faster equipment may be negated.
The impact of technology on fiber Opening, picking, and blending techniques can be
Good quality fiber can also withstand the
If fiber of poor quality is used, and many breakages requiring frequent
A-17

Labor Costs
The U.S. is at a relative disadvantage when comparing its labor costs to developing countries and many other international competitors ( see Table A-12). compensation rates for textile mill workers in the U . S . have exceeded those of its competitors, with the exception of Italy, throughout the 1980s. U . S . producers must compensate for this labor cost disadvantage by increasing labor productivity.
Hourly
Recently, the textile mill industry has become less labor intensive. Total employment declined from 765,000 in 1974 to 730,000 in 1987. However, with over 80 percent of its workforce employed in production, it still ranks as the 10th largest industrial employer. costs to remain relatively stable, despite hourly wages for textile mill workers increasing from $6.31 to $8.81 between 1980 and 1986. As the industry becomes more automated, firms are stepping up capital expenditures and reducing production labor costs. As a result, the industry's capital expenditure per production worker increased from $2,110 per production worker in 1980 to $3,300 in 1985.
The decline in employment has allowed overall industry labor
Table A-12
( U . S . Dollars) HOURLY COMPENSATION RATES FOR TEXTILE PRODUCTION WORKERS
country 1980 1982 1981 1986
China HA YA 0.26 0.23 Hang K m g 1.53 1.65 1.59 1.W I t a l y 6.96 6.57 6.57 9.19 .]*pan 4.22 4.15 4.68 6.77 Korea 0.81 0.9 1.01 1.09 Taiwan 0.05 1.11 1.41 1.62 United $rates 6.31 7.37 8.21 8.81
......................................................................
=e: U.S. International Trade Administration, U.S. Global Competitiveness: The U.S . Textile Mill Industry, December 1987.
A-18

Economic Measures
In an effort to make textile production more efficient and competitive, textile manufacturers have also adopted economic measures. Unprofitable and inefficient mills have been shut down causing the number of textile plants in the U.S. to decline by 10 percent between 1977 and 1982. Over 350 inefficient textile mills were closed between 1981 and 1987. efficient mills that operate technologically sophisticated and less labor-intensive equipment were opened. Although this trend has slowed recently, old, unprofitable, and unproductive looms and spindles continue to be eliminated. accounted for more than 90 percent of the looms shut down between 1983 and 1985 (see Table A-13).
In place of some of these plants, new, more
The Southeast
Strategic marketing programs have also been initiated by companies discontinuing unprofitable product lines and starting inventory monitoring programs. shipping procedures have been streamlined with the help of computerized systems. addition, companies are capitalizing on proximity to domestic textile markets to ensure a quick and flexible response to customers using computerized ordering and inventory management systems.
Ordering and In
Objectives of these "quick-response'' systems are to:
0 Reduce investment in raw materials and inventories
0 Enhance the accuracy of production scheduling
0 Prevent loss of profits due to surplus inventories or stockouts.
Companies have also followed niche strategies--moving into markets with less labor intensity and greater growth prospects. The industrial and home furnishings markets are prime examples of markets with high growth prospects. manufacturing (Burlington Industries, J.P. Stevens, Collins & Aikman, etc.) have all pursued these strategies by entering into the upholstery, carpeting, and other industrial fabrics segments of the textile industry.
The big names in textile
A-19

Table A-13
1983-1985 PERMANENT TEXTILE PLANT CLOSINGS IN THE SOUTHEAST
Nvnber of No. of Spindles Locat im Locus Shut Doun Eliminated ......................................................................... South C a r o l i M 9.750 3W.564 North C a r o l i ~ 2.188 266,956 Georgia 2 . a 2 175.012 Vi rg in ia 499 77,060 Alabama 0 56,816
Total 15,039 966.401)
=e: Office of Technology Assessment, The U.S. Textile and Apparel Industry: A Revolution in Progress, April 1987.
Technological Measures
The textile industry has also employed technological measures as a means of strengthening its competitive position and productivity. increased rapidly after 1974, peaking at $1.9 billion in 1984. went towards purchases of faster, more-efficient looms like the rapier, air jet, and other types of shuttleless looms.
New capital expenditures These investments
The adoption of technological methods, however, has not been as widespread as the adoption of economic measures. beyond the resources of many of the small, independent mill operators around the country. As a result, most o f the recent investments in mill modernization have been restricted to the larger companies. capital expenditures since the early 1980's has amounted to $2 billion.
Mill modernization expenses can be high, often
For example, Burlington Industries'
As shown in Table A-14, capital expenditures in the textile industry followed a more erratic trend than those for all manufacturing. industry's piecemeal investment i n technological measures. have dropped.
This may reflect the textile Expenditures since 1984 -
However, expenditures will have to continue just to maintain modern
A-20
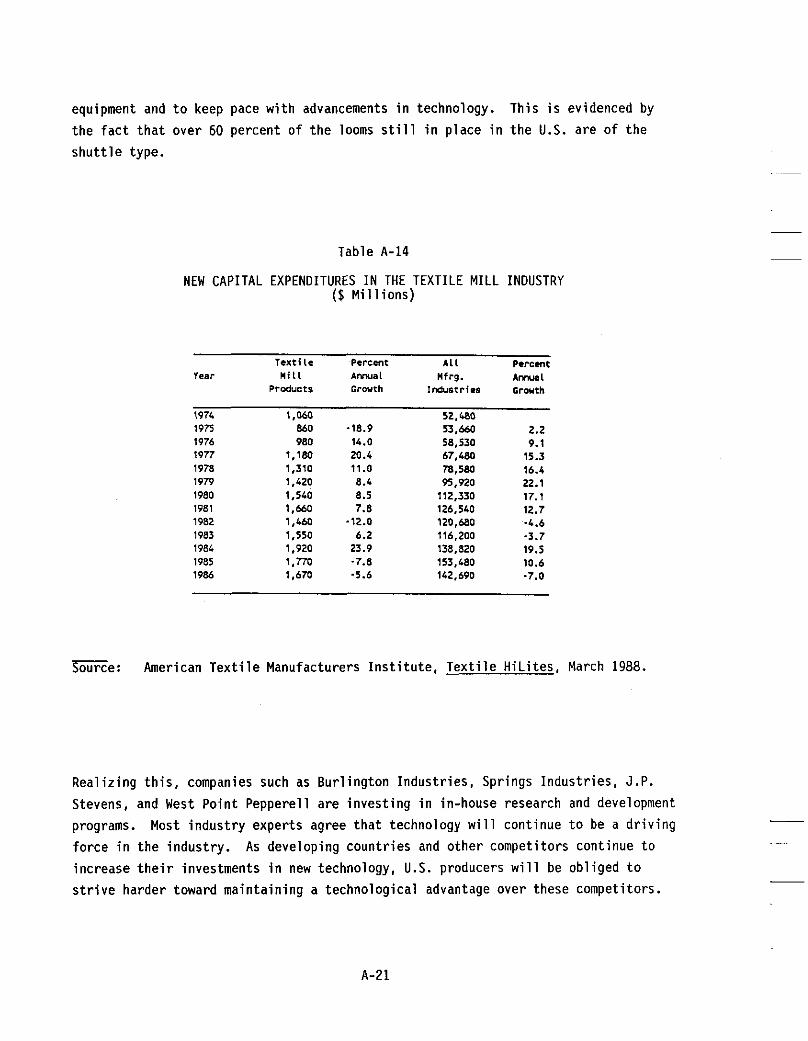
equipment and t o keep pace w i t h advancements i n technology. This i s evidenced by the f a c t t h a t over 60 percent o f t he looms s t i l l i n place i n the U.S. are o f t he
s h u t t l e type.
Table A-14
NEW CAPITAL EXPENDITURES I N THE TEXTILE MILL INDUSTRY ($ M i l l i o n s )
Text i le Percent A11 Percent Year M i l l A w a l Ilfrg. A w l
1974 1.060 52.480 1975 8.50 -18.9 53,MO 2.2 1976 980 14.0 58,530 9.1
PrOducts Growth I d t r i e s Growth
1977 1.1.90 20.4 67,480 15.3 1978 1,310 11.0 78.580 16.4 1979 1,420 8.4 95.920 22.1 1980 1,540 8.5 112,330 17.1 1981 1.W 7.8 126,540 12.7 1982 1.460 -12.0 120,680 -4.6 1983 1.550 6.2 116,200 -3.7 1984 1.920 23.9 138,820 19.5 1985 1,770 -7.8 153,480 10.6 1 986 1,670 -5.6 142,690 -7.0
=e: American T e x t i l e Manufacturers I n s t i t u t e , T e x t i l e H iL i tes , March 1988.
Rea l iz ing t h i s , companies such as Bur l ing ton Indus t r ies , Springs Indus t r ies , J.P. Stevens, and West Po in t Pepperell are inves t ing i n in-house research and development programs. Most i ndus t r y experts agree t h a t technology w i l l continue t o be a d r i v i n g fo rce i n the indus t ry . increase t h e i r investments i n new technology, U.S. producers w i l l be obl iged t o s t r i v e harder toward maintaining a technological advantage over these competitors.
As developing countr ies and other competitors continue t o
A-21

IMPACT OF COMPETITIVE RESPONSES
The measures adopted by the t e x t i l e indus t ry t o respond t o compet i t ive pressures have resu l ted i n s t r u c t u r a l changes t o t e x t i l e manufacturing processes and increased p r o d u c t i v i t y and modernization rates.
T e x t i l e M i l l I n teg ra t i on
Increased dependence on technology i s causing the t e x t i l e indus t ry t o emphasize la rger , more-integrated operations. As a r e s u l t , small , p r o f i t a b l e companies become acqu is i t i on ta rge ts o f companies wishing t o d i v e r s i f y operations. Companies l i k e Dan River and Cone M i l l s reverted t o p r i v a t e ownership t o p ro tec t themselves from being acquired.
In tegra ted operat ions are necessary t o streamline the i n d u s t r y ' s expensive and burdensome mate r ia l f low. Major companies l i k e M i l l i k e n , Bur l ington, and J.P. Stevens have s ta r ted operat ing in tegra ted m i l l s i n which a l l t e x t i l e processes are performed, from s t a r t t o f i n i s h . Yarn spinning, weaving, f a b r i c formation, and dyeing and f i n i s h i n g are a l l performed a t in tegra ted m i l l s .
Major t e x t i l e producers have a l so fo l lowed forward- integrat ion s t ra teg ies by purchasing apparel companies -- f o r example, West Point Pepperell acquired C lue t t Peabody. Backward i n t e g r a t i o n has a lso taken place, w i t h f a b r i c producers acquir ing i n te res ts i n yarn producing f a c i l i t i e s . The increased use o f manmade f i b e r s i n the 1960s and 1970s caused t r a d i t i o n a l a g r i c u l t u r a l producers t o be replaced by chemical manufacturers as major supp l ie rs o f raw mater ia l t o the t e x t i l e m i l l . chemical companies, such as Celanese, DuPont, and Monsanto, have i n t e r e s t s i n t e x t i l e companies and support industry-sponsored research i n t o t e x t i l e manufacturing.
Many b i g
Hor izontal i n t e g r a t i o n i s a lso tak ing place w i t h increasing frequency. acqu is i t ions , res t ruc tu res , and consol idat ions have become common. J.P. Stevens acquired Bur l ing ton Indus t r i es ' home fu rn ish ings business before being acquired i t s e l f by an investment group inc lud ing West Point Pepperel l , i n e a r l y 1988. Bur l ington, t h e l a r g e s t U.S. t e x t i l e firm, embarked on a res t ruc tu r ing p lan which involved the d i s p o s i t i o n o f unp ro f i t ab le businesses t o t a l i n g over $600 m i l l i o n i n sales and t h e c los ing o f over 74 plants. and acqu is i t i ons i n the t e x t i l e industry, compared w i t h on ly 5 f o u r years e a r l i e r .
Mergers and
I n 1986 alone, there were over 20 mergers
A-22

T e x t i l e I n d u s t r y P r o d u c t i v i t y
I n t h e m i d - l 9 7 0 ' s , p r o d u c t i v i t y i n t h e t e x t i l e i n d u s t r y was lower than t h e n a t i o n a l average f o r a l l manufac tur ing i n d u s t r i e s . However, s i n c e 1979, changes i n s t r a t e g y have emphasized r u n n i n g m o r e - e f f i c i e n t t e x t i l e m i l l s and e l i m i n a t i n g i n e f f i c i e n t ones, t h u s a c c e l e r a t i n g t e x t i l e i n d u s t r y p r o d u c t i v i t y . For many t e x t i l e companies,
economic measures (such as s t r a t e g i c market ing programs and stream1 i n e d i n v e n t o r y and d i s t r i b u t i o n systems) have improved o v e r a l l p r o d u c t i v i t y . Technologica l measures, such as s h u t t l e l e s s looms, open-end sp inn ing , and automated p r o d u c t i o n and m o n i t o r i n g systems, have a l s o improved p r o d u c t i v i t y . between 1976 and 1986 p r o d u c t i v i t y indexes grew a t an annual average r a t e o f 5 . 2 percent i n t h e t e x t i l e m i l l i n d u s t r y , compared w i t h 2.8 percent f o r a l l manufactur ing.
As shown i n Table A-15,
Table A-15
TRENDS I N U.S. TEXTILE INDUSTRY PRODUCTIVITY ( P r o d u c t i v i t y * Indexes - 1977 = 100)
7.w lcxci 1. A l l M i l l ".
Pr&t. 1rdmtrln
1976 82.1 97.1 1977 100.0 100.0 1978 W.4 101.5 1979 104.9 101.4 1980 110.2 101.4 1981 113.0 1oJ.6 1 902 122.8 105.9 1 98.3 129.1 112.0 1984 131.0 118.1 1985 121.2 124.2 1 9M 136.2 128.2
P.rcmc A m 1 A'lwaw Orwch
...................................................................
1976-19M 5.21 2 .m
* P r o d u c t i v i t y d e f i n e d i n terms o f ou tpu t p e r p a y r o l l hour.
- Source: American T e x t i l e Manufacturers I n s t i t u t e , T e x t i l e H i L i t e s , March 1988.
Modern iza t ion
Desp i te a r i s e i n c a p i t a l expendi tures and increases i n p r o d u c t i v i t y and modern iza t ion r a t e s i n some t e x t i l e sec tors , t h e U.S. l a g s behind some o f i t s key compet i to rs i n t h e r a t e o f modern izat ion, as measured by t h e r a t i o o f d e l i v e r i e s o f
A-23

new equipment t o i n s t a l l e d capacity. U.S. companies w i t h those o f o ther major t e x t i l e producing countr ies.
Table A-16 compares modernization ra tes o f
Table A-16
(Percent) COMPARATIVE RATES OF MODERNIZATION I N SPINNING AND WEAVING, 1985*
cDurty Spiming yewing
ChiM 46.0 0.9 Hmg Kmg M.5 19.0 I t a l y 98.4 25.1 Japan 14.0 11.3 Korea 41.3 19.8 Taiuan 09.0 22.7 United Stater n.7 17.7
* "Comparative Rates" r e f l e c t t he r a t i o o f d e l i v e r i e s of new equipment t o i n s t a l l e d capaci ty a t t h e end o f 1985.
=e: U.S. I n te rna t i ona l Trade Administrat ion, U.S. Global Competitiveness, The U.S. T e x t i l e M i l l Industry, December 1987.
The r a t e o f modernization i n the United States has been adversely a f fec ted by i t s need t o r e l y on expensive fo re ign technology. Exchange r a t e f l uc tua t i ons account f o r t he h igh cos t o f imported fo re ign t e x t i l e machinery, as a devalued d o l l a r on t h e world market has caused the cost o f imported machinery t o increase. Yet, because
most o f t h e equipment i s manufactured abroad, t e x t i l e producers have l i t t l e choice bu t t o r e l y on imports t o replace o r upgrade equipment. Being able t o t e s t new
technologies from t h e i r home countr ies before worldwide marketing a lso gives t e x t i l e manufacturers i n technology-producing countr ies a compet i t ive edge over the U.S. As
shown i n Table A-17, t he import share o f t he U.S. t e x t i l e machinery i ndus t r y rose from 6.9 percent i n 1980 t o 57 percent i n 1986.
- ~
-
A-24

Table A-17
IMPORT SHARE OF TEXTILE MACHINERY MARKET (Percent)
- 1960 1970 - 1980 1984 g& 1986 Import Share 6.9 30.6 43.5 52.9 49.6 57.5
=e: U.S. International Trade Administration, U.S. Global Competitiveness, The U.S. Textile Mill Industry, December 1987.
Another factor for the low rate of modernization is the textile mill industry's conservatism, with many manufacturers regarding textile production as an art rather than a science. conservatism. The numerous small, independent, single producers are less likely t o adopt aggressive modernization programs unless their existence is threatened by integrated mills which no longer need their services. are run only by the largest companies. They are not yet an industry-wide phenomenon.
The fragmented nature of the industry also explains this
Currently, integrated mills
BUSINESS AND PRODUCT TRENDS
Textile mills are heavily dependent on technology to produce quality products. equipment for opening and picking can lead to better blends of fibers, new carding technology can lead to better integration of fibers, and new spinning technologies can result in better quality yarns. To date, textile mill producers who have invested in new equipment have reduced production costs and reaped other benefits including:
New
0 Reduced labor intensity
0
0 Faster drying/finishing times
0 Overall productivity increases.
High unit output at lower input cost
The U.S. textile industry as a whole will benefit as more domestic companies take advantage of technological advancements. manufacturing costs to be able to compete with each other and with foreign producers. New technologies which accelerate production, reduce waste, and cut
Textile producers want and need to reduce
A-25

costs can fill this need. better quality textile product. Newer fibers, improved fiber blends, and advanced and efficient sizing, spinning, weaving, and finishing technologies can be strategically combined to meet this need. further automate textile production. machinery can function effectively and efficiently if yarn quality and consistency can be assured. The need for and importance of cost-effective, fool-proof monitoring systems is high. The high cost of labor will continue to encourage textile producers to examine computerized methods for monitoring not only product quality but the flow of material through a mill. The large flow of material through a mill will also boost interest in robotics. The relatively high cost of labor in the U.S. means that strategies either to reduce the labor content or to improve labor productivity will have high payoffs.
Textile manufacturers also want and need to produce a
Finally, textile producers need to High-efficiency looms and other textile
A-26

Appendix 8
MANUFACTURING PROCESSES AND ENERGY USE


TABLE OF CONTENTS
Section
APPENDIX B
MANUFACTURING PROCESSES AND ENERGY USE
U n i t Processes i n Dry Processing U n i t Processes i n Wet Processing T e x t i l e Production Costs T e x t i l e Manufacturing Processes and Technologies Energy Consumption i n t h e T e x t i l e Industry E l e c t r i c i t y Use i n t h e T e x t i l e Industry Energy Consumption by S p e c i f i c Processes
6 - 1
6-8 6-12
6-14
6-17 6-19
6-25
6-30
B - i i i


Appendix E
MANUFACTURING PROCESSES AND ENERGY USE
Woven or Knitted Fabric
Formation
T e x t i l e manufacturing takes p lace i n t h a t p a r t of t h e t e x t i l e i n d u s t r i a l complex t h a t f a l l s under SIC 22 i n which yarns, f a b r i c , carpets, and rugs are formed, dyed, and f i n i s h e d . It invo lves the product ion o f f i n i s h e d t e x t i l e ma te r ia l from na tu ra l o r manmade f i b e r s . Typica l t e x t i l e manufacturing cons is ts o f f i v e bas ic processes: yarn formation, f a b r i c format ion, f l o o r coverings format ion, nonwoven f a b r i c format ion, and f i n i s h i n g . processing, d r y and wet. F igure E-1 demonstrates the r e l a t i o n s h i p among the processes and categor ies.
These processes can be categor ized i n t o two types o f
I
j
I
Formation ;
Floor Yarn Covering t, Formation --*
Dry Processing I (Greige Mills)
Finishing/ Dyeing
Figure E - I . Basic Processes i n T e x t i l e Manufacturing
E-1
Nonwoven I Fabric I
Formation I E I

These f i v e processes are expla ined below:
Yarn Formation: through var ious p i ck ing , combing, and t w i s t i n g processes. Yarn format ion equipment such as p ick ing , card, and combing machines gather f i b e r s loose ly i n t o a c o r d - l i k e form known as s l i v e r s . These s l i v e r s are passed through drawing frames t o increase alignment, then through a r o v i n g frame t o apply t w i s t . Basic u n i t operat ions performed i n t h i s process together w i t h t h e i r energy i npu ts and process outputs are presented i n F igure 8-2.
Fabr i c Formation: f a b r i c . A warping machine winds numerous separate s t rands o f yarn onto a beam. s o l u t i o n o f s ta rch , wax, o i l s , and water, t o coat and strengthen the yarn i n p repara t ion f o r f u r t h e r processing. The yarn i s then woven o r k n i t t e d i n t o grey, o r un f in ished, f a b r i c . Basic u n i t operat ions w i t h t h e i r energy i npu ts and process outputs are presented i n F igure 8-3.
F l o o r Coverings Formation: F loo r coverings are produced e i t h e r by weaving o r by t u f t i n g , a process where yarn i s attached t o the carpet backing d i r e c t l y . t h e i r energy inputs and process outputs a re presented i n F igure B-4.
Nonwoven Fabr i c Formation: are bound together us ing adhesive chemicals o r heat. ma in ly used i n t h e i n d u s t r i a l and home-furnishing sectors . bonding are p e c u l i a r operat ions t o t h i s unique process. performed i n t h i s process together w i t h t h e i r energy inputs and process ou tpu ts are presented i n F igure 6-5.
F in i sh ing : F in i sh ing processes vary w i t h the f a b r i c and product end-use; they i nc lude b leaching, mercer iz ing, dyeing, Sanfor iz ing , and heat s e t t i n g . These operat ions are designed t o impart q u a l i t i e s such as c o l o r fastness, fee l , and p r o t e c t i o n from shrinkage. process together w i t h t h e i r energy inputs and process outputs are presented i n F igure 8-6.
Natura l o r man-made f i b e r s o r blends are spun i n t o yarn
~
Fabr ic format ion invo lves t h e conversion o f yarn i n t o
A s lash ing machine t r e a t s the yarn w i t h a s i z e , which i s a ho t
U n i t operat ions together performed i n t h i s process together w i th
I n nonwoven f a b r i c format ion, yarns o r f i b e r s Nonwoven f a b r i c s are
U n i t operat ions Web forming and
U n i t operat ions performed i n t h i s
These f i v e bas ic processes i nvo l ve numerous and sometimes r e p e t i t i v e batch operat ions, which can be p laced i n t o two broad categor ies--dry and wet, depending on whether o r n o t a l i q u i d i s invo lved.
0 Dry processing: Dry processing o f t e n takes p lace i n g re ige m i l l s and inc ludes a l l t he t e x t i l e processing operat ions t h a t take p lace up t o the stage where t h e arn i s spun and the woven o r k n i t t e d grey f a b r i c i s formed (except slashingy, as shown i n F igure B-1. They inc lude opening, b lending, card ing, sp inn ing, weaving, and k n i t t i n g .
Wet Processing: Wet processing invo lves the m a j o r i t y o f processes t h a t dye o r f i n i s h the spun yarn o r wovenlkn i t g re ige f a b r i c o r f l o o r covering. A lso inc luded i n wet processing i s s lashing, which t.akes p lace p r i o r t o f a b r i c o r yarn dyeing and/or f i n i s h i n g bu t invo lves the app l i ca t i on o f l i q u i d chemicals t o the yarn. shows t h e processes invo lved i n g re ige and f i n i s h i n g m i l l s .
0
Some m i l l s are now in tegra ted . Table B - 1

ENERGY ENERGY USE INPUT (BTUILB.) PRDCESS STEP PROCESS WYPUT
FIBER
1,200 WENlHG WASTE FIBERS (W) BLENOING U P (P)
PICKING
FIBERS (W) WINDING SLIVER (P) CCWBING
163 ORAWING SLIVER (P)
E
E
MNMADE FIBER
E
I-* YARN (P) 10.000 I SPINNING
WINDING SWOLING YARN (P)
(50 E
TEXTURED YARN (P) 20.500
E
PROCESS WATER (W) YARN (P)
1,300 s . w
BLEACHIWG
TO MAVINGIKNITTING FLO(X( COVERINGS
FINISHED SPUN YARNS m
Figure 8-2. Yarn Formation: Process Flow, Energy Inputs, and Process Outputs
KEY
E ELECTRICITY G WATURAL E*$ 5 STEW w WASTE
=e: U.S. Department o f Energy, The U.S. Textile Industry: An Energy Perspective; American Consulting Engi-1, Industrial Market and Energy Management Guide - SIC 22, The Textile Mill PFoducts Industry, 1985.
B-3

ENERGY ENERGY USE INPUT ( B T U / L B . ) PROCESS STEP
YARN
PROCESS CUTPUT
Yarping Yarn (P) 850
E
Uoven Fabric (PI - Knitted Fabric (P) E
si ngei ne Fabric (P) 155
Heat Loss (U)
Fabric (P)
Heat LOSS (U) > Uater (Y)
1,200 Yashiw H.G
Fabric (P) Yater (U) Heat Loss CY)
scwring Uashing I 1.350
s,n - Grey Goods (P) Heat LOSS CY)
3.455 Drying s.0 -
I
Figure 6-3. Fabric Formation: Process Flow, Energy Inputs, and Process Outputs
GREY GQaS
KEY
E ELECTRICITY G NATURAL U S S S T E W H HOT YATER P PROCESS UJTPUT u WSTE P R m u c T s
m e : U . S . Department o f Energy, The U.S . Textile Industry: An Energy Perspective; American Consulting Engineers Council, Industrial Market and Energy Manaqement Guide - SIC 22, The Textile Mill Products Industry, 1985.
6-4

EYERGY ENERGY USE lNWT (BTUILB.) PROCESS STEP PROCESS M P U T
*.m (P) neat LO.. (W)
1.050 c.rpt (P) Rups (P)
~rosese water (w) C.rpt/Rup. (P)
39.000 8tWsq. Yd.
H l t LO.. CY) Wrinkle R-ing Wait. Flbrn CY) elndOc Trimming
Fluffing Finishd F h r C a r i m (P)
1,000 ~
4.000
r INlSHEO FLOOP CGVERIYOS
Figure 8-4. F loo r Coverings: Process Flow, Energy Inputs , and Process Outputs
KEY
E ELECTRICITY G NATURAL U S S S T E M H HOT WATER P PROCESS OUTPUT Y WASTE PRCOUCTS
=e: U.S. Department o f Energy, The U.S. T e x t i l e Indus t ry : An Enerqy Perspective; American Consul t ing Engineers Counci l , I n d u s t r i a l Market and Enerqy Management Guide - SIC 22, The T e x t i l e M i l l Products Industry, 1985.
8-5

ENERGY ENERGY USE INPUT (BTU/LB.) PROCESS STEP PROCESS WTPUl KEY
1,500 Uets (P) Waste F ibers (W)
2,000 - 4,550 Nomoven Fabric (P)
Web B o d i n g Waste F ibers CY)
E
G.E.f
Finished N m o v m Fabric (P) Heat Loss (W)
3,000 E.S
FlNlSHED NOWWENS
Figure B-5. Nonwovens: Process Flow, Energy Inputs , and Process Outputs
E ELECTRICITY G NATURAL GAS S STEAM
=e: U.S. Department o f Energy, The U.S. T e x t i l e Indus t ry : An Energy Perspective; American Consul t ing Engineers Counci l , I n d u s t r i a l Market and Energy Management Guide - S I C 22, The T e x t i l e M i l l Products Indus t r y , 1985.
B-6

ENERGY ENERGY USE INPUT (BTUILB.) PROCESS STEP
GREY tmOS
I
PROCESS CUTWT
10.700 water (Y) Dyeing Dyed Fabric (P)
E -3- Heat Loss ( P I
Dyed Fabric (PI Drying Heat LOSS ( P I
3,000 S,E,H -
I Printed Fabric (P) 9.570
E Pr in t ing
Dyed/Printed Fabric (P) Drying Heat LOSS (Yl
5,000 0.S.H -
DyedIPrinted Fabric (P) Curing Heat Loss (UI
Dyrd /P r in ted Fabric (P I Heat LOSS (Ul
530 - 3,000 Drying Finished Yoven/Knitted Fabric ( P I
S,G ----.--------, curing -------- - -> Heat LOSS CY)
FINISHED WVEW OR KNITTED FABRIC
Figure 6-6. Textile Finishing: Process Flow, Energy Inputs, and Process Outputs
KEY
E ELECTRICITY 0 NATURAL CAS s STEW H HOT WATER P PROCESS CUTPUT Y WASTE PROOUCTS
=e: U.S. Department o f Energy, The U.S. Textile 1ndustr.y: An Ener Perspective; American Consulting Engineers Council, IndustriapMarket and Energy Manaqement Guide - SIC 22, The Textile Mill Products Industry, 1985.
6-7

Table B-1
DRY AND WET PROCESSING MILLS CATEGORIES
Greige M i l l s (Dry Processing)
0 Yarn Formation
0 Tex tu r i z ing
0 Fabric Formation --Weaving - - K n i t t i n g --Nonwoven
( f l o o r coverings 0 T u f t i n g
F in i sh ing M i l l s (Wet Processing)
0 Yarn Dyeing
0 Fabric Dyeing --Woven Fabric - -Kn i t Fabric --Floor Coverings
0 P r i n t i n g
0 Fin ish ing --Drying --Heat Se t t i ng --Curing
U N I T PROCESSES I N DRY PROCESSING
Each o f t he f i v e basic processes involves a sequence o f numerous u n i t operations/processes. depending on the s p e c i f i c product l i n e and the desired end product, as described below.
Operations and t h e i r sequence are a l te red and modif ied
Yarn Formation
Yarns are formed by loose ly gather ing na tura l f i b e r s , manmade f i b e r s , o r a blend o f both i n t o a s t r i n g - l i k e form, drawing them out t o increase f i b e r alignment and f i n a l l y t w i s t i n g them t o increase strength. invo lve the f o l l o w i n g u n i t operations:
General ly, yarn formation processes
0 Opening, blending, and p i ck ing
0 Carding
0 Drawing
0 Lap Winding
B-a

0 Combing
0 Roving
0 Spinning
0 Textur iz ing.
Openinq, blendinq, and p ick ing . are beaten, cleaned, and formed i n t o a loose, uni form sheet i n a p icker . The f i b e r s then go through a cu rd muchine. and cy l i nde rs covered w i t h f i n e teeth. cy l i nde rs f o r f u r t h e r c leaning and alignment. form a rope - l i ke strand c a l l e d a sZiver. make them p a r a l l e l , and t o improve un i fo rmi ty . a t t h i s stage, as m u l t i p l e strands are combined i n t o a s ing le s l i v e r . stage, drawn s l i v e r s can go d i r e c t l y t o spinning.
Bales o f f i b e r are opened and blended, then they
This machine contains many long rectangular slabs The f i b e r s pass between the slabs and
They are passed through r o l l e r s t o S l i ve rs pass through the drawing frume t o
Some f i b e r blending may take place A t t h i s
Lap windinq and combing. These are opt ional and seldom-used processes. I n lap winding, cans o f s l i v e r s are passed from the drawing frame t o the r ibbon l a p machine, where they are doubled and redoubled t o enhance evenness, t o improve f i b e r para l le l i sm, and t o opt imize the blending. comber which uses a ser ies o f s tee l t ee th t o comb out shor t f i b e r s .
These r ibbon laps are then fed i n t o a
%. a ser ies o f r o l l e r s (usua l ly th ree) . compressed, reduced i n diameter, and given a s l i g h t t w i s t .
Roving imparts strength t o the f i b e r s by passing i nd i v idua l s l i v e r s between During t h i s operation the s l i v e r s are
Spinning. systems are ava i l ab le today: r i n g , open-end, and a i r j e t . Each draws the s l i v e r o r rov ing through a ser ies o f r o l l e r s a t varying speeds, t w i s t i n g i t between 10 and 30 tu rns per inch t o form a f i r m , s t rong yarn. bobbins i n readiness f o r t he next major process-- fabr ic formation. spinning e l im ina tes rov ing because the powerful open-end machines perform the rov ing and spinning funct ions simultaneously. A i r j e t spinning, p a r t i c u l a r l y su i tab le f o r man-made f i b e r s , does no t requ i re lapping, combing, or roving. Therefore, when these techno log ica l l y advanced yarn formation processes are used, t he number o f conventional u n i t operations i s s i g n i f i c a n t l y reduced. Open-end spinning also increases t h e product ion r a t e by about fou r o r f i v e times t h a t o f t r a d i t i o n a l r i n g spinning, processes lower grades o f co t ton w i th few breakages, and reduces the amount o f co t ton dust generated because the process i s enclosed.
The next operat ion i n yarn formation i s spinning. Three basic spinning
The spun yarn i s then wound onto Open-end
B-9

Textur iz ing. necessary on ly f o r manmade f i b e r s . t o syn the t i c spun yarns so t h a t they resemble na tura l spun yarns and ob ta in the add i t iona l des i rab le bulk. Tex tur iz ing includes to rs iona l , edge, and compressional crimping.
The f i n a l operation i n yarn formation i s t ex to r i z ing , which i s
This operation provides a t ex tu re and appearance
Fabric Formation
Fabric formation processes the spun yarns i n t o f a b r i c s e i t h e r through weaving o r k n i t t i n g . performed, warping and slashing (or s i z ing ) .
However, p r i o r t o weaving o r k n i t t i n g two preparatory operations m u s t be
Warping. (beam) t o form t h e l ong i tud ina l yarns i n a piece o f f ab r i c . through a reed t h a t separates the yarns t o ensure t h a t they stay p a r a l l e l dur ing weaving. t h a t can r e s u l t i n breakages. Therefore, a p ro tec t i ve coat ing i s appl ied t o the yarn by passing these beams through a s losh ing machine. consol idated i n t o the proper number o f warp yarns by the app l i ca t i on o f a s ize , normally s ta rch o r po lyv iny l -a lcoho l ( P V A ) . t o reduce breakage and damage dur ing weaving. pressurized cams f o r d ry ing and i s wound onto ho t warp beams.
A worping machine winds hundreds o f separate strands onto a l a rge spool
These yarns are guided
During weaving, warped yarns go through considerable f r i c t i o n and tension
I n sZoshing, the yarns are
The s i ze coats and strengthens the yarn The heated yarn passes over hot
Weaving. I n weoving, the f i l l i n g (cross-wise) yarn i s passed back and f o r t h between the warp according t o a pre-determined pattern. I n the past, s h u t t l e looms were the only type o f weaving loom avai lable. A harness would r a i s e and lower a l t e rna te warp yarns t o a l l ow a s h u t t l e conta in ing the f i l l i n g yarn t o pass through the opening. Now a v a r i e t y o f complex machinery can produce i n t r i c a t e f a b r i c patterns using up t o s i x d i f f e r e n t co lo rs f o r f i l l i n g and operating a t speeds o f up t o 600 f e e t per minute. The jacquard loom i s the most i n t r i c a t e because i t cont ro ls i nd i v idua l warp threads separately. The most advanced weaving machinery, however, i s t he shu t t l e less loom. These looms replace the s h u t t l e loom, which can be very
cumbersome and cause many breakages. When a shu t t l e less loom i s used, the f i l l i n g - i s inser ted through the warp threads by a i r , water, a rap ie r , o r a special metal p r o j e c t i 1 e.
Kn i t t i ng . K n i t t i n g i s the i n te r l oop ing o f one o r more yarns. As w i t h weaving, s ize must f i r s t be appl ied t o the yarn t o strengthen i t i n order t o increase the speed
B-10

and ease w i t h which yarn can be k n i t t e d . s t i t c h e s . depending on t h e way i n which the yarn i s looped through the adjacent rows. types o f k n i t t i n g are ava i lab le . a warp beam t o form f a b r i c . p rev ious l y formed loops t o form f a b r i c .
K n i t t i n g s t a r t s w i t h rows o f looped These rows are converted i n t o d i f f e r e n t types o f f a b r i c s t ruc tu res
Two Warp knitting feeds warp threads c o l l e c t i v e l y from
Circular knitting passes i n d i v i d u a l yarns through
Fabr ics formed w i t h weaving and k n i t t i n g operat ions a re then t r a n s f e r r e d t o the f i n i s h i n g s tep ( i n t h e case o f i n teg ra ted p lan ts ) o r they are shipped t o f i n i s h i n g m i l l s where they undergo a se t o f operat ions designed t o improve t h e i r q u a l i t y and appearance.
F loor Coverinss Formation
The major d i f f e rences between woven o r k n i t t e d f a b r i c format ion and the format ion o f f l o o r coverings a r i s e a f t e r t h e yarn i s spun.
Heat Set t ing . which i s s i m i l a r t o the same preparatory s tep i n f a b r i c f i n i s h i n g (discussed below).
The f i r s t opera t ion i n rug and carpet manufacture i s beat setting,
Tuf t ing . t he pr imary backing ma te r ia l , a mesh-like p iece o f syn the t i c f a b r i c (usua l l y woven polypropylene) which adds shape and body t o the carpet . a row o f needles supp l ied w i t h yarn passes the needles through t h e backing ma te r ia l . The yarns thus p laced i n t o t h e backing ma te r ia l are then looped a t t he o ther s ide o f t he backing ma te r ia l . The t u f t e d carpet i s then dyed, p r i n ted , and f i n i s h e d i n much the same way t h a t f a b r i c i s f in ished. Some op t iona l u n i t operat ions are c a r r i e d out a f t e r t h e carpe t i s f in ished. Secondary back ing may be added, usua l l y w i t h t h e he lp o f a t h i n l a y e r o f l a t e x , depending on t h e end use.
A f t e r beat setting comes tufting, i n which t h e carpet yarn i s attached t o
I n tufting, a bar ca r ry ing
They may i nc lude wrinkle removing and face beating.
A f t e r beat setting and tufting, a number o f mechanical operat ions such as fzuffing, steuming, and selvedge trimming are performed t o improve the appearance o f t he carpet.
B-11

Nonwoven Formation
Nonwoven f a b r i c s cons is t o f a sheet o r web o f f i b e r s which are mechanically, thermal ly (self-bonding), o r chemical ly bonded. processes i nvo l ve web formation and web bonding. goes through a dry ing step i d e n t i c a l t o drying processes i n woven f a b r i c .
The two major steps i n these A f t e r bonding, the f a b r i c usua l ly
Web Formation. Web formation takes place d i r e c t l y a f t e r t he f i b e r opening and blending operations. Patterns i n web formation can be p a r a l l e l , c ross- la id , o r random. used f o r c ross - la id patterns, and a i r streams deposi t ing f i b e r on a r o t a t i n g screen (a i r - la id - techn iques) are used f o r random patterns.
General ly, cards are used i n p a r a l l e l web patterns, m u l t i p l e lappers are
Web Bonding. Web bonding techniques general ly f a l l i n t o one o f three categories: mechanical, chemical, o r self-bonding. Mechanical web bonding i s accomplished by needle punching and uses no chemical addi t ives; however, t he product has less strength than a chemical ly bonded nonwoven. S t i t c h bonding i s another mechanical technique which y i e l d s a product most l i k e k n i t t e d fab r i cs . s p l i t up i n t o wet and dry chemical bonding. Chemical wet bonding uses adhesives. Chemical d ry bonding uses thermoplastic bonding and e l im ina tes a d ry ing step. bonding techniques genera l l y use e i t h e r a heat system, heat combined w i t h a pressure-based system, o r a solvent bonding system.
Chemical bonding can be
Se l f -
UNIT PROCESSES I N WET PROCESSING
Wet processing operations are c o l l e c t i v e l y known as f i n i s h i n g . m i l l s are known as wet processing m i l l s because they invo lve many l iquid-based operations. bleaching, mercerizing, dyeing, washing, p r i n t i n g , cur ing, heat se t t i ng , and
f i n i s h i n g .
Dyeing and f i n i s h i n g
The basic types o f operations i n any f i n i s h i n g process are scouring,
Many o f these u n i t processes are fo l lowed by a d ry ing step.
F in i sh ing - finishing transforms k n i t o r woven greige goods i n t o a f i n i shed f a b r i c , o r spun yarn
i n t o dyed yarn. desired. Finer fab r i cs
may go through numerous sequential operations. The f i n i s h i n g operations are ca r r i ed
out i n f i n i s h i n g m i l l s .
Process flows vary w i t h the type and q u a l i t y o f end product ~
As a r e s u l t , t he re are many d i f f e r e n t f i n i s h i n g operations.
6-12

Scourinq, Bleachinq, and Mercerizing. scoured, bleached, and/or mercerized. improve whiteness and absorbency. Mercer iz ing s lowly t r e a t s the yarn under tension w i th caus t ic soda t o improve strength, l u s t e r , and dyeab i l i t y .
P r i o r t o dyeing, t he greige f a b r i c must be Scouring and bleoching use enzyme baths which
These operations enhance subsequent dye f i x a t i o n .
Heat Set t ing , Singeing, and Sizinq. Optional f i n i s h i n g processes inc lude heat- s e t t i n g , t o preserve the dimensional s t a b i l i t y o f the f a b r i c so t h a t the numerous thermal processes t o f o l l o w do no t cause shrinkage. p ro t rud ing h a i r s on the surface, there fore s ingeing may be required. removes t h e chemicals appl ied dur ing slashing.
Some f a b r i c s may have a few Desiz ing
Dyeina. so lu t i on t o absorb a desired co lo r . sequences o f processes fol lowed bu t a lso i n the techniques applied. processes and washing may be continuous, semicontinuous, o r batch. take place i n atmospheric o r pressure- jet machines. continuous dye range using a pad/squeeze machine. moisture. reduct ion i n d ry ing time.
I n dyeing, the bleached f a b r i c o r yarn i s passed through a chemical Var iat ions a r i s e no t on ly i n the number and
Dyeing Batch dyeing can
Continuous dyeing i s done on a
Continuous dyeing permits dyes tu f f and hot water conservation as w e l l a5 Squeeze r o l l e r s squeeze out the
P r in t i ng . e i t h e r f l a t screen processes, continuous r o t a r y screen processes, o r r o l l e r p r i n t i n g . complete the process.
P r i n t i n g techniques are s i m i l a r t o those i n paper p r i n t i n g , and invo lve
The type o f p r i n t i n g agent used determines the energy requ i red t o
Drying and Curing. t h i s stage also, chemicals t h a t impart c e r t a i n desired q u a l i t i e s are added. These inc lude a n t i s t a t i c s , softeners, s t a i n protectors, and f i r e retardants. Mechanical f i n i s h i n g methods may a lso be applied. These methods improve f a b r i c hand ( f e e l ) or a l t e r the surface cha rac te r i s t i cs . For example, sonfor iz ing shr inks the f a b r i c , napping ra i ses h a i r y o r downy surfaces, and creosing adds f o l d s t o the f a b r i c
according t o a predetermined pattern.
F ina l f i n i s h i n g operations mainly invo lve drying and cur ing. A t
The f i n i s h i n g operations apply f o r woven fabr ics . operations are used i n k n i t t i n g , f l o o r covering, and nonwoven fab r i cs .
Var iat ions o f these f i n i s h i n g
B-13

TEXTILE PRODUCTION COSTS
Production cos ts i n t h e t e x t i l e indus t ry , as i n a l l o ther manufacturing sec tors , cons i s t o f l abo r , raw mate r ia l , energy, and o ther cos ts such as the cos t o f f i n a n c i a l and insurance serv ices , c a p i t a l charges, and non-production suppl ies. The aspects o f p roduc t ion cos ts t h a t are unique t o t h e t e x t i l e i ndus t r y r e l a t e t o the breakdown between these costs . ma te r ia l costs account f o r 40-70 percent o f t he average cos t per d o l l a r o f output ,
averaging about 60 percent, as shown i n Table 8-2.
Across a l l 3 - d i g i t t e x t i l e S I C ca tegor ies , r a w
Table 8-2
TEXTILE INDUSTRY AVERAGE COSTS PER DOLLAR OF OUTPUT BY COST CATEGORY AND 3-DIGIT S I C , 1985
221 222 223 224 225 226 227 228 229 22
Lator Costs 27.3 25.8 26.6 29.7 26.3 18.7 11.9 21.6 21.3 22.2 Material 57.7 58.7 56.8 39.5 51.8 62.3 69.0 65.3 58.3 59.6 E l e c t r i c i t y 3.9 3.5 1.9 2.1 1.4 1.7 0.7 3.8 2 .0 2.3 Fossil Fuel 1.3 0.9 1.7 0.9 1.2 3.4 1.2 0.7 1.2 1.3 Ocher 9.7 11.1 12.9 27.8 19.3 13.9 17.1 8.6 17.2 14.6 ........._......... ...... ...... ...... ...._. ...... ...... ....._ ...... .....- ..._--.- T o t a l 100.0 100.0 100.0 100.0 100.0 100.0 100.0 100.0 100.0 100.0
valve of Shipments 4,025 8.402 933 962 11,783 5,M)l 8,061 8,019 5.L91 53,276 (M i l l ion DoLlars)
- Source: U.S. Dept. o f Commerce, Bureau o f Census, Annual Survey o f Manufactures,
1985.
Raw mate r ia l s cons is t most ly o f f i b e r o r yarn s tap le . I n f i n i s h i n g p lan ts , chemical dyes are a l so a major raw mate r ia l . sec tor whose raw mate r ia l s cos t captures t h e l a r g e s t share (69 percent) o f a d o l l a r o f output. i ndus t r y , bu t i s as h igh as 29.7 percent i n narrow f a b r i c m i l l s (where considerable
The f l o o r coverings i ndus t r y i s the t e x t i l e
Labor cos ts average about 22 percent per d o l l a r o f output i n the t e x t i l e
B-14

detailed work is required to produce specialty items such as laces, beltings, ribbons, and bindings) and as low as 11.9 percent in SIC 227. Fossil energy cost averages about 1.3 percent but, as is to be expected, is higher in the textile finishing sector (SIC 226) than in the others. most electricity intensive. In these mills (SICS 221, 222, and 228) electricity costs are 3.9 percent, 3.5 percent, and 3.8 percent, respectively. Electricity costs per dollar of output in the textile industry as a whole averages about 2.3 percent.
Spinning and weaving mills are the
Textile mill competitive strategies now rely heavily on the reduction of production costs. The ability to control each cost element is crucial to cost reduction efforts. labor costs. Production labor costs are about 14 cents per dollar of textile industry output, exceeding the non-production labor costs by about 10 cents per dollar of output. The textile industry sectors with the highest production costs per dollar of output are the cotton weaving (SIC 221) and narrow woven fabric (SIC 224) industries. This labor intensity is due mainly to the extensive fiber preparation work required prior to weaving. $1,000 of output in these two industries, compared with the average of 20.7 hours for the textile industry as a whole. reduce the labor intensity and to automate some of the fiber opening room processes so vital to ensuring fiber and product quality.
The textile industry tries hard to reduce both its labor intensity and its Table B-3 shows the high labor content of textile production.
Table B-3 shows that production workers put in 27 and 28 hours per
Tables 8-2 and 8-3 highlight the need to
B-15

Table E-3
TEXTILE INDUSTRY U N I T LABOR COST BY TYPE, 1985
SIC 221 222 223 224 225 226 227 228 22? 22
Employees Per M i l l i o n Do l la rs Outpt Production Nom-Production Total
Labor Costs Per I O u t p t Payro l l
Production Non-Production
r a t a t social Securi ty b Payro l l Taxes Benef i ts
r o t a l Labor Costs
Production Labor HoursllOOO I Output CosttHWr COStlS cutpt
13.9 1.5
15.4
19.7 3.3
23.0 2.2 2.2
27.3
27.0 8.7s 23.6
11.9 12.0 15.0 1.8 2.0 2.6
13.7 14.0 17.6
17.3 16.6 18.0 4.5 5.3 7.1
21.8 21.9 25.2 2.1 2.4 2.5 1.9 2.4 2.0
25.8 26.6 29.7
23.5 24.5 28.3 8.80 8.35 7.58 20.7 20.4 21.4
14.0 2.3
16.4
16.6 5.7
22.3 2.1 1.8
26.3
26.6 7.41 19.7
7.7 4.7 11.7 1.7 1.3 1.3 9.3 6.0 13.0
11.6 6.9 15.1 4.2 3.3 3.2
15.8 10.3 18.3 1.5 0.9 1.7 1.4 0.8 1.6
18.7 11.9 21.6
15.6 9.7 22.6 8.89 0.33 7.92 13.8 8.1 17.9
7.9 10.6 1.9 1.7 9.9 12.4
12.0 14.3 5.4 4.4
17.3 18.7 1.7 1.8 2.3 1.7
21.3 22.2
15.5 20.7 9.58 8.25 14.9 17.1
Source: U.S. Dept. o f Commerce, Bureau o f Census, Annual Survey o f Manufactures, 1985.
-

O f a l l cost items i n t e x t i l e production, e l e c t r i c i t y costs are o f t e n perceived as the l eas t con t ro l l ab le . Raw mater ia l costs can be con t ro l l ed by the se lec t i on o f r e l i a b l e supp l ie rs and good q u a l i t y f i be rs . other t e x t i l e product ion e f f i c i e n c i e s . by ca re fu l planning, such as spot market purchases and cost. con t ras t , are se t by the u t i l i t y and.customers cannot switch between u t i l i t i e s . addi t ion, s ince e l e c t r i c i t y costs account f o r a l a rge po r t i on o f the average t e x t i l e m i l l ' s energy costs (general ly over 60 percent), t e x t i l e m i l l s have incent ives t o improve the e f f i c i e n c y o f e lectr ic-based processes and technologies.
Poor q u a l i t y f i b e r s reduce weaving and Foss i l energy costs can a lso be con t ro l l ed
E l e c t r i c ra tes , by I n
TEXTILE MANUFACTURING PROCESSES AND TECHNOLOGIES
Basic t e x t i l e manufacturing methods have been used f o r decades. use t he same basic process t o convert f i b e r s t o yarn, weave o r k n i t t he yarn i n t o fab r i c , and f i n i s h these f a b r i c s i n preparat ion f o r market. However, recent challenges posed by fo re ign manufacturers coupled w i t h the a v a i l a b i l i t y o f s ta te - o f - the -a r t equipment have l e d an increasing number o f t e x t i l e manufacturers t o adopt new technologies. General ly, i n i t s modernization move, the t e x t i l e indus t ry i s
r e l y i n g on equipment manufacturers f o r technological advances, wh i le p lay ing a passive r o l e i n product ion-or iented research and development.
T e x t i l e m i l l s s t i l l
Many technologies have demonstrated t h e i r techn ica l f l e x i b i l i t y i n actual m i l l environments, such as commercial o r la rge p i l o t p lants. which we de f ine as "s ta te -o f - the -a r t " technologies and processes, reduce the number o f process steps, promote energy and resource conservation, and improve the ove ra l l e f f i c i e n c y o f t h e product ion process. however, i s t o improve product q u a l i t y and accelerate the manufacturing process i n both d r y and wet processing.
These new technologies,
An ove r r i d ing goal o f these technologies,
Dry Processinq
I n d ry processes the new technologies are d i rec ted toward product q u a l i t y improvement and the reduct ion o f production time. l i m i t e d and have usua l l y concentrated on improving the design and s i z i n g o f e l e c t r i c motors, u t i l i z i n g va r iab le speed c o n t r o l l e r s and adjustable speed dr ives , and reducing heat ing and a i r cond i t ion ing loads. Table 8-4 presents a summary o f s ta te - o f - the -a r t technologies app l i cab le t o the dry processing u n i t operations described e a r l i e r , t h e i r energy sources, and t h e i r p o t e n t i a l impacts on energy consumption.
Energy conservation e f f o r t s are
6-17

The assessment o f t h e i r impact on energy consumption i s performed from t h e perspec t ive o f t h e i r p o t e n t i a l f o r energy savings, s ince improving energy e f f i c i e n c y i s a major concern i n a l l manufacturing now.
Table 8-4
STATE-OF-THE-ART TEXTILE MANUFACTURING TECHNOLOGIES--DRY PROCESSING
OPERATION TECHNOLOGY
General New i n s t a l t a t ion of high-ef f i c i ency
Inproving pauer factor U t i l i z i n g var iable speed controls Synthetic lubricants I ~ ~ ~ ~ s ~ automation comprter m n i t o r i n g
mDt0rs
Spinning Opn.erd rp inn ig A i w j e t spinning
Texturizing A i r - tex tu r i z ing
Slashing
warping
Ueaving
Kn i t t i ng
Tuft ing
High pressure squeeze Size recovery Foam slashing solvent slashing
cmbina warping and slashing i n t o one operation
Rapier A i r - j e t ua te r - j a r P r o j e c t i l e
m e m a t i c k n i t t i n g ui thout needles
Comprterized Yarn Placement (CYP) loam using a hollow needle concept
KEY
E = ELECTRICITY G = GIs
._..
E Moderate
E Lou E Moderate E Low E Lou E Lou
E Moderate E LOW
E Low
E E E
G.E
G,E
E E E E
E
E
LOU
LOU
High High
LOU
Moderate LOU High Moderate
LOU
LOW
KEY
LOW : below 25% savings noderate: 25.50% savings High : above 50% wvings
.._.
"Savings" refers to the decrease in energy use asbociateu with substituting [he new technology or manufacturing approach for the competing conventional technology or approach.
m e : U.S. Department o f Energy, The U.S. T e x t i l e Industry: An Enerqy Perspective, March 1985; and Resource Dynamics Corporation.
8-18

Wet Processing
Wet processes i nvo l ve l a rge amounts o f thermal energy (usua l ly supplied by f o s s i l fue ls ) consumed mainly i n d ry ing operations. Thermal energy losses are very common i n wet processing, which i s very energy intensive. S ta te -o f - the-ar t technologies developed f o r these processes o f ten invo lve the reduc t ion o f energy consumption and the replacement o f fossil-energy-based technologies w i t h electr ic-based technologies (electrotechnologies). Table E-5 presents a summary o f the s ta te -o f - the-ar t technologies, t h e i r energy sources, and t h e i r impacts on energy consumption.
Advanced Technoloqies
I n add i t i on t o t h e establ ished s ta te -o f - the -a r t technologies app l i cab le t o both dry and wet processing, some promising advanced technologies (used i n other i ndus t r i es ) are a t o r near the commercial izat ion stage i n the manufacture o f t e x t i l e s . are being developed s p e c i f i c a l l y f o r t e x t i l e manufacturing i n lab se t t i ngs and research centers around the country. t o design an i n teg ra ted system where the f a b r i c i s d r i e d on ly once, r a t h e r than the three t o f o u r times c u r r e n t l y used. This w i l l r e s u l t i n subs tan t ia l energy, space, and mater ia l savings. Table E-6 presents a summary o f these advanced technologies, t h e i r energy sources, and t h e i r po ten t i a l impacts on energy consumption.
Others
An example o f these technologies i s t he e f f o r t
ENERGY CONSUMPTION I N THE TEXTILE INDUSTRY
The t e x t i l e i ndus t r y consumed 286.1 t r i l l i o n Btu o f energy i n 1985, making i t the eleventh l a rges t i n d u s t r i a l energy consumer i n the U.S. This f i g u r e represents a s l i g h t dec l i ne over the 1980 consumption l e v e l o f 295 t r i l l i o n E t u , mainly as a
r e s u l t o f energy conservation measures adopted by the indus t ry dur ing the e a r l y
1980s. t he 4.3 percent (from 207 t r i l l i o n Btu i n 1980 t o 198 t r i l l i o n Btu i n 1985) dec l ine i n consumption o f purchased fue ls . dec l ine i n e l e c t r i c i t y consumption.
As shown i n Table E-7, t h i s reduct ion i n consumption i s mainly a t t r i b u t e d t o
T h i s i s compared w i t h a less than one percent
Energy i n t e n s i t y i n the t e x t i l e indus t ry , as measured by the r a t i o o f energy costs t o value o f shipments o r value added, i s r e l a t i v e l y high when compared w i t h the average f o r a l l manufacturing. Table E-8 compares energy i n t e n s i t y i n the t e x t i l e
B-19

Table 6-5
STATE-OF-THE-ART TEXTILE MANUFACTURING TECHNOLOGIES--WET PROCESSING
- Source:
I nigh t Wish E "ish
L a : tela zsz .."ins* m&r.te: zs.m w i n o s n i b : .bonsm-iwi
"Savings" refers to the decrease in ewrgy US. aaaociatd with substituting the new technolow or manufacturing approach for the c-tinq conventional technology or approach.
U.S. Department o f Energy, The U.S. T e x t i l e Indus t r y : An Energy Perspect ive, March 1985; and Resource Dynamics Corporat ion.
6-20

Table 6-6
ADVANCED TEXTILE MANUFACTURING TECHNOLOGIES
OIERAIIDY IECWYOLDGT ENERGY I*PLcI 01 C N U C I f M c E my-1101
YE? PROCESSIWO
.... E * LLEClRICiTI e = us
G.E Hlgh G nigh
6.E l!zdor.t.
c wnt. 1106.1.t.
E n f s h
L Mder.1.
E Md.r.te
E H l g h E nigh E nigh e E High
E Wlgh E n l g h
LOU
E LW C.E Hlgh
El
Lw : k l w ZSX ~ ~ 1 4 . *odK.t,: 2 5 - M I 3.”iW. M I * : , w e sox wiw.
....
~swings” refer^ to tbc decreecc in energy uae MSociAtd with aubatituting the new technolopy or unufacturing approach for the ccarmtina conventional technoligy oi Approach.
=e: U.S. Department o f Energy, The U.S. T e x t i l e Industry: An Energy Perspective, March 1985; and Resource Dynamics Corporation.
8-21

Table B-7
TOTAL ENERGY CONSUMPTION I N THE TEXTILE INDUSTRY
1 9 8 0 2 6 , 1 2 3 8 9 . 1 2 0 7 . 1 9 4 . 9 1 1 2 . 2 2 9 4 . 9 1 9 8 1 2 5 , 9 2 1 8 8 . 4 2 0 5 . 0 9 5 . 4 1 0 9 . 6 2 9 2 . 3 1982 2 4 ~ 240 8 2 . 7 1 7 9 . 1 8 2 . 2 9 7 . 5 2 6 2 . 4 1983 2 6 , 7 8 6 9 1 . 4 1 9 7 . 2 8 0 . 4 1 1 6 . 8 2 8 8 . 6 1 9 8 4 2 7 , 0 3 9 9 2 . 3 1 9 0 . 9 8 0 . 4 1 1 0 . 5 2 8 3 . 2 1 9 8 5 2 5 , 8 8 7 8 8 . 3 1 9 7 . 8 6 7 . 7 130.1 2 8 6 . 1
- Source: U.S. Dept. o f Commerce, Bureau o f Census, Annual Survey o f Manufactures;
American Gas Associat ion, Future Gas Consumption i n the Un i ted States, var ious volumes; Resource Dynamics Corporat ion estimates.
Table 8-8
1985 TEXTILE INDUSTRY ENERGY COSTS AND ENERGY INTENSITY
Total E n e r w E l e c t r i c i t y __________________.__________________ .._---___________.___._......-------- ro ta1 c a t s Costs Per Total costs costs Per Cost Per Value D o l l a r of Cost Per vaLw D o l l a r of
Sector ($Mils> O f Shipments Value A&ed ($Mils) Of Shipnents Value Added
T e x t i l e
_______.__._..__..__--.------------...---------------------.--..-------------------.---- Industry 1,925 3.6% 9.3% 1,214 2.3% 5.9%
Process Indust r ies 29,061 3.4% 10.0% 13,176 1.6% 4.6%
A l l Manufacturing 59,M7 2.6% 6.0% 31,595 1.1% 3.2%
- Source: U.S. Department o f Commerce, Bureau o f t h e Census, Annual Survey o f
Manufactures, 1985.
8-22

i ndus t r y t o t h e energy i n t e n s i t y i n the process and a l l manufacturing i ndus t r i es . The t a b l e shows t h a t a t 9.3 percent, 1985 energy costs pe r d o l l a r o f value added i s higher than t h e na t i ona l average o f 6 percent f o r a l l manufacturing b u t s l i g h t l y lower than t h e average f o r the process i ndus t r i es (10 percent).
I n 1985, t h e cos t o f e l e c t r i c i t y i n the t e x t i l e i ndus t r y was 5.9 percent o f t h e i n d u s t r y ' s value added by manufacture, almost tw ice t h e na t iona l average o f t h e manufacturing sector. E l e c t r i c i t y i n t e n s i t y i s higher than t h e average f o r t h e process i ndus t r i es , perhaps a r e f l e c t i o n o f the t e x t i l e i n d u s t r y ' s lower r e l i a n c e on self-generated e l e c t r i c i t y t h a t i s so common t o process i ndus t r i es l i k e t h e petroleum, pu lp and paper, and chemical indus t r ies . The i n t e n s i t y a lso demonstrates the importance o f e l e c t r i c i t y i n most t e x t i l e manufacturing processes.
When examining t h e t rend i n t o t a l energy i n t e n s i t y ( f o r both purchased fue l s and e l e c t r i c i t y ) between 1980 and 1985, it can be seen from Table E-9 t h a t t o t a l energy i n t e n s i t y increased from 3.2 percent o f value o f shipments i n 1980 t o 3.6 percent i n 1985. This change i n t o t a l energy i n t e n s i t y i s a t t r i b u t e d d i r e c t l y t o the almost 30 percent r i s e i n t h e e l e c t r i c i t y i n t e n s i t y compared w i t h the 7 percent dec l i ne i n f o s s i l energy i n t e n s i t y . a t a much f a s t e r r a t e (45 percent) than the cos t o f purchased f u e l s (10 percent) . This f u r t h e r exp la ins the dec is ive impact o f e l e c t r i c i t y i n t e n s i t y on t o t a l energy i n t e n s i t y .
During t h e same per iod, t h e cos t o f e l e c t r i c i t y increased
Despite the increase i n energy i n t e n s i t y , energy p r o d u c t i v i t y t rends improved between 1975 and 1985 (as shown i n Table E-10). consumption per pound o f f i b e r went from 29,930 Etu t o 25,739 Etu. i nd i ca tes t h a t widespread energy conservation e f f o r t s i n t h i s i ndus t r y are achieving t h e i r goal o f processing more f i b e r w i t h reduced energy input .
I n t h a t ten-year per iod, energy This t rend
6-23

Table 6-9
ENERGY INTENSITY I N THE TEXTILE INDUSTRY
1980 1985
Cost Cost/$ ship. Cost/$ val. Cost Costlt ship. Costlt val . Energy Source (nil. 5) ( X I .dded (74 (nil. f ) ( X ) d e d (7.)
Electr ica l 840.2 1.8 4.4 1,214.2 2.3 5.9
Purchased Fuels 647.5 1.4 3.4 710.6 1.3 3.4
Total 1.487.7 3.2 7.8 1.924.8 3.6 9.3
- Source: U.S. Dept. o f Commerce, Bureau o f the Census, Annual Survey o f
Manufactures, 1980 and 1985.
Table 6-10
ENERGY PRODUCTIVITY TRENDS I N TEXTILE INDUSTRY
Total M i l l Energy Energy Fiber Use Per Used Consumption l b of Fiber
Year ( T r i l . Btu) ( M i l . l b s . ) ( B t 4 _ _ _ - _ _ - - - _ _ - _ _ _ _ _ _ _ _ _ _ _ _ _ _ _ _ _ _ _ _ _ _ _ _ _ _ _ _ - - - - - - - - - - - - - - - - - - - - - - - 1975 307.1 10,260.6 29.930 1976 328.6 11.189.9 29,366 1977 339.2 11,s 15.2 29 I 457 1978 326.6 11,650.8 28,032 1979 314.9 11,891.1 26,482 1980 294.9 11,223.3 26,276 1982 262.4 9,378.8 27,978 1983 288.6 11,122.4 25,948 1984 283.2 10.824.3 26,163 1985 286.1 11.115.5 25,739
=e: U.S. Department o f Commerce, Bureau o f the Census, Annual Survey o f Manufactures; American T e x t i l e Manufacturers I n s t i t u t e , T e x t i l e H i L i t e s , March 1988.
6-24

ELECTRICITY USE I N THE TEXTILE INDUSTRY
E l e c t r i c i t y consumption represents about 31 percent o f t he i ndus t r y ' s t o t a l energy use, making e l e c t r i c i t y t he l a rges t energy supply source i n t h i s indus t ry (Figure B-
7).
The t e x t i l e indus t ry consumed about 28.5 b i l l i o n kWh i n 1987. o f the e l e c t r i c i t y consumed was purchased. Only a small share o f e l e c t r i c i t y was self-generated. Cogeneration i s a techn ica l l y v iab le op t ion f o r meeting some o f the i n d u s t r y ' s e l e c t r i c needs, due t o the l a rge amounts of process steam requ i red f o r d ry ing and f i n i s h i n g , the existence o f waste products ( f i b e r s t h a t can be inc inera ted) , and the presence o f waste heat. However, many t e x t i l e p lan ts are small establishments which may not be able t o a f f o r d the c a p i t a l investment required t o cogenerdte. i ndus t r y between 1980 and 1987. consumption increased about 9 percent between 1980 and 1987. Manmade f i b e r weaving ( S I C 222) and yarn and thread m i l l s (SIC 228) are the l a rges t e l e c t r i c i t y consumers i n the t e x t i l e industry. The combined e l e c t r i c i t y consumption f o r the two indus t r i es amounted t o 14.8 b i l l i o n kWh i n 1987, o r 52 percent o f t he t o t a l e l e c t r i c i t y use i n the t e x t i l e indus t ry . u t i l i t i e s f o r t he promotion o f e lectrotechnologies t h a t improve e f f i c i e n c y ' because
they stand t o ga in the most from e f f i c i e n t use o f e l e c t r i c i t y .
More than 98 percent
Table B-11 shows e l e c t r i c i t y consumption patterns i n the t e x t i l e Both self-generated and purchased e l e c t r i c i t y
These two indus t r i es should be targeted by
End-Uses o f E l e c t r i c i t y
The main end uses o f e l e c t r i c i t y i n the t e x t i l e m i l l i ndus t ry are motor d r ive , l i g h t i n g , and process heat. percent o f t he e l e c t r i c i t y consumed i n the t e x t i l e m i l l industry. next l a r g e s t e l e c t r i c i t y consumer, w i th process heat ing app l ica t ions representing
on ly about 2 percent.
As shown i n Figure 8-8, motor d r i v e accounts f o r 83 L igh t i ng i s the
Motor d r i v e e l e c t r i c i t y use i s broken down i n t o mater ia ls processing (45 percent) , mater ia ls handling (35 percent), and pumps, fans, and compressors (about 20 percent). MuteriuZs-processing equipment performs the separating, combing, and other materials-processing steps t h a t are c a r r i e d out dur ing spinning and weaving. Opening and card machinery, which use t h e i r s tee l f ingers f o r p lucking and combing, and spinning machinery, which t w i s t s and separates f i b e r s , are materials-processing
equipment.
8-25

Coal 10%
- Source:
Figure 6-7. 1985 T e x t i l e Energy Use (286.1 T r i l l i o n Btu)
U.S. Deoartment o f Commerce. Bureau o f t he Census. 1985 Annual Survev o f Manufactures; American Gas Associat ion, Future Ga; Consumption i n the United States, Vol. 13, 1986; U.S. Department o f Energy, Energy Informat ion Administrat ion, Manufacture Energy Consumption Survey: Consumption o f Energy, 1985, November, 1988; and Resource Dynamics Corporation estimates.
Table 6-11
ELECTRICITY CONSUMPTION I N THE TEXTILE INDUSTRY ( M i l l i o n kWh)
SIC ln&strY .............................. 221 cotton uc.vir4 222 Mamde r i h r Ycavinp 223 Yo01 UeavinglFlnirhln 224 Y ~ W W h b d c Niilr 225 Knltting M i l k 226 Textile Finishing 227 Floor Covering Mills 228 Yam C Thread Mil ls 229 Wise. lextile
1 980 1981 1982 ............................... 4.758 c.470 3,515 6.4% 6.671 6.41111 323 339 298 460 b54 317
3.326 3.138 2,918 1.5M 1.649 1.891
6.275 6.258 5.977 1,898 1,953 1,847
1.005 1.010 989
1983
3,796
298 265
3,356 2,167
9 s 6.800 2.012
.......... r.wr
1984 .......... 3.609 7.127 336 329
3.156 2.055 1.164 7.140 2,123
1985 .......... 3,507 6.791
514 341
3,055 1.975 1.091 6,619 2.w
19% 1-7 ................. 3.bb7 3.794
347 561
6.904 7.23L 350 564
3.190 3.350 2.076 2,201 1.200 1.319 7.156 7.596 2.165 2.295 .......................................................................................................
TOTAL 26.123 25.922 24.240 26.m 27.039 25.11117 27.034 28.562 SELF.GEWERATE0 ELECTR 392 542 553 383 W 9 562 406 b28 PURCHASED ELECTRICITY 25,751 25,580 23.887 26.603 26.600 25.525 26.628 28.134
Source: U.S. Dept. o f Commerce, Ann , various issues; serve S t a t i s t i c a l Board o f Governors o f the F
Releases, 1986 and 1987; Resource Dynamics Corporation estimates.
6-26

Total Electricity Use 1985 - 25.9 Billion kwh
......................
2%
Electric Motor D r l w Apdbationt 1985 - 11.3 BlPbn kWh Electrle Process Heat Applcatlonr
IS86 - .6 Blllon LWh
Figure E-8. 1985 Textile Industry Electricity End Uses (25.9 Billion kWh)
8-27

Muteriols-hundling a c t i v i t i e s take place throughout t e x t i l e manufacturing, s t a r t i n g from the r o t a t i n g f iber-opening machinery t o f i n i s h i n g , where f a b r i c i s p r i n t e d o r heat set using r o l l e r s and r o l l i n g frames. dur ing f a b r i c formation where bales o f f i b e r are moved through the m i l l .
Mater ia ls handling a l so takes place
Pumps, funs, and compressors account f o r a la rge po r t i on o f t he e l e c t r i c i t y used i n HVAC systems. e l e c t r i c i t y , most ly t o power small motors scattered through the m i l l . Pumps are used f o r f l u i d processing i n dyeing t o pump dyes, r i n s e water, and other l i q u i d s i n t o and out o f dye becks. and f i n i s h i n g and f o r blowers i n opening and blending machines.
About 20 percent o f t he energy used i n f i n i s h i n g m i l l s i s
Fans are a lso used i n convection ovens used f o r dry ing
About 640 m i l l i o n kWh was used i n t e x t i l e process heat app l i ca t ions i n 1985. 67 percent o f e l e c t r i c i t y used i n process heat ing app l ica t ions i s used f o r dry ing operations and t h e remainder i s used i n cur ing operations.
About
E l e c t r i c i t y Consumption by Region
The m a j o r i t y o f t e x t i l e m i l l s are concentrated i n a few regions i n the U.S. Figure 6-9 shows e l e c t r i c i t y consumption by region i n the t e x t i l e indus t ry compared t o a l l
other manufacturing indus t r ies . The Southeast region ranks the highest i n t e x t i l e
e l e c t r i c i t y consumption. The 1985, e l e c t r i c i t y consumption i n t h i s region amounted t o 21.6 b i l l i o n kWh, represent ing about 84 percent o f the t o t a l energy consumed by the t e x t i l e i ndus t r y i n the e n t i r e U.S. T e x t i l e manufacturers i n South Carol ina and North Carol ina consumed over 12 b i l l i o n kWh o f e l e c t r i c i t y . Alabama, Tennessee, and V i r g i n i a a l so consume la rge amounts o f e l e c t r i c i t y . m i l l s i n High Point, North Carolina; Greenv i l le and Spartanburg, South Carolina; and Fo r t Payne, Alabama account, i n pa r t , f o r these regional trends. As a r e s u l t , the
t e x t i l e loads o f u t i l i t i e s serving these regions are high. e l e c t r i c i t y use represents about 4 percent o f t he t o t a l manufacturing sec tor ' s
e l e c t r i c i t y consumption, i t i s 18 percent o f the manufacturing e l e c t r i c i t y load i n the Southeast and over 25 percent o f t he manufacturing load i n the th ree la rges t producing s ta tes as shown i n Table 6-12.
High concentrat ions o f t e x t i l e
While t e x t i l e
6-28

Billion kWh 160 1 I
1 4 0
120
100
80
60
4 0
20
n " S. E. E.S.Cent.Mld Atl. New Eng.E.N.CentW.S.Cent. Paclflc W.N.Cent. Mount.
Region
Other Mfrg. Textlles
F igure 8-9. 1985 Manufacturing E l e c t r i c i t y Use By Region
Table 8-12
1985 TEXTILE INDUSTRY ELECTRICITY USE I N THE SOUTHEAST
Total T e x t i l e Indu+trisl T e x t i l e Elec. Use T e x t i l e El=. Use Elec. Use Percentage Shi-ts
S t a t e ( M i l . kUh) ( M i l . kUh) Of Total ( M i l l i o n f)
South Carol ina 20.994 6,037 29 7.776 North Carol ine 25,795 b,877 27 14,113 Georgia 17,630 4,902 28 10,997 Alabama 18,642 1,912 10 2,560 V i r g i n i a 11 .am 95c 8 2,956 Tennessee 25,568 934 4 1.476 -.__-.-_.___ _ _ _ _ _ _ _ _ _ _ - - -___ -_._._-.__ Total S.E. 120,433 21,617 18 39.874 Tota l U.S. 728.004 25,887 4 53,277
S.E. X of Total U.S. 16.5 85.5 74.8 -_-_-- -__-_. ._- - - -__~~~.~- . - .~~~.~~.~~~.~.~~. .~.~~~~. .~
=e: U.S. Dept. o f Commerce, Annual Survey o f Manufactures, 1985; Resource Dynamics Corporat ion estimates.
8-29

ENERGY CONSUMPTION BY S P E C I F I C PROCESSES
The importance o f energy i n t h e t e x t i l e m i l l depends on t h e type o f processing t h a t i s done a t t h e m i l l - - w e t o r dry . i n t e n s i v e w h i l e wet processes are f o s s i l energy in tens ive .
I n general, d r y processes are e l e c t r i c i t y
Dry Processing
The sp inn ing, t w i s t i n g , and weaving processes performed i n these m i l l s r e q u i r e considerable amounts o f motive power. Except f o r s lashing, a l l operat ions performed i n t h e d r y processing m i l l use e l e c t r i c i t y as t he pr imary energy source. Steam used i n t h e s lash ing opera t ion i s usua l l y generated by b o i l e r s burn ing n a t u r a l gas, coa l , f u e l o i l , o r o the r petroleum products. E l e c t r i c i t y suppl ies about 80 percent o f t he t o t a l energy requirements i n g re ige m i l l (dry m i l l s ) . There are few oppor tun i t i es f o r f u r t h e r e l e c t r i c i t y penet ra t ion i n dry processing. Most o f t h e increases w i l l come from automation programs. As more companies automate t h e i r p lan ts and i n s t a l l computerized systems f o r process c o n t r o l , t h e i r r e l i a n c e on un in te r rup ted e l e c t r i c
power w i l l increase, bu t on l y s l i g h t l y . Among the new technology developments t h a t might increase e l e c t r i c i t y consumed t o d r i v e motors are mechanical moisture-removal devices such as vacuum ex t rac to rs and r o l l e r squeezers. g re ige m i l l s t o improve s lash ing operat ions and could be a t t r a c t i v e because o f t h e i r p o t e n t i a l energy savings.
These might be used i n
Table B-13 shows energy inputs , average energy consumption, and outputs f o r each
opera t ion i n t h e d r y processing m i l l . spinning, and weaving are the processes t h a t requ i re the l a rges t amounts o f e l e c t r i c i t y t o process a pound o f f i b e r .
As can be seen from t h i s t a b l e , t e x t u r i z i n g ,
Table B-14 presents energy consumption f i gu res f o r u n i t operat ions i n t e x t i l e m i l l s . Spinning operat ions i n the manmade f i b e r weaving ( S I C 222) and yarn and th read m i l l s ( S I C 228) sec tors consumed a t o t a l o f 3,879 m i l l i o n kWh--70 percent o f a l l
e l e c t r i c i t y used i n sp inn ing i n t h e e n t i r e indus t ry .
B-30

Table E-13
ENERGY CONSUMPTION I N DRY PROCESSING MILLS
ENERGY INPUTS OPERATIOU AVG. ENERGY CONSfflPTlON CUTWTS
E
E
E
E
E
E
E
S. E
E
E
KEY:
Y a m preparation
Carding
R o v i n g
Spinning
Textur iz ing tsynthhet ic yarns only1
Yarping
Slashing
Weaving
MI
K n i t t i n g
Inputs: E . e l e c t r i c i t y s - St."
1,200 BTU/lb yarn trash ( w ) lap (P)
250 . 1.800 8TUllb short f ibers. t rash ( w ) caw: 754 BTUllb) s l i v e r (p)
98 . 323 BTUllb s l i v e r (p) (avg: 163 BTUllb)
677 . 1,219 BTUllb roving s l i v e r s (p) (avg: 985 BTUNIlb)
1,612 -20,618 yarn (P) c a w : 7.520 B T U l l b (yarn count 18.51) ( 15,965 B T U l l b Warn count 351)
11,694 -33,400 BTUllb Y a r n (p) (avg: 20,500 BTUllb)
850 BTUllb yarn (P) (a 5.5 Lbslhrlpositim)
1.100 . 2,900 BTUllb process water tu) caw: tst.eanl 1,523 BTUllb) yam (P) ( telec.1 800 BTUflb)
( [ tota l ] 2,323 BTUllb)
............
3,540 -13,850 BTlJ/lb fab r i c (p) (avg: 5.440 BTUllb)
3,540 -10.860 BTUllb fab r i c (PI
outputs: Y . waste p . pPocess Wtplt
*Fuel swpces for steam prwhction: natura l gas, coal, fuel o i l , a d other p t r o l n n products
Source: American Consul t ing Engineers Counci l , I n d u s t r i a l Market & Energy Manaqement Guide: S I C 22 - The T e x t i l e M i l l Products Indus t ry , 1985; U.S. Dept. o f Energy, The U . S . T e x t i l e Indus t ry : An Energy Perspect ive, March 1988.
8-31

Table 8-14
1985 ELECTRICITY CONSUMPTION BY SPECIFIC TEXTILE OPERATION ( M i l l i o n kWh)
IOf.1 1,382 810 5.531 3.8S2 l.37p 3.W8 2,570 1.971 513 3.881 2S,?d7
=e: U.S. Dept. o f Commerce, Bureau o f t h e Census, Annual Survey o f Manufactures, 1985; U.S. Dept. of Energy, The U . S . T e x t i l e Indus t ry : An Energy Perspective, March 1988; American Consul t ing Engineers Counci 1, I n d u s t r i a l Market and Energy Management Guide: S I C 22 - T e x t i l e M i l l Products Industry; Resource Dynamics Corporation estimates.
8-32

Wet Processing
Wet processing often requires large inputs of thermal energy, mainly to heat liquids and chemical dyes and to dry and finish textiles. Process heating is dominated by fossil fuels because they can heat evenly and inexpensively with readily available technologies. of application varies widely. applications of open flame, eliminating the possibility of electric process heat applications. and pressure. is crucial to avoid over- or under-processing. The design and application flexibility of gas equipment allows ready application of heat in those processes where heat is required. Table 6-15 presents energy inputs, average energy consumption, and outputs for individual operations in wet processing mills.
In textile processing, the quantity of heat, temperature, and method Some methods (such as singeing) require direct
Others require steam cans or calendars for the application of heat In all cases the application and maintenance of a certain temperature
Dyeing, curing, and other finishing processes require large quantities of thermal energy. on electricity. one fuel source, enabling costs to be the determining factor in fuel choice. Steam and natural gas are the two major thermal energy sources for drying and finishing, with most steam being generated by coal-, oil-, or natural gas-fired boilers. In addition to steam and hot water supplied by boilers, some drying, curing, and finishing processes also require direct-fired natural gas. Current natural gas equipment in textile processes includes natural gas radiant heat, dryers, burners, cylinder dryers, curers, convection ovens, and gas burners with calendar rolls.
As can be seen from Table 8-15, only a few wet processing operations rely Many plants have fuel-switching capabilities to avoid dependence on
Electrical energy requirements for space conditioning, material handling, and other systems used in wet processing are low. trillion Btu used for process heating in 1985, 30 percent was supplied by natural gas, 29 percent by coal, 20 percent by fuel oil, and 19 percent by LPG and other fossil fuels. Electricity accounted for only about one percent. Electric heating technologies are used mainly for drying and curing. drying equipment. 520 million kWh in 1980 to about 640 million kWh in 1985, and there appear to be opportunities for these processes to become more widely applied in the textile industry.
Figure 6-10 shows that out of the 188
Some mills have installed RF
Electric process heating applications in textiles grew from about
If electric heating processes can provide the high temperatures required
8-33

Table B-15
ENERGY CONSUMPTION I N WET PROCESSING MILLS
ENERGY INPUTS OPERATION AVG. ENERGY CONSUUPTIOW CUTPUTS
YARN DYEING . rawstosk dyein0
. yarn package dyeing ard drying w g : 9,UO BTUllb
ard drying 10,mo " YOMW FABRIC DYElllG AND FIHISHIMG . heat sett ing avg: 530 BTUllb
. singeing 155 "
. desizing 465 I'
. scwr ing 1,350 . bleachins 1,200 " . mercerizing 1,920 "
. dye iw 6,225 . pr in t l ng 9,570 'I
. finishing 2,730 "
. dryin9 3.455 "
. preparation . dye iw . f in ish ing . drying
. twist ing
. heat Setting
. t u f t i n g
. dyeing
. pr in t ing
. finishing
. drying
- web formation/ web b r d i n g
FLOOR COVERINGS
Inputs: E . e l e c t r i c i t y G . natural gas S . steam, Y . water
process $later ( W )
dyed yarn (P)
heat loss (u) fabric (p) exhaust, process water (u) fabric (p) process water ( w ) fabric (p)
process water ( w ) dyed fabric (p)
process uater (u) printed fabric (p) procwr "ate? (U) fabric (p) exhaust ( w ) fabric (P)
process water tu) fabric (p) exhaust (w)
avg: 4,500 BTUlLb y a m (p) ( 0 0.833 Lbslhrlposition) 3.150 BTUflb heat Loss ( w )
Yarn 10) 1.050 " ;roc.;;-u.ter (U)
c a r p t (p) 9.800 ne process water ( w )
carpet (p) process uater (u) 39,000 Blulsq. yard c a r p t (p)
3,500 BTUllb process water ( w ) c a r p 1 (p)
4.350 " exhaust ( w ) c a r p t (p)
4,550 I' (Mat) waste adhesive, p d m r tu) 2.010 (dry) c a r p c (p)
h l t p l t s : Y . waste p . process Wtput
*Fuel sources for s t e m production: natural gas, coal, fuel a i \ , and other pet ro lem prodvcts
- Source: American Consult ing Engineers Council, I n d u s t r i a l Market & Enerq
Manaqement Guide: S I C 22 - The T e x t i l e M i l l Products Indus t ry , 1385; U.S. Department o f Energy, The U.S. T e x t i l e Industry: An Enerqy Perspective, March 1985.
8-34

Coal 29%
Fuel Oil 20%
Figure B-10. 1985 Process Heat Energy Sources 188 T r i l l i o n Btu
=e: U.S. Department o f Commerce, Bureau o f t he Census, 1985 Annual Survey o f Manufactures; American Gas Associat ion, Future Gas Consumption i n the Uni ted States, Vol. 13, 1986; U.S. Department o f Energy, Energy In fo rmat ion Admin is t ra t ion , Manufacture Energy Consumption Survey: Consumption of Enerqv, 1985, November, 1988; and Resource Dynamics Corporat ion estimates.
8-35

f o r d i r e c t - f i r e d processes, increase product ion, improve q u a l i t y , and prevent dye migra t ion , they may be i n s t a l l e d .
Table 6-16 presents non -e lec t r i c energy consumption by i n d i v i d u a l u n i t operat ions. The t a b l e shows t h a t a t o t a l o f 56.1 t r i l l i o n B tu o f f u e l s were purchased i n 1985 f o r dyeing operat ions, t h e l a r g e s t amount o f non -e lec t r i c energy consumed i n the t e x t i l e i ndus t r y . f i x a t i o n and t o heat r i n s e water. f i n i s h i n g m i l l s , and carpe t and rug m i l l s are among the l a r g e s t consumers o f f o s s i l energy used f o r dyeing. 226, and 227) amounts t o 73 percent o f t h e t o t a l energy consumed f o r dyeing operat ions i n a l l t e x t i l e m i l l s .
~
Almost a l l o f t h i s energy goes t o heat water f o r proper dye K n i t t i n g m i l l s (which dye and f i n i s h k n i t goods), ~
The combined consumption o f these th ree m i l l s ( S I C S 225,
Table 6-16
( T r i l l i o n Btu) 1985 NON-ELECTRIC ENERGY CONSUMPTION BY S P E C I F I C TEXTILE PROCESSES
5.0 2.6 7.4 5.2 0.11
0.1 0.2 0.2 0.2 0.4 1.1 0.2 1.1 0.1
1 3 0.6 0.6 0.1
2.0 1.s (6.1 9.4 8.1 1.6
2.1 2.6 1.11 S . 2 1 6 . 4 1 1 . 1 11.1 1.6
0.6 0.3 1.1 8,s a.9 2.a 4 . 1 1.1
*.I 2.s 1.1 5.9 5.7 0.8
0 . b 6.6 1.7 5.7 1 .I
20.1
L.5
2.5
10.7
52.1
27.7
15.6
1a.q
rot.i 8.0 7.7 6.2 11.1 1.0 56.1 54.6 3b.8 5.1 8.2 197.8
=e: U . S . Dept. o f Commerce, Bureau o f t he Census, Annual Survey o f Manufactures, 1985; U . S . Dept. o f Energy, The U.S. T e x t i l e Indus t ry : An Energy Perspective; American Consul t ing Engineers Counci l , I n d u s t r i a l Market and Energy Manaqement Guide: S I C 22 - T e x t i l e M i l l Products Indus t ry ; Resource Dynamics Corporat ion estimates.
6-36

Appendix C
TEXTILE INDUSTRY ELECTROTECHNOLOGY EQUIPMENT SUPPLIERS
i


TABLE OF CONTENTS
APPENDIX C
TEXTILE INDUSTRY ELECTROTECHNOLOGY EQUIPMENT SUPPLIERS
Adjustable Speed Dr ive Equipment Suppl iers Heat Exchangers and Heat Recovery Equipment Suppl iers I n f r a r e d Processing Equipment Suppliers I n d u s t r i a l Process Heat Pump Equipment Suppl iers Microwave Heating and Drying Equipment Suppliers Radiofrequency Heating and Drying Equipment Suppl iers U l t r a v i o l e t Curing Equipment Suppl iers
c -1 c-3 c-4 C-6 c - 7 C-8 c - 9


ADJUSTABLE SPEED DRIVE EQUIPMENT SUPPLIERS
A l l en Bradley Motion Control D i v i s i o n 4300 Brown Deer Road Brown Deer, W I 53223
ABB I n d u s t r i a l Systems, Inc. P.O. Box 372 Milwaukee, W I 53201 414-785-3358
Oanfoss E lec t ron ics 2995 Eastrock Dr ive Rockford, I L 61109 815-398-2770; 800'-432-6367
Eaton Corporation E lec r i c Dr ives D i v i s i o n 3122 14th Avenue Kenosha, W I 53141
Emerson E l e c t r i c Company I n d u s t r i a l Controls D iv i s ion 3036 A l t Boulevard Grand Is land, NY 14072
GE Dr ive Systems 1100 Lawrence Parkwav
414-656-4011
716-773-2321
., Er ie, PA 16531 814-875-2663
Graham Company 8800 W. Bradley Road Milwaukee, W I 53223
H i tach i America Ltd. 220 White P la ins Road Tarrytown, NY 10591
Lovejoy Incorporated 2655 Wisconsin Avenue Downers Grove, I L 60515
414-355-8800
914-631-0600
708-852-0500
Magnetek Dr ives & Systems 16555 Ryerson Road New B e d i n , W I 53151 414-782-0200
Marathon E lec t ron ics Avtek Dr ive D iv i s ion 398 Beach Road Burlingame, CA 94010 415-347-3081
Mi tsub ish i E l e c t r i c Sales America 800 Biermann Court Mount Prospect, I L 60056
Polyspede E lec t ron ics Co. 6770 Twin H i l l s Avenue
708-298-9223
Dallas, TX 75231 214-363-7245
Reliance E l e c t r i c Co. E l e c t r i c a l Drives Group 24703 Euc l id Avenue Cleveland, OH 44117
Ross H i l l Controls Corp. 1530 Sam Houston Pkwy North Houston, TX 77043
Southcon 10901 Downs Road
7 13-467 -9888
PO Box 410328 Charlot te, NC 28241-0328 704-393-1636
Square D Company PO Box 7744h . - - . . . -. . . - Raleigh, NC 27611
T. B. Woods' Sons Company 440 N. F i f t h Avenue Chambersburg, PA 17201
919-266-8600
717-264-7161
c - 1

ADJUSTABLE SPEED D R I V E EQUIPMENT SUPPLIERS (CONTINUED)
Toshiba I n t e r . Corp. 13131 W. L i t l e York Road Houston, TX 77041
West i nghouse E l e c t r i c Corp. Control D i v i s i o n
713-466-0277
P.O. Box 819 Oldsmar. FL 34677
c-2

HEAT EXCHANGERS AND HEAT RECOVERY EQUIPMENT SUPPLIERS
Ai r tech Systems Corp. 365 Central S t r e e t PO Box 686 Stoughton, MA 02072 617-344-0467
Morton Machine Works, Inc. PO Box 2547 300 Jackson Avenue Columbus, GA 31901 404-322-5541
c-3

INFRARED PROCESSING EQUIPMENT SUPPLIERS
BBC Indus t r i es , Inc. 1526 Fenpark Dr ive Fenton, MO 63026 314-343-5600
BGK F in i sh ing Systems, Inc. 4131 Pheasant Ridge Drive, North Minneapolis, MN 55434
Br ink, E.H. Company, Inc. 476 Grant Terrance
612-784-0466
Buf fa lo , NY 14213 716-885-0265
Brown Engineering 550 South Monroe St ree t Seat t le , WA 98108 206-762-7337 800-426-6384
Calor i tech, Inc. P.O. Box 846 Glen Burnie, MD 21061
Casso-Solar Corporation P.O. Box 163 U.S. Route 202 Pomona, NY 10970
Chroma 1 ox E.L. Wiegand D i v i s i o n 641 Alpha Dr ive Pi t tsburgh, PA 15238
Cleveland Process Corporation 127 S.W. F i f t h Avenue Homestead, FL 33030
Delta T Products, Inc. 22 Park Place Bu t le r , NJ 07405
301-766-6333
914-356-2500
412-967-3900
800-241-0412;305-248-4312
201-492-1533
DeVi 1 b i ss Company P.O. BOX 913 . .~. Toledo, OH 43692 800-628-1200, Ext. 735
Dry-Clime Lamp Corporation P.O. Box 146 Sta te Road 46W Greensburg, I N 47240
Eraser Company, Inc. Luxtherm D iv i s ion O l i va Dr ive P.O. Box 4961
812-663-4141
Syracuse, NY 13221 315-454-3237
Fos tor ia Indus t r ies , Inc. 1200 North Main St ree t Fostor ia, OH 44830
Glenro, Inc. 39 McBride Avenue
419-435-9201
Paterson, NJ 07501 800-922-0106;201-274-5900
Glo-Quartz E l e c t r i c Heater Company, 1nc. 7074 Maple St ree t Mentor, OH 44060
Hix Corporation 1201 East 27th S t ree t
216-255-9701
P.O. Box 393 P i t tsburg , KS 66762 316-231-8568
I n d u s t r i a l Systems Corporation 1021 Lake Road Medina. OH 44256 216-725-8500
c-4

INFRARED PROCESSING EQUIPMENT SUPPLIERS (CONTINUED)
Infrasource, Inc. 1200-A North Concord St ree t South S t . Paul, MN 55075
In tegra ted Technologies, Inc. 70 M i l l Road Acushnet, MA 02743
J.R. Greene, Inc. 710 Myr t l e Avenue Boonton, NJ 07005
John J. Fannon Company Thermal Devices D iv i s ion 16025 23 M i l e Road Mount Clemens, M I 48044
612-450-9747
508-998-3071
201-335-1630
313-263-8850
Mahan Oven and Engineering Co. Inc. P.O. Box 2144 Hiahwav 176E Spartanburg, SC 29304 803-585-9433
Oal Associates, Inc. 1175 I n d u s t r i a l Avenue P.O. Box J Escondido, CA 92025
Ogden Manufacturing Company 48 West Seeoers Road
619-743-7143
Ar l i ng ton Heights, I L 60005 708-593-8050
Process Thermal Dynamics, Inc. 1200 North Concord St ree t South S t . Paul, MN 55075 612-450-4702
Radiant Heat Enterpr ises, Inc. P.O. Box 566 4 0 ~ ~ i e r ai West F a i r f i e l d , NJ 07006 201-227-6633
Radiation Systems, Inc. 455 West Main S t ree t Wyckoff, NJ 07481 201-891-7515
Research, Inc. Radiant Energy D iv i s ion P.O. Box 24064 Minneapolis, MN 55424
Spectrum In f ra red , Inc. 246 East 131st Stree t
612-941-3300
Cleveland, OH 44108 216-451-6666
Tech Systems 1013 West Main St ree t P.O. Box 142 Greensburo. I N 47240
Therma-Tech Corporation 300 Dakota St ree t
UV I11 Systems, Inc. P.O. Box 447 M i l l i s , MA 02054 508-520-1802
Wat 1 ow E l e c t r i c Manufacturing Co. 12001 Lackland Road S t . Louis, MO 63146
Wellman Thermal Systems Corporation One Progress Road She lbyv i l le , I N 46176
314-878-4600
317-398-4411
Radiant Heat, Inc. I n d u s t r i a l Park 62 Sawyer Dr ive Coventry, R I 02816 401-822-0360
c-5

INDUSTRIAL PROCESS HEAT PUMP EQUIPMENT SUPPLIERS
App l i ca t i on Engineering Corporation 801 AEC D r . ~~~ ~~
Wood Dale, IL 60191
Cr i spa i re Corp. E-Tech D i v i s i o n 3570 American Dr i ve At lan ta , GA 30341
Dantherm Systems D i v i s i o n Patterson I n t e r n a t i o n a l 208 E. Adam S t ree t
708-595-1060
404-458-6643
Cambridge, W I 53523 608-423-4101;800-368-4376
Heat Exchangers, Inc . 8131 N.Monticel10 Avenue PO Box 790 Skokie, IL 60076
H i tach i Zosen U.S.A. Ltd. 150 E. 52nd S t ree t 20th F loo r New York, NY 10022
McQuaylSnyderGeneral Corp. PO Box 1551 Minneapolis, MN 55440
Tecogen, Inc. Thermo E lec t ron Corp. 45 F i r s t Avenue Waltham, MA 02254
708-679-0300
212-355-5650
612-553-5330
617-622-1000
C-6

MICROWAVE HEATING AN0 DRYING EQUIPMENT SUPPLIERS
Associated Science Research Foundation 126 Water S t r e e t Marlboro NH 03455
Econco Broadcast Service 1318 Commerce Avenue Woodland, CA 95695
914-335-6270
916-662-7553; 800-0532-6626
502-241-8933
Raytheon Company 190 Willow Street Waltham, MA 02254
Radio Frequency Co. Inc. 152 Dover Road PO Box 158 M i l l i s , MA 02054
Watlow E l e c t r i c Mfg. Co 12001 Lackland Road
617-642-4244
617-762-4900
S t . Louis, MO 63146 314-878-4600
c-7

RADIOFREQUENCY HEATING AND DRYING EQUIPMENT SUPPLIERS
Ameritherm, Inc. 39 Main St ree t S c o t t s v i l l e , NY 14546
Cal lanan 5679 Northwest Highway Chicago, I L 60646
Econco
800-456-HEAT
312-792-3344
1318 Commerce Avenue Woodland, CA 95695 916-662-7553;800-532-6626
Glenro, Inc. 39 McBride Avenue Extension Paterson, NJ 07501 800-922-0106;201-274-5900
IHS-INOUCTOHEAT 5009 Rondo Dr ive Fo r t Worth, TX 76106 817-625-5577
Inductoheat, Inc. 32251 North Avis Dr ive Madison Heights, M I 48071 800-624-6297;313-585-9393
Kabar Manufacturing Corp 140 Schmit Blvd. Farmingdale, NY 11735
Nemeth Engineering Associates, Inc. 5901 West Highway 22 Crestwood, KY 40014
P i l l a r I ndus t r i es , Inc. N92 W15800 Mega1 Dr ive Menomonee F a l l s , WE 53051
516-694-6857
502-241-1502
414-255-6470
Radio Frequency Company, Inc. 152 Dover Road P.O. Box 158 M i l l i s , MA 02054 617-762-4900
Radvne Corporation 12819 West' S i l v e r Spring Road B u t l e r . W I 53007 - - . . . . . . - . . . 414-mi-8360
Thermex Thermatron 60 Spence St ree t Bay Shore, NY 11706 516-231-7800
PSC, Inc. 21761 Tungsten Road Cleveland, OH 44117 216-531-3375
c-8

ULTRAVIOLET CURING EQUIPMENT SUPPLIERS
American U l t r a v i o l e t Co. 562 Centra l Avenue Murray H i l l , NJ 07974 201-665-2211
Col i g h t 820 Decatur Avenue North Minneapolis, MN 55427
F u l l e r U l t r a v i o l e t Corp. PO Box 279 F rank fo r t , I L 60423
612-544-9100
815-469-3301
Fusion UV Curing Systems Corp. 7600 Standish Place Rockville,MD 20855 301-251-0300
Glenro, Inc. 10 South 11th Avenue Paterson, NJ 07501
Hanovia, Inc. 100 Chestnut S t ree t Newark,NJ 07105
800-922-0106;201-274S5900
201-589-4300
In teg ra ted Technologies, Inc. 70 M i l l Road Acushnet, MA 02743 508-998-3071
Spectronics Corp. 956 Brush Hollow Road Westbury, NY 11590 516-333-4840
UV I11 Systems, Inc. P.O. Box 447 M i l l i s , MA 02054 508-520-1802
c -9


Appendix D
DESCRIPTIONS OF SELECTED ELECTROTECHNOLOGIES FOR THE TEXTILE INDUSTRY
L
7 ! 7
! I
!
I
!
!
~
!
! !
!


TABLE OF CONTENTS
S e c t i o n
APPENDIX D
DESCRIPTIONS OF SELECTED ELECTROTECHNOLOGIES FOR THE TEXTILE INDUSTRY
R a d i o f r e q u e n c y D r y i n g and H e a t i n g I n d u s t r i a l Process H e a t Pumps Membrane Processes U l t r a v i o l e t C u r i n g Microwave P r o c e s s i n g
D- 1
0-1 0-6 D-17 D-32 0-42
D - i i i


Appendix D
DESCRIPTIONS OF SELECTED ELECTROTECHNOLOGIES FOR THE TEXTILE INDUSTRY
RAOIOFREQUENCY DRYING AND HEATING
B A S I C PRINCIPLES
Radiofrequency (RF) i s the name given t o the po r t i on o f t he electromagnetic spectrum between 2 and 100 MHZ because these frequencies are used f o r rad io communications. The most commonly used RF frequencies are 13.56 and 27.12 MHZ. RF heat ing and drying use radio-frequency waves t o heat e l e c t r i c a l l y non-conducting mater ia ls ( d i e l e c t r i c s ) composed o f po la r molecules. molecules i s water, and many RF app l i ca t ions are used t o d ry moist mater ia ls . molecules have an asymmetric e l e c t r i c a l structure--much l i k e min ia tu re magnets--and tend t o a l i g n themselves i n an imposed e l e c t r i c f i e l d . e l e c t r i c f i e l d i s a l te rna ted r a p i d l y ( a t h igh frequencies) these p o l a r molecules tend t o move i n synchronization w i t h the f i e l d , c rea t i ng f r i c t i o n between molecules and thus producing heat from w i t h i n the mater ia l . This p r i n c i p l e i s re fe r red t o as d i e l e c t r i c heating, and i s a lso exp lo i ted by microwaves.
The most common d i e l e c t r i c w i t h po la r Polar
When the d i r e c t i o n o f the
TEXTILE APPLICATIONS AND COMMERCIAL STATUS
RF d ry ing i s used i n the t e x t i l e indus t ry t o dry yarn and fabr ics . indus t ry app l i ca t i ons o f RF inc lude the dry ing o f yarn, thread tows, and f a b r i c webs. cakes and dye bobbins. commercial s e t t i n g . i s c u r r e n t l y a t t he labora tory stage. there are i nd i ca t i ons t h a t t he common problem o f s i z e ma te r ia l s t i c k i n g t o drying cy l inders can be el iminated. An added b e n e f i t may be a reduct ion o f requirements f o r s i z i n g wax. Other RF dry ing bene f i t s i n t e x t i l e app l i ca t ions include:
Spec i f i c t e x t i l e
Most t e x t i l e d ry ing app l ica t ions have involved bu lk yarns, inc lud ing rayon RF dry ing o f t h i n webs o f f a b r i c has no t y e t been done i n a
RF d ry ing o f warped yarns dur ing s lashing and s i z i n g operations Since RF i s a non-contact d ry ing method,
0 Absence o f thermal l a g and i n e r t i a
0 Nonheating o f nonpolar f i b e r s such as po lyes ter i n RF f i e l d
D- 1

Rapid drying rates
Little or no heat radiation into the room
Simple process control.
Smaller drying sections of sizing machines
By selectively heating the dielectric medium (most often water), RF produces more uniform drying in the product, while improving product quality by heating moisture and not the surface of the product. as bulk yarns, which could not be dried using conventional methods. textile manufacturers can increase production volume by producing higher density yarn (more yarnlspool).
RF can be used to dry compacted materials, such As a result,
EQUIPMENT
A typical RF system consists of the following four major components:
A generator. Includes the power supply, voltage controls and oscillator. The power supply and voltage controls provide high-voltage power to the oscillator, which generates high-frequency power for the application.
An applicator. Houses the electrode system, provides shielding and may include such auxiliaries as hot air and moisture extraction systems. The electrode system, often consisting of simple parallel plates or rods, converts the high-frequency power from the oscillator to RF waves. The applicator also contains shielding to avoid transmission of RF radiation.
The materials-handling system. Positions the product under the RF applicator. In continuous-type systems, such as conveyors, the material is guided through the exposure area. (similar to home ovens) have no materials-handling system, and depend on an operator to remove the product from the exposure area when processing is complete.
The system controls. Contains the necessary controls (automatic, digital, or manual) to regulate the processing duration, intensity, and speed of the materials-handling system. The controls may be complex for special applications or may be simple on-off push buttons.
Batch-type processing systems
Figure D-1 illustrates a textile spool-drying RF system, showing the generator, electrodes, conveyors, and extraction system.
D-2

Figure D-1. Drying of Textile Spools
=e: Reference (2)
PERFORMANCE AND COST DATA
Power Requirements
In drying applications, a rule-of-thumb is that the power requirements are calculated at 1 kW for each kg of water removed in an hour. yarn weighing 1.3 kg and initially holding 26-percent moisture, an RF system removing all but 3 percent moisture (or 0.3 kg water removed) would require
Thus for a bobbin of
0 3 k x 1 k W = 0.3kW . d bobbin/hr
At a production rate of 700 bobbins dried per hour, the power rating would be
x 700 bobbins = 210 kW. hr
Capital Costs
One major disadvantage of RF is its high capital costs. heater or dryer may range from $1,000 to $3,500 per kW, with smaller systems
The cost of an RF
D-3

(1 - 200 kw) ranging from $2,500 t o $3,500 per kW and l a r g e r systems (300 - 1,000 kW) ranging from $1,000 t o $2,500 per kW. represented by a sophist icated process requ i r i ng complex con t ro l s and app l ica tor , whereas the low end would be the cost o f a simple app l i ca tor . t he 210 kW bobbin-drying system, the c a p i t a l cost i s $570,000.
The high end would be
For
Operating Costs
I n s p i t e o f RF's h igh c a p i t a l cost , a number o f t e x t i l e app l i ca t ions have proven t o be economical. examination o f cur ren t operat ing costs i s required t o evaluate the po ten t i a l benef i t s .
However, operat ing costs can vary, and an
Labor Costs. Labor costs are o f ten lower w i t h RF than w i t h o ther forms o f heat. Some i n s t a l l a t i o n s are equipped t o operate completely unattended. Some i n s t a l l a t i o n s share the operator costs w i t h other machines o r o ther pa r t s o f t he process. I n many app l ica t ions on ly one operator i s required t o load and unload.
Operating labor savings may be o f f s e t by increased maintenance requirements. Because o f t he l i m i t e d l i f e o f vacuum tubes, the c r i t i c a l component o f t he RF
generator, t he labor and pa r t s required t o maintain an RF system could be s i g n i f i c a n t .
Enerav Costs. Approximately 60 percent o f the power input t o the generator a c t u a l l y reaches the product. As a r e s u l t , t he power requ i red i s about 1.7 t imes t h e power reaching the product, o r generator output. Thus a generator w i t h a 210 kW output would requ i re about 350 kW power input. o f a 210 kW RF system would be about $87,500 annually (based on 350 kW power input , 5,000 hours per year operation, and $0.05 per kWh).
The energy costs
Mater ia l Costs. t o minutes. t he shor te r t ime exposure, bu t a lso reduces work i n process inventory. t he oven temperature need on ly reach the b o i l i n g p o i n t t o remove moisture, thus the product i s never exposed t o h igh heat. As a r e s u l t o f decreased exposure t o h igh temperature, t he amount o f product loss due t o overheating can be s i g n i f i c a n t l y reduced w i t h RF dry ing and heating.
I n d ry ing t e x t i l e s , t he dry ing per iod i s reduced from hours
Also, This no t on l y reduces heat d e t e r i o r a t i o n o f t he product due t o
0-4

REFERENCES:
1. Auburn Un ivers i ty , Dept. o f T e x t i l e Engineering, Radio Frequency Drying
2. O r f e u i l , Maurice, E l e c t r i c Process Heatinq, EPRI Report EM-5105-SR,
3. Schmidt, P.S., E l e c t r i c i t y and I n d u s t r i a l P roduc t i v i t y , E l e c t r i c Power
4. Thermo Energy Corporation, Radio-Frequency D i e l e c t r i c Heating i n
o f T e x t i l e Yarns i n Siz inq, November 1987.
B a t t e l l e Press, Columbus, OH 1987.
Research I n s t i t u t e , Report EM-3640, New York, NY, 1984.
I ndus t r E l e c t r i c Power Research I n s t i t u t e , E P R I EM-4949, Palo A l to , CA, imidb.
D-5

INDUSTRIAL PROCESS HEAT PUMPS
BASIC PRINCIPLES
Industrial process heat pumps receive process heat from low-temperature sources, elevate its temperature, and return it for process use. offer industries the ability to upgrade low-temperature heat and to recycle this heat back into the processes. application is to reduce external energy requirements, thereby reducing costs.
Heat pumps
The net effect of a well-chosen
Heat pump cycles may be open, semi-open, or closed, depending upon the heat transfer configuration used in the process.
Figure D-2 is a schematic of a closed-cycle heat pump. pumps use a working fluid, separate from the process, to transfer heat from a low-temperature source to a higher-temperature sink. circulates through an evaporator where it is vaporized by absorbing heat from the source. temperature of the working fluid. where heat is transferred to the process fluid. To complete the cycle, the working fluid is then expanded to lower its pressure.
Closed-cycle heat
The working fluid
A compressor is used to increase the pressure and thus the This fluid then passes through a condenser,
ounet Process - Sink I
Inlet - I
I t
Evaporator - Heat t
Source- Inlet t
outlet - Figure D-2. Closed-Cycle Heat Pump System
=e: Reference (2)
D-6

An open-cycle system, o f ten c a l l e d mechanical vapor recompression (MVR), uses t he mater ia l being processed (steam o r other process vapors) d i r e c t l y as the working f l u i d , r a t h e r than t r a n s f e r r i n g heat through the medium o f a separate r e f r i g e r a n t . associated heat t r a n s f e r i n e f f i c i e n c i e s . shown i n Figure D-3. through an expansion device t o a f l a s h chamber where p a r t o f t he stream i s vaporized and f lows t o a compressor, which raises i t s temperature and pressure. The heated vapor de l i ve rs i t s heat back t o the process, i n t h i s
case as steam.
The cyc le there fore el iminates heat exchangers and t h e i r A schematic o f an MVR system i s
The process vapor (e.g., waste water) i s de l i vered
Compressed 7- ;rzc:s
Campressor &= Expansion r-'
Device bquidi Condensate
Stream :n
Vaporizer rJ-"? Flam Chamber Heat Source
Discharge
Figure D-3. Open-Cycle Heat Pump
=e: Reference (2)
A v a r i a t i o n o f t he open-cycle system i s the semi-open system, i n which the process f l u i d i s vaporized by absorbing heat from a waste stream i n a conventional heat exchanger, then compressed t o d e l i v e r heat a t an elevated temperature. streams.
These systems t y p i c a l l y recover heat from contaminated waste
D-7

TEXTILE APPLICATIONS AND COMMERCIAL STATUS
Closed-cycle heat pumps are used in industries with relatively low temperature requirements, such as the textile industry, in applications where hot- water-driven absorption chillers are used. The textile mill industry requires large quantities of hot water for washing, dyeing, rinsing, bleaching, and scouring. A closed-cycle heat pump can recover the heat from waste water that has been used in one of these wet processing applications to heat the incoming water.
Most industrial process heat pumps now in use are open-cycle systems. Open-cycle systems are finding application in industries where large quantities of water vapor are produced in evaporation, distillation, and drying processes. sodium hydroxide, and other process chemicals. Traditional steam-fired evaporators used in textile applications can be replaced with industrial process heat pumps. concentrating process can recover some of these chemicals. use of a heat pump to increase the pressure of low-quality steam from a caustic soda evaporator.
The textile industry uses large quantities of caustic,
An open-cycle heat pump combined with an evaporative and One example is the
Semi-open-cycle systems are mostly used to recover heat from contaminated streams. boilers and many of the dyeing processes performed prior to drying generate large quantities of effluent. from waste streams and heat them for use as boiler make-up water.
Many textile drying processes rely on steam that is generated in
A semi-open system can recover the excess heat
The main advantage of industrial process heat recovery is the reduction in energy costs. can lower operating costs by decreasing process energy requirements and reducing cooling requirements. However, their economics are highly sensitive to site-specific conditions, including relative fuel and electricity costs. Moreover, the evaluation of heat pumps should include consideration of the relative costs and benefits o f other energy conservation measures, such as increased heat integration.
If properly placed in the industrial plant, electric heat pumps
Heat pumps may also have other advantages. effect evaporators heat pump evaporators require less space and permit processing at lower temperatures, an important consideration for
For example, compared to multiple-
D - 8

heat-sensitive materials, especially in those mills that process synthetic fibers or blends.
EQUIPMENT
Industrial process heat recovery systems consist o f a variety o f waste recovery devices, depending on the type o f system that is being designed. Each type operates slightly differently but the end result is the same.
All industrial process heat pumps are custom designed to meet site-specific and process-specific conditions. architect/engineering firms or by equipment manufacturers such as evaporator suppliers. These systems may be supplied on a "turn-key" basis. it is difficult to describe a generic industrial process heat pump installation.
System designs are typically prepared by
As a result,
Closed-cycle systems are typically packaged units which recover 50 to 14OoF heat and amplify it to useable temperature levels (e.g., 110 to ZOOOF). main components o f these systems are a compressor, pressure reducing valve, and two heat exchangers (condenser and evaporator). refrigerant (working fluid) in a closed-cycle system can be the key t o
successful heat pump application.
The
The choice of a
In open-cycle systems, the compressor (and the heat exchanger in a semi-open cycle) must be compatible with the process fluids and be protected from corrosive and erosive fluids. vapor be dry (superheated). are also less sensitive to contaminated vapors. system configuration for an open-cycle industrial process heat pump. overhead vapor from a distillation vessel is compressed, raising its temperature and pressure. a heat exchanger with the bottoms product being vaporized to return the heat to the process. In an electric system the driver of the compressor is an electric motor, and in a natural gas-fired system the driver is an internal combustion engine.
Centrifugal compressors require that the inlet Rotary screw machines can handle wet vapors and
Figure D-4 is a typical The
The high-temperature compressed gas is condensed in
D-9

Feed --#
Compressor
nottoms Product
Figure D-4. Open-Cycle Industrial Heat Pump
=e: Reference (5) -
PERFORMANCE AND COST DATA
An investment by a textile firm in an industrial process heat recovery system will be determined by the technical and economic viability of the system.
From the technical standpoint, the opportunities for process heat recovery need to be assessed. utilization opportunities is complicated by the dozens of hot and cold streams that typify a wet processing operation in a textile mill. industrial process has been viewed as a multitude of sources and sinks offering many heat pumping possibilities, attention has typically been focused on the design of the individual unit operation at the expense of the integration of those units into an overall optimized heat flowsheet. analytical methodology called Pinch Analysis based on "process synthesis" techniques can be used to optimize the matching of hot and cold process streams with each other or with external utilities in a heat exchange network to reduce overall capital and operating (mainly energy) costs. Various process synthesis techniques can be applied to identify optimal heat pump
The identification of industrial process heat pump
While the
A new
D-10

placement within the industrial plant. the context of overall process heat and power flows, can heat pump use be properly justified. described in References 11, 12, 15, 17, and 18.
Only by evaluating an application in
Methodologies for achieving process integration are
The effectiveness of an open-cycle heat pump system is strongly dependent upon the performance of its vapor compression equipment. Generally, the desired characteristics i n a compressor include reliability, low maintenance, and high efficiency. The nature of the compression equipment varies significantly with the heat pump size and pressure ratio. Low volumetric flow rates and high pressure ratios suggest the use of positive displacement equipment such as reciprocating-piston and screw compressors. pressure ratios can be accommodated by centrifugal equipment, while high flows and low pressure ratios may be best provided by axial compressors. Some process situations may require a combination of any two or all three types of compressors in order to accomplish special cycle performance.
Intermediate flows and moderate
The efficiency of a heat pump i s measured by the coefficient of performance (COP), defined as the ratio of heating output to compressor work. a heat pump system should be used only as a measure of efficiency and not as a decision variable for the selection of a heat pump.
The COP of
The COP is dependent on:
0
0 Working fluid properties
0 Compressor efficiency
0 Heat exchanger effectiveness.
Temperature difference between the heat sink and the heat source
Capital and Operating Costs
Industrial process heat pump systems are custom designed to fit specific process requirements. largely determined by the capital costs and operating costs (including fuel cost savings). factors including system type and capacity (MBtu/hr), required temperature lift, compressor size and type, working fluid specifications, and heat exchanger(s) type and area (in closed-cycle and semi-open systems). Additional factors that directly or indirectly influence the cost o f a heat
The economic viability of heat recovery systems is
The capital cost of a heat pump system is dependent upon many
D-11

pump system inc lude t o t a l engineering time, cos t o f c a p i t a l , p ip ing , ins t rumenta t ion , i n s u l a t i o n , a u x i l i a r y equipment, and i n s t a l l a t i o n .
The economic r e t u r n o f a heat pump system i s very s e n s i t i v e t o s i t e - s p e c i f i c cond i t ions (i.e., pressure, temperature, u t i l i t y costs, and produc t ion technology). source temperature can have a s i g n i f i c a n t e f f e c t on t h e o v e r a l l system economics.
For example, reducing steam pressure requirements o r inc reas ing
In a recent s tudy prepared f o r t he Department o f Energy (DOE), bo th closed- and open-cycle heat pump systems, used i n several e x i s t i n g operat ions, were s tud ied and evaluated. e l e c t r i c - d r i v e systems and were moderate i n s i ze ( t y p i c a l l y less than 1 t o 2 m i l l i o n Btus per hour). The open-cycle heat pumps ( p r i m a r i l y used i n chemical process app l i ca t i ons ) were much l a r g e r systems, and used a v a r i e t y o f prime movers, i n c l u d i n g gas and steam tu rb ines , and e l e c t r i c motor d r i ve . Table 0-1 shows a summary o f c a p i t a l and opera t ing costs f o r t he c losed-cyc le systems. The t a b l e a l so inc ludes payback c r i t e r i a used t o evaluate the p ro jec ts . Table D-2 i s a summary o f t h e pro jec ted c a p i t a l and opera t ing costs f o r new and r e t r o f i t MVR systems. In general, MVR systems are more expensive and r e q u i r e more engineer ing and design than the c losed-cyc le heat pump systems. sponsored s tudy found t h a t a t e x t i l e company which i n s t a l l e d an MVR system i n p lace o f t h e e x i s t i n g c o a l - f i r e d b o i l e r s was expected t o save up t o 60 percent o f t h e p l a n t ' s f u e l costs , w i t h payback i n j u s t over one year (Reference 6).
Most c losed-cyc le heat pumps s tud ied used
A DOE-
D-12

Table D - 1
SUMMARY OF CAPITAL AND OPERATING COSTS FOR CLOSED-CYCLE HEAT PUMPS*
Cap i ta l Costs:
Heat Pumps Other Equipment Ins t a l 1 a t i on Design
Tota l Investment
Annual Operating and Maintenance Costs:
LOW -
$30,000 10,000 10,000
0
$50,000
None Budgeted
Annual Energy Cost Savings: $20,000
Payback Required: 2-3 years
Payback Projected: 2.5 years
$ 650,000 2,050,000
500,000 480,000
$3,680,000
$ 82,000
$1,100,000
5-10 years
3.3 years
* System Capacity: Range o f 100 Thousand Btu /hr t o 25 M i l l i o n Btu /hr . The s e t o f f i g u r e s r e l a t e d t o t h e "Low" end o f t he cost range r e f l e c t s smal le r system capac i t i es . t h e cost range r e f l e c t s l a r g e r system capac i t ies .
The se t o f f i g u r e s r e l a t e d t o "High" end o f
Source: (5)
0-13

Table 0-2
SUMMARY OF PROJECTED CAPITAL COSTS FOR NEW AND RETROFIT MVR SYSTEMS* ( D o l l a r s i n M i l l i o n s )
New - C a p i t a l Costs:
Compression and D r i v e System
R e b o i l e r Condenser
Other Equipment
I n s t a l l a t i o n ,
T o t a l C a p i t a l Investment
Engineer ing, and Design
Operat ing and Maintenance Costs:
E l e c t r i c i t y
Steam
Coo l ing Water
Other Expenses
T o t a l 0 & M Expenses
P r o j e c t e d Energy Savings vs Convent ional D i s t i l l a t i o n :
P r o j e c t e d Paybacks:
$0.75-2.3
$0.5-1.0
$0.2-1 .o
$0.5-1.0
$2.0-5.3
$0.4-1.4
$0.8-1.5
$0.05-0.2
$0.1-0.5
$0.5-2 .O
$0.75-2.2
2-2.5 years
R e t r o f i t
$0.7-1.2
$0.9-1.1
$0.1-0.2
$1.3-2.0
$3 .O-4 .5
$0.6-1.4
_ - $0.06-0.2
$0.30-0.5
$1.0-2.1
$1.0-1.5
2.7-3.5 years
Note: T o t a l s may n o t add due t o rounding and due t o t h e f a c t t h a t these c o s t s represent ranges f o r t h e systems surveyed; a l s o each system may n o t have i n c o r p o r a t e d each c o s t i t e m (e.g., steam and e l e c t r i c i t y )
* System c a p a c i t y : 20 t o 100 m i l l i o n Btu /hr . The c o s t ranges r e p o r t e d above tend t o r e f l e c t a t l e a s t a p o r t i o n o f t h e l i s t e d ranges of system c a p a c i t i e s .
Source: (5 )
D-14

REFERENCES
1.
2.
3.
4.
5.
6.
7.
8.
9.
10.
11.
12.
13.
14.
15.
Ar thur D. L i t t l e , Inc., Heat Pumps as E f f i c i e n t I n d u s t r i a l Technoloqy, New York S ta te Energy Research and Development Author i ty , Albany, NY, 1984.
E l e c t r i c Power Research I n s t i t u t e , I n d u s t r i a l Process Heat Pumps, Technical B r i e f , Palo A l to , CA.
E l e c t r i c Power Research I n s t i t u t e , Heat Pump Manual, Report EM-4100-SRt Palo A l to , CA, E l e c t r i c Power Research I n s t i t u t e and National Rural E l e c t r i c Cooperative Association, Washington, D.C., August 1985.
Gas Research I n s t i t u t e , An Assessment o f Vapor Compression Heat Pumps Technology and Appl icat ions f o r I n d u s t r i a l Processes, F ina l Report ?,November 1980-February 1982), Chicago, IL .
Hagler, B a i l l y , & Co., I n d u s t r i a l Heat Pump I d e n t i f i c a t i o n and Case Studies, U.S. Department o f Energy, F ina l Report, Washington, DC, Ju ly 1987.
Hagler, B a i l l y Co., Opportuni t ies f o r P roduc t i v i t y Improvements and Enerqy Savings i n U.S. Industry: Heat Pump Appl icat ions, U.S. Dept. o f Energy, Washington, D.C., June 1987.
Har r is , G. E., Heat Pumps i n D i s t i l l a t i o n Processes, EPRI EM-3656, Palo A l to , CA, August 1984.
Karp, Alan, " I n d u s t r i a l Process Heat Pumps: Some Unconventional Wisdom," paper presented t o the IETCE, Houston, TX, Sept. 1987.
O r f e u i l , Maurice, E l e c t r i c Process Heating, EPRI Report EM-5105-SR, B a t t e l l e Press, Columbus, OH, 1987.
Ranade, S.M., E. Hindmarsh, and D. Boland, " I n d u s t r i a l Heat Pumps: Appropriate Placement and S iz ing Using the Grand Composite," presented t o t h e 8 t h I n d u s t r i a l Energy Technology Conference and Exh ib i t i on , Houston, TX, 1986.
Ranade, S.M., e t . a l , " I n d u s t r i a l Heat Pumps: A Novel Approach t o Their Placement, Siz ing, and Selection," paper presented t o the 21st IECEC, San Oiego, CA, 1986.
paper
Resource Dynamics Corporation, I n d u s t r i a l Process Heat Pumps: State-of- the-Art Review and Research and Development Needs, McLean, VA, 1984.
Resource Dynamics Corporation, I n d u s t r i a l Process Heat Recovery, Edison E l e c t r i c I n s t i t u t e , E l e c t r i c Power Research I n s t i t u t e , September 1988.
Schmidt, P h i l i p S . , E l e c t r i c i t y and I n d u s t r i a l Produc t iv i t y , E l e c t r i c Power Research I n s t i t u t e , Report EM-3640, Palo A l to , CA, 1984.
Spriggs, H.D., and G. Ashton, "Diverse Appl icat ions o f Pinch Technology Within t h e Process Indus t r ies , " Energy Technology Conference and Exh ib i t ion , Houston, T X , 1986.
paper presented t o the 8 t h I n d u s t r i a l
D-15

16. Tensa Technology, An Assessment o f t he Future A p p l i c a b i l i t y o f Some Heat Engines and Heat Pumps i n the Process Indus t r ies , Technical Papers, Middlesbrough Cleveland, England, 1981.
17. Tjoe, T.N., and B. L innhof f , "Using Pinch Technology f o r Process R e t r o f i t , " Chemical Engineering, A p r i l 28, 1986.
18. Townsend, D.W., and B. L innhoff , "Heat and Power Networks i n Process Design," AICHE Journal, Vol. 29, No. 5, 1983.
19. Union Carbide Corp., Heat Pumps i n Evaporation Processes, E l e c t r i c Power Research I n s t i t u t e , Report EM-4693, Palo A l to , CA, November 1986.
D-16

MEMBRANE PROCESSES
BAS I C PRINCIPLES
Membrane processes use a semipermeable b a r r i e r ( t y p i c a l l y made o f an organic polymer, metal, o r ceramic) t o s e l e c t i v e l y t ranspor t components from one f l u i d t o another. concentrat ion, o r electromagnetic gradient. Some o f the membrane processes have been known f o r 200 years. was developed i n the ea r l y 1960's f o r seawater desal t ing. By the e a r l y 1970's, membrane processes were commercialized and used i n waste water treatment, seawater desal t ing, and cheese whey separation. Q u i t e o f ten , membrane separation i s overlooked although the po ten t i a l f o r energy savings i s
enormous compared w i t h o ther separation techniques, p a r t i c u l a r l y evaporation.
The d r i v i n g fo rce f o r the t ranspor t may be pressure,
The f i r s t p r a c t i c a l use o f a membrane process
In general, membrane processes do no t invo lve phase change and they are l ess energy i n tens i ve than o ther separation processes. processes, such as evaporation, d i s t i l l a t i o n , and c r y s t a l l i z a t i o n , heat i s appl ied o r removed from the so lu t i on t o change i t s phase t o vapor o r s o l i d c rys ta l s . phase change; the product e x i t s t he membrane i n i t s o r i g i n a l phase. combination o f conventional phase-change and membrane u n i t s are used i n hybr id systems capable o f operations t h a t are no t f eas ib le w i t h e i t h e r process alone.
In phase-change separation
On t he o ther hand, membrane separation processes invo lve no such A
Four p r i n c i p a l types o f membrane processes are used i n the indus t ry , depending upon the physical and electrochemical p roper t ies o f the p a r t i c l e s being
separated:
0 Reverse osmosis
0 U1 t r a f i l t r a t i o n
0 Gas separat ion
0 Elec t rod ia l ys i s .
For t e x t i l e i ndus t r y app l i ca t ions , reverse osmosis and u l t r a f i l t r a t i o n have proven t o be valuable and cos t e f f e c t i v e and on ly these two types w i l l be
0-17

discussed i n t h i s document. t ranspor t are e s s e n t i a l l y the same f o r t he d i f f e r e n t membrane processes.
The thermodynamic p r i n c i p l e s o f membrane
Reverse osmosis (RO) i s a process t h a t uses a semipermeable membrane which al lows s o l u t i o n permeation, bu t acts as a b a r r i e r t o the passage, o r t ranspor t , o f d issolved and suspended substances (i.e. s a l t s , ions, and organic compounds). pressure h igh enough t o overcome the na tura l osmotic pressure i n the so lu t i on . The p a r t i c l e s i z e o f species separated i s t y p i c a l l y between 1 t o 10 angstroms w i t h d r i v i n g pressure o f 200 t o 1000 pounds per square inch (ps i ) . U l t r a f i l t r a t i o n (UF) i s s i m i l a r t o RO, bu t w i t h lower pressure (10-100 p s i ) and la rge r p a r t i c l e s izes (10 t o 299 angstroms). So lu t ion components re ta ined (not allowed t o pass the membrane) depend on t h e i r molecular weight (MW); RO membranes r e t a i n species w i t h MWs up t o 300, wh i l e UF membranes r e t a i n species with MW between 300 and 300,000. Figure D-5 i s a schematic o f t he RO and UF processes. It shows how s a l t i s re jec ted by the RO membrane wh i l e i t passes through the UF membrane.
The so lu t i on t ranspor t i n RO i s accomplished by using
TEXTILE APPLICATIONS AND COMMERCIAL STATUS
T e x t i l e processes requ i re and produce considerable quan t i t i es o f hot and c o l d streams f o r var ious operations, as shown i n Figure D-6. are inc reas ing ly p lay ing an important r o l e i n t e x t i l e app l i ca t ions f o r the recovery and reuse o f valuable chemicals, organics, and process water. T e x t i l e app l i ca t i ons o f membrane processes f a l l i n t o two broad categories:
Membrane processes
0 Water p u r i f i c a t i o n
0 Waste water treatment and recovery.
0-18

Reverse Osmosis (RO)
Water Salts Macromolecules
-. - 5 . .*. :*e Permeate !:.
~
Ultrafiltration (UF)
Water Salts Macromolecules
2;:. Permeatetf ’ . *
Figure D-5. Permselectivity of RO and UF Membranes
=e: Reference (8)
Water Purification
Purified water or water of a certain quality is required in many wet processing textile applications, mainly for product quality benefits. Waters used to rinse fabrics and fibers after dyeing must be of a certain quality to yield desired results, as must the boiler feed waters. Waters used in climate control systems can be pre- or post-treated using membrane systems.
Textile industry process waters that can be purified with membrane separation processes include:
Dye bath make-up water
0
0 Boiler feed water
0 Climate control systems.
Rinse water for higher product quality
D-19

Carding, Raw Filter Combing. Yarn
-L - Drawing Out, Roving, Spinning
Hot. Xoist Exhaust Hot. Moist Exhaust
t Wet-End Processing
Fabric Slashing (siring), Weaving
-
I "Grev" FabrLc Bleaching Clean Fabric
I
"Grey" Fabric Washes Dyeing
Hoc, Desire HOC, Scouring Hot. Bleaching Waste Scream Wash Wacer Wash Water
Drying, Fixing
not, m i s t Exhaust Screams t
Hot. Xoist Exhaust
t
Dropped Hoc-Dye not Batches Wash Water
Finished Fabric
Figure D-6. Generalized Schematic of Textile Treatment Processes
=e: Reference (2)
D-20

Waste Water Treatment and Recovery
T e x t i l e wet f i n i s h i n g processes generate considerable streams conta in ing chemical dyes, other chemicals, and heat. oxygen demand (BOD), r e q u i r i n g treatment p r i o r t o discharge. r e s u l t i n cost savings. Membranes have been used i n t h e t e x t i l e indus t ry t o remove the c o l o r from waste water, separate the b r i n e from dyes t o be reused i n dye se t t i ng , and recover concentrates, t e x t i l e lubr ican ts , and sizes f o r reuse. Examples o f waste water recovery and treatment app l i ca t ions include:
0
Many o f these have high b i o l o g i c a l The i r reuse can
Continuous recovery (up t o 2-percent concentrat ions o f t e x t i l e l ub r i can ts w i t h high BOD f o r reuse)
Concentration and recovery o f dyes
P u r i f i c a t i o n and reuse o f ind igo dye
Recovery o f caus t ic wash water
(CMC), and o ther s izes used i n slashing.
0
0
0
0 Concentrat ion o f po l yv iny l alcohol (PVA) , carboxyl methyl c e l l u l o s e
Membrane separations are normally much less energy-intensive than are conventional separations, which o f ten invo lve energy-intensive phase-change u n i t operations. o r compressors. The advantages o f membrane separation systems i n dyeing operations inc lude consistent q u a l i t y i n the c o l o r o f dyes and reduced feedwater requirements. degradation o f dye q u a l i t y dur ing a given product ion run. Because o f the va r ia t i ons i n feedwater q u a l i t y dur ing a t y p i c a l day ( t h i s may a r i s e from overpumping, inadequately t rea ted feedwater, o r other reasons), dye s e t t i n g i s
no t always uniform. This lack o f un i fo rm i t y can r e s u l t i n d i f f e r e n t shades o r hues o f f a b r i c intended t o have the same co lo r . I n some m i l l s there can be a sharp d i s t i n c t i o n between a f a b r i c dyed i n the beginning o f t he production run and t h a t dyed a t t he end, although the same c o l o r dye was used. reverse osmosis system i s used, dye water can be t rea ted t o separate the c o l o r and p u r i f y t he water t o i t s o r i g i n a l q u a l i t y p r i o r t o the o r i g i n a l dye se t t i ng . Thus, no new feedwater i s required, o r what new feedwater i s requ i red as a r e s u l t o f wastage due t o s lashing would be so minimal as no t t o a l t e r feedwater q u a l i t y .
I n general, they requ i re on ly e l e c t r i c a l energy t o run pumps
One problem many t e x t i l e f i n i s h e r s face i s the
When a
D-21

Not all dye recovery applications of membrane processes produce these benefits, however, because some dyes may act as foulants for the membranes. When such fouling occurs on a regular basis the cost of cleaning or replacement may negate the cost effectiveness of membrane systems. textile processes, such as scouring, where high temperatures and waste streams containing high pH levels are produced, successful applications of membrane processes depend on the availability of high-temperature and pH-resistant membranes.
In those
The optimal separation process for many applications of membrane processes is a "hybrid" process. These processes combine a conventional separation unit operation, such as evaporation, with a membrane process, such as reverse osmosis. alone may be achievable with a hybrid process.
In some cases, separations that are not possible with either process
Since membrane processes are generally electric-driven, replacement of a conventional phase-change separation process with a membrane-based hybrid process usually results in the replacement of some or all thermal energy requirements by electrical energy requirements. And, due t o the relatively low energy requirements o f most membrane processes, the overall energy requirements of a membrane-based hybrid process will be lower than those of a conventional phase-change process alone. The economic benefits of membrane systems are:
0 Lower energy costs
0
0
Lower floor space due to compact size of membrane equipment
Lower design/maintenance costs due to modular design of membrane units
Increased productivity due to improved system reliability. 0
EQUIPMEN1
The basic components of a typical membrane process consist of the following components:
0 Membranes
0 Membrane modules
0 Electric liquid pump.
D-22

scour
Wasre
Pump
a c e = f o r
IIF
a 25 W C X
Figure D-7. Membrane-Based Hybr id L i q u i d Separation Process
=e: Reference (2)
The membranes and membrane modules are the keys t o these systems. membrane and t h e membrane module d i f f e r among app l ica t ions . Membranes are made from a wide v a r i e t y o f mater ia ls i nc lud ing c e l l u l o s e esters, p o l y v i n y l c h l o r i d e (PVC), c e l l u l o s e acetate, polycarbonate, polyamides, polysul fone, po l yo le f i ns , and v i n y l ch lo r ide .
The type o f
The most w ide ly used RO membrane module conf igura t ions today are: t h e spiral-wound f l a t - s h e e t membrane; t h e she l l -s ide- feed hol l o w - f i n e - f i b e r membrane; and t h e f la t -e lement membrane arrangements as shown i n Figure D-8. These conf igura t ions have r e l a t i v e l y h igh packing dens i t i es and are r e l a t i v e l y inexpensive t o i n s t a l l .
D-23

membrane; and the flat-element membrane arrangements as shown in Figure D-8. These configurations have relatively high packing densities and are relatively inexpensive to install.
Figure D-8. Spiral-Wound, Hollow-Fine-Fiber, and Flat-Element Membrane
=e: References (8)
D-24

A module design that is less prone to fouling than are the shell-side-feed hollow-fine-fiber or spiral-wound modules i s the tubular-membrane module, illustrated in Figure D-9. number o f perforated stainless steel tubes in the form o f a shell-and-tube heat exchanger. introduced on the tube side. the tubes, thereby minimizing fouling; there are no "dead spots" within the membrane module. The cost per square foot of tubular membranes, however, is typically about three times that for hollow-fiber membranes.
A typical tubular membrane module consists of a
Each tube is lined with a tubular membrane. Feed is Turbulent flow is maintained down the length of
n Pemeate
Parseace U stainless InieclOutlec Collection ?lembraae
Permeate
Shroud Support Tubes Ports
I I /
Pcrseace Uembrane Insert Otfcake Tubes
Figure D-9. Cross Section of a Tubular RO Membrane (A ) and Schematic of a Tubular RO Membrane Module (B)
=e: Reference (2)
D-25
Since most UF processes treat fouling-prone streams, UF membranes are typically modularized in tube-side-feed hollow-fiber and tubular configurations (although spiral-wound is sometimes used when less-foul ing-prone streams are treated). the ease with which the membranes can be cleaned. UF membranes can withstand solutions with high chlorine concentration, higher temperatures (close to boiling), and a wide pH range, while RO membranes have little tolerance for chlorine concentration and high temperatures (higher than 100 degrees Fahrenheit).
Module configuration also affects
Also, RO membranes are much more fragile than the UF ones.
PERFORMANCE AND COST DATA
The selection of membrane systems depends on application requirements such as chemical and physical properties of the feed stream (i .e., feed composition, pressure, and temperature), material being separated (i .e., molecular weight and size), desired composition of the permeate and/or the concentrate, and the desired production rate (i.e., gallons per day or cubic feet per minute). While there is no standard specification for membrane equipment, it can be described in terms of pore size, rejection capability, and permeability.
Pore Size: The pore structure of the membrane acts as a filter; passing small solutes while retaining larger emulsified and suspended matters. size of a specific membrane should be much smaller than the size of particles rejected such that the particles cannot enter the membrane structure and plug it. Figure D-10 shows the membrane separation processes in relation t o
commonly known particle sizes.
The pore
Rejection: Molecular weight cut-off (defined as: the molecular weight below which a species passes through the membrane) is used as a measure of rejection. pressure, pH, temperature, and solute characteristics (i.e., shape, size, and flexibility). are better rejected than flexible ones.
Particle rejection is influenced by many factors including
For example, for a given molecular weight, more-rigid molecules
Permeability: unit area, time, thickness, and pressure driving force. permeability are gallons per day (or hour) per unit area or cubic meters per day per square meter.
Permeability is defined as the volume of water permeated per The standard units of
Because both capital and operating costs for a membrane
D-26

system increase w i t h inc reas ing membrane area, i t i s impor tant t o min imize membrane area by choosing membranes w i t h h igher permeab i l i t y .
Reverse oimoiis
Membrane l i f e depends on t h e operat ing cond i t ions such as process temperature, pH l e v e l , stream c h a r a c t e r i s t i c s , and c lean ing and s t e r i l i z i n g cond i t ions . General ly, membrane l i f e t imes are two years o r more f o r t r e a t i n g c lean streams (water processing), bu t are d r a s t i c a l l y reduced when t r e a t i n g comparat ive ly d i r t y streams (i .e., waste water). module con f igu ra t i ons a re more s u i t a b l e f o r c e r t a i n k inds o f app l i ca t i ons than others. f l a t , t ubu la r , spiral-wound, and ho l l ow- f i be r membrane modules.
Some types o f membrane
Table 0-3 compares features f o r t he most common membrane modules:
Mi<toiiitration Typical range Of reparation PloCell
Obrenation method
Ultraiiltration I
Macroiillration I I
F igure D-10. The Separation Spectrum
=e: Reference (9)
D-27

Tubular
bowentionall
Spiralwound
Hollowfiber
(shellside feed)
Hollow-fiber
lfeed inside fibem)
Table D-3
COMPARISON OF TYPES OF MEMBRANE PERMEATORS
Adwanlagm
LOW holdup per "nil membrane area Much operating experience L~WfloDrrpscePerrq.ft.
LOW floor rpace per 19. fl. Very good for highly v i f ~ w i
Very low holdup per mil membrane
High conversion per wss achievable
Earily cleaned: accepted for prmesing
Mwh operating experience Individual tuber replaceable
SOlYfi0"l
area
food products
Moderately low floor spice required
Easily cleaned per sq. n.
Low in cost ( E a . Bhq. ft.1 Compact: low floor space per sq. ft. Low holdup per "nil membrane area Long Operating experience
very low in cost very compacf Low holdup
very low in COW
very compact Low holdup May beamenableto cleaning membranes
Disadvantages
Can plug a i points of solution stagnation May be hard to clean acceptably for food usel Expensive 81 present lea. $100hq. f1.1
Meager lsrgecaie operating experience a t present
CB" Plvg Can be hard 10 clean accepfably Expensive SI present Membranes in some designs hard to replace
High holdup per unit membrane area Relatively expeenrive b. $lO-$ZOhq. ft. Requires moderately large floor space per sq.
ft.slthough tube module can be placed separately in and around existing equip- ment in special cases
Meager operating experience at Prerenf High holdup per Unit membrane area
Easily plugged Hard to clean acceptably for pmcesring
food products
Plugs eerily Verv hard to clean
Just now on market-eager operating experience
statu*
Commercial
large%aI* equipment
market jYSt now on
Commercial
Commercial
market "EWO"
Commercial
=e: Reference (3)
Power Requirements
Electrical energy required in a membrane system depends on many factors including: process parameters (i .e., pressure and temperature) ; permeate/brine concentration; and feed flow rate. phase change, substantial amounts o f energy can be saved by replacing thermal energy with electrical energy required only to operate the membrane system. Furthermore, membrane separation processes have the potential of conserving additional energy by recovering and recycling process components from waste streams at process temperatures. discharged brine stream from the RO devices is at pressures o f 705 to 950 psi.
the type of application; membrane type; area and permeability;
Because membrane processes involve no
For example, in seawater plants, the
D-28

When the brine stream is passed through a hydro or impulse turbine, additional amounts of energy are recovered.
Capital Costs
The capital costs of membrane systems depend on the type and size o f membrane modules, feed stream properties, process requirements (i .e., temperature, pressure, permeate/brine concentration, and composition), and system capacity. As a result, there is a wide variation in capital costs. be misleading. In general, however, a membrane system can cost from several million dollars for a heavy industrial application (i.e., chemical plant) to about $10,000 for a water purification system. A water purification system that processes 5,000 gallons a day could cost between $10,000 and $50,000, depending on the instrumentation and the type of membrane used. costs include motors, piping, and wiring. Most plants do their own installation but as the system gets bigger companies need the help of membrane companies to install equipment. For a water purification unit producing 100,000 gallons per day, capital costs would range between $2.00-$2.50 per gallon per day, for a maximum of about $250,000. These capital cost estimates are affected by such factors as the quality of the feedwater, the temperature limitations, the instrumentation, and the type of membrane.
Generalizations can
Installation
In most systems, the cost o f RO devices makes up 10 to 30 percent o f capital costs, and the balance is for site development, installation, building, pipes, pumps, storage, etc. The economics of UF are so dependent on the process specification that it is not practical to develop a rule of thumb for capital and operating costs.
Operating Costs
Operating costs are influenced by energy, material, labor, and maintenance costs. The operating cost for membrane systems consist of the following:
0 Membrane replacement
D-29
0 Spare parts
0 Labor
0 Raw water usage
0 Chemical usage.
The labor content consists of aking OF ratic al data, cleaning membrane ' I
adding chemicals, and flushing out the system. system, operating costs amount to between 80 cents and $1.10 per 1,000 gallons of purified water. between $2.50 - $4.00 per 1,000 gallons because of the higher membrane requirements. Also, power costs are higher, more chemicals are used, and frequent membrane cleaning i s required.
For a water purification
Costs for a wastewater treatment system would be higher,
0-30

REFERENCES
1.
2.
3.
4.
5.
6.
7.
8.
9.
Applegate, Lynn E., "Membrane Separation Processes," Chemical Enqineering, McGraw-Hill, New York, NY, June 11, 1984.
Bend Research, Inc., The Use of Membrane-Based Hybrid Systems in Industrial Separations, Report No. EM-5231, Electric Power Research Institute, Palo Alto, CA.
Lacey, Robert E., "Membrane Separation Processes," Chemical Enqineering, McGraw-Hill, New York, NY, September 4, 1972.
Mans, Jack, ed., "Membrane Processing -- Cost, Efficiency Sparks Interest in New Technology," Processed Prepared Foods, Gorman Publishing, 1981.
McGraw-Hill, ed., "New Chlor-Alkali Methods Boost a Sagging Industry," Chemical Enqineering, New York, NY, April 30, 1984.
McGraw-Hill, ed., "Separations are Key to Biotech Scale-up," Chemical Enqineering, New York, NY, January 19, 1987.
Osmonics, Inc., Company brochures on OSMO Membrane Systems, Minetonka, MN, 1985.
EPRI, "Membrane Processes," Techcomnentary, Vol. 1, No. 2, 1988.
Battelle, "Advances in Membrane Technology", B-TIP Report No. 50, December 1986.
D-31

ULTRAVIOLET CURING
BASIC PRINCIPLES
Ultraviolet (UV) radiation is the part of the electromagnetic spectrum having wavelengths from 4 to 400 nanometers. specific applications to match the wavelength at which the substrates absorb the most energy to induce chemical change. UV lamps of specific wavelengths are used for curing compounds because those compounds selectively absorb energy of those wavelengths and, in doing so, undergo a chemical change. The basic energy source for initiating reactions of UV responsive materials is the mercury vapor lamp. Typically the material that is processed passes through a drying area or oven for irradiation.
UV wavelengths are selected for
Applying electromagnetic radiation to certain polymeric materials leads to the formation of three-dimensional network structures, in effect transforming a liquid on a substrate t o a solid coating. radiation-processing or radiation-curing. materials requires that electrical energy be converted to some form of electromagnetic radiation energy with sufficient power or intensity to be commercially feasible.
This process is termed Radiation processing of polymeric
Figure D-11 shows the UV curing process.
TEXTILE APPLICATIONS AND COMMERCIAL STATUS
Although UV processing of polymeric materials has found widespread commercial use in coatings, printing, adhesives, electronics, and communications applications, textile applications have been limited for one major reason: the use of UV-curable coatings on apparel fibers and fabrics, while technically feasible, may lead to undesirable side effects. natural absorbency of textile fibers and fabrics, UV curable inks or other coatings will penetrate the fibers, acting as a blocking device to the ultraviolet radiation. shsitizer, rendering the fabric unsuitable for use as clothing. However,
Because of the
The untreated UV-curable coating will act as a skin
D-32

Polymerization Solid
Photoinitiator I [ , , , I
Polymerization Solid
Figure 0-11. UV Curing Process
=e: Reference (3) -
non-apparel related fabrics and fibers such as tire cords, can be treated with UV-curable coatings. Commercial uses of UV processing in the textile industry are limited to the coating of non-apparel fibers and fabrics. reasons textile manufacturers coat fibers with various coating materials are to enhance lubricity, to impart greater strength to fibers, and t o improve adhesibility when fibers are being resinated.
The main
As with many applications of new or emerging technologies in the textile industry, secrecy is a major barrier to obtaining information about the commercial status of the technology. Some manufacturers of UV equipment admit to having worked with textile customers but will not divulge the nature of the applications. textile industry but the information is proprietary. In many instances these textile companies enter into secrecy agreements with equipment manufacturers.
Some textile companies are working on UV processing in the
Research, development, and testing remain to be done before ultraviolet processing in textile applications can reach the stage of commercial maturity. Textile companies, UV equipment manufacturers, and, to a large extent, research institutions need to collaborate on expanding the potential applications in the textile industry because the benefits of such applications
D-33

could be considerable. transformation of a liquid on a substrate to a solid coating. simple drying (in which pigments or other coating materials originally in suspension or solution in a solvent are left on the surface when the solvent is evaporated), curing involves a change in the molecular structure of the coating to render it solid. conventional curing methods.
Ultraviolet radiation can induce the rapid In contrast to
UV curing offers a number of advantages over These advantages include:
0 Rapid drying and curing speeds (seconds compared to minutes)
0 Reduction or elimination of organic solvents, thus eliminating air pollution and incineration problems
0 Reduction or elimination of conventional drying ovens and incinerators
0 Increased production rates
0 More efficient use o f coating materials due to reduced penetration into substrates
Savings in space of application equipment
Applicability to products that cannot be manufactured by any other processing technique (for example, products and materials that are sensitive to heating such as synthetic fibers).
0
0
EQUIPMENT
The major lamp systems in commercial use today are as follows (see Figure D 4 2 ) :
0 Low-pressure mercury vapor lamps
0 Medium-pressure (1 to 2 atmospheres) electrode-activated mercury vapor lamps
Medium-pressure mercury vapor lamps activated by microwave energy radiation, thus not requiring electrodes
Pulsed or flash xenon gas arcs
Hybrid xenon/mercury vapor lamp systems.
0
0
The most common industrial UV lamp source i s the medium-pressure mercury lamp. In this lamp, ionization is produced by a high-voltage discharge through a gas-filled tube. between electrodes or by placing the gas in a microwave field for electrodeless operation.
The discharge is produced either by positioning an arc
D-34
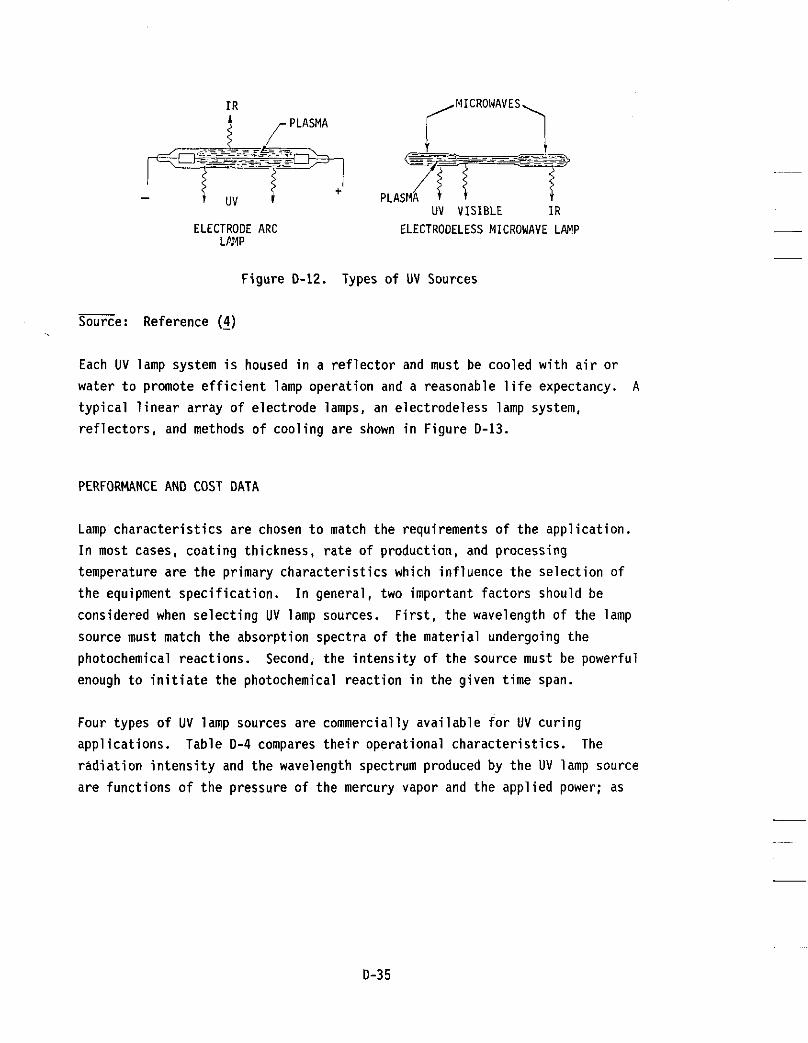
f '1 I R t ,-PLASMA
ELECTRODE ARC ELECTRODELESS MICROWAVE L M P LPJ4P
Figure 0-12. Types of UV Sources
=e: Reference (5)
Each UV lamp system is housed in a reflector and must be cooled with air or water to promote efficient lamp operation and a reasonable life expectancy. typical linear array of electrode lamps, an electrodeless lamp system, reflectors, and methods of cooling are shown in Figure D-13.
A
PERFORMANCE AND COST DATA
Lamp characteristics are chosen to match the requirements o f the application. In most cases, coating thickness, rate of production, and processing temperature are the primary characteristics which influence the selection of the equipment specification. In general, two important factors should be considered when selecting UV lamp sources. source must match the absorption spectra of the material undergoing the photochemical reactions. Second, the intensity of the source must be powerful enough to initiate the photochemical reaction in the given time span.
First, the wavelength of the lamp
Four types of UV lamp sources are commercially available for UV curing applications. Table D-4 compares their operational characteristics. The radiation intensity and the wavelength spectrum produced by the UV lamp source are functions of the pressure of the mercury vapor and the applied power; as
D-35
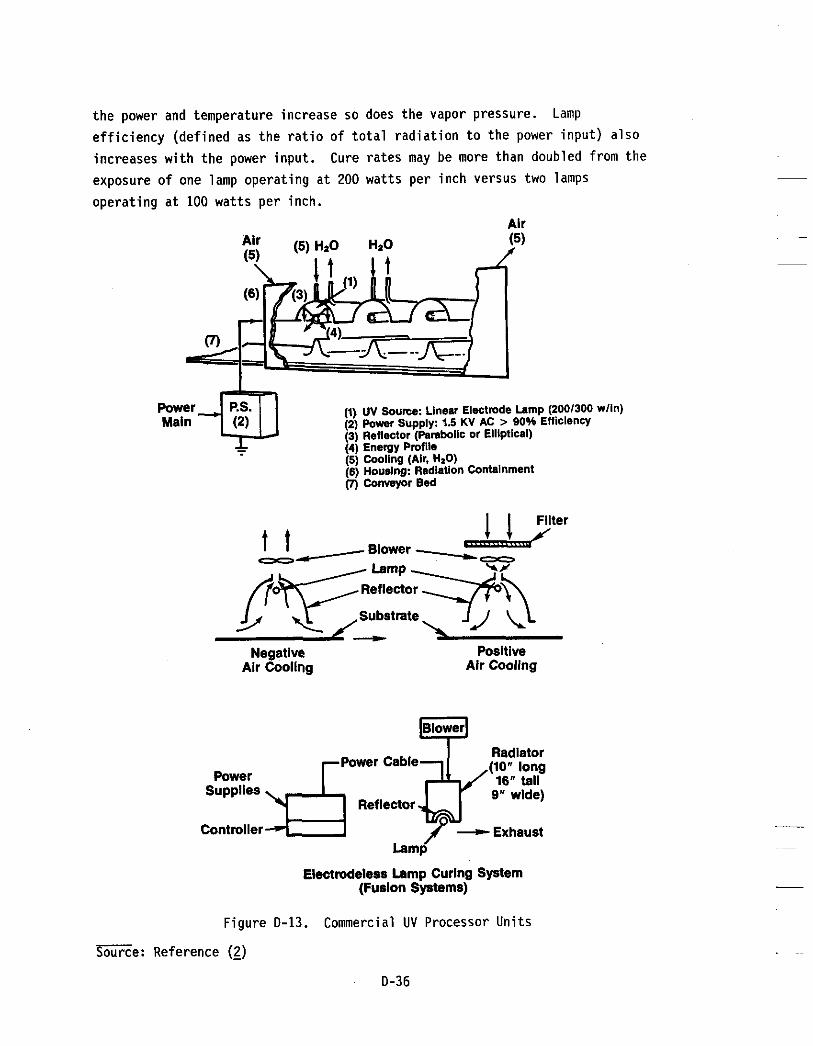
t he power and temperature increase so does the vapor pressure. e f f i c i e n c y (def ined as the r a t i o o f t o t a l r a d i a t i o n t o the power input ) a lso increases w i t h the power input. exposure o f one lamp operat ing a t 200 watts per inch versus two lamps operat ing a t 100 watts per inch.
Lamp
Cure ra tes may be more than doubled from the
Air Air (5) H2O H20 (5)
(I) UV Source: Linear Eleclmde Lamp (200/300 w/ln) (2) Power Supply: 1.5 KV AC > 90% Eflicienw (3) Reflector (pamboiic or Elliptical) - (4) Energy Profile (5) Cooling (Air, HIO) (6) Housing: Radialion Containment (7) ConWOr Bed
Main
I I Filter J t t -00
t t Blower 00-
Substrate
Negative Air Cooling
Positive Air Cooling
Radiator (10" long 16" tall
9" wide)
Controller -Exhaust
Reflector
Eiectrodeiess lamp Curing System (Fusion Systems)
Figure 0-13. Commercial UV Processor Un i ts
=e: Reference (2) D-36

Table 0-4
UV LAMP OPERATING CHARACTERISTICS
Lamp Temp.
Lamp Power
Arc Lengths
Bulb Shapes
Relative System Costs
El ectrode-Act i vated Mi cruwave Low-Pressure Medium-Pressure Energized
Mercury Hercurv Mercury
Cool High High
1 - 10 Watts/In. 100 - 400 Watts/In. 300 Watts/In.
10 - 75 Inches 1-1/2 - 77 Inches 10 Inches
Linear, Linear, Curved Linear Ci rcu 1 ar
LOW Moderate High
Flash Xenon
Moderate (Water Cooled)
.1 to 10 Kilo- Watts Peak Power
.6 - 30 Inches
Linear. Circular, Hclica1
High
Input Power 1 - 10 Watts/In. 110 - 440 Watts/In. 550 Watts/In. -- Lamp Warranty 17,500 Hours 1.000 Hours 3,000 Hours 1.000 Hours
Major Output Wavelengths
Spectral Variations
Spectral Efficiency
Radiant Efficiency
Overall Efficienty
Practical Limits
(m) 254 365. 436, 546. 365, 636. 450
580 546, 580
none Moderate Extensive Limited
Excellent Good Very Good Poor
Very Good Good Fair Poor
Fair Good Good Poor
Low Intensity None Limited Sizes Low Efficiency
=e: R e f e r e n c e (2)
D-37

I n mercury lamps, the plasma which produces the UV energy i s enclosed i n a quartz envelope. This quartz envelope acts as a f i l t e r , absorbing unwanted wavelengths, espec ia l l y the i n f r a r e d (IR) po r t i on o f t he spectrum contained i n the lamp. app l i ca t ions requ i re t h a t substrate temperature should be maintained a t a
given leve l .
F i l t e r i n g o f I R wavelengths i s important because some cur ing
For special app l i ca t ions , e.g., where a high degree o f r a d i a t i o n penet ra t ion i s required, pulsed xenon- f i l l ed lamps are used. The UV spec t ra l output o f the xenon lamp can be s h i f t e d by varying the capacitance and the lamp voltage. Pulsed xenon lamps can be s ta r ted , stopped, and res ta r ted i n s t a n t l y wi thout warm up time.
Curing Speed
The main advantage o f UV cur ing i s t he rap id cur ing t h a t UV can e f f e c t . speed, determined by the number o f UV lamps required t o cure a product a t a given l i n e speed, i s an extremely complex ca lcu la t ion . o f ten d i f f i c u l t t o design. fac to rs :
Cure
Q u a n t i t a t i v e t e s t s are Generally, cur ing speed depends on the fo l l ow ing
0 The chemical compound. Each monomer w i l l cure a t a d i f f e r e n t ra te , depending on i t s composition, t he type and amount o f s e n s i t i z e r pigment, and add i t i ves used. A l l o f these are determined by the manufacturer o f t he compound.
The thickness o f coating. The amount o f UV energy i ns ide a l aye r o f coa t ing decreases exponent ia l ly w i t h the depth.
cu r ing r a t e increases w i t h the UV energy per u n i t surface area. cure lamps should have the highest power-to-size r a t i o a t ta inab le w i thout s a c r i f i c i n g t h e i r l i f e t i m e o r r e l i a b i l i t y . lamp's r e f l e c t o r and i t s he igh t above the product a f f e c t the i n t e n s i t y o f the UV energy. A r e f l e c t o r f o r which UV energy i s concentrated on a small area can a f f o r d f a s t e r cur ing than a r e f l e c t o r t h a t f loods an area w i t h a uni form d i s t r i b u t i o n o f energy.
fo rmula t ion and substrate cha rac te r i s t i cs such as type and c o l o r o f ma te r ia l , temperature, pretreatment, and thermal capaci ty ( s p e c i f i c heat), can a lso in f luence the cur ing speed.
0
0 The i n t e n s i t y o f UV energy. Up t o a c e r t a i n sa tu ra t i on po in t , t he
The shape o f a
UV
0 Addi t iona l Factors. The method o f coat app l i ca t ion , chemical
D-38

Capital Costs
Complete UV system costs include the lamp system, shielding, shutters, cooling system, and installation cost. Typically, these costs are amortized over five years and represent about 25 percent of the hourly operating costs. Generally, capital cost for conventional gas curing systems are nearly four times higher than equivalent UV systems, and one-fourth of this expenditure is for the incinerator required to dispose of the solvent vapor.
Since most of the UV curing systems are custom made, their prices are influenced by many factors such as type, number, and length of lamps; type of shielding; cooling method (water versus air); and type of power supply and safety interlocks. than air cooled ones. system i s as follows:
For example, water-cooled UV systems are more expensive In general, the capital cost for each type of UV lamp
Low-pressure mercury lamp systems have selective markets for surface curing and in some cases total curing of temperature-sensitive and troublesome substrates. A typical one-lamp low-pressure mercury system costs $215.
Typical multiple-lamp systems cost anywhere between $2,700 and $19,400 depending on number and lamp length.
Electrodeless systems have two standard size modules (6" or lo"), and cost approximately $3,200 for the 6-inch compared to $7,500 for the 10-inch lamp module.
An Xenon system complete with lamp, power supply, water cooling system, and reflector costs approximately $4,300 depending upon lamp length and additional options.
Operating Costs
The most significant operating costs in any curing application are material, maintenance and labor, and energy costs.
Material Cost. UV curing applications. 1.75 times as expensive per pound as conventional solvent-based coatings. the other hand, UV coating materials are entirely convertible to solids with no wasted solvent to evaporate from the coating film. coating material used per unit stock and offsets the higher price for the UV coating material. Also, since the UV-curing process is very well controlled,
The coating material is the most critical cost element in the Coating material for UV curing applications is 1.1 to
On
This results in less
D-39

material loss due to the rejection of poor quality output is less than conventional curing processes.
Maintenance and Labor Costs. Burned out lamps and electrical components (i.e., ballasts, magnetrons, etc.) must be periodically replaced or cleaned. Lamp replacement costs generally represent 10 to 25 percent of the total operating costs for UV systems. The normal life expectancy for most UV lamps is 1,500 hours based on one shift per day of operation. electrodeless UV lamps have about 100 percent greater operating life than conventional electrode lamps (1,500 vs. 3,000 hours for electrodeless lamps). The cost of replacement lamps varies considerably, depending on their length and type. Electrodeless lamps require the replacement of the magnetron power tubes in the 4,000- to 6,000-hour range, and cost approximately $75, whereas in conventional (electrode) lamps, ballasts are replaced and usually cost approximately $100 each.
Usually, the
The operating labor cost for UV systems is roughly 33 percent less than that o f similar gas systems because UV systems are mechanically less complex and skilled labor is not required.
Enerqy Cost. energy required by equivalent conventional gas units. Gas systems are less efficient than the UV systems. percent of the total operating costs.
Typically, UV curing units use approximately 25 percent of the
Typically, electricity represents 30-40
Power Requirements
Many factors influence the power requirements, such as type of substrate, lamp source, coating material, and cooling and ventilation rates. Generally, the total power required is determined by multiplying the lamp intensity (expressed in watts per inch), times the lamp length, times the total number of lamps in the system. exchangers as well as ballast inefficiencies can generally be accounted for by including a safety factor, usually from 20-40 percent of the required power. For most ultraviolet drying applications, energy use is about 0.5 to 1 kW per inch width of substrate for each drying position in the press.
The power required for air blowers and/or heat
0-40

REFERENCES
1.
2.
3.
4.
5.
Baer, G.F.,"UV Curing - An Overview," SME Technical Paper FC83-248, Dearborn, M I , 1983.
Battelle Columbus Laboratories, Radiation Curing: State-of-the-Art Assessment, Electric Power Research Institute, Report EM-4570, Palo K l t o , J u n e 1986.
Fusion Systems, "Fusion Systems Ultraviolet Curing, Advanced Technology for Tomorrow's Benefits Today," Rockville, MD.
Schmidt, Philip S . , Electricity and Industrial Productivity, Electric Power Research Institute, Report EM-4630, Palo Alto, CA, May 1983.
Spero, D.M., "Choosing UV Hardware--Promises, Performances, Prices," ASM Technical Paper FC78-545, Dearborn, M I , 1978.
0-41

MICROWAVE PROCESS I NG
BASIC PRINCIPLES
Microwave is the name given to the radio-frequency portion of the electromagnetic spectrum between 300 and 300,000 MHZ. In an effort to avoid conflict with communication applications using microwave frequencies, the Federal Communication Commission (FCC) has set aside several frequency bands for microwave heating. almost exclusively . Of the allowed frequencies, 915 and 2,450 MHZ are used
Microwave processing uses microwaves to heat electrically non-conducting materials (dielectrics) composed of polar molecules. dielectric with polar molecules is water, and many microwave applications are used to heat or dry moist materials. electrical structure--much like miniature magnets--and tend to a1 ign themselves in an imposed electric field, as shown in Figure D-14. When the direction of the electric field is alternated rapidly (at high frequencies) these polar molecules tend to move in synchronization with the field, creating friction between molecules and thus producing heat from within the material. This principle is referred to as dielectric heating, and is also performed by radiofrequency equipment.
The most common
Polar molecules have an asymmetric
Dipolar molecules t . Alternating electric field +
Figure D-14. Schematic Representation of Dielectric Hysteresis Heating
D-42

Microwaves are produced by magnetron tubes, which are comprised of a rod-shaped cathode within a cylindrical anode. magnetron, electrons flow from the cathode to the anode, setting up an electromagnetic field (both electric and magnetic fields). the field is determined by the dimensions of the slots and cavities which line the walls of the anode. When power is supplied to the magnetron, oscillations i n the slots and cavities form microwaves.
When power is supplied to the
The frequency of
TEXTILE APPLICATIONS AND COMMERCIAL BENEFITS
Textile industry applications of microwaves fall into two categories: the removal of moisture from fibers and the heating of solids and liquids used to coat, dye, or otherwise process fibers, fabrics, and floor coverings. Microwaves have been used for finished drying of carpets and to dry different samples of textile fibers (polyester and cotton fibers) and lubricants. Application of microwaves for sample testing can provide a fast and effective method of determining the moisture content of particular fabric and fiber types and their response to drying. efficient drying of products with high moisture content (microwaves can cause undesirable boil-up), microwave drying is more efficient when used to dry products with lower moisture contents. can be used to speed up drying after moisture levels drop. been used to reduce all the moisture from pillow stuffing to flatten these pillows for packaging. These pillows are later puffed to their original shape without any wrinkling.
While conventional heating provides
Figure D-15 illustrates how microwaves Microwaves have
Microwave heating can effectively augment conventional heating in some
heat can pump moisture to the surlaoe 04 a product where it can be evaporated mole
antmi applications. For example, microwave
efficiently byaconventional hot air system. But when a product has a moisture content of 50% or more.
n.rm microwave heating might cause I I undesirable boilina
Figure D-15. Comparison of Microwaves and Conventional Drying
D-43

The t e x t i l e indus t ry , dr iven almost e n t i r e l y by economics, has been slow t o respond t o microwave technology appl icat ions. apply ing microwaves i n t e x t i l e app l i ca t ions i s t he lack o f a de ta i l ed assessment o f t he economics. cost standpoint. used i n t e x t i l e heating, drying, and cur ing appl icat ions. Microwave use i n o ther i ndus t r i es w i t h app l i ca t ions s i m i l a r t o t e x t i l e drying, f o r example, d ry ing o f inks i n the p r i n t i n g indus t ry , has demonstrated the convenience and speed o f microwaves.
processing has been shown t o enhance p r o d u c t i v i t y because i t can heat t h i c k sections o f mater ia l and heat mater ia ls t h a t are sens i t i ve t o h igh temperatures such as syn the t ic f i b e r s and heat-sensi t ive dyes.
One o f the major problems w i t h
Microwave equipment i s expensive from a c a p i t a l E l e c t r i c i t y i s more expensive than the o ther energy sources
I n add i t i on t o convenience and speed, microwave
Increased compet i t ion i s now fo rc ing the t e x t i l e indus t ry t o look f o r ways t o increase p r o d u c t i v i t y and decrease costs. i n t e r e s t i n a v a r i e t y o f i n d u s t r i a l heat ing appl icat ions. bene f i t s o f microwave processing inc lude increased production, decreased energy consumption, reduced mater ia l loss, as we l l as space and labor savings, provided the app l i ca t i on i s su i tab le f o r microwaves. Since the moisture l e v e l o f f a b r i c s and f i b e r s t h a t have been d r ied i s c r u c i a l t o t e x t i l e product q u a l i t y , t he use o f microwaves t o measure moisture l e v e l s i n t e x t i l e products i s one valuable app l i ca t i on o f microwaves i n the t e x t i l e indus t ry . comparison i n Table D-5 shows microwaves have some advantages over conventional d ry ing methods. increased product ion volume w i t h reduced processing time. successful app l i ca t i ons t y p i c a l l y requ i re any o f the fo l low ing :
0 Heating t h i c k sections o f mater ia l
0 Heating temperature-sensit ive mater ia ls
0 Heating expensive mater ia ls w i th reduced mater ia l loss, leading t o s i g n i f i c a n t cos t savings
Convert ing a batch process t o continuous o r semi-continuous.
This has helped t o b u i l d a new I n general,
The
The reduct ion i n d ry ing t ime can lead t o P o t e n t i a l l y
0
D-44

Table D-5
COMPARATIVE MICROWAVE DRYING DATA
MATERIAL MICROYAVE D R Y I N G A I R OVEN DRYING
T X Weight Moisture Drying Tim Moisture Drying Tim (9) (Z) (Win) ( X ) (nin)
Polyester Fiber 12 4 4 4 60 Cotton F i k r 4 7 a 7 60 Text i le Lubricant 3 25 10 25 60
- Source: Reference (2)
Microwaves have a higher power densi ty than radiofrequency (RF) waves, and thus microwave systems genera l l y heat f a s t e r than RF systems. achieve a slower, more uni form heat ra te , which i s i dea l f o r la rger , t h i c k e r objects. Although there i s p o t e n t i a l f o r competit ion between the two electrotechnologies, i n most app l i ca t ions one i s b e t t e r su i ted than the other and genera l l y each competes against conventional ovens. I n add i t ion , t he average microwave system i s about 50 kW, i n contrast t o a t y p i c a l RF system, which i s about 100 - 300 kW. var ied and commercialized than those o f microwaves.
RF systems
To date, t e x t i l e app l i ca t ions o f RF are more
Unfortunately, the t e x t i l e app l i ca t ions o f microwaves t h a t have reaped successful r e s u l t s have not been published by the companies. reasons there are many wel l -kept t rade secrets i n the t e x t i l e indus t ry . Laboratory t e s t s o f microwave processing i n the t e x t i l e indus t ry have ind ica ted some techn ica l l i m i t a t i o n s (e.g., dye migra t ion) , and the high c a p i t a l costs o f microwave equipment may pose economic ba r r i e rs . l i m i t a t i o n s are no t insurmountable. A concerted research and development e f f o r t together w i t h commitments from the t e x t i l e industry, microwave equipment manufacturers, and u t i l i t i e s can help accelerate the
For compet i t ive
But these
D-45

commercialization of microwaves. of the inherent benefits of microwave processing for those applications to which they are suitable.
In this way textile firms can realize some
EQUIPMENT
The microwave processing system is comprised of four basic components:
A generator. Includes the power supply unit and magnetron(s). The magnetron generates microwaves from electricity produced by the power supply. Prone to overheating, the magnetron is typically air- or water-cooled.
An applicator. directs them to the product. waveguides to direct the microwaves, and can also include one-way shields that prevent microwaves from reflecting back through the waveguide, possibly damaging the magnetron.
Materials Handling Equipment. applicator. In continuous processing systems, the materials handling system guides the product through the exposure area. processing systems (similar to home microwave ovens) have no materials handling system, and depend on an operator to remove processed products.
System Controls Monitor and Regulator. and heating while protecting against overexposure, the controls should regulate exposure time and/or material-hand1 ing speed.
Receives the microwaves from the generator and The applicator consists of one or more
Positions the product under the
Batch
To ensure adequate drying
PERFORMANCE AND COST DATA
Prior to specifying microwave equipment, several characteristics that affect heating requirements should be known, including:
Production rate (yards or feet per minute if web drying, products per hour if drying spools)
0 Material being processed
0 Weight of each product
0
0 Desired rise in temperature
Specific heat of the product
0 Dielectric properties (if application is not drying or heating water).
0-46

Determination o f Heating Requirements
The f i r s t step i n spec i fy ing microwave equipment i s t o determine the heat ing required by the app l ica t ion . microwave generator power requirements. I n d ry ing app l ica t ions , however, the power requirement can be estimated by using the percentage moisture and product weight (see next sect ion). There are a t most f ou r types o f heat requirements:
This step i s necessary t o determine the
1) The heat requ i red t o r a i s e the dry mater ia l up t o processing temperature, ca lcu la ted by the product o f t he weight o f the pa r t , the s p e c i f i c heat o f the p a r t , and the desired r i s e i n temperature.
The heat requ i red t o r a i s e the v o l a t i l e matter ( f l u i d being dr iven o f f , e.g., water) up t o processing temperature. heat requ i red t o do so i s ca lcu la ted by the product o f the i n i t i a l moisture percentage, product weight, s p e c i f i c heat o f t h e v o l a t i l e , and the r i s e i n temperature. I n non-drying app l ica t ions , t h i s heat i s no t requ i red since there i s no v o l a t i l e .
The heat requ i red t o vaporize (d r i ve o f f ) t he v o l a t i l e matter. This i s dependent on the heat o f vapor izat ion o f t he v o l a t i l e (970 B tu / l b f o r water). weight, 'percentage moisture, and heat o f vapor izat ion.
Heat losses t o the surrounding a i r o r machinery. achieved when the product absorbs the f u l l output o f the microwave system. By c a r e f u l l y con f igur ing the app l ica tor , t he amount o f microwaves not absorbed by the product can be minimized.
2) The quan t i t y o f
3)
This quan t i t y o f heat i s the product o f t he product
4) Peak e f f i c i e n c y i s
The t o t a l heat requ i red t o d ry o r heat the app l i ca t i on i s t he sum o f these fou r components. By m u l t i p l y i n g by the production ra te , i n products per hour, the hour ly BTU requirement can be estimated.
Determination o f Power Requirements
To convert t he heat requirements i n t o power requirements, the hour ly Btu
requirement must be d iv ided by 3412 ( the Btu per kWh equivalent) . conversion y i e l d s the generator kW output. required t o evaporate 100 lbs o f water per hour. be requ i red o r about 311 kWh. p o r t i o n o f t he energy from the MW generator reaches the product. d ry ing app l ica t ions , a rule-of-thumb i s t h a t the power requirements are ca lcu la ted a t 1 kW f o r every 2.5 l bs o f water removed per hour. Due t o the h igher cost o f e l e c t r i c i t y i n comparison w i t h o ther energy sources, t e x t i l e
T h i s For example, 1,000 Btu per l b i s
Therefore, 100,000 Btu w i l l This must be adjusted because on ly a c e r t a i n
I n microwave
D-47

f i rms are genera l l y w i l l i n g t o inves t only i n small-sized e lec t r i c -based equipment, genera l l y , those w i t h i n the 30-50 kW range unless the bene f i t s o f a
l a r g e r u n i t are unequivocal ly demonstrated.
App l ica tor Desisn
In microwave app l ica t ions , con f igur ing the app l i ca to r t o provide high e f f i c i e n c y , uniform, and r a p i d heating i s c r i t i c a l l y important. App l ica tor design i s a tomplex f i e l d , i nvo l v ing the i n t e r a c t i o n o f heat t r a n s f e r , mass t rans fe r , and electromagnetics. I n establ ished app l ica t ions such as bacon cooking, pasta drying, and rubber heating, manufacturers have standard app l i ca to r designs which provide h igh l y e f f i c i e n t transmission o f t he microwaves. However, i n newly developed app l ica t ions , t he app l i ca to r may requ i re a custom design.
Capi ta l Costs
One o f t he major disadvantages o f microwave systems i s the high c a p i t a l costs. Most microwave systems cost between $2,000 and $4,000 per kW. systems may cos t less per kW capacity. type o f operat ion ( i .e., batch o r continuous). For a 40-kW u n i t , continuous-type systems would t y p i c a l l y cost between $100,000 t o $160,000 ( o r from $2,500 t o $4,000 per kW). The same sized u n i t may cost on ly $50,000 f o r batch-type operat ion. The continuous-type system requires a mater ia ls handling system, as we l l as much more complex cont ro ls . A standard s i ze u n i t i s about 50 kW. Appl icat ions requ i r i ng 300 kW are genera l l y b e t t e r su i ted t o conventional ovens due t o the d i f fe rence i n c a p i t a l costs.
Very l a rge Much o f t h i s variance i s due t o the
Operatinq Costs
In s p i t e o f h igh c a p i t a l cost , there have been a number o f app l i ca t ions where microwave d ry ing and heat ing has proved t o be economical. However, operat ing cost can vary by p lan t , and an evaluat ion o f cur ren t operating costs i s
requ i red to evaluate the p o t e n t i a l bene f i t s o f microwave processing.
Labor Costs. Labor costs are o f ten lower w i th a microwave heater than w i th conventional methods o f heating. This i s a r e s u l t o f decreased operator

involvement. unload. microwave heaters or with other machines. operate completely unattended. due to the automated controls necessary for unattended operation.
In many applications only one operator is required to load and Other applications may share the operator costs among several
Some installations are equipped to These systems may have higher capital costs
However, any operating labor savings may be partially offset by an increase in maintenance requirements. Magnetrons, the critical component of the generator, have a limited life (requiring replacement every 6,000 hrs.). 50-kW magnetron costs about $60,000, bringing additional maintenance charges to about $1 per hour of operation. for maintenance could decrease the operating labor savings.
A
As a result, the labor and parts required
Enerqy Costs. actually reaches the product. times the power reaching the product, or generator output. Thus a generator with a 50-kW output would require about 100-kW power input. o f a 50-kW microwave system would be about $44,000 annually (based on 100 kW power input, 8,760 hours per year operation--as many textile plants operate 3-shift operations 7 days a week--and $0.05 per kWh). application well suited to microwaves can save 30 to 50 percent in energy costs compared to conventional gas-fired ovens.
Approximately 50 percent of the power input to the generator As a result, the power required is about 2
The energy costs
In general, an
Material Costs. production or decrease in processing time. deterioration of the product due t o the shorter time exposure, but also reduces work in process inventory. Also, the oven temperature need only reach the minimum temperature (in drying applications the boiling point of water), thus the product is never exposed to high heat. exposure to high temperature, the amount of.product loss due to overheating can be significantly reduced with microwave processing.
One of the major advantages of microwaves i s the increase in This not only reduces heat
As a result of.decreased
Space Savings. conventional ovens. resulted by installing microwave systems. quantify, the value o f reducing space requirements should be considered when evaluating microwave systems.
Microwave systems take up much less floor space than Reduction in space requirements of up to 75 percent have
Although sometimes difficult to
D-49

REFERENCES:
1. O r f e u i l , M., E l e c t r i c Process Heatinq, EPRI Report EM-5105-SR, B a t t e l l e Press, Columbus, OH, 1987.
2. CEM Corporation, Company brochure on Microwave So l ids and Moisture Analyzer, Mathews, North Carol ina.
3. Thermo Energy Corporation, Microwave Power i n Industry, E l e c t r i c Power Research I n s t i t u t e , E P R I EUM-3645, Palo A l to , CA, August 1984.
4. Thermo Energy Corporation, Radio-Frequency D i e l e c t r i c Heatinq i n Indus t ry CA, Mar& 1987.
E l e c t r i c Power Research I n s t i t u t e , Report EM-4949, Par0 A l to ,
D-50