text and the paper as it appeared. tornado forecasting: a
TRANSCRIPT

Published in: The Tornado: Its Structure, Dynamics, Prediction, and Hazards (C. Church et al., Eds.), GeophysicalMonograph 79, Amer. Geophys. Union, 557-571. Note: The references have been updated from the original to includepage nos. for "in press" articles and to make some minor corrections. There may be some slight variances between thistext and the paper as it appeared.
Tornado Forecasting: A ReviewCharles A. Doswell III
National Severe Storms Laboratory, Norman, Oklahoma73069
Steven J. Weiss and Robert H. Johns
National Severe Storms Forecast Center, Kansas City, Missouri 64106
1. INTRODUCTION
Present-day operational tornadoforecasting can be thought of in twoparts: anticipation of tornadic potentialin the storm environment, and recogni-tion of tornadic storms once they de-velop. The former is a forecasting issue,while the latter is associated with warn-ings (or so-called nowcasting). This pa-per focuses on the forecasting aspect oftornadoes1, by dealing primarily with therelationship between the tornadic stormand its environment. We begin with ashort history of tornado forecasting andrelated research in Section 2, while Sec-tion 3 provides an overview of currenttornado forecasting procedures withinthe Severe Local Storms (SELS) Unit atthe National Severe Storms ForecastCenter (NSSFC). Section 4 gives a shortsummary of 35 years of SELS tornadoand severe thunderstorm forecast verifi-cation, while Section 5 describes ourcurrent understanding of the connectionbetween tornadoes and their environ-ment. We conclude in Section 6 withour thoughts about the future of tornadoforecasting.
2. SHORT HISTORY OF TORNADOFORECASTING
Our historical review necessarilymust be brief; interested readers canconsult Schaefer (1986) for additionaldetails about the history of severe 1 Recognition and detection issues willbe treated elsewhere in this volume, byBurgess et al. (1992).
weather forecasting in general; anotherreview by House (1963) is somewhatdated, but provides excellent backgroundmaterial. Although tornado forecastinghas its roots in the 19th century, stem-ming mostly from the work of J.P. Fin-ley (see Galway 1985 for more on Fin-ley), it wasn't until the early 1950s thatserious tornado forecasting began. Be-fore then, the use of the word "tornado"in public forecasts was prohibited,largely because of the perception thattornado forecasts would cause publicpanic. It is clear that modern tornadoforecasters owe a great deal to the pio-neering efforts of Ernest Fawbush andRobert Miller (1952, 1954), two AirForce officers who had some early tor-nado forecasting successes at Tinker AirForce Base in Oklahoma in the late1940s. On the civilian side, work wasproceeding (e.g., Showalter and Fulks1943, Lloyd 1942), but until 1952 thecivilian weather service (then called theWeather Bureau) still was reluctant touse the word "tornado" in any forecast.The successes of Fawbush and Millerclearly paved the way for a civilian tor-nado forecasting program.
The first civilian tornado forecastsbegan with the formation of a special-ized unit as part of the Weather BureauAnalysis (WBAN) Center in Washing-ton, D.C. during March of 1952 (seeGalway 1973, 1989 for more details).This unit became the Severe LocalStorms (SELS) Center in early 1953, andmoved to Kansas City, MO in August1954, eventually forming part of the Na-tional Severe Storms Forecast Center(NSSFC) in 1966.

2
When SELS first came into being,the relationship between the synoptic-scale environment and the tornado wasnot well understood; forecasting wasessentially empirical. Various forecast-ers and researchers observed that certainmeteorological elements, detectablewithin the large-scale data networks(surface and aloft), tended to be presentin many tornado events (e.g., Fawbush etal. 1951, Beebe and Bates 1955). These"features" included static instability, sig-nificant extratropical cyclones, abundantlow-level moisture, jet streams, surfaceconvergence boundaries, and so forth.
Early on, however, it became clearthat no single set of such features waspresent with each and every tornadoevent; rather, particular collections ofelements were associated with particulargroups of cases. In effect, pattern rec-ognition became the basis for forecast-ing. This approach was applied to syn-optic maps and vertical soundings to de-velop what Schaefer (1986) calls a"forecast rote." The essential referenceon this forecasting approach is Miller(1972), which describes map typescommonly associated with major severeweather outbreaks. The notion of indi-cating the location and orientation of thevarious features of interest on a singlemap, the so-called composite chart (Fig.1)2 is the cornerstone of the forecast rote.Another form of this method is thechecklist (also described in Miller 1972),as shown in Fig. 2.
2 It is noteworthy that the compositechart, as employed in severe weatherforecasting, specifically attempts to es-tablish the interaction between featuresaloft and at the surface. Thus, it is aproduct with a long history of addressingwhat Mass (1991) considers a commondeficiency in synoptic analysis; namely,the failure to depict 3-dimensional rela-tionships among features at differentlevels.
Fig. 1. An example of a composite chart; in thiscase it is a composite prognosis, depicting 12 hforecast positions of surface and upper air fea-tures at 0000 UTC 27 April 1991 based on initialdata from 1200 UTC 26 April 1991. Black sym-bols are conventional surface frontal features,green lines denote 50 and 70% mean (surface to500 mb) relative humidity, red streamlines are at850 mb with a 50 kt maximum indicated, bluestream line is the 500 mb jet stream axis, with a76 kt maximum indicated, the blue dashed fron-tal symbols depict 500 mb thermal trough axes,and the orange lines are isopleths of the forecastlifted index.
Fig. 2. Example of a checklist for severeweather.

3
Unfortunately, there was little in-formation in this approach that allowedforecasters to make a direct connectionbetween what they saw in their analyzedweather data and the storms responsiblefor producing the tornadoes. On thescale of a weather map, a tornado is amicroscopic dot. There is no informa-tion on a weather map distinguishing atornadic from a non-tornadic storm, ex-cept insofar as there is some associationbetween the storm and its environment.
What weather map typing gives oneis an association, but it does little to ex-plain cause and effect. What was thebasis for making the operational distinc-tion between tornadic and non-tornadicsituations? For forecasting purposes, theconnection between the storm and itsenvironment has been and largely re-mains by means of a synoptic climatol-ogy, generally derived quite subjec-tively.
When the techniques of the 1950swere being developed, there was littlecomprehension of the structure andevolution of tornadic storms and whatrelationship existed between the tornadicstorm and the tornado. Weather radarswere a brand-new technology, and noscientific basis existed to use a radar forunderstanding tornadic storms, muchless detecting them when present. Real-time radar in a national tornado fore-casting unit was a distant dream, as werereal-time satellite views of storms andcomputer-based analysis and forecasting.
The radar observations of the 1950screated a great deal of interest in learn-ing more about tornadic storm structureand evolution. Research surfacemesonetworks had been established inthe early 1950s to pursue some ideasabout tornadoes (e.g., Tepper 1950,1959), but radar rapidly became the pri-mary means for observing tornadicstorms. Thus, while forecasters concen-trated on empirical methods based onsynoptic scale surface and upper air data,the focus of tornado-related researchdealt with storm-scale processes as re-vealed by radar. This schism betweenresearch and operational goals grew withtime; by the early 1960s, an institution-
alized fission of the tornado research andforecasting communities was createdwith the establishment of the NationalSevere Storms Laboratory from theWeather Bureau National Severe StormsProject (see Staff, NSSP 1963) in 1964.
The research produced a picture ofthe tornadic storm as a "supercell" (asdetailed in Browning and Fujita 1965), atype of convective storm which differedsignificantly from other, non-tornadicstorms in its radar structure and evolu-tion. While it became apparent that notall supercells produced tornadoes, andnot all tornadoes came from supercells(see Doswell and Burgess 1992), super-cells clearly were prolific tornado pro-ducers in comparison to other convectivestorms.
In these pioneering studies, it alsowas found that supercells favored certainenvironments, although the reason forthis association remained somewhat un-clear. In spite of these gains, the knowl-edge of tornadic storms developed dur-ing this research was not readily incor-porated in the operational environment;3
research and operations seemed unableto communicate effectively. By con-centrating on different scales and datastreams, most forecasters and research-ers no longer spoke the same language.
By the mid-1970s, numerical cloudmodelling had become capable of fully3-dimensional, time-dependent stormsimulations. We think the flowering ofthese models has signaled the beginningof the end to the barrier separating basicstorm-scale research from operationalforecasting, although this was not widelyrecognized at the time. We believe thisbecause the cloud models can be used toexplore how the characteristic featuresof a simulated storm depend on thelarger environment in which it develops.Subsequent cloud model-based researchindeed has been quite successful in de-veloping the storm-environment con-
3 Some of the research results have hadan impact in some operational detectionand warning programs, although eventhere, progress has been slow.

4
nection for the first time (e.g., Weismanand Klemp 1982, 1984).
Another critical source of insightinto convective storms has been researchDoppler radar observations. WhileBrowning's work (e.g., Browning 1964)made innovative use of reflectivity in-formation to infer storm flow, the de-tailed velocity field information has con-firmed the basic supercell storm struc-tures deduced from non-Doppler radarstudies (e.g., Brandes 1977), and hasbeen quite important in validating con-cepts developed from numerical cloudmodels (see, e.g., Weisman and Klemp1984).
A third important research devel-opment of relevance has been the de-ployment of "storm chase" teams:groups of meteorologists attempting toobserve tornadoes and tornadic stormsfirsthand. This has produced an un-precedented number of detailed visualobservations, including many storms ofthe non-tornadic variety. For the firsttime, scientists have been able to relateevents (tornadic and non-tornadic) ob-served directly in the field to structuresseen in large-scale weather maps. Itshould be obvious that tornado fore-casting is an essential part of a stormchase; thus, storm chasers have becomecontributors to forecasting research (e.g.,Weaver and Doesken 1991, Davies andJohns 1992, Brady and Szoke 1988)
In spite of the proliferation of newtechnologies in the workplace and theburgeoning research developments, thedecades following the 1950s have notseen much change in operational tornadoforecasting techniques. Rather than sup-porting qualitative changes in the waytornado forecasting is done, new ob-serving and analysis tools have beenused to increase the precision and time-liness of the forecasting approaches pri-marily developed in the 1950s. The newobservations most often have been usedto identify new ways to detect severestorms (e.g., the satellite-observed "en-hanced-V" signature noted by McCann1983; see Fig. 3) as well as to enhancerecognition of previously-known ele-ments (e.g., intersecting thunderstorm-
generated outflow boundaries, as in Pur-dom 1982). Although severe storm rec-ognition and detection has been im-proved by the new observations, theirvalue as forecasting tools often has beencompromised by a lack of exploration ofthe times the features were present andyet nothing happened (see, e.g., Stensrudand Maddox 1988).
Fig. 3. Example of an "enhanced-V" signaturefrom a satellite image (from Setvák and Doswell1991), showing the visible appearance (top) andthe enhanced thermal infrared appearance (bot-tom), the latter of which emphasizes the signa-ture.
Moreover, computers have beenused mostly to speed and enhance sub-jective analysis techniques developeddecades earlier (mostly by automateddata plotting), rather than to create newtechniques. In effect, for operationalforecasting, the computer often has beenasked to duplicate electronically whatused to be done manually.

5
In recent years, the research and op-erational sides of tornado forecastinghave begun to collaborate once again.For example, recent research intostreamwise vorticity (Davies-Jones1984) is being applied directly in as-sessing tornado potential (e.g., see Johnset al. 1990, Davies-Jones et al. 1990, andDavies and Johns 1992) operationally.
3. CURRENT SELS TORNADOFORECASTING PROCEDURES
Present-day SELS tornado fore-casting comprises three steps: the "Sec-ond Day Severe Thunderstorm Outlook(hereafter, the DY2 AC), the "First DayConvective Outlook" (hereafter, theDY1 AC), and severe thunder-storm/tornado watches. This suite ofSELS products has evolved over time;they are partially described in Weiss etal. (1980), but for a full description theinterested reader should consult the Na-tional Weather Service Operations Man-ual, Chapter C-40.
The Outlooks (or ACs) are regu-larly-issued (and updated) general fore-casts of relatively large areas of severethunderstorm4 potential. Watches, onthe other hand, are issued only as needed(in the judgment of the SELS lead fore-caster) and are more specific in terms oftiming, location, and expected types ofsevere weather. The basic premise isthat as the time of the event approaches,it is possible to refine the forecasts ofsevere thunderstorm type, timing, andlocation. While this premise seems logi-cal, it is not necessarily valid; the rele-vant scales decrease as the event devel- 4 For official purposes, a severe thu n-derstorm is defined as one which pro-duces one or more of the following: hail> 3/4 in (2 cm) in diameter, measuredwinds > 50 kt (25 m s-1), "damaging"winds (involving some subjective judg-ment of effects required to meet thethreshold), a tornado. Heavy rain, largequantities of sub-threshold hail, funnelclouds, frequent lightning, etc. are notconsidered to meet the official criteria(see discussion in Doswell 1985).
ops, first shrinking from synoptic scaleto mesoscale and then on to the convec-tive storm scale. However, the amountof data available to the forecaster doesnot undergo an increase commensuratewith this scale decrease. It is not un-common for forecasting to become moredifficult as the time of the event ap-proaches (as discussed in Doswell et al.1986). Generally, it is during the watchphase that SELS attempts to distinguishbetween tornadic and non-tornadicstorms.
3.1. Forecasting Procedures: Convec-tive Outlooks
Operational SELS tornado fore-casting employs three general ap-proaches: synoptic pattern recognition,meteorological parameter assessment(checklists), and climatology. These arethe tools that developed historically asnoted in Section 1. Special synopticpattern-specific or geographically-specific situations have been used to de-velop specialized forecasting techniques(for some examples, see Doswell 1980,Hales 1985, Johns 1984, Weiss 1985,Hirt 1985, Weiss 1987) that contribute tothe ACs.
As more is learned about the physi-cal processes resulting in tornadoesand/or severe thunderstorms, parametersconsidered operationally relevant havebeen changing to reflect that new under-standing. Thus, for example, vorticityadvection, emphasized in Miller (1972)and questioned by Maddox and Doswell(1982), is giving way to helicity-relatedparameters, as discussed in Davies-Joneset al. (1990). Continuing efforts to re-fine the climatological information abouttornadoes (Kelly et al. 1979) and non-tornadic severe thunderstorms (Kelly etal. 1985) are aimed, in part, at improvingoperational forecasting; recall that cli-matology, modified by knowledge of thesynoptic pattern, is a traditional basis fordistinguishing tornadic from non-tornadic situations.
For the long lead times of the ACs(up to 52 h in the case of the DY2 AC),the primary input to these products is the

6
numerical weather prediction modelguidance from the National Meteoro-logical Center (NMC), of which NSSFC(and, hence, SELS) is a part. With di-minishing lead times, and especiallywith regard to the watches, diagnosticevaluation of surface and upper-air databecomes dominant over model progno-sis. In conjunction with the analysis ofsurface and sounding data, the remotelysensed data (such as satellite, radar, andlightning ground strike location) thathave become available in ever-growingamounts are increasingly important.These data, especially satellite imagery,are useful in assessing the numericalmodel initial conditions (e.g., Hales1979) and in data voids (most oceanicregions and some sparsely populatedland areas, as well as when conventionaldata are missing or contaminated withconvection).
SELS continues to employ many pa-rameters designed to summarize infor-mation contained in the data; such pa-rameters often are called "indices" (seee.g., Miller 1972, Galway 1956, Show-alter 1953 for some of the myriad ther-modynamic indices measuring static in-stability). Recently, a more comprehen-sive parameter than the traditional indi-ces for static instability is coming intouse in SELS: the Potential Buoyant En-ergy (PBE, also called the ConvectiveAvailable Potential Energy, or CAPE;see Moncrieff and Miller 1976) is the"positive" area on a sounding associatedwith the buoyant part of a lifted parcelascent between the Level of Free Con-vection (LFC) and the Equilibrium Level(see Doswell et al. 1982).
Nearly all the parameters (past andpresent) used on composite charts and/orchecklists can be shown to be associatedwith:
1. Synoptic and mesoscale upward mo-tion2. Sufficient moisture and lapse rate fora parcel to be positively buoyant3. Vertical wind shear structure
Therefore, the scientific connectionbetween the parameters used and the
physical processes can be made, even ifforecasters have not always recognizedthat connection.
A key notion employed in tornadoforecasting is that of "limiting factors".Once a preliminary general threat areahas been defined, it is refined by consid-ering what factors make it unlikely thatsome parts of the original threat areaactually will experience severe weather.Obviously, anything precluding thunder-storms will preclude tornadoes.5 In to r-nado forecasting, vertical wind shearstructure is becoming the key factor indistinguishing tornadic from non-tornadic events, so this becomes a criti-cal limiting factor in delineating tornadothreat areas.
In a few cases (typically fewer thanten days per year), tornado outbreaks areforecast in the ACs. Such forecasts be-gan in the mid-1970s, following the 3-4April 1974 outbreak. A separate publicversion of the AC is issued in suchsituations. Although it is impossible tobe completely general regarding tornadooutbreak conditions that might result insuch an AC, they typically are associatedwith what we call synoptically evidentpatterns. Tornadoes may be mentionedin the outlooks when moderate or greaterthermal instability is likely to be coupledwith favorable vertical wind shearstructures (Davies-Jones et al. 1990,Johns et al. 1990, Leftwich 1990).
3.2. Forecasting Procedures: Watches
The foremost SELS public fore-cast products are the tornado and severethunderstorm watches (an example ofwhich is shown in Fig. 4). These fore-casts usually take the form of quadrilat-erals covering on the order of 20,000 mi2
(about 52,000 km2), and are valid fortime periods of several hours. Somestatistical information about watches in1990 is shown in Table 1. 5 As noted in Doswell and Burgess(1992), some atmospheric vortices arenot associated with deep, moist convec-tion. These are not considered to be tor-nadoes.

7
Table 1. Some facts about SELS watches in1990.
# tornado watches 249# severe thunderstormwatches
496
Average watch duration 4.86 hAverage watch area 76,519 km2 =
29,544 stat.mi2
Median lead time 31 min
Fig. 4. Plot of tornado watch #183 on 26 April1991 (cf. Fig. 5).
In order to convey informationabout SELS forecaster interpretations tothe forecasting community (not to thepublic), SELS Mesoscale Discussions(MDs) are issued as needed. The MDsprovide a narrative of probable weatherdevelopments and possible forthcomingwatch issuance; MDs began in 1986.Another information-conveying, non-public product is the watch-relatedStatus Report, begun in the 1950s, whichhas several aims: to keep the field of-fices informed about severe weatherconditions in and near an issued watcharea, to clear those parts of the watchwhere the severe weather threat hasended, and to provide information aboutadditional, follow-on watches.
In general, SELS forecasters mustdeduce the character of the subsynopticscale processes relevant to severeweather watches from limited opera-tional data: hourly surface observations,satellite images, and radar displays.
These current sources provide the high-est operationally-available space andtime resolution for the task at hand.Subjective surface analyses locate andtrack features believed relevant (seeMiller 1972, Doswell 1982) to tornadoand severe thunderstorm forecasting.These features then are related to thesatellite imagery using the advanced in-teractive computer system calledNSSFC's VAS Data Utilization Center(VDUC, see Browning 1991). Recently,lightning ground strike data have be-come available (Mosher and Lewis1990) and are used in SELS for defining,locating, and monitoring convection, asa supplement to satellite and radar data.
In the past, it was common to dif-ferentiate tornadic from non-tornadicsituations using parameters related to thestrength of the winds aloft (as in Miller1972). This created a seasonal bias tothe frequency of issuing tornadowatches, with increased likelihood of atornado watch in the winter and spring(and to a lesser extent, in the fall) whenstrongly baroclinic disturbances are pre-sent in severe weather situations. Dur-ing the summer, with weaker synopticscale disturbances, the tendency was to-ward severe thunderstorm (instead oftornado) watches. Although this methodmatches climatology reasonably well(see Kelly et al 1979), there was no un-derstanding of the processes relevant totornadogenesis being employed, largelybecause that understanding was notavailable. It was not easy to justify thechoice in any given situation, except byexperience and climatology.
It is only within the last severalyears that this situation has begun tochange. At present, recognition of thesupercell environment is becoming thecornerstone of SELS tornadic vs. non-tornadic decision-making. This philoso-phy also reflects a lack of knowledgeabout non-supercell tornadoes at present,at least compared to supercell tornadoes;as noted in Doswell and Burgess (1992),the study of the non-supercell tornadohas only just begun.
On the other hand, the high degreeof association between supercells and
8
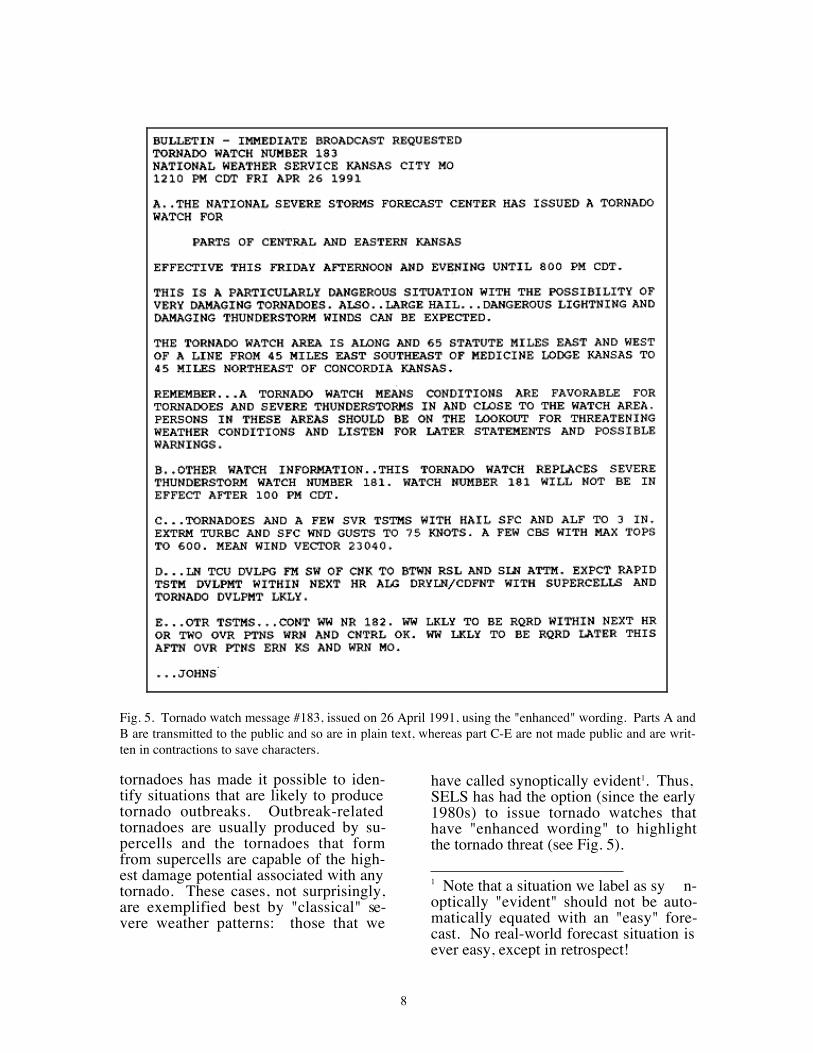
Fig. 5. Tornado watch message #183, issued on 26 April 1991, using the "enhanced" wording. Parts A andB are transmitted to the public and so are in plain text, whereas part C-E are not made public and are writ-ten in contractions to save characters.
tornadoes has made it possible to iden-tify situations that are likely to producetornado outbreaks. Outbreak-relatedtornadoes are usually produced by su-percells and the tornadoes that formfrom supercells are capable of the high-est damage potential associated with anytornado. These cases, not surprisingly,are exemplified best by "classical" se-vere weather patterns: those that we
have called synoptically evident1. Thus,SELS has had the option (since the early1980s) to issue tornado watches thathave "enhanced wording" to highlightthe tornado threat (see Fig. 5). 1 Note that a situation we label as sy n-optically "evident" should not be auto-matically equated with an "easy" fore-cast. No real-world forecast situation isever easy, except in retrospect!

9
Fig. 6. Plot of yearly totals of tornado days (i.e.,days with one or more reported tornadoes).
Fig. 7. Plot of yearly totals of "big" tornado days(i.e., those days with at least two or more violent(F4-F5) tornadoes).
Let us define a tornado day as a daywith one or more tornadoes and a bigtornado day as a day with two or moreviolent (F4-F5) tornadoes. The interan-nual variation in tornado days is rathersmall, averaging about 175 days per year(see Fig. 6), whereas big tornado daysfluctuate considerably from year to year(Fig. 7), with an average frequency ofabout 10 such days per year. Enhancedwording is used when tornado outbreaksare expected, and outbreaks typicallyhave two or more violent tornadoes,meeting our criterion for a big tornadoday. Thus, the enhanced wording in tor-nado watches is not commonly em-ployed.
The role of vertical wind shear-related parameters in tornado forecastinghas made the development and opera-tional availability of additional sources
for vertical wind structure quite critical.Therefore, the demonstration network ofvertical wind profilers (Gage and Bal-sley 1978) presently being implemented(National Weather Service 1987) is ofgreat interest to operational forecasters.Also, the wind profiling capability (seeRabin and Zrnic' 1980) of the WSR-88D(NEXRAD) Doppler radars in the pre-storm, clear air environment may be ex-tremely valuable.
4. 35 YEARS OF TORNADOFORECAST VERIFICATION
Since the essential aspect of tornadoforecasting is to distinguish between tor-nadic and non-tornadic situations, thiswill be the primary issue discussed here.There are numerous other aspects of tor-nado and severe thunderstorm watchverification that we cannot dwell onhere; some will be presented in a futurepublication. Our data consist of the finalSELS log of severe weather reports andrecords of tornado and severe thunder-storm watches, covering the 35 year pe-riod 1955-1989, inclusive.
It should be noted that a tornadowatch/event is, in a sense, also a severethunderstorm watch/event. That is, atornado-producing storm is, by defini-tion, a severe thunderstorm. Therefore,a tornado in a severe thunderstorm watchverifies that watch, but a non-tornadicevent does not verify a tornado watch.However, for the purposes of this paper,we have not accounted for this fact in theverification; that work is not yet com-plete, but it will be reported upon in theaforementioned future publication.
Another important aspect of tornadoforecast verification is that tornadowatches are area forecasts that typicallycover several tens of thousands of squarekilometers, whereas tornadoes affectonly a few square kilometers even inmajor events. This disparity in coveragemeans that successful tornado watches(i.e., those with tornadoes in them) aremostly "false alarms" in the sense thatthe vast majority of the forecast area isunaffected. The original watch verifica-tion schemes considered them as area

10
forecasts, so that a single tornado effec-tively verified the entire area of thewatch. Recently, as described in Weisset al. (1980), watch verification has beenchanged such that a single report onlyverifies a portion of the total watcharea/time. However, this new schemestill does not incorporate informationabout areas outside the watch.
Fig. 8. Illustrating the Manually-Digitized Radar(MDR) grid with those blocks considered in theverification shaded gray.
The verification scheme used herein(first described in Doswell et al. 1990b)is based on the so-called Manually Dig-itized Radar (MDR) grid shown in Fig.8. Each MDR box is roughly2 a square40 km (25 n mi) on a side. Every watchhas been broken down into MDR gridboxes, using the convention that if thecentroid of an MDR box is within thewatch, that MDR box is considered to bewithin the watch. The valid time of thewatch is broken down by hours; if awatch begins on the hour or within thefirst 29 minutes of the hour the watch isconsidered valid for the whole hour,whereas watches beginning 30 minutesor more after the hour apply to the nextwhole hour. The MDR box-hour is thebasic unit of the verification, and it natu- 2 Since the grid is defined on a polarstereographic map projection, the gridboxes vary in size across the map by asmuch as about 10%. The nominal sizeapplies only at 60˚ N latitude, where themap scale factor is unity.
rally gives a somewhat "grainy" picture.We have tested the effect of increasingthe resolution both in space and time andfound that for our verification purposes,it is detectable but does not affect theoverall patterns. There are 4533 MDRboxes over the United States (boxes overwater are not counted), and each non-leap year has 39,709,080 MDR box-hours.For verification purposes, a severeweather report is considered to verify anentire MDR box-hour if it occurs any-time within that hour. Reports otherthan the first in that MDR box-hour areignored unless they are of a differenttype (the two types of reports are "tor-nado" and "non-tornadic severe thunder-storm"). If one or more tornadoes occurwithin a given box-hour, it is counted asa "tornado hit" irrespective of any con-current non-tornadic severe thunder-storm reports. If one or more non-tornadic severe events occur within agiven box-hour, it is counted as a "se-vere thunderstorm hit".
Our basic tool for verification is the3x3 contingency table shown in Table 2,derived via the above process for everyMDR box. From the information con-tained within this basic table, a wide va-riety of summary measures, histograms,maps, etc. can be constructed, of whichwe obviously have room for only a smallfraction. Although a single number can-not express all of the content implied inTable 2, we shall use the Heidke skillscore as a summary measure of skill (seeDoswell et al. 1990a,b for details). Asshown in Table 3, skill scores have in-creased by nearly an order of magnitudeover the 35 years. If we compare thefirst decade (1955-1964) with the lastdecade (1980-1989) of our record (Fig.9), it can be seen that the primary "tor-nado alley" skill maximum has persisted,but additional centers of relative skillhave developed in North Carolina, NewYork state, Montana, and Idaho. It is atpresent difficult to know how to interpretthese results; however, spatial distribu-tion of verification scores clearly is in-fluenced by the distribution of severe

11
Fig. 9. Maps of smoothed Heidke skill score for(a) 1955-1964 and (b) 1980-1989.
weather reports (compare Fig. 9 withFig. 10).
The reporting of non-tornadic se-vere weather has increased markedlywith time (Fig. 11), whereas tornado re-porting has remained more nearly con-stant. While the skill has climbed moreor less steadily during the 35 years underconsideration, how much of this skill isattributable to enhanced reporting? Toattempt to account for this "inflation" wedid the following. If one does not dis-tinguish for the moment between torna-does and non-tornadic severe thunder-storms, then the contingency table (Ta-ble 2) reduces to the 2x2 table shown inTable 4.
Table 2. Contingency table for severe thunderstorm and tornado watch box-hours, as described in the text.
ObservedForecast Tornado Severe Thunderstorm Nothing Total
Tornado n11 n12 n13 n1•Severe Thunderstorm n21 n22 n23 n2•
Nothing n31 n32 n33 n3•Total n•1 n•2 n•3 n••
Table 3. Actual 3 x 3 contingency tables for (a) 1955 and (b) 1989, showing the number of watch-boxhours as described in the text.
ObservedForecast Tornado Severe Thunderstorm Nothing Total
(a) 1955Tornado 85 62 39,696 39,843
Severe Thunderstorm 40 56 78,580 78,676Nothing 420 604 39,589,357 39,590,561
Total 545 722 39,707,813 39,709,080(b) 1989
Tornado 237 1372 61,036 62,645Severe Thunderstorm 102 1965 96,325 98,392
Nothing 393 4255 39,543,395 39,548,043Total 732 7592 39,700,756 39,709,080

12
Fig. 10. Maps of smoothed tornado occurrencefor (a) 1955-1964 and (b) 1980-1989.
We take the number of severe re-ports in 1955 as the standard1, denotedby (x+y)55. Subtract this from the num-ber of severe reports in the ith year,(x+y)i, to obtain the difference, di. Thisdifference is an estimate of the numberof events for the ith year that would havegone unreported in 1955, so these are allput into the z -box (refer to Table 4) inthe contingency table. We assume thatthe ratio of the x-box to the y-box re-mains the same, and re-do the skill scoreverification on the revised table. Of 1 As is the case in accounting for cu r-rency inflation, this does not imply thatthere is anything special about 1955. Itsimply represents a base, or referencestate. We could just as easily have ad-justed toward a 1989 standard, with nomaterial difference in our conclusions.
Fig. 11. Plot of yearly totals of non-tornadicsevere weather.
course, some of the di might actuallybelong in the w-box, but since w is typi-cally much larger than the other entriesin the table, ignoring this creates only anegligible error. While we temporarilyhave lumped tornadoes and non-tornadicsevere thunderstorm events together forthis purpose, the Heidke skill scores forthe 2x2 and 3x3 versions of the table arenot markedly different (see Doswell etal. 1990). The results of this procedure(Fig. 12) show that overall, the skill ofsevere weather watches has improved byabout 50% when report "inflation" hasbeen accounted for, rather than the orderof magnitude increase without correctingfor this inflation.
Table 4. As in Table 2, with no distinction be-tween tornadoes and severe thunderstorms (N =x+y+z+w)
ObservedForecast Severe Nothing Total
Severe x y x+yNothing z w z+w
Total x+z y+w N
Turning to the specific issue of tor-nado vs. severe thunderstorm forecasts,the asymmetry of the forecasts is im-portant. That is, as long as one or moretornadoes occur in a tornado watch,there is no problem with having manyreports of non-tornadic severe thunder-storm events in that tornado watch (ele-ment n12 in Table 2). On the other hand,having tornadoes occur in severe thun-

13
derstorm watches is an undesirable event(element n21 in Table 2). Of course,there is an easy way to prevent this fromever occurring: always issue only tor-nado watches. Doing so would represent
Fig. 12. Plot of yearly values in Heidke skillscore, both unadjusted and adjusted (as describedin the text) for "inflation" of non-tornadic severeweather reports.
no attempt to discriminate between tor-nadic and non-tornadic severe thunder-storms and this clearly is not desirable,nor does it reflect what has been done.As can be seen in Table 3, the occur-rence of tornadoes in severe thunder-storm watches has increased with time,but only by about a factor of two. Thisrelatively small increase appears to be,in part, a consequence of the relativelymodest rate of increase in tornado re-porting overall. However, the number ofcorrectly forecast tornado events has in-creased by about a factor of three, sug-gesting some increase in the skill of dis-crimination. The occurrence of torna-does without any watch of either typeactually decreased during the period, al-though such total misses still constitutethe majority of observed tornadic events.Since the majority of all tornadoes areweak, and because the probability ofdetection for tornadoes in watches islowest for weak tornadoes (Leftwich andAnthony 1991), most of these missedevents are weak tornadoes and probablyare not associated with supercells. Gal-way (1975) has observed that the major-ity of tornado deaths occur in watches,which remains true to this day, suggest-
ing that watches capture most of the sig-nificant tornadoes.
5. CURRENT UNDERSTANDING OFTORNADIC STORMS
Our understanding of tornadicstorms and how they interact with theirenvironment is presently in an excitingstate of transition. As Doswell and Bur-gess (1992) have indicated, we havecome to realize that tornadoes can occurin many ways, and are not limited to su-percell events. Not all tornado reportsrepresent the same meteorological phe-nomenon and we are just beginning tounderstand how non-supercell tornadoesmight arise (e.g., Wakimoto and Wilson,1989).
Even for supercell events, however,mesoscale variability in atmosphericstructure can be crucial in estimating thechances for tornadoes (see Burgess andCurran, 1985 for a case study example).Mesoscale details, often slipping more orless unnoticed through the present-dayobserving system, can be the differencebetween correct and incorrect forecasts.The sorts of events used by Miller(1972) to exemplify tornadic environ-ments are not as difficult to predict, be-cause they are characterized by large-scale environments readily identified asbeing favorable for supercells with to-day's data. Such synoptically evidentevents are not frequent during the tor-nado season, however (see also Maddoxand Doswell 1982).
On some tornado days (typicallythose with large CAPE but weak to mar-ginal shear) severe storms are likely, butthe apparent tornado potential is nothigh. A notable recent example is 28August 1990, on which the violent Plain-field, Illinois event occurred. In suchenvironments (many of which produceno significant tornadoes), some mesos-cale process creates a local environmentsuch that isolated storms become tor-nadic in ideal conditions, but those con-ditions are uncharacteristic of a largearea. In contrast, major outbreak days(such as the Kansas-Oklahoma outbreakof 26 April 1991 that produced the An-

14
dover, Kansas killer tornado, amongothers), have widespread supercell-favorable environments and many super-cells.
Said another way, more than 90% ofthe tornado days per year are not syn-optically "evident" ; most tornadoevents involve mesoscale processes thatare difficult to anticipate at present (seeDoswell 1987, Rockwood and Maddox1988). The forecaster must formulate acorrect prior assessment of tornado po-tential, followed by careful monitoringof the observations, watching for crucialdevelopments that might escape noticeeven when they occur.
Recent research has suggested thatthe vertical wind shear structure is themost crucial element in supercells.Thus, the source of rotation in supercell-related tornadoes seems to be the verticalwind shear in the environment. Staticinstability does not seem particularlyuseful in distinguishing supercell fromnon-supercell events, since supercellsoccur within a broad range of instabili-ties (Johns et al. 1990, 1991), although itmay be important in determining otheraspects of severe thunderstorm potential.
To the extent that supercells are re-sponsible for most strong and violenttornadoes, the current task of tornadoforecasting hinges on predicting envi-ronments favorable for supercells. Thisbegins with the requirement that deep,moist convection be possible; in turn,this depends on having sufficient mois-ture, instability, and lift such that poten-tially buoyant parcels reach their LFCs.Many of the empirical forecasting "rulesof thumb" have physical explanationsrooted in the required presence of deep,moist convection. Beyond this, for su-percells, it appears that the developmentof a supercell's deep, persistent mesocy-clone takes longer than the 20-40 minlifetime of an ordinary convective cell.Long lifetimes for convective events arethe result of propagation, with new con-vective cells developing in preferred lo-cations relative to existing cells. Prefer-ential convective development is nowknown to be related to the vertical windshear (see Weisman and Klemp 1982,
1984). It is also important that the com-bination of vertical wind shear and stormmotion produce enough storm-relativehelicity (as in Davies-Jones et al. 1990)to allow the mesocyclone to reach downto the surface (Brooks et al. 1992). De-spite some recent progress, the valida-tion of these ideas in forecasting practicehas yet to be done, in part owing to alack of mesoscale detail in the observa-tions.
Although non-supercell events havenot yet received the research attentiongiven to supercells, it appears that atleast some of them may be related tomesoscale processes associated with ter-rain features (e.g., Brady and Szoke1988). To whatever extent non-supercelltornadoes are associated with topogra-phy, their prediction may be corre-spondingly straightforward (see Doswell1980, Weaver and Doesken 1991). Asof this writing, it is not known whatfraction of all such tornadoes are terrain-related.
6. FUTURE DIRECTIONS
We have indicated that tornadoforecasting is presently in a state of rapidchange. We have emphasized how im-portant scientific understanding has be-come in the tornado prediction problem.It is the new technologies that will makenew science possible, but breakthroughswill not arise simply by switching onnew systems. Systematic research willbe needed to achieve technology'spromise, and a commitment to transfer-ring new understanding to operations isrequired. As new ideas are developed,their forecast value must be verified rig-orously and the ideas modified based onthe results of the verification.
6.1. Technological Tools
There are several new observingtechnologies to which the operationalweather services in the United States al-ready are committed. The WSR-88Dradar network is the keystone for thefuture health of tornado warnings, butwhat about tornado forecasting? With

15
the current emphasis on the importanceof vertical wind shear in supercellstorms, the clear air wind profiling capa-bility of the WSR-88Ds (e.g., see Fig.13) becomes potentially valuable. Sincethis capability is, in general, limited tolow levels, it nicely complements thevertical wind profilers, which do notprovide low-level winds. An opportu-nity for increasing our wind observationslies in automated instruments on com-mercial aircraft, including high resolu-tion data during ascent and descent (ineffect creating wind and temperaturesoundings near major air terminals). Alltogether, these enhancements to obser-vations of the mesoscale flow variationsshould improve our capacity to diagnoseand anticipate the wind shear structure.
Fig. 13. An example of a time-height cross sec-tion of wind from a steerable Doppler radar us-ing the Velocity-Azimuth Display algorithm.
Widespread deployment of auto-mated surface observations should en-hance the resolution of our surface data.The new technologies that make auto-mated surface observations feasible havemade it realistic to propose the operationof what we now view as research-densitymesonetworks over much of the countryas we enter the new century. In the past,processes observed with high-resolutionnetworks (see Fujita 1963) were not re-solved in operational networks. Withthe proliferation of such networks in op-erations, it should be possible to put intopractice the concepts derived from theresearch network observations of thepast, as well as to do new research on a
wider range of situations than the re-search networks, with their limited areaand time of operations, could sample.
As of this writing, we are on theverge of having a nationwide network oflightning ground strike detectors and aspace-based lightning mapper (Turmanand Tettelbach 1980) that will allow ob-servations of intra- and inter-cloud light-ning as well as ground strikes. The ul-timate value of such information in tor-nado forecasting remains unknown atpresent. If such data are to be of valuein forecasting, we must integrate thelightning data with the rest of the obser-vations in determining how lightningground strike information relates tostorm severity (see MacGorman 1992).
Multispectral satellite observationsof an unprecedented scope are promisedfor the near future, also. We believe thereal value in such observations is not intrying to emulate direct measurement(e.g., rawinsonde) data. Instead, the newdata should be used in ways that are con-sistent with their character; e.g., layer-averaged variables (see Fuelberg andOlson 1991). Given earth- and space-based remote sensing technologies (windand thermodynamic profilers, Dopplerradars), and various direct measurements(rawinsondes, aircraft measurements),the most complete and useful observa-tions will involve the union of all theseobserving technologies, a task easier saidthan done.
Another technological tool is theoperational meteorological workstation .As new observing technologies are aboutto unleash a torrent of new data on theoperational work environment, the samebasic technologies also give us the ca-pacity to absorb and integrate it. If afuture operational workstation is to havea positive impact on forecasting, it mustmeet two requirements. First, the work-station hardware must have sufficientdata processing resources to deal effec-tively in real-time with the data transferrates associated with the new observa-tions. Second, the workstation softwaremust make this torrent of data availablein operationally useful ways.

16
The last technological tool for thefuture we shall discuss is the numericalprediction model. There can be no doubtthat numerical prediction models willcontinue to assume ever greater roles inthe tornado forecast problem. Clearly,the tornado is many orders of magnitudesmaller than the environmental processesthat give it birth, so scale interaction is acrucial question. However, it will bemany years (if ever) before a single nu-merical prediction model will encompassall these scales explicitly and simultane-ously.
The real impact of mesoscale nu-merical prediction models in operationsremains to be seen, but experimentalreal-time predictions with mesoscalemodels are underway (see Warner andSeaman 1990). Even numerical cloudmodels may have a role in operationalforecasting (see Fig. 14). See Brooks etal. (1992) for an extended discussion onthis topic. The capacity for such model-ling can only increase, so such modelscould come to be viewed as essential di-agnostic tools (see Keyser and Uccellini1987) of the forecaster. The forecasterof the future must be much more than apassive recipient of model "guidance"(see Snellman 1977) – the forecasterwould be using numerical models in a
Fig. 14. Output of radar reflectivity (gray con-toured at 10 dbz intervals) and vorticity (darkcontoured at 0.0025 s-1 interval, with the zerocontour suppressed) from a numerical cloudmodel; tic marks are 5.45 km apart. The modelbegan with horizontally homogeneous initial
conditions, using a forecast thermodynamicsounding and hodograph on 26 May 1991. Theforecast input is valid for northwestern Okla-homa and a supercell tornadic storm developedthat afternoon near Woodward, Oklahoma.
way analogous to using pencils and pa-per weather charts. The computershould not be used to do what can bedone with a pencil on paper, however.Rather, the numerical models shouldform the basis for operationally usefulexploration of the intricate, nonlinearrelationships associated with weather-making processes.
6.2. Productive Areas for Research
We believe that tornado forecastingeventually will outgrow its purely asso-ciative, empirical roots. The new ob-serving systems mean that forecastersand researchers will be sharing the samedata sets in the near future and the appli-cation of meteorological science to tor-nado forecasting probably will be a morenatural process than it is now. Such anoutcome depends on (a) successful re-search aimed at increasing understandingof storm-environment relationships, (b) ameaningful education and training pro-gram for operational forecasters, and (c)a collective will to overcome a decades-long schism between research and op-erations.
An issue of considerable concern isthe forecasting of the detailed thermody-namic structure of the storm environ-ment, be it tornadic or not. Presentmodels and observations give only asynoptic scale picture that often is in-adequate to resolve the importantmesoscale details. Of course, on somedays, it is possible to do an adequate jobwith the subjective and objective fore-casting tools at hand. The processes bywhich moisture, momentum, and staticstability change are well-known in prin-ciple, but those processes are not neces-sarily well-handled even in research-level modeling, much less in operationalpractice. Some of this stems from lackof resolution, both in our models and inour observations; some of the inadequa-
17
cies arise from deficiencies in the physi-cal parameterizations used in numericalmodels. The parameterization of con-vection is a crucial issue in the large-scale forecast evolution of static stabil-ity; release the convection too soon andthe model never develops realistic con-vective instability, whereas if the param-eterized convection is "turned on" toolate, the forecast instability can reachunrealistically high levels.
If we continue to depend on physi-cal parameterizations in our numericalmodels, as we almost certainly shall, it isobvious that improved parameterizationsare needed. We believe that researchaimed at improving physical under-standing is preferable to improving pa-rameterizations in the long run; param-eterization is, in effect, a concessionmade in ignorance, even when it is anecessary concession. Of course, im-proved physical understanding can havea positive impact on parameterizationschemes, as well.
Sensible and latent heat fluxes canhave an enormous impact on static sta-bility and moisture availability. The op-erational model "boundary layer phys-ics" parameterizations leave much to bedesired from the viewpoint of a tornadoforecaster, especially in data-void areaslike the Gulf of Mexico (see Lewis et al.1989).
In addition to the thermodynamicfields, it is clear that, with the apparentimportance of vertical wind structure forsupercells, wind forecasting is a keyproblem in numerical prediction. Owingto their poor resolution using present op-erational data, mesoscale structures inthe wind field depend primarily on themodel for their creation, rather than be-ing included initially. Our experiencesuggests that current operational weatherprediction models are rather unsuccess-ful in predicting those important detailsreliably. The models have their suc-cesses, but there does not seem to be anyconsistency in them; the predicted de-tails are not reliable, at least for theneeds of a tornado forecaster.
As the new, more detailed obser-vations accumulate, we may be able to
develop new understanding of thesemesoscale processes, heretofore inade-quately sampled. This understandingmay lead to improvements in mesoscalenumerical prediction that will be essen-tial to the tornado forecast problem.However, an additional complication toforecasting details of the wind structureis the impact from convection. Maddox(1983), Ninomiya (1971), and othershave shown that persistent deep convec-tion can alter the surrounding environ-ment. This means that new convectiondeveloping in the vicinity of pre-existingconvection encounters a different windand thermodynamic environment on themesoscale than seen by any precedingconvection.
Given all of the new technologicaland associated scientific developmentsthat are likely to take place in the nextdecade, it is quite plausible to be opti-mistic about the future of tornado fore-casting. There can be no doubt that con-siderable progress will be made duringthe next ten years, and we look forwardto those developments.
Acknowledgments. The authors wish tothank Dr. Robert A. Maddox (NSSL)and the anonymous reviewers for theirhelpful comments on previous versionsof this paper. Thanks also are extendedto Mr. Dave Keller (NSSL) for his ef-forts in the verification study and Ms.Joan Kimpel (Cooperative Institute forMesoscale Meteorological Studies) forher help in drafting, as well as Dr. LouisWicker (Univ. of Illinois and NationalCenter for Supercomputing Applica-tions) and Dr. Harold Brooks (NationalResearch Council) for their help withFig. 14.
REFERENCES
Beebe, R.G. and F.C. Bates, 1955: Amechanism for assisting in the re-lease of convective instability.Mon. Wea. Rev., 83, 1-10.
Brady, R.H. and E. Szoke, 1988: Thelandspout -- A common type ofNortheast Colorado tornado. Pre-prints, 15th Conf. Severe Local

18
Storms (Baltimore, MD), Amer.Meteor. Soc., 312-315.
Brandes, E.A., 1977: Flow in severethunderstorms observed by dual-Doppler radar. Mon. Wea. Rev.,105, 113-120
Brooks, H.E., C.A. Doswell III and R.P.Davies-Jones, 1992: Environmentalhelicity and the development oflow-level mesocyclones. Proceed-ings, Tornado Symposium III (C.Church, ed.), Amer. GeophysicalUnion, (in press).
______, ______ and R.A. Maddox,1992: On the use of mesoscale andcloud-scale models in operationalforecasting. Wea. Forecasting, 7,(in press).
Browning, K.A., 1964: Airflow andprecipitation trajectories within se-vere local storms which travel to theright of the winds. J. Atmos. Sci.,22, 664-668.
______, and T. Fujita, 1965: A FamilyOutbreak of Severe Local Storms --A Comprehensive Study of theStorms in Oklahoma on 26 May1963, Part I. U.S. Air Force SpecialReport No. 32, AFCRL-65-695(1),L.G. Hanscom Field, Bedford, MA,NTIS Accession No. AD 623787,346 pp.
Browning, P.A., 1991: The VDUC in-teractive computer system at theNational Severe Storms ForecastCenter. Preprints, 7th Int. Conf. In-teractive Information and Process-ing Systems for Meteorology,Oceanography, and Hydrology(New Orleans, LA), Amer. Meteor.Soc., 204-207.
Burgess, D.W. and B. Curran, 1985:The relationship of storm type toenvironment in Oklahoma on 26April 1984. Preprints, 14th Conf.Severe Local Storms (Indianapolis,IN), Amer. Meteor. Soc., 208-211.
______, R.J. Donaldson and P.R. Des-rochers, 1992: Tornado detectionand warning by radar. Proceedings,Tornado Symposium III (C. Church,ed.), Amer. Geophysical Union, (inpress).
Davies, J.M. and R.H. Johns, 1992:Some wind and instability parame-ters associated with strong and vio-lent tornadoes. Part I: Helicity andmean shear magnitudes. Proceed-ings, Tornado Symposium III (C.Church, ed.), Amer. GeophysicalUnion, (in press).
Davies-Jones, R.P., 1984: Streamwisevorticity: The origin of updraft ro-tation in supercell storms. J. Atmos.Sci., 41, 2991-3006.
______, D.W. Burgess and M. Foster,1990: Test of helicity as a tornadoforecast parameter. Preprints, 16thConf. Severe Local Storms (Ka-nanaskis Park, Alberta), Amer. Me-teor. Soc., 588-592.
Doswell, C.A. III, 1980: Synoptic scaleenvironments associated with HighPlains severe thunderstorms. Bull.Amer. Meteor. Soc., 60, 1388-1400.
______, 1982: The Operational Meteor-ology of Convective Weather. Vol.I: Operational Mesoanalysis.NOAA Tech. Memo. NWS NSSFC-5, available from the author at Na-tional Severe Storms Lab., 1313Halley Cir., Norman, OK 73069,172 pp.
______, 1985: The Operational Meteor-ology of Convective Weather. Vol.II: Storm Scale Analysis. NOAATech. Memo. ERL ESG-15, avail-able from the author at National Se-vere Storms Lab., 1313 Halley Cir.,Norman, OK 73069, 240 pp.
______, 1987: The distinction betweenlarge-scale and mesoscale contribu-tion to severe convection: A casestudy example. Wea. Forecasting,2, 3-16.
______, J.T. Schaefer, D.W. McCann, T.W. Schlatter and H.B. Wobus, 1982:Thermodynamic analysis proce-dures at the National Severe StormsForecast Center. Preprints, 9 thConf. Wea. Forecasting and Analy-sis (Seattle, WA), Amer. Meteor.Soc., 304-309.
______, R.A. Maddox and C.F. Chap-pell, 1986: Fundamental considera-tions in forecasting for field experi-ments. Preprints, 11th Conf. Wea.

19
Forecasting and Analysis (KansasCity, MO), Amer. Meteor. Soc.,353-358.
______, R. Davies-Jones D.L. Keller,1990a: On summary measures ofskill in rare event forecasting basedon contingency tables. Wea. Fore-casting, 5, 576-585.
______, D.L. Keller and S.J. Weiss,1990b: An analysis of the temporaland spatial variation of tornado andsevere thunderstorm watch verifica-tion. Preprints, 16th Conf. SevereLocal Storms (Kananaskis Park, Al-berta), Amer. Meteor. Soc., 294-299.
______. and D.W. Burgess, 1991: Tor-nadoes and tornadic storms. Pro-ceedings, Tornado Symposium III(C. Church, ed.), Amer. Geophysi-cal Union, (in press).
Fawbush, E.J., and R.C. Miller, 1952: Amean sounding representative of thetornadic airmass environment. Bull.Amer. Meteor. Soc., 33, 303-307.
______, and ______, 1954: The types ofairmasses in which North Americantornadoes form. Bull. Amer. Me-teor. Soc., 35, 154-165.
______, ______ and L.G. Starrett, 1951:An empirical method of forecastingtornado development. Bull. Amer.Meteor. Soc., 32, 1-9.
Fuelberg, H.E., and S.R. Olson, 1991:An assessment of VAS-derived re-trievals and parameters using inthunderstorm forecasting. Mon.Wea. Rev., 119, 795-814.
Fujita, T., 1963: Analytical mesomete-orology: A review. M e t e o r .Monogr. (D. Atlas, ed.), 5, No. 27,Amer. Meteor. Soc., 77-125
Galway, J.G., 1956: The lifted index asa predictor of latent instability.Bull. Amer. Meteor. Soc., 37, 528-529.
______, 1973: Severe local storm fore-casting in the United States. Un-published SELS workshop notes,National Severe Storms ForecastCenter, Kansas City, MO 64106, 13pp.
______, 1975: Relationship of tornadodeaths to severe weather watch ar-eas. Mon. Wea. Rev., 103, 737-741.
______, 1985: J.P. Finley: The first se-vere storms forecaster. Bull. Amer.Meteor. Soc., 66, 1389-1395.
______, 1989: The evolution of severethunderstorm criteria within theWeather Service. Wea. Forecast-ing, 4, 585-592.
Gage, K.S. and B.B. Balsley, 1978:Doppler radar probing of the clearatmosphere. Bull. Amer. Meteor.Soc., 58, 1074-1093.
Hales, J.E., Jr., 1979: A subjective as-sessment of model initial conditionsusing satellite imagery. Bull. Amer.Meteor. Soc., 60, 206-211.
______, 1985: Synoptic features associ-ated with Los Angeles tornado oc-currences. Bull. Amer. Meteor.Soc., 66, 657-662.
Hirt, W.D., 1985: Forecasting severeweather in North Dakota. Preprints,14th Conf. Severe Local Storms(Indianapolis, IN), 328-331.
House, D.C., 1963: Forecasting torna-does and severe thunderstorms.Meteor. Monogr. (D. Atlas, ed.), 5,No. 27, 141-155.
Johns, R.H., 1984: A synoptic climatol-ogy of northwest flow severeweather outbreaks. Part II: Mete-orological parameters and synopticpatterns. Mon. Wea. Rev., 112, 449-464.
______, J.M. Davies and P.W. Leftwich,1990: An examination of the rela-tionship of 0-2 km AGL "positive"wind shear to potential buoyant en-ergy in strong and violent tornadosituations. Preprints, 16th Conf. Se-vere Local Storms (KananaskisPark, Alberta), Amer. Meteor. Soc.,593-598.
______, P.W. Leftwich and J.M. Davies,1992: Some wind and instabilityparameters associated with strongand violent tornadoes. Part II:Variations in the combinations ofwind and instability parameters.Proceedings, Tornado SymposiumIII (C. Church, ed.), Amer. Geo-physical Union, (in press).

20
Kelly, D.L., J.T. Schaefer, R.P.McNulty, C.A. Doswell III and R.F.Abbey, Jr., 1979: An augmentedtornado climatology. Mon. Wea.Rev., 106, 1172-1183.
______, ______ and C.A. Doswell III,1985: The climatology of non-tornadic severe thunderstorm eventsin the United States. Mon. Wea.Rev., 113, 1997-2014.
Keyser, D. and L.W. Uccellini, 1987:Regional models: Emerging re-search tools for synoptic meteorolo-gists. Bull. Amer. Meteor. Soc., 68,306-320.
Leftwich, P.W., Jr., 1990: On the use ofhelicity in operational assessment ofsevere local storm potential. Pre-prints, 16th Conf. Severe LocalStorms (Kananaskis Park, Alberta),Amer. Meteor. Soc., 306-310.
Leftwich, P.W., Jr. and R.W. Anthony,1991: Verification of Severe LocalStorms Forecast Issued by the Na-tional Severe Storms Forecast Cen-ter: 1990. NOAA Tech. Memo.NWS NSSFC-31, Available at Na-tional Severe Storms Forecast Cen-ter 601 E. 12th St., Kansas City,MO 64106, 9 pp.
Lloyd, J.R., 1942: The development andtrajectories of tornadoes. M o n .Wea. Rev., 70, 65-75.
Lewis, J.M., C.M. Hayden, R.T. Merrilland J.M. Schneider, 1989:GUFMEX: A study of return flowin the Gulf of Mexico. Bull. Amer.Meteor. Soc., 70, 24-29.
MacGorman, D.R., 1992: Lightning intornadic storms: A review. Pro-ceedings, Tornado Symposium III(C. Church, ed.), Amer. Geophysi-cal Union, (in press).
Maddox, R.A., 1983: Large-scale mete-orological conditions associatedwith midlatitude, mesoscale con-vective complexes. Mon. Wea.Rev., 111, 1475-1493.
Maddox, R.A. and C.A. Doswell III,1982: An examination of jet streamconfigurations, 500 mb vorticity ad-vection and low level thermal ad-vection patterns during extended pe-
riods of intense convection. Mon.Wea. Rev., 110, 184-197.
Mass, C.F., 1991: Synoptic frontalanalysis: Time for a reassessment?Bull. Amer. Meteor. Soc., 72, 348-363.
McCann, D.W, 1983: The enhanced-V:A satellite observable severe stormsignature. Mon. Wea. Rev., 111,887-894.
Miller, R.C., 1972: Notes on the Analy-sis and Severe-Storm ForecastingProcedures of the Air Force GlobalWeather Central. Air WeatherService Tech. Rept. 200 (Rev.), AirWeather Service, Scott Air ForceBase, IL, 190 pp.
Moncrieff, M.W. and M.J. Miller, 1976:The dynamics and simulation oftropical cumulonimbus and squalllines. Quart. J. Roy. Meteor. Soc.,102, 373-394.
Mosher, F.R. and J.S. Lewis, 1990: Useof lightning location data in severestorm forecasting. Preprints, Conf.Atmos. Electricity (Kananaskis Park,Alberta), Amer. Meteor. Soc., 692-697.
National Weather Service, 1987: As-sessment Plan for the Uses of WindProfiler Technology in NWS Op-erations. National Weather Serviceunpublished planning document,Office of Meteorology, SilverSprings, MD, 70 pp.
Ninomiya, K., 1971: Mesoscale modifi-cation of synoptic situations fromthunderstorm development as re-vealed by ATS III and aerologicaldata. J. Appl. Meteor., 10, 1103-1121.
Purdom, J.F.W., 1982: Subjective inter-pretation of geostationary satellitedata for nowcasting. Nowcasting(K. Browning, ed.), AcademicPress, 149-166.
Rabin, R.M. and D.S. Zrnic', 1980: Sub-synoptic-scale vertical wind re-vealed by dual Doppler-radar andVAD analysis. J. Atmos. Sci., 37,644-654.
Rockwood, A.A. and R.A. Maddox,1988: Mesoscale and synoptic scaleinteractions leading to intense con-

21
vection: The case of 7 June 1982.Wea. Forecasting, 3, 51-68.
Schaefer, J.T., 1986: Severe thunder-storm forecasting: A historical per-spective. Wea. Forecasting, 1, 164-189.
Setvák, M. and C.A. Doswell III, 1991:The AVHRR channel 3 cloud topreflectivity of convective storms.Mon. Wea. Rev., 119, 841-847.
Showalter, A.K., 1953: A stability indexfor thunderstorm forecasting. Bull.Amer. Meteor. Soc., 6, 250-252.
______, and J.R. Fulks, 1943: Prelimi-nary report on tornadoes. U.S.Weather Bureau, Washington D.C.(out of print), 162 pp.
Snellman, L.W., 1977: Operationalforecasting using auto-mated guid-ance. Bull. Amer. Meteor. Soc., 58,1036-1044.
Staff, NSSP, 1963: Environmental andthunderstorm structure as shown byNational Severe Storms Project ob-servations in spring 1960-61. Mon.Wea. Rev., 91, 271-292.
Stensrud, D.J. and R.A. Maddox, 1988:Opposing mesoscale circulations: Acase study. Wea. Forecasting, 3 ,189-204.
Tepper, M., 1950: A proposed mecha-nism of squall lines: The pressurejump line. J. Meteor., 7, 21-29.
______, 1959: Mesometeorology - thelink between macroscale atmos-pheric motions and local weather.Bull. Amer. Meteor. Soc., 40, 56-72.
Turman, B.N. and R.J. Tettelbach, 1980:Synoptic-scale satellite lightningobservation in conjunction with tor-nadoes. Mon. Wea. Rev., 108,1878-1882.
Wakimoto, R.M. and J.W. Wilson, 1989:Non-supercell tornadoes. Mon.Wea. Rev., 117, 1113-1140.
Warner, T.T. and N.L. Seaman, 1990: Areal-time, mesoscale numericalweather-prediction system used forresearch, teaching, and public serv-ice at the Pennsylvania State Uni-versity. Bull. Amer. Meteor. Soc.,71, 792-805
Weaver, J.F. and N.J. Doesken, 1991:High Plains severe weather -- Ten
years after. Wea. Forecasting, 6 ,411-414.
Weisman, M.L. and J.B. Klemp, 1982:The dependence of numericallysimulated convective storms onvertical wind shear and buoyancy.Mon. Wea. Rev., 110, 504-520.
______, and ______, 1984: The struc-ture and classification of numeri-cally simulated convective storms indirectionally varying wind shears.Mon. Wea. Rev., 112, 2479-2498.
Weiss, S.J., 1985: On the operationalforecasting of tornadoes associatedwith tropical cyclones. Preprints,14th Conf. Severe Local Storms (In-dianapolis, IN), Amer. Meteor. Soc.,293-296.
______, 1987: On the relationship be-tween NGM mean relative humidityand the occurrence of severe localstorms. Preprints, 15th Conf. SevereLocal Storms (Baltimore, MD),Amer. Meteor. Soc., J111-J114.
______, D.L. Kelly and J.T. Schaefer,1980: New objective verificationtechniques at the National SevereStorms Forecast Center. Preprints,8th Conf. Wea. Forecasting andAnalysis (Denver, CO), Amer. Me-teor. Soc., 412-419.