texas-wide gis-based crash risk assessment
TRANSCRIPT
Texas-wide GIS-based Crash Risk Assessment
By Michael Martin
2015 Traffic Safety Conference Corpus Christi, Texas

Overview
The Concept
The Process – Road Segments Defined – Crashes Assigned to Road Segments – Crash Rates Calculated per Road Segment – Traffic Volume Ranges Defined – Crash Risk Categories Assigned
Statewide Crash Risk Map
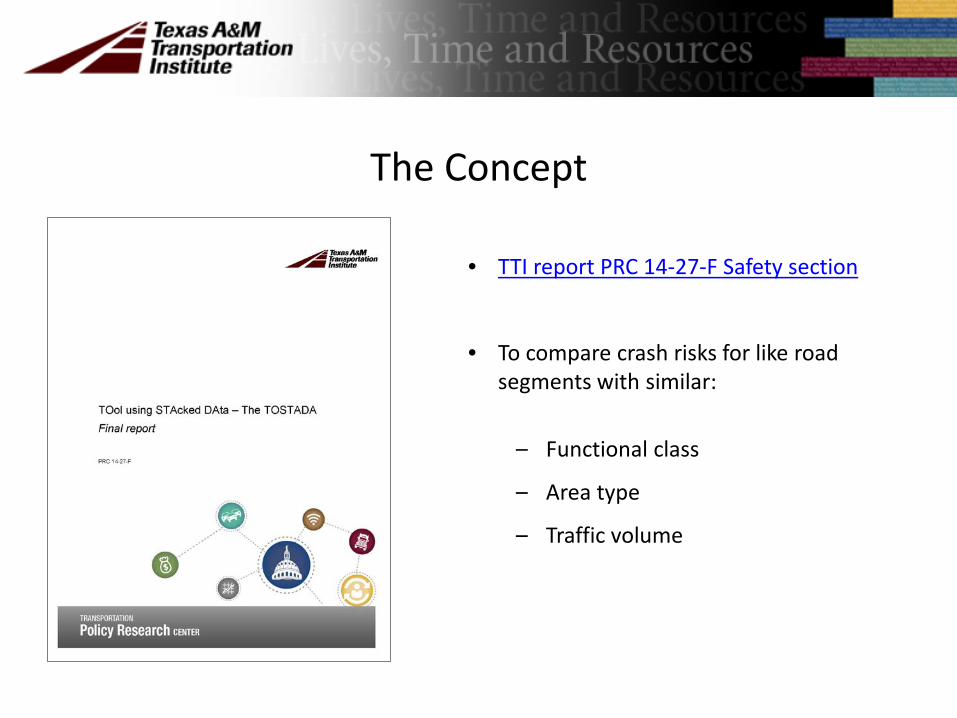
The Concept
• TTI report PRC 14-27-F Safety section
• To compare crash risks for like road segments with similar:
– Functional class
– Area type
– Traffic volume
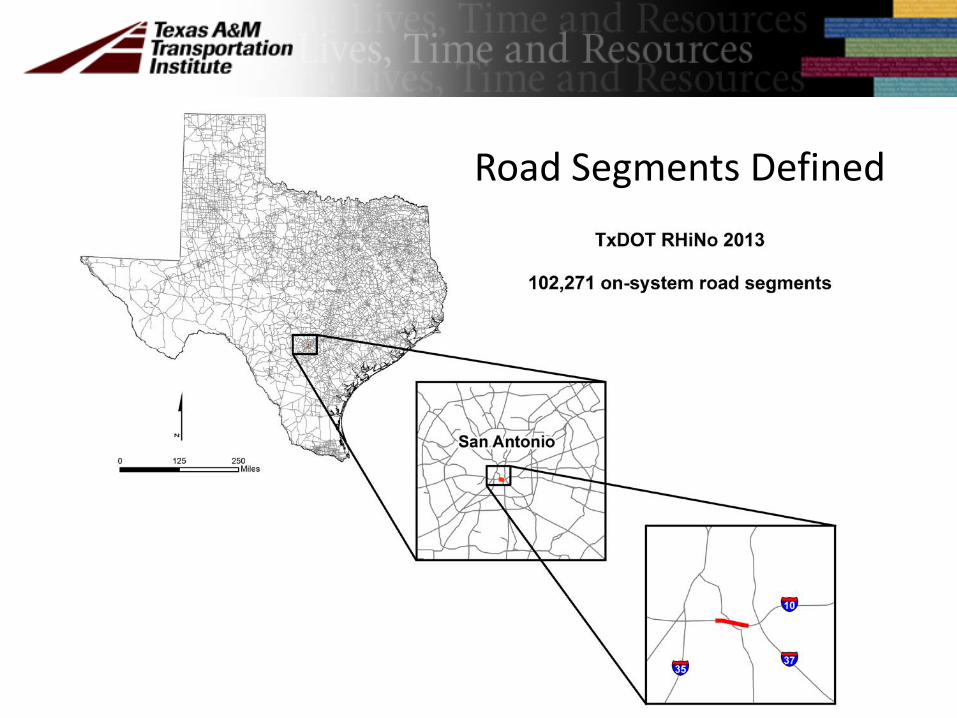
Road Segments Defined

Crashes Assigned

Crash Rates Calculated Per Road Segment
# 𝑜𝑜 𝐶𝐶𝐶𝐶𝐶𝐶𝐶𝐿𝐶𝐿𝐿𝐿𝐶 ∗ 𝐴𝐴𝐴
The probability of being involved in a crash per instance of the exposure measure (length and traffic volume combined).

Traffic Volume Ranges Defined
Area Type Functional Class
Volume Ranges (ADT)
Low Medium High
Urban
Freeways <75,000 75,000 – 150,000 >150,000
Arterials <25,000 25,000 – 50,000 >50,000
Collectors <5,000 5,000 – 10,000 >10,000
Local* 0 – 20,000
Rural
Freeways <30,000 30,000 – 60,000 >60,000
Arterials <15,000 15,000 – 30,000 >30,000
Collectors <5,000 5,000 – 10,000 >10,000
Local* 0 – 15,000
*- Only one volume group.
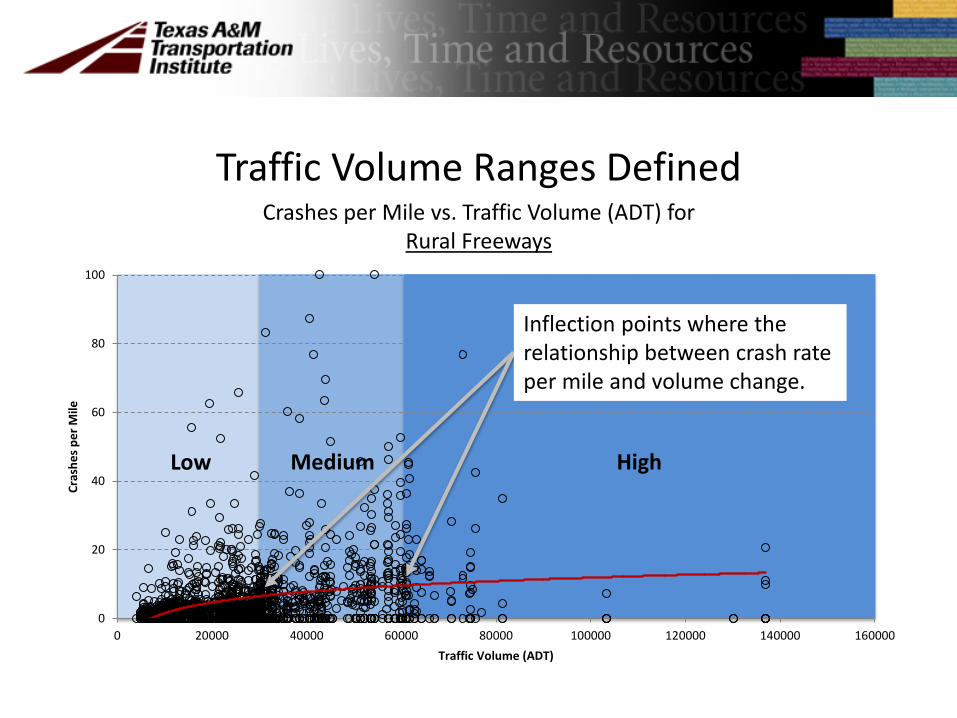
Traffic Volume Ranges Defined Crashes per Mile vs. Traffic Volume (ADT) for
Rural Freeways
Low High Medium
0
20
40
60
80
100
0 20000 40000 60000 80000 100000 120000 140000 160000
Cras
hes p
er M
ile
Traffic Volume (ADT)
Inflection points where the relationship between crash rate per mile and volume change.

Crash Risk Categories Assigned
Area Type Functional Class
Volume Ranges (ADT)
Low Medium High
Urban
Freeways <75,000 75,000 – 150,000 >150,000
Arterials <25,000 25,000 – 50,000 >50,000
Collectors <5,000 5,000 – 10,000 >10,000
Local* 0 – 20,000
Rural
Freeways <30,000 30,000 – 60,000 >60,000
Arterials <15,000 15,000 – 30,000 >30,000
Collectors <5,000 5,000 – 10,000 >10,000
Local* 0 – 15,000
*- Only one volume group.

Crash Risk Categories Assigned
0.0%
20.0%
40.0%
60.0%
80.0%
100.0%
0 1 2 3 4 5 6 7 8 9 10
Perc
ent o
f Seg
men
ts
Crash Rate (Crashes per Million Vehicle-Miles)
Inflection points where the relationship between cumulative percentages and crash rates change.
Low
Moderate
High Very High
Cumulative Percentage vs. Crash Rate for Medium Traffic Volume Rural Freeways
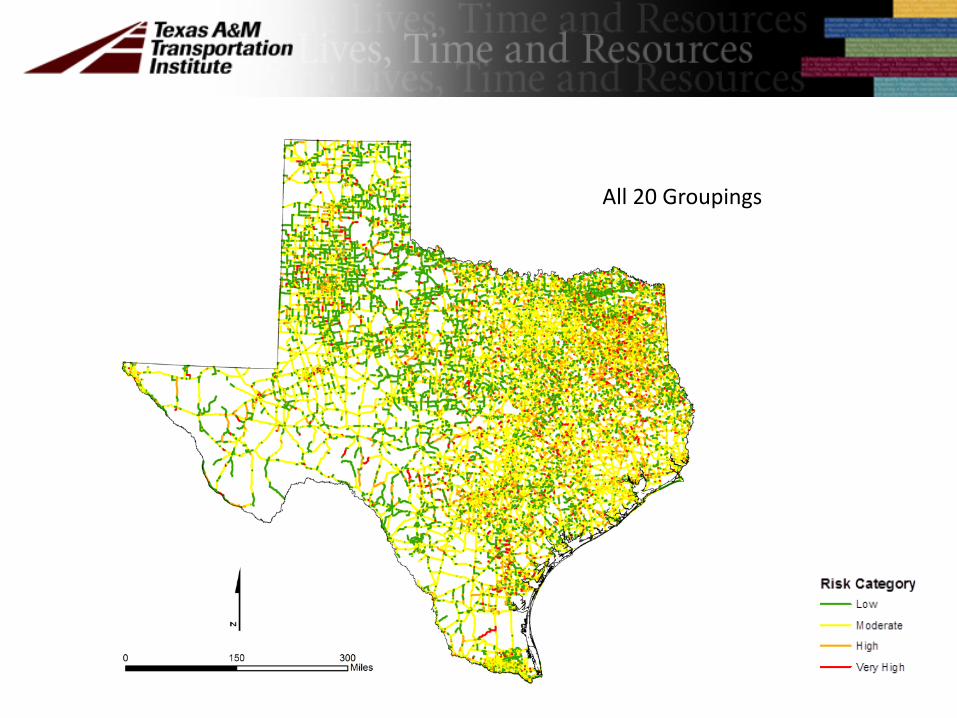
All 20 Groupings

All 20 Groupings with High & Very High Risk