texas top ten percent plan: how it works, what are its ... · texas top ten percent plan: how it...
TRANSCRIPT

Texas Top Ten Percent Plan: How It Works, What Are Its Limits, and Recommendations to Consider
Stella M. Flores New York University and The Steinhardt Institute for Higher
Education Policy, New York, NY
Catherine L. Horn University of Houston and The Institute for Educational Policy
Research and Evaluation, Houston, TX
2015
Copyright © 2015 Educational Testing Service. All Rights Reserved. ETS and the ETS logo are registered trademarks of Educational Testing Service (ETS). MEASURING
THE POWER OF LEARNING is a trademark of ETS. All other trademarks are property of their respective owners
.

Texas Top Ten Percent Plan i
Abstract
In this paper, we endeavor to contribute to efforts to implement college admissions
strategies appropriate within the nation’s developing law by examining percent plans, an
alternative race-neutral path to college admissions in Texas, California, and Florida. We
seek to do four things: (a) summarize the broad contributions to students’ opportunities to
access college; (b) describe the three state percent plans currently in place and the
important role demography plays in their implementation; (c) synthesize what is known
empirically about percent plans, their value, strengths, and limitations; and (d) provide
empirically based considerations related for institutions considering the implementation of
alternative admissions plans. As the higher education community contemplates percent
plans as possible mediators of the equity crisis, this report finds that there is much to be
learned from the rigorous research available on these plans to date, and much work left to
be done to cultivate their success.
Keywords: percent plans, race and college admissions, affirmative action, minorities

Texas Top Ten Percent Plan ii
Table of Contents
Accessing College .............................................................................................................. 2
What Are the Percent Plans and How Does Demography Play a Role in
Understanding Their Effectiveness? ............................................................................ 5
Demography and State Policy ....................................................................................... 7
What Have We Learned From 15 Years of Research on Percent Plans and
Other Race-Neutral Admissions Approaches? .......................................................... 10
Are Percent Plans Effective? ....................................................................................... 10
Are Alternative Admissions Plans Efficient? ............................................................. 12
Do Purposeful Bans on Affirmative Action Reduce Student Participation
of Underrepresented Minorities? ............................................................................... 13
Empirically Guided Recommendations for Considering Percent
Plan Implementation ....................................................................................................... 15
Understand and Forecast Your State and Institutional Context .............................. 15
Carefully Consider the Effects of Race-Neutral Policies in Admissions .................. 16
Broaden and Leverage the Concept of K-16 Partnerships, Especially in
Recruitment ................................................................................................................. 16
Thoughtfully Provide and Allocate Resources Across Multiple Tiers
of Support Associated With Admission ..................................................................... 16
Create Stakeholders for Access Teams Within a State ............................................. 17
Conclusion ........................................................................................................................ 17
References ........................................................................................................................ 19
Notes ................................................................................................................................. 24
Texas Top Ten Percent Plan 1
In June 2013, the United States Supreme Court ruled on the most recent in a series of cases
challenging the legality of race-conscious college admissions processes. Specifically, this
case argued that the automatic admissions policy in Texas, the Top Ten Percent Plan
(TTPP), had been so effective as to render any race-conscious admissions plan unnecessary
and therefore unlawful. In Fisher v. University of Texas at Austin (2013), the Court
recognized the right of universities to pursue diversity as a compelling educational interest
and affirmed prior decisions supporting the legality of the consideration of race in
admissions. It also highlighted the critical nature of rigorous social science in making and
defending sound decisions about admissions policies. Specifically, Justice Kennedy’s
majority decision in the Fisher case noted that institutions have an obligation to document
“whether a university could achieve sufficient diversity without using racial classifications.”
Said differently, the decision clarified that judges cannot simply defer to colleges but must
reach their own conclusions on this key issue.
Applying the judicial standard of review articulated in Gratz v. Bollinger (2003), Grutter v.
Bollinger (2003), and Regents of the University of California v. Bakke (1978), the Supreme
Court in Fisher v. University of Texas at Austin (2013) held that the lower courts did not view
the Texas TTPP in the light of strict scrutiny, requiring the University of Texas to prove that
its admissions plan “is narrowly-tailored to achieve the benefits of diversity,” and remanded
the case to the Fifth Circuit for findings consistent with the judicial standard. In 2014, the
Fifth Circuit Court again found the Texas admissions policy to be narrowly tailored. In
particular, this court found that
…race-conscious holistic review is necessary to make the Top Ten Percent Plan
workable by patching holes that a mechanical admissions program leaves in its
ability to achieve the rich diversity that contributes to its academic mission—as
described by Bakke and Grutter. (Fisher v. Texas, 2014, p. 35)
A key rationale of this court’s decision identifies that the successful admission of additional
minority students under the percent plan was a result of the changing demography of Texas
as well as the continuing trends toward resegregation in the state’s secondary education
system. In June 2015, the Supreme Court agreed to rehear Fisher. At issue again is whether
models such as the percent plan have been indeed sufficiently successful to act as a reliable
workable race-neutral alternative.
A critical role of this report then is an assessment of the now more than 15-year study of the
Texas TTPP. Automatic admissions policies—commonly referred to as percent plan
policies—are located as a form of state or gubernatorial policy in Texas, California, and
Florida and guarantee admission to a certain percentage of their high school graduates.
Initially a state-level response to the end of race-conscious admissions as a result of the
1996 Fifth Circuit Court of Appeals decision in Hopwood v. University of Texas, prohibiting
affirmative action in university admissions in Texas and evolving into, for certain

2 Texas Top Ten Percent Plan
universities, an important mechanism within an “affirmative action plus” plan following
Grutter v. Bollinger, percent plans remain an important ostensibly race-neutral mechanism
to carefully understand (Grutter v. Bollinger, 2003).
To that end, our charge with this paper is to review briefly the particulars of the three
percent plans and their outcomes to date in a scaled way. In particular, in this paper we
seek to do four things: (a) summarize the broad contributions to students’ opportunities to
access college; (b) describe the three state percent plans currently in place and the
important role demography plays in their implementation; (c) synthesize what is known
empirically about percent plans, their value, strengths, and limitations; and (d) provide
empirically based considerations related for implementing a percent plan or race-neutral
method. While the U.S. Department of Education and the U.S. Department of Justice have
provided guidance to universities on the use of race in higher education settings in the
United States (U.S. Department of Justice & U.S. Department of Education, n.d.), in this paper
we seek to contribute to efforts to implement admissions strategies appropriate within the
nation’s developing law through the presentation of research-based recommendations. That
is, we synthesize what we know from rigorous and related legal, theoretical, and empirical
analyses to guide institutions and their leaders on race-conscious issues to date in the form
of research-based recommendations, in particular recommendations related to responsibly
designed research and evaluation.
Accessing College
In order to understand percent plans and their relative effectiveness as admissions
strategies, it is important first to place that discussion in the broader frame of what factors
we know affect college access, particularly for traditionally underserved students. This
paper is influenced, conceptually, by several related sets of frameworks for understanding
the college access to success trajectory. First, Perna, Rowan-Kenyon, Bell, Thomas, and Li’s
(2008) theoretical model of student college enrollment (Figure 1) suggests that multiple
layers of influence are brought to bear in the decision-making process: students and their
families; K-12 schools; higher education institutions; and the broader societal, economic,
and policy context. Specifically, this model, building from St. John (2003), emphasizes that
the quality and quantity of available resources and the information provided with respect to
those resources influence how each layer in this model mediates or moderates the choice
process. For example, financial aid available through institution, state, and federal sources
bound the overall choices applicants have to consider when they are making decisions
about college application and enrollment decisions (e.g., Heller, 1999; Kane, 2003; van der
Klauuw, 2002). Additionally, aid influences application and enrollment decisions to the
extent that students have access to and understanding of clear and useful information about
what the relative impacts are of related choices (e.g., availability of types of merit and/or
need-based aid; selection of loans versus grants; the broader implications of community
college versus 4-year attendance; Dynarski, 2000; Heller, 1999; Kane, 2003). Said

Texas Top Ten Percent Plan 3
differently, the model reflects that “state and federal policies may directly impact access to
information through programs aimed at reducing college knowledge barriers” (Bell, Rowan-
Kenyon, & Perna, 2009, p. 668), further substantiating previous work examining the role of
state policies on college enrollment decisions (Perna & Titus, 2004). As such, this
framework clarifies important complexities that inherently underlie the understanding of
percent plans (most prominently in Texas but also with implications in other states where
these admissions plans currently exist).
Figure 1 Conceptual model of the influences on student access and enrollment. From “Typology of Federal, State, and Local Public Policies Designed to Promote College Access” by L. W. Perna, H. T. Rowan-Kenyon, A. Bell, S. L. Thomas, and C. Li, 2008, Journal of Higher Education, 79, p. 248. Copyright 2008 by The Ohio State University. Reprinted with permission.

4 Texas Top Ten Percent Plan
Additionally, work on college access outcomes from economics has contributed to a
conceptual frame for understanding college access. Using a variety of datasets both within
and outside of traditional education data systems, such work has provided additional detail
on family characteristics, wealth in addition to income, as well as operationalization of
access to information networks. Research leading to the turn of the century began to
emphasize the role of family characteristics and academic achievement in addition to the
role of aid on the college enrollment (Figure 2; e.g., Ellwood & Kane, 2000; Heller, 1997;
McPherson & Schapiro, 1991, 1998). After 2000, however, the notion of information
networks in the college access equation became more prominent, and the use of novel data
sources to quantify this phenomenon aided in further understanding this process. Of
particular relevance was the acknowledgment of information forces about college
opportunity in regard to applications, state policies, outreach, and so on (Avery & Kane,
2004; Dynarski, 2004; B. T. Long & Riley, 2007; M. C. Long & Tienda, 2008; Pallais & Turner,
2006, 2007). Figure 3 attends to these factors in a more comprehensive way.
Initiated in Texas and varied in their guarantees, such policies, colloquially referred to as
percent plans, offer an alternative race-neutral path to college admissions in Texas,
California, and Florida (Horn, 2012; Horn & Flores, 2003). The percent plans currently
being implemented in Texas, California, and Florida share some overlap, but are largely
divergent in guarantees and processes (see Table 1). Each state’s plan and guarantees are
discussed briefly, in turn below.
Figure 2 Model of college enrollment: Influence of family characteristics and academic achievement.

Texas Top Ten Percent Plan 5
Figure 3 Model of college enrollment: Influence of information networks in addition to aid and academic preparation.
What Are the Percent Plans and How Does Demography Play a Role in Understanding Their Effectiveness?
In Texas, eligible students must graduate in the top 10% of their high school class,1 a
classification made at the end of the junior year or beginning of senior year in high school
(College for All Texans, 2012; Horn, 2012). Over time, revisions to the law resulted in the
requirement that students graduate with a recommended or advanced high school program
of study (or the portion of program available to them; Texas Education Code [TEC], 2009,
51.803–51.809). The Texas percent plan policy does not explicitly discuss the use of race-
conscious scholarships and outreach, but multiple universities as well as the Higher
Education Coordinating Board maintain either individual or community-based grant
opportunities for percent plan students with demonstrated financial need.
The University of California’s (UC) Eligibility in Local Context (ELC) plan provides
guaranteed admission to a UC system institution for students graduating in the top 9% of
their respective high school classes (Horn, 2012; Horn & Flores, 2003). While students
identify campus preferences, ELC does not provide guarantee that the student will be
granted that preference, unlike Texas. Eligible students must have completed 11 UC-
approved a-g courses2 prior to the senior year and a UC-calculated GPA that meets or
exceeds the threshold set by the university system for that high school (Horn & Flores,
2003). Similar to Texas, UC’s policy does not discuss financial aid or outreach requirements,
and to date, no scholarships have been directly associated with ELC.

6 Texas Top Ten Percent Plan
Table 1 Percent Plan Guarantees in Texas, California, and Florida
Question Texas California (original)
California (revised)b
Florida
Who gains admission?
Top 10%: public and private
Top 4%: comprehensive public and private
Top 9%: comprehensive public and private
Top 20%: public
To what does the policy grant admission?
Texas public university of student’s choicea
A UC system university, but not necessarily of student’s choice
A UC system university, but not necessarily of student’s choice
A state university system campus, but not necessarily of student’s choice
What are the coursework and other requirements?
Since 2004, recommended or advanced high school program or portion of program available to students
a-g system eligible coursework requirements
a-g system eligible coursework requirements
State-mandated coursework
Does the policy allow for or address race-conscious scholarships and outreach?
No; high–school-based scholarships and outreach
No; high–school-based scholarships and outreach
No; high–school-based scholarships and outreach
Yes, both allowed at time of implementation
Note. Sources: Horn & Flores (2003); Marin & Lee (2003); University of California Office of Strategic Communications (2009). aIn 2009, the Texas legislature modified the law to cap the guaranteed admissions to University of Texas at Austin to 75% of the entering class (i.e., TEC, 2009, §51.803). bIn 2009, the UC Board of Regents modified the original Eligibility in Local Context (ELC) parameters (University of California Office of Strategic Communications, 2009).
Florida’s Talented 20 program provides guaranteed admission to one of the state university
system campuses for students graduating in the top 20% of their high school classes after
the 7th semester of high school (Horn, 2012; Horn & Flores, 2003). Students must complete
a designated set of 18 courses (Florida Department of Education, 2005). While aid is not
directly attached to the Talented 20 program, priority for financial aid is given to those
students in awarding the Florida Student Assistance Grant (Florida Department of
Education, 2005). Unique to the Talented 20 program, the original design maintained
opportunities to undertake race-conscious outreach efforts (despite the plan’s connection

Texas Top Ten Percent Plan 7
to the state’s One Florida initiative which prohibits such efforts in the admissions process;
Marin & Lee, 2003).
In summary, then, while packaged in similar rhetoric of transparent eligibility, the three
plans offer substantially different opportunities to access public higher education in their
respective states. On one extreme, Texas offers the least restrictive set of guidelines,
whereas California, on the other, offers much more reserved benefits for eligible students.
Additionally, the percent plans also operate within a complex landscape of other state
policies related to higher education often tied to legislative priorities and available funding
for public higher education. Among the percent-plan states in this analysis, Florida, for
example, has invested heavily in merit aid scholarship approaches prioritizing grades and
test scores for award receipt (Heller & Marin, 2004). Texas invested heavily in need-based
financial aid in the early 2000s then instituted tuition deregulation that negatively affected
some racial groups over others (Flores & Shepherd, 2014).
Demography and State Policy
In understanding the implementation and outcomes of percent plan policies, it is essential
to acknowledge the connection between a state’s demography and its policy. In this paper,
we use Texas to illustrate this point. Between 2000 and 2010, the Hispanic population
accounted for more than 50% of the total increase in the U.S. population (15.2 million out of
27.3 million). The Black population also grew faster than the total U.S. population (12%
versus 9%; Ennis, Rios-Vargas, & Albert, 2011; Rastogi, Johnson, Hoeffel, & Drewery, 2011).
And these demographics are reflected in the nation’s changing postsecondary education
population. By 2011, for example, Hispanics constituted the largest minority group at the
nation’s 4-year colleges and universities (Fry, 2011; Fry & Lopez, 2012).
During this same period, Texas had the greatest numeric population increase of all U.S.
states (four million) as well as registering the second largest number of Hispanics (after
California) and the third largest number of Blacks (after New York and Florida; Ennis et al.,
2011; Mackun & Wilson, 2011; Rastogi et al., 2011). In fact, data from the Integrated
Postsecondary Education Data System (IPEDS) in 2010 show that Texas had the nation’s
largest Black and Hispanic 4-year undergraduate populations (Flores & Park, 2013).
In connecting the potential enrollment success of an implemented percent plan with
demography, then, one necessary condition would include a large youth age population
both eligible to and enrolling in college. Figures 4 and 5 present, geographically, the
tremendous growth of the eligible underrepresented student population in Texas over time.
That demographic success, however, masks substantial gaps in expected rate of growth
based on population size and more specifically where students are choosing to enroll in
college. For example, despite an increase of more than 237,000 Hispanic college enrollees
from 2000 to 2011, Texas remains well below the state higher education board’s enrollment

8 Texas Top Ten Percent Plan
goals, which were set with consideration of the fact that Hispanics are expected to become
the largest racial/ethnic group in the state by 2015. Black student college enrollment has
fared more positively, although a growing majority of this enrollment has occurred at the
community college level (Flores & Park, 2013).
Figure 4. Texas minority college eligibility, 2000. Figure created by Jacob Thornton and Stella M. Flores. PUMA = public micro data area.
Texas Top Ten Percent Plan 9
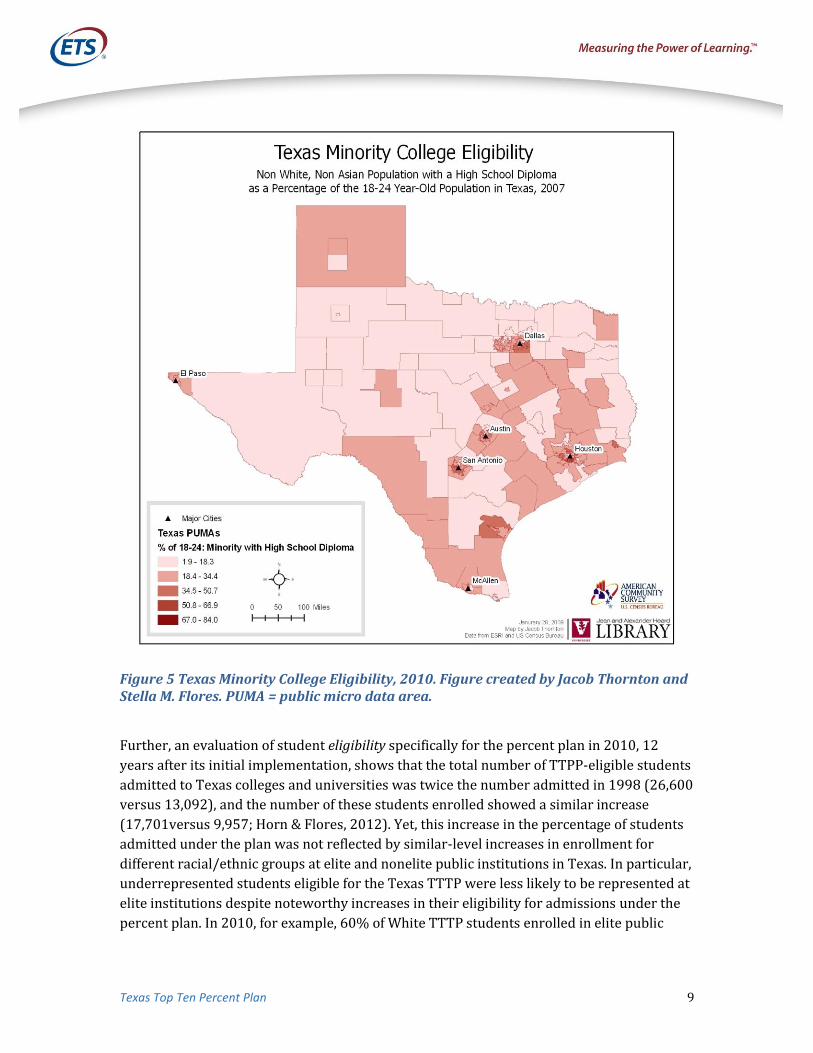
Figure 5 Texas Minority College Eligibility, 2010. Figure created by Jacob Thornton and Stella M. Flores. PUMA = public micro data area.
Further, an evaluation of student eligibility specifically for the percent plan in 2010, 12
years after its initial implementation, shows that the total number of TTPP-eligible students
admitted to Texas colleges and universities was twice the number admitted in 1998 (26,600
versus 13,092), and the number of these students enrolled showed a similar increase
(17,701versus 9,957; Horn & Flores, 2012). Yet, this increase in the percentage of students
admitted under the plan was not reflected by similar-level increases in enrollment for
different racial/ethnic groups at elite and nonelite public institutions in Texas. In particular,
underrepresented students eligible for the Texas TTTP were less likely to be represented at
elite institutions despite noteworthy increases in their eligibility for admissions under the
percent plan. In 2010, for example, 60% of White TTTP students enrolled in elite public

10 Texas Top Ten Percent Plan
institutions, compared to 69% of Asian American students, 44% of Hispanic students, and
only 34% of Black students. In that same year, 36% of Black TTTP students enrolled in the
nonselective 4-year sector of Texas higher education, compared to 29% of Hispanic
students, 19% of White students, and only 5% of Asian American students (Horn & Flores,
2012).
In sum, percent plans vary both in their guarantees and in the ways in which demographic
context nuances understanding of their effectiveness. Scholars have sought to consider
both, and in the paper we now turn to what the literature has identified about percent
plans, their strengths, and their limitations.
What Have We Learned From 15 Years of Research on Percent Plans and Other Race-Neutral Admissions Approaches?
In line with Justice Kennedy’s request for institutions to document whether universities can
achieve sufficient diversity without using racial classifications, in this section of the paper
we present peer-reviewed research examining a set of related questions. Indeed, such
questions have received some of the most rigorous analysis attention across multiple
disciplines and methodologies of educational topics researched to date. While numerous
scholars have contributed to the work on a range of diversity policies, we include the
studies because of their influence in the literature as examinations of race-neutral
alternatives from a policy analysis perspective. That is, the analyses consulted specifically
were used to examine the impact of various configurations of affirmative action and its
alternatives utilizing methodologies grounded in the theoretical frameworks that account
for the various factors that affect these plans and their intended beneficiaries.
Broadly, three strands of research regarding the use of affirmative action in selective
colleges and universities have surfaced in the public discourse and academic journals over
the last decade and a half (Flores & Oseguera, 2013). The first wave of research examined
relates to the effects of alternative admissions plans such as the state-specific race-neutral
admissions programs known as the college percent plans. The second wave of research
examines the role of these alternative measures as efficient substitutes to affirmative action.
The third wave of research evaluates the effects of state bans on affirmative action by way
of state legislation or voter referenda in college admissions, and more recently, the effects of
such bans in neighboring states.
Are Percent Plans Effective?
The Texas TTPP is perhaps the most evaluated such plan in the literature to date. Much of
research on the Texas plan and its effects on the state’s most selective and moderately
selective institutions has focused on whether the level of diversity achieved before
affirmative action was retracted has rebounded; whether college admissions mirrored the

Texas Top Ten Percent Plan 11
state’s evolving demographics, which is a goal of state higher education leaders; and, to a
lesser extent although still relevant, whether students admitted under a race-neutral regime
were persisting and completing college at reasonable rates (Niu & Tienda, 2010).
M. C. Long and Tienda (2008) found that changes in college admissions decision structures
from the percent plan prevented the type of rebound in diversity numbers experienced
under a traditional affirmative action (i.e., race-conscious) admissions plan. Kain, O’Brien,
and Jargowsky (2005) did find some restoration of diversity preban numbers, but they
attribute this to the increasing percentage of the minority population over time and not to
the effectiveness of the percent plan (Flores & Oseguera, 2013). More recently, Harris and
Tienda (2012) confirmed the significance of accounting for the changing demographics in
Texas, most notably the increasing percentage of Hispanic students. In particular,
accounting for the changes in the size of high school graduation cohorts shows Hispanic
students at a significant disadvantage in regard to enrollment outcomes compared to White
students at the state’s top two institutions. The authors provide additional clarity to the
notion of perceived enrollment success by identifying the difference between increased
enrollment outcomes on paper versus increased enrollment as it relates to the eligible
population of interest that should theoretically be enrolling in college according to their
rate of growth by age group. Specifically, Harris and Tienda (2012) found that Hispanic
students experienced their lowest application and admissions rates during the years the
percent plan was in effect, which resulted in their having a reduced presence at the state’s
flagship institutions compared to years when affirmative action was in place. These
analyses are particularly important because descriptive reviews of admissions rates that do
not account for demographic growth of groups such as Hispanic students, instead provides
a portrait of increasing higher representation of this group than would otherwise be
reported with appropriate statistical procedures. Said differently, ignoring the dramatic
changes in the high school graduate population gives the appearance of substantially
restoring access for students of color to levels before the percent plan, when, in reality, for a
much larger population and share of students of color, it has actually declined.
While statewide analyses of the effects of the percent plan have yielded negative results on
the use of this admissions alternative as a replacement for affirmative action, analysis of one
district in Texas employing a regression discontinuity design found some limited influence
of the percent plan on college enrollment into flagship institutions in Texas for both White
and minority (defined in the study as Asian, Black, and Hispanic) students. The results are
tempered by the fact, though, that the study only considered one large urban district and
found the strongest impacts only for students who attended high college-sending high
schools (Daughtery, Martorell, & McFarlin, 2012). That is, any effect of the percent plan on
flagship enrollment is concentrated in high schools that already send high percentages of
students to college. In contrast, data from this large district show that the percent plan does
not have an effect for students who attend the most disadvantaged high schools. In a state
where underrepresented minorities are concentrated in low-achieving segregated schools
12 Texas Top Ten Percent Plan
(M. C. Long & Tienda, 2008; Niu & Tienda, 2010), other state and national studies including
similar schools (e.g., Adelman, 2006; M.C. Long, Iatarola, & Conger, 2009) identify a low
probability that they will adequately prepare students equally for 4-year institutions.
Interestingly, the analytic attention given to the Texas TTPP has not been seen in other
states due primarily to issues of data availability stemming from coordination of statewide
data systems and linking of the K-12 sector to that of the postsecondary sector. Much of the
work on California, for example, has focused on the effects of state bans on affirmative
action, primarily Proposition 209 (Grodsky & Kurlaender, 2010). In Florida, the work
remains largely in the form of descriptive statistics, preventing a clearer understanding of
the performance of the Talented 20 program.
Are Alternative Admissions Plans Efficient?
Building on work in the areas of taste-based discrimination (Becker, 1971), statistical
discrimination (Arrow, 1973; Phelps, 1972), and the effects of affirmative action in the labor
market (Coate & Loury, 1993; Lundberg, 1991), Chan and Eyster (2003) examined whether
a ban on traditional affirmative action practices at a highly selective public institution in
California equalized the applicant pool by failing to give minority students the advantage of
admitting them with lower test scores. Using administrative data within a framework of
efficiency, the authors determined that adopting an admissions rule that ignores
standardized test scores and other measures of academic ability, traditionally identified by
admissions officers for all applicants, is inefficient, because doing so does not select the best
candidates from any ethnic group (Flores & Oseguera, 2013). Said differently, admissions
rules that partially ignore qualifications yield less qualified candidates than an affirmative
action rule that yields similar diversity but more qualified candidates.
Using data from the 1989 College and Beyond dataset, Fryer and colleagues (Fryer, Loury, &
Yuret, 2008) provided another experiment on what they call the limits of race-neutral
approaches (Flores & Oseguera, 2013). Student outcomes were analyzed under three
regimes: a color-conscious approach (authors use color-sighted) that uses traditional
affirmative action practices; a color-blind approach equivalent to a race-neutral approach
that incorporates proxies for race and ignores other measures of academic ability; and a
laissez-faire approach that essentially does not incorporate affirmative action practices but
operates more like a cutoff score, whereby applicants who meet a particular standard are
admitted, and those who do not are not admitted. Similar to the work of Chan and Eyster
(2003), Fryer et al. (2008) found that employing color-blind rather than color-sighted
affirmative action resulted in a loss of efficiency, from less than 1 percentage point to just
over 6 percentage points, depending on the college (e.g., differences in the size and location
of elite institutions). In sum, the work of Fryer et al. (2008) suggests that firms (or
organizations) constrained by a color-blind system (i.e., race neutral), yet still concerned
with diversity, will employ rules that ultimately flatten the function that relates to a

Texas Top Ten Percent Plan 13
worker’s (i.e., student’s) level of qualification. Some less qualified candidates will have a
greater chance of being accepted and some more qualified candidates will face a lower
chance of acceptance. The authors caution that such a practice may reduce a worker’s (i.e.,
student) incentive of preparatory effort because of the loss of the benefit of this investment.
Do Purposeful Bans on Affirmative Action Reduce Student Participation of Underrepresented Minorities?
Employing a four-stage college choice strategy utilizing data from the National Longitudinal
Study of the High School Class of 1972, Arcidiacono (2005) presented one of the first
analyses to estimate structurally an individual’s decision on where to submit an application
by modeling expectations on admittance, financial aid, and future earnings. The paper
specifically evaluated the effect on Black students of eliminating race-conscious advantages
in the admissions and financial aid processes, including future earnings. Arcidiacono’s four-
stage model includes (a) students’ choice of where to submit applications; (b) schools’
decisions on admissions and financial aid; (c) students’ choice of where, or whether, to
attend a school, based on the amount of financial aid offered and alternative options, which
include opting out of college altogether and entering the labor market instead; and (d)
students’ decision to enter the labor market. Arcidiacono provided simulations using data
from a time well before states banned affirmative action, and therefore these simulations
should be understood in this context. For example, the data Arcidiacono used looked at
college entry in 1974, just a few years before the landmark Bakke decision, which clarified
admissions practices in terms of race (Regents of the University of California v. Bakke, 1978).
Admittedly, the cohorts of Black students applying to college in that earlier era were
considerably smaller than current estimates of numbers of Black high school graduates,
which reached a record number in 2009, according to the 2010 U.S. Census (Fry, 2011).
Nevertheless, Arcidiacono found that removing affirmative action programs would have the
greatest effect on the percentage of Black students attending top-tier schools. In some cases,
the percentage of Black males attending colleges with an average SAT score above 1200 fell
by over 40%. He found a more modest effect on the general distribution of total Black
student enrollment; however, removing financial aid benefits related to race reduced the
percentage of Black students who enrolled in any college as well.
Similar results can be found in an examination of the effect of the most recent bans of
affirmative action on college admissions. The following analyses were used to examine
these new political phenomena, which are increasing in number, on a national scale. Using a
difference-in-difference strategy with Current Population Survey (CPS) and American
Community Survey (ACS) data from 1995 to 2003, Hinrichs (2012) examined how state
bans on affirmative action in California, Florida, Texas, and Washington affected college
enrollment, educational attainment, and the demographic composition of universities.
While there are numerous limitations with these data sources in that it is impossible to
account for precollege academic characteristics or the various stages of the choice process

14 Texas Top Ten Percent Plan
noted in other studies, there remains great value in the level of state representation in the
CPS data and in the size of the ACS sample. First, Hinrichs found that while there was no
effect from the bans on the typical student or typical college, the bans did reduce the
enrollment of underrepresented minorities and increase White enrollment at selective
colleges. Furthermore, in California in particular, there was a notable shift in where
underrepresented minority students were attending college, from more selective to less
selective campuses, confirming Arcidiacono’s (2005) findings as well as predictions of a
cascading effect found in various higher education news accounts (Selingo, 1999). Second,
and of most relevance to this review, is the finding that such bans caused a significant drop
in underrepresented student populations at the nation’s most selective colleges and
universities. Such a finding should not be surprising because affirmative action policies in
college admissions are most relevant in highly selective colleges and universities.
To measure the effects of bans via an institutional effect approach, Backes (2012) employed
data from the IPEDS. The author contributed to this wave of research on state bans despite
having used aggregate level data by attempting to account for state-level policies likely to
affect college admissions such as a high-stakes accountability system, a high school exit
exam, and the presence of a percent plan. Backes found that fewer Black and Latino
students enrolled at the most selective institutions as a result of the state bans. In short, the
effects of affirmative action, as noted in previous studies, were limited to the nation’s most
selective colleges and universities. Also relevant to this review is the author’s finding
regarding enrollment shifts at private universities as a result of the state bans on
affirmative action in college admissions. The study did not find an increase in minority
student enrollment at private institutions in states with bans. In sum, a shift in the higher
education landscape for traditionally underrepresented student enrollment in states with
bans seems to be toward lower tier rather than higher ranked institutions.
Utilizing another national data source although with longitudinal student level data, the
National Educational Longitudinal Study of 1992, Howell (2010) provided simulation
analyses that indicated that a nationwide ban on affirmative action would decrease
minority enrollment nationally by 2% across all levels of selectivity in U.S. colleges and
universities. When accounting for selectivity, however, the effect changes substantially. That
is, implementing race-neutral admissions across the nation would decrease minority
enrollment at selective 4-year colleges by 10.2%. The effect is also not likely to be mitigated
even by offers of financial incentives. Howell left some hope open in restoring some level of
diversity through heavy recruitment of minority students but did not provide evidence on
effective practices as this was not the intent of the study. Blume and Long (2014) provided
similar results in a recent similar national analysis using a more updated national dataset
(although with implications that go beyond the banned affirmative action states of interest).
The authors, unsurprisingly, found substantial declines in levels of affirmative action
practiced in highly selective colleges in ban states. However, new to this area of literature is
their finding that the decline in use of affirmative action in such states also negatively

Texas Top Ten Percent Plan 15
affected students who live in adjacent states that lack highly selective colleges (e.g., Nevada,
Arizona, and Idaho).
Empirically Guided Recommendations for Considering Percent Plan Implementation
Justice Kennedy’s majority decision in the Fisher case upheld the compelling benefits of
diversity but also emphasized the obligation of universities to meet rigorously the
expectations of narrow tailoring, specifically that institutions have an obligation to
document “whether a university could achieve sufficient diversity without using racial
classifications” (Fisher v. University of Texas at Austin, p. 10). Specifically, universities were
admonished by the Court in the Court’s rigorous expectation of universities having a
narrowly tailored policy. Should institutional and state decision makers consider the ways
in which alternative admissions plans to affirmative action, such as percent plans, might be
incorporated into their higher education systems, we provide a set of empirically guided
recommendations comprised from over a decade of rigorous social science research.
Understand and Forecast Your State and Institutional Context
First, it is essential to acknowledge the demographic, economic, political, and broader
context in which the discussion of race-conscious admissions is occurring and carefully
consider the implications of that context on potential success of an admissions plan.
Further, such information may prove useful in creating essential, targeted related outreach,
recruitment, and scholarship efforts. Finally, careful attention to context reflects the
dynamic rather than static nature of the nation’s college-age student population, and
reinforces a commitment to regularly review our outreach and recruitment efforts in
particular. For example, this dynamic context is occurring across a number of states due to
factors such as immigration, a surge in minority births, and the combination of more deaths
and fewer births from the White population (Frey, 2013). Five jurisdictions now have
majority-minority populations (California, Hawaii, New Mexico, Texas, and Washington,
D.C.) and 14 have majority-minority child populations under the age of 5 (Arizona,
California, Delaware, Florida, Georgia, Hawaii, Maryland, Mississippi, New Jersey, New
Mexico, New York, Nevada, Texas, and Washington, D.C.). In addition, four jurisdictions
contain over half of all foreign-born residents and 14 others exceed the national average
share of the foreign born in the United States. State and institutional leaders would be wise
to consider the forthcoming shifts in the K-16 population, the electorate, and other socio-
political dimensions of their governing context. In summary, there are very different racial
and ethnic compositions both between and within states that shape the possible kinds of
diversity colleges can achieve and with whom they must be prepared to support effectively.

16 Texas Top Ten Percent Plan
Carefully Consider the Effects of Race-Neutral Policies in Admissions
The term race-neutral may be reflected in a broad array of admissions practices, which may
need to be understood more precisely by institutions in regard to their effects, in assessing
their admissions strategies moving forward. Local practices such as holistic review or test-
based admissions, motivated by a variety of influences including state bans as described
earlier, need to continue to be carefully understood by institutional leaders.
Multidisciplinary research across various state contexts, and the nation as a whole, to date
has found that these alternative admissions plans do not reach or sufficiently restore the
level of race and ethnic diversity present before the retraction of affirmative action. And
knowing the outcomes of such decisions is a first step in understanding how to move into
the future with other programming and policy decisions.
Broaden and Leverage the Concept of K-16 Partnerships, Especially in Recruitment
Increasingly, states are turning toward legislated policies that seek to create a seamless
flow for students from primary to secondary to tertiary education and a connectedness to
the curricular experiences across grades and educational levels. Such a policy framework
marks an important shift conceptually, from traditional models construing each of these
educational levels as separate propositions and thus contributing to the continued
stratification of educational opportunities and outcomes, through the perpetuation of
multiple and often competing levers of power and knowledge (e.g., Antonio, Venezia, &
Kirst, 2004; Kirst & Venezia, 2004). In specifically enhancing admissions efforts, then, such
partnerships may enhance outreach as well as longer term academic signaling. That is, the
reform toward a seamless transition to higher education may induce students not likely to
consider college; this possibility may translate into decisions by students to take more
college-ready coursework to prepare them for the transition into the next sector of higher
education. Such efforts have been documented already in regard to changes in curriculum
choice in Texas (Domina, 2007) although the follow-through into college application
behavior has had less success (Horn & Flores, 2012).
Thoughtfully Provide and Allocate Resources Across Multiple Tiers of Support Associated With Admission
Institutions need to allocate resources to recruitment and retention carefully and connect
them to the broader literature on what influences college choice. In particular, the empirical
research suggests that substantial institution-driven resource allocation needs to be made
with regard to enhancing student applications to the most rigorous institutions. Various
research studies have documented the benefit of attending a more selective institution as it
relates to college completion outcomes. Access-driven policies, however well intentioned,
without supports to apply or to persist in college are an incomplete formula for success in

Texas Top Ten Percent Plan 17
particular in institutions with fewer resources and capacity to support students, as
compared to their better-resourced and more selective institutions.
Create Stakeholders for Access Teams Within a State
Finally, it is important to recognize the strain this kind of effort puts on already limited
university resources. Universities might seek to leverage current and ongoing efforts,
particularly with regard to data collection at the state and national level, as well as to
consider the formation of multistakeholder partnerships to take on these tasks.
Organizations such as Marta Tienda’s Texas Higher Education Opportunity Project at
Princeton University and others serve as strong examples of the ways in which scholars,
state officials, private foundations, and university leaders can work together to produce
rigorous assessment useful in improving institutional decision making. In regard to data
collection, the State Higher Education Executive Officers have provided a series of reports
detailing the capacity of state data systems across the K-20 sectors including workforce
commissions. Understanding how to capitalize on a state’s data capacity to create stronger
K-13 and higher education policy through such innovative data systems could lead to
stronger and more creative policy development within a state and institution environment.
Conclusion
Analyses of data over the last 12 years suggest two stories related to percent plans
effectiveness, at least in Texas. First, the soaring numbers of the non-White population,
particularly Latinos, among college-eligible students may be leading to inaccurate praise of
not only the percent plan but other related state college enrollment policies as well. More
accurate assessments of percent plan effectiveness that account for these demographic
realities indicate that Latinos are less likely to go to college despite their heavily increasing
share of the high school graduate population (Flores & Park, 2013). The second story of the
percent plan in Texas is where eligible students choose to go to college. As noted, the data
suggest that underrepresented students who are percent–plan-eligible are more likely to
enroll in a nonselective flagship institution, a choice likely influenced by concentrated
disadvantage both economically and in the high schools attended (Harris & Tienda, 2012;
Horn & Flores, 2012). That is, an admissions guarantee does not guarantee enrollment, and
various data sources have pointed to this phenomenon to date.
In moving forward, then, what this body of research on the percent plans requires one to
consider is the balance in the relationship between the student and that student’s personal
context, the institution, and the policies that create opportunity. One of the fundamental
issues policy makers and university leaders alike have to address is the underlying
purpose(s) of admissions and how to assess whether those purposes are being met through
the strategies being used. While those in the middle of percent-plan implementation and
those watching in the wings consider next steps, the paper ends with four simple questions
18 Texas Top Ten Percent Plan
to start the process. First, how can or will the implemented policy contribute to better and
more meaningful connections between the primary, secondary, and postsecondary sectors?
Second, in what ways does or can the policy address the broader factors that influence
substantially access to college? Third, to what extent is a university or system willing to
trade autonomy for transparency in college admissions and to what end? Finally, how are
(or will be) outcomes of such policies defined, measured, and evaluated, and in what
disaggregated contexts?
These simple examples, nestled in the broader empirical literature described, underscore
the importance, then, of having a clear and shared policy and implementation
understanding of disaggregation, where fine-grained income status and geography more
complexly understood, also proved important qualifiers to understanding policy success.
Part of what will allow for this serious work to be done is to build, maintain, and put to use
seamless data systems that connect at the individual-level preschool through college
experiences and outcomes and include adequate flags that let policy makers and educators
carefully track the progress of all students through the full educational pipeline (Hoffman,
Vargas, Venezia, & Miller, 2007). As the higher education community contemplates percent
plans as possible mediators of the equity crisis, then, there is much to be learned from the
case studies available in the United States, and much work left to be done to cultivate their
success.
Texas Top Ten Percent Plan 19
References
Adelman, C. (2006). The toolbox revisited: Paths to degree completion from high school to college. Washington, DC: U.S. Department of Education.
Antonio, A. L., Venezia, A., & Kirst, M. W. (2004). Addressing the development of college knowledge: Concepts to improve student transitions from high school to college (The Bridge Project Report No. 15). Retrieved from http://www.stanford.edu/group/bridgeproject/EAQ 1-31-04.pdf
Arcidiacono, P. (2005). Affirmative action in higher education: How do admission and financial aid rules affect future earnings? Econometrica. 73, 1477–1524.
Arrow, K. (1973). The theory of discrimination. In O. Ashenfelter & A. Rees (Eds.), Discrimination in labor markets (pp. 3–33). Princeton, NJ: Princeton University Press.
Avery, C. N., & Kane, T. J. (2004). Student perceptions of college opportunities: The Boston COACH program. In C. Hoxby (Ed.), College choices: The economics of where to go, when to go, and how to pay for it (pp. 355–394). Chicago, IL: University of Chicago Press.
Backes, B. (2012). Do affirmative action bans lower minority college enrollment and attainment? Evidence from statewide bans. Journal of Human Resources, 47, 435–455.
Becker, G. S. (1971). The economics of discrimination. Chicago, IL: University of Chicago Press.
Bell, A. D., Rowan-Kenyon, H. T., & Perna, L. W. (2009). College knowledge of 9th and 11th grade students: Variation by school and state context. The Journal of Higher Education, 80, 663–685.
Blume, G. H., & Long, M. C. (2014). Changes in levels of affirmative action in college admissions in response to statewide bans and judicial rulings. Educational Evaluation and Policy Analysis, 36, 228–252.
Chan, J., & Eyster, E. (2003). Does banning affirmative action lower college student quality? The American Economic Review, 93, 858–872.
Coate, S., & Loury, G. C. (1993). Will affirmative-action policies eliminate negative stereotypes? The American Economic Review, 83, 1220–1240.
College for All Texans. (2012). Top 10% scholarship program. Retrieved from http://www.collegeforalltexans.com/apps/financialaid/tofa2.cfm?ID=385

20 Texas Top Ten Percent Plan
Daughtery, L., Martorell, F., & McFarlin, I. (2012). Percent plans, automatic admissions and college enrolment outcomes (Working Paper No. 12–18). Ann Arbor, MI: University of Michigan, National Poverty Center.
Domina, T. (2007). Higher education policy as secondary school reform: Texas high schools after Hopwood. Educational Evaluation and Policy Analysis, 29, 200–217.
Dynarski, S. (2000). Hope for whom? Financial aid for the middle class and its impact on college attendance (Working Paper No. 7756). Cambridge, MA: National Bureau of Economic Research.
Dynarski, S. M. (2004). The new merit aid. In C. M. Hoxby (Ed.), College choice: The economics of where to go, when to go, and how to pay for it (pp. 63–100). Chicago, IL: University of Chicago Press.
Ellwood, D. T., & Kane, T. J. (2000). Who is getting a college education? Family background and the growing gaps in enrollment. In S. Danziger & J. Waldfogel (Eds.), Securing the future (pp. 283–324). New York, NY: Russell Sage Foundation.
Ennis, S. R., Rios-Vargas, M., & Albert, N. G. (2011). The Hispanic population: 2010. Washington, DC: U.S. Census Bureau.
Fisher v. Texas, 758 F.3d 633 (5th Cir. 2014).
Fisher v. University of Texas at Austin, 570 U.S __ (2013).
Flores, S. M., & Oseguera, L. (2013). Public policy and higher education attainment in a 21st-century racial demography: Examining research from early childhood to the labor market. In M. Paulsen (Ed.), Higher education: Handbook of theory and research (Vol. 28, pp. 513–560). Dordrecht, Netherlands: Springer.
Flores, S. M., & Park, T. J. (2013). Race, ethnicity, and college success: Examining the continued significance of the minority-serving institution. Educational Researcher, 42, 115–128.
Flores, S. M., & Shepherd, J. (2014). The effect of tuition deregulation on low-income and underrepresented students in Texas. ANNALS of the American Academy of Political and Social Science, 655, 99–122.
Florida Department of Education. (2005). Talented 20. Retrieved from http://www.fldoe.org/talented20/
Frey, W. H. (2013, June 19). Shift to a majority-minority population in the U.S. happening faster than expected. Retrieved from the Brookings Institute website: http://www.brookings.edu/blogs/up-front/posts/2013/06/19-us-majority-minority-population-census-frey
Texas Top Ten Percent Plan 21
Fry, R. (2011). Hispanic college enrollment spikes, narrowing gaps with other groups. Retrieved from the Pew Hispanic Center website: http://www.pewhispanic.org/2011/08/25/hispanic-college-enrollment-spikes-narrowing-gaps-with-other-groups/
Fry, R., & Lopez, M. (2012). Now largest minority group on four-year college campuses, Hispanic student enrollments reach new highs in 2011. Retrieved from the Pew Hispanic Center website: http://www.pewhispanic.org/files/2012/08/Hispanic-Student-Enrollments-Reach-New-Highs-in-2011_FINAL.pdf
Fryer, Jr., R. G., Loury, G. C., & Yuret, T. (2008). An economic analysis of color-blind affirmative action. The Journal of Law, Economics, & Organization, 24, 319–355.
Gratz v. Bollinger, 539 U.S. 244 (2003).
Grodsky, E., & Kurlaender, M. (Eds.). (2010). Equal opportunity in higher education: The past and future of California’s proposition 209. Harvard, MA: Harvard Education Press.
Grutter v. Bollinger, 539 U.S. 306 (2003).
Harris, A. L., & Tienda, M. (2012). Hispanics in higher education and the Texas top 10% law. Race and Social Problems, 4, 57–67.
Heller, D. E. (1997). Student price response in higher education: An update of Leslie and Brinkman. Journal of Higher Education, 68, 624–659.
Heller, D. E. (1999). The effects of tuition and state financial aid on public college enrollment. The Review of Higher Education, 23, 65–89.
Heller, D. E., & Marin, P. (Eds.). (2004). State merit aid programs and racial inequality. Cambridge, MA: The Civil Rights Project at Harvard.
Hinrichs, P. (2012). The effects of affirmative action bans on college enrollment, educational attainment, and the demographic composition of universities. The Review of Economics and Statistics, 94, 712–722.
Hoffman, N., Vargas, J., Venezia, A., & Miller, M. S. (Eds.). (2007). Minding the gap: Why integrating high school and college makes sense and how to do it. Harvard, MA: Harvard Education Press.
Hopwood v. University of Texas, 78 F.3d 932 (5th Cir. 1996).
Horn, C. (2012). Percent plan admissions: Their strengths and challenges in furthering an equity agenda. Pensamiento Educativo: Revista de Investigacion Educacional Latinoamericana, 49, 31–45.

22 Texas Top Ten Percent Plan
Horn, C., & Flores, S. (2003). Percent plans in college admissions: A comparative analysis of three states’ experiences. Harvard, MA: The Civil Rights Project at Harvard University.
Horn, C., & Flores, S. (2012). When policy opportunity is not enough: Access and enrollment patterns among Texas percent plan eligible students. Journal of Applied Research on Children: Informing Policy for Children at Risk 3(2). Retrieved from http://digitalcommons.library.tmc.edu/childrenatrisk/vol3/iss2/9/
Howell, J. (2010). Assessing the impact of eliminating affirmative action in higher education. Journal of Labor Economics, 28, 113–166.
Kain, J. F., O’Brien, D. M., & Jargowsky, P. (2005). Hopwood and the Top 10 Percent law: How they have affected the college enrollment decisions of Texas high school graduates. Dallas, TX: The Texas Schools Project.
Kane, T. J. (2003). A quasi-experimental estimate of the impact of financial aid on college-going (Working Paper No. 9703). Cambridge, MA: National Bureau of Economic Research.
Kirst, M., & Venezia, A. (Eds.). (2004). From high school to college: Improving opportunities for success in postsecondary education. San Francisco, CA: Jossey-Bass.
Long, B. T., & Riley, E. (2007). Financial aid: A broken bridge to college access? Harvard Educational Review, 77, 39–63.
Long, M. C., Iatarola, P., & Conger, D. (2009). Explaining gaps in readiness for college-level math: The role of high school courses. Education Finance and Policy, 4, 1–33.
Long, M. C., & Tienda, M. (2008). Winners and losers: Changes in Texas university admissions post-Hopwood. Educational Evaluation and Policy Analysis, 30, 255–280.
Lundberg, S. J. (1991). The enforcement of equal opportunity laws under imperfect information: Affirmative action and alternatives. Quarterly Journal of Economics, 106, 309–326.
Mackun, P., & Wilson, S. (2011). Population distribution and change: 2000 to 2010. Retrieved from the U.S. Census Bureau website: http://www.census.gov/prod/cen2010/briefs/c2010br-01.pdf
Marin, P., & Lee, E. (2003). Appearance and reality in the sunshine state: The Talented 20 program in Florida. Cambridge, MA: The Civil Rights Project at Harvard University.
McPherson, M. S., & Schapiro, M. O. (1991). Does student aid affect college enrollment: New evidence on a persistent controversy. American Economic Review, 81, 309–318.
McPherson, M. S., & Schapiro, M. O. (1998). The student aid game. Princeton, NJ: Princeton University Press.

Texas Top Ten Percent Plan 23
Niu, S., & Tienda, M. (2010). Minority student academic performance under the uniform admission law: Evidence from the University of Texas at Austin. Educational Evaluation and Policy Analysis, 32, 44–69.
Pallais, A., & Turner, S. E. (2006). Opportunities for low-income students at top colleges and universities: Policy initiatives and the distribution of students. National Tax Journal, 59, 357–388.
Pallais, A., & Turner, S. E. (2007). Access to elites. In S. Dickert-Conlin & R. Rubenstein (Eds.), Economic inequality and higher education: Access, persistence and success (pp. 128–156). New York, NY: Russell Sage Foundation.
Perna, L. W., Rowan-Kenyon, H. T., Bell, A., Thomas, S. L., & Li, C. (2008). Typology of federal, state, and local public policies designed to promote college access. Journal of Higher Education, 79, p. 243–267.
Perna, L. W., & Titus, M. A. (2004). Understanding differences in the choice of college attended: The role of state public policies. The Review of Higher Education, 27, 501–525.
Phelps, E. S. (1972). The statistical theory of racism and sexism. The American Economic Review, 62, 659–661.
Rastogi, S., Johnson, T. D., Hoeffel, E. M., & Drewery, M. P. (2011). The Black population. Washington, DC: U.S. Census Bureau.
Regents of the University of California v. Bakke, 438 U.S. 265 (1978).
Selingo, J. (1999). A quiet end to the use of race in college admissions in Florida. The Chronicle of Higher Education, 46, p. A31.
St. John, E. P. (2003). Refinancing the college dream: Access, equal opportunity, and justice for taxpayers. Baltimore, MD: Johns Hopkins University Press.
Texas Education Code § 51.803–51.809 (2009).
University of California Office of Strategic Communications. (2009). UC regents adopt changes to freshman eligibility. Retrieved from http://www.universityofcalifornia.edu/news
U.S. Department of Justice, & U.S. Department of Education. (n.d.). Guidance on the voluntary use of race to achieve diversity in postsecondary education. Retrieved from http://www.justice.gov/crt/about/edu/documents/guidancepost.pdf
van der Klauuw, W. (2002). Estimating the effect of financial aid offers on college enrollment: A regression-discontinuity approach. International Economic Review, 43, 1249–1287.

24 Texas Top Ten Percent Plan
Notes
1 The 2009 revisions to the original Texas HB 588 legislation (i.e., TEC, 2009, §51.803) set a by-campus cap of 75% on the required proportion of entering students composed of percent-plan beneficiaries. The practical result has been a shift in the required rank to gain admission to the University of Texas at Austin. For example, students applying to University of Texas had to be in the top 7% of their high school classes to be eligible for automatic admission for the 2014–2015 academic year (University of Texas at Austin, 2014–2015).
2 The a-g courses are UC- and California State University (CSU)-approved courses that students are required to complete in high school in order to be eligible for admission consideration. Each course is assigned a letter from a though g. See http://collegetools.berkeley.edu/resources.php?cat_id=22#resource