texas a&m university system emp workshop … · aerco benchmark 3.0 condensing boilers. chiller...
TRANSCRIPT

TEXAS A&M UNIVERSITY SYSTEMENERGY MANAGEMENT PROGRAM
EMP WorkshopOctober 16 & 17, 2012
Texas A&M University-CommerceTexas A&M University-Commerce
Ronnie Scott, HVAC Supervisor
Gary Williamson Electrical Supervisor
2

Campus OverviewCampus OverviewTotal Gross Square Footage (GSF) – 2.3 million
Buildings Served ‐ 102 buildings
Size of Campus in Acres – 1,883
Number of Students, Faculty and Staff – 13,000 (< >)
FY12 Annual Purchased Utility Cost Electricity $3,066,681 Natural Gas $ 294,389 Water & Sewer $ 462,758 Solid Waste $ 27,217
3

Utility Plant ProductionUtility Plant ProductionDistrict Cooling and Heating
Chiller capacity: Main campus 2,650 tons on main loop Stand alone 1,555 tons Housing 1,100 tons
Boiler capacity Main campus 47.5 mmbtu Housing 16.5 mmbtu
40 percent of total campus GSF served by central utility plant
Type of utility plant and building automation system: Majority of campus is covered by Schneider Electric Siemens in three buildings
4

Greatest Challenge and PrioritiesGreatest Challenge and Priorities
Greatest challenge faced by your institution in the area of utilities and energy management:
Improving energy efficiency across campus while continuing to address on‐going campus needs
Three highest priorities to improve facility operation and reduce energy consumption and cost:
Upgrade mechanical systems in older buildings
Retrofit existing buildings with energy‐efficient lighting
Install light and HVAC occupancy sensors in classrooms and offices
5

Texas A&M University – KingsvilleTexas A&M University – Kingsville
Larry Lomas HVAC Supervisor
Rob RamirezExecutive Director of Physical Plant
Chris Vera Associate Director of Facilities Planning & Construction
Brittany Cord Assistant Director
of Facilities Administration
6

Campus OverviewCampus OverviewTotal Gross Square Footage – 2,272,299 Buildings Served ‐ 108Size of Campus in Acres – 250 acres 85 acres (mowing, edging, weeding, blowing, landscaping,
Ect..)119 acres (streets, hardscape & parking lots) Number of Students – 7,239Faculty and Staff ‐ 913FY12 Annual Purchased Utility Cost Electricity $4,366,386 Natural Gas $ 71,841 Water & Sewer $ 359,184 Solid Waste $ 138,556
7

Utility Plant ProductionUtility Plant Production District Cooling and Heating
2 ‐ central utility plants
3 – 650 ton chillers per plant; 3900 ‐ total tons
Boiler capacity (mmbtu) – 10.89 (approx. 6.5 buildings)
Percent of total campus GSF served by central utility plant
Cooling – 77.45% (1.76 Million GSF) Heating ‐ 12.04% (273,657 GSF)
Type of utility plant and building automation system
Centrifugal Chillers, Chilled Water Loop, Direct Primary 3‐pass, wetback, fire‐tube, steam boilers BAS ‐ 84% (1.8 Million GSF) – Siemens
8

Greatest Challenge and PrioritiesGreatest Challenge and PrioritiesGreatest challenge faced by your institution in the area of utilities and energy management
Aging infrastructure and funding for new energy management projects
Three highest priorities to improve facility operation and reduce energy consumption and cost
Metering of campus buildings
Educating the building users
Securing funding for investments into energy projects and to ensure operating efficiencies
9

10
TAMUCCTAMUCC
Van Franks Associate Director Facilities Services
John CaseyInterim Director
Facilities Services
William VillanuevaSystem Programmer I
Facilities Services
Joey VeraFacilities Maintenance
Supervisor Facilities Services

11
Campus OverviewCampus Overview
Total Gross Square Footage (GSF) 2.48 Million
Buildings Served 46
Size of Campus in Acres 390
Number of Students, Faculty and Staff 11,500
FY12 Annual Purchased Utility Cost $4.959 Million Electricity $3.683 Million Natural Gas $209,000 Water & Sewer $768,000 Solid Waste $88,000

12
Utility Plant ProductionUtility Plant Production
District Cooling and Heating
Describe central utility plant (if applicable)
Chiller capacity (tons) 6,000
Boiler capacity (mmbtu) 30.128
Percent of total campus GSF
served by central utility plant 56.3%
Type of utility plant and building automation system
Chilled/Hot Water Siemens Apogee
13
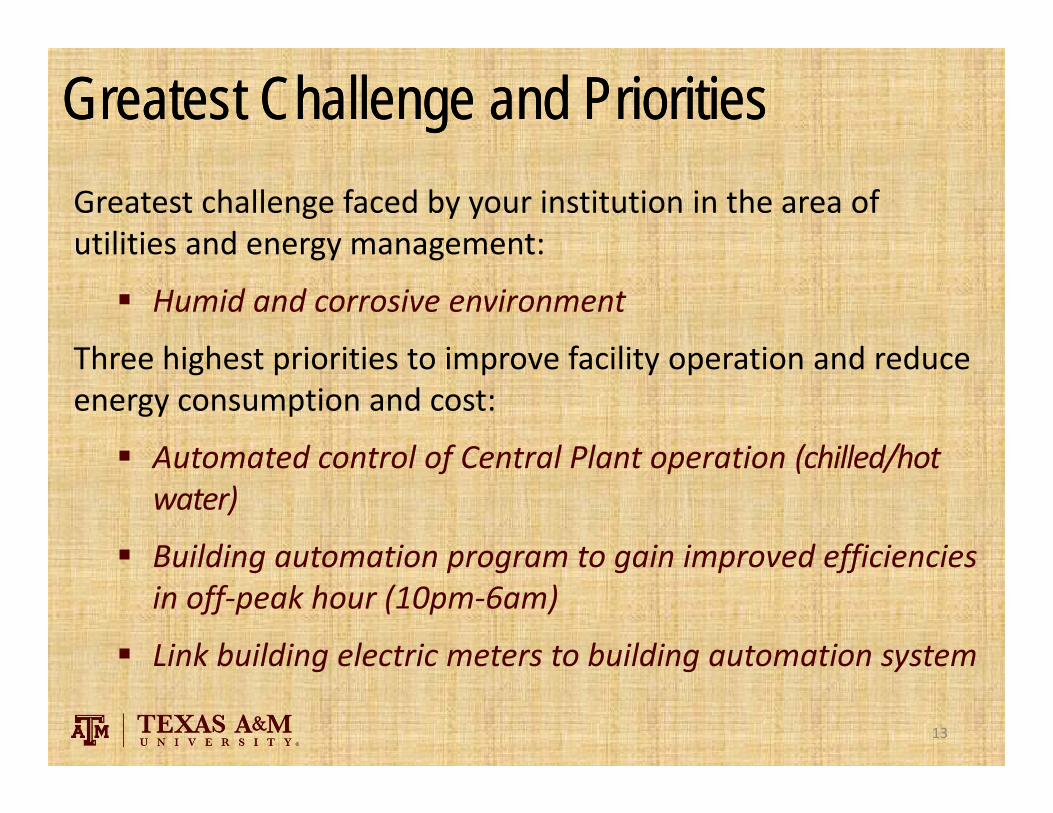
Greatest Challenge and PrioritiesGreatest Challenge and PrioritiesGreatest challenge faced by your institution in the area of utilities and energy management:
Humid and corrosive environment
Three highest priorities to improve facility operation and reduce energy consumption and cost:
Automated control of Central Plant operation (chilled/hot water)
Building automation program to gain improved efficiencies in off‐peak hour (10pm‐6am)
Link building electric meters to building automation system

Jeff AllenDirector of Facilities
Texas A&M University – TexarkanaTexas A&M University – Texarkana
Titus TurnerUtilities Manager
14

Campus OverviewCampus OverviewCampus Gross Square footage: 440,651Bringle Lake Campus: 326,666 Science & Technology Building 44,572 University Center 181,450 Physical Plant 14,729 Bringle Lake Village (Student Housing) 85,915
South Campus 113,985 Aikin Building 51,600 Academic Building 39,385 John F. Moss Library 23,000
Campus Size: 382 Acres*Students 1,960**Faculty 197**Staff 142** * As per LAR Budgeted FY13
** As per Banner Enrollment Status Report
15

FY12 ELECTRIC NATURAL GAS WATER TOTAL
Total Paid $373,115 $126,891 $150,699 $650,705
KWH 7,509,398 7,509,398
CCF 10,520 10,520
MMBtu 15,070 15,070
Unit Gallons 19,757,406 19,757,406
FY12 ANNUAL PURCHASED UTILITY COST
Campus OverviewCampus Overview
16

Utility Plant ProductionUtility Plant ProductionCentral Plant
Two (2) 1070 ton Trane Water Cooled Centrifugal Chillers
Two (2) 250 HP Cleaver‐Brooks 4WI‐700‐250‐1508,368 (1000 BTU/HR) Boilers
75% of campus buildings on main campus currently serviced
Siemens Insight
17

1. Greatest challenge faced by your institution in the area of utilities and energy management
Reduction or elimination of South Campus utility costs
2. Three highest priorities to improve facility operation and reduce energy consumption and cost
HVAC Scheduling Campus‐wide Energy Stewardship Central Plant Optimization
Challenges and PrioritiesChallenges and Priorities
18

Charles MuseEnergy Manager
Senior Director in Physical Plantand Director of Utilities
Dr. Corey BradfordSenior Vice President
Business Affairs & Chief Financial Officer
Larry WatsonAssistant Vice President
Physical Plant
Prairie View A&M UniversityPrairie View A&M University
ALLSENIOR BUILDING COORDINATORS
19

Campus OverviewCampus OverviewTotal Gross Square Footage (GSF) and Buildings Served
1,785,679 GSF
Size of Campus in Acres
1,500 ACRES
Number of Students, Faculty, and Staff
8,343 Students421 Faculty706 Staff
FY12 Annual Purchased Utility Cost
Electricity = $2,621.800Natural Gas = $404,755Water & Sewer = n/a
Solid Waste = $103,000
20

Utility Plant ProductionUtility Plant ProductionDistrict Cooling and HeatingPrairie View A&M University’s Central Utility Plant is located centrally in the University’s core on the main campus. It contains the oldest architecture (1916) among the University’s facilities. The plant provides all chilled water, heating hot water, and steam to main campus facilities, and provides for the central monitoring/control of the University’s electrical distribution, domestic water, fire alarm/firefighting, and wastewater treatment systems/facilities. Primary machinery located and operated within the plant include 5 chillers, 4 boilers, water softeners, de‐alkalizers, deaerator and other supporting equipment.
Chiller capacity (5,500 tons) Boiler capacity (110 mmbtu) 90% Percent of total campus GSF served by central utility plant Johnson Controls – Metasys EMS System
21

Greatest Challenge and PrioritiesGreatest Challenge and PrioritiesGreatest challenge faced by your institution in the area of utilities and energy management Utility Production and Distribution Optimization
Three highest priorities to improve facility operation and reduce energy consumption and cost Precise Utility Metering and Data Management
Building Energy Retro‐Commissioning
Customers Awareness, Education, Outreach and Engagement
22

Texas A&M Galveston (Facility Services) Texas A&M Galveston (Facility Services)
Will Heidel Director of Facility
Services
David Lang Asst. Director of Construction and
Renovation Pat Hebert Facilities
Coordinator
Frank Deharde A/C & Refrigeration
Mechanic IINo picture on file
23
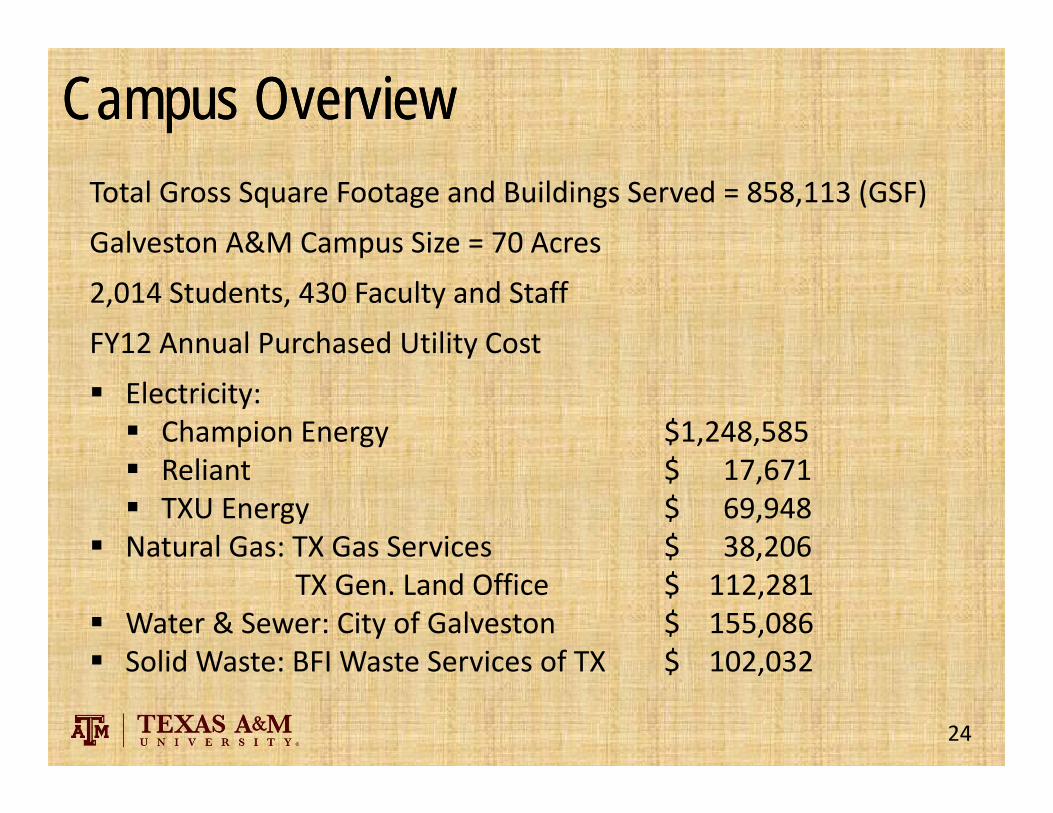
Campus OverviewCampus OverviewTotal Gross Square Footage and Buildings Served = 858,113 (GSF)
Galveston A&M Campus Size = 70 Acres
2,014 Students, 430 Faculty and Staff
FY12 Annual Purchased Utility Cost
Electricity: Champion Energy $1,248,585 Reliant $ 17,671 TXU Energy $ 69,948
Natural Gas: TX Gas Services $ 38,206TX Gen. Land Office $ 112,281
Water & Sewer: City of Galveston $ 155,086 Solid Waste: BFI Waste Services of TX $ 102,032
24

Utility Plant ProductionUtility Plant ProductionDistrict Cooling and HeatingOne central plant for chilled/hot water a/c and heat
Chiller capacity One 1000 ton chiller and two 500 ton chillers
80% percent of total campus GSF served by central utility plant One dorm with 200 PTAC a/c units One building with 15 roof top units
Type of utility plant and building automation system Siemens control system 70% of campus in digital and 30% is pneumatic
25

Greatest Challenge and PrioritiesGreatest Challenge and PrioritiesGreatest challenge faced by your institution in the area of utilities and energy management Deferred maintenance funding Controlling equipment to meet the supply needed at different times
Three highest priorities to improve facility operation and reduce energy consumption and cost Chiller Scheduling; Sea Aggie Center Control; Ocean Coastal Study
Building (OCSB) Control Train staff to be able to program and trend equipment use on
campus Need to replace the underground hot/cold water loop lines
26

Dan K. SmithAssociate Vice President for Physical Facilities
West Texas A&M UniversityWest Texas A&M University
27

Campus OverviewCampus OverviewTotal Gross Square Footage (GSF) and Buildings Served
92 buildings with 2,612,000 GSF
Size of Campus in Acres – 190 acre Main Campus
Number of Students, Faculty and Staff8,747
FY12 Annual Purchased Utility Cost Electricity ‐ $1,722,000.00 Natural Gas ‐ $600,000.00 Water & Sewer ‐ $1,000,000.00 Solid Waste ‐ $17,000.00
28

Utility Plant ProductionUtility Plant ProductionDistrict Cooling and Heating
Chiller capacity – 2,950 tons
Boiler capacity ‐ 132.889 mmbtu
Chillers: (3) 500 ton (2) 300 ton (1) 850 ton
29
BOILER NUMBER MANUFACTURER YEAR
INSTALLEDCAPACITY
/hr1 Cleaver Brooks Burner 1978 60 HZ
2 Cleaver Brooks Burner 1978 60 HZ
3 Erie City - Keystone 1963 16,000 KBTU
4 Erie City - Keystone 1963 16,000 KBTU
5 Erie City - Keystone 1969 25,700 KBTU

Utility Plant ProductionUtility Plant Production
Percent of total campus GSF served by central utility plant ‐ 2,167,000 GSF or 83%
Type of utility plant and building automation system
Boiler and Chiller Plant
Automation by Johnson Control Incorporated (JCI)
30

PrioritiesPriorities
Two highest priorities to improve facility operation and reduce energy consumption and cost
Boiler Efficiency
Boiler Controls
31

Texas A&M University at Central TexasTexas A&M University at Central Texas
103,000 GSF ‐ Founders Hall (owned)
170,000 GSF ‐ 2 leased spaces
FY12 Annual Purchased Utility Cost Electricity $40,000 Natural Gas $ 5,000 Water & Sewer $20,000 Solid Waste $10,000
Christopher Hill Director of Facilities
32
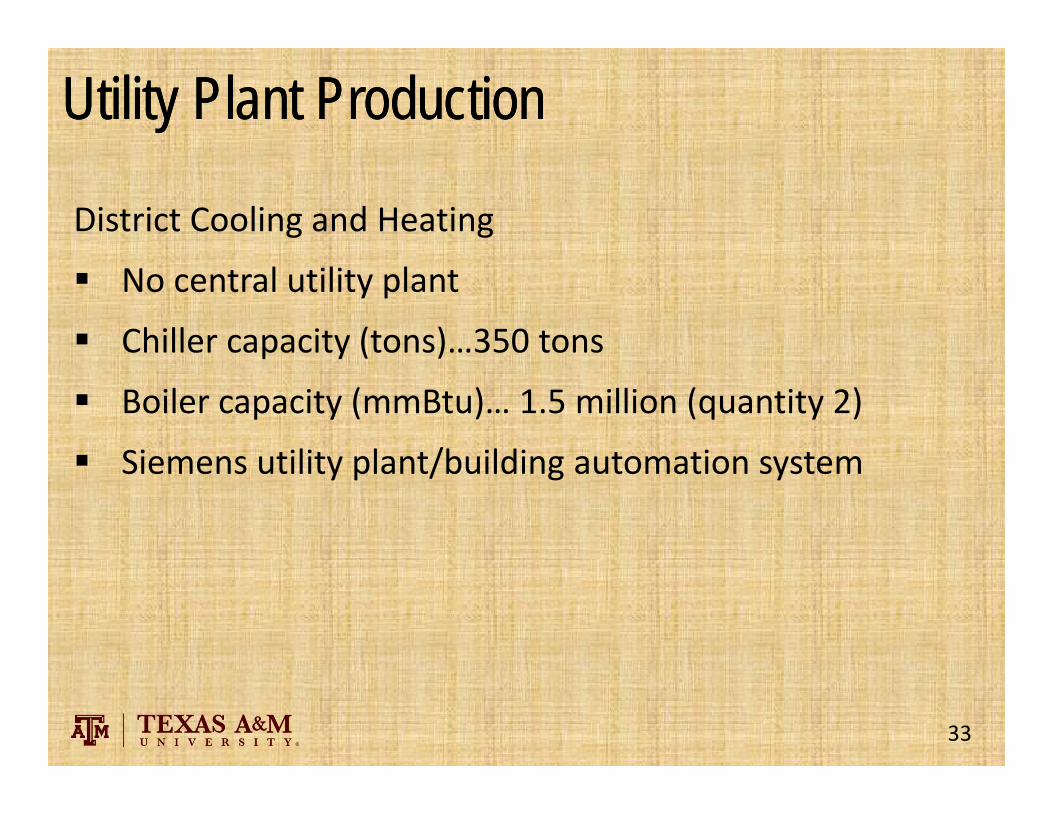
Utility Plant ProductionUtility Plant Production
District Cooling and Heating
No central utility plant
Chiller capacity (tons)…350 tons
Boiler capacity (mmBtu)… 1.5 million (quantity 2)
Siemens utility plant/building automation system
33

Greatest Challenge and PrioritiesGreatest Challenge and Priorities
Greatest challenge faced by your institution in the area of utilities and energy management
Being a new campus, the toughest part will be to make sure the policies become part of the culture as we grow
34

Tarleton State UniversityTarleton State University
Steven J. BowmanDirector of Energy and Utility Operations
35

Campus OverviewCampus Overview98 Buildings, 2,047,492 GSF, 1,317,707 Total NASF and 791,589 E&G NASF
Main Campus 169 acres, Dairy 81.1 acres, Farm 699.6 acres, Ranch 1,174.2 acres Total 2,124 acres
10,281 Students, 279 Faculty and 667 Staff – Stephenville, Ft. Worth, Weatherford, and Waco
FY12 Annual Purchased Utility Cost Electricity ‐ 34,425,270 kilowatt‐hours $ 2,707104 Natural Gas – 78,732 MCF $ 309,362 Water & Sewer – 48,182,679 Gallons $ 411,552 Solid Waste – n/a
36

Utility Plant ProductionUtility Plant ProductionDistrict Cooling and Heating Describe central utility plant – Five (5) 1,000 ton Trane Chillers, two (2)
devalued due to cooling tower issues one (1) out of service. Nine (9) Aerco Benchmark 3.0 Condensing Boilers.
Chiller capacity (tons) ‐ 3,650 tons
Boiler capacity (mmbtu) ‐ 27,000 mbh
Percent of total campus GSF served by central utility plant – 1,139,965 GSF of 2,047,492 GSF or 55.6%
Type of utility plant and building automation system – Trane Tracer Summit controls the boilers, chillers and cooling towers. The Central Plant distribution pumps and the main campus irrigation, fire panels, security alarms and HVAC points are controlled by Johnson Controls MetaSys (bacnet)
37

Greatest Challenge and PrioritiesGreatest Challenge and Priorities
Greatest challenge faced by your institution in the area of utilities and energy management :
Obtain staffing and funding to continue increasing the energy reduction measure we have already obtained in the last 5 years
Three highest priorities to improve facility operation and reduce energy consumption and cost:
Get new electrical contract in place for a multi‐year period Proceed with Energy Conservation Projects planned for an ESCO Support and funding to continue making improvements each year
38
Texas A&M University-San AntonioTexas A&M University-San Antonio
Polo CervantesAssistant Director of Physical Plant
Marshall LasswellDirector of Facilities and Physical Plant
39
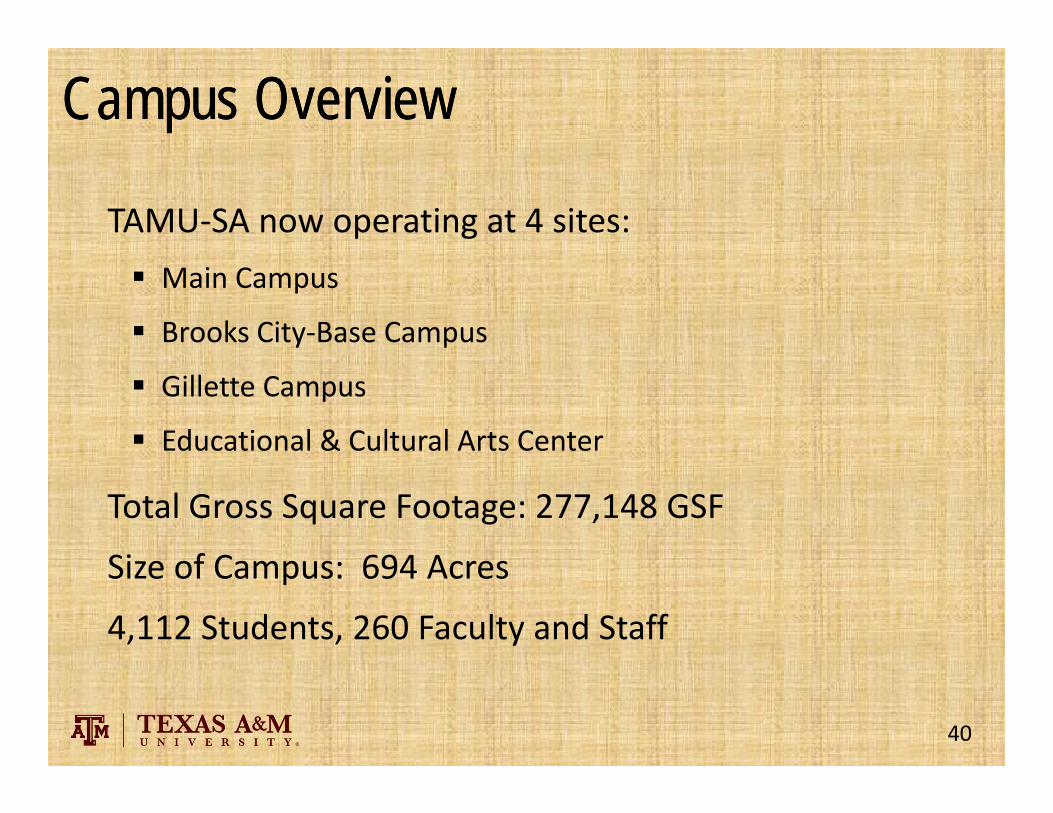
Campus OverviewCampus Overview
TAMU‐SA now operating at 4 sites: Main Campus
Brooks City‐Base Campus
Gillette Campus
Educational & Cultural Arts Center
Total Gross Square Footage: 277,148 GSF
Size of Campus: 694 Acres
4,112 Students, 260 Faculty and Staff
40

Greatest Challenge/Opportunity: Rapid GrowthGreatest Challenge/Opportunity: Rapid Growth
1,430
2,343
3,120
3,554
0
500
1000
1500
2000
2500
3000
3500
4000
Fall 2008 Fall 2009 Fall 2010 Fall 2011 Fall 2012
4,112
187%from fall 2008 to fall 2012
at TAMU-SA
Enrollment grew
41

Greatest Challenge and PrioritiesGreatest Challenge and Priorities
Greatest challenge faced by your institution in the area of utilities and energy management: Operating at Multiple Campuses (3 of 4 leased)
Three highest priorities to improve facility operation and reduce energy consumption and cost Continue to implement best practices into design standards
Increase facility utilization hours of existing buildings
42

Texas A&M International UniversityTexas A&M International University
Richard Gentry Director Physical Plant
Albert LopezAsst Director
Arnulfo MarquezHVAC Supervisor
43

Texas A&M InternationalTexas A&M International
44

Campus OverviewCampus Overview
Total Gross Square Footage (GSF) and Buildings Served
900,416 GSF 15 Total Buildings
Size of Campus in Acres 300 Acres
Number of Students, Faculty and Staff
7,000 Students 945 Faculty and Staff
FY12 Annual Purchased Utility Cost
Electricity $1,804,311 Natural Gas $ 66,409 Water & Sewer $ 407,484 62% Irrigation 25% CP Makeup Solid Waste $ 27,071
45
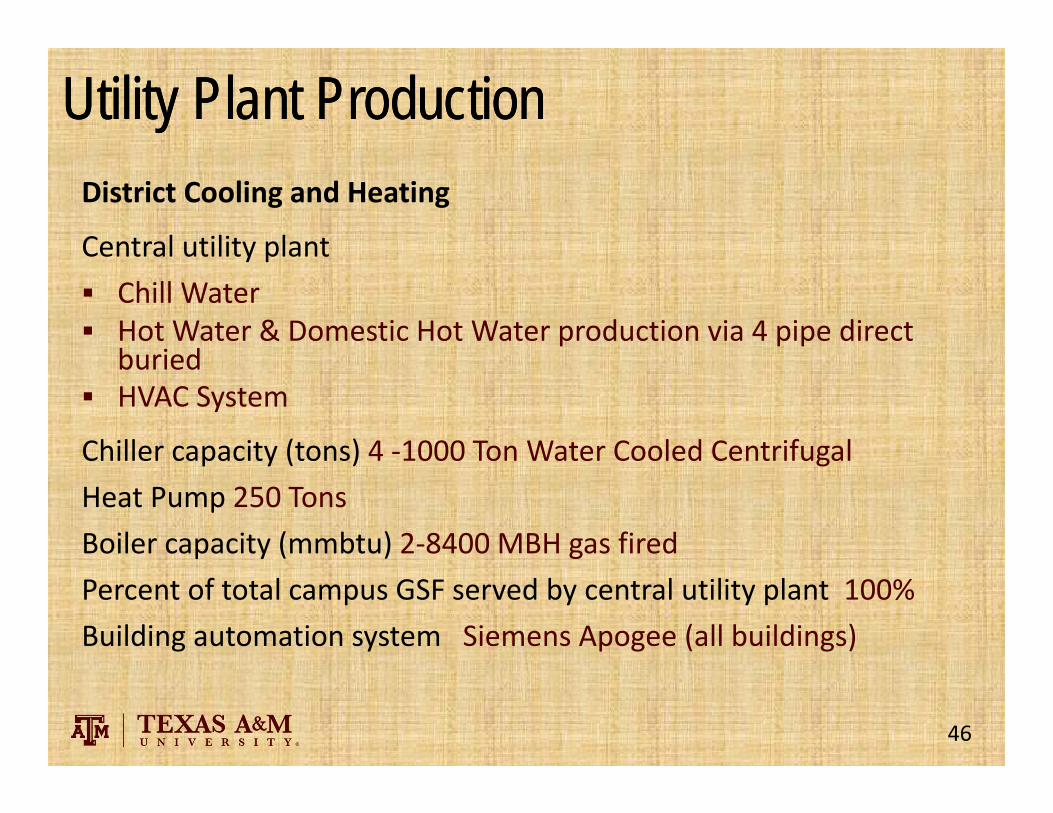
Utility Plant ProductionUtility Plant ProductionDistrict Cooling and Heating
Central utility plant Chill Water Hot Water & Domestic Hot Water production via 4 pipe direct
buried HVAC System
Chiller capacity (tons) 4 ‐1000 Ton Water Cooled CentrifugalHeat Pump 250 TonsBoiler capacity (mmbtu) 2‐8400 MBH gas fired Percent of total campus GSF served by central utility plant 100%Building automation system Siemens Apogee (all buildings)
46

Greatest Challenge and PrioritiesGreatest Challenge and Priorities
Greatest challenge faced by your institution in the area of utilities and energy management
Steady Growth Budget Reductions Staffing
Three highest priorities to improve facility operation and reduce energy consumption and cost
Thermal Storage Electrical System Maintenance Plan Power Factor Correction
47

Richard Lynn P.E. LEEDAPDirector of Utilities
Joe Fix P.E. LEEDAP –Electrical Engineer
Terry Hoppe –Maintenance Foreman II–IBT Houston
Dan Clawson – Facilities Coordinator Round Rock & Temple
Mike Young– Manager Of Facilities Services & Planning– Dallas BCD
Reynaldo Escobedo –Building Attendant McAllen
Charles Suarez – Business Coordinator - Kingsville COP
Donnie Loftin – Assistant Facilities Coordinator-Temple
Texas A&M Health Science CenterTexas A&M Health Science Center
48
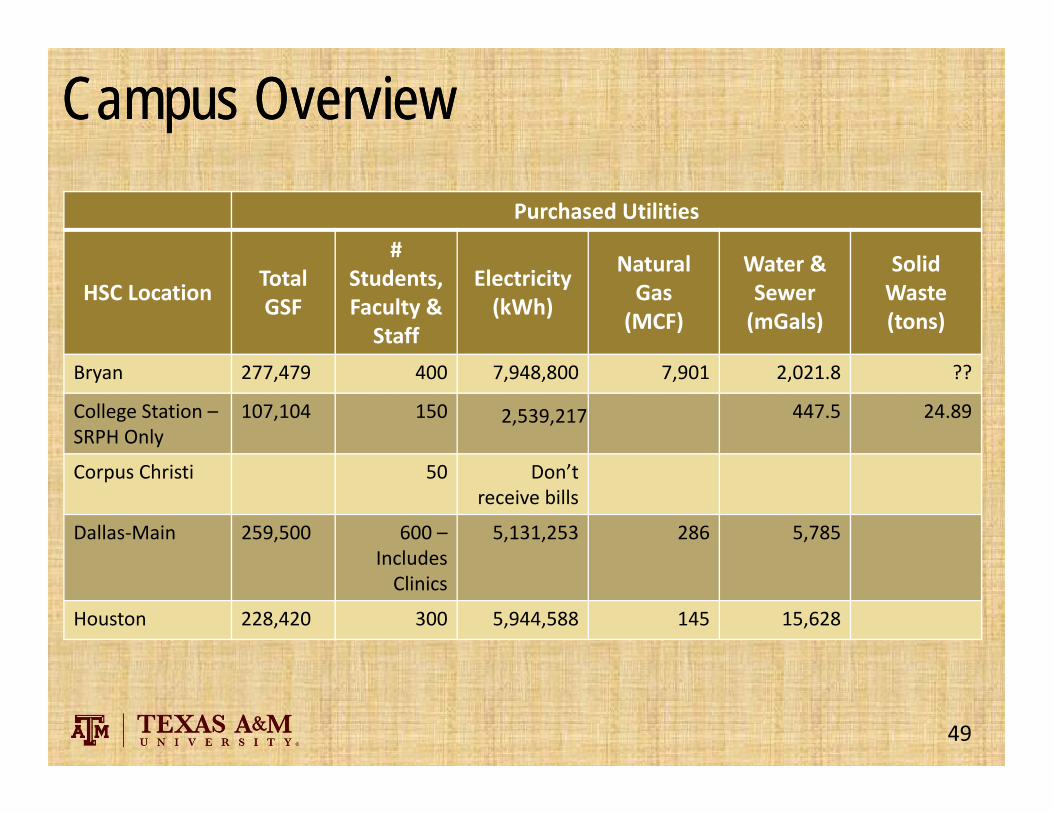
Campus OverviewCampus OverviewPurchased Utilities
HSC Location Total GSF
# Students, Faculty & Staff
Electricity(kWh)
Natural Gas(MCF)
Water & Sewer(mGals)
Solid Waste(tons)
Bryan 277,479 400 7,948,800 7,901 2,021.8 ??
College Station –SRPH Only
107,104 150 2,539,217 447.5 24.89
Corpus Christi 50 Don’t receive bills
Dallas‐Main 259,500 600 –Includes Clinics
5,131,253 286 5,785
Houston 228,420 300 5,944,588 145 15,628
49

Campus OverviewCampus OverviewPurchased Utilities
HSC Location Total GSF
# Students, Faculty & Staff
Electricity(kWh)
Natural Gas(MCF)
Water & Sewer(mGals)
Solid Waste(tons)
Kingsville ‐Vivarium
5,300 5 949,440 ? ?
McAllen 23,000 25 753,360 638 $2,967.64
Round Rock 149,983 300 includes clinics
2,312,293 4,393 7,108 ?
Temple‐MRB 59,238 140 3,803,207 10,312.8 4,103 ?
50

Utility Plant ProductionUtility Plant ProductionDistrict Heating and Cooling
HSC LocationCentral Plant(Y/N)
Chiller Capacity(tons)
Boiler Capacity(mmBtu)
% of total Campus GSF Served by
Central Plant
Type of UtilityPlant System
Type of Building
Automation System
Bryan Yes 1800 14.4 65% ‐Remaining is developer bld.
CHW/HHW Siemens Insight
College Station N N/A N/A Fed From TAMU
On TAMU Siemens
Corpus Christi N/A N/A N/A Fed from TAMUCC
?
Dallas N N/A N/A Fed from Baylor Med Ctr
CHW – Steam from Baylor
TAC
51

Utility Plant ProductionUtility Plant ProductionDistrict Heating and Cooling
HSC Location
Central Plant(Y/N)
Chiller Capacity(tons)
Boiler Capacity(mmBtu)
% of total Campus GSF Served by
Central Plant
Type of UtilityPlant System
Type of Building
Automation System
Houston N N/A N/A Fed From TECO
CHW /Steam from TECO
JCI
Kingsville ‐COP
N N/A N/A Fed From TAMUK
CHW / HHW from TAMUK
Siemens
McAllen Yes 125 Electric Strip Hgt
100 Air Cooled Chiller VSPSP
Siemens
Round Rock
Yes 550 4.4 100 Air Cooled Chiller VSPSP – VSP for HHW
Siemens
Temple ‐MR
Yes 450 4.0 100 Air Cooled Chiller VSPSP – VSP for HHW
Siemens
52

Greatest Challenge and PrioritiesGreatest Challenge and PrioritiesGreatest challenge faced by your institution in the area of utilities and energy management: Getting our private utility suppliers to provide us detailed bills with
consumption and cost for utilities Getting greater support from our upper management Getting funds to implement Energy Audits at the facilitiesThree highest priorities to improve facility operation and reduce energy consumption and cost Perform ASHRAE Level One audits in all of our facilities Perform ASHRAE Level II & III audits in facilities that need it Backing and funding to implement the recommendations from the
audits. In many cases the age of the equipment will dictate spending the money
53

Utilities & Energy ServicesEnergy Management Program
Workshop
Utilities & Energy ServicesEnergy Management Program
WorkshopOctober 16-17, 2012
54

Energy Management Program Update
Jim Riley, Executive DirectorLes Williams, Director
October 16, 2012
55

Energy Management Program UpdateEnergy Management Program UpdatePhase I Establish consumption baselines (EUI) Identifying ‘low hanging’ opportunities Begin discussion about EUI targets and Energy Stewardship
Phase II Establish campus EUI targets Documenting and tracking energy performance Documenting opportunities
Phase III Identifying opportunities for improvement Identifying funding challenges / opportunities
56

Energy Management Program UpdateEnergy Management Program UpdateCampus Visits Texas A&M University Commerce (Commerce, TX) Texas A&M University Kingsville (Kingsville, TX) Texas A&M University Corpus Christi (Corpus Christi, TX) Texas A&M University Texarkana (Texarkana, TX) Prairie View A&M University (Prairie View, TX) Texas A&M University (Galveston, TX) West Texas A&M University (Canyon, TX) Texas A&M University Central Texas (Killeen, TX) Tarleton State University (Stephenville, TX) Texas A&M University San Antonio (San Antonio, TX) Texas A&M International University (Laredo, TX) Texas A&M Health Science Center (College Station, TX)
57
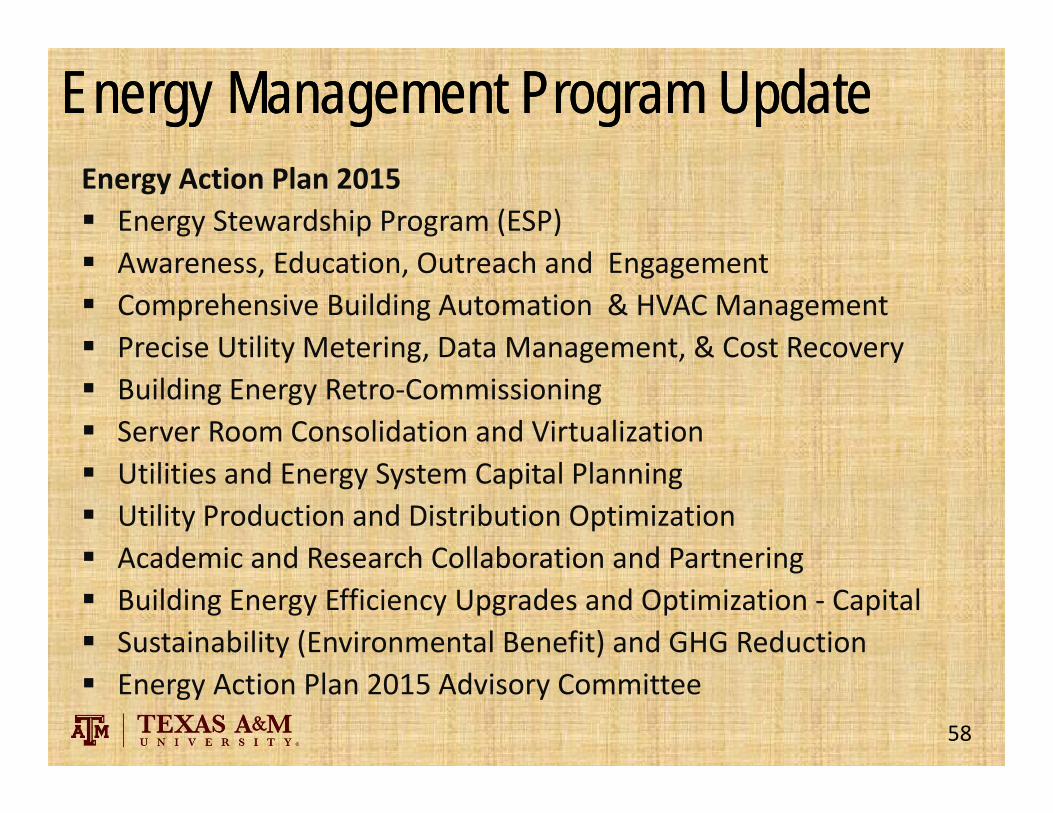
Energy Management Program UpdateEnergy Management Program UpdateEnergy Action Plan 2015 Energy Stewardship Program (ESP) Awareness, Education, Outreach and Engagement Comprehensive Building Automation & HVAC Management Precise Utility Metering, Data Management, & Cost Recovery Building Energy Retro‐Commissioning Server Room Consolidation and Virtualization Utilities and Energy System Capital Planning Utility Production and Distribution Optimization Academic and Research Collaboration and Partnering Building Energy Efficiency Upgrades and Optimization ‐ Capital Sustainability (Environmental Benefit) and GHG Reduction Energy Action Plan 2015 Advisory Committee
58

Energy Stewardship ProgramCollege Station, Texas
Charlie Shear, Supervisor Energy Stewardship Program
October 16, 2012
59

Energy Stewardship ProgramEnergy Stewardship Program
60

Improve Energy Efficiency and Conservation
Work Closely With Students Faculty Staff Building occupants Departmental representatives Facility managers Building proctors Technical staff
To Educate Inform Raise awareness
61
Energy Stewardship ProgramEnergy Stewardship Program
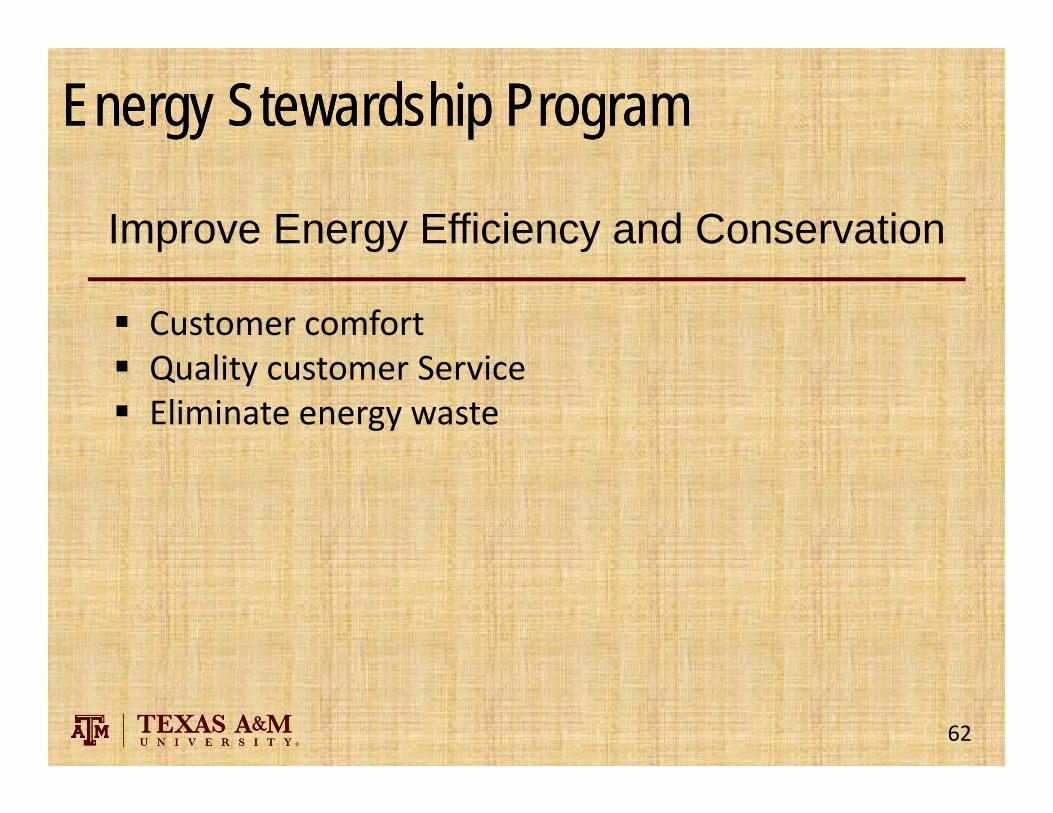
Improve Energy Efficiency and Conservation
Customer comfort Quality customer Service Eliminate energy waste
62
Energy Stewardship ProgramEnergy Stewardship Program

63
Energy Stewardship ProgramEnergy Stewardship Program

64
Energy Stewardship ProgramEnergy Stewardship Program

The overall financial goal is to reduce the energy cost of TAMU College Station by a minimum of the following:
FY12 FY13 FY14 FY15 FY16 FY17 FY18 FY19 FY20 FY21$500,000 $750,000 $802,500 $858,675 $918,782 $983,097 $1,051,914 $1,125,548 $1,204,336 $1,288,640
65
Energy Stewardship ProgramEnergy Stewardship Program
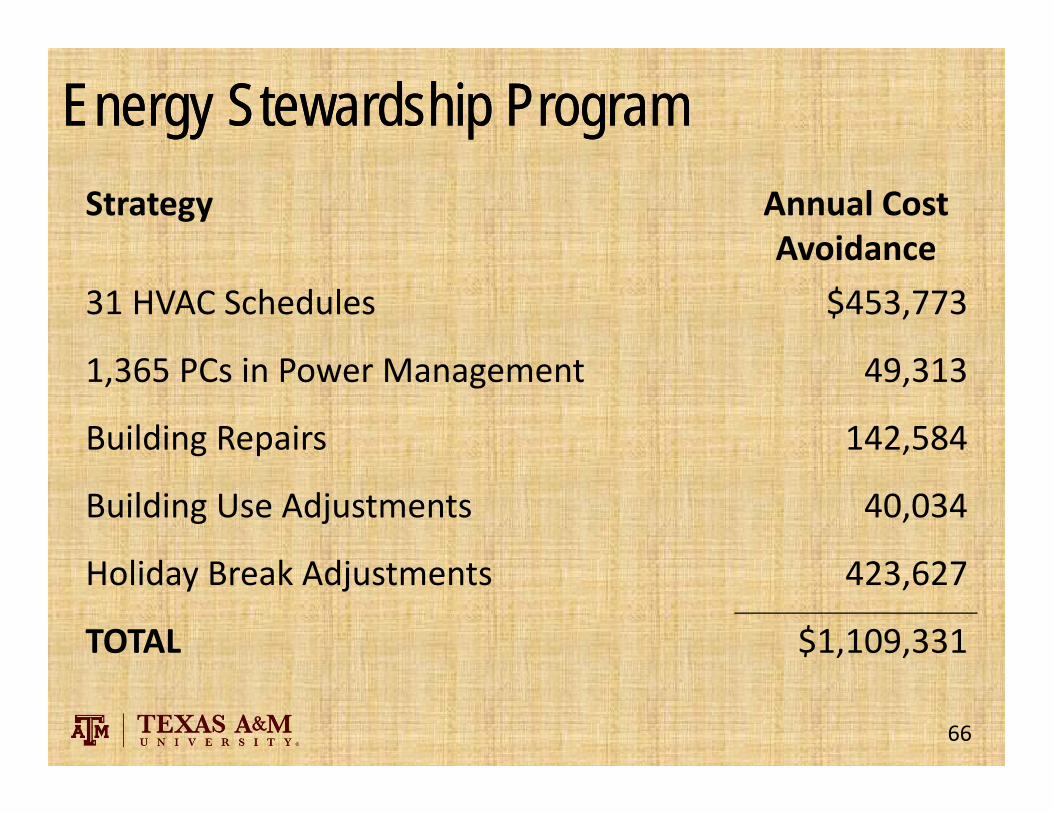
Strategy Annual Cost Avoidance
31 HVAC Schedules $453,773
1,365 PCs in Power Management 49,313
Building Repairs 142,584
Building Use Adjustments 40,034
Holiday Break Adjustments 423,627
TOTAL $1,109,331
66
Energy Stewardship ProgramEnergy Stewardship Program

We’reAll
EnergyStewards
67
Energy Stewardship ProgramEnergy Stewardship Program

Building Automation System Management
Homer Bruner, Assistant DirectorIT & Energy Services
October 16, 2012
68

69
Building Automation System (BAS)Building Automation System (BAS) First responders to all HVAC calls DDC Pneumatic DX systems
182 Buildings with DDC 19 Million Conditioned Square Feet
373,900 Points
841 Field Panels
24/7/365 Support
15 Technicians (in‐house and contract)

BSL3 Labs – Animal Research – Chemistry Labs –Fume Hoods – Clean Rooms – Data Center
Work Order System – Dispatching – Custom Performance Reports – Command Center
Scheduling HVAC Systems – EAP 2015 – Energy Stewards – Retro‐Commissioning
Building Automation System (BAS)Building Automation System (BAS)
70

Retro-Commissioning Program (RCP)Retro-Commissioning Program (RCP)
99 buildings since 2002
13.8 Million Square Feet
1992 Campus EUI was 364mBtu/gsf
2012 at 214 mBtu/gsf
2015 EUI goal is 190 mBtu/gsf
Integral component of EAP 2015
Target to commission 1 million GSF per year
71

Focus on: Safety Comfort Meeting the customers needs Energy Reduction
Retro-Commissioning Program (RCP)Retro-Commissioning Program (RCP)
72

Building Automation System (BAS) Retro-Commissioning Program (RCP)Building Automation System (BAS) Retro-Commissioning Program (RCP)
Come to BAS & RCP break‐out sessions to see how we do it
Please ask questions
73

Utility Metering and Cost Recovery
Les Williams, Director
October 16, 2012
74

Utility Metering and Cost RecoveryUtility Metering and Cost Recovery
In the United States alone, buildings account for1:
72% of electricity consumption 39% of energy use 38% of all carbon dioxide (CO2) emissions
Why meter utility consumption at each building?
You can’t manage what you don’t measure – you wouldn’t spend millions of dollars without proper financial accounting, but it happens routinely with energy.
optimize system and building performance verify targeted energy and water consumption reduction
1. http://www.usgbc.org/DisplayPage.aspx?CMSPageID=1718 75

Key Points• All major buildings on campus metered• Utility bills are based on actual consumption• Metered data facilitates discussion between UES and customer being
billed• Metering encourages energy conservation1
– Measurement alone can lead to energy conservation of up to 2%– Invoicing for consumption can result in additional 5% savings– Using data to tune buildings can result in savings of 15 to 45%
• Educated and motivated customers are key to significant improvement in energy consumption and cost reduction1. “Guidance for Electric Metering in Federal Buildings”, http://www1.eere.energy.gov/femp/pdfs/adv_metering.pdf
Utility Metering and Cost RecoveryUtility Metering and Cost Recovery
76

General Services ComplexGeneral Services Complex
77

Capital Planning and Financial Justification
Les Williams, Director
October 16, 2012
78

CHW Projections – Main CampusCHW Projections – Main Campus
CHW 30 Year Load and Capacity Projections ‐Main Campus
Note: Includes electric chillers only
0
5,000
10,000
15,000
20,000
25,000
30,000
35,000
40,000
2012
2013
2014
2015
2016
2017
2018
2019
2020
2021
2022
2023
2024
2025
2026
2027
2028
2029
2030
2031
2032
2033
2034
2035
2036
2037
2038
2039
2040
2041
2042
CHW (T
ons)
Fiscal Year
Chilled Water Load Growth vs. Capacity ‐Main Campus
New SUP3 Capacity New CUP Capacity Existing SUP3 Capacity Existing CUP Capacity Load Firm Capacity w/equipment replacements
79

CHW Projections – West CampusCHW Projections – West Campus
CHW 30 Year Load and Capacity Projections – West Campus
0
5,000
10,000
15,000
20,000
25,000
30,000
35,000
40,000
45,000
2012
2013
2014
2015
2016
2017
2018
2019
2020
2021
2022
2023
2024
2025
2026
2027
2028
2029
2030
2031
2032
2033
2034
2035
2036
2037
2038
2039
2040
2041
2042
CHW (T
ons)
Fiscal Year
Chilled Water Load Growth vs. Capacity ‐West Campus
New SUP4 Capacity New SUP2 Capacity New SUP 1 Capacity Existing SUP2 Capacity Existing SUP1 Capacity Load Firm Capacity w/equipment replacements
80

Resource AllocationResource Allocation
81
Production & Distribution Optimization
Jim Riley, Executive Director
October 16, 2012
82

Divergent Energy ChartDivergent Energy Chart
83
4.0
5.0
6.0
7.0
8.0
9.0
10.0
12.0
14.0
16.0
18.0
20.0
22.0
24.0
26.0
02 03 04 05 06 07 08 09 10 11 12 13 14 15
Tota
l Cam
pus
Ener
gy C
onsu
mpt
ion
(trill
ion
Btu
)
Tota
l Cam
pus
(mill
ion
GSF
)
Fiscal Year
Divergent Energy ChartTexas A&M University, College Station, Texas
Total Campus GSF
Total Campus Energy Consumption
Note: From FY02 to FY10, gross square footage of facilities served increased by 17.9% while total energy consumption decreased by 22.9%
Campus Square
Campus Energy
Energy consumption per GSF reduced by 40 percent over 10 year period (FY02 ‐FY12) $140 million in purchased energy
Significant growth in campus square
footage
requires continuous
optimization and improved
ProjectedActual

Energy Use Index ChartEnergy Use Index Chart
84
364
238214
190
0
50
100
150
200
250
300
350
400
02 03 04 05 06 07 08 09 10 11 12 13 14 15
Ener
gy U
se P
er G
ross
Squ
are
Foot
(mB
tu c
onsu
mpt
ion
per G
SF)
Fiscal YearNotes: FY10 through FY15 data projected with new CHP operating in FY12
$140 million cost avoidance realized over 10 years
Achieved 40 percent reduction of energy consumption per GSF
over ten years (from FY02 baseline through
FY12)
EAP 2012 goal is to reduce overall EUI 20% over 5 years (from FY10
baseline)
Energy Use Index (Energy Consumption per GSF)Texas A&M University, College Station, Texas
5 years10 years