tetrazole substituted polymers for high temperature
TRANSCRIPT
Tetrazole substituted polymers for High Temperature
Polymer Electrolyte Fuel Cells
Journal: Journal of Materials Chemistry A
Manuscript ID: TA-ART-03-2015-001936.R3
Article Type: Paper
Date Submitted by the Author: 01-Jun-2015
Complete List of Authors: Henkensmeier, Dirk; Korea Institute of Science and Technology, Fuel Cell Research Center Duong, Ngoc My Hanh; KIST, Brela, Mateusz; Jagiellonian University, Theoretical Chemistry Dyduch, Karol; Jagiellonian University, Theoretical Chemistry Michalak, Artur; Jagiellonian University, Theoretical Chemistry
Jankova, Katja; DTU, Energy Cho, Hyeongrae; KIST, Jang, Jong Hyun; Korea Institute of Science and Technology, Fuel Cell Research Center Kim, Hyoung-Juhn; Korea Inst Sci & Technol , Fuel Cell Research Center Cleemann, Lars; Technical University of Denmark, Li, Qingfeng; Technical University of Denmark, Department of Energy Conversion and Storage Jensen, Jens Oluf; Technical University of Denmark,
Journal of Materials Chemistry A
1
Tetrazole substituted polymers for High Temperature Polymer
Electrolyte Fuel Cells
Dirk Henkensmeier,a,b* Ngoc My Hanh Duong,a,b Mateusz Brela,c Karol Dyduch,c Artur
Michalak,c* Katja Jankova,d Hyeongrae Cho,a Jong Hyun Jang,a,e Hyoung-Juhn Kim,a Lars N.
Cleemann,d Qingfeng Li,d Jens Oluf Jensend
a) Korea Institute of Science and Technology, Fuel Cell Research Center, Hwarangno 14-gil 5,
136-791 Seoul, Republic of Korea
b) University of Science and Technology, 217 Gajungro, Yuseonggu, Daejeon, Republic of
Korea
c) Jagiellonian University, Faculty of Chemistry, Ingardena 3, 30-060 Krakow, Poland
d) Proton Conductors, DTU Energy, Technical University of Denmark, Kemitorvet 207, DK-
2800 Kgs. Lyngby, Denmark
e) Green School, Korea University, Seoul 136-713, Republic of Korea
* corresponding authors; email: [email protected]; Tel. +82-2-958-5298.
[email protected]; Tel. +48-12-6632217.
Abstract
While tetrazole (TZ) has much lower basicity than imidazole and may not be fully protonated in
the presence of phosphoric acid (PA), DFT calculations suggest that the basicity of TZ groups
can be increased by introduction of a 2,6-dioxy-phenyl-group in position 5 of TZ. This structure
allows hydrogen bonds between TZ protons and ether oxygen atoms, and thereby establishes a
resonance stabilised, co-planar structure for tetrazolium ions. Molecular electrostatic potential
(MEP) calculations also indicate that tetrazolium ions possess two sites for proton hopping. This
makes such materials interesting for use in a high temperature fuel cell (HT PEMFC). Based on
these findings, two polymers incorporating the proposed TZ groups were synthesised, formed
into membranes, doped with PA and tested for the fuel cell relevant properties. At room
temperature, TZ-PEEN and commercial meta-PBI showed an equilibrium uptake of 0.5 and 4.7
mol PA/mol heterocycle, indicating that PBI has higher affinity to PA then TZ-PEEN. The
Page 1 of 32 Journal of Materials Chemistry A
2
highest achieved PA uptake was ca. 110 wt%, resulting in a proton conductivity of 25 mS/cm at
160 °C with a low activation energy of about 35 kJ/mol. In a first HT PEMFC test at 160 °C, a
peak power density of 287 mW/cm2 was achieved.
Keywords: HT PEMFC, tetrazole, polyether, membranes, phosphoric acid doping
1. Introduction
High temperature polymer electrolyte membrane fuel cells (HT PEMFCs) are operating in the
temperature range of 120-200 °C. The gas streams are usually unhumidified, but can also contain
water if the cell is connected to a reformer.[1] Since no liquid water exists under these conditions
(unless a very high pressure is applied), the electrolyte is usually based on phosphoric acid (PA).
In contrast to phosphoric acid fuel cells (PAFCs) where an inorganic e.g. SiC matrix is used to
immobilize liquid PA, HT PEMFCs employ PA absorbed in a dense polymeric membrane. The
most common membrane type is PA doped polybenzimidazole (PBI), in which PA interacts with
the basic nitrogen atoms of the imidazole rings.[2] While only one PA molecule interacts
strongly with an imidazole ring, several more PA molecules can be absorbed by hydrogen
bonding. Up to 5- 6 PA molecules per imidazole can be doped when meta-PBI is immersed in 85
wt% PA solution at room temperature.[3] Membranes prepared by a sol-gel process, in which
PBI precipitates out of a polyphosphoric acid (PPA) solution as the temperature is decreasing
and PPA is hydrolysed by ambient humidity to PA, can even keep up to about 20 molecules PA
per imidazole.[4]
So far, most published work has been dedicated to PBI based systems,[5] and there is only
limited work on alternative polymers. The most advanced alternatives probably are aromatic
poly(ethers) incorporating pyridine moieties in the backbone.[6-8] Some researchers also
reported the use of imidazole moieties as a side group in aromatic polymers,[9] or as part of
radiation grafted polymers[10]. Considering the large variety of nitrogen containing heterocycles
which could be attached to polymers, it is surprising that literature is rather scarce on other
heterocycles than imidazole or pyridine. However, there is a small body of literature on tetrazole
containing polymers, which were doped with PA and characterised for their fuel cell relevant ex-
situ properties.[11, 12] Very recently, Song et al. showed the fuel cell performance of PA doped
tetrazole containing polymers.[13] Inspired by this work, we now present the preparation and
Page 2 of 32Journal of Materials Chemistry A
3
properties of poly(arylene ethers) with tetrazole moieties attached to the backbone. Theoretical
modeling has been recently successfully applied in studies focused on proton exchange
membranes. [14-16]. In this work Density Functional Theory (DFT) calculations are applied to
describe geometry and the electronic structure of tetrazole based polymer models, compared with
the corresponding PBI models. In particular we discuss the charge distribution and its
implications for possible protonation sites and the protonation energies. The calculations suggest
that 5-(2,6-oxy-phenyl)-based tetrazoles have especially attractive properties. Finally, we also
tested the new materials in the fuel cell, and while Song et al. operated their cells only up to 120
°C,[13] we show that tetrazole based fuel cell membranes can be operated also at 160 °C.
2. Experimental section
2.1 Polymer synthesis
2.1.1 Materials
Dimethyl sulfoxide (DMSO) was obtained from Daejung, dimethyl sulfoxide-d6 (DMSO-d6,
99.9% D) was obtained from Cambridge Isotope Laboratories, 2,6-difluorobenzonitrile from
Oakwood products. 2-methylhydroquinone, bisphenol A, hydroquinone sulfonic acid potassium
salt, sodium azide (NaN3), zinc cloride (ZnCl2), dimethylacetamide (DMAc), N-Methyl-2-
pyrrolidone (NMP), toluene, potassium carbonate (K2CO3) were obtained from Sigma. All
chemicals were used without further purification.
2.1.2 Synthesis of PEEN (Poly (ether ether nitrile ))
In a three-necked round-bottom flask, fitted with stirrer and a Dean-Stark Trap, 2.78 g
(20 mmol) 2,6-difluorobenzonitrile, 2.48 g (20 mmol) 2-methylhydroquinone and 5.52 g
potassium carbonate (K2CO3) were dissolved in a mixture of 35 ml anhydrous
dimethylacetamide (DMAc) and 31 ml anhydrous toluene. After thorough flushing with
nitrogen, the mixture was then heated under stirring at 150 oC for 4 hours, in order to remove the
water by azeotropic distillation with toluene. When toluene was completely removed, the
suspension was heated at 180 oC until the viscosity visibly increased. The reaction mixture was
cooled down, the polymer precipitated in DI water, washed for 24 hours and dried in vacuum at
60 oC for 48 hours. PEEN is soluble in hot NMP, but not well soluble in chloroform, DMSO,
DMSO/chloroform, DMSO/0.5wt% LiCl and tetrahydrofurane.
Page 3 of 32 Journal of Materials Chemistry A
4
2.1.3 Synthesis of SPEEN (sulfonated Poly-(ether ether nitrile sulfone))
2.78 g (20 mmol) 2,6-difluorobenzonitrile, 2.74 g (12 mmol) bisphenol A, 1.83 g (8
mmol) hydroquinone sulfonic acid potassium salt 5.52 g, potassium carbonate (K2CO3) were
dissolved in a mixture of 25 ml anhydrous dimethylacetamide (DMAc) and 31 ml anhydrous
toluene. After thorough flushing with nitrogen, the mixture was heated under stirring at 150 oC
for 4 hours, in order to remove the water by azeotropic distillation with toluene. When toluene
was completely removed, the suspension was heated at 170 oC until the viscosity visibly
increased. The reaction mixture was cooled down, the polymer precipitated in DI water, washed
for 24 hours and dried under reduced pressure at 60 oC for 24 hours. 1H NMR (300 MHz,
DMSO-d6, ppm): 7.19-7.62 (m, ca. 70H, aromatic protons of BPA (7.38 and 7.19 ppm), the
hydroquinone sulfonic acid moiety, and the proton in para-position to nitrile), 6.43-6.77 (m, ca.
20H, aromatic protons in meta-position to nitrile), 1.73 (s, 36H, BPA -CH3).
2.1.4 Preparation of tetrazole-containing PEEN, SPEEN (TZ-PEEN, TZ-SPEEN)
TZ-PEEN, TZ-SPEEN were prepared and optimized by [2+3] addition reaction.[17]
First, 1 g PEEN or SPEEN was dissolved in 24 ml NMP at 140 oC. NaN3 and anhydrous ZnCl2
with the molar ratio of –CN/ZnCl2/NaN3 1:4:4 were introduced later into the flasks. The reaction
mixtures were stirred at 140 oC for a total of 6 days. The withdrawn samples were heated at 60 oC for 1 hour in dil. HCl, filtered, washed on the filter with the dil. HCl followed by water, and
then dried under reduced pressure at 60 oC for 24 hours.
2.2 Polymer Characterization
Chemical structures were characterized using a Bruker 300 MHz nuclear magnetic resonance
(NMR) spectrometer.
FT-IR spectra were recorded on a Lambda Scientific FTIR 7600 spectrometer with a single
bounce diamond ATR accessory with film samples at 4 cm-1 resolution, 16 scans, over the 400-
4000 cm-1 range.
2.3 Membrane fabrication and acid doping
Page 4 of 32Journal of Materials Chemistry A
5
TZ-PEEN and TZ-SPEEN were dissolved in NMP to obtain 5% wt. solutions at room
temperature. The solutions were then filtrated through polypropylene filters (pore size 0.45 µm)
into petri dishes and dried at 60 °C, first under ambient pressure for 1 hour, later under vacuum
for 24 hours.
The acid doping of the membranes was performed by immersing the membranes in an 85 wt %
PA solution at 30 oC, 80 oC or 120 oC. The PA content was measured based on the weight
change of the membrane before and after doping. The PA content (wt%) was calculated
according to Equation 1, where Wt and Wo are the weights of the membrane after doping and
before doping, respectively.
0
0
% 100tuptake
W WPA
W
−= × (Equation 1)
2.4 Mechanical testing
Tensile tests were performed on a Cometech QC-508E universal testing machine. The samples
were cut from 1 membrane with the sample size of 1 cm x 4 cm, 4 samples were prepared for
each kind of membrane. The samples were stretched at the elongation speed of 10 mm/min. For
each measurement, humidity and temperature were recorded as the mechanical properties greatly
depend on environmental conditions. The maximum stress was taken as the tensile strength.
2.5 Size Exclusion Chromatography
SEC was performed on a Shimadzu HPLC Instrument, equipped with 2 PolarSil columns (100
and 300 Å) from Polymer Standards Service (PSS) and a Shimadzu refractive index detector.
The samples were run in DMAC containing 0.5 wt% LiCl at 60 °C at a flow rate of 1 ml/min.
Calibration was made with 17 narrow molecular weight PMMA standards from PSS in the
molecular weight range of 800 to 1600000 g/mol and the LabSolutions GPC Software.
2.6 Thermogravimetric analysis
Thermal stability of membranes was measured with TA instruments TGA Q50. Sample weights
were around 10 mg, and the temperature was increased 10 °C/min from room temperature to 100
Page 5 of 32 Journal of Materials Chemistry A
6
°C, kept for 30 minutes, and then again increased at the same heat rate to 900 °C in a nitrogen
stream.
2.7 Proton conductivity
A Zahner IM6 impedance analyser (ZAHNER-elektrik GmbH & Co. KG, Kronach, Germany)
was used to measure electrochemical impedance spectra of membranes. Membrane samples (4
cm x 1 cm) were doped with phosphoric acid and dried at 110 oC for 5 hours to evaporate water.
After that, the membrane was measured in the frequency range of 0.1 Hz to 100 kHz by a 4-
probe method. The conductivity σ was calculated according to Equation 2.
1000[ / ]
dmS cm
twRσ = (Equation 2)
Here d is the distance between the inner electrodes (1 cm), t and w are the thickness and width (1
cm) of the membrane strip, and R is the resistance [ohm], as obtained from the x-axis intercept of
the curve in the Nyquist plot.
2.8 MEA fabrication and fuel cell testing
Catalyst powder (46.3% Pt/C from TKK, Japan) and PTFE dispersion (60 wt% in water from
Sigma, Korea) were dispersed in isopropyl alcohol and distilled water (IPA : water = 4:1 wt/wt)
with a solid PTFE to Pt/C ratio of 1:4. The catalyst ink was sprayed uniformly onto a gas
diffusion layer (SGL GDL 10 BC) to prepare gas diffusion electrodes (GDE) by an automatic
spraying machine. The GDEs were then heat treated for 5 minutes at 350 °C under nitrogen
atmosphere. The Pt loading on each electrode was 1.03 mg cm-2. The MEAs, with an active
electrode area of 7.84 cm2, were assembled into a single cell without hot pressing, and the screws
were fastened with a torque of 80 pound inch (9.04 Nm). The single cells were operated at 160 oC and ambient pressure with non-humidified H2 and air. The gas flow rates were 100 sccm and
300 sccm, respectively. Fuel cell performance was characterized by continuously measuring the
potential at constant current (200 mA·cm-2) at 160 oC, and i-V curves.
2.9 Computational details
Theoretical calculations with Density Functional Theory (DFT) methodology using the Becke88
exchange [18] and Perdew86 correlation [19, 20] functional (BP86) were performed using the
Page 6 of 32Journal of Materials Chemistry A
7
Amsterdam Density Functional (ADF) program, version 2013.01[21-25]. A standard triple-ζ
STO basis included in the ADF package with one set of polarization functions was applied for all
atoms. Scalar relativistic effects were included by employing the Zero Order Regular
Approximation (ZORA). [26, 27] Charge distribution was analyzed with the Hirshfeld atomic
charges [28] and Molecular Electrostatic Potential [29, 30].
3. Results and Discussion
3.1 Synthesis of tetrazole-modified poly(arylene ether)s
Tetrazoles can be synthesised in a [2+3] cycloaddition of nitrile groups with sodium azide. To
enhance the reaction kinetics, usually acidic catalysts are added.[31] While this reaction can be
handled well on small scale (e.g. large head space in which hydrazoic acid remains under the
detonation threshold of 15,000 ppm), the potential evolution of HN3 may rise safety issues
especially for larger batches.[32] An apparently safe procedure for the kilogram scale was
reported by Giradin et al.[33] As shown by Du et al., also aromatic nitrile group containing
polymers can react with sodium azide in a polymer analogous reaction.[17] Based on that work,
two nitrile containing poly(arylene ethers) were synthesised, hereafter referred to as PEEN and
SPEEN (Scheme 1). When fully substituted, PEEN would show a very high density of functional
groups, while SPEEN has a slightly lower tetrazole density and an additional sulfonic acid group.
The acid group was proposed to improve the conductivity of membranes with a low PA doping
level.[34] Characterisation of PEEN and SPEEN was done by NMR spectroscopy. In order to
assign the peaks of SPEEN, also a polymer without the hydroquinone sulfonic acid monomer
(P1) and another polymer without bisphenol A (P2) were synthesised and characterised
(supporting information). It was found that the protons in meta-position to the nitrile group
appear at 6.59/6.61 ppm in P1, and are split up into signals at 6.91/6.93, 6.77/6.79, 6.63/6.65,
6.48/6.51 and 6.39/6.41 in P2, reflecting the 3 possible triades (SO3H can be ortho or meta to
benzonitrile) and the spatial orientation of the sulfonic acid groups (supporting information).
While the polymerisation reactions easily led to membrane forming polymers, the cycloaddition
with azide was very sluggish and reactions needed to be run for several days, as also reported by
Du et al.[17] Among the tested conditions (Table 1), the highest conversion of the nitrile groups
could be achieved when the reactions were run at 140 °C for 6 days in normal (not anhydrous)
NMP with zinc chloride as catalyst, in a reagent ratio (-CN:ZnCl2:NaN3) of 1:4:4. The same
Page 7 of 32 Journal of Materials Chemistry A
8
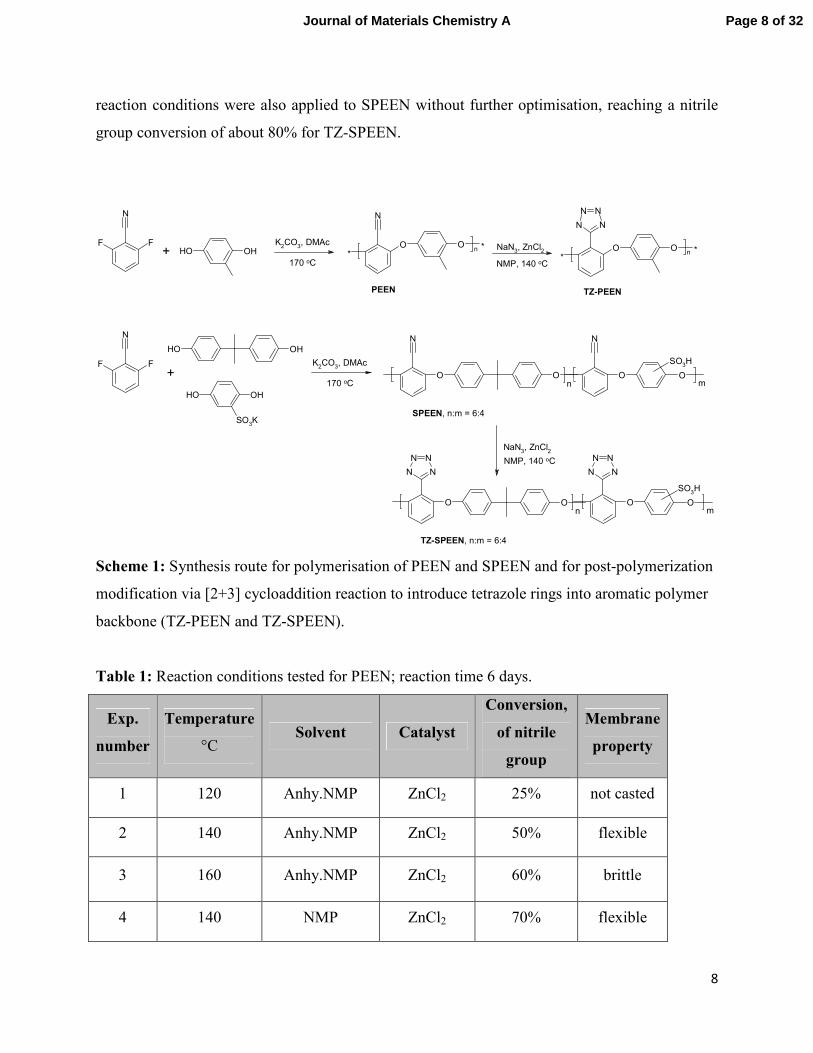
reaction conditions were also applied to SPEEN without further optimisation, reaching a nitrile
group conversion of about 80% for TZ-SPEEN.
OO
N
O
N
O
SO3H
FF
N
OHOH
OH OH
SO3K
OHOH
FF
N
K2CO
3, DMAc
K2CO
3, DMAc
OO
N
NN
N
O O
SO3H
N
NN
N
NaN3, ZnCl
2
N
O*
O *n
NaN
3, ZnCl
2 O*
O *n
N
NN
N
n
SPEEN, n:m = 6:4
m
+
+
170 oC
170 oC
n
TZ-SPEEN, n:m = 6:4
m
NMP, 140 oC
NMP, 140 oC
PEEN TZ-PEEN
Scheme 1: Synthesis route for polymerisation of PEEN and SPEEN and for post-polymerization
modification via [2+3] cycloaddition reaction to introduce tetrazole rings into aromatic polymer
backbone (TZ-PEEN and TZ-SPEEN).
Table 1: Reaction conditions tested for PEEN; reaction time 6 days.
Exp.
number
Temperature
°C Solvent Catalyst
Conversion,
of nitrile
group
Membrane
property
1 120 Anhy.NMP ZnCl2 25% not casted
2 140 Anhy.NMP ZnCl2 50% flexible
3 160 Anhy.NMP ZnCl2 60% brittle
4 140 NMP ZnCl2 70% flexible
Page 8 of 32Journal of Materials Chemistry A
9
5 140 NMP AlCl3 30% not casted
Because the highest turnover reached only around 70 % (TZ-PEEN) and 80% (TZ-SPEEN), the
NMR spectra of the tetrazolated polymers were complex and did not allow a detailed
characterisation. Nevertheless, a new multiplet appearing at 6.96/6.98 ppm probably stems from
the protons in meta-position to the tetrazole. ATR FT-IR spectroscopy gave more information.
The intensity of the nitrile peaks at 2233 cm-1 (PEEN) and 2235 cm-1 (SPEEN) decreased with
proceeding tetrazolisation. In addition, the bands around 1600 cm-1 are slightly broadened and
shifted to higher wave numbers. This could indicate the appearance of a new band in this region,
since N=N bonds of tetrazoles were reported to give signals around 1600 cm-1.[35] Comparison
of the integral areas of the nitrile bands (ACN) and the bands around 1030 cm-1 as internal
standard (Astandard) allowed calculation of the degree of nitrile conversion, according to
Equation 3.
conversion [%] = 100·(1-(ACN'/Astandard')/(ACN/Astandard)) (Equation 3)
3.2 Density Functional Theory calculations
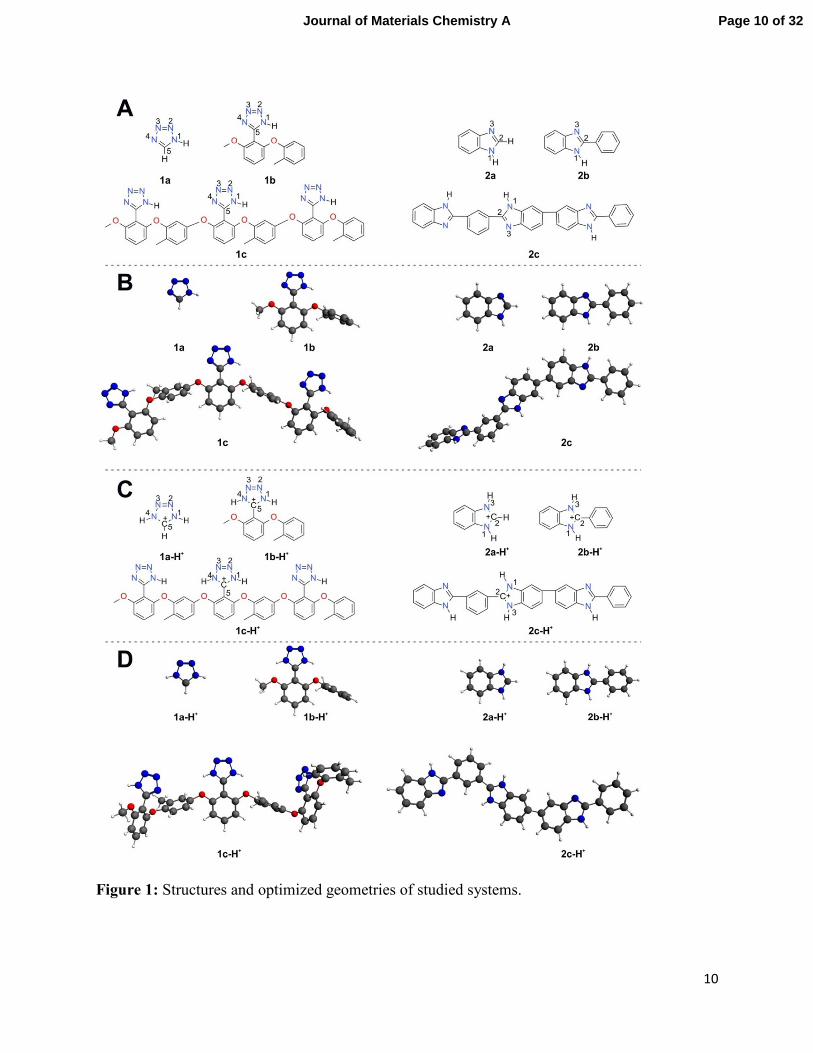
The model systems considered in theoretical DFT calculations are shown in Figure 1.
Starting from the tetrazole structure (1a), we further consider a model based on the single
repeating unit motif of TZ-PEEN (‘monomer’ 1b), saturated by a hydrogen atom (added on
phenyl) and a methyl group (linked to the ether oxygen atom). Finally, the largest TZ-PEEN
model contains three repeating units (‘trimer’1c, saturated as in the case of ‘monomer’). In such
a ‘trimeric’ model as 1c, the interactions of the central repeating unit with the neighbors are
taken into account. A comparison of the results obtained for models 1a, 1b, and 1c allows for
discussion of the influence of the ether groups on the properties of the tetrazole fragment, as well
as the influence of the neighboring repeating units.
Page 9 of 32 Journal of Materials Chemistry A
10
Figure 1: Structures and optimized geometries of studied systems.
Page 10 of 32Journal of Materials Chemistry A
11
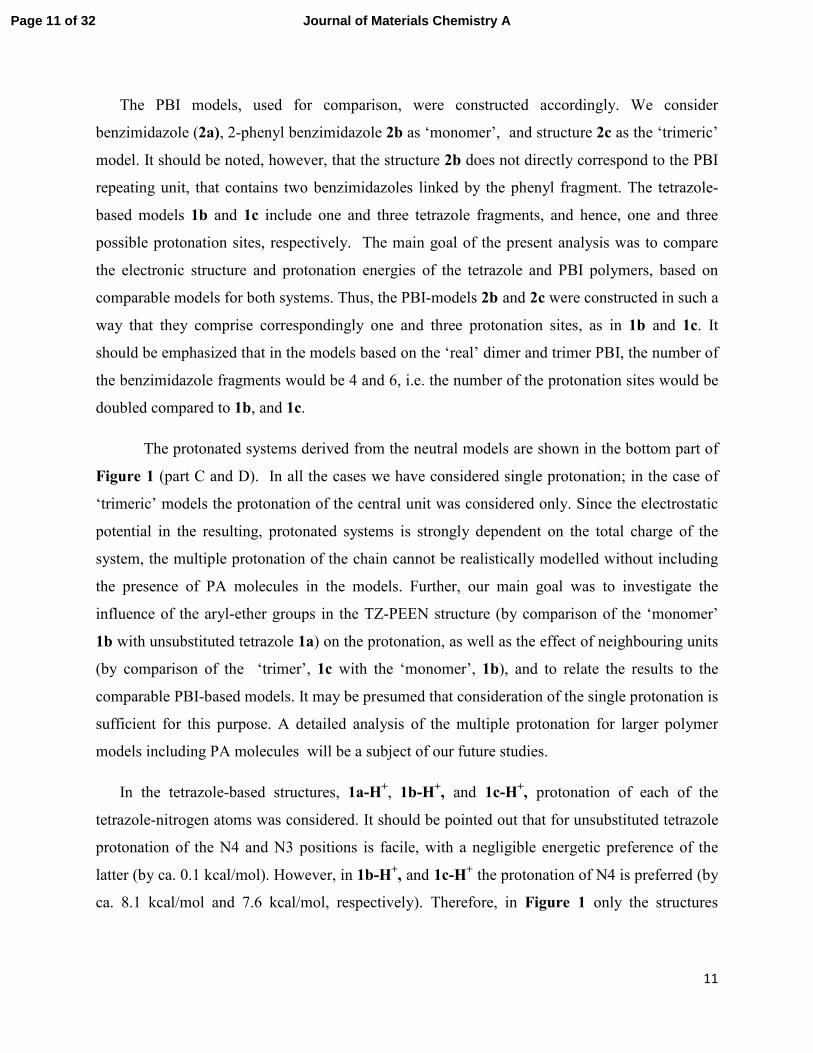
The PBI models, used for comparison, were constructed accordingly. We consider
benzimidazole (2a), 2-phenyl benzimidazole 2b as ‘monomer’, and structure 2c as the ‘trimeric’
model. It should be noted, however, that the structure 2b does not directly correspond to the PBI
repeating unit, that contains two benzimidazoles linked by the phenyl fragment. The tetrazole-
based models 1b and 1c include one and three tetrazole fragments, and hence, one and three
possible protonation sites, respectively. The main goal of the present analysis was to compare
the electronic structure and protonation energies of the tetrazole and PBI polymers, based on
comparable models for both systems. Thus, the PBI-models 2b and 2c were constructed in such a
way that they comprise correspondingly one and three protonation sites, as in 1b and 1c. It
should be emphasized that in the models based on the ‘real’ dimer and trimer PBI, the number of
the benzimidazole fragments would be 4 and 6, i.e. the number of the protonation sites would be
doubled compared to 1b, and 1c.
The protonated systems derived from the neutral models are shown in the bottom part of
Figure 1 (part C and D). In all the cases we have considered single protonation; in the case of
‘trimeric’ models the protonation of the central unit was considered only. Since the electrostatic
potential in the resulting, protonated systems is strongly dependent on the total charge of the
system, the multiple protonation of the chain cannot be realistically modelled without including
the presence of PA molecules in the models. Further, our main goal was to investigate the
influence of the aryl-ether groups in the TZ-PEEN structure (by comparison of the ‘monomer’
1b with unsubstituted tetrazole 1a) on the protonation, as well as the effect of neighbouring units
(by comparison of the ‘trimer’, 1c with the ‘monomer’, 1b), and to relate the results to the
comparable PBI-based models. It may be presumed that consideration of the single protonation is
sufficient for this purpose. A detailed analysis of the multiple protonation for larger polymer
models including PA molecules will be a subject of our future studies.
In the tetrazole-based structures, 1a-H+, 1b-H
+, and 1c-H
+, protonation of each of the
tetrazole-nitrogen atoms was considered. It should be pointed out that for unsubstituted tetrazole
protonation of the N4 and N3 positions is facile, with a negligible energetic preference of the
latter (by ca. 0.1 kcal/mol). However, in 1b-H+, and 1c-H
+ the protonation of N4 is preferred (by
ca. 8.1 kcal/mol and 7.6 kcal/mol, respectively). Therefore, in Figure 1 only the structures
Page 11 of 32 Journal of Materials Chemistry A
12
protonated at N4 position are shown. In the PBI-based structures, 2a-H+, 2b-H
+, and 2c-H
+, the
proton is attached to the corresponding N3 atom.
The optimized, minimum energy structures of the neutral and the protonated models are
shown in parts B and D of Figure 1, respectively. Concerning the optimized geometries of the
polymer models, it is worth emphasizing that in all the structures the tetrazole and the phenyl
rings are almost co-planar in the central unit with the deviation of the torsion angle by ca. 1o-5o.
The planar arrangement is stabilized by the interaction between the proton on the nitrogen atom
and the ether oxygen atom(s) (intra-molecular hydrogen bonding); the (N-H)---O distance varies
between 1.99-2.02 A for different structures.
Charge distribution in the neutral systems has been characterized by Hirshfeld atomic
charges (Figure 2, part A) and the molecular electrostatic potential, MEP (Figure 2, part B,
Figure 3, and Table 2). For all the tetrazole-based systems the most negative atomic charge (red
color in Figure 2) is observed on N4 atom; for PBI-systems on the corresponding atom labeled
as a N3, Figure 2A. The picture emerging from atomic charges is consistent with the MEP
distribution. For tetrazole-based systems MEP exhibits a negative region extending over N2-N3-
N4 part of the ring; for the PBI-systems in the vicinity of the corresponding N3 atom. Thus, it
may be predicted that for tetrazole-systems the proton/positive charge will be stabilized in a
relatively extended, wide negative MEP region, in proximity of N2-N3-N4. This is in agreement
with earlier studies focused on tetrazole [36, 37].
Page 12 of 32Journal of Materials Chemistry A

13
Figure 2: Panel A presents the color representation of Hirshfeld atomic charges for the
considered compounds. The color scale is shown in the right side of the panel; blue color
corresponds to highest positive, and red to the highest negative charge. Panel B presents
Molecular Electrostatic Potential (MEP) color-coded at electron-density isosurface (ρ = 0.002
a.u.). In the right side of the plot the color scale is shown; blue color corresponds to highest
positive MEP and red to the lowest MEP values.
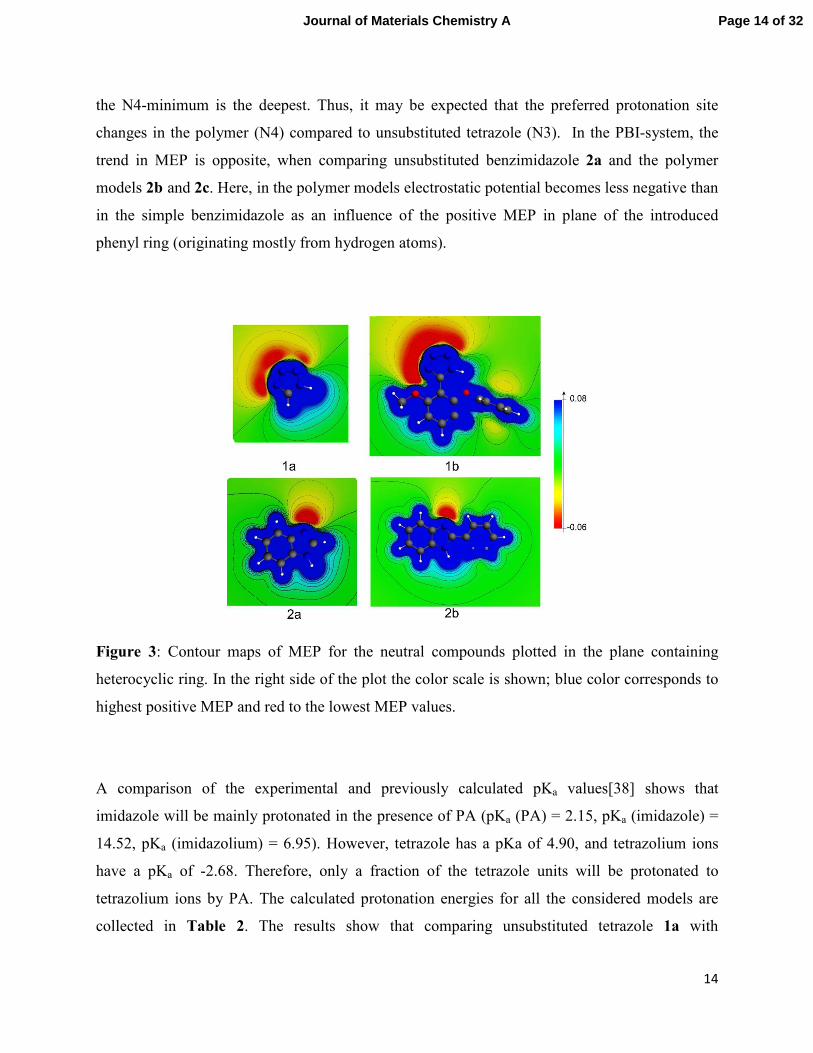
It is worth pointing out, however, that the details of the MEP distribution change when
comparing simple, unsubstituted tetrazole molecule and the tetrazole ring in the
monomer/polymer models. Namely, the depth of the minima (Figure 3, Table 2) increases as an
influence of the ether-oxygen atoms. Also, a relative depth of the minima in the vicinity of N2,
N3, N4 atoms changes: for tetrazole, the N3-minimum is slightly deeper, while for 1b, and 1c,
Page 13 of 32 Journal of Materials Chemistry A
14
the N4-minimum is the deepest. Thus, it may be expected that the preferred protonation site
changes in the polymer (N4) compared to unsubstituted tetrazole (N3). In the PBI-system, the
trend in MEP is opposite, when comparing unsubstituted benzimidazole 2a and the polymer
models 2b and 2c. Here, in the polymer models electrostatic potential becomes less negative than
in the simple benzimidazole as an influence of the positive MEP in plane of the introduced
phenyl ring (originating mostly from hydrogen atoms).
Figure 3: Contour maps of MEP for the neutral compounds plotted in the plane containing
heterocyclic ring. In the right side of the plot the color scale is shown; blue color corresponds to
highest positive MEP and red to the lowest MEP values.
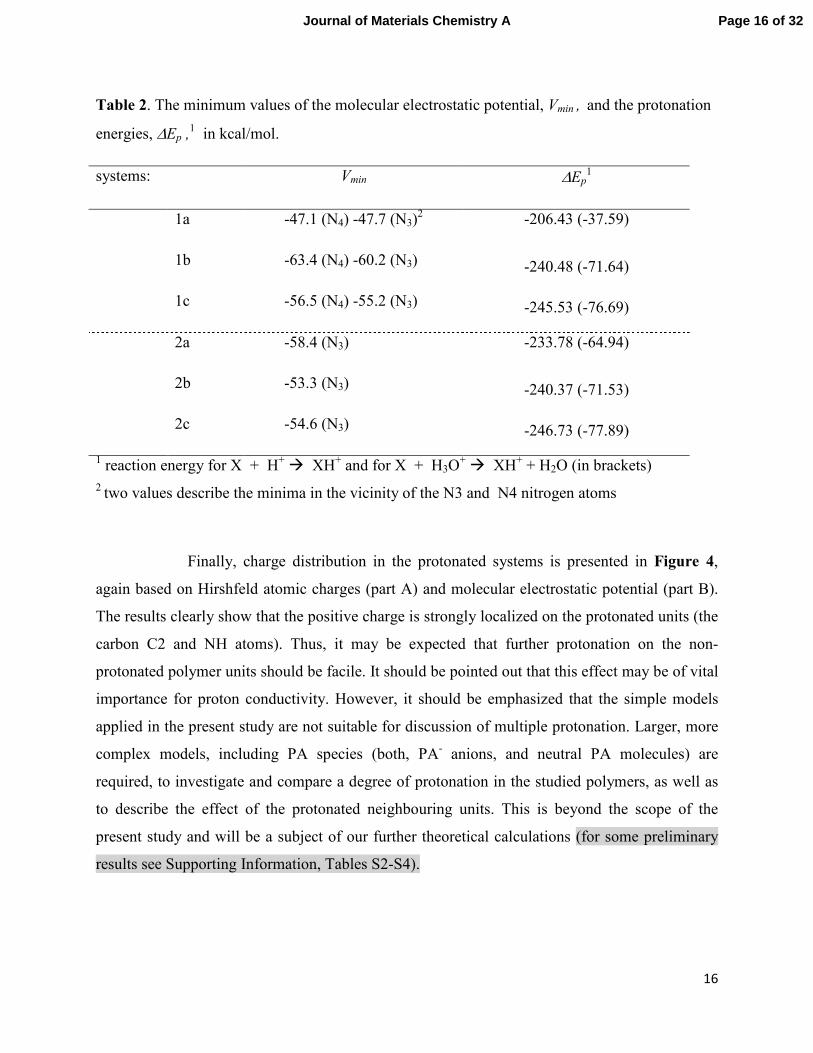
A comparison of the experimental and previously calculated pKa values[38] shows that
imidazole will be mainly protonated in the presence of PA (pKa (PA) = 2.15, pKa (imidazole) =
14.52, pKa (imidazolium) = 6.95). However, tetrazole has a pKa of 4.90, and tetrazolium ions
have a pKa of -2.68. Therefore, only a fraction of the tetrazole units will be protonated to
tetrazolium ions by PA. The calculated protonation energies for all the considered models are
collected in Table 2. The results show that comparing unsubstituted tetrazole 1a with
Page 14 of 32Journal of Materials Chemistry A
15
benzimidazole 2a the protonation is more stabilizing for the latter, the difference is ca. 27
kcal/mol. The protonation is facilitated in the ‘monomers’ compared to small molecules, and
further in the ‘trimers’. However, this effect is much stronger for the tetrazole-based models then
for PBI. As a result, the protonation energies for tetrazole- and PBI-‘monomers’ are comparable
(1b vs. 2b); for the corresponding ‘trimers’ the preference of PBI is now only ca. 1 kcal/mol (1c
vs. 2c). These effects clearly originate from the changes in MEP discussed earlier (for tetrazole:
MEP deeper for 1b, 1c than for 1a, while for PBI deeper for 2a than 2b, 2c). In other words,
while the calculated protonation energies of tetrazole 1a and imdazole 2a reflect qualitatively the
lower pKa values of tetrazole, our calculations predict that the introduction of 2,6-ether
substituted phenyl groups in the C5-position of tetrazole significantly increases the pKa values of
such tetrazole groups, into the range of imidazole systems. This can be understood by the
predicted planar structure of these systems, which allows for resonance stabilisation over the
phenyl ring. Therefore, while tetrazole based polymers may not interact well enough with PA to
be doped efficiently, systems containing 2,6-ether substituted phenyl groups in the C5-position
of tetrazole may be very attractive systems for PA doped polymers.
In order to further validate our main conclusion for larger models, the preliminary
calculations were performed for the tetrazole model comprising four repeat units (‘tetramer’), as
well for the PBI models with four and six benzimidazole fragments (‘dimer’ and ‘trimer’). The
results show (see Supporting Information, Table S1) that there is no qualitative influence of the
model elongation, concerning the trends in the protonation energies for the tetrazole- and PBI-
based systems.
Page 15 of 32 Journal of Materials Chemistry A
16
Table 2. The minimum values of the molecular electrostatic potential, Vmin , and the protonation
energies, ∆Ep ,1 in kcal/mol.
systems: Vmin ∆Ep1
1a -47.1 (N4) -47.7 (N3)2 -206.43 (-37.59)
1b -63.4 (N4) -60.2 (N3) -240.48 (-71.64)
1c -56.5 (N4) -55.2 (N3) -245.53 (-76.69)
2a -58.4 (N3) -233.78 (-64.94)
2b -53.3 (N3) -240.37 (-71.53)
2c -54.6 (N3) -246.73 (-77.89)
1 reaction energy for X + H+ XH+ and for X + H3O+ XH+ + H2O (in brackets)
2 two values describe the minima in the vicinity of the N3 and N4 nitrogen atoms
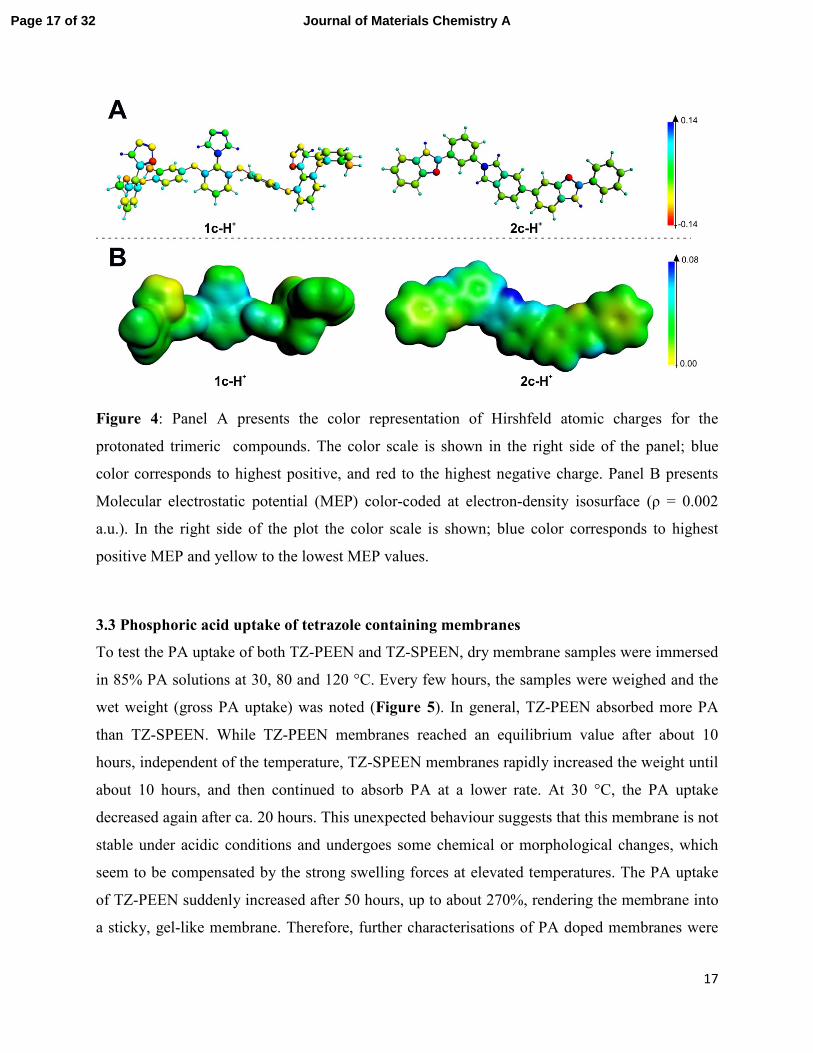
Finally, charge distribution in the protonated systems is presented in Figure 4,
again based on Hirshfeld atomic charges (part A) and molecular electrostatic potential (part B).
The results clearly show that the positive charge is strongly localized on the protonated units (the
carbon C2 and NH atoms). Thus, it may be expected that further protonation on the non-
protonated polymer units should be facile. It should be pointed out that this effect may be of vital
importance for proton conductivity. However, it should be emphasized that the simple models
applied in the present study are not suitable for discussion of multiple protonation. Larger, more
complex models, including PA species (both, PA- anions, and neutral PA molecules) are
required, to investigate and compare a degree of protonation in the studied polymers, as well as
to describe the effect of the protonated neighbouring units. This is beyond the scope of the
present study and will be a subject of our further theoretical calculations (for some preliminary
results see Supporting Information, Tables S2-S4).
Page 16 of 32Journal of Materials Chemistry A
17
Figure 4: Panel A presents the color representation of Hirshfeld atomic charges for the
protonated trimeric compounds. The color scale is shown in the right side of the panel; blue
color corresponds to highest positive, and red to the highest negative charge. Panel B presents
Molecular electrostatic potential (MEP) color-coded at electron-density isosurface (ρ = 0.002
a.u.). In the right side of the plot the color scale is shown; blue color corresponds to highest
positive MEP and yellow to the lowest MEP values.
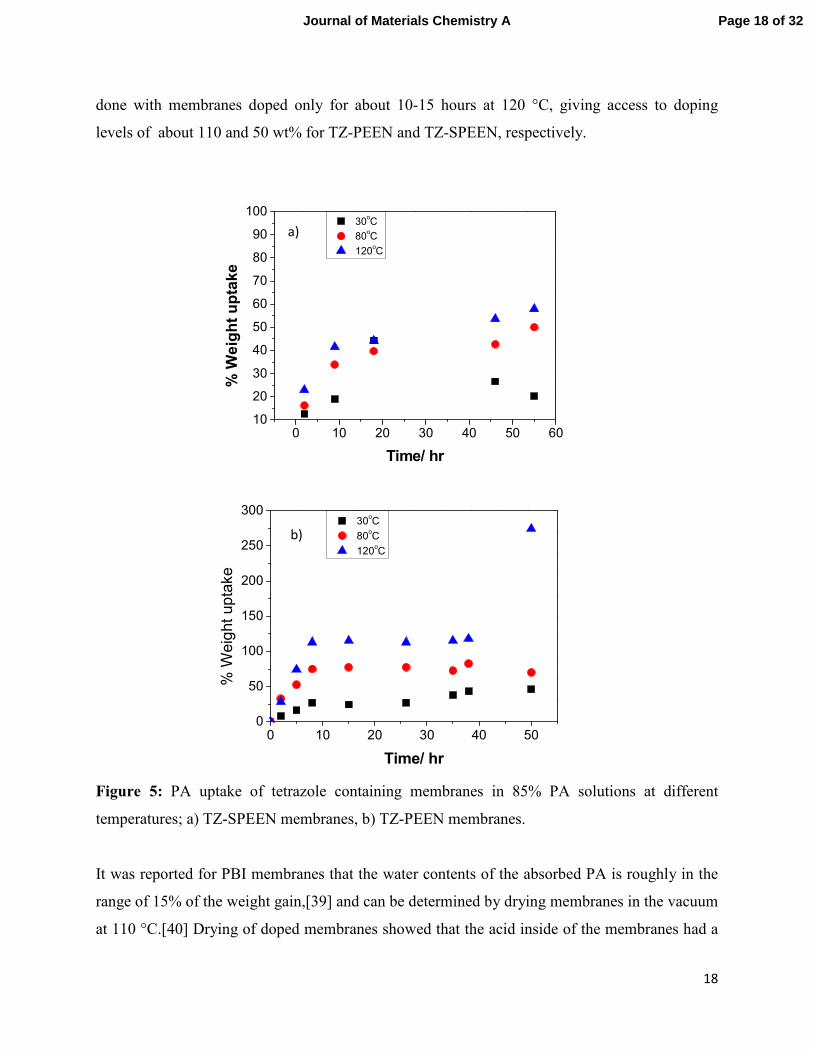
3.3 Phosphoric acid uptake of tetrazole containing membranes
To test the PA uptake of both TZ-PEEN and TZ-SPEEN, dry membrane samples were immersed
in 85% PA solutions at 30, 80 and 120 °C. Every few hours, the samples were weighed and the
wet weight (gross PA uptake) was noted (Figure 5). In general, TZ-PEEN absorbed more PA
than TZ-SPEEN. While TZ-PEEN membranes reached an equilibrium value after about 10
hours, independent of the temperature, TZ-SPEEN membranes rapidly increased the weight until
about 10 hours, and then continued to absorb PA at a lower rate. At 30 °C, the PA uptake
decreased again after ca. 20 hours. This unexpected behaviour suggests that this membrane is not
stable under acidic conditions and undergoes some chemical or morphological changes, which
seem to be compensated by the strong swelling forces at elevated temperatures. The PA uptake
of TZ-PEEN suddenly increased after 50 hours, up to about 270%, rendering the membrane into
a sticky, gel-like membrane. Therefore, further characterisations of PA doped membranes were
Page 17 of 32 Journal of Materials Chemistry A
18
done with membranes doped only for about 10-15 hours at 120 °C, giving access to doping
levels of about 110 and 50 wt% for TZ-PEEN and TZ-SPEEN, respectively.
0 10 20 30 40 50 6010
20
30
40
50
60
70
80
90
100 30
oC
80oC
120oC
% W
eig
ht
up
take
Time/ hr
0 10 20 30 40 500
50
100
150
200
250
300 30
oC
80oC
120oC
% W
eight uptake
Time/ hr
Figure 5: PA uptake of tetrazole containing membranes in 85% PA solutions at different
temperatures; a) TZ-SPEEN membranes, b) TZ-PEEN membranes.
It was reported for PBI membranes that the water contents of the absorbed PA is roughly in the
range of 15% of the weight gain,[39] and can be determined by drying membranes in the vacuum
at 110 °C.[40] Drying of doped membranes showed that the acid inside of the membranes had a
a)
b)
Page 18 of 32Journal of Materials Chemistry A
19
water concentration of 24 and 14% for TZ-PEEN and TZ-SPEEN, respectively. A comparison of
the equilibrium acid doping level in 85wt% PA at room temperature reveals that TZ-PEEN and
meta-PBI[3] absorb 0.5 and 4.7 mole PA/mole heterocycle, respectively (corrected for 24 and
14% water in the absorbed PA). Clearly PBI shows a higher affinity to PA than TZ-PEEN.
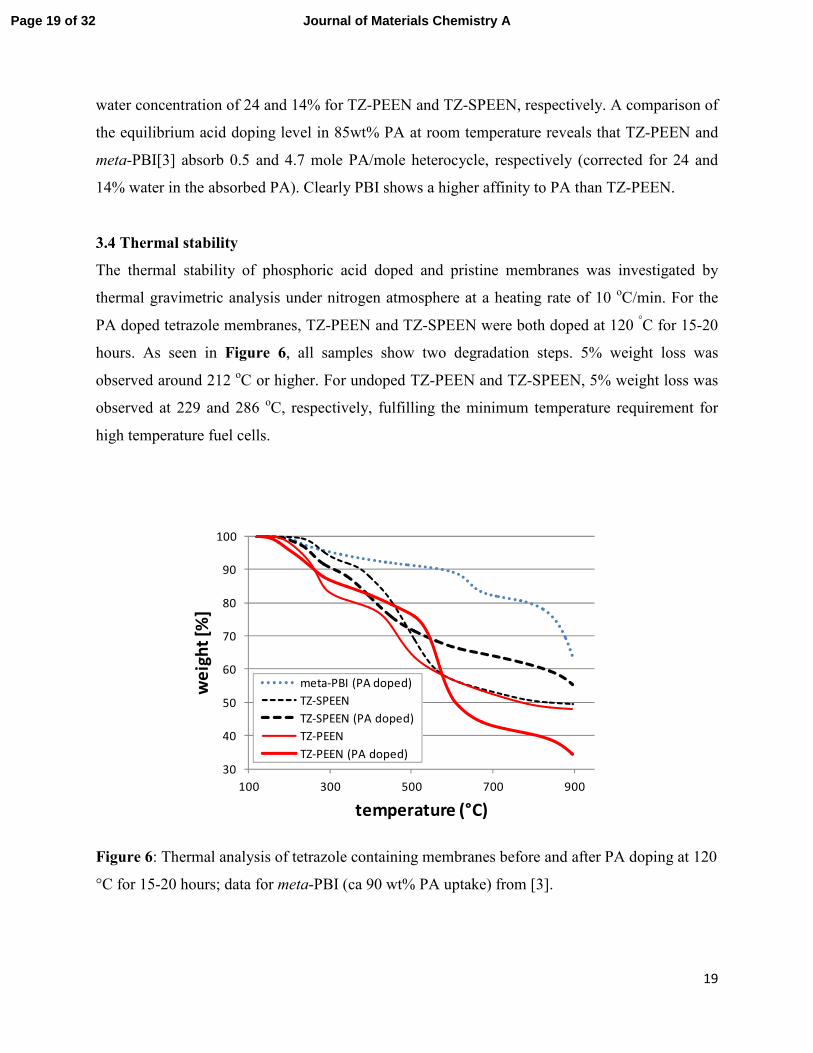
3.4 Thermal stability
The thermal stability of phosphoric acid doped and pristine membranes was investigated by
thermal gravimetric analysis under nitrogen atmosphere at a heating rate of 10 oC/min. For the
PA doped tetrazole membranes, TZ-PEEN and TZ-SPEEN were both doped at 120 °C for 15-20
hours. As seen in Figure 6, all samples show two degradation steps. 5% weight loss was
observed around 212 oC or higher. For undoped TZ-PEEN and TZ-SPEEN, 5% weight loss was
observed at 229 and 286 oC, respectively, fulfilling the minimum temperature requirement for
high temperature fuel cells.
Figure 6: Thermal analysis of tetrazole containing membranes before and after PA doping at 120
°C for 15-20 hours; data for meta-PBI (ca 90 wt% PA uptake) from [3].
30
40
50
60
70
80
90
100
100 300 500 700 900
we
igh
t [%
]
temperature (°C)
meta-PBI (PA doped)
TZ-SPEEN
TZ-SPEEN (PA doped)
TZ-PEEN
TZ-PEEN (PA doped)
Page 19 of 32 Journal of Materials Chemistry A
20
The origin of the first degradation step around 200 oC is not clear. One possibility is residual
water which could not be removed by pre-drying at 100 °C for 30 minutes, as water molecules
are likely involved in intermolecular hydrogen bonding with the nitrogen atoms.[41] Another
possibility is related to the tetrazole moieties. For 70% tetrazolated TZ-PEEN, loss of tetrazole
would account for 19% weight loss, and loss of HN3 (back reaction of the cycloaddition with
azide) for 12%. Therefore, loss of the whole tetrazole group during thermal degradation is more
probable. On the other hand, TZ-SPEEN shows only half of the expected weight loss. This may
indicate a stabilising effect, e.g. ionic interaction, of the sulfonic acid groups. For acid doped
samples, degradation includes dehydration of PA under formation of PA anhydrides. Around 400 oC, all 4 samples show degradation of the polymer backbone.
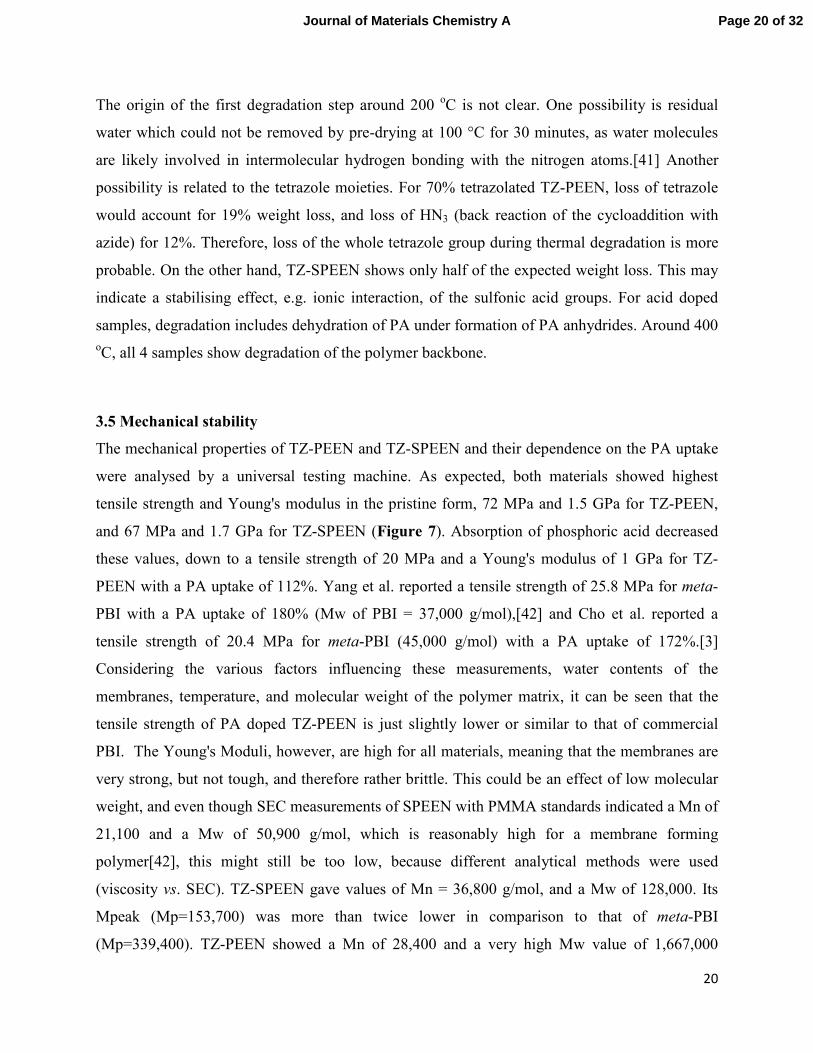
3.5 Mechanical stability
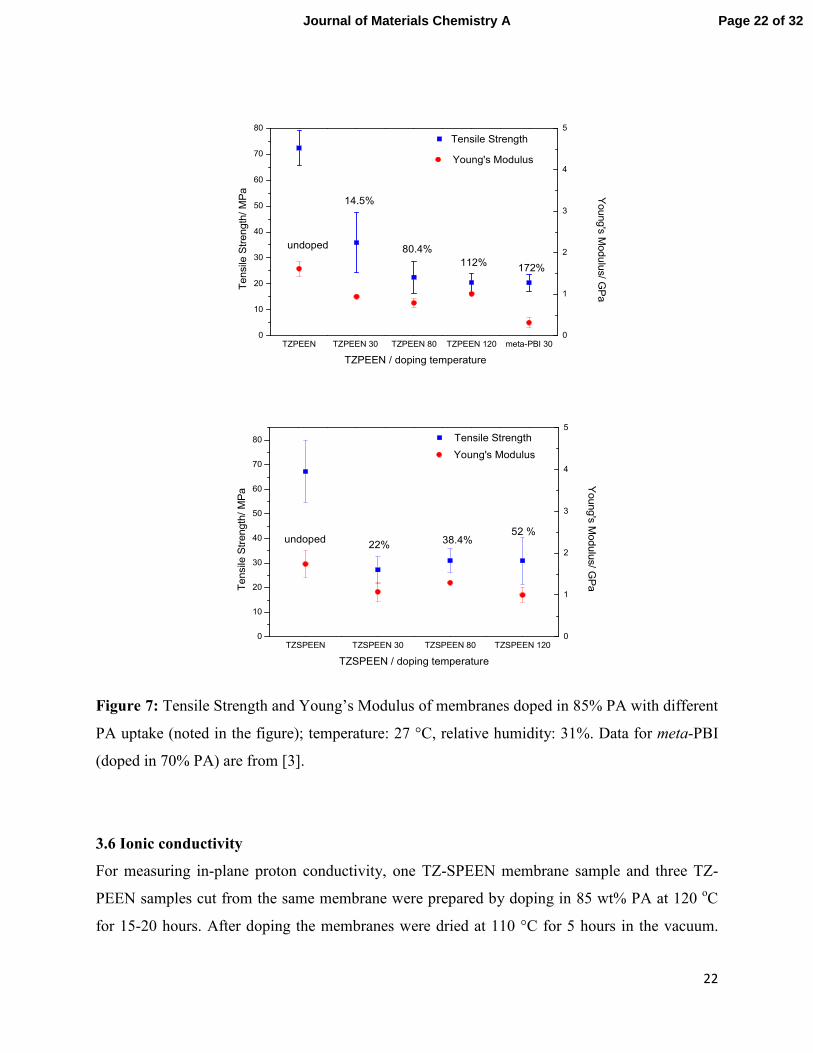
The mechanical properties of TZ-PEEN and TZ-SPEEN and their dependence on the PA uptake
were analysed by a universal testing machine. As expected, both materials showed highest
tensile strength and Young's modulus in the pristine form, 72 MPa and 1.5 GPa for TZ-PEEN,
and 67 MPa and 1.7 GPa for TZ-SPEEN (Figure 7). Absorption of phosphoric acid decreased
these values, down to a tensile strength of 20 MPa and a Young's modulus of 1 GPa for TZ-
PEEN with a PA uptake of 112%. Yang et al. reported a tensile strength of 25.8 MPa for meta-
PBI with a PA uptake of 180% (Mw of PBI = 37,000 g/mol),[42] and Cho et al. reported a
tensile strength of 20.4 MPa for meta-PBI (45,000 g/mol) with a PA uptake of 172%.[3]
Considering the various factors influencing these measurements, water contents of the
membranes, temperature, and molecular weight of the polymer matrix, it can be seen that the
tensile strength of PA doped TZ-PEEN is just slightly lower or similar to that of commercial
PBI. The Young's Moduli, however, are high for all materials, meaning that the membranes are
very strong, but not tough, and therefore rather brittle. This could be an effect of low molecular
weight, and even though SEC measurements of SPEEN with PMMA standards indicated a Mn of
21,100 and a Mw of 50,900 g/mol, which is reasonably high for a membrane forming
polymer[42], this might still be too low, because different analytical methods were used
(viscosity vs. SEC). TZ-SPEEN gave values of Mn = 36,800 g/mol, and a Mw of 128,000. Its
Mpeak (Mp=153,700) was more than twice lower in comparison to that of meta-PBI
(Mp=339,400). TZ-PEEN showed a Mn of 28,400 and a very high Mw value of 1,667,000
Page 20 of 32Journal of Materials Chemistry A
21
g/mol, due to the high molecular weight fraction being out of the calibration. A reason for the
brittle behaviour of TZ-SPEEN could be also strong interactions of the tetrazole groups by
hydrogen bonding, which may only be partially interrupted by protonation in the PA doped
systems, because tetrazolium ions still possess unprotonated nitrogen atoms which act as
hydrogen bond acceptors. Furthermore, as discussed before, while imidazole is mainly
protonated in the presence of PA, the tetrazole units in TZ-PEEN and TZ-SPEEN are probably
not fully protonated, due to the low pKa values of tetrazole and tetrazolium. A lower level of
protonation than observed for PBI is also indicated by the behaviour of DMAc/0.5 wt.-% LiCl
solutions, used as eluent for SEC. While the SEC curve of TZ-SPEEN does not show any
dependence on the concentration of the polymer (from 0.5-12 mg/ml, data not shown), this is not
true in case of meta-PBI - its chain collapses after a concentration of 2-4 mg/ml, forming
compact structures with changed conformation, which results in the shift of SEC curves to higher
elution volumes, i.e. lower molar masses. [43].
Page 21 of 32 Journal of Materials Chemistry A
22
TZPEEN TZPEEN 30 TZPEEN 80 TZPEEN 120 meta-PBI 300
10
20
30
40
50
60
70
80
172%
Tensile Strength/ MPa
TZPEEN / doping temperature
Tensile Strength
Young's Modulus/ G
Pa
undoped
14.5%
80.4%
112%
0
1
2
3
4
5
Young's Modulus
TZSPEEN TZSPEEN 30 TZSPEEN 80 TZSPEEN 1200
10
20
30
40
50
60
70
80
Tensile Strength/ MPa
TZSPEEN / doping temperature
Tensile Strength
undoped22% 38.4%
52 %
0
1
2
3
4
5
Young's Modulus
Young's Modulus/ G
Pa
Figure 7: Tensile Strength and Young’s Modulus of membranes doped in 85% PA with different
PA uptake (noted in the figure); temperature: 27 °C, relative humidity: 31%. Data for meta-PBI
(doped in 70% PA) are from [3].
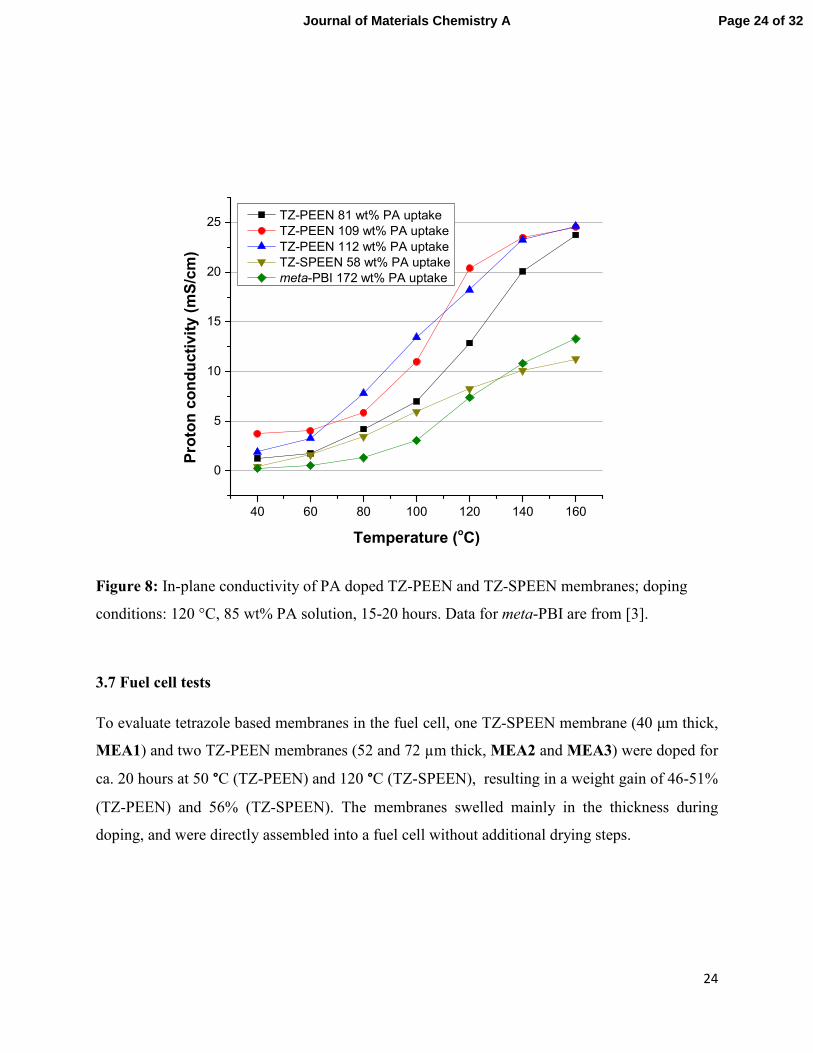
3.6 Ionic conductivity
For measuring in-plane proton conductivity, one TZ-SPEEN membrane sample and three TZ-
PEEN samples cut from the same membrane were prepared by doping in 85 wt% PA at 120 oC
for 15-20 hours. After doping the membranes were dried at 110 °C for 5 hours in the vacuum.
Page 22 of 32Journal of Materials Chemistry A

23
The membrane weight gains due to the doping acid were found to be of 81%, 109% and 112%
(TZ-PEEN) and 58% (TZ-SPEEN). Drying of the obtained membranes before measuring the
conductivity ensured that the measured conductivity is that of dry membranes, because water
increases the conductivity of PA doped membranes.[2] The proton conductivities of PA doped
tetrazole-based membranes (Figure 8) were then studied using electrochemical impedance
spectroscopy (EIS). Compared with the proton conductivity of PA-doped meta-PBI with a
weight gain of 172% during doping, TZ-PEEN membranes show much better values: At 160 oC,
the proton conductivity of PA-doped meta-PBI was reported as 14 mS/cm [3] while TZ-PEEN
shows a conductivity of about 25 mS/cm, even though the PA uptake is lower. Considering the
lower doping level of TZ-SPEEN in comparison to TZ-PEEN, it can be expected that the
conductivity of TZ-SPEEN is much lower, and indeed it only reaches 12 mS/cm at 160 °C,
similar to that of the mentioned meta-PBI membrane, but at 30% of the acid uptake. Of course
these values are very low in comparison with state-of-the-art membranes, e.g. meta-PBI doped
with a PA uptake of about 350 wt% showed a conductivity of 130-140 mS/cm at the same
temperature,[42] but since reduction of the PA uptake increases the mechanical stability, some
researchers try to reduce the PA uptake.[34] In the Arrhenius plot, the PA doped membranes
show an inflection point at around 120 °C (Figure S5). Between 60-100 °C, however, a
reasonably linear trend is observed (R2 > 0.99), indicating that proton conduction in PA doped
TZ-PEEN and TZ-SPEEN has an activation energy in the range of 35 kJ/mol. According to the
literature, the activation energy for proton conduction in various PBI derivatives increases with
increasing acid content, independent of the exact chemical structure of the polymer matrix,
reaching about 45 kJ/mol at an acid content of 60% (Figure S6).[44] Even though the acid
content in TZ-PEEN and TZ-SPEEN is lower (37 - 53 %), the activation energies observed for
tetrazole based membranes are much lower. This suggests that proton conduction in the
presented materials follows another mechanism, e.g. this could be a strong contribution of proton
hopping involving the tetrazole rings, as already suggested for some non-doped tetrazole
containing polymers.[12] In summary, it seems that tetrazole based membranes have an
intrinsically higher conductivity, which should increase further if it is possible to increase the
acid uptake without degrading the mechanical stability, e.g. by a mechanical reinforcement.
Page 23 of 32 Journal of Materials Chemistry A
24
40 60 80 100 120 140 160
0
5
10
15
20
25
Pro
ton
co
nd
ucti
vit
y (
mS
/cm
)
Temperature (oC)
TZ-PEEN 81 wt% PA uptake
TZ-PEEN 109 wt% PA uptake
TZ-PEEN 112 wt% PA uptake
TZ-SPEEN 58 wt% PA uptake
meta-PBI 172 wt% PA uptake
Figure 8: In-plane conductivity of PA doped TZ-PEEN and TZ-SPEEN membranes; doping
conditions: 120 °C, 85 wt% PA solution, 15-20 hours. Data for meta-PBI are from [3].
3.7 Fuel cell tests
To evaluate tetrazole based membranes in the fuel cell, one TZ-SPEEN membrane (40 µm thick,
MEA1) and two TZ-PEEN membranes (52 and 72 µm thick, MEA2 and MEA3) were doped for
ca. 20 hours at 50 °C (TZ-PEEN) and 120 °C (TZ-SPEEN), resulting in a weight gain of 46-51%
(TZ-PEEN) and 56% (TZ-SPEEN). The membranes swelled mainly in the thickness during
doping, and were directly assembled into a fuel cell without additional drying steps.
Page 24 of 32Journal of Materials Chemistry A
25
3.7.1 TZ-SPEEN fails rapidly in the fuel cell
Following our standard procedure, MEA1 was operated at a current density of 200 mA/cm2 for
activation. During activation, redistribution of PA typically increases the cell potential until a
steady value is reached. For TZ-SPEEN membranes, however, the potential decreased rapidly
and already after 4 hours reached 0V (red, upper curve in Figure S7). The reason for the
observed catastrophic failure is the low acidic stability of bisphenol A that can lead to scission of
the polymer main chain.[45, 46] SEC analysis of the failed membrane confirmed this hypothesis
(supporting information) .
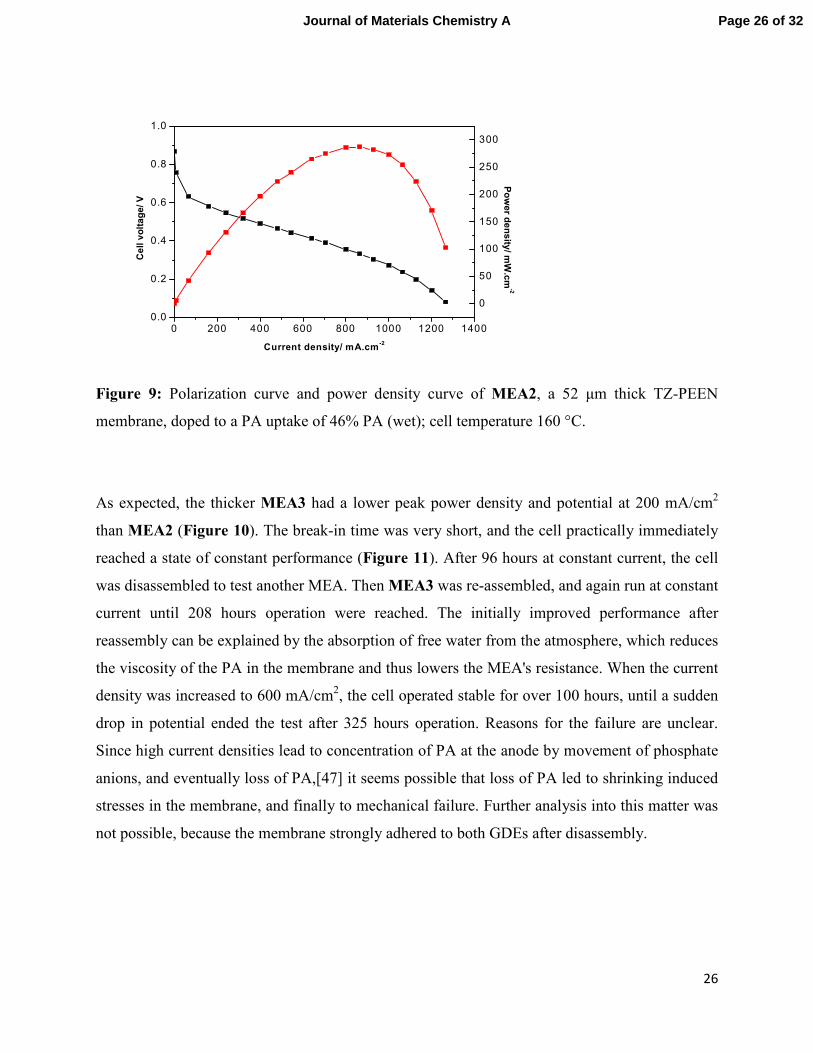
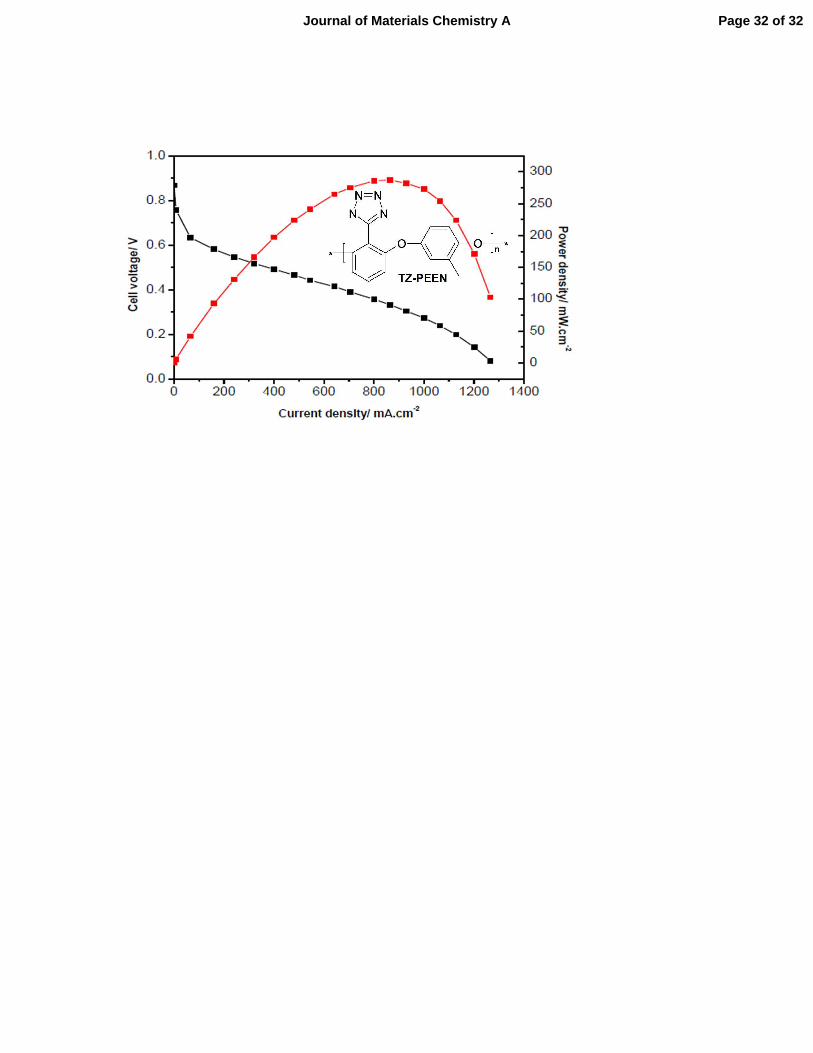
3.7.2 TZ-PEEN shows good performance in the fuel cell
Both TZ-PEEN membranes showed a stable fuel cell performance at 160 °C and a current
density of 200 mA/cm2, indicating that indeed the bisphenol A unit in TZ-SPEEN acts as a
breaking point. After activation, MEA2, based on 52 µm thick TZ-PEEN, showed a peak power
density of 287 mW/cm2 and a potential at 200 mA/cm2 of 558 mV (Figure 9). Linear sweep
voltammetry (Figure S10) revealed that MEA 2 was practically free of electric shorting (slope
of the linear part ~ 0 Ω-1 cm-2), and that the hydrogen crossover current was in the range of 10
mA/cm2 (extrapolation to 0 V). This crossover current density is too large for practical
applications, but can be improved by increasing the membrane thickness and probably also by
optimisation of the membrane casting process.
Page 25 of 32 Journal of Materials Chemistry A
26
0 200 400 600 800 1000 1200 14000.0
0.2
0.4
0.6
0.8
1.0
Ce
ll v
olt
ag
e/ V
Current density/ mA.cm-2
0
50
100
150
200
250
300
Po
we
r de
ns
ity/ m
W.c
m-2
Figure 9: Polarization curve and power density curve of MEA2, a 52 µm thick TZ-PEEN
membrane, doped to a PA uptake of 46% PA (wet); cell temperature 160 °C.
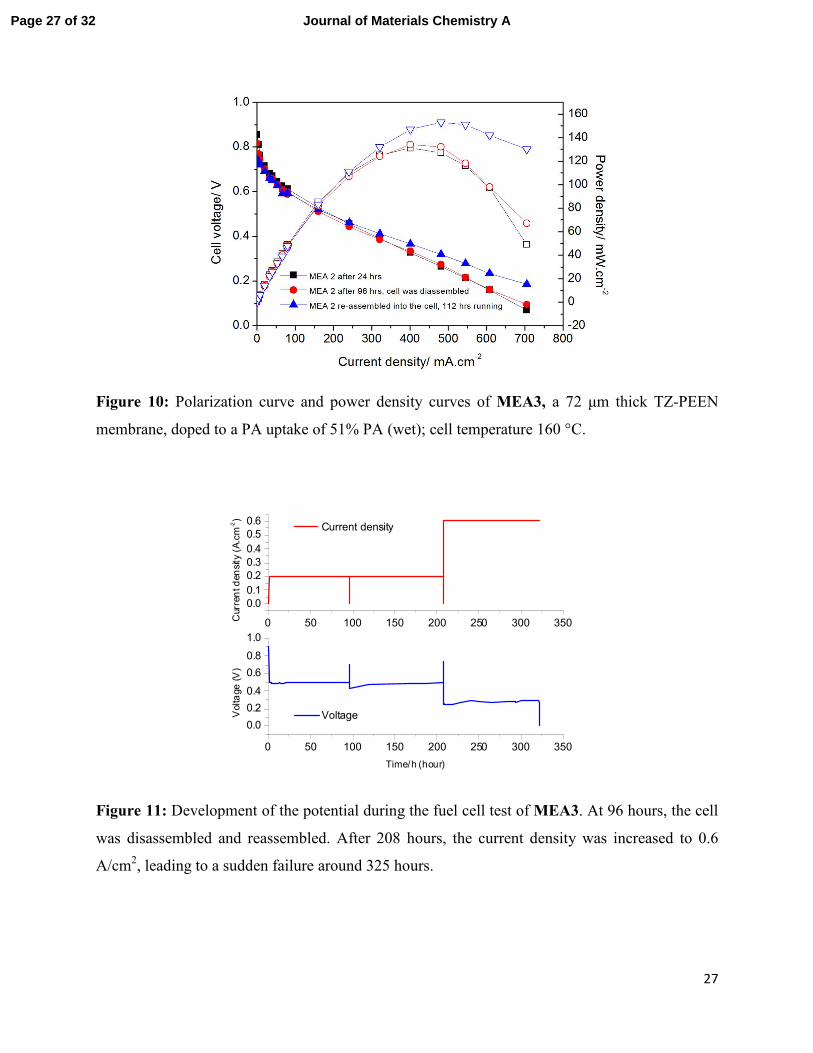
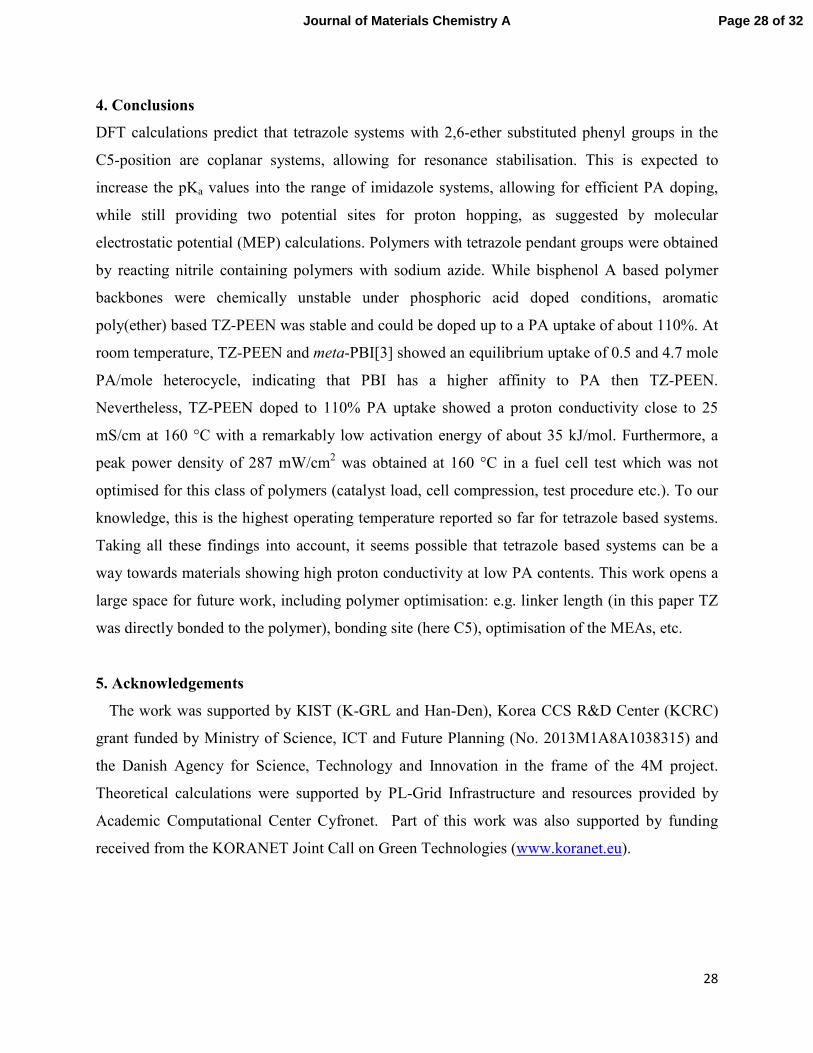
As expected, the thicker MEA3 had a lower peak power density and potential at 200 mA/cm2
than MEA2 (Figure 10). The break-in time was very short, and the cell practically immediately
reached a state of constant performance (Figure 11). After 96 hours at constant current, the cell
was disassembled to test another MEA. Then MEA3 was re-assembled, and again run at constant
current until 208 hours operation were reached. The initially improved performance after
reassembly can be explained by the absorption of free water from the atmosphere, which reduces
the viscosity of the PA in the membrane and thus lowers the MEA's resistance. When the current
density was increased to 600 mA/cm2, the cell operated stable for over 100 hours, until a sudden
drop in potential ended the test after 325 hours operation. Reasons for the failure are unclear.
Since high current densities lead to concentration of PA at the anode by movement of phosphate
anions, and eventually loss of PA,[47] it seems possible that loss of PA led to shrinking induced
stresses in the membrane, and finally to mechanical failure. Further analysis into this matter was
not possible, because the membrane strongly adhered to both GDEs after disassembly.
Page 26 of 32Journal of Materials Chemistry A
27
Figure 10: Polarization curve and power density curves of MEA3, a 72 µm thick TZ-PEEN
membrane, doped to a PA uptake of 51% PA (wet); cell temperature 160 °C.
Figure 11: Development of the potential during the fuel cell test of MEA3. At 96 hours, the cell
was disassembled and reassembled. After 208 hours, the current density was increased to 0.6
A/cm2, leading to a sudden failure around 325 hours.
0 50 100 150 200 250 300 350
0.0
0.2
0.4
0.6
0.8
1.0
VoltageVoltage (V)
Time/h (hour)
0 50 100 150 200 250 300 350
0.0
0.1
0.2
0.3
0.4
0.5
0.6 Current density
Current density (A.cm
-2)
Page 27 of 32 Journal of Materials Chemistry A
28
4. Conclusions
DFT calculations predict that tetrazole systems with 2,6-ether substituted phenyl groups in the
C5-position are coplanar systems, allowing for resonance stabilisation. This is expected to
increase the pKa values into the range of imidazole systems, allowing for efficient PA doping,
while still providing two potential sites for proton hopping, as suggested by molecular
electrostatic potential (MEP) calculations. Polymers with tetrazole pendant groups were obtained
by reacting nitrile containing polymers with sodium azide. While bisphenol A based polymer
backbones were chemically unstable under phosphoric acid doped conditions, aromatic
poly(ether) based TZ-PEEN was stable and could be doped up to a PA uptake of about 110%. At
room temperature, TZ-PEEN and meta-PBI[3] showed an equilibrium uptake of 0.5 and 4.7 mole
PA/mole heterocycle, indicating that PBI has a higher affinity to PA then TZ-PEEN.
Nevertheless, TZ-PEEN doped to 110% PA uptake showed a proton conductivity close to 25
mS/cm at 160 °C with a remarkably low activation energy of about 35 kJ/mol. Furthermore, a
peak power density of 287 mW/cm2 was obtained at 160 °C in a fuel cell test which was not
optimised for this class of polymers (catalyst load, cell compression, test procedure etc.). To our
knowledge, this is the highest operating temperature reported so far for tetrazole based systems.
Taking all these findings into account, it seems possible that tetrazole based systems can be a
way towards materials showing high proton conductivity at low PA contents. This work opens a
large space for future work, including polymer optimisation: e.g. linker length (in this paper TZ
was directly bonded to the polymer), bonding site (here C5), optimisation of the MEAs, etc.
5. Acknowledgements
The work was supported by KIST (K-GRL and Han-Den), Korea CCS R&D Center (KCRC)
grant funded by Ministry of Science, ICT and Future Planning (No. 2013M1A8A1038315) and
the Danish Agency for Science, Technology and Innovation in the frame of the 4M project.
Theoretical calculations were supported by PL-Grid Infrastructure and resources provided by
Academic Computational Center Cyfronet. Part of this work was also supported by funding
received from the KORANET Joint Call on Green Technologies (www.koranet.eu).
Page 28 of 32Journal of Materials Chemistry A
29
6. References
[1] F. Zhou, S. S. Araya, I. F. Grigoras, S. J. Andreasen, S. K. Kær, J. Fuel Cell Sci. Tech., 2015,
12, 021002 (1-9).
[2] J. S. Wainright, J.-T. Wang, D. Weng, R. F. Savinell, M. Litt, J. Electrochem. Soc. 1995, 142,
L121-L123.
[3] H. Cho, E. Hur, D. Henkensmeier, G. Jeong, E. Cho, H.-J. Kim, J. H. Jang, K.-Y. Lee, H. A.
Hjuler, Q. Li, J. O. Jensen, L. N. Cleemann, Eur. Polym. J. 2014, 58, 135–143.
[4] L. Xiao, H. Zhang, E. Scanlon, L. S. Ramanathan, E.-W. Choe, D. Rogers, T. Apple, B. C.
Benicewicz, Chem. Mater. 2005, 17, 5328-5333.
[5] Q. Li, J. O. Jensen, R. F. Savinell, N. J. Bjerrum, Progr. Polym. Sci. 2009, 34, 449–477.
[6] N. Gourdoupi, J. K. Kallitsis and S. Neophytides, J. Power Sources 2010, 195, 170-174.
[7] C. Morfopoulou, A. K. Andreopoulou and J. K. Kallitsis, J. Polym. Sci., Part A: Polym.
Chem. 2011, 49, 4325-4334.
[8] C. I. Morfopoulou, A. K. Andreopoulou, M. K. Daletou, S. G. Neophytides, J. K. Kallitsis, J.
Mater. Chem. A 2013, 1, 1613-1622.
[9] J. Yang, Q. Li, J. O. Jensen, C. Pan, L. N. Cleemann, N. J. Bjerrum, R. He, J. Power Sources
2012, 205, 114– 121.
[10] M. M. Nasef, dx.doi.org/10.1021/cr4005499
[11] H.-T. Pu, S. Ye, React. Funct. Polym. 2006, 66, 856–862.
[12] H. Pu, J.Wu, D. Wan, Z. Chang, J. Membr. Sci. 2008, 322, 392–399.
[13] M.-K. Song, H. Li, J. Li, D. Zhao, J. Wang, M. Liu, Adv. Mater. 2014, 26, 1277-1282.
[14] E. Kim, P. F. Weck, N. Balakrishnan, C. Bae, J. Phys. Chem. B 2008, 112, 3283-3286.
[15] N. Idupulapati, R. Devanathan, M. Dupuis, J. Phys. Chem. A 2010, 114, 6904–6912.
[16] Y. Zhou, J. Yang, H. Su, J. Zeng, S. P. Jiang, W. A. Goddard, J. Am. Chem. Soc. 2014, 136,
4954−4964.
[17] N. Du, G. P. Robertson, M. M. Dal-Cin, L. Scoles, M. Guiver, Polymer 2012, 53, 4367 –
4372.
[18] A. D. Becke, Phys. Rev. A 1988, 38, 3098-3100.
[19] J. P. Perdew, Physical Review B: Condensed Matter and Materials Physics 1986, 34, 7406-
7406.
[20] J. P. Perdew, Phys. Rev. B 1986, 33, 8822-8824.
Page 29 of 32 Journal of Materials Chemistry A
30
[21] G. te Velde, F. M. Bickelhaupt, E. J. Baerends, C. Fonseca Guerra, S. J. A. van Gisbergen,
J. G. Snijders, T. Ziegler, J. Comput. Chem. 2001, 22, 931-967.
[22] E. J. Baerends, D. E. Ellis, P. Ros, Chem. Phys. 1973, 2, 41-51.
[23]E. J. Baerends, P. Ros, Chem. Phys. 1973, 2, 52-59.
[24] G. te Velde, E. J. Baerends, J. Comput. Phys. 1992, 99, 84-98.
[25] C. G. Fonseca Guerra, O. Visser, J. G. Snijders, G. te Velde, E. J. Baerends, Methods and
Techniques in Computational Chemistry: METECC-95. STEF: Cagliari, Italy, 1995, p. 303.
[26] E. van Lenthe, E. J. Baerends, J. G. Snijders, J. Chem. Phys. 1993, 99, 4597-4610.
[27] E. van Lenthe, E. J. Baerends, J. G. Snijders, J. Chem. Phys. 1994, 101, 9783-9792.
[28] F. L. Hirshfeld, Theoret. Chim. Acta 1977, 44, 129–138.
[29] J. S. Murray, P. Politzer, WIREs Comput Mol Sci 2011, 1, 153-163.
[30] J. S. Murray, P. Politzer, Theoretical Chemistry Accounts 2002, 108, 134-142.
[31] D. Cantillo, B. Gutmann, C. O. Kappe, J. Org. Chem. 2012, 77, 10882−10890.
[32] D. Cantillo, B. Gutmann, C. O. Kappe, J. Am. Chem. Soc. 2011, 133, 4465–4475.
[33] M. Girardin, S. J. Dolman, S. Lauzon, S. G. Ouellet, G. Hughes, P. Fernandez, G. Zhou, P.
D. O’Shea, Org. Process Res. Dev. 2011, 15, 1073–1080.
[34] D. C. Villa, S. Angioni, S. Dal Barco, P. Mustarelli, E. Quartarone, Adv. Energy Mater.
2014, 4, 1301949 (1-8).
[35] A. Dişli, M. Salman, Russ. J. Org. Chem. 2009, 45, 151-153.
[36] F. H. Allen, C. R. Groom, J. W. Liebeschuetz, D. A. Bardwell, T. S. G. Olsson, P. A.
Wood, J. Chem. Inf. Model. 2012, 52, 857−866.
[37] D. D. Zorn, J. A. Boatz, M. S. Gordon, J. Phys. Chem. B 2006, 110, 11110-11119.
[38] J. F. Satchell, B. J. Smith, Phys. Chem. Chem. Phys. 2002, 4, 4314–4318.
[39] X. Glipa, B. Bonnet, B. Mula, D. J. Jones, J. Rozière, J. Mater. Chem. 1999, 9, 3045-3049.
[40] Q. Li, R. He, R. W. Berg, H. A. Hjuler, N. J. Bjerrum, Solid State Ionics 2004, 168, 177-
185.
[41] N.W. Brooks, R.A. Duckett, J. Rose, I.M. Ward, Polymer 1993, 34, 4039.
[42] J. S. Yang, L. N. Cleemann, T. Steenberg, C. Terkelsen, Q. Li, J. O. Jensen, H. A. Hjuler, N.
J. Bjerrum, R. He, Fuel Cells 2014, 14, 7-15.
[43] C. B. Shogbon, J.-L. Brousseau, H. Zhang, B. C. Benicewicz, Y. A. Akpalu,
Macromolecules, 2006, 39, 9409-9418.
Page 30 of 32Journal of Materials Chemistry A
31
[44] J. A. Asensio, E. M. Sánchez, P. Gómez-Romero, Chem. Soc. Rev. 2010, 39, 3210–3239.
[45] W. Chen, H. Lin, Org. Lett. 2004, 14, 2341-2342.
[46] S. Hink, N. M. H. Duong, D. Henkensmeier, J. Y. Kim, J. H. Jang, H.-J. Kim, J. Han, S.-W.
Nam, Solid State Ionics, 2015, 275, 80-85.
[47] S. H. Eberhardt, M. Toulec, F. Marone, M. Stampanoni, F. N. Büchi, T. J. Schmidt, J.
Electrochem. Soc. 2015, 162, F310-F316.
Page 31 of 32 Journal of Materials Chemistry A
Page 32 of 32Journal of Materials Chemistry A