testing urbanization economies in manufacturing industries: urban
TRANSCRIPT

Munich Personal RePEc Archive
Testing urbanization economies in
manufacturing industries: urban
diversity or urban size?
Fu, Shihe and Hong, Junjie
Southwestern University of Finance and Economics, University of
International Business and Economics
August 2008
Online at https://mpra.ub.uni-muenchen.de/10078/
MPRA Paper No. 10078, posted 18 Aug 2008 03:15 UTC

Testing Urbanization Economies in ManufacturingIndustries: Urban Diversity or Urban Size?
Shihe FuResearch Institute of Economics and ManagementSouthwestern University of Finance and Economics
55 Guanghua Cun StreetChengdu 610074, ChinaE-mail: [email protected]
Junjie HongSchool of International Trade and Economics
University of International Business and EconomicsBeijing, 100029, China
E-mail: [email protected]
Abstract
Whether urbanization economies are caused by urban diversity or urbanscale is not clear in regional and urban economics literature. Many empiricalstudies have used either city population size or urban industrial diversityto measure urbanization economies and have reached di¤erent conclusions.This paper argues that city size mainly captures the pure scale economiesof urban public goods, and may generate net diseconomies when a city sizeis too large. Urban industrial diversity can also enhance �rm productivity.Using the 2004 China manufacturing census data, we test simultaneously thee¤ects of urban size and industrial diversity on �rm productivity, controllingfor localization economies and human capital externalities. We found thatcity size e¤ect does exist, but too large a city size indicates net diseconomies.Firms also bene�t from industrial diversity, and the strength of such bene�tincreases with city size but decreases with �rm size. The overall resultssupport Jacobs�s idea that small �rms bene�t more from urban diversity.
Key words: Urbanization economies; Industrial diversity; Jacobs exter-nalities; City size
JEL Classi�cations: L60; R12; R30
1

1 INTRODUCTION
Traditionally, urban agglomeration economies are categorized into two types:
localization economies, referring to the economies of scale external to a �rm
but internal to an industry, and urbanization economies, referring to the
economies of scale external to an industry but internal to a city (Hoover,
1937). Although Alfred Marshall�s analysis that localization economies come
from labor market pooling, input sharing, and information spillovers between
�rms in the same industry in a city has been widely accepted (Rosenthal
and Strange, 2001), whether urbanization economies come from urban size
or urban industrial diversity has been less clearer.
The concept of urbanization economies is, as a matter of fact, de�ned
vaguely in the regional and urban economics literature, and has been evolv-
ing gradually. At �rst urbanization economies are de�ned as scale economies
external to any industry and resulting from the general level of city economy
(Hoover, 1937, 1971) and measured by city size (population). Henderson
(1986) also believed that urbanization economies are determined by only
the size of the city, not its industrial composition. Since the 1990s the fo-
cus has been shifted gradually onto urban diversity. Henderson, Kuncoro,
and Turner (1995) argued that urbanization economies mean the bene�t a
�rm obtains from overall scale and diversity of a city. Glaeser et al. (1992)
used �lack of industrial diversity� as a measure of urbanization economies,
or Jacobs externalities, in the dynamic context, named after Jane Jacobs
who emphasized the importance of urban industrial diversity on innovation
and urban growth. Henderson (2003) also mixed urbanization economies
with Jacobs externalities. In this paper, we do not intend to argue what the
precise de�nition of urbanization economies should be. In stead, we call the
e¤ect of city population size on �rm productivity city size (scale) e¤ect, and
the e¤ect of urban diversity Jacobs externalities, and test simultaneously
these two e¤ects, conditioning on other controls.
2

Many empirical studies in the 1970s and 1980s have provided evidence
that larger city size is associated with higher productivity. For example,
Sveikauskas (1975) found that productivity is higher in larger cities: dou-
bling a city size is associated with about 6% higher labor productivity in
an average industry. Segal (1976) estimated an aggregate production func-
tion for 58 metropolitan areas and found that labor productivity in cities
with population above two million is 8% higher, concluding that there exist
returns to scale in city size or agglomeration e¤ects.1 Moomaw (1985) con-
structed a theoretical model incorporating city size choice in a �rm�s location
choice problem. He found that the e¤ect of city size on �rm productivity av-
erages 7% (the elasticity is 0.07) among manufacturing industries, and such
external economies have been decreasing in larger cities during the 1970s.
All these studies used industry level data, without the distinction between
localization economies and urbanization economies, and failed to separate
localization economies from city size e¤ect.
Other studies that also used city population or population density as
the measure of urbanization economies distinguished localization economies
from urbanization economies, but reached di¤erent conclusions on the city
size e¤ect. Carlino (1979) used the total number of manufacturing report-
ing units in a metropolitan area to measure urbanization economies, and
metropolitan area population the urbanization diseconomies, and found that
the e¤ect of population size is negative in 18 of the 19 two-digit industries
in his sample. Henderson (1986) used industry-urban area level data in
the USA and Brazil and measured urbanization economies by city popula-
tion. He found little evidence of urbanization economies in manufacturing
industries. Sveikauskas, Gowdy, and Funk (1988) measured urbanization
economies in food processing industry by metropolitan area population, and
found that such agglomeration e¤ects do exist. Using the population in
1Both Sveikauskas and Segal�s studies over-estimated the e¤ect of city size due toimproper model speci�cations or measurement errors in capital intensity (Moomaw, 1981).
3

densely inhabited districts as a measure, Nakamura (1985) found that small
urbanization economies exist in manufacturing industries in Japan, and light
industries tend to receive more urbanization economies than heavy indus-
tries do. The recent study by Baldwin et al. (2007) used metropolitan area
population to measure urbanization economies and found that in Canada
productivity of manufacturing plants bene�ts from urbanization economies:
the elasticity is about 0.077.2
The di¤erent results of urban size e¤ect suggest that the relationship
between urban size and productivity is complex. On the one hand, there
are economies of scale associated with city size. Large city sizes can reduce
the average cost of urban public goods. Such an e¤ect can be considered
pure economies of scale. Abdel-Rahman (2000) constructed a theoretical
model and demonstrated that �rms have incentive to concentrate in a city
that provides public infrastructures, resulting in agglomeration economies.
Large city sizes also imply statistical economies in product markets and la-
bor markets. For example, a �rm�s demand is less variable if the number of
buyers are large and buyers� demand are uncorrelated. On the other hand,
there are diseconomies of scale associated with city size. When city sizes
become larger, problems of congestion, high real estate rents, and other dis-
amenities will arise. Therefore, city size may capture both the productivity
advantages and disadvantages. Theories on the optimal city size indicate
that when a city has an optimal population size, the forces of agglomeration
economies are o¤set by the forces of disagglomeration economies, resulting
in the locally constant returns to scale (Arnott, 1979, 2004). Since real city
sizes may not be optimal, the net e¤ect of city size can be positive or nega-
tive. In addition, city sizes may not be closely related to industrial structure.
Two cities of the same size may have very di¤erent degree of industrial di-
versity or specialization, thus, may show very di¤erent productivity e¤ects.
2All these studies, except Sveikauskas, Gowdy, and Funk (1988), also found evidenceon localization economies at the same time.
4

Although large cities tend to host more diverse industries, city size does
not necessarily represent diversity. Furthermore, industrial diversity of a
small urban area may also have productivity e¤ect. A piece of empirical
evidence is from Rosenthal and Strange (2003) where industrial diversity at
the zip code level has positive e¤ect on the birth and employment of new
establishments.
Urban diversity mainly refers to the industrial diversity within a city.
Probably there is no one who emphasized the importance of urban diver-
sity to urban growth more than Jane Jacobs did. This is why the bene�t
from urban diversity is loosely called Jacobs externalities, even from a sta-
tic context. Jacobs (1961) stressed the important e¤ect of urban diversity
on city safety and city growth. Particularly, she argued that small �rms
bene�t more from urban diversity in large cities because small �rms depend
more on external industrial environments while large �rms are relatively self-
su¢cient. In her another book (1969) she argued further that the growth of
a city is determined by that city�s ability to constantly adding new works
to old ones, and urban diversity is crucial in promoting urban innovation.
Other bene�t from urban diversity can be labor market pooling or statisti-
cal economies (Quigley, 1998; Duranton and Puga, 2000). Industrial diver-
sity may reduce frictional unemployment and stabilize employment (Simon,
1988; Malizia and Ke, 1993). Overall, the bene�ts from urban industrial
diversity may capture both statistical economies, innovation and knowledge
spillovers, and labor market pooling.
A few studies constructed di¤erent indexes to test Jacobs externalities
empirically, and the results are mixed. Glaeser et al. (1992) constructed
a �lack of diversity� index, the ratio of the employment of the largest �ve
industries excluding the industry in question to a city�s total employment,
to measure Jacobs externalities, and found that industrial diversity pro-
motes employment growth in industries. Another approach is to construct
a sub-industry diversity index. For example, manufacturing industry con-
5

sists of many three-digit sub-industries. For any sub-industry in question,
a diversity index can be constructed based on the information of all other
sub-industries within the manufacturing industry in a city. Henderson, Kun-
coro, and Turner (1995) explored this measure and found that mature in-
dustries do not bene�t from urban diversity, but new high-tech industries
do, while both types of industries bene�t from Marshallian externalities.
They concluded that Jacobs externalities help attract new industries while
Marshallian externalities help retain existing industries. Henderson (2003)
also explored this measure as well as the traditional city size measure in
studying the urbanization-Jacobs economies in the US manufacturing and
high-tech industries, and he found little evidence of Jacobs externalities.3
This paper contributes to the literature by using industrial diversity to
measure urbanization-Jacobs economies while controlling for city size ef-
fect, localization economies, and human capital externalities. Di¤erent from
Henderson (2003) and Rothensal and Strange (2003), we are looking at all
manufacturing industries; di¤erent from Mommaw (1981), Glaeser et al.
(1992), Henderson, Kuncoro, and Turner (1995), we are looking at the �rm
level; and most importantly, di¤erent from almost all existing studies on
either city size or industrial diversity, we test the e¤ect of city size and ur-
ban diversity simultaneously, conditioning on localization economies, human
capital externalities, and other controls.
We use the 2004 China manufacturing census data to do the test. We �nd
that in general, city size e¤ect does exist, but too large a city size indicates
net diseconomies. Firms also bene�t from urban industrial diversity, and the
3Recent studies on urban diversity has extended the concept to cultural diviersity.For example, Florida (2002) found that the openness and diversity of urban milieu ispositively associated with the concentration of human capital and high-tech industries.Ottaviano and Peri (2005) constructed a linguistic diversity index to measure culturaldiversity in cities and found that overall cultural diversity has a positive e¤ect on wages andemployment of US-born workers during 1970-1990. Fu (2007) found Jacobs externalitiesin labor markets.
6

strength of such bene�t increases with city size but decreases with �rm size.
Only small �rms bene�t from industrial diversity in all cities; medium �rms
and large �rms bene�t little from industrial diversity. The overall results
support Jacobs�s idea that small �rms bene�t more from urban diversity.
The next section describes the data. Section three speci�es the econo-
metric models to be estimated, and section four presents the results. The
last section concludes.
2 DATA
The data used in this paper are drawn from the �rst economic census of
China, conducted by the Chinese government from 2004 to 2005, and cov-
ering the entire universe of establishments in China. We obtained the �rm
level data of manufacturing industries from the State Statistical Bureau of
China. The data set contains detailed information on all manufacturing
�rms (over 1.3 million) at the end of 2004, including the geographic loca-
tion, year of entry, ownership, total asset, total employment, employment
by education, etc.
The city used in this paper is de�ned as �city proper�, not including the
suburban counties. Statistically, Chinese cities are classi�ed into �ve size
categories according to their population sizes:
(1) Super-large cities: With a population above 2,000,000 persons;
(2) Extra-large cities: With a population between 1,000,000~2,000,000
persons;
(3) Large cities: With a population between 500,000~1,000,000 persons;
(4) Medium cities: With a population between 200,000~500,000 persons;
(5) Small cities: With a population less than 200,000 persons.
The data on city population and total employment by industry in cities
are from the China Urban Statistical Yearbook 2005. The industrial employ-
ment data are not available for cities with population size less than 200,000.
7

Therefore, we select only �rms located in cities with population equal to or
larger than 200,000.
According to the State Statistical Bureau of China, manufacturing �rms
are classi�ed into three categories, based on the total number of employees,
total revenue, or total asset. We adopt the total employee criterion. Small
�rms have less than 300 employees, medium �rms 300~2000 employees, and
large �rms more than 2000 employees.
One potential problem using this data set is that a �rm may have mul-
tiple operating plants that spread in di¤erent cities. Since we are unable
to access plant information, we have to assume that all the employees of
a �rm are located in the same city. This might create some aggregation
bias. However, we believe that the aggregation bias is not serious because
a multi-unit �rm was surveyed at the location where the majority of its
business was conducted. Also in our sample approximately 97.34% of �rms
are single-unit �rms. We also estimate the models separately for single-unit
and multi-unit �rms and the pattern of the results is very similar.
3 MODEL SPECIFICATIONS
In line with most of the existing studies, we adopt the production function
approach to test urbanization economies. Speci�cally, a �rm�s production
function is speci�ed as
Yijk = f(Xijk)g(Ljk)h(Uk); (1)
where Yijk is the total output of the ith �rm in a two-digit manufactur-
ing industry j located in city k; Xijk is a vector of the �rm�s inputs, Ljk
is a vector of characteristics of industry j located in city k, and Uk is a
vector of characteristics of city k. f is assumed to be a neoclassical produc-
tion function; g and h are functions measuring localization economies and
urbanization economies, and are assumed to be Hicks neutral to f:
8

Since individual production function can vary across industries and lo-
cations, a �exible production function (translog production function) is pre-
ferred. We adopt the Cobb-Douglas production function form with a set
of other control variables to control for unobserved �rm, industry, and city
characteristics, and use the translog production function as a robust check.
Corresponding to (1), under some simpli�ed assumptions, the benchmark
econometric model can be speci�ed as
log Yijk = �Xijk + �Ljk + Uk + "ijk; (2)
where "ijk is a disturbance term, �, �, and are coe¢cient vectors to
be estimated.
The vector of inputs, Xijk; includes the following two variables:
Log(Employee): the logarithmic of a �rm�s total number of employees
at the end of year 2004, proxy for a �rm�s labor input;
Log(Asset): the logarithmic of the monetary value of all the economic
resources that a �rm owns or controls, proxy for a �rm�s capital stock.
The key identi�cation issue is that some unobserved �rm characteristics
may correlate with industry or city attributes, biasing the estimation of �
and : To better control for �rm heterogeneity, we add a set of the following
variables to the X vector:
Age: a �rm�s age, equals 2004 minus the opening year;
Age square: the square of Age; proxy for the life cycle of a �rm�s prod-
ucts;
Female: the percentage of a �rm�s employees that are females.
In addition, we include a set of dummy variables to control for di¤erent
types of registration, equity holding, upper levels of administration, and
organization levels.4
4Registration type refers to the organization form of capital enrolled, including 23types, such as state owned, collectively owned, proprietary, domestic joint-stock, andforeign. Equity holding refers to whether the state has dominant equity shares or not.Upper level administration refers to which level of government supervises the �rm, such as
9

The vector of characteristics of a two-digit industry j in city k, Ljk,
consists of two variables:
Indavedu: the ratio of the number of employees that have a college
degree or above in industry j in city k to the total employees of industry
j in city k, controlling for the quality of human capital stock in industry j
in city k: The e¤ect of this variable on output is also referred to as human
capital externalities.5
Specialization: the degree of specialization of industry j in city k: It
equals the total employees in industry j in city k divided by the total em-
ployment in city k:6The e¤ect of this variable is commonly referred to as
localization economies or Marshallian externalities.
To better control for unobserved industry speci�c characteristics, we also
add two-digit industry �xed e¤ects to the model.
The vector of characteristics of city k, Uk, consists of two variables:
Log(population): the logarithmic of non-agricultural population at the
end of year 2004 in city k; capturing the scale e¤ect of city size;
Urban diversity: equals one minus the Her�ndahl index in terms of
the employment in one-digit industries in city k, re�ecting the degree of
industrial diversity in that city. Speci�cally,
the central government, provincial government, and municipal government. Organizationlevel means the rank of a �rm in the political hierarchy of the state, province, city, andcounty.
5We also experiment with the percentage of a �rm�s employees that have a collegedegree or above to measure the average education level of a �rm�s labor force. Thisvariable is not included in the model because it is higly correlated with Indavedu (thecorrelation is 0.41).
6The available data of employment by industry in a city is unit employment, whichexcludes self-employed workers. Since self-employed workers are of small proportion anddistributed across di¤erent industries, we believe that the ratio of unit employment inmanufacturing industries in a city to the total unit employment in a city is very close tothe actual manufacturing employment share in a city. Therefore, for each two-digit man-ufacturing industry in the census data, we compute its share in the total manufacturingemployment, then multiply this share by the ratio of manufacturing unit employment tothe total unit employment in a city to obtain the specialization index.
10

Urban diversity = 1�XM
m=1
EmkPMm=1Emk
!2
; (3)
where Emk is the number of employees in a one-digit industry m in city
k; M is the total number of one-digit industries in city k. There are 19
one-digit industries in total, including agriculture, manufacturing, mining,
public utility, wholesale and retail, real estate, construction, etc., and the
employment data are from China Urban Statistical Yearbook 2005. 7 The
value of Urban diversity is between zero and one. As the value becomes
closer to one, the city industries become more diverse.
Since the diversity of manufacturing industries has also been used in
the literature (Henderson, Kuncoro, and Turner, 1995), we also construct a
manufacturing diversity index to test its e¤ect:
Manu diversity: equals one minus the Her�ndahl index in terms of
two-digit manufacturing industries in city k:
Manu diversity = 1�XJ
j=1
Ejk
PJj=1Ejk
!2
; (4)
where Ejk is the number of employees in a two-digit manufacturing
industry j in city k in the census data, and J is the total number of two-
digit manufacturing industries in city k:
To better control for unobserved regional di¤erences and unobserved city
characteristics, we add province �xed e¤ects.8 Some cities are capitals of
provinces or directly under the central government. Such cities may be
favored politically and we also create a dummy variable to control for such
in�uences.
Before we complete the speci�cation of the benchmark model, one point
worth noting is that the relationship between industrial specialization and
7The employment here refers to unit employment, which excludes self-employment. Asexplained in footnote 6, we believe omitting self-employment does not generate seriousbias and this index re�ects well the actual degree of industrial diversity in a city.
8A city does not cross province boundaries.
11

industrial diversity is not linear or completely opposite. A city can have
multiple specializations and can show specializations in a few industries and
have a relatively high degree of diversity at the same time.
4 RESULTS
4.1 Overall results
Table 1 presents the benchmark model results. All the standard errors are
adjusted by city-industry clusters. Since the coe¢cients of �rm character-
istics are of expected signs and signi�cance, and are not of our particular
interest, we report only the coe¢cients of agglomeration variables. Column
1 uses manufacturing diversity to measure urban diversity and the coe¢cient
is negative and signi�cant, indicating that manufacturing specialization en-
hances �rm productivity. The variable Manu diversity correlates moder-
ately with Log(population) and Specialization (correlation coe¢cients are
0.4 and 0.28 respectively), this might cause come collinearity problem. In
addition, this variable re�ects only the diversity of manufacturing indus-
tries, not really the industrial diversity of a city. Therefore, we decide to
replace this variable by Urban diversity variable. Column 2 con�rms that
Urban diversity is a much better measure, as the signi�cance of all the
agglomeration variables improves a lot. Even after controlling for human
capital externalities and city size e¤ect, in general, �rms still enjoy localiza-
tion economies and Jacobs externalities. Doubling a city size is associated
with about 11% increase in total output, which is comparable to 8% in Segal
(1976). The semi-elasticity of Specialization index is about 1.06, indicating
there exist signi�cant localization economies in manufacturing industries;
while the semi-elasticity of diversity index is about 0.98, also indicating
signi�cant Jacobs externalities in cities.
Columns 3 and 4 in Table 1 estimate the benchmark model for single-unit
and multi-unit �rms. Although the results for multi-unit �rms are somewhat
12
di¤erent as expected, the results for single-unit �rms are remarkably similar
to the results of pooled data, suggesting that the �multi-unit bias� is not
serious. The last two columns present the results by non-high-tech and high-
tech �rms.9 While the results of non-high-tech �rm is similar to results of
pooled data, the results from high-tech �rms are surprising: They do not
bene�t from any types of agglomeration economies, contrasting to existing
studies.10
A few studies proposed to use �exible production function, speci�cally,
translog production function (Nakamura, 1985; Henderson, 1986). We also
try translog production function. All the results of agglomeration variables
are pretty much similar (results are not reported here). Since using translog
production function does not generate new insights for this research, we
decide to keep the simple Cobb-Douglas function form. We also try using
output per worker as the dependent variable, and the pattern of the esti-
mate results is very similar. In summary, the pooled data results show that
in general, manufacturing �rms bene�t from human capital externalities,
localization economies, city bigness, and Jacobs externalities.
9The classi�cation of high-tech industries is de�ned by the State Statistical Bureau ofChina, which is much broader than high-tech industries selected in Henderson (2003).10 In column 6 variables Specialization and Urban diversity are highly correlated (cor-
relation coe¢cient is 0.59). After dropping Specialization, the coe¢cients of other threeagglomeration variables are positive but not signi�cant. On average, high-tech �rms areyounger, have more employees, have higher proportion of college graduates, and are morelikely to be located in super-large cities, compared with other �rms. However, testingagglomeration economies in high-tech industries is beyond the scope of this paper.
13
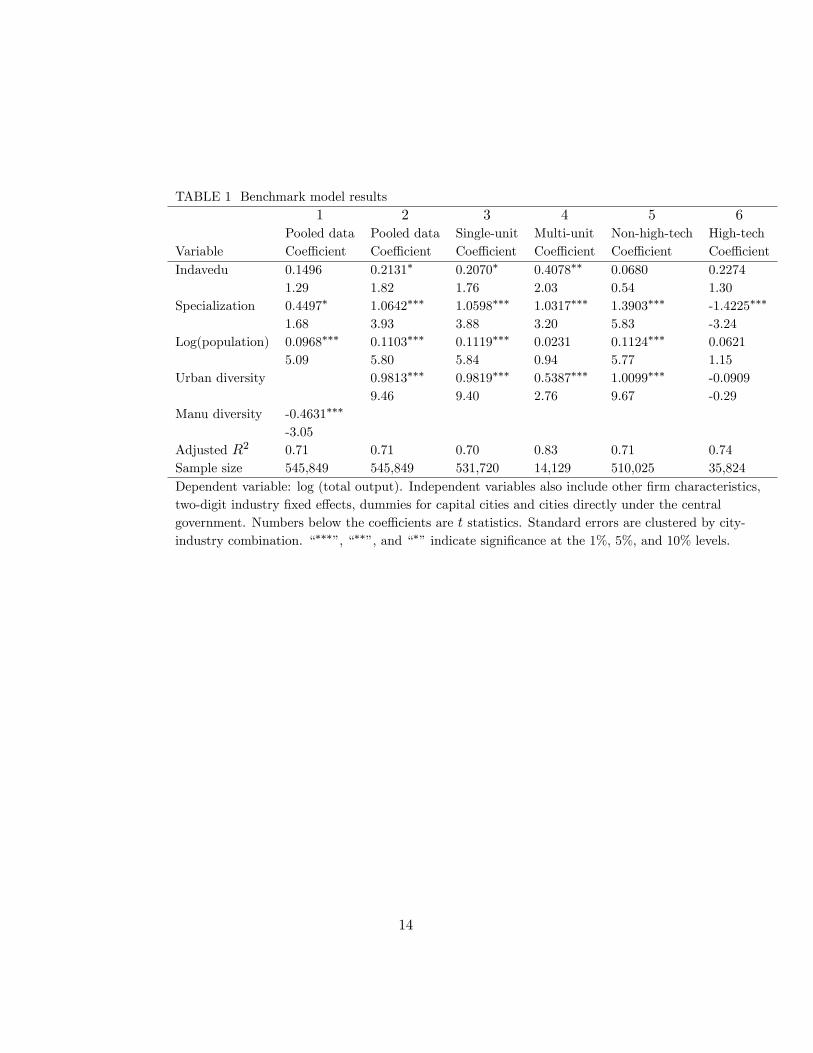
TABLE 1 Benchmark model results
1 2 3 4 5 6Pooled data Pooled data Single-unit Multi-unit Non-high-tech High-tech
Variable Coe¢cient Coe¢cient Coe¢cient Coe¢cient Coe¢cient Coe¢cient
Indavedu 0.1496 0.2131� 0.2070� 0.4078�� 0.0680 0.2274
1.29 1.82 1.76 2.03 0.54 1.30
Specialization 0.4497� 1.0642��� 1.0598��� 1.0317��� 1.3903��� -1.4225���
1.68 3.93 3.88 3.20 5.83 -3.24
Log(population) 0.0968��� 0.1103��� 0.1119��� 0.0231 0.1124��� 0.0621
5.09 5.80 5.84 0.94 5.77 1.15
Urban diversity 0.9813��� 0.9819��� 0.5387��� 1.0099��� -0.0909
9.46 9.40 2.76 9.67 -0.29
Manu diversity -0.4631���
-3.05
Adjusted R2 0.71 0.71 0.70 0.83 0.71 0.74
Sample size 545,849 545,849 531,720 14,129 510,025 35,824
Dependent variable: log (total output). Independent variables also include other �rm characteristics,
two-digit industry �xed e¤ects, dummies for capital cities and cities directly under the central
government. Numbers below the coe¢cients are t statistics. Standard errors are clustered by city-
industry combination. �����, ����, and ��� indicate signi�cance at the 1%, 5%, and 10% levels.
14

4.2 Results by city size
Urban theories predict that medium cities tend to be specialized, and large
cities tend to be diverse. Empirically, theories imply that �rms in medium
cities enjoy more localization economies, while in large cities enjoy more ur-
banization economies. We estimate the benchmark model by city size. The
results are reported in Table 2. Columns 1-4 estimate the models for �rms
located in cities with population greater than or equal to 0.2, 0.5, 1, and
2 million, respectively. A clear pattern shows up: As we restrict our sam-
ple gradually to larger cities, localization economies attenuate while Jacobs
externalities become stronger. Estimate results by city size type (columns
4-7) also con�rm this pattern. Speci�cally, localization economies are the
strongest in medium cities, while Jacobs externalities are the strongest in
super-large cities. The city size e¤ect in extra-large cities (column 5) is
negative and signi�cant at the 1% level, indicating that probably the dis-
economies from city bigness may be dominant. We will provide further
evidence in a moment.
15
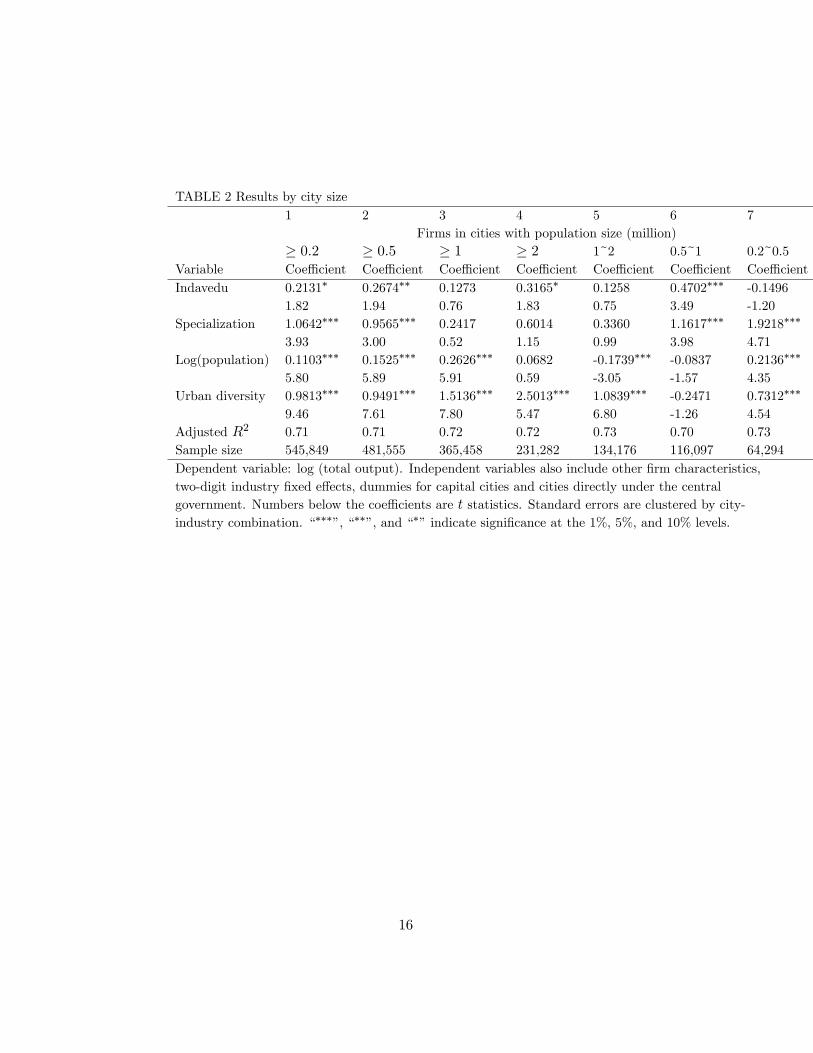
TABLE 2 Results by city size
1 2 3 4 5 6 7
Firms in cities with population size (million)
� 0:2 � 0:5 � 1 � 2 1~2 0.5~1 0.2~0.5
Variable Coe¢cient Coe¢cient Coe¢cient Coe¢cient Coe¢cient Coe¢cient Coe¢cient
Indavedu 0.2131� 0.2674�� 0.1273 0.3165� 0.1258 0.4702��� -0.1496
1.82 1.94 0.76 1.83 0.75 3.49 -1.20
Specialization 1.0642��� 0.9565��� 0.2417 0.6014 0.3360 1.1617��� 1.9218���
3.93 3.00 0.52 1.15 0.99 3.98 4.71
Log(population) 0.1103��� 0.1525��� 0.2626��� 0.0682 -0.1739��� -0.0837 0.2136���
5.80 5.89 5.91 0.59 -3.05 -1.57 4.35
Urban diversity 0.9813��� 0.9491��� 1.5136��� 2.5013��� 1.0839��� -0.2471 0.7312���
9.46 7.61 7.80 5.47 6.80 -1.26 4.54
Adjusted R2 0.71 0.71 0.72 0.72 0.73 0.70 0.73
Sample size 545,849 481,555 365,458 231,282 134,176 116,097 64,294
Dependent variable: log (total output). Independent variables also include other �rm characteristics,
two-digit industry �xed e¤ects, dummies for capital cities and cities directly under the central
government. Numbers below the coe¢cients are t statistics. Standard errors are clustered by city-
industry combination. �����, ����, and ��� indicate signi�cance at the 1%, 5%, and 10% levels.
16

4.3 Results by �rm size
Jacobs (1961) argued that small �rms bene�t more from urban diversity be-
cause small �rms rely more on the external industrial environment. Rosen-
thal and Strange (2003) found that total employment at small establish-
ments in the same industry at the zip code level has larger e¤ect on births
and employment of new establishments than does total employment at
medium or large establishments, possibly because small establishments were
more open and innovative. These ideas suggest that �rms of di¤erent sizes
might bene�t from or contribute to agglomeration economies in di¤erent
ways. Therefore, we estimate the benchmark model by �rm size. Table
3 presents the results: Small �rms bene�t from all types of agglomeration
economies; medium �rms bene�t from localization economies and city big-
ness; large �rms also bene�t from localization economies and city bigness,
but the magnitudes attenuate by half compared with medium �rms. Note
that medium and large �rms do not bene�t from urban diversity, possibly
because they are more self-su¢cient, as Jacobs argued.11
That �rms of di¤erent sizes all bene�t from localization economies is
worth more explanation. The relation between �rm size and localization
economies has not been fully understood yet in the literature. Kim (1995)
and Holms and Stevens (2002) found positive correlation between industry
concentration and plant size. Wheeler (2006) provided further evidence that
11To make use of the full sample information, we interact the �rm size dummies withSpecialization and Urban diversity, using small size as the reference. The coe¢cient ofSpecialization for small �rms is 1.0161 and is signi�cant at the 1% level; the coe¢cientsof �rm size dummies interacting with Specialization for medium and large �rms are0.5553 and 0.6321, respectively, but neither is signi�cant. This con�rms that small �rmsbene�t strongly from localization economies. The coe¢cients of �rm size dummy variableinteracting with Urban diversity for small, medium, and large �rms are 0.9891, -0.1806,and -0.2742, respectively, and all are signi�cant at the 1% level, suggesting that small�rms bene�t more strongly from Jacobs externalities than medium and large �rms do. Insummary, when using �rm size dummy variable interacting with agglomeration variables,the pattern of urban diversity e¤ect is remarkably consistent with the results in Table 3.
17

localization economies are positively associated with the size of plants, but
not the count of plants. However, small plants that specialize in intermediate
goods tend to concentrate heavily, such as dress industry in New York (Licht-
enberg, 1960). Using Italian manufacturing data, Lafourcade and Mion
(2007) found that large plants are more concentrated (clustering within nar-
row urban areas), small plants are less concentrated but are more agglom-
erated (co-located within wider areas and spatially auto-correlated). How
plant size is related to industrial concentration and localization economies
warrants further investigation.
18

TABLE 3 Results by �rm size
All �rms Small �rms Medium �rms Large �rms
Variable Coe¢cient Co¢cient Coe¢cient Coe¢cient
Indavedu 0.2131� 0.2122� 0.1732 0.0193
1.82 1.77 1.13 0.07
Specialization 1.0642��� 1.0420��� 1.2759��� 0.6358�
3.93 3.44 4.95 1.84
Log(population) 0.1103��� 0.1107��� 0.1119��� 0.0639�
5.80 5.71 5.03 1.71
Urban diversity 0.9813��� 1.0404��� -0.0144 -0.4355
9.46 9.89 -0.10 -1.40
Adjusted R2 0.71 0.65 0.67 0.81
Sample size 545,849 520,918 22,917 2,014
Dependent variable: log (total output). Independent variables also include other �rm
characteristics, two-digit industry �xed e¤ects, dummies for capital cities and cities
directly under the central government. Numbers below the coe¢cients are t statistics.
Standard errors are clustered by city-industry combination. �����, ����, and ��� indicate
signi�cance at the 1%, 5%, and 10% levels.
19
4.4 Results by �rm size and city size
To provide a complete picture of the e¤ects of di¤erent types of agglom-
eration economies on �rms of di¤erent sizes in cities of di¤erent sizes, for
each �rm size type, we estimate the benchmark model by city size. Table
4 reports the results. The results are remarkably consistent with the �nd-
ings in the previous tables. The �rst panel shows that small �rms bene�t
strongly from localization economies in medium and large cities, while bene-
�t strongly from urban diversity in super-large cities; small �rms also bene�t
from city bigness in medium cities, but too large a size (say, over one mil-
lion) means net diseconomies. The second panel shows that medium �rms
bene�t from localization economies in large cities and above, but bene�t
from urban diversity only in super large cities; medium �rms bene�t from
city bigness only in extra-large cities, and oversize (more than two million)
implies net diseconomies. These pieces of evidence indicate that the e¤ects
of urban size and urban diversity operate in di¤erent ways. The third panel
shows that large �rms bene�t little from agglomeration economies, except
localization economies in medium cities.
20

TABLE 4 Results by �rm size and city size
Firms in cities of population size (Million)
Small �rms � 0:2 �0.5 �1 � 2 1~2 0.5~1 0.2~0.5
Variable Coe¢cient Coe¢cient Coe¢cient Coe¢cient Coe¢cient Coe¢cient Coe¢cient
Indavedu 0.2122� 0.2689� 0.1436 0.3404�� 0.1307 0.4494��� -0.1819
1.77 1.90 0.83 1.95 0.74 3.27 -1.41
Specialization 1.0420��� 0.8959��� 0.1434 0.6421 0.1837 1.1594��� 2.1092���
3.44 2.50 0.27 1.23 0.50 3.95 5.12
Log(population) 0.1107��� 0.1520��� 0.2714��� 0.0842 -0.1895��� -0.0811 0.2218���
5.71 5.78 5.83 0.72 -3.24 -1.21 4.40
Urban diversity 1.0404��� 1.0166��� 1.5403��� 2.4113��� 1.0951��� -0.1956 0.7811���
9.89 8.11 7.73 5.22 6.74 -1.22 4.73
Adjusted R2 0.65 0.65 0.66 0.66 0.67 0.62 0.66
Sample size 520,918 459,526 351,154 222,811 128,343 108,372 61,392
Medium �rms
Indavedu 0.1732 0.1576 -0.1603 -0.1191 -0.2981 0.5556�� 0.0796
1.13 0.94 -0.81 -0.48 -0.92 2.09 0.23
Specialization 1.2759��� 1.4451��� 1.7192��� 2.5451��� 1.8479��� 0.7088�� -0.1715
4.95 5.33 4.45 2.88 4.04 2.01 -0.38
Log(population) 0.1119��� 0.1612��� 0.1314��� -0.7723��� 0.1696� -0.1915� 0.0206
5.03 5.64 2.75 -3.58 1.86 -1.73 0.22
Urban diversity -0.0144 -0.1180 0.4003 2.0931��� 0.4625 -0.6734��� -0.4908
-0.10 -0.70 1.39 2.46 1.48 -3.22 -1.62
Adjusted R2 0.67 0.68 0.66 0.66 0.66 0.68 0.63
Sample size 22,917 20,262 13,170 7,809 5,361 7,092 2,655
Large �rms
Indavedu 0.0193 0.0111 0.2479 0.4280 0.3537 -0.8039 0.1768
0.07 0.03 0.58 0.63 0.68 -1.28 0.27
Specialization 0.6358� 0.7563� -0.4969 -1.1554 0.4154 1.6676��� 0.1567
1.84 1.71 -0.61 -0.68 0.43 3.05 0.24
Log(population) 0.0639� 0.0827� -0.0582 -0.1016 0.0044 0.2255 0.2342
1.71 1.88 -0.51 -0.18 0.02 0.82 1.14
Urban diversity -0.4355 -0.4851 0.4112 1.3853 0.0440 -0.96� -0.1951
-1.40 -1.32 0.65 0.64 0.05 -1.79 -0.24
Adjusted R2 0.81 0.81 0.82 0.82 0.83 0.78 0.83
Sample size 2,014 1,767 1,134 662 472 633 247
Dependent variable: log (total output). Independent variables also include other �rm characteristics,
two-digit industry �xed e¤ects, dummies for capital cities and cities directly under the central
government. Numbers below the coe¢cients are t statistics. Standard errors are clustered by city-
industry combination. �����, ����, and ��� indicate signi�cance at the 1%, 5%, and 10% levels.
21

It is worth noting that the coe¢cients of Log(population) are not signi�-
cant or even negative for cities with population larger than two million, sug-
gesting that super-large cities may have no bene�t or even net diseconomies
to all �rms. To further investigate this e¤ect, we also add the square of
Log(population) to the benchmark model and estimate it by �rm size in
super-large cities. Table 5 presents the results and imputes the optimal city
size. The imputed optimal city sizes range from 1,686,557 to 2,257,571 per-
sons. However, the mean population of the 20 super-large cities is 4,006,440,
the minimum is 2,044,600, the standard deviation is 2,204,273, and the max-
imum is 1,080,000 (Shanghai). This suggests that super-large cities are too
large for manufacturing �rms.12
12Au and Henderson (2006) found that many Chinese cities are undersized, but a fewcities are signi�cantly oversized.
22

TABLE 5 Testing optimal city size for �rms in super-large cities
All �rms Small �rms Medium �rms Large �rms
Variable Coe¢cient Coe¢cient Coe¢cient Coe¢cient
Indavedu -0.0127 -0.0015 -0.2114 0.3625
-0.06 -0.01 -0.87 0.51
Specialization 0.8224 0.8676 2.4764��� -1.2913
1.51 1.58 2.77 -0.76
Log(population) 14.0126 15.2506� 16.1419 10.8758
1.55 1.69 1.42 0.41
[Log(population)]2 -0.4815 -0.5220� -0.5629 -0.3717
-1.61 -1.74 -1.49 -0.42
Urban diversity 0.7151�� 0.6321� 1.6948�� 0.2990
2.03 1.78 2.08 0.18
Adjusted R2 0.71 0.66 0.66 0.82
Sample size 231,282 222,811 7,809 662
Imputed optimal city size 2,086,503 2,208,668 1,686,557 2,257,571
Mean of actual sizes 4,006,440
Dependent variable: log (total output). Independent variables also include other �rm characteristics,
two-digit industry �xed e¤ect, dummies for capital cities and cities directly under the central
government. Numbers below the coe¢cients are t statistics. Standard errors are clustered by city-
industry combination. �����, ����, and ��� indicate signi�cance at the 1%, 5%, and 10% levels.
23
4.5 Results by industry
Since many studies have used industry level data or studied only a few par-
ticular two-digit manufacturing industries, we also estimate the benchmark
model by two-digit industry to provide additional insight. Out of 30 two-
digit manufacturing industries, 28 have positive coe¢cients of Log(population),
10 are signi�cant at least at the 10% level; 29 have positive coe¢cient of
Urban diversity, and 18 are signi�cant at least at the 10% level; 21 have
positive coe¢cients of Specialization, and 12 are signi�cant at least at the
10% level; 16 have positive coe¢cients of Indavedu, and only one is signif-
icant at least at the 10% level; 11 industries show positive coe¢cients for
all the four agglomeration variables. Taking together, the results show that
the majority of industries enjoy the bene�t from urban diversity and city
bigness. There are also some evidence of localization economies. The results
are contrast to Nakamura (1985) who found little urbanization economies in
manufacturing industries in Japan.
5 CONCLUSION
This paper uses the 2004 China economic census data of manufacturing in-
dustries and tests the e¤ects of urban industrial diversity and urban size on
�rm productivity, controlling for human capital externalities and localiza-
tion economies. The results show that while �rm productivity is positively
associated with city size, too large a city size (say, over two million popu-
lation) will generate net diseconomies. In general, �rms bene�t from urban
diversity, but small �rms bene�t more than large �rms do, consistent with
Jacobs�s idea that small �rms rely more on the diverse external environ-
ment. We also �nd that medium cities generate more signi�cant localiza-
tion economies than large cities do, but large cities generate more signi�cant
Jacobs externalities than medium cities do. One policy implication is that
while large cities still maintain their advantage of attracting �rms of all
24

sizes, medium cities should better attract small and medium �rms and en-
courage clustering and specialization. Another policy implication is that
a city should encourage industrial diversity. This is not a con�ict to spe-
cialization. A city can be relatively diverse while having a few specialized
industries, compared with other cities.
We did not address the �rm selection issue. It is possible that high-
productivity �rms may select cities of certain size or cities of certain char-
acteristics, or that small cities with higher productivity grow to large cities
at some point of time, creating spurious correlation between productivity
and city size or urban diversity. We have used a set of dummy variables
to control for unobserved characteristics of �rms, industries, and cities, and
the conclusions would not be too sensitive to the sorting bias.
25
REFERENCES
Abdel-Rahman, Hesham M. 2000. �Multi-�rm City Versus Company
Town: A Microfoundation Model of Localization Economies,� Journal of
Regional Science, 40, 755-769.
Arnott, Richard. 1979. "Optimal City Size in a Spatial Economy,"
Journal of Urban Economics, 6, 65-89.
Arnott, Richard. 2004. "Does the Henry George Theorem Provide a
Practical Guide to Optimal City Size?" American Journal of Economics
and Sociology, 63, 1057-1090.
Au, Chun-Chung and Vernon Henderson. 2006. "Are Chinese Cities Too
Small?" Review of Economic Studies, 73, 549-576.
Baldwin, John, Desmond Beckstead, Mark Brown, and David Rigby.
2007. "Urban Economies and Productivity," Economic Analysis Research
Paper, Statistics Canada.
Carlino, Gerald. 1979. "Increasing Returns to Scale in Metropolitan
Manufacturing," Journal of Regional Science, 19, 363-373.
Duranton, Gilles and Diego Puga. 2000. "Diversity and Specialization in
Cities: Why, Where and When Does It Matter?" Urban Studies, 37, 533-555.
Florida, Richard. 2002. "Bohemian and Economic Geography," Journal
of Economic Geography, 2, 55-71.
Fu, Shihe. 2007. "Smart Café Cities: Testing Human Capital External-
ities in the Boston Metropolitan Area," Journal of Urban Economics, 61,
86-111.
Glaeser, Edward, Hedi Kallal, Jose Scheinkman and Andrei Shleifer.
1992. "Growth in Cities," Journal of Political Economy, 100, 1126-1152.
Henderson, Vernon. 1986. "E¢ciency of Resource Usage and City
Sizes," Journal of Urban Economics, 19, 47-70.
Henderson, Vernon, Ari Kuncoro and Matt Turner. 1995. "Industrial
Development in Cities," Journal of Political Economy, 103, 1067-1090.
Henderson, Vernon. 2003. "Marshall�s Scale Economies," Journal of
26

Urban Economics, 53, 1-28.
Holmes, Thomas and John Stevens. 2002. "Geographic Concentration
and Establishment Scale," Review of Economics and Statistics, 84, 682-690.
Hoover, Edgar. 1937. Location Theory and the Shoe and Leather Indus-
tries. Cambridge, MA: Harvard University Press.
Hoover, Edgar. 1971. An Introduction to Regional Economics. New
York: Alfred A. Knopf, INC.
Jacobs, Jane. 1961. The Death and Life of Great American Cities. New
York: Vintage Books.
Jacobs, Jane. 1969. The Economy of Cities. New York: Vintage Books.
Kim, Sukkoo. 1995. �Expansion of Markets and the Geographic Distri-
bution of Economic Activities: The Trends in U.S. Regional Manufacturing
Structure, 1860-1987,� Quarterly Journal of Economics, 110, 881-908.
Lafourcade, Miren and Mion Giordano. 2007. "Concentration, Agglom-
eration and the Size of Plants," Regional Science and Urban Economics, 37,
46-68.
Lichtenberg, Robert. 1960. One-Tenth of a Nation. Cambridge, MA:
Harvard University Press.
Malizia, Emil and Shanzi Ke. 1993. "The In�uence of Economic Di-
versity on Unemployment and Stability," Journal of Regional Science, 33,
221-235.
Moomaw, Ronald. 1981. "Productivity and City Size: A Critique of the
Evidence," Quarterly Journal of Economics, 96, 675-688.
Moomaw, Ronald. 1985. "Firm Location and City Size: Reduced Pro-
ductivity Advantages as a Factor in the Decline of Manufacturing in Urban
Areas," Journal of Urban Economics, 17, 73-89.
Nakamura, Ryohei. 1985. "Agglomeration Economies in Urban Man-
ufacturing Industries: A Case of Japanese Cities," Journal of Urban Eco-
nomics, 17, 108-124.
Ottaviano, Gianmarco and Giovanni Peri. 2005. "Cities and Cultures,"
27

Journal of Urban Economics, 58, 304-337.
Quigley, John. 1998. "Urban Diversity and Economic Growth," Journal
of Economic Perspective, 12, 127-128.
Rosenthal, Stuart and William Strange. 2001. "The Determinants of
Agglomeration," Journal of Urban Economics, 50, 191-229.
Rosenthal, Stuart and William Strange. 2003. "Geography, Industrial
Organization and Agglomeration," Review of Economics and Statistics, 85,
377-393.
Segal, David. 1976. "Are There Returns to Scale in City Size?" Review
of Economics and Statistics, 58, 339-350.
Simon, Curtis. 1988. "Frictional Unemployment and the Role of Indus-
trial Diversity," Quarterly Journal of Economics, 103, 715-728.
Sveikauskas, Leo. 1975. �The Productivity of Cities,� Quarterly Journal
of Economics, 89, 393-413.
Sveikauskas, Leo. John Gowdy and Michael Funk. 1988. �Urban Pro-
ductivity: City Size or Industry Size,� Journal of Regional Science, 28,
185-202.
Wheeler, Christopher. 2006. �Productivity and the Geographic Concen-
tration of Industry: The Role of Plant Scale,� Regional Science and Urban
Economics, 36, 313-330.
Acknowledgement: We thank Richard Arnott, Yuming Fu, the seminar
and conference participants at Tsinghua University, Central University of
Finance and Economics, the China Economists Society 2008 conference, and
the 13th Asian Real Estate Society Annual Meeting for helpful comments.
28