testing the validity of purchasing power parity theory and
TRANSCRIPT

Journal of Accounting and Finance in Emerging Economies Vol. 6, No 1, 2020
127
Volume and Issues Obtainable at Center for Sustainability Research and Consultancy
Journal of Accounting and Finance in Emerging Economies ISSN: 2519-0318 ISSN (E) 2518-8488
Volume 6: Issue 1 March 2020
Journal homepage: www.publishing.globalcsrc.org/jafee
Testing the Validity of Purchasing Power Parity Theory and Dynamics of Exchange
Rate Behavior (Pakistan, China, Iran and Turkey)
1 Rana Shahid Imdad Akash, 2 Muhammad Mudasar Ghafoor, 3 Navid Ahmed
1 Assistant Professor, School of Business Management, NFC-IEFR, Faisalabad, Pakistan:
[email protected] 2 Assistant Professor, University of the Punjab, Jhelum Campus, Jhelum. Pakistan: [email protected] 3 Lecturer IMS, University of Agriculture, Sub Campus Toba Tek Singh, Pakistan: [email protected]
ARTICLE DETAILS ABSTRACT
History
Revised format: February 2020
Available Online: March 2020
Purpose: This study is aimed at to observe the purchasing power parity
(PPP) Theory. The purchasing power parity (PPP) is the most enduring
debate of literature in international macroeconomics. It is most
controversial due to various puzzles and tested with different econometric
models for certain group of countries. Therefore, the PPP is valid
assumption while international comparison due to use of common
exchange rate and the prevalence of Law of One price.
Design/Methodology/Approach: The validity of PPP for relative
countries (Pakistan, China, Iran and Turkey) was tested and analyzed for
the sample period 2001 to 2018.
Findings: It is observed that exchange rates of Pakistan, China, Iran and
Turkey are not consistent and constant. The deviations of PPP through
structural changes identified and are not persistence over long period.
Overall results reflected that there is an existence of long run equilibrium
relation in between Pakistan and China as well as in between Iran and
Turkey. The error correction model has confirmed the adjustment speed of
short run disequilibrium to long term disequilibrium level.
Implications/Originality/Value: The expected differential level of
inflation has significant positive impact to exchange rate shift to Pakistan
and trading activity patterns. The changes in foreign exchange market and
commodity market due to economic integration are important implications
for economic globalization.
© 2020 The authors, under a Creative Commons Attribution-Non
Commercial 4.0
Keywords
Purchasing Power Parity, Law
of One Price, Long Run, Short
Run
JEL Classification:
K12, K19, F20
Corresponding author’s email address: [email protected]
Recommended citation: Akash, R. S. I., Ghafoor, M. M., & Ahmad, N., (2020). Testing the Validity of Purchasing
Power Parity Theory and Dynamics of Exchange Rate Behavior (Pakistan, China, Iran and Turkey). Journal of
Accounting and Finance in Emerging Economies, 6 (1), 127-144
DOI: 10.26710/jafee.v6i1.1059
1. Introduction
The Law of one price indicates that the price of a commodity at domestic level should be the same at
foreign level. However, the purchasing power parity theory is an economic theory which is based on
underlying assumption of exchange rate and macro models in the open economy. It is a primary doctrine
brought to you by COREView metadata, citation and similar papers at core.ac.uk
provided by CSRC Publishing: Open Journal Systems (Center for Sustainability Research and...
Journal of Accounting and Finance in Emerging Economies Vol. 6, No 1, 2020
128
in the literature of international finance. The purchasing power theory is a comparative compression of
money at that level where one currency per value measured at equal base to another currency. The value
of home currency must have the equal value to foreign currency. Froot and Rogoff (1995), Sarno and
Taylor (2002) studied the PPP theory which is found mixed for its current floating exchange rate period
because of overvalued or undervalued of a currency.
The fluctuations in the exchange rate implicate movements towards or away from long time equilibrium
level. It is very crucial for policy perspective. In accordance, law of one price holds that at a same time a
money value of identical products should be same while purchase and sale among two economies. The
economies have high degrees of economic interdependence and fluctuation in exchange rate. On the other
hand, demand of one product is fluctuated due to shift in inflation of one economy. The change in demand
from home country to foreign country will be continued until the change in currency value of foreign
country appreciated. The PPP can have implications to explain that the real exchange rates found non-
stationary.
The non-stationary of real exchange rate is being held. The theory describes that traditional PPP is failing
to hold due to non-stationarity in the fundamentals economic. The economic fundamentals are the basic
premise of equilibrium and a long term equilibrium level implicates to hold of PPP. A non validity of PPP
should also have better implications for a wide set of subsequent theories of international finance. So, PPP
is proposed to be as a valid proposition for best flow with reference to economic fundamentals.
Most of the international economic fundamentals based on flow of exchange rate. Therefore exchange
rate may goes under the name of risks due to volatility for the long run. The phenomena of long standing
puzzle may arise. The currency prices not at fundamental values are basic premise and quick adjustment
may validate at any instant the prices at their fundamental values and short run disequilibrium. The
phenomena will have a long standing puzzle of exchange rate. The puzzle of exchange rate may create
misallocation of scarce resources. PPP can minimize the misallocation of scarce resources and help to
create global prosperity. The inefficiency of quick adjustment may create the mispricing to lead the
puzzle. The disequilibrium cause price distortion leads eventually international welfare losses. Thus it
should be needed considerable effort to locate the exchange rates correctly priced or not excessively price
and parity conditions hold. An empirical analysis can be used to help for exploration of real exchange
rates stationarity. The stationarity level supported to co – integration analysis. It can be helpful for a
system comprising to a nominal level of exchange rate, its foreign prices and domestic prices.
The previous literature supported that a non-linear trends is a key assumption to explain the failure of the
theory. Furthermore, it should also assist to determine PPP may have been found valid in Pakistan, China,
Iran and Turkey.
2. Literature Review
Khan and Qayyum (2007) identified the existence of PPP and validated a relationship of foreign exchange
and integration of goods market. Chaung and Lai (1994) suggested supporting the assumption of
purchasing power parity and indicating that two conditions are not consistent. Alba and Park (2005)
showed that PPP holds under exchange rate to support for purchasing power parity theory. Bhatti (1996)
examined that a nominal level of exchange rate is used to tend the domestic price ratio and foreign price
that supports a real exchange rate behavior is also mean reversion. Taylor (2002) investigated the PPPP
and found a favorable with floating exchange rates also linked to deviations due to purchasing power
parity. Taylor and Sarno (1998) explored that a real dollar exchange rate during post Bretton Wood
system found evidence of mean reverting behavior of PPP. Sercu et.al (1995) observed the behavior of
exchange rate and consider the inter dependence and non-traded goods of economy. Arize et.al (2004)
suggested about the purchasing power parity assumptions holds with the conditions of equilibrium and
found PPP more stable in Asia as in African. Murray and Papell (2004) concluded that Taylor was very
Journal of Accounting and Finance in Emerging Economies Vol. 6, No 1, 2020
129
strong in study to perfume the unit root test of lags selection and rejected favor the assumption of PPP.
Elsadig (2011) tested PPP of US dollar and Japanese Yen. A penal unit root and cointegration tests
employed and mixed results found regarded to existence of PPP. Chortareas and Kapetanios (2013)
studied the relationship in prices and exchange rates under purchasing power parity theory of MIST
(Mexico, Indonesia, South Koreas and Turkey) and BRICS (Brazil, Russian, Indian, China, and South
African) countries. Glenville (2013) also explained about the exchange rate and price level integration of
bivariate countries. The exchange rate stationarity proved and found a long term positive relation among
price levels and exchange rates exist. Kamal (2014) explored an empirical study of real exchange rate of
short run and long run relation to buying power. The unit root test does not support PPP due to non
stationarity of exchange rate and no cointegration exists between price and exchange rate. Zyoud (2015)
tested the PPP and found existence but weak level of PPP in short term due to slow movement as
compared to change in value of currency. Bhatti (1996) and Shively (2001) supported a long term
existence, relative price level move with the proportionate of nominal exchange rate risk and real
exchange rate with its equilibrium level in long term. Shively (2001) found PPP have no impact on real
exchange rate. However, PPP play a vital role to determine the nominal exchange rate. Kanyembo and
Sheefeni (2013) indicated that the PPP holds and exist in the long run between South Africa and Zambia.
He et al. (2015) suggested the globalization under the world economy. The China’s foreign trade and its
role with exchange rate and increase in inflation to its economy. Dixon et al. (2016) provided about the
exchange rate reforms of specific regime announced by China to make flexible exchange rate economy. It
also considers the monetary policy to develop industry and economy. Ma et al. (2017) argued the validity
of PPP which have no strong base in China, Korea and Japan But also found that PPP holds and exist in
China under the quantile approach specifically. The heterogeneity and non-stationarity found in disorder
due to PPP deviated and found a long run rapid fluctuation in exchange rate. The long run parity related to
Pakistan and India, PPP holds. The previous literature tested only existence of long term relationship but
not short term relationship of PPP and exchange rate. This research hypothesis explored that whether the
long term and short term relationship of PPP and dynamics of exchange rate exist or not.
3. Data and Methodology
3.1 Data
The validity of PPP for Pakistan, China, Iran and Turkey is tested and analyzed for the sample period
January 1, 2001 to December 31, 2018. PPP theory can be viewed under the strong foundation of law of
one price. The difference in transaction cost such as transportation cost, tax and tariffs are the basic
premise to violate the law of one price. Actually, the process of arbitrage will be used to ensure that same
good traded in world market, would be sold at same price in every country. The prices should shows at
similar price in a common currency.
The Pt and SPt* are the domestic and foreign prices of currency for goods or services. Thus, the law of
one price in term of exchange rate prices:
Pt = e SPt* (1)
To make a comparative relation to domestic and foreign currencies of countries should be as under:
Pt = eSPt* (2)
E = Pt/SPt* (3)
The theory of exchange rates, PPP equation (2) predicted the exchange rate to adjust at same level of
price. The absolute PPP underlying assumption of real exchange rate and nominal exchange rate should
also be adjusted as under:
𝑒𝑆𝑃𝑡∗
𝑃𝑡= 1 (4)
Journal of Accounting and Finance in Emerging Economies Vol. 6, No 1, 2020
130
Where Qt is the real exchange rate can be as under:
𝑄𝑡 =𝑒𝑆𝑃𝑡∗
𝑃𝑡= 1 (5)
PPP theory is established by Cassel (1916) that a floating exchange rate and nominal exchange rate cannot
be deviated from its PPP. There should not be any transaction cost such as trade restrictions and
transportation cost. Assuming that there is the LOP hold as under
∑ 𝑊𝑗𝑃𝑡𝑗 = e 𝑆𝑛𝑗=1 ∑ 𝑊 ∗𝑗
𝑛𝑗=1 𝑃𝑡 ∗𝑗 (6)
PPP theory tests are used to analyze the stationarity of exchange rate and price level series related to two
countries. The unit root test applied. Pt as prices at domestic level and SPt* as prices at foreign level of
other countries to compare with Pakistan. The real exchange rate in the logarithm formation and Qt, the
real exchange rate should be calculated as:
log (Qt) = log (e) + log (SPt*) – log (Pt) (7)
Augmented Dickey Fuller (ADF) (1979) unit root test for simple autoregressive model (AR) is as follows.
Xt = ∆Xt − 1 + µt (8)
Xt is a variable for the time t, ∆ is a coefficient and µt is an error term. ∆X𝑡 at 1st difference or second
difference.
∆Xt = (∆ − 1)Xt − 1 + µt = λXt − 1 + µt (9)
The Phillip Perron (PP) (1988) test in autoregressive (AR) model for unit root test as under applied.
Xt = λ0 + λ1Xt − 1 + λ2 𝑡 [𝑡 −𝑇
2] + µt (10)
The Johansen (1988; 1991) and Johansen-Juselius (1990) test is a technique to identify cointegration.
∆Xt = 𝛼 + ∑ γt∆Xt − 1 + α t ∆Xt − 1 + µtn−1t=1 (11)
𝛼 in an equation of relationship is being a constant, Xt is a matrix of vectors, γ and 𝛼 are the parameters
or coefficients. ∆ is taken as a operator of change for vectors in the matrix. Trace statistics equation is as
under.
Ý𝑡𝑟𝑎𝑐𝑒 = −T ∑ nlog(1 − γQ) (12)
The maximum Eigen value can have a prove of hypothesis of cointegration exist due to more than its
critical value.
Ý𝑀𝑎𝑥𝑖𝑚𝑢𝑚 = −T nlog (1 − λP + 1) (13)
λP +1,………, λP = (N-P) is being used to its small square; where the T is taken a level of observations
at its area specified. Bivariate co-integration analysis is used to observe a long term relationship among
two series. Bivariate autoregressive process among two different series identifying co-integration to show
its effects in the long term.
Journal of Accounting and Finance in Emerging Economies Vol. 6, No 1, 2020
131
Χ = 𝛼0 + ∑ 𝜆𝑖𝑋𝑡−1 + ∑ 𝛿𝐶𝑡−1 + µ𝑡 ni=1
ni=1 (14)
Y𝑡 = 𝛼0 + ∑ 𝜆𝑖𝑌𝑡−1 + ∑ 𝑓𝑖𝜆𝑡−1 + µ𝑡ni=1
ni=1 (15)
Xt and Yt are the series of stationarity, α is a constant.
Yt = α0 + ∑ λiYt−1 + ∑ ∆iYt−1 + µtni=1
ni=1 (16)
The Eagle Granger causality analysis test is employed to identify the cause and effect whether one time
series has lead and lag relationship to another. Therefore, a Granger cause is useful and assists to
determine the factor of causality relation and lead lag values selection process.
𝛿𝑝𝑟𝑜𝑏(𝑋𝑡+𝑛│£𝑡 = 𝛿𝑝𝑟𝑜𝑏(𝑋𝑡+𝑛│µ𝑡) (17)
A conditional probability P probability set of information Xt at time t on Xt+n values at past and
information set µ𝑡 values contained for both Xt and Yt for the given period of time. Vector error model
of correction is being used to identify misspecification to evaluate the relation at short term and
adjustments at short term with reference to recent economic activity.
∆Χt = λ + ∑ λini=1 ∆Χt−i + ∑ δi
ni=1 ∆Χt−1 + γRi−1 + µt (18)
∆Yt = λ + ∑ λini=1 Yt−i + ∑ δn
i=1 ∆λt−1 + £Ri−1 + µt (19)
The stationary series are taken as Xt and Yt in the given equations. 𝞴 is constants. µt is an term of error
and Ri is term of correction, 𝐴𝑖 and 𝐵𝑖 , 𝛿, f, are parameters or coefficients. 𝛾, 𝜃 are parameters or
coefficients of error, positive integer value n and number of values i is taken.
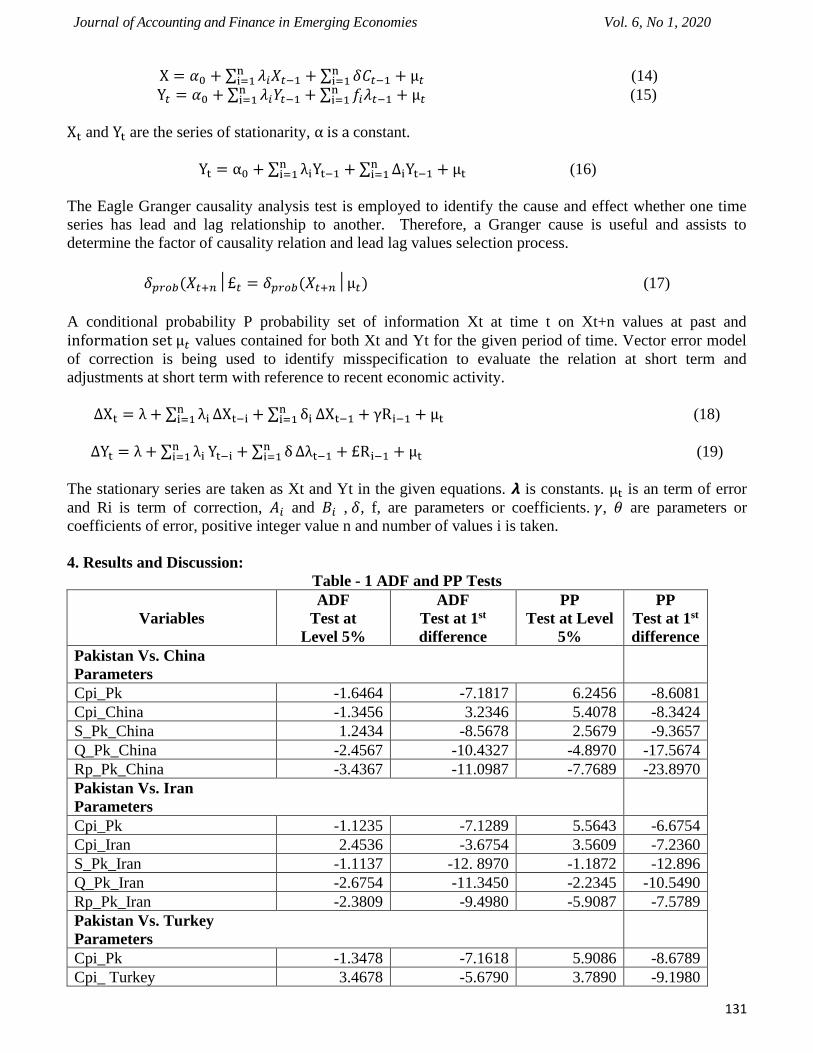
4. Results and Discussion:
Table - 1 ADF and PP Tests
Variables
ADF
Test at
Level 5%
ADF
Test at 1st
difference
PP
Test at Level
5%
PP
Test at 1st
difference
Pakistan Vs. China
Parameters
Cpi_Pk -1.6464 -7.1817 6.2456 -8.6081
Cpi_China -1.3456 3.2346 5.4078 -8.3424
S_Pk_China 1.2434 -8.5678 2.5679 -9.3657
Q_Pk_China -2.4567 -10.4327 -4.8970 -17.5674
Rp_Pk_China -3.4367 -11.0987 -7.7689 -23.8970
Pakistan Vs. Iran
Parameters
Cpi_Pk -1.1235 -7.1289 5.5643 -6.6754
Cpi_Iran 2.4536 -3.6754 3.5609 -7.2360
S_Pk_Iran -1.1137 -12. 8970 -1.1872 -12.896
Q_Pk_Iran -2.6754 -11.3450 -2.2345 -10.5490
Rp_Pk_Iran -2.3809 -9.4980 -5.9087 -7.5789
Pakistan Vs. Turkey
Parameters
Cpi_Pk -1.3478 -7.1618 5.9086 -8.6789
Cpi_ Turkey 3.4678 -5.6790 3.7890 -9.1980
Journal of Accounting and Finance in Emerging Economies Vol. 6, No 1, 2020
132
S_Pk_ Turkey -1.0345 -8.6790 -1.3478 -8.9807
Q_Pk_ Turkey 1.6780 -7.5697 1.7098 -9.3467
Rp_Pk_ Turkey 1.0987 -8.7698 1.8907 -9.7854
Table 3.1: Critical Values:
Probabilities 1% 5% 10%
ADF at Level -3.43228 -2.86228 -2.56721
ADF at 1st difference -3.46446 -2.87644 -2.57479
PP at Level -3.43228 -2.86228 -2.56721
PP at1st difference -3.46446 -2.87644 -2.57479
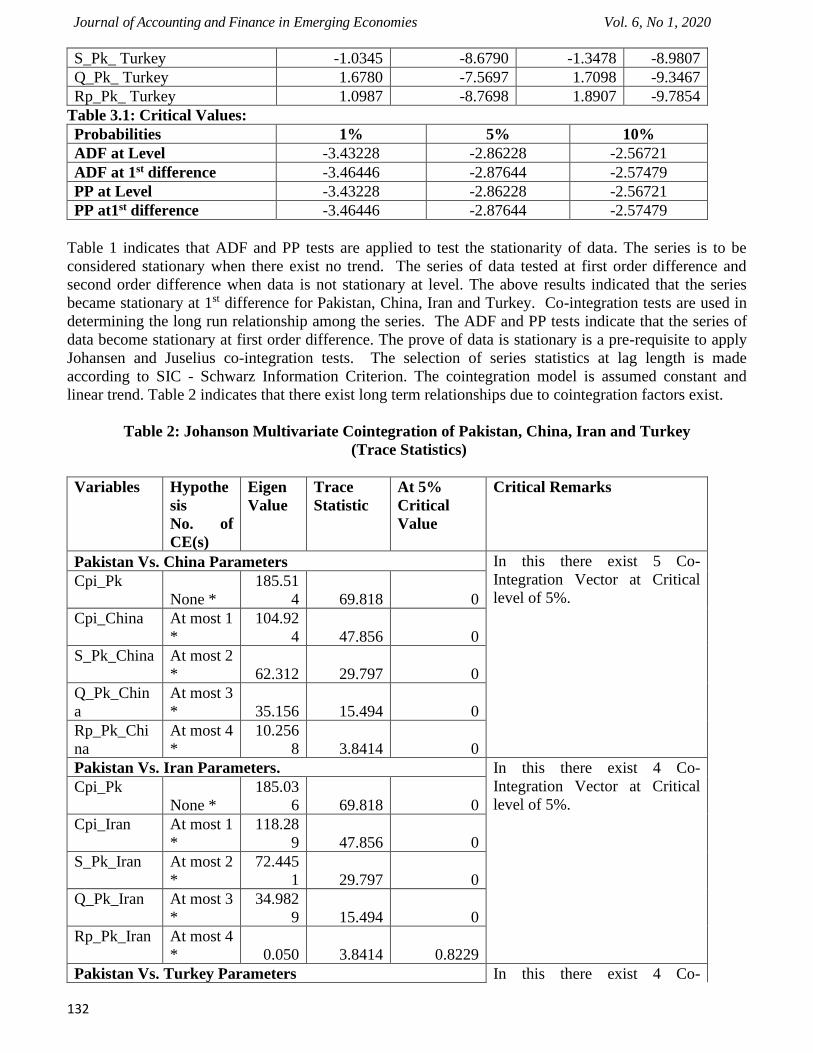
Table 1 indicates that ADF and PP tests are applied to test the stationarity of data. The series is to be
considered stationary when there exist no trend. The series of data tested at first order difference and
second order difference when data is not stationary at level. The above results indicated that the series
became stationary at 1st difference for Pakistan, China, Iran and Turkey. Co-integration tests are used in
determining the long run relationship among the series. The ADF and PP tests indicate that the series of
data become stationary at first order difference. The prove of data is stationary is a pre-requisite to apply
Johansen and Juselius co-integration tests. The selection of series statistics at lag length is made
according to SIC - Schwarz Information Criterion. The cointegration model is assumed constant and
linear trend. Table 2 indicates that there exist long term relationships due to cointegration factors exist.
Table 2: Johanson Multivariate Cointegration of Pakistan, China, Iran and Turkey
(Trace Statistics)
Variables Hypothe
sis
No. of
CE(s)
Eigen
Value
Trace
Statistic
At 5%
Critical
Value
Critical Remarks
Pakistan Vs. China Parameters In this there exist 5 Co-
Integration Vector at Critical
level of 5%.
Cpi_Pk
None *
185.51
4 69.818 0
Cpi_China At most 1
*
104.92
4 47.856 0
S_Pk_China At most 2
* 62.312 29.797 0
Q_Pk_Chin
a
At most 3
* 35.156 15.494 0
Rp_Pk_Chi
na
At most 4
*
10.256
8 3.8414 0
Pakistan Vs. Iran Parameters. In this there exist 4 Co-
Integration Vector at Critical
level of 5%.
Cpi_Pk
None *
185.03
6 69.818 0
Cpi_Iran At most 1
*
118.28
9 47.856 0
S_Pk_Iran At most 2
*
72.445
1 29.797 0
Q_Pk_Iran At most 3
*
34.982
9 15.494 0
Rp_Pk_Iran At most 4
* 0.050 3.8414 0.8229
Pakistan Vs. Turkey Parameters In this there exist 4 Co-

Journal of Accounting and Finance in Emerging Economies Vol. 6, No 1, 2020
133
Cpi_Pk
None *
232.63
5 69.818 0
Integration Vector at Critical
level of 5%.
Cpi_ Turkey At most 1
*
160.36
5 47.8561 0
S_Pk_
Turkey
At most 2
* 99.930 29.7970 0
Q_Pk_
Turkey
At most 3
* 44.448 15.494 0
Rp_Pk_
Turkey
At most 4
* 1.382 3.841 0.2396
There exist 5 Co-integrating vectors exist between Pakistan and China which indicates that long
relationship exist between these two economies. However there exist 5 co-integrating vectors exist
among Pakistan and china as well which also elaborate existence of long run relationships. Moreover
there also exist 5 co-integrating vectors among Pakistan and Turkey as well. The trace statistics accepts
𝐻0 and rejects 𝐻1. The Maximum Eigen Value tests also applied to confirm the presence of long run
relationship. Table 3 indicates the results regarding Maximum Eigen Value.
Table 3: Johanson Multivariate Cointegration of Pakistan, China, Iran and Turkey
(Maximum Eigen Value)
Equity
Markets.
Hypothe
sis
No. of
CE(s)
Eigen
Value
Max. Eigen
Value
Statistics.
5%
Critical
Value
Critical Remarks
Pakistan Vs. China Parameters In this there exist 5 Co-
Integration Vector at Critical
level of 5%.
Cpi_Pk None * 80.589 33.876 0
Cpi_China At most 1
* 42.612 27.584 0
S_Pk_China At most 2
* 27.155 21.131 0
Q_Pk_Chin
a
At most 3
* 24.900 14.264 0
Rp_Pk_Chi
na
At most 4
* 10.256 3.841 0
Pakistan Vs. Iran Parameters. In this there exist 4 Co-
Integration Vector at Critical
level of 5%.
Cpi_Pk None * 66.746 33.876 0
Cpi_Iran At most 1
* 45.844 27.584 0
S_Pk_Iran At most 2
* 37.462 21.131 0
Q_Pk_Iran At most 3
* 34.932 14.264 0
Rp_Pk_Iran At most 4
* 0.0500 3.841 0.822
Pakistan Vs. Turkey Parameters In this there exist 4 Co-
Integration Vector at Critical
level of 5%.
Cpi_Pk None * 72.270 33.876 0
Cpi_ Turkey At most 1
* 60.434 27.584 0

Journal of Accounting and Finance in Emerging Economies Vol. 6, No 1, 2020
134
S_Pk_
Turkey
At most 2
* 55.482 21.131 0
Q_Pk_
Turkey
At most 3
* 43.065 14.264 0
Rp_Pk_
Turkey
At most 4
* 1.382 3.841 0.2396
According to Table 3 again there exist 5 Co-integrating vectors exist between Pakistan and China which
indicates that long relationship exist between these two economies. However there exist 5 co-integrating
vectors exist among Pakistan and china as well which also elaborate existence of long run relationships.
Moreover there also exist 5 co-integrating vectors among Pakistan and Turkey as well. The Maximum
Eigen value test also accepts 𝐻0 and rejects 𝐻1. Table 4 a. describes bivariate co-integration to explore the
long run relationship among the purchasing power parity variables of Pakistan and China.
Table 4 a. Bivariate Cointegration for Pakistan Vs. China:
Equity Markets. Hypoth
esis
Eige
n
Valu
e
Trace
Statisti
cs.
At 5%
Critical
Value
Critical Remarks.
Pakistan Vs. China Parameters.
Cpi_China --- Cpi_Pk
None *
At most
1 *
0.32
9 22.399 13.324
Co-integration Exist.
Cpi_China ---
Q_Pk_China
None
At most
1
0.06
5 0.709 4.598
Co-integration not Exist.
Cpi_China ---
Rp_Pk_China
None *
At most
1 *
0.09
8 14.678 12.654
Co-integration Exist.
Cpi_China ---
S_Pk_China
None *
At most
1 *
0.00
0 0.0760 4.325
Co-integration not Exist.
Cpi_Pk --- Q_Pk_China
None *
At most
1 *
0.43
2 33.098 19.398
Co-integration Exist.
Cpi_Pk ---
Rp_Pk_China
None *
At most
1 *
0.54
6 0.598 2.629
Co-integration Exist.
Cpi_Pk --- S_Pk_China
None
At most
1
0.98
2 6.294 13.271
Co-integration not Exist.
S_Pk_China ---
Q_Pk_China
None
At most
1
0.59
1 0.762 4.145
Co-integration not Exist.
The above results indicate that there exist long run relationship between CPI, Relative Price, Real and
Nominal exchange rates of Pakistan and China. Table 4 b. describes bivariate co-integration to explore the
long run relationship among the purchasing power parity variables of Pakistan and Iran.
Table 4 b. Bivariate Cointegration for Pakistan Vs. Iran:
Journal of Accounting and Finance in Emerging Economies Vol. 6, No 1, 2020
135
Equity Markets. Hypothe
sis
Eige
n
Valu
e
Trace
Statisti
cs.
At 5%
Critical
Value
Critical Remarks.
Pakistan Vs. Iran Parameters.
Cpi_Iran --- Cpi_Pk
None
At most
1
0.60
9 11.940 16.109
Co-integration not
Exist.
Cpi_Iran --- Q_Pk_Iran
None
At most
1
0.90
8 0.419 2.932
Co-integration not
Exist.
Cpi_Iran --- Rp_Pk_Iran
None
At most
1
0.18
5 9.281 14.286
Co-integration not
Exist.
Cpi_Iran --- S_Pk_Iran
None
At most
1
0.00
1 0.742 4.263
Co-integration not
Exist.
Cpi_Pk --- Q_Pk_Iran
None
At most
1
0.26
1 13. 870 17.797
Co-integration not
Exist.
Cpi_Pk --- Rp_Pk_Iran None
At most
1
0.00
6 0.967 3.761
Co-integration not
Exist.
Cpi_Pk --- S_Pk_Iran
None *
At most
1
0.09
8 6.173 18.4947
Co-integration one
Exist.
S_Pk_Iran--- Q_Pk_Iran
None *
At most
1
0.79
1 0.485 4.018
Co-integration one
Exist.
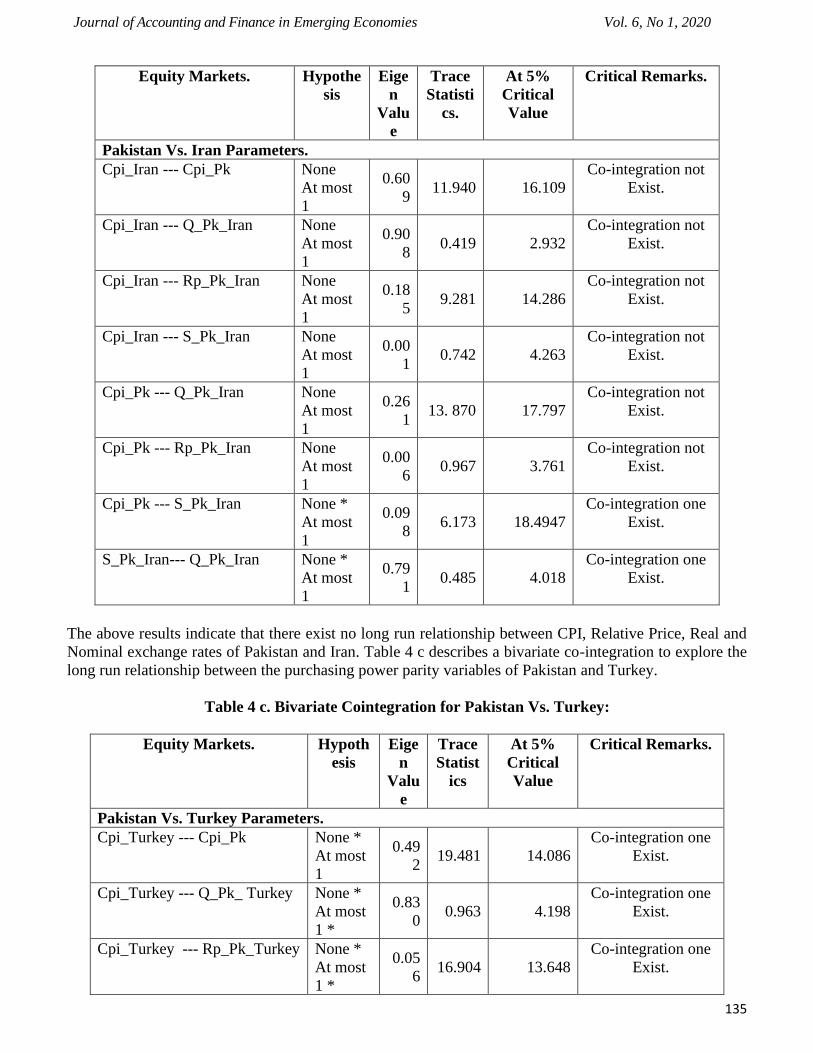
The above results indicate that there exist no long run relationship between CPI, Relative Price, Real and
Nominal exchange rates of Pakistan and Iran. Table 4 c describes a bivariate co-integration to explore the
long run relationship between the purchasing power parity variables of Pakistan and Turkey.
Table 4 c. Bivariate Cointegration for Pakistan Vs. Turkey:
Equity Markets. Hypoth
esis
Eige
n
Valu
e
Trace
Statist
ics
At 5%
Critical
Value
Critical Remarks.
Pakistan Vs. Turkey Parameters.
Cpi_Turkey --- Cpi_Pk
None *
At most
1
0.49
2 19.481 14.086
Co-integration one
Exist.
Cpi_Turkey --- Q_Pk_ Turkey
None *
At most
1 *
0.83
0 0.963 4.198
Co-integration one
Exist.
Cpi_Turkey --- Rp_Pk_Turkey None *
At most
1 *
0.05
6 16.904 13.648
Co-integration one
Exist.
Journal of Accounting and Finance in Emerging Economies Vol. 6, No 1, 2020
136
Cpi_ Turkey --- S_Pk_Turkey
None
At most
1
0.04
5 0.095 4.674
Co-integration not
Exist.
Cpi_Pk --- Q_Pk_ Turkey
None
At most
1
0.00
9 13.969 18.739
Co-integration not
Exist.
Cpi_Pk --- Rp_Pk_Turkey None *
At most
1
0.05
9 8.765 5.512
Co-integration one
Exist.
Cpi_Pk --- S_Pk_Turkey
None *
At most
1 *
0.85
4 12.281 9.837
Co-integration one
Exist.
S_Pk_Turkey --- Q_Pk_Turkey
None *
At most
1 *
0.93
8 2.164 1.419
Co-integration one
Exist.
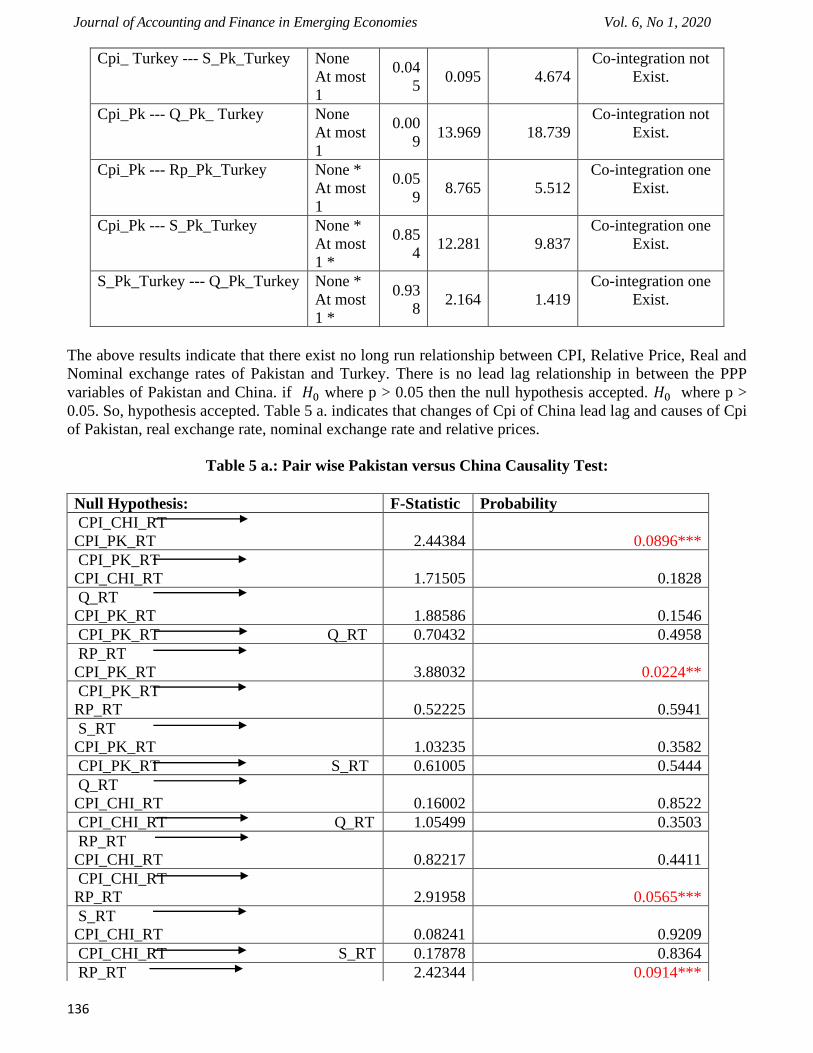
The above results indicate that there exist no long run relationship between CPI, Relative Price, Real and
Nominal exchange rates of Pakistan and Turkey. There is no lead lag relationship in between the PPP
variables of Pakistan and China. if 𝐻0 where p > 0.05 then the null hypothesis accepted. 𝐻0 where p >
0.05. So, hypothesis accepted. Table 5 a. indicates that changes of Cpi of China lead lag and causes of Cpi
of Pakistan, real exchange rate, nominal exchange rate and relative prices.
Table 5 a.: Pair wise Pakistan versus China Causality Test:
Null Hypothesis: F-Statistic Probability
CPI_CHI_RT
CPI_PK_RT 2.44384 0.0896***
CPI_PK_RT
CPI_CHI_RT 1.71505 0.1828
Q_RT
CPI_PK_RT 1.88586 0.1546
CPI_PK_RT Q_RT 0.70432 0.4958
RP_RT
CPI_PK_RT 3.88032 0.0224**
CPI_PK_RT
RP_RT 0.52225 0.5941
S_RT
CPI_PK_RT 1.03235 0.3582
CPI_PK_RT S_RT 0.61005 0.5444
Q_RT
CPI_CHI_RT 0.16002 0.8522
CPI_CHI_RT Q_RT 1.05499 0.3503
RP_RT
CPI_CHI_RT 0.82217 0.4411
CPI_CHI_RT
RP_RT 2.91958 0.0565***
S_RT
CPI_CHI_RT 0.08241 0.9209
CPI_CHI_RT S_RT 0.17878 0.8364
RP_RT 2.42344 0.0914***
Journal of Accounting and Finance in Emerging Economies Vol. 6, No 1, 2020
137
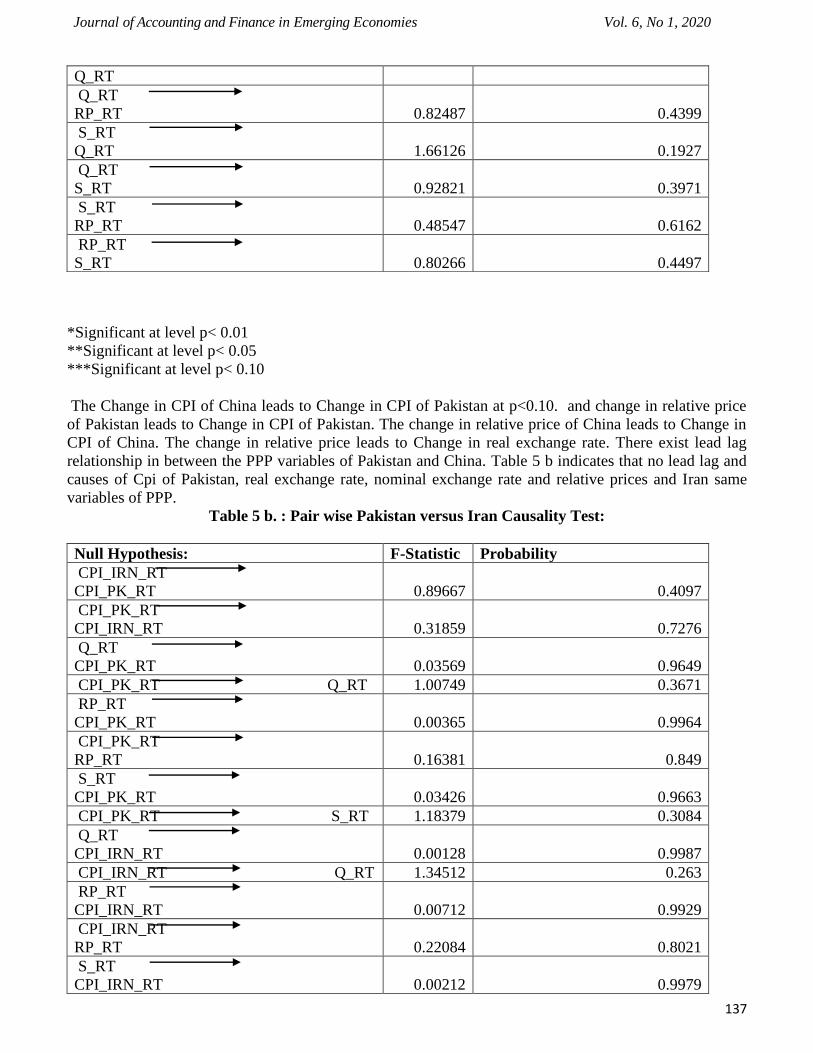
*Significant at level p< 0.01
**Significant at level p< 0.05
***Significant at level p< 0.10
The Change in CPI of China leads to Change in CPI of Pakistan at p<0.10. and change in relative price
of Pakistan leads to Change in CPI of Pakistan. The change in relative price of China leads to Change in
CPI of China. The change in relative price leads to Change in real exchange rate. There exist lead lag
relationship in between the PPP variables of Pakistan and China. Table 5 b indicates that no lead lag and
causes of Cpi of Pakistan, real exchange rate, nominal exchange rate and relative prices and Iran same
variables of PPP.
Table 5 b. : Pair wise Pakistan versus Iran Causality Test:
Q_RT
Q_RT
RP_RT 0.82487 0.4399
S_RT
Q_RT 1.66126 0.1927
Q_RT
S_RT 0.92821 0.3971
S_RT
RP_RT 0.48547 0.6162
RP_RT
S_RT 0.80266 0.4497
Null Hypothesis: F-Statistic Probability
CPI_IRN_RT
CPI_PK_RT 0.89667 0.4097
CPI_PK_RT
CPI_IRN_RT 0.31859 0.7276
Q_RT
CPI_PK_RT 0.03569 0.9649
CPI_PK_RT Q_RT 1.00749 0.3671
RP_RT
CPI_PK_RT 0.00365 0.9964
CPI_PK_RT
RP_RT 0.16381 0.849
S_RT
CPI_PK_RT 0.03426 0.9663
CPI_PK_RT S_RT 1.18379 0.3084
Q_RT
CPI_IRN_RT 0.00128 0.9987
CPI_IRN_RT Q_RT 1.34512 0.263
RP_RT
CPI_IRN_RT 0.00712 0.9929
CPI_IRN_RT
RP_RT 0.22084 0.8021
S_RT
CPI_IRN_RT 0.00212 0.9979

Journal of Accounting and Finance in Emerging Economies Vol. 6, No 1, 2020
138
*Si
gnif
ica
nt
at
lev
el
p<
0.0
1
**S
igni
fica
nt
at level p< 0.05
***Significant at level p< 0.10
There is no lead lag relationship in between the PPP variables of Pakistan and Turkey. No bidirectional
causality exist among the variables.
Table 5 c.: Pair wise Pakistan versus Turkey Causality Test:
CPI_IRN_RT S_RT 1.4264 0.2428
RP_RT
Q_RT 0.36398 0.6954
Q_RT
RP_RT 0.47624 0.6219
S_RT
Q_RT 0.60658 0.5463
Q_RT
S_RT 0.67498 0.5104
S_RT
RP_RT 0.44077 0.6442
RP_RT
S_RT 0.32104 0.7258
Null Hypothesis: F-Statistic Probability
CPI_TUR_RT
CPI_PK_RT 8.97507 0.000000
CPI_PK_RT
CPI_TUR_RT 1.66356 0.145800
Q_RT
CPI_PK_RT 0.06786 0.996800
CPI_PK_RT Q_RT 0.61903 0.685500
RP_RT
CPI_PK_RT 3.36619 0.006300*
CPI_PK_RT
RP_RT 3.40201 0.005900*
S_RT
CPI_PK_RT 0.09417 0.993000
CPI_PK_RT
S_RT 0.60366 0.697200
Q_RT
CPI_TUR_RT 0.08133 0.995100
CPI_TUR_RT Q_RT 6.07228 0.000030*
RP_RT
CPI_TUR_RT 1.00314 0.417400
CPI_TUR_RT
RP_RT 7.80617 0.000001*
S_RT
CPI_TUR_RT 0.0772 0.995600
CPI_TUR_RT S_RT 5.82341 0.000050*
RP_RT
Q_RT 1.36261 0.2406
Q_RT 0.67971 0.6394
Journal of Accounting and Finance in Emerging Economies Vol. 6, No 1, 2020
139
*Significant at level p< 0.01
**Significant at level p< 0.05
***Significant at level p< 0.10
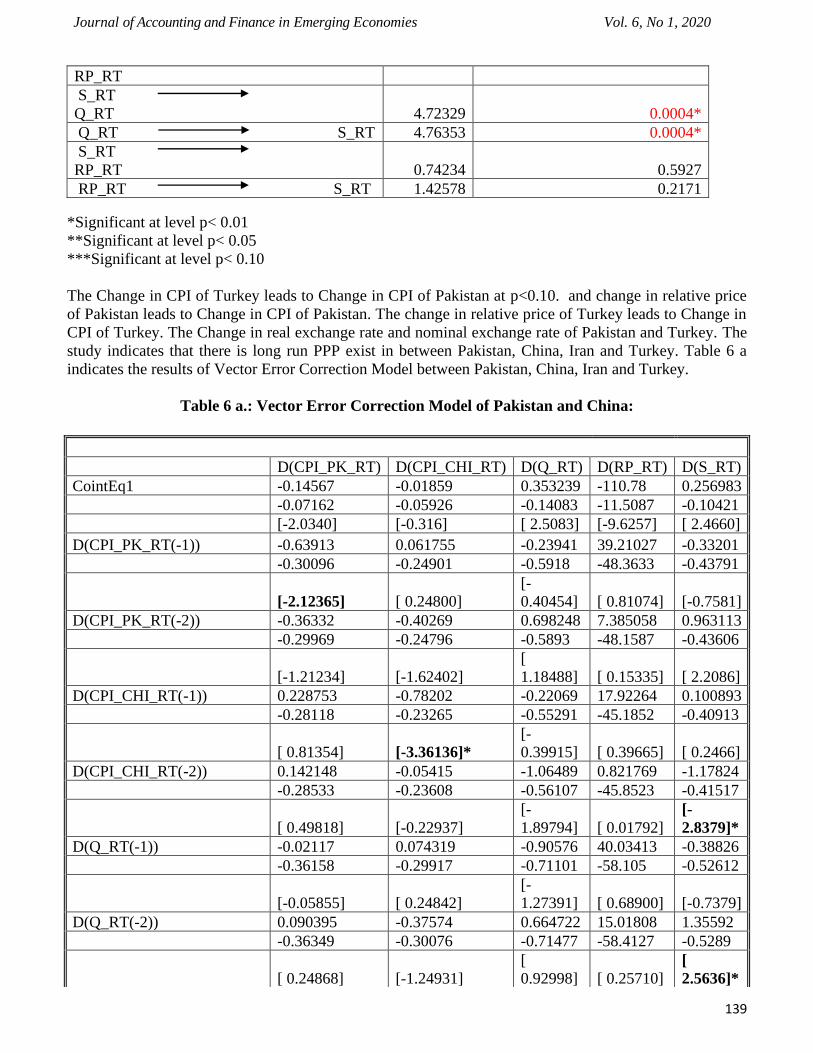
The Change in CPI of Turkey leads to Change in CPI of Pakistan at p<0.10. and change in relative price
of Pakistan leads to Change in CPI of Pakistan. The change in relative price of Turkey leads to Change in
CPI of Turkey. The Change in real exchange rate and nominal exchange rate of Pakistan and Turkey. The
study indicates that there is long run PPP exist in between Pakistan, China, Iran and Turkey. Table 6 a
indicates the results of Vector Error Correction Model between Pakistan, China, Iran and Turkey.
Table 6 a.: Vector Error Correction Model of Pakistan and China:
RP_RT
S_RT
Q_RT 4.72329 0.0004*
Q_RT S_RT 4.76353 0.0004*
S_RT
RP_RT 0.74234 0.5927
RP_RT S_RT 1.42578 0.2171
D(CPI_PK_RT) D(CPI_CHI_RT) D(Q_RT) D(RP_RT) D(S_RT)
CointEq1 -0.14567 -0.01859 0.353239 -110.78 0.256983
-0.07162 -0.05926 -0.14083 -11.5087 -0.10421
[-2.0340] [-0.316] [ 2.5083] [-9.6257] [ 2.4660]
D(CPI_PK_RT(-1)) -0.63913 0.061755 -0.23941 39.21027 -0.33201
-0.30096 -0.24901 -0.5918 -48.3633 -0.43791
[-2.12365] [ 0.24800]
[-
0.40454] [ 0.81074] [-0.7581]
D(CPI_PK_RT(-2)) -0.36332 -0.40269 0.698248 7.385058 0.963113
-0.29969 -0.24796 -0.5893 -48.1587 -0.43606
[-1.21234] [-1.62402]
[
1.18488] [ 0.15335] [ 2.2086]
D(CPI_CHI_RT(-1)) 0.228753 -0.78202 -0.22069 17.92264 0.100893
-0.28118 -0.23265 -0.55291 -45.1852 -0.40913
[ 0.81354] [-3.36136]*
[-
0.39915] [ 0.39665] [ 0.2466]
D(CPI_CHI_RT(-2)) 0.142148 -0.05415 -1.06489 0.821769 -1.17824
-0.28533 -0.23608 -0.56107 -45.8523 -0.41517
[ 0.49818] [-0.22937]
[-
1.89794] [ 0.01792]
[-
2.8379]*
D(Q_RT(-1)) -0.02117 0.074319 -0.90576 40.03413 -0.38826
-0.36158 -0.29917 -0.71101 -58.105 -0.52612
[-0.05855] [ 0.24842]
[-
1.27391] [ 0.68900] [-0.7379]
D(Q_RT(-2)) 0.090395 -0.37574 0.664722 15.01808 1.35592
-0.36349 -0.30076 -0.71477 -58.4127 -0.5289
[ 0.24868] [-1.24931]
[
0.92998] [ 0.25710]
[
2.5636]*
Journal of Accounting and Finance in Emerging Economies Vol. 6, No 1, 2020
140
*significant at [t>1.96]
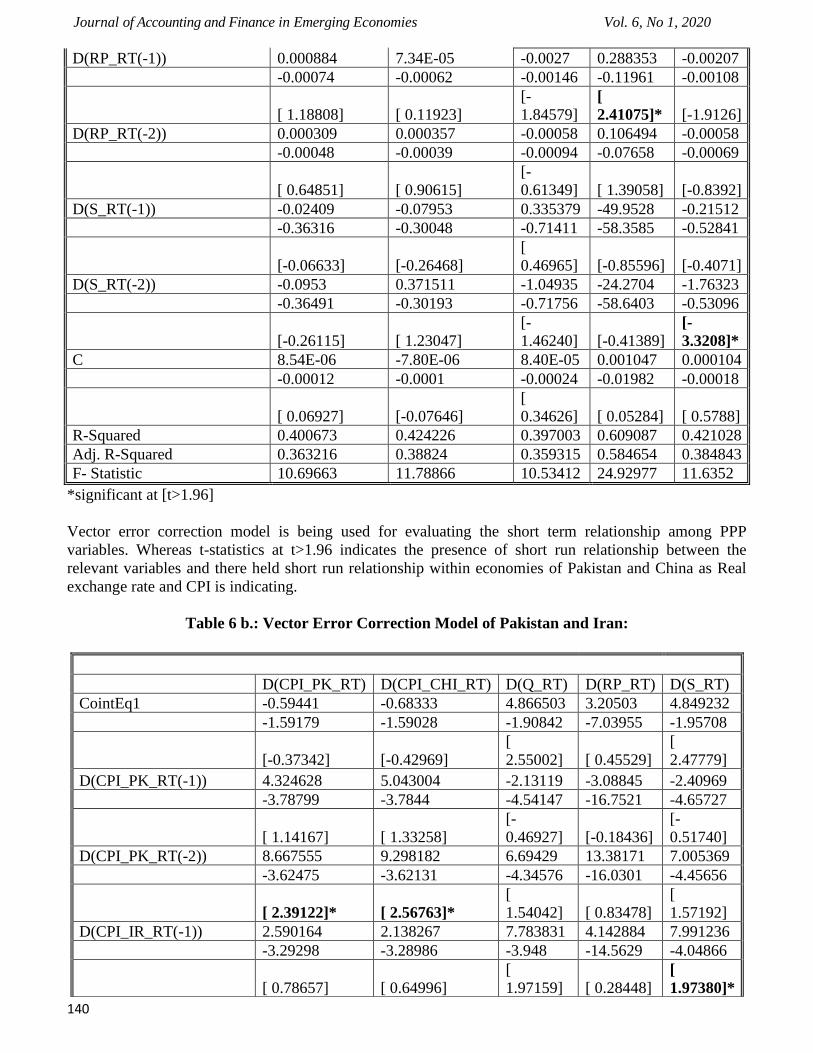
Vector error correction model is being used for evaluating the short term relationship among PPP
variables. Whereas t-statistics at t>1.96 indicates the presence of short run relationship between the
relevant variables and there held short run relationship within economies of Pakistan and China as Real
exchange rate and CPI is indicating.
Table 6 b.: Vector Error Correction Model of Pakistan and Iran:
D(RP_RT(-1)) 0.000884 7.34E-05 -0.0027 0.288353 -0.00207
-0.00074 -0.00062 -0.00146 -0.11961 -0.00108
[ 1.18808] [ 0.11923]
[-
1.84579]
[
2.41075]* [-1.9126]
D(RP_RT(-2)) 0.000309 0.000357 -0.00058 0.106494 -0.00058
-0.00048 -0.00039 -0.00094 -0.07658 -0.00069
[ 0.64851] [ 0.90615]
[-
0.61349] [ 1.39058] [-0.8392]
D(S_RT(-1)) -0.02409 -0.07953 0.335379 -49.9528 -0.21512
-0.36316 -0.30048 -0.71411 -58.3585 -0.52841
[-0.06633] [-0.26468]
[
0.46965] [-0.85596] [-0.4071]
D(S_RT(-2)) -0.0953 0.371511 -1.04935 -24.2704 -1.76323
-0.36491 -0.30193 -0.71756 -58.6403 -0.53096
[-0.26115] [ 1.23047]
[-
1.46240] [-0.41389]
[-
3.3208]*
C 8.54E-06 -7.80E-06 8.40E-05 0.001047 0.000104
-0.00012 -0.0001 -0.00024 -0.01982 -0.00018
[ 0.06927] [-0.07646]
[
0.34626] [ 0.05284] [ 0.5788]
R-Squared 0.400673 0.424226 0.397003 0.609087 0.421028
Adj. R-Squared 0.363216 0.38824 0.359315 0.584654 0.384843
F- Statistic 10.69663 11.78866 10.53412 24.92977 11.6352
D(CPI_PK_RT) D(CPI_CHI_RT) D(Q_RT) D(RP_RT) D(S_RT)
CointEq1 -0.59441 -0.68333 4.866503 3.20503 4.849232
-1.59179 -1.59028 -1.90842 -7.03955 -1.95708
[-0.37342] [-0.42969]
[
2.55002] [ 0.45529]
[
2.47779]
D(CPI_PK_RT(-1)) 4.324628 5.043004 -2.13119 -3.08845 -2.40969
-3.78799 -3.7844 -4.54147 -16.7521 -4.65727
[ 1.14167] [ 1.33258]
[-
0.46927] [-0.18436]
[-
0.51740]
D(CPI_PK_RT(-2)) 8.667555 9.298182 6.69429 13.38171 7.005369
-3.62475 -3.62131 -4.34576 -16.0301 -4.45656
[ 2.39122]* [ 2.56763]*
[
1.54042] [ 0.83478]
[
1.57192]
D(CPI_IR_RT(-1)) 2.590164 2.138267 7.783831 4.142884 7.991236
-3.29298 -3.28986 -3.948 -14.5629 -4.04866
[ 0.78657] [ 0.64996]
[
1.97159] [ 0.28448]
[
1.97380]*
Journal of Accounting and Finance in Emerging Economies Vol. 6, No 1, 2020
141
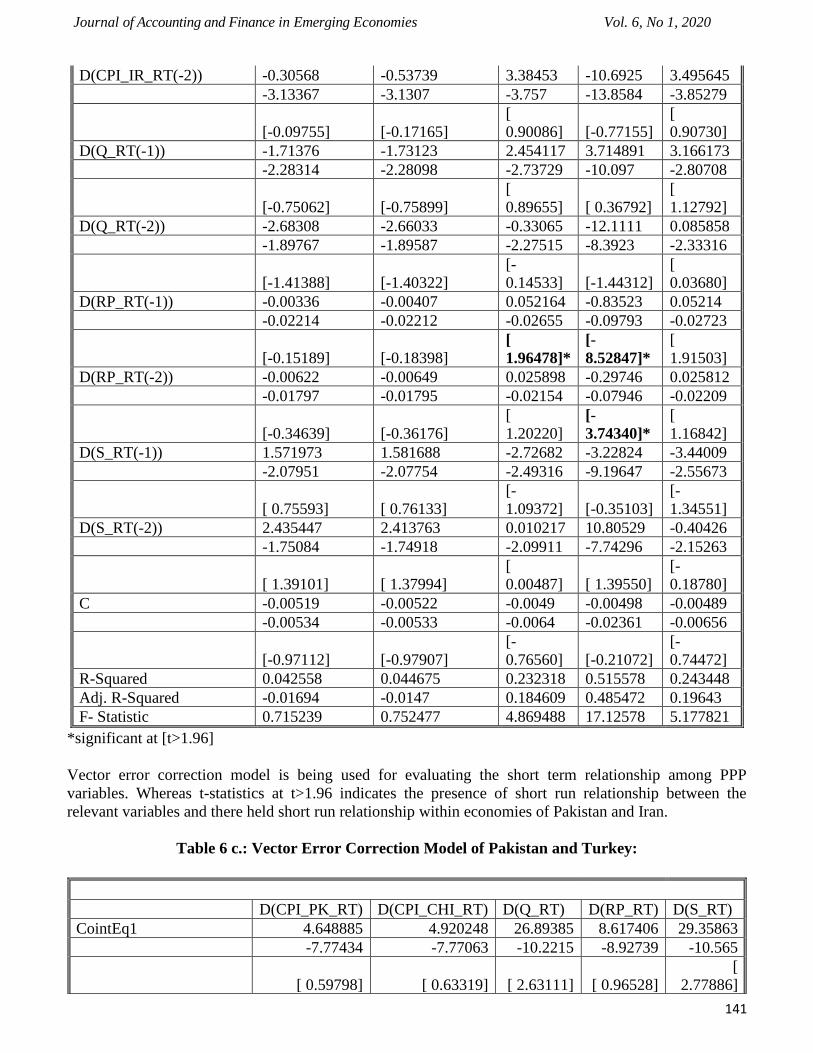
*significant at [t>1.96]
Vector error correction model is being used for evaluating the short term relationship among PPP
variables. Whereas t-statistics at t>1.96 indicates the presence of short run relationship between the
relevant variables and there held short run relationship within economies of Pakistan and Iran.
Table 6 c.: Vector Error Correction Model of Pakistan and Turkey:
D(CPI_IR_RT(-2)) -0.30568 -0.53739 3.38453 -10.6925 3.495645
-3.13367 -3.1307 -3.757 -13.8584 -3.85279
[-0.09755] [-0.17165]
[
0.90086] [-0.77155]
[
0.90730]
D(Q_RT(-1)) -1.71376 -1.73123 2.454117 3.714891 3.166173
-2.28314 -2.28098 -2.73729 -10.097 -2.80708
[-0.75062] [-0.75899]
[
0.89655] [ 0.36792]
[
1.12792]
D(Q_RT(-2)) -2.68308 -2.66033 -0.33065 -12.1111 0.085858
-1.89767 -1.89587 -2.27515 -8.3923 -2.33316
[-1.41388] [-1.40322]
[-
0.14533] [-1.44312]
[
0.03680]
D(RP_RT(-1)) -0.00336 -0.00407 0.052164 -0.83523 0.05214
-0.02214 -0.02212 -0.02655 -0.09793 -0.02723
[-0.15189] [-0.18398]
[
1.96478]*
[-
8.52847]*
[
1.91503]
D(RP_RT(-2)) -0.00622 -0.00649 0.025898 -0.29746 0.025812
-0.01797 -0.01795 -0.02154 -0.07946 -0.02209
[-0.34639] [-0.36176]
[
1.20220]
[-
3.74340]*
[
1.16842]
D(S_RT(-1)) 1.571973 1.581688 -2.72682 -3.22824 -3.44009
-2.07951 -2.07754 -2.49316 -9.19647 -2.55673
[ 0.75593] [ 0.76133]
[-
1.09372] [-0.35103]
[-
1.34551]
D(S_RT(-2)) 2.435447 2.413763 0.010217 10.80529 -0.40426
-1.75084 -1.74918 -2.09911 -7.74296 -2.15263
[ 1.39101] [ 1.37994]
[
0.00487] [ 1.39550]
[-
0.18780]
C -0.00519 -0.00522 -0.0049 -0.00498 -0.00489
-0.00534 -0.00533 -0.0064 -0.02361 -0.00656
[-0.97112] [-0.97907]
[-
0.76560] [-0.21072]
[-
0.74472]
R-Squared 0.042558 0.044675 0.232318 0.515578 0.243448
Adj. R-Squared -0.01694 -0.0147 0.184609 0.485472 0.19643
F- Statistic 0.715239 0.752477 4.869488 17.12578 5.177821
D(CPI_PK_RT) D(CPI_CHI_RT) D(Q_RT) D(RP_RT) D(S_RT)
CointEq1 4.648885 4.920248 26.89385 8.617406 29.35863
-7.77434 -7.77063 -10.2215 -8.92739 -10.565
[ 0.59798] [ 0.63319] [ 2.63111] [ 0.96528]
[
2.77886]

Journal of Accounting and Finance in Emerging Economies Vol. 6, No 1, 2020
142
*significant at [t>1.96]
D(CPI_PK_RT(-1)) -0.558386 -0.15605 -22.08882 0.169659 -24.04587
-8.67528 -8.67114 -11.406 -9.96195 -11.7893
[-0.06437] [-0.01800] [-1.93659] [ 0.01703]
[-
2.03963]*
D(CPI_PK_RT(-2)) 5.841176 5.998417 -5.243736 2.769047 -6.095168
-7.57912 -7.5755 -9.96483 -8.70321 -10.2997
[ 0.77069] [ 0.79182] [-0.52622] [ 0.31816]
[-
0.59178]
D(CPI_TUR_RT(-1)) -0.344596 -0.38139 20.26698 5.480655 21.60715
-8.92122 -8.91695 -11.7294 -10.2444 -12.1236
[-0.03863] [-0.04277] [ 1.72788] [ 0.53499]
[
1.78224]
D(CPI_TUR_RT(-2)) 5.536287 5.582842 16.22742 12.68664 16.73
-7.74003 -7.73634 -10.1764 -8.88799 -10.5184
[ 0.71528] [ 0.72164] [ 1.59461] [ 1.42739]
[
1.59055]
D(Q_RT(-1)) -0.617438 -0.827274 -16.18042 -3.502068 -16.88502
-5.00706 -5.00467 -6.58315 -5.74968 -6.80438
[-0.12331] [-0.16530]
[-
2.45785]* [-0.60909]
[-
2.48149]*
D(Q_RT(-2)) 9.498625 9.188814 1.037679 3.998714 1.075948
-3.75554 -3.75375 -4.93769 -4.31254 -5.10362
[ 2.52923]* [ 2.44790]* [ 0.21015] [ 0.92723]
[
0.21082]
D(RP_RT(-1)) -0.036937 -0.032934 -0.146251 -0.395962 -0.157971
-0.35812 -0.35795 -0.47084 -0.41123 -0.48667
[-0.10314] [-0.09201] [-0.31062] [-0.96287]
[-
0.32460]
D(RP_RT(-2)) -0.583516 -0.574788 -0.544987 -0.778255 -0.557317
-0.35175 -0.35158 -0.46247 -0.40392 -0.47801
[-1.65890] [-1.63486] [-1.17842] [-1.92676]
[-
1.16591]
D(S_RT(-1)) 0.611607 0.810506 14.34725 3.349279 14.94912
-4.6716 -4.66937 -6.1421 -5.36447 -6.34851
[ 0.13092] [ 0.17358] [ 2.33589] [ 0.62434]
[
2.35474]*
D(S_RT(-2)) -8.77438 -8.489258 -1.345183 -3.743839 -1.404413
-3.48754 -3.48588 -4.58533 -4.0048 -4.73943
[-2.51592]* [-2.43533]* [-0.29337] [-0.93484]
[-
0.29633]
C -0.004868 -0.004895 -0.005475 -0.005157 -0.005498
-0.00505 -0.00505 -0.00664 -0.0058 -0.00686
[-0.96377] [-0.96940] [-0.82431] [-0.88896]
[-
0.80092]
R-Squared 0.143617 0.14299 0.39745 0.182957 0.413257
Adj. R-Squared 0.090395 0.089729 0.360003 0.13218 0.376793
F- Statistic 2.69847 2.684725 10.61376 3.603172 11.33323
Journal of Accounting and Finance in Emerging Economies Vol. 6, No 1, 2020
143
Vector error correction model is being used for evaluating the short term relationship among PPP
variables. Whereas t-statistics at t>1.96 indicates the presence of short run relationship between the
relevant variables and there held short run relationship within economies of Pakistan and Turkey.
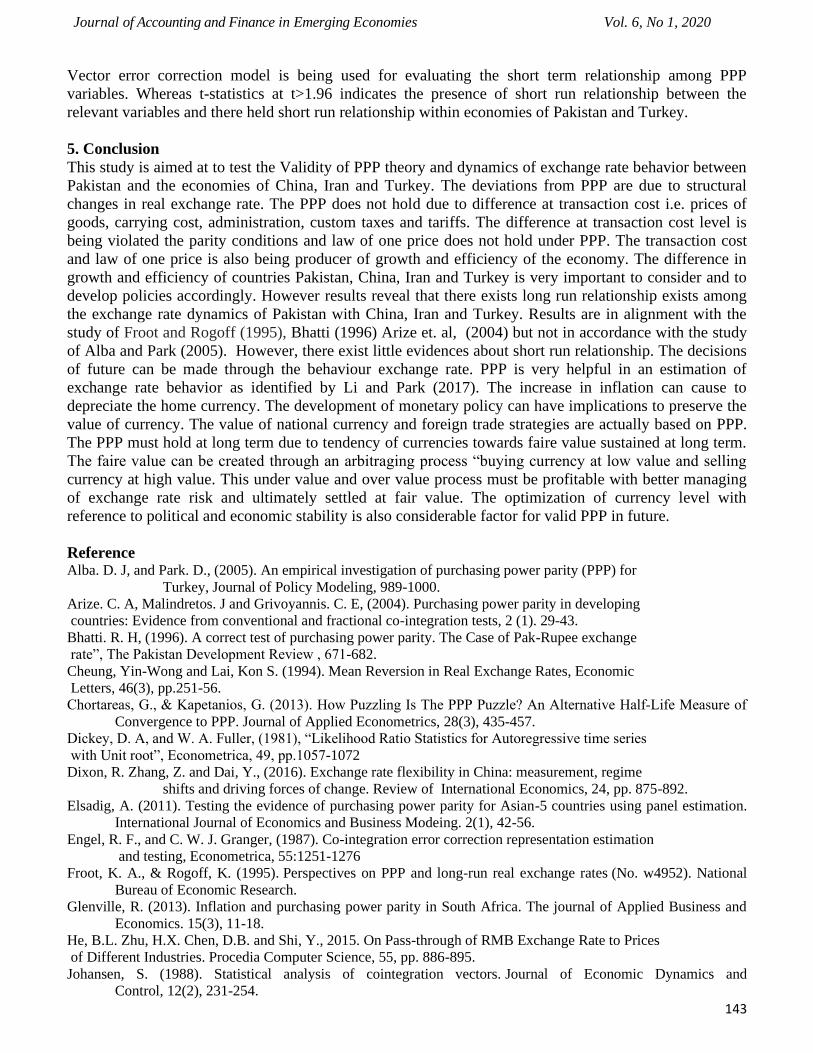
5. Conclusion
This study is aimed at to test the Validity of PPP theory and dynamics of exchange rate behavior between
Pakistan and the economies of China, Iran and Turkey. The deviations from PPP are due to structural
changes in real exchange rate. The PPP does not hold due to difference at transaction cost i.e. prices of
goods, carrying cost, administration, custom taxes and tariffs. The difference at transaction cost level is
being violated the parity conditions and law of one price does not hold under PPP. The transaction cost
and law of one price is also being producer of growth and efficiency of the economy. The difference in
growth and efficiency of countries Pakistan, China, Iran and Turkey is very important to consider and to
develop policies accordingly. However results reveal that there exists long run relationship exists among
the exchange rate dynamics of Pakistan with China, Iran and Turkey. Results are in alignment with the
study of Froot and Rogoff (1995), Bhatti (1996) Arize et. al, (2004) but not in accordance with the study
of Alba and Park (2005). However, there exist little evidences about short run relationship. The decisions
of future can be made through the behaviour exchange rate. PPP is very helpful in an estimation of
exchange rate behavior as identified by Li and Park (2017). The increase in inflation can cause to
depreciate the home currency. The development of monetary policy can have implications to preserve the
value of currency. The value of national currency and foreign trade strategies are actually based on PPP.
The PPP must hold at long term due to tendency of currencies towards faire value sustained at long term.
The faire value can be created through an arbitraging process “buying currency at low value and selling
currency at high value. This under value and over value process must be profitable with better managing
of exchange rate risk and ultimately settled at fair value. The optimization of currency level with
reference to political and economic stability is also considerable factor for valid PPP in future.
Reference Alba. D. J, and Park. D., (2005). An empirical investigation of purchasing power parity (PPP) for
Turkey, Journal of Policy Modeling, 989-1000.
Arize. C. A, Malindretos. J and Grivoyannis. C. E, (2004). Purchasing power parity in developing
countries: Evidence from conventional and fractional co-integration tests, 2 (1). 29-43.
Bhatti. R. H, (1996). A correct test of purchasing power parity. The Case of Pak-Rupee exchange
rate”, The Pakistan Development Review , 671-682.
Cheung, Yin-Wong and Lai, Kon S. (1994). Mean Reversion in Real Exchange Rates, Economic
Letters, 46(3), pp.251-56.
Chortareas, G., & Kapetanios, G. (2013). How Puzzling Is The PPP Puzzle? An Alternative Half‐Life Measure of
Convergence to PPP. Journal of Applied Econometrics, 28(3), 435-457.
Dickey, D. A, and W. A. Fuller, (1981), “Likelihood Ratio Statistics for Autoregressive time series
with Unit root”, Econometrica, 49, pp.1057-1072
Dixon, R. Zhang, Z. and Dai, Y., (2016). Exchange rate flexibility in China: measurement, regime
shifts and driving forces of change. Review of International Economics, 24, pp. 875-892.
Elsadig, A. (2011). Testing the evidence of purchasing power parity for Asian-5 countries using panel estimation.
International Journal of Economics and Business Modeing. 2(1), 42-56.
Engel, R. F., and C. W. J. Granger, (1987). Co-integration error correction representation estimation
and testing, Econometrica, 55:1251-1276
Froot, K. A., & Rogoff, K. (1995). Perspectives on PPP and long-run real exchange rates (No. w4952). National
Bureau of Economic Research.
Glenville, R. (2013). Inflation and purchasing power parity in South Africa. The journal of Applied Business and
Economics. 15(3), 11-18.
He, B.L. Zhu, H.X. Chen, D.B. and Shi, Y., 2015. On Pass-through of RMB Exchange Rate to Prices
of Different Industries. Procedia Computer Science, 55, pp. 886-895.
Johansen, S. (1988). Statistical analysis of cointegration vectors. Journal of Economic Dynamics and
Control, 12(2), 231-254.
Journal of Accounting and Finance in Emerging Economies Vol. 6, No 1, 2020
144
Johansen, S., &Juselius, K. (1990). Maximum likelihood estimation and inference on cointegration with
applications to the demand for money. Oxford Bulletin of Economics and Statistics, 52(2), 169-210.
Kanyembo, C. and Sheefeni, J.P. (2013). Purchasing Power Parity between Zambia and South
Africa, Journal of Emerging Issues in Economics, Finance and Banking (JEIEFB), 2, 858-
871.
Khan, M. A., & Qayyum, A. (2007). Exchange rate determination in Pakistan: Evidence based on purchasing power
parity theory. Pakistan Economic and Social Review, 181-202.
Ma, W. Li, H.Q. and Park, S.Y., (2017). Empirical conditional quantile test for purchasing power
parity: Evidence from East Asian countries. International Review of Economics and
Finance, 49:211-222.
Murray. J. C and Papell. H. D, (2002). The purchasing power parity persistence paradigm, Journal of
International Economics (1–19).
Phillips, P., and P. Perron, (1988). Testing for a unit root in time series regression, Biometrica, 75:335-346
Sercu, P., Uppal, R., & Van Hulle, C. (1995). The exchange rate in the presence of transaction costs: implications
for tests of purchasing power parity. Journal of Finance, 1309-1319.
Sarno, L. and Taylor, M.P. (2002). The Economics of Exchange Rates, Cambridge University Press, Cambridge.
Shively, P.A, (2001). A Test of Long-Run Purchasing Power Parity”, Economics Letters, 73,201-
205.
Taylor. M. A, (2002). A Century of Purchasing Power Parity” The Review of Economics and
Statistics, February 2002, 84(1): 139–150
Taylor, M.P. & Sarno, L. (1998). The behavior of real exchange rates during the post-Bretton Woods period,
Journal of International Economics, (1998), Vol. 46, pp. 281-312.
Zyoud, H.A. (2015). An Empirical Test of Purchasing Power Parity Theory for Canadian Dollar-US
Dollar Exchange Rates, International Journal of Economics and Finance, 7:3, 233-240.