testing the modeled effectiveness of an operational fuel ... · woody fuels were counted by ......
TRANSCRIPT
USDA Forest Service Proceedings RMRS-P-46CD. 2007. 301
Abstract—Much of the coniferous zones in the Western United States where fires were historically frequent have seen large increases in stand densities and associated forest fuels due to 20th century anthropogenic influences. This condition is partially responsible for contemporary large, uncharacteristically severe wildfires. Therefore, considerable effort is under way to reduce the potential for extreme wildfire behavior and effects, especially near communities, by manipulating canopy and surface fuels using mechanical thinning and/or prescribed burning. Treatment effectiveness, however, has been difficult to quantitatively assess, but methods are now available for estimating stand-level canopy and surface fuels with which fire behavior can be more accurately modeled and compared among different fuel treatments. The Sheafman Fuels Reduc-tion Project was recently conducted by the Bitterroot National Forest incorporating various fuel treatments to reduce the probability of high intensity crown fire impacting a watershed adjacent to Pinesdale, MT. Detailed sampling of stand conditions was conducted before and after two treatments: overstory thinning with understory cut-ting, and understory cutting only. Both were followed by slash burning. Surface fuel loadings were estimated from intercept data, and canopy fuels were estimated from tree data using the FuelCalc program. Pre- and posttreatment fuels data were used to model surface and crown fire behavior using the NEXUS program. A comparison was made between fire behavior computed from treatment mean fuels data and individual plot fuels data. Results indicate that because surface fuels and estimated mid-flame wind speeds increased modestly with treatments, surface fire behavior was not greatly altered until 20-ft wind speeds exceeded 20 mph. Treatment effects on canopy base heights and canopy bulk densities within the small landscape determined the level of estimated treatment effectiveness. Both treatments reduced the probability of crown fire initiation by raising canopy base heights. The likelihood of crown fire spread was appreciably reduced only in the overstory thinning treatment. An examination of plot scale surface and crown fire behavior gave a more detailed assessment of treatment effectiveness than average treatment values.
Introduction
A large proportion of the forested regions in the Western United States, which historically were exposed to frequent, low intensity wildfire (Arno and others 1997; Everett and others 2000), are currently represented by altered stand structure and composition compared to pre-European settle-ment (Cooper 1960; Parsons and others 1979). An alteration of historical disturbance trends, from regular fire occurrence to general fire exclusion and tree harvesting, is the supposed cause for these forest changes. These changes are generally characterized by large numbers of trees, typically with a considerable proportion of shade tolerance (Hartwell and others 2000),
Testing the Modeled Effectiveness of an Operational Fuel Reduction Treatment in a Small Western Montana Interface Landscape Using Two Spatial Scales
Michael G. Harrington1, Erin Noonan-Wright2, and Mitchell Doherty2
In: Butler, Bret W.; Cook, Wayne, comps. 2007. The fire environment—innovations, management, and policy; conference proceedings. 26-30 March 2007; Dest in, FL . Proceed ings RMRS-P-46CD. Fort Collins, CO: U.S. Department of Agriculture, Forest Serv ice, Rocky Mounta in Research Station. 662 p. CD-ROM.
1 Research Forester, U.S. Department of Agriculture, Forest Service, Rocky Mountain Research Station, Missoula, MT. [email protected]
2 Fire Ecologist and Forestry Technician, respectively, Systems for Environmental Management, Missoula, MT.

USDA Forest Service Proceedings RMRS-P-46CD. 2007. 302
and often with significant amounts of dead vegetation litter (Pyne and others 1993; Arno and others 2000). Therefore, across many low to mid-elevation forested landscapes, large amounts of both living and dead biomass have ac-cumulated. Furthermore, wildland fires of uncharacteristically high intensity and severity are now common, in part because of this condition, and because communities and many recreational activities occur within or close to this forest type, the fire risk is high (Skinner and Chang 1996; Hardy 2005). In addition, because historically these ecosystems were defined by low to mixed severity rather than high severity systems, they have developed little resilience, and postfire recovery to some acceptable condition is uncertain (Barrett and others 1991; Brown and others 1994).
A large effort is currently under way to lessen this hazard by manipulat-ing canopy and surface fuel characteristics to reduce the probability of severe wildfire behavior and impacts (USDA, USDI 2004; http://www.healthy-forests.gov/accomplish-report_2004.pdf). Most fuel reduction treatments use mechanical thinning, prescribed burning, or a combination to reduce horizontal and vertical fuel quantities and homogeneity (Agee and Skinner 2005). Ideally, areas with high probability of severe fire because of a fuel hazard can be delineated for active management consideration (GAO 2003). Whereas techniques for assessing surface fuel characteristics and surface fire behavior have been available for some time, canopy fuel treatment prescrip-tions and their assumed effects on crown fire initiation and spread have been, until recently, qualitatively assessed, typically by expert opinion. This was primarily due to the inability to accurately quantify canopy fuels and crown fire spread (Scott and Reinhardt 2001).
The Sheafman Fuels Reduction Project was recently conducted by the Bitterroot National Forest incorporating various canopy and surface fuels treatments in a dense forest condition to reduce the probability for high in-tensity crown fire impacting the watershed and community of Pinesdale, MT. This study evaluates pre- and posttreatment fuels and models the change in anticipated fire behavior following two treatments across this small, interface landscape. Predicted fire behavior is compared at two scales: the more tradi-tional average treatment-level scale, and a more detailed plot-level scale.
Methods
Treatment HistoryIn May 2001, The Bitterroot National Forest signed a Decision Notice
to conduct the Sheafman Fuels Reduction Project within a 475-acre area adjacent to and west of private property in the community of Pinesdale, MT, with several hundred rural homes. The Purpose and Need statement from the document (Bitterroot National Forest 2001) reports:
Breakup the existing fuel continuity on National Forest System lands near the town of Pinesdale by reducing the density of trees. This will decrease the probability that a future wildland fire would develop into, or be sustained as, a stand replacing or crown fire, and increase the probability of being able to defend life and property within the wild-land/urban interface from wildland fire.
Based on existing fuels and site conditions, a series of units were established by the National Forest for either prescribed burning only (not discussed in this paper), understory cutting with prescribed fire, or overstory thinning
Testing the Modeled Effectiveness of an Operational Fuel Reduction Treatment in a Small Western Montana Interface… Harrington, Noonan-Wright, and Doherty

USDA Forest Service Proceedings RMRS-P-46CD. 2007. 303
with understory cutting and prescribed fire. The silvicultural prescription for the overstory thinning treatment called for leaving a single or two-story semiopen stand with 50 to 80 trees per acre favoring ponderosa pine with a heavy reduction of understory trees. In the understory cutting treatment, trees less than 7 inches diameter breast height (dbh at 4.5 ft) were cut and piled for burning, mostly on slopes steeper than 45 percent, where equipment for overstory thinning could not safely operate.
Field MethodsIn 2002, sample plots were established in six locations within the Sheaf-
man treatment area. Five plots were established for sampling surface fuels, stand structure, and other site attributes in four locations and 10 plots in the remaining two locations for a total of 40 plots. Throughout the project area, the final decision between overstory thinning (OT) or understory cutting (UC) was made by the forest operator with the most liberal treatment, OT, preferred. Therefore, 32 plots received the OT treatment and eight received the UC treatment (fig. 1).
Figure 1—Examples of Sheafman fuel treatments: pre (a) and post (b) overstory thinning, and pre (c) and post (d) understory cutting.
a
b
Testing the Modeled Effectiveness of an Operational Fuel Reduction Treatment in a Small Western Montana Interface… Harrington, Noonan-Wright, and Doherty

USDA Forest Service Proceedings RMRS-P-46CD. 2007. 304
c
d
The first plot at each location was randomly located, and subsequent plots were systematically located along a previously selected azimuth and distance. At each plot, two or three 50-ft transects were laid out at previously chosen azimuths to measure surface fuel characteristics according to FIREMON protocols, version 2.1.1 (Lutes 2006) in which intercepts of down and dead woody fuels were counted by size class; canopy cover and height of shrub and herbaceous vegetation were measured; and forest f loor depth measurements were made separating litter and duff. The intercept, canopy cover/height, and litter/duff depth data were used in standard algorithms to calculate load-ings by fuel type. Note that posttreatment shrub characteristics could not be measured on 30 of 40 plots because of dormancy. Therefore, because shrub canopy cover and heights on the 10 measured plots were similar between pre- and posttreatment, pretreatment values were used in the posttreatment analysis for those 30 plots. Also at each plot, the following measurements were made for all trees > 4.5 ft tall within a 1/10th-acre circular subplot: species, dbh, height, height to live crown base, and crown class (dominant, codominant, intermediate, and suppressed). Few trees <4.5 ft tall occurred
Testing the Modeled Effectiveness of an Operational Fuel Reduction Treatment in a Small Western Montana Interface… Harrington, Noonan-Wright, and Doherty

USDA Forest Service Proceedings RMRS-P-46CD. 2007. 305
at this site. Tree data were used in the FUELCALC program, Beta version (Reinhardt and others 2006) to compute canopy fuel attributes, such as load-ing by fuel size class, canopy bulk densities, and canopy base heights. Crown class adjustment factors that were most appropriate for the Sheafman site were used in the calculations. Pretreatment sampling took place in 2002 and 2003, overstory thinning, understory cutting and pile burning occurred between 2002 and 2004, and posttreatment sampling took place in 2004.
Fuel and Fire Behavior ModelingModeled fire behavior—namely surface fire spread rate and f lame length
along with the torching and crowning indices—was used to evaluate the pre- and posttreatment level of wildfire hazard and assess the effect of the fuel treatments. In this analysis, we compared pre- and posttreatment stand conditions, surface and canopy fuel characteristics, and the resulting fire be-havior in the 32 plots with overstory thinning/understory cutting (OT) and the eight plots with understory cutting (UC) only. Fire behavior modeling was conducted at two scales for comparison: using average treatment-level fuels data and using individual plot-level fuels data. In the first method, the surface and canopy fuels data for all plots within a treatment were averaged resulting in one custom fuel model per treatment each for pre and post con-ditions. These single custom fuel models were used to predict single values for each surface and crown fire behavior attribute by treatment before and after thinning. This method is commonly reported when assessing treatment effectiveness (Raymond and Peterson 2005; Stephens and Moghaddas 2005). In the second method, custom fuel models were developed for each plot from plot-level surface fuel characteristics and canopy fuel attributes. These plot-level models were used to estimate surface and crown fire behavior for each plot to assess a distribution of predicted fire response within a treatment. Therefore, this is an assessment of scale, examining surface and crown fire behavior at the larger treatment scale and at the smaller plot scale, which may be the fuel environment level at which fire actually responds. Fulé and others (2002) also reported that average stand conditions fail to represent canopy fuel variability, reducing the chance of predicting real crown fire behavior.
The 95th percentile fire weather and computed fuel moistures used in the wildfire scenario and representing a very high level of fire danger were retrieved using the Fire Family Plus 3.0 program with data from the Smith Creek Remote Automatic Weather Station (#242912) 7 miles north and at a similar elevation and aspect as the fuel treatment site. Data were analyzed for the 7 years the station has been in operation and covered May 1 to Oct. 30, 2000 to 2006. The fuel moisture scenario used in fire behavior calculations for both pre- and posttreatment was 1-hr = 3 percent, 10-hr = 4 percent, 100-hr = 6 percent, live woody = 70 percent, herbaceous = 30 percent, foliar = 100 percent. Because winds are inherently transient, they were mod-eled at four 20-ft wind speeds (10, 20, 30, and 40 mph) and across slope, which is the most likely wind direction in the Sheafman area. Stand height, crown ratio, and canopy cover were used to derive the wind adjustment factor for calculation of the mid-flame wind speeds (Albini and Baughman 1979). Both the treatment-level or plot-level custom surface fuel models, canopy fuel attributes, and slopes along with the 95th percentile computed fuel moisture values as well as the selected 20-ft wind speeds were used for fire behavior modeling at the treatment or plot level using the NEXUS 2.0 program (Scott 1999). Note that, even though crown fire behavior values are computed by NEXUS, only fire behavior from surface fire is reported because the focus
Testing the Modeled Effectiveness of an Operational Fuel Reduction Treatment in a Small Western Montana Interface… Harrington, Noonan-Wright, and Doherty

USDA Forest Service Proceedings RMRS-P-46CD. 2007. 306
of this assessment is whether or not crown fire will initiate and spread, not how intense the crown fire will be.
Crown fire terminology used in this paper comes from Scott and Rein-hardt (2001):
• Passive crown fire occurs as individual or small groups of trees torch out but lateral crown fire spread is not necessary.
• Active crown fire occurs as the entire fuel complex from surface to canopy is burning and the crown fire is dependant on the surface fire.
• Conditional surface fire occurs when passive crown fire requirements are not met but crown fire spread requirements are.
• Torching index is the 20-ft wind speed at which crown fire activity can initiate.
• Crowning index is the 20-ft wind speed at which active crown fire is possible.
Results
Much of the Sheafman treatment area had been heavily logged, most likely a century earlier, leading to dense Douglas-fir stands that occupied the site at the beginning of this project. Before treatment, the overstory thinning plots (OT) averaged about 580 trees/acre and 140 ft2/acre basal area, with individual plots ranging from 230 to 1770 trees/acre (fig. 2). Tree density and basal area averaged just under 380 trees/acre and 125 ft2/acre in the under-story cutting plots (UC) with a much narrower range than the OT plots.
Thinning reduced the average OT plot tree density by 87 percent (73 trees/acre) and basal area by 63 percent (53 ft2/acre) compared to 59 percent (154 trees/acre) and 17 percent (102 ft2/acre) reductions, respectively, for the UC plots (fig. 2). The relatively high stand densities resulted in substantial mean canopy bulk density (CBD) values, and the range of plot values was large, 0.06 to 0.54 kg/m3 for the OT plots and 0.06 to 0.27 kg/m3 for the UC
Figure 2—Box plot of trees per acre (a) and basal area (b) grouped by treatment, overstory thin (n=32) and understory cut (n=8) and status, pretreatment or posttreatment. The box portion of the box represents the interquartile range (25th to 75th percentile). The red line is the mean; the black line is the median. The lines extending from the bottom and top of the box represent the minimum and maximum values, respectively. Outliers are not shown.
a b
Testing the Modeled Effectiveness of an Operational Fuel Reduction Treatment in a Small Western Montana Interface… Harrington, Noonan-Wright, and Doherty
USDA Forest Service Proceedings RMRS-P-46CD. 2007. 307
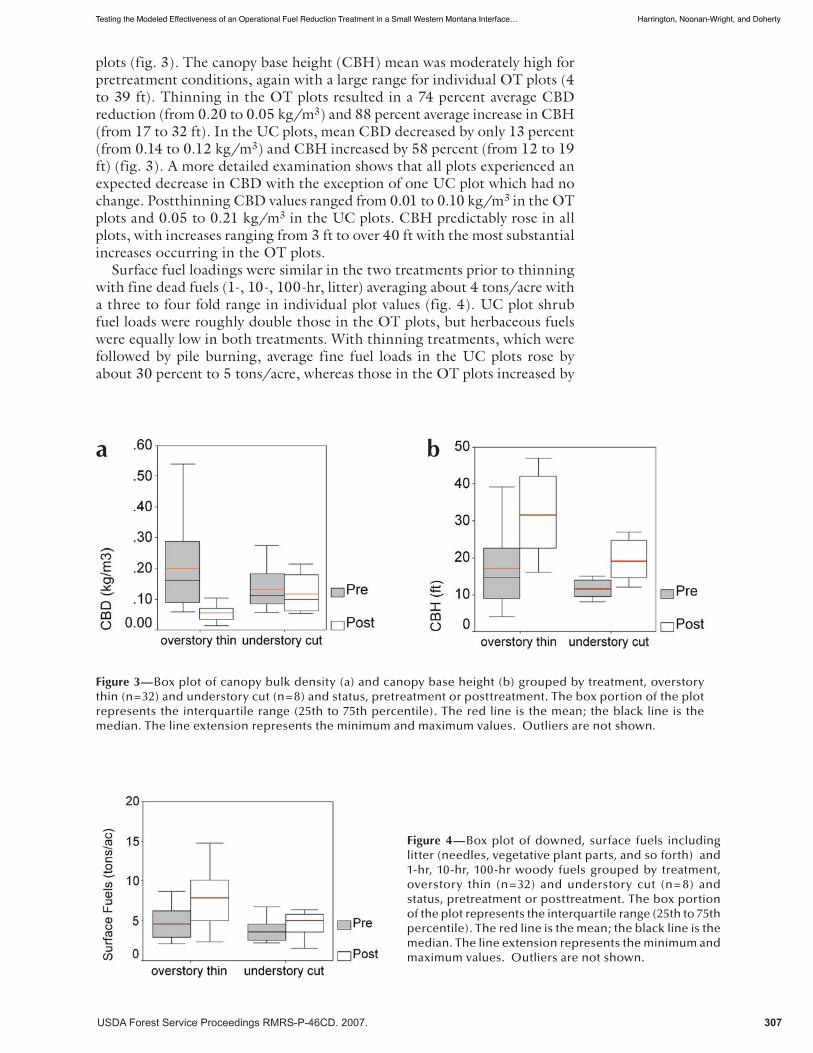
plots (fig. 3). The canopy base height (CBH) mean was moderately high for pretreatment conditions, again with a large range for individual OT plots (4 to 39 ft). Thinning in the OT plots resulted in a 74 percent average CBD reduction (from 0.20 to 0.05 kg/m3) and 88 percent average increase in CBH (from 17 to 32 ft). In the UC plots, mean CBD decreased by only 13 percent (from 0.14 to 0.12 kg/m3) and CBH increased by 58 percent (from 12 to 19 ft) (fig. 3). A more detailed examination shows that all plots experienced an expected decrease in CBD with the exception of one UC plot which had no change. Postthinning CBD values ranged from 0.01 to 0.10 kg/m3 in the OT plots and 0.05 to 0.21 kg/m3 in the UC plots. CBH predictably rose in all plots, with increases ranging from 3 ft to over 40 ft with the most substantial increases occurring in the OT plots.
Surface fuel loadings were similar in the two treatments prior to thinning with fine dead fuels (1-, 10-, 100-hr, litter) averaging about 4 tons/acre with a three to four fold range in individual plot values (fig. 4). UC plot shrub fuel loads were roughly double those in the OT plots, but herbaceous fuels were equally low in both treatments. With thinning treatments, which were followed by pile burning, average fine fuel loads in the UC plots rose by about 30 percent to 5 tons/acre, whereas those in the OT plots increased by
Figure 3—Box plot of canopy bulk density (a) and canopy base height (b) grouped by treatment, overstory thin (n=32) and understory cut (n=8) and status, pretreatment or posttreatment. The box portion of the plot represents the interquartile range (25th to 75th percentile). The red line is the mean; the black line is the median. The line extension represents the minimum and maximum values. Outliers are not shown.
a b
Figure 4—Box plot of downed, surface fuels including litter (needles, vegetative plant parts, and so forth) and 1-hr, 10-hr, 100-hr woody fuels grouped by treatment, overstory thin (n=32) and understory cut (n= 8) and status, pretreatment or posttreatment. The box portion of the plot represents the interquartile range (25th to 75th percentile). The red line is the mean; the black line is the median. The line extension represents the minimum and maximum values. Outliers are not shown.
Testing the Modeled Effectiveness of an Operational Fuel Reduction Treatment in a Small Western Montana Interface… Harrington, Noonan-Wright, and Doherty

USDA Forest Service Proceedings RMRS-P-46CD. 2007. 308
almost 70 percent to 8 tons/acre. These fuel loading increases were primar-ily due to added 10-hr and 100-hr woody biomass. Live herbaceous fuels changed little, and shrub loads were similar in the analysis, primarily because pretreatment shrub biomass was used for posttreatment in 30 of 40 plots as described in the methods.
Effective mid-flame wind speeds are also expected to increase with higher wind adjustment factors resulting from the more open posttreatment stand features. The wind adjustment factor as computed using Albini and Baughman (1979) averaged about 0.12 in both treatments before thinning but almost doubled (0.22) in the OT plots with thinning compared to only a 25 percent increase (0.15) in the UC plots. The range of wind adjustment factors across pretreatment OT plots was predicted to reduce a 20 mph, 20-ft wind to 2 to 3 mph at mid-flame height but would increase to 3 to 6 mph after thinning. UC plot mid-flame wind speed range would also be 2 to 3 mph pretreatment and would only increase to 2 to 4 mph posttreatment.
To repeat from the Fuels and Fire Behavior Modeling section above, two methods were used to compute and summarize the fire behavior outputs. In the first method, treatment-level fire behavior values were computed from the NEXUS model using a single mean custom fuel model for each treatment, for pre and post conditions. The second method used plot-level outputs that were the distribution of fire behavior values from NEXUS-produced custom fuel models for each plot. Treatment-level predicted surface fire spread rates and f lame lengths are compared in table 1 for pre- and postthinning for the two treatments under four wind speeds. Postthinning treatment-level spread rates and f lame lengths were similar to prethinning values in the OT plots at lower wind speeds but increased more rapidly with increasing wind speeds. The ranges of plot-level spread rates and f lame lengths broadened to higher maximums after treatment and at wind speeds higher than 20 mph.
Table 1—Rates of surface fire spread and flame lengths at four 20-ft wind speeds pre- and posttreatment in the Overstory Thinning and Understory Cutting treatments. Treatment-level (trt-level) values are computed from mean fuel loadings, slopes, and wind speeds. Plot-level values include the maximum and minimum values computed from individual plot fuel loadings, slopes, and wind speeds.
Rate of fire spread (chains/hour)
Overstory thinning Understory cutting
Pretreatment Posttreatment Pretreatment Posttreatment
20-ft
wind
speed
(mph) Trt-level Plot-level Trt-level Plot-level Trt-level Plot-level Trt-level Plot-level
10 6 2-23 5 2-24 15 3-31 11 4-23
20 7 3-39 9 4-53 17 6-34 14 7-30
30 10 4-52 16 8-96 22 9-48 20 11-45
40 14 6-73 25 12-148 30 14-67 29 17-66
Flame length (feet)
Overstory thinning Understory cutting
Pretreatment Posttreatment Pretreatment Posttreatment
20-ft
wind
speed
(mph) Trt-level Plot-level Trt-level Plot-level Trt-level Plot-level Trt-level Plot-level
10 3 2-10 3 2-10 6 2-9 5 2-8
20 4 2-10 4 2-11 6 3-9 6 3-9
30 4 2-11 5 2-14 7 3-10 7 4-11
40 5 2-12 6 3-18 8 4-12 8 5-13
Testing the Modeled Effectiveness of an Operational Fuel Reduction Treatment in a Small Western Montana Interface… Harrington, Noonan-Wright, and Doherty

USDA Forest Service Proceedings RMRS-P-46CD. 2007. 309
The treatment and plot-level rates of fire spread and f lame lengths in the UC plots were predicted to change little as a result of the thinning (table 1). Looking at individual plots, figure 5 shows that a general increase in fire behavior after treatment is predicted for a growing number of plots as wind speed rises. With winds at or above 20 mph, rates of fire spread and f lame lengths after the OT treatment are expected to increase in over 60 percent of the plots. Increases in fire spread and f lame length are predicted to occur posttreatment in over 50 and 35 percent of the UC plots, respectively, with wind speeds 30 mph and greater.
The treatment-level torching index for plots in the OT treatment was quite high for both pre- and posttreatment, exceeding 80 mph (table 2). Plot-level indices were expansive because of the broad range of CBH values (fig. 3). For the UC treatment, the treatment-level torching index rose from 27 mph pretreatment to almost 50 mph posttreatment. The treatment-level
Table 2—Torching and crowning indexes in miles/hour winds speed pre- and posttreatment for the overstory thinning and understory cutting treatments. Treatment-level (trt-level) values are computed from mean fire behavior values, CBD, and CBH. Plot-level values include the maximum and minimum values computed from individual plot fire behavior values, CBD, and CBH.
Overstory thinning Understory cuttingIndex
(mph) Pretreatment Posttreatment Pretreatment Posttreatment
Trt-level Plot-level Trt-level Plot-level Trt-level Plot-level Trt-level Plot-level
Torch 89 0-469 118 21-392 27 0-95 49 10-99
Crown 12 4-32 34 21-89 17 8-32 19 11-34
Figure 5—Percent of plots with increasing surface rates of spread (ROS) and flame lengths (FML) following the overstory thinning and understory cutting treatments.
Testing the Modeled Effectiveness of an Operational Fuel Reduction Treatment in a Small Western Montana Interface… Harrington, Noonan-Wright, and Doherty

USDA Forest Service Proceedings RMRS-P-46CD. 2007. 310
crowning index almost tripled in the OT plots from 12 to 34 mph with thin-ning as did the range, but changed minimally in the UC treatment. This reflects the relative changes in CBD by treatment shown in figure 3. Figure 6 shows the percent of plots with torching potential under four wind speeds. Throughout the tested wind speed range, 6 to 28 percent of the OT plots were predicted to torch before treatment, which was reduced to a maximum of 13 percent at 40 mph winds after thinning. Between 25 and 75 percent of the UC plots were initially predicted to torch with 10 to 40 mph winds. These values were reduced approximately in half with treatments, indicating that some crown fire initiation was still predicted at all wind speeds in the UC plots after thinning.
Combining active and conditional crown fire potential, 31 percent of the OT plots were predicted to support crown fire spread at a 20-ft wind speed of 10 mph before treatment, up to 100 percent with winds at 40 mph (fig. 7). After thinning, no plots were expected to support crown fire at winds below 20 mph, but with 30 to 40 mph winds, 34 and 63 percent of plots were pre-dicted support crown fire. In the UC plots before treatment, the range of plots predicted to sustain crown fire spread ranged from 13 to 100 percent within the tested wind speed range. With understory tree cutting, these percentages decreased by only 13 percent with winds at or below 30 mph, and remained at 100 percent with a 40 mph wind speed.
Figure 6 — Percent of plots in the over s tor y t h inning ( n = 3 2 ) a n d understory cutting (n=8) treatments in which crown fire initiation is predicted before and after treatment at four wind speeds.
Figure 7— Percent of plots in the over s tor y th inning ( n = 3 2 ) a nd understory cutting (n= 8) treatments in which crown fire spread is predicted before and after treatment at four wind speeds.
Testing the Modeled Effectiveness of an Operational Fuel Reduction Treatment in a Small Western Montana Interface… Harrington, Noonan-Wright, and Doherty
USDA Forest Service Proceedings RMRS-P-46CD. 2007. 311
Summary and Discussion
The purpose of the Sheafman Fuels Reduction Project as stated in the Decision Notice (see Methods section) was to breakup fuel continuity through tree density reduction thereby lessening the probability of stand replacement crown fire. The monitoring and analysis reported here quantified the surface fuel status and the assumed canopy fuel continuity, determined the effect of thinning on fuel structure, and modeled the predicted fire behavior before and after fuel reduction treatments. We presented average values for surface fuel loadings and canopy fuel structure before and after thinning and also treatment-level predicted surface and crown fire behavior based on these average fuel characteristics and a specified wildfire weather/fuel moisture scenario for the two treatments implemented in the project area. These aver-age values offer an assessment of general fuel conditions within treatments as well as broad generalization of predicted fire behavior, which is standard reporting procedure.
An additional evaluation features a comparison of pre- and posttreatment fire behavior on a plot scale with the assumption that fire response is more closely tied to small scale surface and canopy fuel characteristics than to larger stand scale average conditions and therefore, perhaps, more informative. Because surface fire behavior at any particular site depends on the quality and quantity of available fuels, spatial variability in fuels should lead to variable fire behavior. Further, because surface fire behavior and canopy base height are the primary factors controlling crown fire initiation, quantifying the plot-level coincidence of these two factors should provide a more accurate assessment of the spatial probability of torching than do treatment averages. Addition-ally, plot-level canopy bulk density values, which may exceed or fall short of wind speed thresholds for crown fire spread, should provide a more detailed picture of the potential variability of crown fire behavior across a treatment area than does an average CBD value, representing the entire treatment.
The initiation of crown fire is determined by the relationship between surface fire intensity and adjoining canopy base height. The fire intensity input variables that were affected by the thinning treatments were primarily fuel loadings and mid-flame wind speed through the wind adjustment factor. Average surface fuel loading (fig. 4) and wind adjustment factor increased by about 70 and 100 percent in the OT plots, respectively, and 30 and 25 percent and the UC plots, respectively. However, predicted posttreatment spread rates and flame lengths, as indicators of fire intensity, remained similar to pretreat-ment values until 20-ft wind speeds exceeded 20 mph in the OT plots and at all wind speeds in the UC plots (table 1). The torching index computed from treatment-level fire intensity and CBH was very high for the OT plots before (89 mph) and after (118 mph) treatment (table 2), implying that crown fire initiation in either case would be highly unlikely. However, with a plot-level assessment, there clearly are individual plots predicted to initiate crown fire at lower wind speeds than predicted by treatment-level values. Before treatment, the percent of plots with torching potential ranged from 6 percent at 10 mph winds to 28 percent at 40 mph (fig. 6). After treatment, torching was not predicted in OT plots with winds below 30 mph but could be expected in 13 percent with 40 mph winds. In the UC plots, the torching index computed from treatment-level fire intensity and CBH was moderately low at 27 mph before treatment, but rose to 49 mph with thinning. At the plot scale, torching was predicted in 25 percent of the plots at 10 mph and up to 75 percent at 40 mph (fig. 6). With thinning, these percentages were
Testing the Modeled Effectiveness of an Operational Fuel Reduction Treatment in a Small Western Montana Interface… Harrington, Noonan-Wright, and Doherty

USDA Forest Service Proceedings RMRS-P-46CD. 2007. 312
reduced in half, 13 to 38 percent, with the same wind speeds, indicating that the torching potential, even though lessened, is still apparent because CBH values were significantly raised in only a portion of the plots relative to vari-able plot-level changes in surface fire intensity.
Crown fire spread is primarily determined by canopy bulk density and wind speed once the transition from surface to crowns has occurred (active crown fire) or once the crown fire has moved in from an adjacent stand (conditional surface fire) (Scott and Reinhardt 2001). Using average CBD values for each treatment, the crowning index for the OT plots is predicted to rise from 12 mph to 34 mph (table 2) with thinning which reduced CBD by almost 74 percent (fig. 3). In the UC plots, the modest 13 percent decrease in average CBD resulted in an inconsequential change in crowning index from 17 to 19 mph. Figure 7 illustrates percent of plots in which sustained crown fire spread is predicted as either active or conditional crown fire under four wind speeds. With 10 mph winds, a modest percentage of pretreatment UC and OT plots, 10 and 30 percent, respectively, would have sufficient CBD to support crown fire spread. With incrementally higher winds, the percentage of pretreatment plots with expected crown fire spread increases rapidly, in-cluding 90 percent of the plots or greater in both treatments at 30 to 40 mph winds. Because the UC plots had significantly less CBD reduction than the OT plots, the former continues to support high proportion of crown fire after thinning, with 40 to 100 percent of plots still capable of crown fire spread at wind speeds between 20 and 40 mph. No crown fire spread is predicted in the posttreatment OT plots until 30 mph wind speeds are reached, but 63 percent still have that potential with 40 mph winds.
It should be pointed out that when a fuel reduction treatment is imple-mented the expected result is an anticipated reduction in fire behavior. Figure 5 shows a predicted increase in surface fire behavior after treatment due to increased fuel loads and mid-flame wind speeds. This seems to be a reasonable tradeoff for the significant reduction in probability of crown fire initiation and spread (fig. 6 and 7), since management options for response to crown fire are greatly limited compared to surface fire.
In their concluding remarks, Scott and Reinhardt (2001) state: “Spatial and temporal variability in the fire environment leads to higher crown fire activity than predicted using average conditions.” The sampling and analysis reported here captures the spatial variability of a portion of the fire environ-ment, specifically, surface and canopy fuel structure, slope, and predicted mid-flame wind speed. Using this spatially variable data provides more detail for predicted fire behavior than that from average values. For example, where crown fire initiation was not predicted from treatment-level values, a certain percentage of plots were predicted to torch based on that smaller scale assess-ment. This should give managers of the Sheafman Fuels Reduction Project a better appraisal of crown fire probability. It should be noted that the ap-propriate size of a plot-scale fuels assessment has not been determined, and the plot size used in this analysis is, at this point, only for illustration.
ReferencesAgee, James K.; Skinner, Carl N. 2005. Basic principles of forest fuel reduction
treatments. Forest Ecology and Management 211: 83-96.
Albini, F.A.; Baughman, R.G. 1979. Estimating wind speeds for predicting wildland fire behavior. Res. Pap. INT-221. Ogden, UT: U.S. Department of Agriculture, Forest Service, Intermountain Forest and Range Experiment Station. 12 p.
Testing the Modeled Effectiveness of an Operational Fuel Reduction Treatment in a Small Western Montana Interface… Harrington, Noonan-Wright, and Doherty

USDA Forest Service Proceedings RMRS-P-46CD. 2007. 313
Arno, S.F.; Smith, H.Y.; Krebs, M.A.1997. Old growth ponderosa pine and western larch stand structures: inf luences of pre-1900 fires and fire exclusion. Res. Pap. INT-RP-495, Ogden, UT: U.S. Department of Agriculture, Forest Service, Intermountain Research Station. 20 p.
Arno, Stephen F.; Parsons, David J.; Keane, Robert E. 2000. Mixed-severity fire regimes in the Northern Rocky Mountains: consequences of fire exclusion and options for the future. In: Cole, David N.; McCool, Stephen F.; Borrie, William T.; O’Loughlin, Jennifer, comps. Wilderness science in a time of change conference, Volume 5: Wilderness ecosystems, threats, and management; May 23-27, 1999. Proceedings RMRS-P-15. Ogden, UT: U.S. Department of Agriculture, Forest Service, Rocky Mountain Research Station: 225-232.
Barrett, S.W.; Arno, S.F.; Key, C.H. 1991. Fire regimes of western larch-lodgepole pine forests in Glacier National Park, Montana. Canadian Journal Forestry Research 21:1711-1720.
Bitterroot National Forest. 2001. Sheafman Fuel Reduction Project: Environmental Assessment. On file: Stevensville Ranger District, 88 Main, St., Stevensville, MT. 130 p.
Brown, J.K.; Arno, S.F.; Barrett, S.W.; Menakis, J.P. 1994. Comparing the prescribed natural fire program with presettlement fires in the Selway-Bitterroot Wilderness. Int. Journal of Wild-land Fire 4:157-168.
Cooper, C.F. 1960. Changes in vegetation, structure and growth of southwestern pine forest since white settlement. Ecological Monographs 30: 129-164.
Everett, R.L.; Schellhaas, R.; Keenum, D.; Spurbeck, D.; Ohlson, P. 2000. Fire history in the ponderosa pine/Douglas-f ir forests on the east slope of the Washington Cascades. Forest Ecology and Management 129: 207-225.
Fulé, Peter Z.; Covington, W.; and others. 2002. Comparing ecological restoration alternatives: Grand Canyon, Arizona. Forest Ecology and Management 170: 19-41.
Hardy, Colin C. 2005. Wildland fire hazard and risk: Problems, definitions, and context. Forest Ecology and Management 211: 73-82.
GAO. 2003. Additional actions required to better identify and prioritize lands needing fuels reduction. Report to Congressional Requesters GAO-03-805. Washington, DC: United States General Accounting Office.
Lutes, D.C. 2006. FIREMON: f ire effects monitoring and inventory system. Gen. Tech. Rep. RMRS-GTR-164-CD. Fort Collins, CO: U.S. Department of Agriculture, Forest Service, Rocky Mountain Research Station.
Parsons, D.J.; DeBenedetti, S. 1979. Impact of fire suppression on a mixed-conifer forest. Forest Ecology and Management 2:21-33.
Pyne, S.J.; Andrews, P.L.; Laven, R.D. 1996. Introduction to wildland fire. New York: John Wiley and Sons. 769 p.
Raymond, Crystal L.; Peterson, David L. 2005. Fuel treatments alter the effects of wildfire in a mixed-evergreen forest, Oregon. Canadian Jour. Forest Research 35: 2981-2995.
Reinhardt, E.; Lutes, D.; Scott, J. 2006. FuelCalc: A method for estimating fuel characteristics. In: Andrews, P.; Butler, B., comps. 2006. Fuels Management—How to Measure Success: conference proceedings. 28-30 March 2006; Portland, OR. RMRS-P-41. Fort Collins, CO: U.S. Department of Agriculture, Forest Service, Rocky Mountain Research Station: 273-282.
Scott, J.H. 1999. NEXUS: a system for assessing crown fire hazard. Fire Management Notes 59(2): 20-24.
Scott, J.H.; Reinhardt, E. 2001. Assessing crown fire potential by linking models of surface and crown fire behavior. Res. Pap. RMRS-RP-29. Fort Collins, CO: U.S. Department of Agriculture, Forest Service, Rocky Mountain Research Station. 59 p.
Testing the Modeled Effectiveness of an Operational Fuel Reduction Treatment in a Small Western Montana Interface… Harrington, Noonan-Wright, and Doherty

USDA Forest Service Proceedings RMRS-P-46CD. 2007. 314
Skinner, C.N.; Chang, C. 1996. Fire regimes, past and present. In: Sierra Nevada Ecosystem Project: Final report to Congress, vol. II chap. 38. Davis, CA: University of California, Centers for Water and Wildland Resources.
Stephens, Scott L.; Moghaddas, Jason J. 2005. Experimental fuel treatment impacts on forest structure, potential fire behavior, and predicted tree mortality in a California mixed conifer forest. Forest Ecology and Management 215: 21-36.
USDA, USDI. 2004. Achieving Healthy Forests and Rangelands: National Fire Plan Performance Update 2004. Washington, DC: U.S. Department of Agriculture and U.S. Department of the Interior. http://www.healthyforests.gov/accomplish-report_2004.pdf
Testing the Modeled Effectiveness of an Operational Fuel Reduction Treatment in a Small Western Montana Interface… Harrington, Noonan-Wright, and Doherty