testing spearman's hypotheses using a bi-factor...
TRANSCRIPT
Intelligence 51 (2015) 79–97
Contents lists available at ScienceDirect
Intelligence
Testing Spearman's hypotheses using a bi-factor model with
WAIS-IV/WMS-IV standardization data☆,☆☆Craig L. Frisby a,⁎, A. Alexander Beaujean b
a Department of Educational, School, and Counseling Psychology, University of Missouri, United Statesb Educational Psychology Department, Baylor University, United States
a r t i c l e i n f o a b s t r a c t
size ofof each
Article history:Received 1 January 2014
Spearman's hypothesis
Edition
Edition (WAIS-IV). Copyright © 2008 NCS PearAll rights reserved.☆☆ Standardization data from the Wechsler(WAIS-IV). Copyright © 2009NCS Pearson, Inc.reserved.
⁎ Corresponding author at: Department of Eing Psychology, 16 Hill Hall, Columbia, MO 6521
E-mail address: [email protected] (C.
http://dx.doi.org/10.1016/j.intell.2015.04.0070160-2896/© 2015 Elsevier Inc. All rights reser
Spearman's hypothesis (SH) is a phrase coined by Arthur Jensen, which posits that theBlack–White mean differences across a group of diverse mental tests is a positive function
proachadingses. Theethodnalysis
Received in revised form 13 April 2015Accepted 16 April 2015Available online 8 June 2015
Keywords:
clearly
G-CFAproachf g andn dataScale-for thelved in
erved.
test's loading onto the general intelligence (g) factor. Initially, a correlated vector (CV) apwas used to examine SH, where the results typically confirmed that the magnitude of g lowere positively correlatedwith the size ofmean group differences in the observed test scorCV approach has been heavily criticized by scholars who have argued that a more precise mfor examining SH can be better investigated using a multi-group confirmatory factor a(MG-CFA). Studies of SH using MG-CFA have been much more equivocal, with results notconfirming nor disconfirming SH.In the current study, we argue that a better method for extracting g in both the CV and Mapproaches is to use a bi-factor model. Because non-g factors extracted from a bi-factor apare independent of g, the bi-factor model allows for a robust examination of the influence onon-g factors on group differences on mental test scores. Using co-normed standardizatiofrom the Wechsler Adult Intelligence Scale-Fourth Edition and the Wechsler MemoryFourth Edition, we examined SHusing both CV andMG-CFA procedures.We found supportweak form of SH in both methods, which suggests that both g and non-g factors were invothe observed mean score differences between Black and White adults.
© 2015 Elsevier Inc. All rights res
Bi-factor modelWechsler Adult Intelligence Scale-FourthWechsler Memory Scale-Fourth Edition
ce (g)
1. Introduction tests that more strongly related to general intelligennomits ar005)as
, with
exhibiting larger group differences (Jensen, 1998). Efforts toancethosees for
, Fourt
Differences between racial, ethnic, and socioecogroups in mean scores on general cognitive ability teswell-established (Gottfredson, 2005; Rushton & Jensen, 2The magnitude of these differences, however, variesfunction of the type of cognitive skills being measured
☆ Standardization data from the Wechsler Adult Intelligence Scale
ut admeand to adiffer-on forroups.e mayson, Inc. Used with permission
Memory Scale, Fourth EditioUsedwith permission. All right
ducational, School, and Counse1, United States.L. Frisby).
ved.
ce.a
explain these patterns in the magnitude of group performdifferences range from non-empirical speculations togrounded in theory and appropriate empirical procedurtesting hypotheses.
1.1. Speculative Explanations
Speculative explanations simply proffer plausible, bhoc, rationales for why a particular group obtains lowerscores than another group. These explanations are not tiecoherent, data-based theory. As one example, “culturalences” is often evoked as a global, all-purpose explanatidiffering performance patterns among population subgThis global explanation typically takes two forms. Som
h.
ns
l-

argue that some subgroups, partly due to economic and socialdisadvantages/differences from the more affluent mainstream,
is th& Tine tond otherroupnd/oereb
s. Firsey are anion ocondaptinf tesBlacmetiy faay fawit
sets that included scores from 149 different tests obtained onsamples of 45,000 Black and 245,000 White examinees, Jensen
Whiteently,s andgroupents.
emoryborne,, littleces indentale tests havenitivees are1985)n the). ForWhitenoldsroups.most
80 C.L. Frisby, A.A. Beaujean / Intelligence 51 (2015) 79–97
are simply not exposed to certain academic stimuli ascasewithmore advantaged subgroups (Eells, 1951; LupiWoo, 1989;White, 1984), and thereby lower scores are dupresumed lack of exposure to tasks such as those foucognitive tests (see specificity doctrine; Jensen, 1984). Omay argue that examinees from different racial/cultural gdisplay different “culturally idiosyncratic” psychological astylistic patterns for interacting with test material, thdepressing scores (see Helms, 1992, 1997).
Speculative explanations suffer from two major flawand fundamentally, findings are explained only after thobserved. Testable hypotheses are not stated first befordata has been collected, which would allow for a rejectthe hypotheses based on patterns shown by the data. Sethese ad hoc explanations are infinitely malleable, adindiscriminately to the idiosyncratic characteristics oitems. As examples, Helms (1997) hypothesized thatexamineesmay fail theWechsler Intelligence Scales Arithitems because of substandard training in school, maComprehension itemsdue to “exposure to racism”, andmDigit Symbol items because they are “uncomfortablepencils as a tool” (p. 522).
1.2. Theory-based explanations: Spearman's hypothesis
rac[testsence]thesi2001thesisces iformainls alss thabein.eroumpleferencatioatterntelli1982sts fod th
g thure ashtoformt dat
man's
haveerbal/erpretigencee testigrantion to, theyexity.”rroll'sded toccom-ntents, andtional-foundts wasnitive
iguingactor-ngs ofsolvedoblemhicles). Forrwardshow
Charles Spearman (1927) initially observed thatdifferences should be “most marked in just thosewhich are known to be saturated with g [general intellig(p. 379). Jensen (1980) later named this Spearman's hypo(SH). There are three levels of SH that Jensen (1998,called the strong form, weak form, and the contra hypoThe strong form posits that any observed race differentest's mean scores are solely a function of g. The weakposits thatwhile race differences in test scoremeans arema function of g, lower-order factors or subtest specificitiecontribute to the difference. The contra hypothesis holdobserved mean score differences are independent of g,solely a function of lower-order factors or test specificity
Support for SH has been borne out from numindependent studies based on large child and adult sa(e.g., Jensen, 1985, 1998) and comprising many difpsychometric tests, such as the Armed Forces QualifiTest (Nyborg & Jensen, 2000), the Kaufman Assessment Bfor Children (Naglieri & Jensen, 1987), the Wechsler Igence Scale for Children-Revised (Jensen & Reynolds,Naglieri & Jensen, 1987; Rushton & Jensen, 2003), and tecollege/graduate school admissions, job selection, anmilitary (Roth, Bevier, Bobko, Switzer, & Tyler, 2001).
There has been some disagreement about interpretinSH literature. Schönemann (1997) interpreted the literatbeing supportive of the weak form of SH. In contrast, Ru(2003) concluded that most studies supported the strongof SH.1 Summarizing his own work from 17 independen
urfaceverbalarison
1 Rushton (1998) proposed that the term Jensen Effect be used whenevethere is a substantial correlation between g loadings and any other variable.
eganssry
teyf,gtkcililh
e]”s).n
yotg
sstny-;re
esn
a
(2001) found that the correlation between Black–differences and g was between .57 and .62. More recDragt (2010) performed a meta-analysis of SH studiefound an average correlation of .85 between g and meantest score differences between Black and White respond
1.2.1. Interpretation of Spearman's hypothesis using tests ofmWhile Jensen's (Jensen & Figueroa, 1975; Jensen & Os
1979) initial interest in SH began with tests of memorywork has been done examining Black–White differenmemory measures. What has been done is mostly inci(i.e., one or two memory subtests in an intelligencbattery), but it tends to indicate both that memory tasksmaller g loadings than other tasks on multi-test cogbatteries and that Black–White differences in mean scoreither considerably reduced on such tests (Jensen, 1980,or that average score for the Black sample is higher thaaverage for the White sample (Jensen & Reynolds, 1982example, in one of the few studies that examined Black–differences in a battery ofmemory tests, Mayfield and Rey(1997) found a consistent factor structure across both gThe Black sample scored higher than theWhite sample onof the memory tests, although the difference was small.
1.3. Empirical challenges to interpretations of Spearhypothesis (SH)
Helms-Lorenz, Van de Vijver, and Poortinga (2003)argued that the constructs of cognitive complexity and vcultural loading are confounded in attempts to properly intresults from tests of SH. They administered two intellbatteries and a computer-assisted elementary cognitivbattery to a large group of Dutch and second-generationm6–12 year old children living in the Netherlands. In additusing factor analysis to compute the subtests' g loadingsgave all subtests two ordinal ratings of “cognitive complOne cognitive complexity rating was based on both Ca(1993) cognitive abilitiesmodelwhile the other corresponthe minimal developmental level needed for successful aplishment (Fischer, 1980). The cultural loadingof subtest cowas rated on an ordinal scale by psychology studentanother rating of each subtest's verbal loading was operaized as the number of words in the subtest. The authorsthat the size of group differences on the intelligence tesbetter predicted by the “cultural” variables than by the cogcomplexity variables.
Although Helms-Lorenz et al. (2003) used an intrmethodology for investigating the relationship between fanalytically derived subtest g loadings and human ratisubtest task characteristics, there are a number of unreissues that challenge their conclusions. The first prconcerns confusion in what Jensen (1998) called the “veof g” versus the g construct itself (Jensen, 1998, p. 309example, cultural differenceswould not explainwhy a FoDigit Span Task and a Backward Digit Span Task wouldwidely discrepant g loadings, despite similarities in the scharacteristics of these tests (particularly in their noncontent). In addition, the composition of the comp
r
groups that Helms-Lorenz et al. used may play a role in theirfindings. Jensen (1998) wrote:
ertieto g)ich il andould
ven inery ip thguag
et asam, theces ingroupimar. 14–, th
ipants, ththane thferen
ed tgroup
xplainarious withests. Anducsentaatelyfacto, thentest'ces inrdizede th
thctedlationgroup-uponweaininolan
s havysis t
investigate SH (Ashton & Lee, 2005;Mulaik, 1992; Schönemann,1997). For example, Colom and Lynn (2004) argued that subtest
other994),nstru-makerassesss mayDolanas theparingle to gsuch a
d col-ubke,t theerpretat thearisongroupces inces in., testished,ast inendedn the), CVorder/differ-
-CFA)ting aparate2009).groupmatedG-CFAng SH).legantalysis.riableecificrs areth the(weakSomehave
sidualversal. If thef there theon thediffer-t biassidual
81C.L. Frisby, A.A. Beaujean / Intelligence 51 (2015) 79–97
Each test score reflects both the level of g and the propof the vehicle of g (the latter being largely unrelatedOne would predict, for example, that the g factor, whhighly and equally loaded in batteries of verbanonverbal tests when given tomonolingual children, whave much smaller g loadings on the verbal tests (giEnglish) than on the nonverbal tests when that battgiven to bilingual children. For the bilingual grouverbal tests would reflect the degree of second-lanacquisition more than they would reflect g (p. 310).
Although the groups studied in the Helms-Lorenz(2003) research are reported to have been exposed to thenumber of (age appropriate) years of Dutch educationalso state “there is evidence that substantial differenknowledge of the Dutch lexicon between the majority-pupils and migrant pupils remain throughout the prschool period, even for second-generation children” (pp15). In the majority of studies that have evaluated SHcomparison groups are comprised of native-born partic(e.g., American blacks and whites). In these studiecomparison groups are more “culturally homogeneous”those in the Helms-Lorenz et al. (2003) study whermigrant students' parents were born in at least five difcountries.
1.4. Methods used to test for Spearman's hypothesis
There are two common methods currently employassess SH: correlated vector (CV) analysis, and multi-confirmatory factor analysis (MG-CFA).
1.4.1. Correlated vector methodA correlated vector (CV) analysis attempts to e
variability in the magnitude of group differences on vtests (or subtests) by correlating the g loading of the testthe size of group differences inmean scores on the same tCV analysis typically involves the following steps: (a) coan exploratory factor analysis (EFA) of the tests in repretive samples of the different comparison groups, separ(b) estimate the similarity (i.e., congruence) of theloadings between groups; (c) if the factors are similarconduct the EFA in the combined sample; (d) correct eachg loading for unreliability; (e) standardize the differenmean scores between the groups; (f) correct each standagroup difference for unreliability; and (g) calculatcorrelation (either Pearson or Spearman) betweencorrected standardized group differences and the correloadings (Jensen, 1985, 1992, 1998). A positive correindicates that tests with higher g loadings have largerdifferences in mean test scores. There is no agreedcorrelation value that differentiates the strong andforms of SH, however, hence support for g's role in determgroup differences can vary greatly between studies (DRoorda, & Wicherts, 2004).
1.4.1.1. Criticisms of the correlated vector method. Scholarleveled a number of criticisms against the use of a CV anal
s.s
see
l.ey
y
ese
et
o
s
t-;r
s
eeg
kg,
eo
g loadings are heavily influenced by the nature of thesubtests included in the battery (see Jensen & Weng, 1hence comparing CV studies that have used different iments to evaluate g may be problematic. Dolan and Ha(2001) argued that the CV procedure does not adequatelymodel fit, thus the factor model used to obtain g loadingnot be the best way to explain the tests' covariances.(2000) opined that making a persuasive argument for gmain contributor to any group differences requires comcompeting models, with the models ascribing a central rofitting the data better than themodels that do not ascriberole to g.
From a somewhat different perspective, Dolan anleagues (Dolan, 2000; Dolan & Hamaker, 2001; Dolan & L2001; Lubke, Dolan, & Kelderman, 2001) argued thacorrelations obtained in a CV analysis are difficult to intwith any degree of specificity, as the method assumes thtests are at least strongly invariant across the compgroups. Strong invariance signifies that any observeddifferences in mean test scores are due to group differenthe constructs that the tests are measuring, not differenhow the test measures the construct across groups (i.ebias). Thus, if the invariance assumption cannot be establthen between-group differences may be attributable, at lepart, to differences in how the tests measure their intconstructs. Even if invariance holds across groups, whetests measure multiple factors (e.g., Wechsler scalesanalysis could mask group differences in lower-domain-specific latent variables by implying that theences are only due to g.
1.4.2. Multi-group confirmatory factor analysis methodThe multi-group confirmatory factor analysis (MG
procedure for assessing group differences involves conducconfirmatory factor analyses (CFAs) simultaneously on sedata from two or more comparison groups (Harrington,MG-CFA is a well established method for investigatingdifferences in the latent means and (co)variances estifrom a latent variablemodel (Millsap, 2011). Moreover, Mhas a number of advantages over a CV analysis for testi(Dolan, 2000; Gustafsson, 1992; Horn, 1997; Millsap, 1997
First, MG-CFA allows for a more integrated and einvestigation of the various steps involved in the CV anSpecifically, MG-CFA requires fitting a single latent vamodel in all groups simultaneously using the group-spdata. Then, in a systematic fashion the model parameteconstrained to be the same across groups, starting wifactor structure (configural invariance), then the loadingsinvariance), and then the intercepts (strong invariance).(e.g., Lubke, Dolan, Kelderman, & Mellenbergh, 2003)advocated a need for assessing the equality of the revariances, too (strict invariance), but there is no uniagreement on this (Little, Card, Slegers, & Ledford, 2007)loadings and intercepts (i.e., the predicted mean oobserved test for a given level of the latent variable) asame across groups, then the between-group differencesmeasured test scores are only due to between-groupences in the latent means, as opposed to measuremenplaying a role in the observed differences. If the re
variances are invariant as well, then the reliability with whichthe test scores measure the latent variables is the same across
nce—es—istronadind ho
ferenthe
In thls thaenceentra
amin
2000chsleensee CVtweeat th. ThegroufactoSH fi
alyzsmen, thek an- anms oThusgrouensed thmakee anficienpoth
rt fodat
& vatasetse aneithe
ethot, anets, sot bst foannoo noeans
correlations, and standard deviations). Consequently, theyargue that the CV approach is better for examining SH—at
ultiple
thoseroach.del toety ofncipalm anman'sne ofof SH.
1996)I areup ofsomenowl-ately
ectualum IIge. Atreaterctor.t. Thisds oniverse,iablessingler theum IIIests ofstrata
G-CFAmodelLubkesinglemon
g. 1a).tum IItest-
asure-l term
actors.factor,ctor. gad, g'ss.nentst of g.pecificy thatn. Likers are
82 C.L. Frisby, A.A. Beaujean / Intelligence 51 (2015) 79–97
groups (Raykov, 2004).Second, the hypothesis of strong factorial invaria
necessity formeaningful interpretation of group differenctested explicitly in MG-CFA. The CV method assumesinvariance, but only assesses for weak invariance via locongruence; moreover, this assessment is done in an afashion.
Third, MG-CFA can compare models that have difconstraints on the model parameter between groups anduse measures to compare how the models fit the data.context of SH, this can be advantageous for testingmodeinclude g in a central role in explaining group differagainst competing models in which g does not play a crole in explaining group differences.
1.5. Using multi-group confirmatory factor analysis to exSpearman's hypothesis
Some investigations of SH have usedMG-CFA. Dolan (applied MG-CFA to standardization data for the WeIntelligence Scale for Children-Revised (WISC-R), which Jand Reynolds (1982) previously analyzed using thapproach. Dolan found support for strict invariance beBlack andWhite groups, lending support to the notion thWISC-R's subtest scores reflected unbiasedmeasurementwere equivocal about the prominence of g causing thedifferences, however, because the first- and higher-ordermodels that they used to represent the different forms ofthe data similarly.
Dolan and Hamaker (2001) used MG-CFA to re-anNaglieri and Jensen's (1987)WISC-R and Kaufman AssesBattery for Children (K-ABC) data. Like Dolan (2000)found support for strict factorial invariance between BlacWhite groups. Also like Dolan, they fit multiple firsthigher-order factor models to represent the different forSH and could not determine what one fit the data best.they were equivocal about g's influence on the observeddifferences in the test scores. Although Naglieri and Jfound a CV-based correlation of .75 between g anmagnitude of Black–White differences, Dolan and Haconcluded that the “repeated demonstration of a positivlarge Spearman correlation is a necessary, but not a sufcondition for inferring the correctness of Spearman's hyesis” (p. 33).
Not all MG-CFA studies of SH have found suppoinvariance. For example, Dolan et al. (2004) reanalyzedfrom two SH studies (Lynn & Owen, 1994; te Nijenhuisder Flier, 1997) that used the CV approach. For both daDolan et al. did not find evidence for strong invariancconcluded that no form of SH could be inferred fromdataset.
Despite the advantages of theMG-CFAmethod, thismalso has critics. For example, Woodley, te Nijenhuis, MusMust (2014) argued that MG-CFA requires large datasstudies of SH that used small datasets “simply cannanalyzed, hence the information contained in them is lothe purposes of accumulation” (p. 30). Second, MG-CFA cbe used for a meta-analysis of SH because most studies dreport sufficient information (i.e., within-group m
asggc
tnetsl
e
)rn
neyprt
etyddf,pnerdt-
ran,dr
ddoertt,
least when meta-analytically combing data from mstudies.
1.6. Factor models used to test Spearman's hypothesis
Studies that have examined SH fall into two groups:that use a MG-CFA approach and those that use a CV appThe MG-CFA studies all used a higher-order factor morepresent g. Studies that used CV measured g in a variways, ranging from the first component of a pricomponents analysis, to the first unrotated factor froEFA, to the general factor extracted from Schmid and Lei(1957) orthogonal transformation. We contend that nothese are the optimal way tomodel g for an investigation
1.6.1. Higher-order factor modelsTo explain factor models, we use Carroll's (1993,
strata terminology and conceptualization. At Stratumnarrow factors, which influence a homogenous grointellectual tasks. There are many factors at Stratum I,examples of which are Inductive Reasoning, Lexical Kedge, and Working Memory. At Stratum II are approxim10 broad factors, which influence a wider range of intelltasks than Stratum I factors. Some examples of Stratfactors are Fluid Reasoning and Comprehension KnowledStratum III is the single g factor, which influences a grange and diversity of intellectual tasks than any other fa
The difference between the strata is breadth of contenis because the presence of factors at a given strata depenthe data being analyzed. If the variables are sufficiently dthen gwill likely be present; with datasets containing varwith homogenous content (e.g., alternate forms of atest), typically only Stratum I factors are present. Focurrent study, we only focus on Stratum II and Stratbecause factors derived from individually-administered tcognitive ability can typically be classified at one of those(Carroll, 1995).
To date, the studies that have examined SHusing theMapproach have all used a higher-order factor (HOF)(Dolan, 2000; Dolan & Hamaker, 2001; Dolan et al., 2004;et al., 2001). HOF models of cognitive ability define g as aStratum III (second-order) factor that explains all the comvariance among the Stratum II (first-order) factors (see FiThe observed test scores have three direct influences: Strafactors, test-specific factors, and measurement error. Thespecific factors typically cannot be distinguished from mement error, so they are amalgamated into a single residuathat is uncorrelated with all other factors.
In HOF models, g directly influences all the Stratum II fTo the extent that g is highly correlated with a Stratum IIhigher levels of g produce higher levels of the Stratum II fadoes not directly influence the observed test scores. Insteinfluence on the tests is mediated by the Stratum II factor
Stratum II factors can be decomposed into two compoin HOFmodels: the part due to g and the part independenThe part that is independent of g is the Stratum II-sfactor, which explains individual differences in the abilitthe Stratum II factor represents beyondwhat g can explaithe test-specific factors, the Stratum II-specific facto
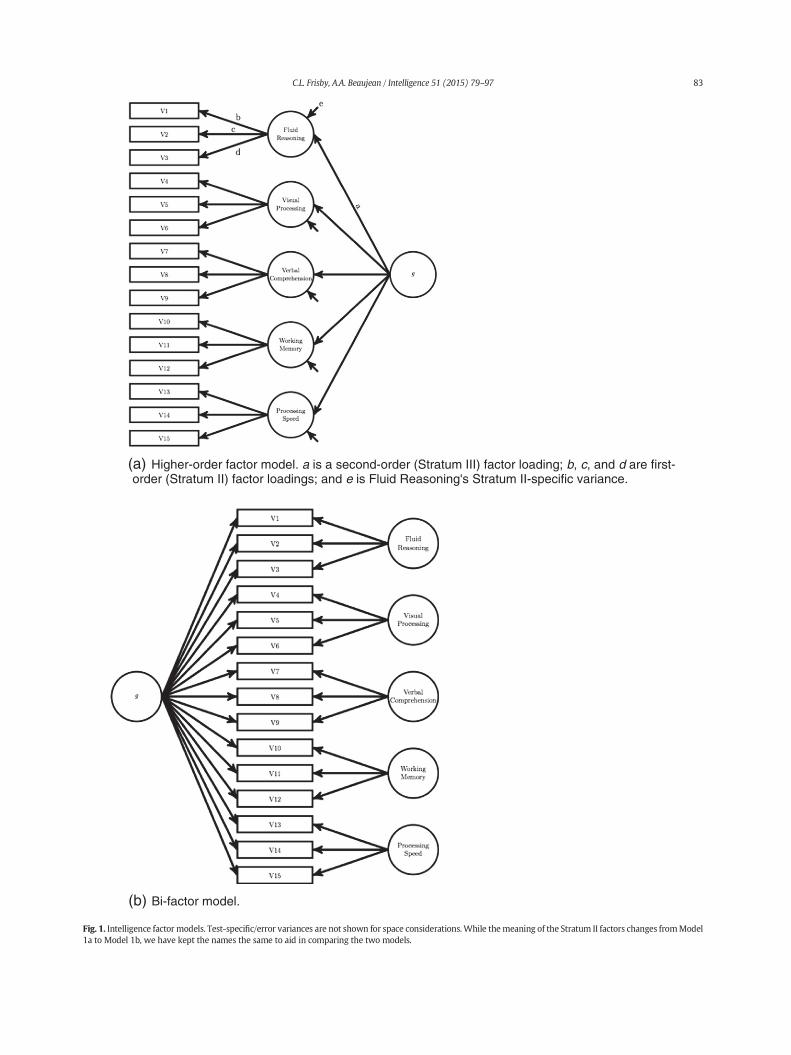
(a) Higher-order factor model. a is a second-order (Stratum III) factor loading; b, c, and d are first-order (Stratum II) factor loadings; and e is Fluid Reasoning's Stratum II-specific variance.
(b) Bi-factor model.
Fig. 1. Intelligence factor models. Test-specific/error variances are not shown for space considerations.While themeaning of the Stratum II factors changes fromModel1a to Model 1b, we have kept the names the same to aid in comparing the two models.
83C.L. Frisby, A.A. Beaujean / Intelligence 51 (2015) 79–97

residuals and are typically uncorrelatedwith all other variables.The total variance of a Stratum II factor, then, is an amalgam of
ratum
factoodelgencignace tesy howig. 11 caehlinplyining oof g'en g'
pos999)samto thraine
nderrker'how
racinte thon V1y thpecifiV1 ttor os tha
probblemiablesuc004)
lity omati1997ns artionstumfactoactorissuefoun-ordegrou
ion oeima
(1957). While the Schmid–Leiman transformation can aid inthe interpretation of higher-order model's Stratum II factors, it
only' con-
nsfor-ate alliablesof theesults) thatelatedr case,ia the
ores isns arey, theto thet haveith anactorsereasat the012).
entionrdless
Therefactorof thefactora SLT); theer CFAly, thets in a-order
re aremorewith, Zhu,will
tum IILargerover-
some-offersnd the
modelmodels.
84 C.L. Frisby, A.A. Beaujean / Intelligence 51 (2015) 79–97
the variance attributable to g and that attributable to StII-specific factors.
1.6.1.1. Problematic issues associated with higher-ordermodels. There are multiple drawbacks of HOF factor mwhen studying a multidimensional trait such as intelli(Chen, Hayes, Carver, Laurenceau, & Zhang, 2012; G2007). In these models, g does not directly influence thscores. Thus, its influence on the test scores is limited bwell the test scores measure the Stratum II factors. Fillustrates this principle. The relationship between g and Vbe calculated using the tracing rules for a path model (Lo2004). Specifically, the relationship is calculated bymultiV1's loading on Fluid Reasoning by Fluid Reasoning's loadg (i.e., b × a). If b = .30 and a = .50, then the magnituderelationship toV1 is .30× .50= .15. If b increases to .65, threlationship with V1 increases to .65 × .50 = .33.
Another drawback of HOF models is that they improportionality constraints (Yung, Thissen, & McLeod, 1Specifically, for a given set of tests influenced by theStratum II factor, the ratio of the test scores' variance dueStratum II factor to the variance attributable to g is constto be the same.
Proportionality constraints can be a challenge to ustand clearly, so we follow Beaujean, Parkin, and Pa(2014) explanation using Fig. 1a. We previously showedto calculate the relationship between g and V1 using trules. We can use the same tracing rules to compuinfluence of Fluid Reasoning's Stratum II-specific factorSpecifically, multiply V1's loading on Fluid Reasoning bstandard deviation of Fluid Reasoning's Stratum II-sfactor (e.g., b� ffiffiffi
ep
). The ratio of g's indirect influence onthe influence of Fluid Reasoning's Stratum II-specific facV1 is exactly the same for the other observed test scoreFluid Reasoning influences: V2, and V3. Specifically,
b� ab� ffiffiffi
ep ¼ c� a
c� ffiffiffie
p ¼ d� ad� ffiffiffi
ep
These forced proportional loading patterns can belematic. First, the constraints cause multicollinearity prowhen using both g and Stratum II factors as predictor var(Beaujean et al., 2014). Second, it is unlikely thatconstraints occur in a population (Schmiedek & Li, 2Although some have empirically assessed the tenabiproportionality constraints and not found them proble(e.g., Dolan & Hamaker, 2001), Mulaik and Quartetti (argued that the sample sizes needed for such investigatiomuch larger than what is typically used in SH investigaThird, proportionality constraints confound g and Strafactors in HOF models because the second-orderstructure is just a re-expression of the Stratum II fcorrelations (Reise, 2012). A combination of the last twocould possibly explain why previous SH studiesequivalent fit between HOF models and oblique firstmodels, and, subsequently, could not determine ifdifferences were due to g or Stratum II factors.
These criticisms apply just as well to any transformatHOF model such as the one developed by Schmid and L
rse,t
an,gnss
e.eed
-s
ge.econt
-ssh.fc)e.IIrssdrp
fn
does not release the proportionality constraints. It isthrough a bi-factor model that the Stratum II factorsstraints on g are released.
1.6.2. Schmid–Leiman transformation (SLT)Schmid and Leiman (1957) developed a matrix tra
mation that some use with higher-ordermodels to calculthe direct and indirect influences on the indicator varsimultaneously (Reynolds & Keith, 2013). Another useSchmid–Leiman transformation (SLT) is to combine the rfrom an EFA on observed test scores (i.e., first-order EFAhave oblique (correlated) factors and an EFA of the corrfactors (i.e., second-order EFA; Gorsuch, 1983). In eithethe SLT produces g loadings for the observed test scores vtechnique discussed in Section 1.6.1.1.
In the SLT, the common variance among all the test screpresented as a general factor, while narrower domairepresented as residual Stratum II factors. ConsequentlStratum II factors are orthogonal to each other as well asgeneral factor. Thus, Stratum II factors from a SLT do nothe same interpretation as those from a Stratum II EFA woblique rotation. In the oblique rotation, the Stratum II freflect variance from both g and the Stratum II factors, whin the SLT the Stratum II factors only reflect varianceStratum II factor level that is unexplained by g (Reise, 2Despite the differences in factor construction, the convhas been to call Stratum II factors by the same name regaof how they were formed (e.g., Carroll, 1996).
1.6.2.1. Problems with the Schmid–Leiman transformation.are two major problems with the SLT. First, the directloadings produced by the SLT are merely a re-expressioncorrelations among the Stratum II factors. Thus, theloadings of an EFA with correlated Stratum II factors andof the EFA's factor loading are equivalent (Schmid, 1957same can also be said for the loadings from a higher-ordand a SLT of those loadings (Yung et al., 1999). ConsequentSLT does not do away with the proportionality constrainHOF model and imposes the constraints on the secondEFA.
A second major problem of the SLT occurs when thecross-loadings (i.e., some of the observed tests load ontothan one Stratum II factor), which are not uncommonindividually-administered intelligence tests (Weiss, Keith& Chen, 2013a, 2013b). In such situations, the SLToverestimate the g loadings and underestimate the Strafactor loadings (Reise, Moore, & Haviland, 2010).Stratum II cross-loadings produce larger amounts of theor underestimation (Reise, 2012).
1.6.3. Bi-factor modelsThe bi-factor model (Holzinger & Swineford, 1937),
times called a direct hierarchical or nested-factorsmodel,an alternative to both theHOF in theMG-CFA approach asecond-order EFA in the CV approach.2
2 Technically, the bi-factor model is a generalization of the HOF(Gignac, 2008; Yung et al., 1999), but we consider them as two distinct
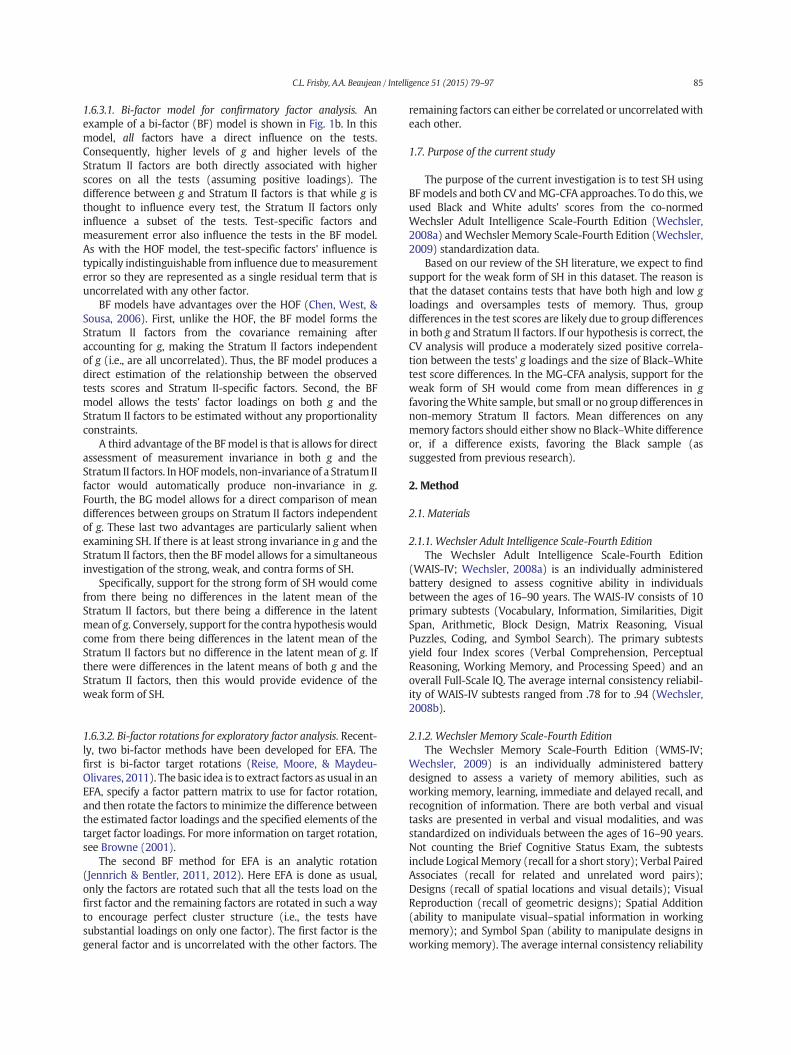
1.6.3.1. Bi-factor model for confirmatory factor analysis. Anexample of a bi-factor (BF) model is shown in Fig. 1b. In this
testsf thighe. Thle g ionl
s andodence imenhat i
est, &s thafte
ndenuceservedhe Bd thnalit
direcd thtum Iin gmeanndenwhend thneou.comof thlatenould
of thf g. Id thof th
remaining factors can either be correlated or uncorrelatedwitheach other.
usingis, wermedhsler,hsler,
o findson islow ggroupencesct, therrela-Whiteor thes in gces inany
rencee (as
ditionsteredidualsof 10, DigitVisualbtestseptualnd anliabil-hsler,
85C.L. Frisby, A.A. Beaujean / Intelligence 51 (2015) 79–97
model, all factors have a direct influence on theConsequently, higher levels of g and higher levels oStratum II factors are both directly associated with hscores on all the tests (assuming positive loadings)difference between g and Stratum II factors is that whithought to influence every test, the Stratum II factorsinfluence a subset of the tests. Test-specific factormeasurement error also influence the tests in the BF mAs with the HOF model, the test-specific factors' influetypically indistinguishable from influence due tomeasureerror so they are represented as a single residual term tuncorrelated with any other factor.
BF models have advantages over the HOF (Chen, WSousa, 2006). First, unlike the HOF, the BF model formStratum II factors from the covariance remainingaccounting for g, making the Stratum II factors indepeof g (i.e., are all uncorrelated). Thus, the BF model proddirect estimation of the relationship between the obstests scores and Stratum II-specific factors. Second, tmodel allows the tests' factor loadings on both g anStratum II factors to be estimated without any proportioconstraints.
A third advantage of the BF model is that is allows forassessment of measurement invariance in both g anStratum II factors. InHOFmodels, non-invariance of a Strafactor would automatically produce non-invarianceFourth, the BG model allows for a direct comparison ofdifferences between groups on Stratum II factors indepeof g. These last two advantages are particularly salientexamining SH. If there is at least strong invariance in g anStratum II factors, then the BF model allows for a simultainvestigation of the strong, weak, and contra forms of SH
Specifically, support for the strong form of SH wouldfrom there being no differences in the latent meanStratum II factors, but there being a difference in themean of g. Conversely, support for the contra hypothesis wcome from there being differences in the latent meanStratum II factors but no difference in the latent mean othere were differences in the latent means of both g anStratum II factors, then this would provide evidenceweak form of SH.
1.6.3.2. Bi-factor rotations for exploratory factor analysis. Recently, two bi-factor methods have been developed for EFA. Th
ydeul in anationtweenof thation
tationusuan tha wahavis ths. Th
S-IV;atterych asll, andvisuald wasyears.btestsPairedairs);Visualditionrkinggns inability
first is bi-factor target rotations (Reise, Moore, & MaOlivares, 2011). The basic idea is to extract factors as usuaEFA, specify a factor pattern matrix to use for factor rotand then rotate the factors to minimize the difference bethe estimated factor loadings and the specified elementstarget factor loadings. For more information on target rotsee Browne (2001).
The second BF method for EFA is an analytic ro(Jennrich & Bentler, 2011, 2012). Here EFA is done asonly the factors are rotated such that all the tests load ofirst factor and the remaining factors are rotated in suchto encourage perfect cluster structure (i.e., the testssubstantial loadings on only one factor). The first factorgeneral factor and is uncorrelated with the other factor
.eresy
l.sts
erta
Fey
teI.
t
es
eet
efee
-e-
,
e,
l,eyeee
1.7. Purpose of the current study
The purpose of the current investigation is to test SHBFmodels and both CV andMG-CFA approaches. To do thused Black and White adults' scores from the co-noWechsler Adult Intelligence Scale-Fourth Edition (Wec2008a) andWechsler Memory Scale-Fourth Edition (Wec2009) standardization data.
Based on our review of the SH literature, we expect tsupport for the weak form of SH in this dataset. The reathat the dataset contains tests that have both high andloadings and oversamples tests of memory. Thus,differences in the test scores are likely due to group differin both g and Stratum II factors. If our hypothesis is correCV analysis will produce a moderately sized positive cotion between the tests' g loadings and the size of Black–test score differences. In the MG-CFA analysis, support fweak form of SH would come from mean differencefavoring theWhite sample, but small or no group differennon-memory Stratum II factors. Mean differences onmemory factors should either show no Black–White diffeor, if a difference exists, favoring the Black samplsuggested from previous research).
2. Method
2.1. Materials
2.1.1. Wechsler Adult Intelligence Scale-Fourth EditionThe Wechsler Adult Intelligence Scale-Fourth E
(WAIS-IV; Wechsler, 2008a) is an individually adminibattery designed to assess cognitive ability in indivbetween the ages of 16–90 years. The WAIS-IV consistsprimary subtests (Vocabulary, Information, SimilaritiesSpan, Arithmetic, Block Design, Matrix Reasoning,Puzzles, Coding, and Symbol Search). The primary suyield four Index scores (Verbal Comprehension, PercReasoning, Working Memory, and Processing Speed) aoverall Full-Scale IQ. The average internal consistency reity of WAIS-IV subtests ranged from .78 for to .94 (Wec2008b).
2.1.2. Wechsler Memory Scale-Fourth EditionThe Wechsler Memory Scale-Fourth Edition (WM
Wechsler, 2009) is an individually administered bdesigned to assess a variety of memory abilities, suworking memory, learning, immediate and delayed recarecognition of information. There are both verbal andtasks are presented in verbal and visual modalities, anstandardized on individuals between the ages of 16–90Not counting the Brief Cognitive Status Exam, the suinclude LogicalMemory (recall for a short story); VerbalAssociates (recall for related and unrelated word pDesigns (recall of spatial locations and visual details);Reproduction (recall of geometric designs); Spatial Ad(ability to manipulate visual–spatial information in womemory); and Symbol Span (ability to manipulate desiworking memory). The average internal consistency reli

of these subtests ranged from .82 to .97 (Wechsler, Holdnack, &Drozdick, 2009).
IV corougus ogeo
e, sedentsWhituse
es ar
ta oscorsingdentmbehom
ith n31
tests
n thly thg datandsigns
and Spatial Addition subtests. In addition, there were 276respondents missing data on Figure Weights, Letter-Number
sub-
to thegness;ge ofetter-Addi-valuesr thanose toimumnlikedata
ave toissing
roach
someiablesBlackbinede firstIV androups.
86 C.L. Frisby, A.A. Beaujean / Intelligence 51 (2015) 79–97
2.2. Participants
Participants were members the WAIS-IV and WMS-normative sample, which is made up of adults aged 16 th90 years. The sample closely matched the 2005 censgender, age, race/ethnicity, parent education level, andgraphic region. For more information about the samplWechsler et al. (2009). There were 1250 total respon1015 of whom identified as either Black (n = 180) or(n = 835). Only the Black and White respondents werefor this study. Descriptive statistics for the subtest scorgiven in Table 1.
2.2.1. Missing dataThere were 737 respondents with no missing da
any of the WAIS-IV subtests, 1 respondent missing aon the Picture Completion subtest, 1 respondent misscore on the Cancellation subtest, and 276 responmissing data on the Figure Weights, Letter-NuSequencing, and Cancellation subtests, almost all of wwere age 70 or above. There were 700 respondents wmissing data on any of the WMS-IV subtests andmissing data on the Designs and Spatial Addition suball age 70 or above.
There were 699 respondents with no missing data oWAIS-IV or WMS-IV subtests, 1 respondent missing onscore on the Cancellation subtest, 38 respondents missinon only the Designs and Spatial Addition subtests,respondents missing data on the Picture Completion, De
Table 1Descriptive statistics for Wechsler Adult Intelligence Scale-Fourth Edition (W
Battery Subtest n
WAIS-IV Block Design 1015WAIS-IV Matrix Reasoning 1015WAIS-IV Figure Weights 739WAIS-IV Picture Completion 1014WAIS-IV Symbol Search 1015WAIS-IV Coding 1015WAIS-IV Cancellation 738WAIS-IV Vocabulary 1015WAIS-IV Information 1015WAIS-IV Comprehension 1015WAIS-IV Similarities 1015WAIS-IV Arithmetic 1015WAIS-IV Digit Span 1015WAIS-IV Letter-Number Sequencing 739WAIS-IV Visual Puzzles 1015WMS-IV Logical Memory I 1015WMS-IV Logical Memory II 1015WMS-IV Visual Reproduction I 1015WMS-IV Visual Reproduction II 1015WMS-IV Verbal Paired Associates I 1015WMS-IV Verbal Paired Associates II 1015WMS-IV Designs I 700WMS-IV Designs II 700WMS-IV Spatial Addition 700WMS-IV Symbol Span 1015
-hn-e,ede
neasr
o5,
eea1,
Sequencing, Cancellation, Designs, and Spatial Additiontests, all age 70 or above.
The majority of the missing data are missing duedesign of the data collection (e.g., planned missinMcArdle, 1994). That is, respondents above the a70 years were not administered the Figure Weights, LNumber Sequencing, Cancellation, Designs, and Spatialtion subtests. While deleting respondents with missingon these variables (i.e., only keeping respondents younge70 years) would likely not bias the results, we instead chhandle the missing data using full information maxlikelihood (FIML) estimation (Enders & Bandalos, 2001). Utraditional ML estimation, FIML makes use of all theavailable from each respondent so respondents do not hbe removed from the dataset because they were mvalues.
2.3. Data analysis
We tested SH using two methods, the CV app(Method 1) and a MG-CFA approach (Method 2).
2.3.1. Method 1: correlated vector analysisWe followed the steps outlined in Section 1.4.1, with
modifications. First, we group centered the var(i.e., created mean deviation scores separately for theandWhite groups) before conducting the EFA in the comgroup. Second, as thereweremissing values in the data,wcreated FIML-based correlationmatrices of all theWAIS-WMS-IV subtests for the Black, White, and combined g
AIS-IV) and Wechsler Memory Scale-Fourth Edition (WMS-IV) subtests.
Mean SD Skew Kurtosis
10.22 2.98 0.02 −0.3510.30 3.02 −0.01 −0.5010.40 3.02 0.01 −0.3010.14 3.03 −0.22 −0.3910.14 2.91 0.09 0.0510.17 2.92 −0.03 −0.129.99 2.89 0.38 0.20
10.30 2.92 0.13 −0.1410.06 3.05 0.06 −0.5010.49 3.07 −0.04 −0.2210.28 2.85 −0.15 0.0110.24 2.85 0.10 −0.4210.26 2.80 0.19 −0.0210.39 3.00 0.82 1.4710.19 3.05 0.38 −0.4610.10 3.02 −0.26 −0.249.95 2.94 −0.18 0.01
10.12 3.09 −0.32 0.1210.02 3.12 0.13 0.249.91 2.98 0.06 −0.249.88 3.00 −0.41 −0.19
10.11 3.01 −0.06 −0.2410.01 3.04 −0.07 0.0610.07 3.07 −0.26 −0.4310.07 3.00 −0.03 −0.35
Weused these correlationmatrices for the EFAs. To calculate g-loadings, we used the analytic bi-factor rotation. To assess
s, w& tenilaritor th
ce bwhichndardslighstein
ð1
k andective this th
of thbtestue trcherMS-IVitted
s wadMG
AIS-IVlac, &ez, &Wardn theithensionpeed2012Fluidpeedtudiests tfourratinl and
odelS-IV
medidiatll thirvenpreviicult
including both Immediate and Delayed WMS-IV subtests isthat it produces specification errors and inadmissible
icker,factorrabee,ler, &n theet al.,btestsrking.factorently.study,ipantsyears.e firstehen-ork-
y, andmodelnsion,mory,
a andfactorerbalmory,rder gmodelfit theme aserbal
ocess-ts theparate, thisersion
ts andfromr theonly
ted inchslerviousg androups
it, wethat
ayson,rativeationRMR),dition,ortedyesiand forion of
87C.L. Frisby, A.A. Beaujean / Intelligence 51 (2015) 79–97
factor similarity between the Black and White groupestimated the congruence coefficients (Lorenzo-SevaBerge, 2006), with values ≥ .95 indicating sufficient simfor g and values ≥ .85 indicating sufficient similarity fother factors (te Nijenhuis & van der Flier, 2003).
We measured the Black–White standardized differencalculating Hedges (1981) effect size (ES) measure,expresses the mean difference between groups in stadeviation units. We used Hedges' ES as it corrects for thebias in the more commonly used d effect measure (Boren2009). The ES formula is given in Eq. (1).
ES ¼ 1−3
4 dfð Þ−1
� �xW−xBffiffiffiffiffiffiffiffiffiffiffiffiffiffiffiffiffiffiffiffiffiffiffiffiffiffiffiffiffiffiffiffiffiffiffiffiffiffiffiffiffiffiffiffiffiffiffiffiffi
nw−1ð Þs2W þ nB−1ð Þs2Bdf
s
where, xB and xW are the mean scaled scores of the BlacWhite groups, respectively, sB
2 and sW2 are the resp
variances for the Black and White groups, and df ardegrees of freedom calculated as nW + nB − 2, where niith group's sample size.
We conducted the CV analyses using two versionsWAIS-IV/WMS-IV data. In the first version, we used all suwithin both the WAIS-IV and WMS-IV batteries. Dstatistical problems experienced by previous reseausing both immediate and delayed versions of the Wsubtests (see Section 2.3.2), in the second analysis we omthe WMS-IV immediate subtests. This second analysiconducted in order to compare the results from the CVanCFA analyses.
2.3.2. Method 2: multi-group confirmatory factor analysisIndependent factor analytic studies of the W
(e.g., Benson, Beaujean, & Taub, in press; Benson, HuKranzler, 2010; Gignac & Watkins, 2013; Nelson, CanivWatkins, 2013; Niileksela, Reynolds, & Kaufman, 2013;Bergman, & Hebert, 2012; Wechsler, 2008b) have showscale to reflect four or five latent variables, mapping ontothe four WAIS-IV index scores (Verbal ComprehePerceptual Reasoning, Working Memory, Processing Sor the Cattell–Horn–Carroll (Schneider & McGrew,theory (Comprehension Knowledge, Visual Processing,Reasoning, Short Term Memory, and Processing Srespectively. The difference in factor models between slikely comes from whether the model allowed the subtehave cross-loadings. Weiss et al. (2013a) argued that theand five-factor models were both sufficient for demonstmodel fit and full factorial invariance between clinicanonclinical samples.
There have been some difficulties in forming CFA mwith WMS data (Wechsler et al., 2009, p. 6). In the WMsome subtests require examinees to recall stimuli imately after presentation (subtests comprising the ImmeIndex), while other subtests ask examinees to recastimuli after a delayed period of time after which inteing and nonrelated subtests have been administeredously (subtests comprising the Delayed Index). The diff
e
ye
y
t,
Þ
eee
esos
s-
,er,))
)so-g
s,-es--y
parameter estimates (Millis, Malina, Bowers, & R1999; Price, Tulsky, Millis, & Weiss, 2002). Thus, mostanalyses of theWMS-IV data (e.g., Holdnack, Zhou, LarMillis, & Salthouse, 2011; Miller, Davidson, SchindMessier, 2013; Salthouse, 2009), including those iWMS-IV technical and interpretive manual (Wechsler2009, p. 60), only include one version of these su(usually the delayed) along with the two visual womemory measures (Spatial Addition and Spatial Span)
There have been a few studies examining thestructure of the WAIS-IV and WMS-IV subtests concurrHoldnack et al. (2011) completed the most thoroughexamining thirteen different models in the 900 particfrom the co-norming sample between the ages of 16–69They found two models fit the data relatively well. Thmodel included seven Stratum II factors (Verbal Comprsion, Perceptual Reasoning, Processing Speed, Auditory Wing Memory, Visual Working Memory, Auditory MemorVisual Memory) without a g factor. The secondcontained five Stratum II factors (Verbal ComprehePerceptual Reasoning, Processing Speed, Working Meand Long-Term Retrieval) and a higher-order g factor.
Miller et al. (2013) analyzed WAIS-IV/WMS-IV datfound a model similar to Holdnack et al.'s (2011) five-model. Specifically, they found five Stratum II factors (VComprehension, Perceptual Reasoning, Working MeProcessing Speed, and Delayed Memory) and a higher-ofactor fit their data best. Salthouse's (2009) found that awith six Stratum II factors and a higher-order g factorWAIS-IV/WMS-IV analysis best. Four factors were the sathose from Miller et al.'s and Holdnack et al.'s studies (VComprehension, Fluid Reasoning, Working Memory, Pring Speed). The difference is that Salthouse's model spliDelayedMemory/Long-Term Retrieval factor into two sefactors: Verbal Memory, and Visual Memory. Likelydifference stems from Salthouse using the immediate vof the WMS-IV subtests instead of the delayed.
For our MG-CFA study, we used all WAIS-IV subtesonly the delayed and visual working memory subteststhe WMS-IV. We chose the delayed subtests oveimmediate tests because those are the ones most commused and are the ones used in the factor analyses reporthe WMS-IV technical and interpretive manual (Weet al., 2009). Our investigation differs from preinvestigations in that we used a BF model to extracttested for invariance between the Black and White gbefore evaluating SH.
2.3.2.1. Determining model fit. To determine model fexamined multiple indices (McDonald & Ho, 2002)represent a variety of fit criteria (Marsh, Hau, & Gr2005). Specifically,we examined (a) theχ2, (b) the compafit index (CFI), (c) root mean square error of approxim(RMSEA), (d) standardized root mean square residual (Sand (e) Mcdonald's non-centrality index (Mc). In adfollowing Boomsma's (2000) recommendationwe also repAkaike's information criterion (AIC) and Schwarz's Bainformation criterion (BIC). For all models, we lookepatterns in the fit statistics, and judged acceptance/reject

the specificmodel based on themajority of the indices.We usedthe following criteria for overall model fit: (a) CFI ≥ .96 (Yu,
entleritta, &ferendicatuegeiancein CF09 ar
l prousinkagesassesujea
ng aataseterioalysifacto). ThfactoF3),facto
We calculated the congruence coefficient (CC) from EFAsapplied to Black andWhite groups separately. The CC was 1.00
e CCsmplesn. Thealysisn thedard-le the
p CFAarallelfactor). It isF1), ar (F3),
ctors.k andtic BFgivencted gdiffer-rman
iablesWMS-
88 C.L. Frisby, A.A. Beaujean / Intelligence 51 (2015) 79–97
2002); (b) RMSEA ≤ .08 (Browne & Cudeck, 1993; Hu & B1999); (c) SRMR ≤ .08, (Hu & Bentler, 1999; Sivo, Fan, WWillse, 2006); (d)Mc N .90.While AIC and BICmeasure difaspects of model fit, for both measures smaller values inbetter approximations of the true model (Markon & Kr2004). When specifically comparing models for invarMeade, Johnson, and Braddy (2008) suggest that changesvalues of .002 and changes in Mc values between .008–.0useful cutoff points.
All analyses were conducted using the R statisticagramming language (R. Development Core Team, 2014),the psych (Revelle, 2012) and lavaan (Rosseel, 2012) pacTo conduct the EFA, fit the latent variable models, andinvariance in R, we followed the steps outlined in Bea(2014a, 2014b).
3. Results
3.1. Method 1: correlated vectors
3.1.1. All subtestsWe conducted the first step of the CV analyses usi
subtests in the WAIS-IV and WMS-IV co-normed dVelicer's (1976) minimum average partial (MAP) crisuggested 2 factors, while Horn's (1965) parallel ansuggested 4–8 factors. We believe that the seven-solution made the most interpretive sense (see Table 2extracted factors consist of g, a Verbal Comprehension(F1), a Logical Memory factor (F2), a Designs factor (Verbal Paired Associates factor (F4), a Processing Speed(F5), and a Short–Term Memory factor (F6).
Table 2
Results from exploratory factor analysis of all subtests extracting seven factorFactor pattern coe
Battery Test g F1
WAIS-IV Figure Weights 0.71 0WMS-IV Visual Reproduction I 0.68 −0WAIS-IV Visual Puzzles 0.67 −0WAIS-IV Matrix Reasoning 0.66 0WMS-IV Symbol Span 0.66 0WAIS-IV Block Design 0.65 −0WAIS-IV Arithmetic 0.65 0WAIS-IV Digit Span 0.62 0WAIS-IV Similarities 0.61 0WMS-IV Spatial Addition 0.61 0WAIS-IV Vocabulary 0.59 0WMS-IV Visual Reproduction II 0.59 −0WAIS-IV Comprehension 0.59 0WAIS-IV Information 0.59 0WMS-IV Verbal Paired Associates I 0.58 −0WMS-IV Logical Memory I 0.58 0WAIS-IV Letter–Number Sequencing 0.58 0WAIS-IV Picture Completion 0.58 0WMS-IV Verbal Paired Associates II 0.55 −0WMS-IV Logical Memory II 0.54 0WAIS-IV Coding 0.52 0WAIS-IV Symbol Search 0.51 −0WMS-IV Designs I 0.50 −0WMS-IV Designs II 0.44 −0WAIS-IV Cancellation 0.38 −0
Note. Factors were rotated using analytic bi-factor rotation. Subtests are prese
,
ter,,Ie
-g.sn
llt.nsrerar
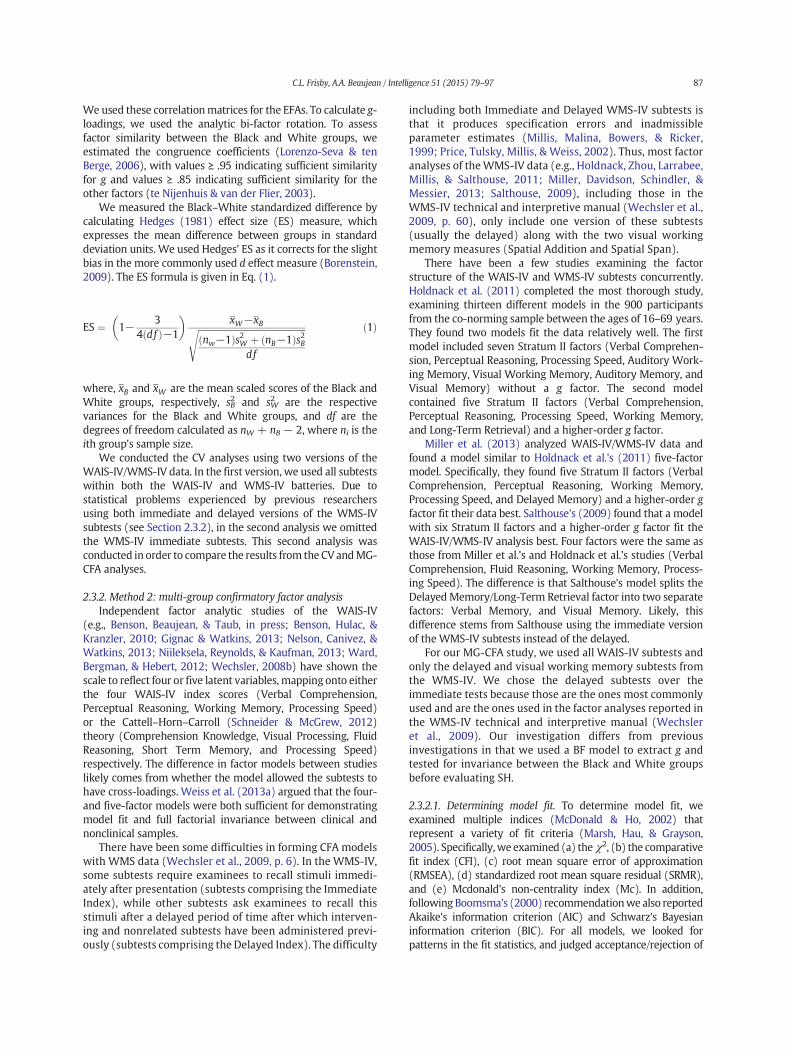
for g and had values ≥ .87 for all the other factors. Since thwere sufficiently high, we combined Black and White saand extracted the g loadings from an analytic BF rotatiosubtest data we used for the correlated vectors (CV) anare given in Table 3. The Pearson correlation betweecorrected g loadings and the corrected Black-White stanized differences was 0.58 (95% CI: 0.53–0.62), whiSpearman correlation was .62 (95% CI: .58–.66).
3.1.2. All subtests except WMS-IV immediateWe performed this analysis to mirror the multi-grou
we conducted. MAP criterion suggested 2 factors, while panalysis suggested 2–5 factors. We believe that the five-solution made the most interpretive sense (see Table 4comprised of g, a Comprehension Knowledge factor (Processing Speed factor (F2), a Working Memory factoand a Visual Spatial Factor (F4).
The CC for gwas 1.00, andwas ≥ .89 for all the others faSince the CCs were sufficiently high, we combined BlacWhite samples and extracted the g loadings from an analyrotation. The subtest data we used for the CV analysis arein Table 5. The Pearson correlation between the correloadings and the corrected standardized Black–Whiteences is 0.57 (95% CI: 0.53–0.61), while the Speacorrelation is .65 (95% CI: .61–0.68).
3.2. Method 2: multi-group confirmatory factor analysis
3.2.1. Testing assumptionsA major assumption of SEM is that the manifest var
are multivariate normal (Kline, 2012). All WAIS-IV and
s using the combined sample (n = 1015).
fficients
F2 F3 F4 F5 F6
.11 −0.12 −0.03 −0.05 −0.02 0.05
.06 −0.11 0.11 −0.02 0.04 −0.21
.06 −0.20 0.00 −0.15 −0.02 −0.14
.04 −0.15 0.04 −0.07 0.04 0.00
.00 −0.03 0.18 0.02 0.05 0.03
.02 −0.21 0.04 −0.18 0.02 −0.13
.19 −0.04 −0.04 −0.07 −0.01 0.21
.05 −0.04 0.00 −0.04 0.08 0.55
.48 0.03 −0.08 −0.04 −0.06 0.01
.02 −0.14 0.12 −0.08 0.10 0.07
.66 0.05 −0.03 0.04 0.00 0.05
.12 −0.05 0.15 0.03 0.00 −0.20
.52 0.05 −0.02 −0.03 −0.03 0.02
.50 −0.02 −0.06 −0.07 −0.04 −0.05
.02 0.08 0.04 0.68 −0.01 0.01
.03 0.69 −0.03 0.03 −0.03 0.02
.03 −0.09 −0.02 −0.03 0.03 0.46
.00 −0.01 0.00 −0.09 0.09 −0.08
.01 0.07 0.03 0.74 −0.03 −0.03
.02 0.76 −0.03 0.09 −0.01 −0.05
.00 0.00 0.02 −0.03 0.57 0.08
.04 −0.04 0.01 −0.04 0.65 −0.01
.04 −0.03 0.74 0.01 0.05 −0.03
.04 −0.02 0.69 0.07 −0.03 0.03
.10 −0.04 0.11 −0.03 0.37 0.07
nted in descending order of their g loadings.

IV univariate subtest skewness values were b 2 and all kurtosisvalues were b 7, so were in acceptable limits (West, Finch, &
skew2,p =ariatlottedsamersen
2012). Consequently, we believe that the data approximate amultivariate normal distribution.
A, weerbal, andr thiset the
Table 3Data used in correlated vectors analysis of all subtests.
Battery Test ES nW nB Corrected ES g Loading Corrected g Loading
WAIS-IV Figure Weights 0.81 590 149 0.86 0.71 0.75WMS-IV Visual Reproduction I 0.66 835 180 0.69 0.68 0.71WAIS-IV Visual Puzzles 0.85 835 180 0.91 0.67 0.71WAIS-IV Matrix Reasoning 0.79 835 180 0.84 0.66 0.70WMS-IV Symbol Span 0.62 835 180 0.66 0.66 0.70WAIS-IV Block Design 1.19 835 180 1.27 0.65 0.70WAIS-IV Arithmetic 0.74 835 180 0.79 0.65 0.69WAIS-IV Digit Span 0.62 835 180 0.64 0.62 0.64WAIS-IV Similarities 0.80 835 180 0.85 0.61 0.66WMS-IV Spatial Addition 0.78 560 140 0.81 0.61 0.64WAIS-IV Comprehension 0.84 835 180 0.90 0.59 0.63WAIS-IV Vocabulary 0.80 835 180 0.82 0.59 0.61WAIS-IV Information 0.78 835 180 0.81 0.59 0.61WMS-IV Visual Reproduction II 0.49 835 180 0.49 0.59 0.60WMS-IV Logical Memory I 0.62 835 180 0.68 0.58 0.64WAIS-IV Picture Completion 0.95 835 179 1.03 0.58 0.63WAIS-IV Letter–Number Sequencing 0.60 590 149 0.64 0.58 0.61WMS-IV Verbal Paired Associates I 0.47 835 180 0.49 0.58 0.60WMS-IV Verbal Paired Associates II 0.46 835 180 0.50 0.55 0.60WMS-IV Logical Memory II 0.60 835 180 0.65 0.54 0.58WAIS-IV Coding 0.74 835 180 0.80 0.52 0.56WAIS-IV Symbol Search 0.72 835 180 0.80 0.51 0.56WMS-IV Designs I 0.56 560 140 0.61 0.50 0.55WMS-IV Designs II 0.43 560 140 0.46 0.44 0.47WAIS-IV Cancellation 0.38 589 149 0.43 0.38 0.43
Note. ES: Hedges' effect size. NW: White sample size. NB: Black sample size. Corrected: corrected for unreliability. Subtests presented in descending order of their gloading. Scores from the Black participants were subtracted from the White participants, so a positive ES indicates that the average score from the White group washigher.
89C.L. Frisby, A.A. Beaujean / Intelligence 51 (2015) 79–97
Curran, 1995). While Mardia (1980) tests of multivariateand kurtosis were larger than expected (b1,p = 30.81, b687.85, n = 738, p = 21), a Q–Q plot of the multivdistribution does not lookmarkedly different from data pfrom a knownmultivariate normal distributions with then, number of variables, and correlation matrix (And
Table 4
Results from exploratory factor analysis of all subtests except the WMS-IV imFactor
Battery Test g
WAIS-IV Figure Weights 0.70WMS-IV Symbol Span 0.68WAIS-IV Matrix Reasoning 0.66WAIS-IV Visual Puzzles 0.66WAIS-IV Block Design 0.65WAIS-IV Arithmetic 0.63WAIS-IV Vocabulary 0.63WAIS-IV Similarities 0.63WMS-IV Visual Reproduction II 0.61WAIS-IV Comprehension 0.61WMS-IV Spatial Addition 0.61WAIS-IV Information 0.61WAIS-IV Digit Span 0.58WAIS-IV Picture Completion 0.56WAIS-IV Letter–Number Sequencing 0.54WMS-IV Verbal Paired Associates II 0.54WAIS-IV Coding 0.51WAIS-IV Symbol Search 0.51WMS-IV Designs II 0.50WMS-IV Logical Memory II 0.48WAIS-IV Cancellation 0.39
Note. Factors were rotated using analytic bi-factor rotation. Subtests presente
e
e,
3.2.1.1. Confirmatory factor analysis. Based on our EFinitially fit a bi-factormodel with four Stratum II factors (VComprehension, Processing Speed, Visual ProcessingWorking Memory). The values for the fit statistics fomodel (B0) are shown in Table 6. The fit measures me
mediate subtests, extracting five factors using the combined sample (n = 1015).
pattern coefficients
F1 F2 F3 F4
0.09 −0.03 0.11 0.15−0.09 0.02 0.06 −0.05
0.01 0.04 0.05 0.16−0.07 −0.01 −0.06 0.32−0.02 0.02 −0.04 0.36
0.17 −0.02 0.25 0.100.60 0.02 0.02 −0.060.48 −0.03 0.01 0.02
−0.19 −0.01 −0.12 −0.060.50 −0.01 0.00 −0.03
−0.03 0.08 0.11 0.130.49 −0.01 −0.04 0.090.00 0.01 0.63 −0.020.03 0.11 −0.03 0.11
−0.02 −0.02 0.50 0.03−0.08 −0.05 −0.02 −0.38
0.03 0.59 0.04 −0.02−0.01 0.64 −0.04 0.02−0.23 −0.07 0.03 −0.11
0.10 0.05 −0.05 −0.36−0.13 0.34 0.07 −0.01
d in descending order of their g loading.
RMSEA and SRMR criteria, but do notmeet theMc criterion andare at the threshold of the CFI criterion. Examining the residual
houlmoder et an thd therba
B1) fised iwn ictorsthos
Next, we fit model B1 to the Black and White groups,separately (B1.B and B1.W, respectively). The model fit slightly
gh thed forcon-
modelte thel withithoutacross
n twosidualM4a),
Table 5Data used in correlated vectors analysis of all subtests except the WMS-IV immediate subtest scores.
Battery Test ES nW nB CorrectedES
g Loading Correctedg loading
WAIS-IV Figure Weights 0.81 590 149 0.86 0.70 0.74WMS-IV Symbol Span 0.62 835 180 0.66 0.68 0.73WAIS-IV Matrix Reasoning 0.79 835 180 0.84 0.66 0.70WAIS-IV Visual Puzzles 0.85 835 180 0.91 0.66 0.70WAIS-IV Block Design 1.19 835 180 1.27 0.65 0.69WAIS-IV Arithmetic 0.74 835 180 0.79 0.63 0.67WAIS-IV Similarities 0.80 835 180 0.85 0.63 0.67WAIS-IV Vocabulary 0.80 835 180 0.82 0.63 0.65WAIS-IV Comprehension 0.84 835 180 0.90 0.61 0.66WMS-IV Spatial Addition 0.78 560 140 0.81 0.61 0.64WAIS-IV Information 0.78 835 180 0.81 0.61 0.63WMS-IV Visual Reproduction II 0.49 835 180 0.49 0.61 0.62WAIS-IV Digit Span 0.62 835 180 0.64 0.58 0.60WAIS-IV Picture Completion 0.95 835 179 1.03 0.56 0.61WMS-IV Verbal Paired Associates II 0.46 835 180 0.50 0.54 0.59WAIS-IV Letter–Number Sequencing 0.60 590 149 0.64 0.54 0.58WAIS-IV Symbol Search 0.72 835 180 0.80 0.51 0.56WAIS-IV Coding 0.74 835 180 0.80 0.51 0.55WMS-IV Designs II 0.43 560 140 0.46 0.50 0.55WMS-IV Logical Memory II 0.60 835 180 0.65 0.48 0.52WAIS-IV Cancellation 0.38 589 149 0.43 0.39 0.44
Note. ES: Hedges' effect size. nW: White sample size. nB: Black sample size. Corrected: Corrected for unreliability. Subtests presented in descending order of their gloading. Scores from the Black participants were subtracted from the White participants, so a positive ES indicates that the average score from the White group washigher.
90 C.L. Frisby, A.A. Beaujean / Intelligence 51 (2015) 79–97
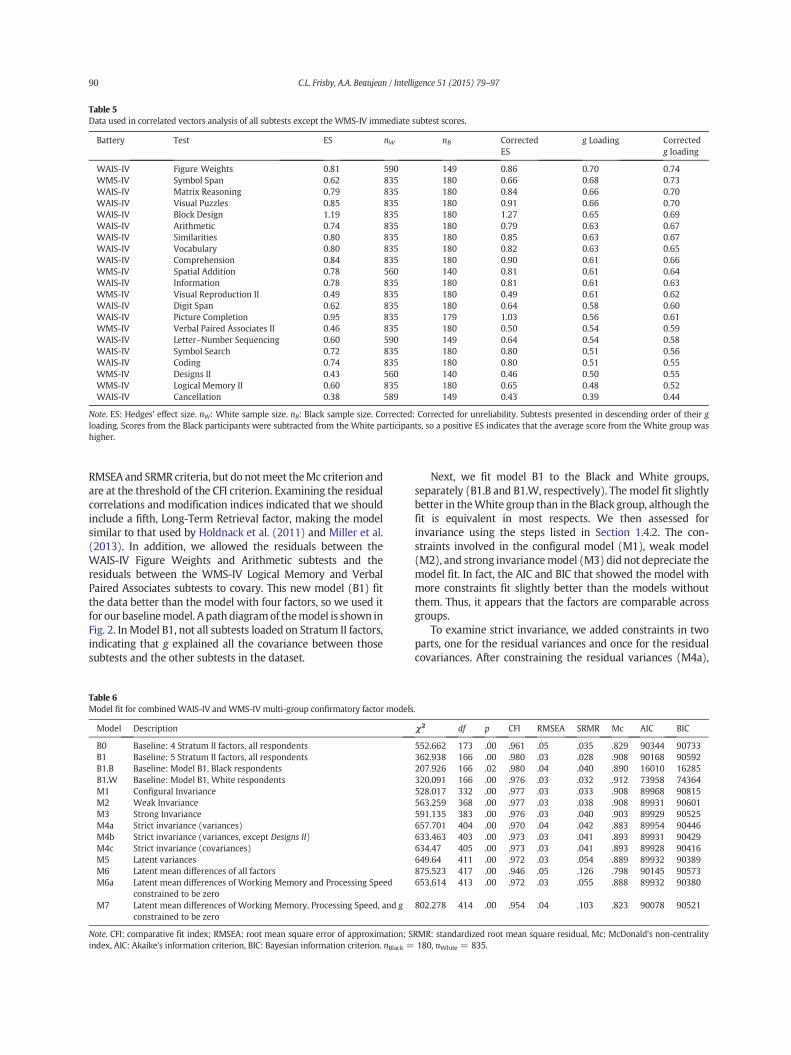
correlations and modification indices indicated that we sinclude a fifth, Long-Term Retrieval factor, making thesimilar to that used by Holdnack et al. (2011) and Mille(2013). In addition, we allowed the residuals betweeWAIS-IV Figure Weights and Arithmetic subtests anresiduals between the WMS-IV Logical Memory and VPaired Associates subtests to covary. This new model (the data better than the model with four factors, so we ufor our baselinemodel. A path diagramof themodel is shoFig. 2. In Model B1, not all subtests loaded on Stratum II faindicating that g explained all the covariance betweensubtests and the other subtests in the dataset.
Table 6
Model fit for combined WAIS-IV and WMS-IV multi-group confirmatory factoModel Description
B0 Baseline: 4 Stratum II factors, all respondentsB1 Baseline: 5 Stratum II factors, all respondentsB1.B Baseline: Model B1, Black respondentsB1.W Baseline: Model B1, White respondentsM1 Configural InvarianceM2 Weak InvarianceM3 Strong InvarianceM4a Strict invariance (variances)M4b Strict invariance (variances, except Designs II)M4c Strict invariance (covariances)M5 Latent variancesM6 Latent mean differences of all factorsM6a Latent mean differences of Working Memory and Processing Sp
constrained to be zeroM7 Latent mean differences of Working Memory, Processing Speed
constrained to be zero
Note. CFI: comparative fit index; RMSEA: root mean square error of approximindex, AIC: Akaike's information criterion, BIC: Bayesian information criterion
dll.eelttn,e
better in theWhite group than in the Black group, althoufit is equivalent in most respects. We then assesseinvariance using the steps listed in Section 1.4.2. Thestraints involved in the configural model (M1), weak(M2), and strong invariancemodel (M3) did not depreciamodel fit. In fact, the AIC and BIC that showed the modemore constraints fit slightly better than the models wthem. Thus, it appears that the factors are comparablegroups.
To examine strict invariance, we added constraints iparts, one for the residual variances and once for the recovariances. After constraining the residual variances (
r models.
χ2 df p CFI RMSEA SRMR Mc AIC BIC
552.662 173 .00 .961 .05 .035 .829 90344 90733362.938 166 .00 .980 .03 .028 .908 90168 90592207.926 166 .02 .980 .04 .040 .890 16010 16285320.091 166 .00 .976 .03 .032 .912 73958 74364528.017 332 .00 .977 .03 .033 .908 89968 90815563.259 368 .00 .977 .03 .038 .908 89931 90601591.135 383 .00 .976 .03 .040 .903 89929 90525657.701 404 .00 .970 .04 .042 .883 89954 90446633.463 403 .00 .973 .03 .041 .893 89931 90429634.47 405 .00 .973 .03 .041 .893 89928 90416649.64 411 .00 .972 .03 .054 .889 89932 90389875.523 417 .00 .946 .05 .126 .798 90145 90573
eed 653.614 413 .00 .972 .03 .055 .888 89932 90380
, and g 802.278 414 .00 .954 .04 .103 .823 90078 90521
ation; SRMR: standardized root mean square residual, Mc: McDonald's non-centrality. nBlack = 180, nWhite = 835.

the model showed some depreciation in fit. Consequently, weexamined the modification indices, which indicated that the
tween
groups. The resulting model (M4b) fit the data better thanmodel M4a, and only slightly worse than model M3. We then
d not
Fig. 2. Bi-factor model of the WAIS-IV and WMS-IV subtests. Subtest specific/error variance terms not shown for space considerations.
91C.L. Frisby, A.A. Beaujean / Intelligence 51 (2015) 79–97
residuals for the Designs II subtests should be freed be
constrained the residual covariances (M4c), which di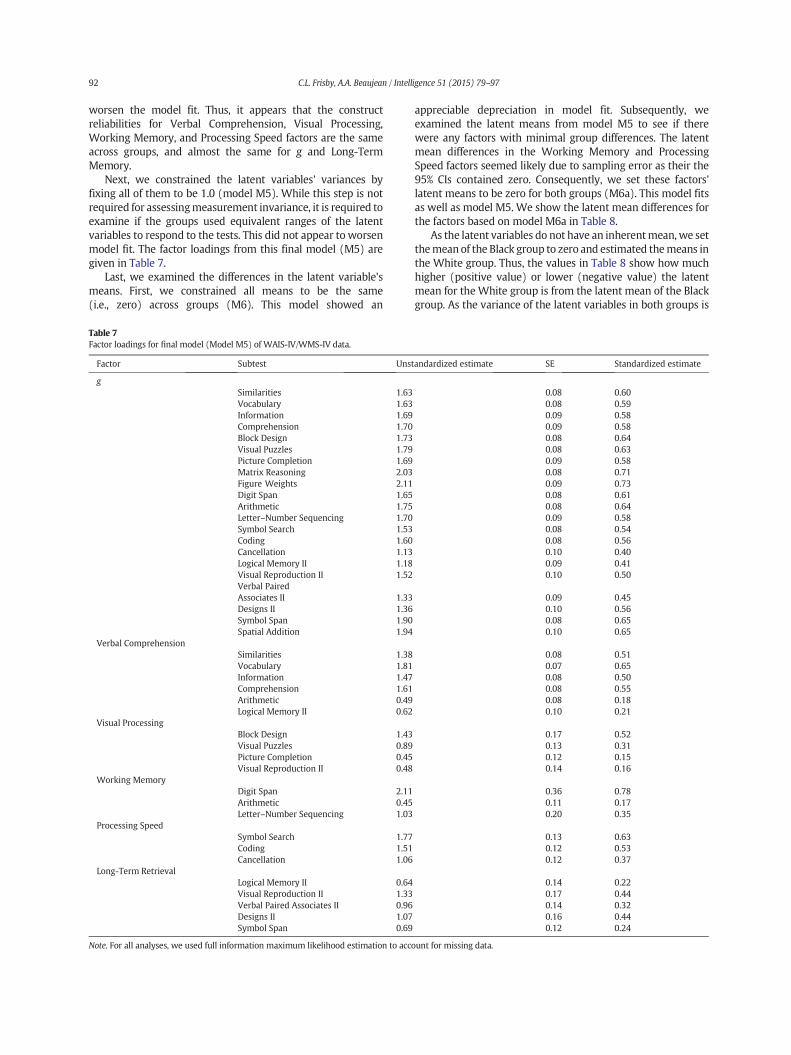
worsen the model fit. Thus, it appears that the constructreliabilities for Verbal Comprehension, Visual Processing,
sam-Term
es bis noired tlatenorse5) ar
iable'samd a
appreciable depreciation in model fit. Subsequently, weexamined the latent means from model M5 to see if there
latentessingir thectors'el fitses for
we setans inmuchlatentBlackups is
92 C.L. Frisby, A.A. Beaujean / Intelligence 51 (2015) 79–97
Working Memory, and Processing Speed factors are theacross groups, and almost the same for g and LongMemory.
Next, we constrained the latent variables' variancfixing all of them to be 1.0 (model M5). While this steprequired for assessingmeasurement invariance, it is requexamine if the groups used equivalent ranges of thevariables to respond to the tests. This did not appear to wmodel fit. The factor loadings from this final model (Mgiven in Table 7.
Last, we examined the differences in the latent varmeans. First, we constrained all means to be the(i.e., zero) across groups (M6). This model showe
Table 7Factor loadings for final model (Model M5) of WAIS-IV/WMS-IV data.
Factor Subtest
gSimilaritiesVocabularyInformationComprehensionBlock DesignVisual PuzzlesPicture CompletionMatrix ReasoningFigure WeightsDigit SpanArithmeticLetter–Number SequencingSymbol SearchCodingCancellationLogical Memory IIVisual Reproduction IIVerbal PairedAssociates IIDesigns IISymbol SpanSpatial Addition
Verbal ComprehensionSimilaritiesVocabularyInformationComprehensionArithmeticLogical Memory II
Visual ProcessingBlock DesignVisual PuzzlesPicture CompletionVisual Reproduction II
Working MemoryDigit SpanArithmeticLetter–Number Sequencing
Processing SpeedSymbol SearchCodingCancellation
Long-Term RetrievalLogical Memory IIVisual Reproduction IIVerbal Paired Associates IIDesigns IISymbol Span
Note. For all analyses, we used full information maximum likelihood estimati
e
ytotne
sen
were any factors with minimal group differences. Themean differences in the Working Memory and ProcSpeed factors seemed likely due to sampling error as the95% CIs contained zero. Consequently, we set these falatent means to be zero for both groups (M6a). This modas well as model M5. We show the latent mean differencthe factors based on model M6a in Table 8.
As the latent variables do not have an inherentmean,themeanof the Black group to zero and estimated themethe White group. Thus, the values in Table 8 show howhigher (positive value) or lower (negative value) themean for the White group is from the latent mean of thegroup. As the variance of the latent variables in both gro
Unstandardized estimate SE Standardized estimate
1.63 0.08 0.601.63 0.08 0.591.69 0.09 0.581.70 0.09 0.581.73 0.08 0.641.79 0.08 0.631.69 0.09 0.582.03 0.08 0.712.11 0.09 0.731.65 0.08 0.611.75 0.08 0.641.70 0.09 0.581.53 0.08 0.541.60 0.08 0.561.13 0.10 0.401.18 0.09 0.411.52 0.10 0.50
1.33 0.09 0.451.36 0.10 0.561.90 0.08 0.651.94 0.10 0.65
1.38 0.08 0.511.81 0.07 0.651.47 0.08 0.501.61 0.08 0.550.49 0.08 0.180.62 0.10 0.21
1.43 0.17 0.520.89 0.13 0.310.45 0.12 0.150.48 0.14 0.16
2.11 0.36 0.780.45 0.11 0.171.03 0.20 0.35
1.77 0.13 0.631.51 0.12 0.531.06 0.12 0.37
0.64 0.14 0.221.33 0.17 0.440.96 0.14 0.321.07 0.16 0.440.69 0.12 0.24
on to account for missing data.
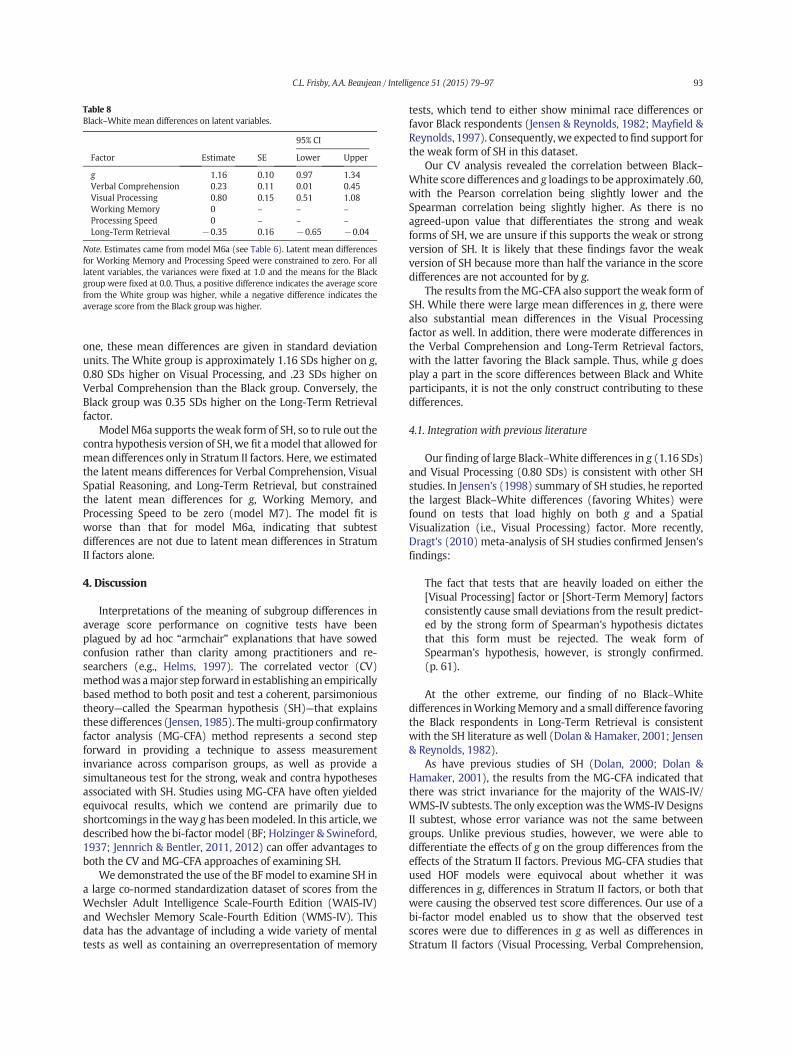
one, these mean differences are given in standard deviationunits. The White group is approximately 1.16 SDs higher on g
er ony, thrieva
ut thed foated
Visuaained, andfit i
ubtesratum
ces inbeenowedd re(CV
ricallniouplainatorstepmenidetheseieldedue tle, wefordges t
SH inm thIS-IV. Thientamor
tests, which tend to either show minimal race differences orfavor Black respondents (Jensen & Reynolds, 1982; Mayfield &
ort for
lack–ly .60,d theis noweaktrongweakscore
rm ofwere
essingces inctors,does
Whitethese
SDs)er SHortedwerepatialently,nsen's
er theactorsedict-ctatesm ofrmed.
Whiteoringistentensen
lan &d thatIS-IV/esignstweenble tom thes thatt wash thate of ad testces innsion,
Table 8Black–White mean differences on latent variables.
95% CI
Factor Estimate SE Lower Upper
g 1.16 0.10 0.97 1.34Verbal Comprehension 0.23 0.11 0.01 0.45Visual Processing 0.80 0.15 0.51 1.08Working Memory 0 – – –Processing Speed 0 – – –Long-Term Retrieval −0.35 0.16 −0.65 −0.04
Note. Estimates came from model M6a (see Table 6). Latent mean differencefor Working Memory and Processing Speed were constrained to zero. For alatent variables, the variances were fixed at 1.0 and the means for the Blacgroup were fixed at 0.0. Thus, a positive difference indicates the average scorfrom the White group was higher, while a negative difference indicates thaverage score from the Black group was higher.
93C.L. Frisby, A.A. Beaujean / Intelligence 51 (2015) 79–97
0.80 SDs higher on Visual Processing, and .23 SDs highVerbal Comprehension than the Black group. ConverselBlack group was 0.35 SDs higher on the Long-Term Retfactor.
Model M6a supports theweak form of SH, so to rule ocontra hypothesis version of SH, we fit amodel that allowmean differences only in Stratum II factors. Here, we estimthe latent means differences for Verbal Comprehension,Spatial Reasoning, and Long-Term Retrieval, but constrthe latent mean differences for g, Working MemoryProcessing Speed to be zero (model M7). The modelworse than that for model M6a, indicating that sdifferences are not due to latent mean differences in StII factors alone.
4. Discussion
Interpretations of the meaning of subgroup differenaverage score performance on cognitive tests haveplagued by ad hoc “armchair” explanations that have sconfusion rather than clarity among practitioners ansearchers (e.g., Helms, 1997). The correlated vectormethodwas amajor step forward in establishing an empibased method to both posit and test a coherent, parsimotheory—called the Spearman hypothesis (SH)—that exthese differences (Jensen, 1985). Themulti-group confirmfactor analysis (MG-CFA) method represents a secondforward in providing a technique to assess measureinvariance across comparison groups, as well as provsimultaneous test for the strong, weak and contra hypoassociated with SH. Studies using MG-CFA have often yequivocal results, which we contend are primarily dshortcomings in theway g has beenmodeled. In this articdescribed how the bi-factor model (BF; Holzinger & Swin1937; Jennrich & Bentler, 2011, 2012) can offer advantaboth the CV and MG-CFA approaches of examining SH.
We demonstrated the use of the BF model to examinea large co-normed standardization dataset of scores froWechsler Adult Intelligence Scale-Fourth Edition (WAand Wechsler Memory Scale-Fourth Edition (WMS-IV)data has the advantage of including a wide variety of mtests as well as containing an overrepresentation of me
,
el
er
l
st
-)yssy
tas
oe,o
e)sly
Reynolds, 1997). Consequently, we expected to find suppthe weak form of SH in this dataset.
Our CV analysis revealed the correlation between BWhite score differences and g loadings to be approximatewith the Pearson correlation being slightly lower anSpearman correlation being slightly higher. As thereagreed-upon value that differentiates the strong andforms of SH, we are unsure if this supports the weak or sversion of SH. It is likely that these findings favor theversion of SH because more than half the variance in thedifferences are not accounted for by g.
The results from theMG-CFA also support the weak foSH. While there were large mean differences in g, therealso substantial mean differences in the Visual Procfactor as well. In addition, there were moderate differenthe Verbal Comprehension and Long-Term Retrieval fawith the latter favoring the Black sample. Thus, while gplay a part in the score differences between Black andparticipants, it is not the only construct contributing todifferences.
4.1. Integration with previous literature
Our finding of large Black–White differences in g (1.16and Visual Processing (0.80 SDs) is consistent with othstudies. In Jensen's (1998) summary of SH studies, he repthe largest Black–White differences (favoring Whites)found on tests that load highly on both g and a SVisualization (i.e., Visual Processing) factor. More recDragt's (2010) meta-analysis of SH studies confirmed Jefindings:
The fact that tests that are heavily loaded on eith[Visual Processing] factor or [Short-Term Memory] fconsistently cause small deviations from the result pred by the strong form of Spearman's hypothesis dithat this form must be rejected. The weak forSpearman's hypothesis, however, is strongly confi(p. 61).
At the other extreme, our finding of no Black–differences inWorkingMemory and a small difference favthe Black respondents in Long-Term Retrieval is conswith the SH literature as well (Dolan & Hamaker, 2001; J& Reynolds, 1982).
As have previous studies of SH (Dolan, 2000; DoHamaker, 2001), the results from the MG-CFA indicatethere was strict invariance for the majority of the WAWMS-IV subtests. The only exceptionwas theWMS-IV DII subtest, whose error variance was not the same begroups. Unlike previous studies, however, we were adifferentiate the effects of g on the group differences froeffects of the Stratum II factors. Previous MG-CFA studieused HOF models were equivocal about whether idifferences in g, differences in Stratum II factors, or botwere causing the observed test score differences. Our usbi-factor model enabled us to show that the observescores were due to differences in g as well as differenStratum II factors (Visual Processing, Verbal Comprehe
sllkee

and Long-Term Retrieval). That is, our study confirmed theweak form of SH, consistent with Jensen's (1998) interpreta-
ng SH
he CVusingwaps ahe CVenceile thf g o
he CVble talysisg, bu0 SD3 SDactorG-CFAimilaethoV ances ohe CVs thae 1.4
sthosakerat thusinst thnd, bh caweenroacd thdirecThirdr, seor aroupsfouns were tht botwhece nowittruct
h haH (omon
Critiques of the CV method were issued over 15 years ago(e.g., Ashton & Lee, 2005; Dolan, 2000; Millsap, 1997), yet the
to bevel ofres is
rms ofarietyorting04). A, afterH, thee dataks for
man's
G-CFAfactoro oursing a.ht notl wason g,rs thetum IIs: theIn thes thatof thehnsonilitiesld be
priatesed soonger2012;ed fordoes
ationsed in
t withust ans for
). Thiswith
ceptu-modelractedfactor
nce isarrollnitiveuld be
94 C.L. Frisby, A.A. Beaujean / Intelligence 51 (2015) 79–97
tion of the SH data.
4.2. Final thoughts on comparing approaches to investigati
4.2.1. Comparison of results from the current studyOur study revealed noteworthy similarities between t
andMG-CFA approaches used to investigate the SHwhena BF model to represent g. Both approaches showed thatestimated invariantly in both the Black and White grouwell as showed large Black–White differences on g. Tanalysis yielded a correlation between Black–White differand g between 0.58 (Pearson) and 0.62 (Spearman), whMG-CFA analysis yielded difference in the latent mean o1.16 SDs.
There were some noticeable differences between tand MG-CFA approaches as well. First, the MG-CFA was auncover more nuanced information than the CV anSpecifically, the MG-CFA not only found differences inalso found group differences in Visual Processing (0.8favoring the White sample), Verbal Comprehension (0.2favoring the White sample), and Long-Term Retrieval f(0.34 SDs favoring the Black sample). Second, the Mfound the construct reliability estimates to be very sbetween the groups for all the factors, an issue the CV mdoes not even attempt to address. Third, while both the CMG-CFA approaches showed large Black–White differeng, themagnitude of the difference is somewhat larger for tanalysis than the MG-CFA. Specifically, the d effect sizecorrespond to the correlations from the CV approach ar(Pearson) and 1.58 (Spearman).
4.2.2. Preferred method for assessing Spearman's hypothesiThe results from our study are in agreement with
from Dolan and his colleagues (Dolan, 2000; Dolan & Ham2001; Dolan et al., 2004; Lubke et al., 2001) showing thMG-CFA approach to testing SH is typically better thanCV. First, the MG-CFA approach is better able to teassumptions inherent in SH than the CV approach. Secousing a BF approach to using a CFA model, the approacprovide more information about the nature of the betgroup differences. For example, the BF MG-CFA appallows for an assessment of group differences in g anStratum II factors simultaneously. Thus, it allows for ainvestigation of the strong, weak, and contra forms of SH.although seldom discussed in the SH literature (howeveIrwing, 2012), the BF MG-CFA approach allows fassessment of construct reliability differences between gfor both g and the Stratum II factors. The current studystrict invariance for all the subtests (except Designs II) aas invariance in the latent variances. Thus, not only abetween-group construct reliabilities nearly identical, bugroups used equivalent ranges of the latent variablesresponding to the test questions. Where strict invarianfound, however, thenwe could have followed theMG-CFAan investigation of the reliability of the measured cons(Reise, Bonifay, & Haviland, 2013).
Despite the number of benefits the MG-CFA approacover the CV approach, the CV approach to assessing Sdifferences between any groups) is still quite com
gss
sef
o.tsss
rddn
t2
e,egeyn-het,en,dllehnths
sr.
method is still used. If the CVmethod is going to continueused, further work needs to be done to determinewhat lethe correlation between g and the differences in test scorequired for support of the strong vs. weak vs. contra foSH. The current lack of agreed-upon values has caused a vof correlation values to be interpreted as evidence suppg's role in determining group differences (Dolan et al., 20Monte Carlo study could be useful here. Specificallysimulating data from strong, weak, and contra forms of Smagnitude of the correlations from a CV analysis of all thsets could be compared to give an idea about benchmarsupport of each level of SH.
4.3. Bi-factor versus higher-order models for testing Spearhypothesis
All prior studies that have compared the CV and Mmethods for evaluating the SH have used a higher-order(HOF) model. In contrast, we used a BF model and, tknowledge, are the first to compare CV with a MG-CFA uBF model's representation of g and the Stratum II factors
If g were the only concern in testing SH, then it migmake much of a difference whether a BF or HOF modeused (Jensen & Weng, 1994). SH does not focus solelyhowever, because theweak and contra forms also consideinfluence of Stratum II factors. In the HOF model, Strafactors are comprised of two independent componentpart that is due to g and the part that is independent of g.BF model, Stratum II factors are defined as constructinfluence a set of observed tests scores independentinfluence of g (Chen et al., 2006). Thus, Murray and Jo(2013, p. 420) concluded, “If ‘pure’measures of specific abare required then bi-factor model factor scores shoupreferred to those from a higher-order model.”
4.3.1. A bi-factor model of intelligenceSome may question whether a BF model is an appro
representation of intelligence. HOF models have been uoften in the field and some argue that they have a strtheoretical basis than BF models (e.g., Keith & Reynolds,Murray & Johnson, 2013). Recently, Beaujean (submittpublication) argued that a BF theory of intelligenceexist—the one that started with Spearman's conceptualizof g, group factors, and specific factors, and then evolvCarroll's three-stratum theory.
First, a BF model's representation of g is consistenSpearman's conceptualization because the BF model is jextension of Spearman's two-factor theory that allowStratum II (group) factors (Holzinger & Swineford, 1939is not surprising, given Holzinger's close associationSpearman (Harman, 1954). Moreover, Spearman's conalization of group factors is aligned with the BF(Spearman, 1933) and he accepted the g factor extfrom a BF model to be the same as that from his two-theory (Spearman, 1946).
Second, John Carroll's conceptualization of intelligemore consistent with a BF model than a HOF model. C(1997) argued that g should be extracted from a set of cogability measures first, and then the Stratum II factors sho
formed from covariances residualized after extracting g. This isthe same idea Holzinger and Swineford (1937) used in
ratumgainsiselye HOted intentl1997
o a Bratumt onlalso iavinrman
of SHd brlyinakeuse ig andces.
ution. Pantehods iashing
vector.004.p guid
loratorometri
uscrip
–Carroeen bnt, 26
ing aner adu
ation oat doe/dx.do
ructura/dx.do
r, L. Vsis anll Sag
y factodoi.org
el fit. Imode
Carroll, J. B. (1993). Human cognitive abilities: A survey of factor-analytic studies.New York, NY: Cambridge University Press.
bilities.0.1207/
arman'sr nature
actor ofRoederll curve
odelingn of the19–251.
tor andrch, 41,
of sexdividual0053-9.f multi-rch, 35,
nces inWISC-Rs. In F.31–60).
om theriticism.0054-4.arman'slligence,
rrelatedaster's
learning
of fullructuralJournal,
rol and31.search:dividual.odels: g, 21–43.ation ofrch, 48,
rlbaum.hooling(Eds.),York:
f group/dx.doi.
tp://dx.
Oxford
. British4-8295.
ize andtp://dx.
nce inist, 47,
class inft, & P. J.sts, and
95C.L. Frisby, A.A. Beaujean / Intelligence 51 (2015) 79–97
developing the BF model.While Carroll (1996) often presented his three-st
theory as a higher-order model in figures, he warns ataking the structure of his figures “too literally or prec(p. 4) because he explicitly preferred the BF model to thmodel. This is most noticeable in the CFAs Carroll conducorder to verify his three-stratum model, as he consischose to use BF models instead of HOF models (Carroll,1995).
One may argue that a HOF model is more preferable tmodel because g is best thought of as an abstraction of StII factors, not a direct influence on tests. This argument nocontradicts Carroll's (1996) conceptualization of g, butcontrary to Spearman's initial conceptualization of g as hdirect influences on the measured tests (Hart & Spea1912).
5. Conclusion
The CVmethodwas amajor contribution to the studyThe HOF MG-CFA method improved the CV methoproviding a technique to examine the assumptions undethe use of CV. We believe that the BF MG-CFA approach man additional contribution to the field of studying SH becacan provide a clearer picture of the contributions ofStratum II factors to the differential size of group differen
References
Andersen, R. (2012). Methods for detecting badly behaved data: Distriblinearmodels, and beyond. InH. Cooper, P.M. Camic, D. L. Long, A. TD. Rindskopf, & K. J. Sher (Eds.), APA handbook of research metpsychology. Data analysis and research publication, 3. (pp. 5–26). Wton, DC: American Psychological Association.
Ashton,M. C., & Lee, K. (2005). Problemswith themethod of correlatedIntelligence, 33, 431–444. http://dx.doi.org/10.1016/j.intell.2004.12
Beaujean, A. A. (2014a). Latent variable modeling using R: A step-by-steNew York, NY: Routledge.
Beaujean, A. A. (2014b). R syntax to accompany Best Practices in ExpFactor Analysis (2014) by Jason Osborne. Waco, TX: Baylor PsychLaboratory (Retrieved from http://www.jwosborne.com).
Beaujean, A. A. (2015n). A bi-factor theory of intelligence does exist. (Mansubmitted for publication).
Beaujean, A. A., Parkin, J., & Parker, S. (2014). Comparing Cattell–Hornmodels for predicting language achievement: Differences betwfactor and higher-order factor models. Psychological Assessme789–805. http://dx.doi.org/10.1037/a0036745.
Benson, N., Beaujean, A. A., & Taub, G. E. (2015). Using score equatmeasurement invariance to examine the Flynn effect in theWechslintelligence scale. Multivariate Behavioral Research (in press).
Benson, N., Hulac, D. M., & Kranzler, J. H. (2010). Independent examintheWechsler adult intelligence scale-fourth edition (WAIS-IV): WhtheWAIS-IVmeasure? Psychological Assessment, 22, 121–130. http:/org/10.1037/a0017767.
Boomsma, A. (2000). Reporting analyses of covariance structures. StEquation Modeling: A Multidisciplinary Journal, 7, 461–483. http:/org/10.1207/s15328007sem0703_6.
Borenstein, M. (2009). Effect sizes for continuous data. In H. CoopeHedges, & J. C. Valentine (Eds.), The handbook of research synthemeta-analysis (pp. 221–235) (2nd ed.). New York, NY: RusseFoundation.
Browne, M. W. (2001). An overview of analytic rotation in exploratoranalysis. Multivariate Behavioral Research, 36, 111–150. http://dx.10.1207/s15327906mbr3601_05.
Browne, M.W., & Cudeck, R. (1993). Alternative ways of assessing modK. A. Bollen, & J. S. Long (Eds.), Testing structural equation(pp. 136–162). Newbury Park, CA: Sage.
t”F
y,
F
ysg,
.ygst
s,r,n-
s.
e.
yc
t
lli-,
dlt
fsi.
li.
.de
r/
nls
Carroll, J. B. (1995). On methodology in the study of cognitive aMultivariate Behavioral Research, 30, 429–452. http://dx.doi.org/1s15327906mbr3003_6.
Carroll, J. B. (1996). A three-stratum theory of intelligence: Specontribution. In I. Dennis, & P. Tapsfield (Eds.),Human abilities: Theiand measurement (pp. 1–17). Mahwah, NJ: Lawrence Erlbaum.
Carroll, J. B. (1997). Theoretical and technical issues in identifying a fgeneral intelligence. In B. Devlin, S. E. Fienberg, D. P. Resnick, & K.(Eds.), Intelligence, genes, and success: Scientists respond to the be(pp. 125–156). New York, NY: Springer-Verlag.
Chen, F. F., Hayes, A., Carver, C. S., Laurenceau, J. -P., & Zhang, Z. (2012). Mgeneral and specific variance inmultifaceted constructs: A comparisobifactor model to other approaches. Journal of Personality, 80, 2http://dx.doi.org/10.1111/j.1467-6494.2011.00739.x.
Chen, F. F., West, S. G., & Sousa, K. H. (2006). A comparison of bifacsecond-order models of quality of life.Multivariate Behavioral Resea189–225. http://dx.doi.org/10.1207/s15327906mbr4102_5.
Colom, R., & Lynn, R. (2004). Testing the developmental theorydifferences in intelligence on 12–18 year olds. Personality and InDifferences, 36, 75–82. http://dx.doi.org/10.1016/S0191-8869(03)0
Dolan, C. V. (2000). Investigating Spearman's hypothesis by means ogroup confirmatory factor analysis. Multivariate Behavioral Resea21–50. http://dx.doi.org/10.1207/s15327906mbr3501_2.
Dolan, C. V., & Hamaker, E. L. (2001). Investigating black-white differepsychometric IQ: Multi-group confirmatory factor analyses of theand K-ABC, and a critique of the method of correlated vectorColumbus (Ed.), Advances in psychological research, Vol. 6. (pp.Huntington, NY: Nova Science Publishers.
Dolan, C. V., & Lubke, G. H. (2001). Viewing Spearman's hypothesis frperspective of Multigroup PCA: A comment on Schonemann's cIntelligence, 29, 231–245. http://dx.doi.org/10.1016/s0160-2896(00)0
Dolan, C. V., Roorda, W., & Wicherts, J. M. (2004). Two failures of Spehypothesis: The GATB in Holland and the JAT in South Africa. Inte32, 155–173. http://dx.doi.org/10.1016/j.intell.2003.09.001.
Dragt, J. (2010). Causes of group differences studied with the method of covectors: A psychometric meta-analysis of Spearman's hypothesis. (Mthesis) Amsterdam, the Netherlands: University of Amsterdam.
Eells, K. (1951). Intelligence and cultural differences: A study of culturaland problem solving. Chicago, IL: University of Chicago.
Enders, C. K., & Bandalos, D. L. (2001). The relative performanceinformation maximum likelihood estimation for missing data in stequation models. Structural Equation Modeling: A Multidisciplinary8, 430–457. http://dx.doi.org/10.1207/S15328007SEM0803_5.
Fischer, K. W. (1980). A theory of cognitive development: The contconstruction of hierarchies of skills. Psychological Review, 87, 477–5
Gignac, G. E. (2007). Multi-factor modeling in individual differences reSome recommendations and suggestions. Personality and InDifferences, 42, 37–48. http://dx.doi.org/10.1016/j.paid.2006.06.019
Gignac, G. E. (2008). Higher-order models versus direct hierarchical mas superordinate or breadth factor? Psychology Science Quarterly, 50
Gignac, G. E., &Watkins, M.W. (2013). Bifactor modeling and the estimmodel based reliability in theWAIS-IV.Multivariate Behavioral Resea639–662. http://dx.doi.org/10.1080/00273171.2013.804398.
Gorsuch, R. L. (1983). Factor analysis (2nded.). Hillsdale, NJ: LawrenceEGottfredson, L. S. (2005). Implications of cognitive differences for sc
within diverse societies. In C. C. L. Frisby, & C. R. ReynoldsComprehensive handbook of multicultural school psychology. NewWiley.
Gustafsson, J. -E. (1992). The relevance of factor analysis for the study odifferences. Multivariate Behavioral Research, 27, 239–247. http:/org/10.1207/s15327906mbr2702_7.
Harman, H. H. (1954). Karl John Holzinger. Psychometrika, 19, 95–96. htdoi.org/10.1007/BF02289158.
Harrington, D. (2009). Confirmatory factor analysis. New York, NY:University Press.
Hart, B., & Spearman, C. (1912). General ability, its existence and natureJournal of Psychology, 5, 51–84. http://dx.doi.org/10.1111/j.2041912.tb00055.x.
Hedges, L. V. (1981). Distribution theory for Glass's estimator of effect srelated estimators. Journal of Educational Statistics, 6, 107–128. htdoi.org/10.3102/10769986006002107.
Helms, J. E. (1992). Why is there no study of cultural equivalestandardized cognitive ability testing? American Psycholog1083–1101. http://dx.doi.org/10.1037/0003-066X.47.9.1083.
Helms, J. E. (1997). The triple quandary of race, culture, and socialstandardized cognitive ability testing. In D. P. Flanagan, J. L. GenshaHarrison (Eds.), Contemporary intellectual assessment: Theories, teissues (pp. 517–532). New York, NY: Guilford Press.

Helms-Lorenz,M., Van deVijver, F. J. R., & Poortinga, Y. H. (2003). Cross-culturaldifferences in cognitive performance and Spearman's hypothesis: g or c?
111-3(2011ent, 1
trika,
ility ofago, IL
nalysi.ponencholog
ariancative
0.1080
dizatio26–131
metrik
sis: Th0.1007
urnal o/s0140
varioucience
idenc0.1207
ort, CT
(Eds.uremen
it spaurnal o2-0663
it spaparison
erns o/dx.do
31–258
to aid in D. Pssmenuilfor
. Hoylw Yor
sentinle, J. Affects irlbaum
ath, an
icient aurnal otp://d
grouluatio. http:
). Weales: A
implication of strict factorial invariance. British Journal of Mathematicaland Statistical Psychology, 56, 231–248. http://dx.doi.org/10.1348/
st Asian47–158.
erencesGeneral
In P. R.ork, NY:
mation-models.19-004-
ructuraltempo-5–340).
nces inhives of0.1016/
mplete.org/10.
porting/dx.doi.
tivity ofApplied.568.matoryurnal of0.1177/
y factorcal and76/jcen.
e failure/Current
e. New
tivariate
l factor?ttp://dx.
paringabilityll.2013.
nces on, 21–43.
mentalwith a.org/10.
Cattell–ce of an91–404.
variousarmed
93–599.
e factoranalysischology,
atisticalounda-
ariance99–331.
96 C.L. Frisby, A.A. Beaujean / Intelligence 51 (2015) 79–97
Intelligence, 31, 9–29. http://dx.doi.org/10.1016/S0160-2896(02)00Holdnack, J. A., Zhou, X., Larrabee, G. J., Millis, S. R., & Salthouse, T. A.
Confirmatory factor analysis of the WAIS-IV/WMS-IV. Assessm178–191. http://dx.doi.org/10.1177/1073191110393106.
Holzinger, K., & Swineford, F. (1937). The bi-factor method. Psychome41–54. http://dx.doi.org/10.1007/BF02287965.
Holzinger, K. J., & Swineford, F. (1939). A study in factor analysis: The stabbi-factor solution. Supplementary Educational Monographs, 48, ChicUniversity of Chicago Press.
Horn, J. (1965). A rationale and test for the number of factors in factor aPsychometrika, 30, 179–185. http://dx.doi.org/10.1007/bf02289447
Horn, J. (1997). On themathematical relationship between factor or comcoefficients and differences between means. Cahiers de PsyCognitive/Current Psychology of Cognition, 16, 721–728.
Hu, L. -T., & Bentler, P. M. (1999). Cutoff criteria for fit indexes in covstructure analysis: Conventional criteria versus new alternStructural Equation Modeling, 6, 1–55. http://dx.doi.org/110705519909540118.
Irwing, P. (2012). Sex differences in g: An analysis of the US standarsample of the WAIS-III. Personality and Individual Differences, 53, 1http://dx.doi.org/10.1016/j.paid.2011.05.001.
Jennrich, R. I., & Bentler, P. (2011). Exploratory bi-factor analysis. Psycho76, 537–549. http://dx.doi.org/10.1007/s11336-011-9218-4.
Jennrich, R. I., & Bentler, P. M. (2012). Exploratory bi-factor analyoblique case. Psychometrika, 77, 442–454. http://dx.doi.org/1s11336-012-9269-1.
Jensen, A. R. (1980). Bias in mental testing. New York, NY: Free Press.Jensen, A. R. (1984). Test validity: g versus the specificity doctrine. Jo
Social and Biological Structures, 7, 93–118. http://dx.doi.org/10.10161750(84)80001-9.
Jensen, A. R. (1985). The nature of the Black–White difference onpsychometric tests: Spearman's hypothesis. Behavioral and Brain S8, 193–263. http://dx.doi.org/10.1017/s0140525x00020392.
Jensen, A. R. (1992). Spearman's hypothesis: Methodology and evMultivariate Behavioral Research, 27, 225–233. http://dx.doi.org/1s15327906mbr2702_5.
Jensen, A. R. (1998). The g factor: The science of mental ability. WestpPraeger Publishers/Greenwood.
Jensen, A. R. (2001). Spearman's hypothesis. In J. M. Collis, & S. MessickIntelligence and personality: Bridging the gap in theory and meas(pp. 3–24). Mahwah, NJ: Lawrence Erlbaum Associates Publishers.
Jensen, A. R., & Figueroa, R. A. (1975). Forward and backward diginteraction with race and IQ: Predictions from Jensen's theory. JoEducational Psychology, 67, 882–893. http://dx.doi.org/10.1037/00267.6.882.
Jensen, A. R., & Osborne, R. T. (1979). Forward and backward diginteraction with race and IQ: A longitudinal developmental comIndian Journal of Psychology, 54, 75–87.
Jensen, A. R., & Reynolds, C. R. (1982). Race, social class and ability patttheWISC-R. Personality and Individual Differences, 3, 423–438. http:/org/10.1016/0191-8869(82)90007-1.
Jensen, A. R., & Weng, L. -J. (1994). What is a good g? Intelligence, 18, 2http://dx.doi.org/10.1016/0160-2896(94)90029-9.
Keith, T. Z., & Reynolds,M. R. (2012). Using confirmatory factor analysisunderstanding the constructs measured by intelligence tests. IFlanagan, & P. L. Harrison (Eds.), Contemporary intellectual asseTheories, tests, and issues (pp. 758–799) (3rd ed.). New York, NY: GPress.
Kline, R. B. (2012). Assumptions in structural equation modeling. In R. A(Ed.), Handbook of structural equation modeling (pp. 111–125). NeNY: Guilford.
Little, T. D., Card, N. A., Slegers, D. W., & Ledford, E. C. (2007). Reprecontextual effects in multiple-group MACS models. In T. D. LittBovaird, & N. A. Card (Eds.), Modeling ecological and contextual elongitudinal studies (pp. 121–147). Mahwah, NJ: Lawrence EAssociates.
Loehlin, J. C. (2004). Latent variable models: An introduction to factor, pstructural equation analysis (4th ed.). Mahwah, NJ: Erlbaum.
Lorenzo-Seva, U., & ten Berge, J. M. F. (2006). Tucker's congruence coeffa meaningful index of factor similarity. Methodology: European JoResearch Methods for the Behavioral and Social Sciences, 2, 57–64. htdoi.org/10.1027/1614-2241.2.2.57.
Lubke, G. H., Dolan, C. V., & Kelderman, H. (2001). Investigatingdifferences on cognitive tests using Spearman's hypothesis: An evaof Jensen's method. Multivariate Behavioral Research, 36, 299–324dx.doi.org/10.1207/S15327906299-324.
Lubke, G. H., Dolan, C. V., Kelderman, H., & Mellenbergh, G. J. (2003measurement invariance with respect to unmeasured variab
.).8,
2,
a:
s.
tie
es./
n.
a,
e/
f-
ss,
e./
:
),t
nf.
n.
ni.
.
n.t:d
ek,
g.n
d
sfx.
pn//
kn
000711003770480020.Lupi, M. H., & Ting Woo, J. Y. (1989). Issues in the assessment of Ea
handicapped students. Assessment for Effective Intervention, 14, 1http://dx.doi.org/10.1177/153450848901400301.
Lynn, R., & Owen, K. (1994). Spearman's hypothesis and test score diffbetween whites, Indians, and blacks in South Africa. Journal ofPsychology, 121, 27–36.
Mardia, K. (1980). Tests of univariate and multivariate normality.Krishnaiah (Ed.),Handbook of statistics,Vol.1. (pp. 279–320). NewYNorth Holland.
Markon, K. E., & Krueger, R. F. (2004). An empirical comparison of infortheoretic selection criteria for multivariate behavior geneticBehavior Genetics, 34, 593–610. http://dx.doi.org/10.1007/s1055587-0.
Marsh, H. W., Hau, K. -T., & Grayson, D. (2005). Goodness of fit in stequation models. In A. Maydeu-Olivares, & J. J. McArdle (Eds.), Conrary psychometrics: A festschrift for Roderick P. McDonald (pp. 27Mahwah, NJ: Lawrence Erlbaum.
Mayfield, J. W., & Reynolds, C. R. (1997). Black–White differememory test performance among children and adolescents. ArcClinical Neuropsychology, 12, 111–122. http://dx.doi.org/1S0887-6177(96)00016-9.
McArdle, J. J. (1994). Structural factor analysis experiments with incodata. Multivariate Behavioral Research, 29, 409–454. http://dx.doi1207/s15327906mbr2904_5.
McDonald, R. P., & Ho, M. -H. R. (2002). Principles and practice in restructural equation analyses. Psychological Methods, 7, 64–82. http:/org/10.1037/1082-989X.7.1.64.
Meade, A. W., Johnson, E. C., & Braddy, P. W. (2008). Power and sensialternative fit indices in tests of measurement invariance. Journal ofPsychology, 93, 568–592. http://dx.doi.org/10.1037/0021-9010.93.3
Miller, D. I., Davidson, P. S. R., Schindler, D., & Messier, C. (2013). Confirfactor analysis of the WAIS-IV and WMS-IV in older adults. JoPsychoeducational Assessment, 31, 375–390. http://dx.doi.org/10734282912467961.
Millis, S. R.,Malina, A. C., Bowers, D. A., & Ricker, J. H. (1999). Confirmatoranalysis of the Wechsler memory scale-III. Journal of CliniExperimental Neuropsychology, 21, 87–93. http://dx.doi.org/10.1021.1.87.937.
Millsap, R. E. (1997). The investigation of Spearman's hypothesis and thto understand factor analysis. Cahiers de Psychologie CognitivePsychology of Cognition, 16, 750–757.
Millsap, R. E. (2011). Statistical approaches to measurement invariancYork, NY: Routledge.
Mulaik, S. A. (1992). Guttman's “last paper” [Special issue]. MulBehavioral Research, 27(1).
Mulaik, S. A., & Quartetti, D. A. (1997). First order or higher order generaStructural EquationModeling: AMultidisciplinary Journal,4, 193–211. hdoi.org/10.1080/10705519709540071.
Murray, A. L., & Johnson, W. (2013). The limitations of model fit in comthe bi-factor versus higher-order models of human cognitivestructure. Intelligence, 41, 407–422. http://dx.doi.org/10.1016/j.inte06.004.
Naglieri, J. A., & Jensen, A. R. (1987). Comparison of Black–White differetheWISC-R and the K-ABC: Spearman's hypothesis. Intelligence, 11http://dx.doi.org/10.1016/0160-2896(87)90024-9.
Nelson, J.M., Canivez, G. L., &Watkins,M.W. (2013). Structural and increvalidity of the Wechsler adult intelligence scale-fourth editionclinical sample. Psychological Assessment, 25, 618–630. http://dx.doi1037/a0032086.
Niileksela, C. R., Reynolds, M. R., & Kaufman, A. S. (2013). An alternativeHorn–Carroll (CHC) factor structure of the WAIS-IV: Age invarianalternative model for ages 70–90. Psychological Assessment, 25, 3http://dx.doi.org/10.1037/a0031175.
Nyborg, H., & Jensen, A. R. (2000). Black–White differences onpsychometric tests: Spearman's hypothesis tested on Americanservices veterans. Personality and Individual Differences, 28, 5http://dx.doi.org/10.1016/s0191-8869(99)00122-1.
Price, L. R., Tulsky, D., Millis, S., & Weiss, L. (2002). Redefining thstructure of the Wechsler memory scale-III: Confirmatory factorwith cross-validation. Journal of Clinical and Experimental Neuropsy24, 574–585. http://dx.doi.org/10.1076/jcen.24.5.574.1013.
R. Development Core Team (2014). R: A language and environment for stcomputing. (Version 3.01) [Computer Program]. Vienna, Austria: R Ftion for Statistical Computing.
Raykov, T. (2004). Behavioral scale reliability and measurement invevaluation using latent variable modeling. Behavior Therapy, 35, 2http://dx.doi.org/10.1016/s0005-7894(04)80041-8.
Reise, S. P. (2012). The rediscovery of bifactor measurement models.Multivariate Behavioral Research, 47, 667–696. http://dx.doi.org/10.1080/
odelinurnal o23891
els ana yiel. http:/
ns anidimenologica78690
ric, anton, IL
in chileynold48–83
odeling
c groutings:.org/10
–Jense7–225
Nybor. Jense
s fromsed ar7–183
erence. http:/
ologicaologica85.r facto/dx.do
lution
tion fognitiv/0882
odel oporar
ord.hiers d
Sivo, S. A., Fan, X., Witta, E. L., & Willse, J. T. (2006). The search for “optimal”cutoff properties: Fit index criteria in structural equation modeling. The
0.3200/
rement.
ation of/dx.doi.
logy, 36,
ores forurnal of010.82.
groupects, or/S0160-
matrix.org/10.
arianceological
ntonio,
rpretive
TX: The
y scale-X: The
clinicalurnal of0.1177/
clinicalurnal of0.1177/
ls withe (Ed.),56–75).
-Hall.ling forfrom g:
variableoctoralifornia.een themetrika,
97C.L. Frisby, A.A. Beaujean / Intelligence 51 (2015) 79–97
00273171.2012.715555.Reise, S. P., Bonifay, W. E., & Haviland, M. G. (2013). Scoring and m
psychological measures in the presence of multidimensionality. JoPersonality Assessment, 95, 129–140. http://dx.doi.org/10.1080/0022012.725437.
Reise, S. P., Moore, T. M., & Haviland, M. G. (2010). Bifactor modrotations: Exploring the extent to which multidimensional datunivocal scale scores. Journal of Personality Assessment, 92, 544–559dx.doi.org/10.1080/00223891.2010.496477.
Reise, S., Moore, T., & Maydeu-Olivares, A. (2011). Target rotatioassessing the impact of model violations on the parameters of unsional item response theory models. Educational and PsychMeasurement, 71, 684–711. http://dx.doi.org/10.1177/00131644103
Revelle, W. (2012). psych: Procedures for psychological, psychometpersonality research. (Version 1.4.8) [Computer Program]. EvansNorthwestern University.
Reynolds,M. R., & Keith, T. Z. (2013).Measurement and statistical issuesAssessment research. In D. H. Saklofske, V. L. Schwean, & C. R. R(Eds.), The Oxford handbook of child psychological assessment (pp.New York, NY: Oxford University Press.
Rosseel, Y. (2012). lavaan: An R package for structural equation mJournal of Statistical Software, 48, 1–36.
Roth, P. L., Bevier, C. A., Bobko, P., Switzer, F. S., & Tyler, P. (2001). Ethnidifferences in cognitive ability in employment and educational setmeta-analysis. Personnel Psychology, 54, 297–330. http://dx.doi1111/j.1744-6570.2001.tb00094.x.
Rushton, J. P. (1998). The “Jensen effect” and the “Spearmanhypothesis” of Black White IQ differences. Intelligence, 26, 21http://dx.doi.org/10.1016/s0160-2896(99)80004-x.
Rushton, J. P. (2003). Race differences in g and the “Jensen effect.”. In H.(Ed.), The scientific study of general intelligence: A tribute to Arthur R(pp. 147–186). Amsterdam: Pergamon.
Rushton, J. P., & Jensen, A. R. (2003). African–White IQ differenceZimbabwe on the Wechsler intelligence scale for children-revimainly on the g factor. Personality and Individual Differences, 34, 17http://dx.doi.org/10.1016/s0191-8869(02)00024-7.
Rushton, J. P., & Jensen, A. R. (2005). Thirty years of research on race diffin cognitive ability. Psychology, Public Policy, and Law, 11, 235–294dx.doi.org/10.1037/1076-8971.11.2.235.
Salthouse, T. A. (2009). Decomposing age correlations on neuropsychand cognitive variables. Journal of the International NeuropsychSociety, 15, 650–661. http://dx.doi.org/10.1017/S13556177099903
Schmid, J., Jr. (1957). The comparability of the bi-factor and second-ordepatterns. The Journal of Experimental Education, 25, 249–253. http:/org/10.2307/20154047.
Schmid, J., & Leiman, J. (1957). The development of hierarchical factor soPsychometrika, 22, 53–61. http://dx.doi.org/10.1007/bf02289209.
Schmiedek, F., & Li, S. -C. (2004). Toward an alternative representadisentangling age-associated differences in general and specific coabilities. Psychology and Aging, 19, 40–56. http://dx.doi.org/10.10377974.19.1.40.
Schneider, W. J., & McGrew, K. S. (2012). The Cattell–Horn–Carroll mintelligence. In D. P. Flanagan, & P. L. Harrison (Eds.), Contemintellectual assessment (pp. 99–144) (3rd ed.). New York, NY: Guilf
Schönemann, P. H. (1997). Famous artefacts: Spearman's hypothesis. CaPsychologie Cognitive/Current Psychology of Cognition, 16, 665–694.
gf.
dd/
d-l.d:
ds).
.
pA.
n.
gn
e.
s/
ll
ri.
s.
re-
fy
e
Journal of Experimental Education, 74, 267–288. http://dx.doi.org/1JEXE.74.3.267-288.
Spearman, C. E. (1927). The abilities of man: Their nature and measuNew York, NY: Blackburn Press.
Spearman, C. (1933). The factor theory and its troubles. III.Misrepresentthe theory. Journal of Educational Psychology, 24, 591–601. http:/org/10.1037/h0073929.
Spearman, C. E. (1946). Theory of general factor. British Journal of Psycho117–131. http://dx.doi.org/10.1111/j.2044-8295.1946.tb01114.x.
te Nijenhuis, J., & van der Flier, H. (1997). Comparability of GATB scimmigrants and majority group members: Some Dutch findings. JoApplied Psychology, 82, 675–687. http://dx.doi.org/10.1037/0021-95.675.
te Nijenhuis, J., & van der Flier, H. (2003). Immigrant–majoritydifferences in cognitive performance: Jensen effects, cultural effboth? Intelligence, 31, 443–459. http://dx.doi.org/10.10162896(03)00027-8.
Velicer, W. F. (1976). Determining the number of components from theof partial correlations. Psychometrika, 41, 321–327. http://dx.doi1007/bf02293557.
Ward, L. C., Bergman, M. A., & Hebert, K. R. (2012). WAIS-IV subtest covstructure: Conceptual and statistical considerations. PsychAssessment, 24, 328–340. http://dx.doi.org/10.1037/a0025614.
Wechsler, D. (2008a). Wechsler adult intelligence scale (4th ed.). San ATX: The Psychological Corporation.
Wechsler, D. (2008b).Wechsler adult intelligence scale: Technical and intemanual (4th ed.). San Antonio, TX: Pearson.
Wechsler, D. (2009). Wechsler memory scale (4th ed.). San Antonio,Psychological Corporation.
Wechsler, D., Holdnack, J. A., & Drozdick, L. W. (2009). Wechsler memorfourth edition technical and interpretive manual. San Antonio, TPsychological Corporation.
Weiss, L. G., Keith, T. Z., Zhu, J., & Chen, H. (2013a). WAIS-IV andvalidation of the four- and five-factor Interpretative approaches. JoPsychoeducational Assessment, 31, 94–113. http://dx.doi.org/10734282913478030.
Weiss, L. G., Keith, T. Z., Zhu, J., & Chen, H. (2013b). WISC-IV andvalidation of the four- and five-factor interpretative approaches. JoPsychoeducational Assessment, 31, 114–131. http://dx.doi.org/10734282913478032.
West, S. G., Finch, J. F., & Curran, P. J. (1995). Structural equation modenon-normal variables: Problems and remedies. In R. A. HoylStructural equation modeling: Concepts, issues and applications (pp.Newbury Park, CA: Sage.
White, J. (1984). The psychology of blacks. Englewood Cliffs, NJ: PrenticeWoodley, M. A., te Nijenhuis, J., Must, O., & Must, A. (2014). Control
increased guessing enhances the independence of the Flynn effectThe return of the Brand effect. Intelligence, 43, 27–34.
Yu, C.-Y. (2002). Evaluating cutoff criteria of model fit indices for latentmodels with binary and continuous outcomes. (Unpublished ddissertation). University of California-Los Angeles, Los Angeles, Cal
Yung, Y. -F., Thissen, D., &McLeod, L. D. (1999). On the relationship betwhigher order factormodel and the hierarchical factormodel. Psycho64, 113–128. http://dx.doi.org/10.1007/bf02294531.