testing of new satellite-derived land surface products in ncep’s global and regional data...
TRANSCRIPT
Testing of new satellite-derived land surface products in
NCEP’s Global and Regional Data Assimilation Systems
Ken Mitchell and Dan Tarpley
NCEP/EMC (NOAA) NESDIS/ORA (NOAA)
JCSDA Science Workshop
May 31 – June 1, 2006
Acknowledgements(Coordination via bi-monthly telecons hosted by NCEP/EMC)
• Joint Center for Satellite Data Assimilation– External: JCSDA-funded PIs
• U.Arizona: X. Zeng, Boston.U: M. Friedl, Princeton.U: E. Wood, GMU: P. Houser
– Internal:• NCEP/EMC: Land Team
– K. Mitchell, G. Gayno, V. Wong, C. Marshall• NESDIS/ORA: Land Team
– D. Tarpley, L. Jiang, F. Kogan, I. Laszlo. P Romanov• NASA GSFC/HSB:
– C. Peters-Lidard, M. Rodell, B. Cosgrove, LIS Team
• NASA GSFC/GMAO:– R. Koster, R. Reichle
• Air Force Weather Agency (AFWA)– J. Eylander

Goals of Land-arena in JCSDA:Improved Weather and Climate Forecast Skill Through Use and
Assimilation of Satellite Land Data
• New and improved satellite products for prescribed land surface characteristics (focus of this presentation)
– Boston U. (M. Friedl), U.Arizona (X. Zeng), NESDIS/ORA (D. Tarpley)
• Improved land surface forward radiation models– Princeton U. (E. Wood), NESDIS/ORA (F. Weng)
• Improved Noah land surface model physics as required to use satellite data (e.g. add groundwater component for GRACE 4dda)
– U.Arizona (X. Zeng), NCEP/EMC (K.Mitchell), NASA/HSB (C. Peters-Lidard)
• Model sensitivity studies on newly available satellite products– U.Arizona (X. Zeng), NCEP/EMC, NASA/HSB, NASA/GMAO (R. Koster)
• Land data assimilation methodologies for improved initial conditions of land surface prognostic states (via Kalman filters or Adjoint models)
– George Mason U. (P. Houser), NASA/HSB, NASA/GMAO
• Transition to operations– NCEP/EMC, NASA/HSB, NASA/GMAO, NESDIS/ORA
Outline
• Vegetation type (aka: landuse class)
• Vegetation phenology (annual cycle)
• Surface albedo
• Land surface temperature (LST)
• Snow cover and snowpack
• Soil moisture
• Surface emissivity
• Research to Operations transition strategy

Noah Land Surface Model:The land component in NCEP global and regional
models and their data assimilation systems(Noah LSM implemented in NCEP ops GFS/GDAS in May 2005)

Uses of land-surface satellite products in NCEP modeling initiatives (operations or test beds)
• Define land surface characteristics– Vegetation phenology: annual cycle of green vegetation fraction (GVF)
• Operations: monthly 0.14-deg monthly global climatology of GVF from AVHRR• Test Bed:
– External/U.Arizona: MODIS-based global 2-km bi-monthly climatology of GVF – Internal/NESDIS: AVHRR-based realtime weekly global 0.144-deg (16-km) GVF
– Vegetation type (land use class):• Operations: AVHRR-based 12-class 1-deg (global model) or 24-class 1-km (regional model)• Test Bed:
– External/Boston.U: MODIS-based 15-class 1-km global– Surface albedo: snow-free and maximum for deep snow
• Operations: based on Briegleb (1992, 1986) and Matthews (1983,1984) seasonal, 1-deg global• Test Bed:
– External/Boston.U: MODIS-based monthly 5-km global (snow-free)– :External/U.Arizona: MODIS-based global 0.05-deg maximum albedo over deep snow
• Determine initial values of land prognostic states via data assimilation– Snow cover and snowpack:
• Operations: Daily multi-sensor 4-km global (Geo, AVHRR, DMSP, AMSU, MODIS)• Test Bed:
– External/Princeton.U: 4DDA of microwave SWE estimates via forward modeling– Internal/HSB: MODIS snow cover assimilation– Internal/NESDIS: AMSU and GEO SWE estimates
– Soil moisture -- Test Bed only (External: GMU, Internal: HSB, GMAO)– Land surface temperature – Test Bed only (External: GMU, Internal: HSB, GMAO)
• Verification of land surface fields (operations and test beds)– Land surface temperature (Internal:EMC)– Snow cover (External: Princeton.U, Internal: EMC and HSB)
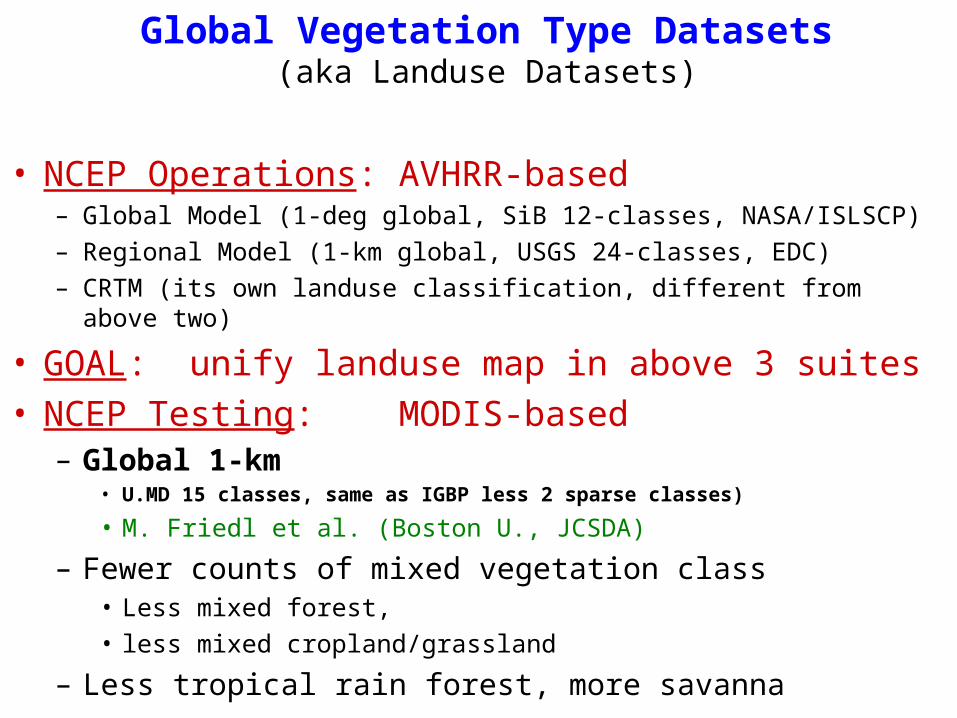
Global Vegetation Type Datasets(aka Landuse Datasets)
• NCEP Operations: AVHRR-based– Global Model (1-deg global, SiB 12-classes, NASA/ISLSCP)– Regional Model (1-km global, USGS 24-classes, EDC)– CRTM (its own landuse classification, different from above two)
• GOAL: unify landuse map in above 3 suites• NCEP Testing: MODIS-based
– Global 1-km • U.MD 15 classes, same as IGBP less 2 sparse classes)
• M. Friedl et al. (Boston U., JCSDA)
– Fewer counts of mixed vegetation class• Less mixed forest, • less mixed cropland/grassland
– Less tropical rain forest, more savanna
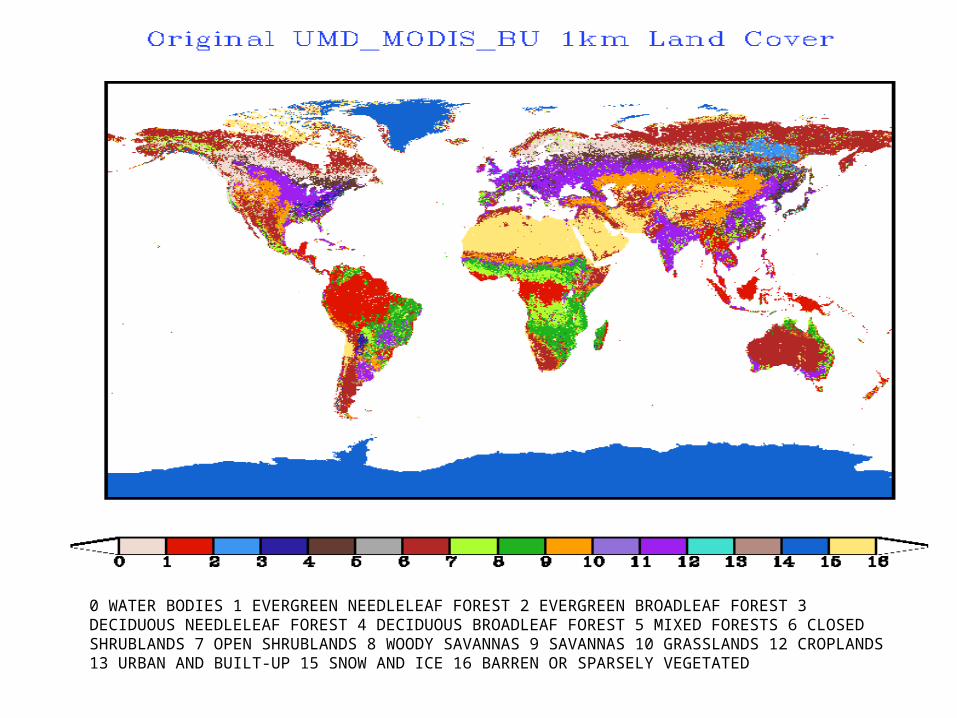
0 WATER BODIES 1 EVERGREEN NEEDLELEAF FOREST 2 EVERGREEN BROADLEAF FOREST 3 DECIDUOUS NEEDLELEAF FOREST 4 DECIDUOUS BROADLEAF FOREST 5 MIXED FORESTS 6 CLOSED SHRUBLANDS 7 OPEN SHRUBLANDS 8 WOODY SAVANNAS 9 SAVANNAS 10 GRASSLANDS 12 CROPLANDS 13 URBAN AND BUILT-UP 15 SNOW AND ICE 16 BARREN OR SPARSELY VEGETATED

1 EVERGREEN NEEDLELEAF FOREST 2 EVERGREEN BROADLEAF FOREST 3 DECIDUOUS NEEDLELEAF FOREST 4 DECIDUOUS BROADLEAF FOREST 5 MIXED FORESTS 6 CLOSED SHRUBLANDS 7 OPEN SHRUBLANDS 8 WOODY SAVANNAS 9 SAVANNAS 10 GRASSLANDS 12 CROPLANDS 13 URBAN AND BUILT-UP 15 SNOW AND ICE 16 BARREN OR SPARSELY VEGETATED 17 WATER BODIES 18 WOODED TUNDRA 19 MIXED TUNDRA 20 BARE GROUND TUNDRA
With tundra class added by NCEP/EMC:
Tundra class believed to be important to CRTM surface emissivity modeling.
(closed and open shrubland classes divided into high latitude and lower latitude regimes)

MODIS-based (Red/Top) versus AVHRR-based (Blue/Bottom)Evergreen needleleaf forest class (left) and mixed forest class (right):
Example of fewer mixed-vegetation pixels in MODIS
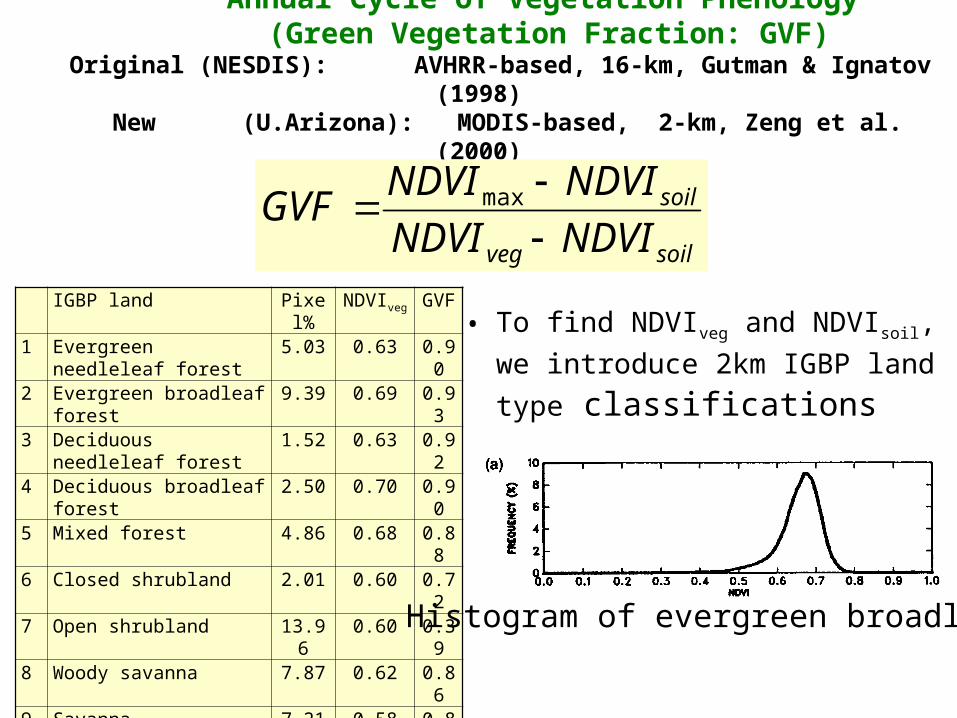
Annual Cycle of Vegetation Phenology (Green Vegetation Fraction: GVF)
Original (NESDIS): AVHRR-based, 16-km, Gutman & Ignatov (1998) New (U.Arizona): MODIS-based, 2-km, Zeng et al. (2000)
• To find NDVIveg and NDVIsoil, we
introduce 2km IGBP land type classifications
IGBP land Pixel% NDVIveg GVF
1 Evergreen needleleaf forest 5.03 0.63 0.902 Evergreen broadleaf forest 9.39 0.69 0.933 Deciduous needleleaf forest 1.52 0.63 0.924 Deciduous broadleaf forest 2.50 0.70 0.905 Mixed forest 4.86 0.68 0.886 Closed shrubland 2.01 0.60 0.727 Open shrubland 13.96 0.60 0.398 Woody savanna 7.87 0.62 0.869 Savanna 7.21 0.58 0.8110 Grassland 8.53 0.49 0.7111 Permanent wetland 1.02 0.56 0.8512 Cropland 10.89 0.61 0.8614 Natural vegetation 10.80 0.65 0.8516 Barren 14.22 0.60 0.11
Histogram of evergreen broadleaf
GVF NDVImax NDVIsoilNDVIveg NDVIsoil

GVF annual cycle:
Original (Gutman/AVHRR) versus New (Zeng et al/MODIS)
New GVF for the 7 most prevalent land cover types in CONUS.
• More realistic annual cycle in new GVF for evergreen needleleaf forest (Original GVF appears to get too low in winter.)
•New GVF is systematically higher in all land cover categories (possibly too high for deciduous broadleaf forest and cropland/grassland).

Global Albedo Datasets
• Snow-free albedo– NCEP Operations: Pre-MODIS (1-deg global, quarterly)
• Briegleb et al. (1992,1986), E. Matthews (1984),
– NCEP Testing: Post-MODIS (.05-deg global, monthly)• M. Friedl et al. (Boston U., JCSDA)
• Maximum albedo for deep snow– Serves as upper bound on surface albedo for deep snow in NCEP Noah LSM
– NCEP Operations: Pre-MODIS (1-deg)• Robinson and Kukla (1985, JAM, DMSP-based)
– NCEP Testing: Post-MODIS (0.05-deg)• Barlage and Zeng (2005, GRL, MODIS-based, JCSDA)
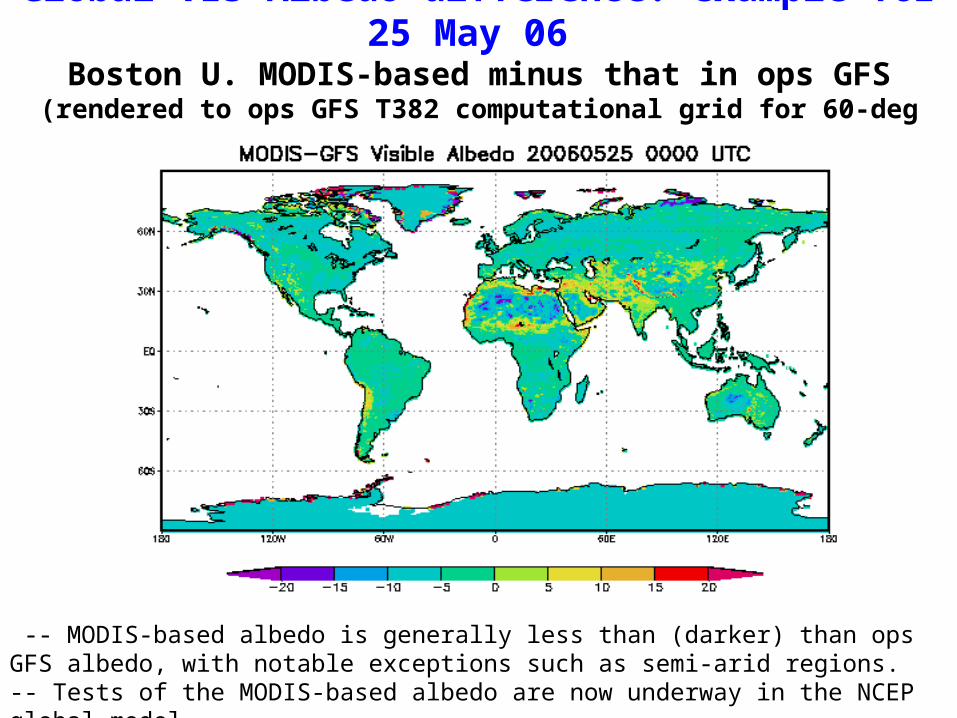
Global VIS Albedo difference: example for 25 May 06
Boston U. MODIS-based minus that in ops GFS(rendered to ops GFS T382 computational grid for 60-deg zenith angle)
-- MODIS-based albedo is generally less than (darker) than ops GFS albedo, with notable exceptions such as semi-arid regions. -- Tests of the MODIS-based albedo are now underway in the NCEP global model.

NCEP Operational 1-deg Max Snow Albedo:from Robinson and Kukla (1985, JAM)
DMSP visibile imagery based
NCEP Test Bed 0.05-deg Max Snow Albedo:from Barlage and Zeng (2005, GRL)
MODID-based

Application of MODIS Maximum Snow Albedo:Testing in WRF-NoahLSM coupled mesoscale model
(Barlage and Zeng, U. Arizona and JCSDA)
• Up to 0.5 C decreases in 2-m temperature in regions of high snow cover and significant albedo change
• Greater than 0.1 C increase in 2-m temperature even when snow depth is less than 1cm

LST: Land Surface Temperature Assimilation
• External initiatives– GMU / Paul Houser: separate talk this session
• Internal initiatives– GMAO / Rolf Reichle: separate talk this session– EMC / Ken Mitchell:
• LST assimilation via Noah LSM adjoint/tangent-linear model (presented at last year’s workshop)
• LST for verifying land surface simulations – next slides
LST: Land Surface Skin Temperature
• Satellite sources of LST– Geostationary (split window, sounder)– AVHRR– MODIS– SSMI, AMSU, other microwave platforms
• NCEP to date has utilized mostly GOES-based LST– Operational in NESDIS: hourly, 1/2-deg resolution– Test Bed at U.Md (R. Pinker): hourly, 1/8th-deg resolution– Split window technique through GOES (I-M)– Sounder technique most recently– Good definition of diurnal cycle
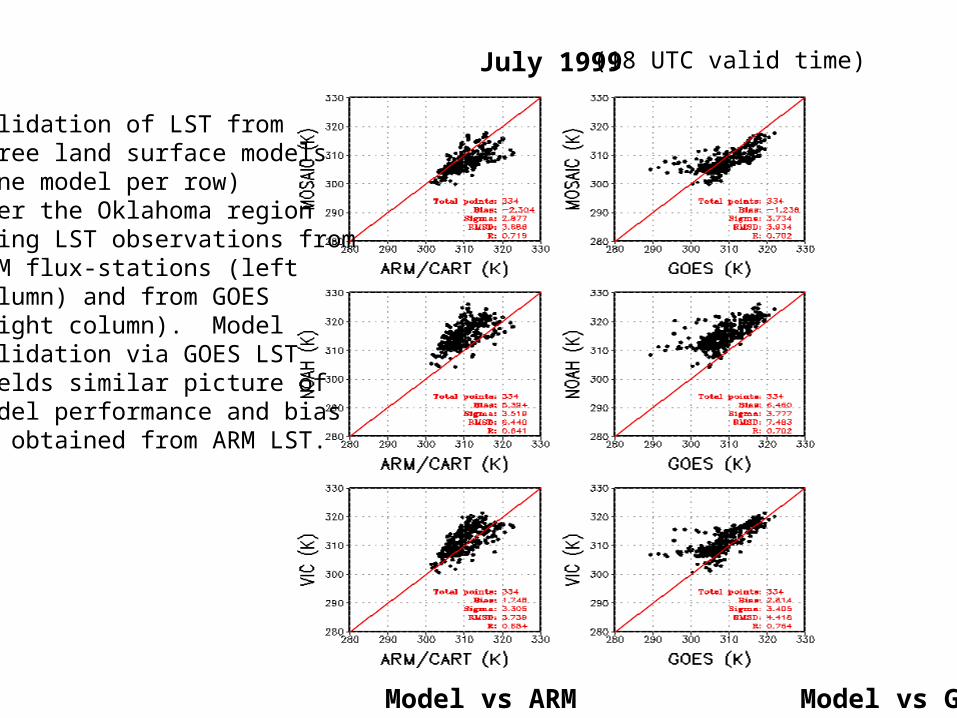
Model vs ARM Model vs GOES
July 1999 (18 UTC valid time)
Validation of LST fromthree land surface models(one model per row)over the Oklahoma regionusing LST observations fromARM flux-stations (left column) and from GOES (right column). Model validation via GOES LSTyields similar picture of model performance and biasas obtained from ARM LST.

LST Difference: Noah LSM simulated minus GOES-derived (18 UTC, 18 July 1999)(GOES LST is obtained only where GOES retrieval infers cloud-free conditions)
For Control Run of Noah LSMNoah LSM LST has notable warm bias
For Test Run of improved Noah LSM(e.g. revised humidity stress functionIn canopy resistance formulation)Noah LSM warm LST bias issubstantially reduced.
Snow Cover and Snowpack Assimilation
• External initiatives– U.Arizona / Mark Barlage: separate talk this session– Princeton.U / Raf Wojcik: separate talk this session
• Internal initiatives– HSB: MODIS snow cover assimilation– NESDIS/ORA and NCEP/EMC: next slides

NESDIS Northern Hemisphere IMS:Interactive Multi-sensor Snow-cover Analysis
• NESDIS has produced satellite-derive N.H. snow cover analyses since 1965 (nearly 40 years)– 1965-1996: weekly, 190-km resolution– Jan 1997- Jan 2004: daily, 24-km resolution– Feb 2004 – present: daily, new 4-km resolution
• IMS production is based on mix of:– A) automated satellite-based snow cover retrieval– B) human analysis of satellite imagery via interactive workstation
• time loops of geostationary and polar visible imagery
• IMS sources of automated satellite retrievals of snow:– GOES and Meteosat visible, SSM/I, MODIS
Satellite-derived snow cover was the FIRST satellite product of any kind ingested into NCEP operational NWP models

Example: NESDIS IMS Snow Cover Analysis of 26 Feb 2004 (4-km)(includes sea-ice cover)
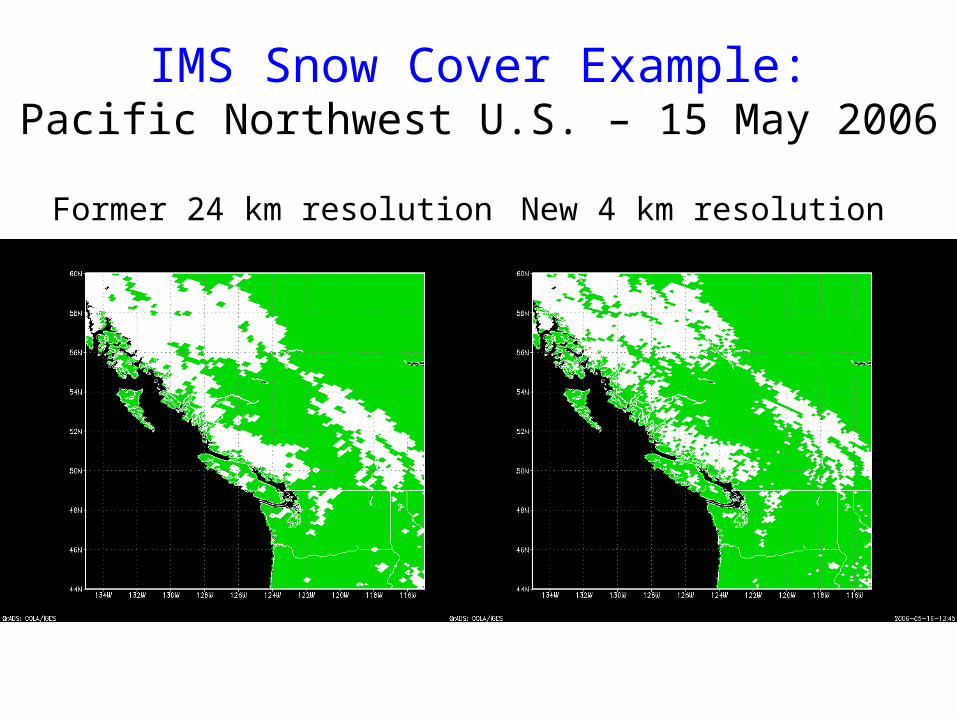
IMS Snow Cover Example:Pacific Northwest U.S. – 15 May 2006
Former 24 km resolution New 4 km resolution

Soil moisture assimilation
• External initiative– GMU / Paul Houser: separate presentation this session
• Internal initiative – GMAO / Rolf Reichle: separate presentation this session
Land Surface Emissivity
• External initiative (not funded by JCSDA)– Tom Schmugge: U. New Mexico, MODIS-based
• Internal initiative– John LeMarshall: AIRS based (hyper-spectral)– Fuzhong Weng: IR sfc emission derived from MW
Research to Operations Strategy
for Land Data Assimilation: Key thrusts for coming year
• Couple NASA/HSB Land Information System (LIS) to the NCEP GFS/GDAS via the Earth System Modeling Framework (ESMF)– NASA funded
• Substantially expand CRTM testing and focus in LIS– NCEP/EMC funded– MODIS, AIRS and MW-based surface emissivity
• Substantially expand Ensemble Kalman Filter component and testing in LIS– Joint NASA and NCEP and USAF
• Continue the expanding collaboration between NCEP/EMC, NASA/HSB, and NASA/GMAO in land data assimilation algorithms, methods, approaches