testing approaches for characterization and selection of ...meptec.org/resources/9 -...
TRANSCRIPT

Testing Approaches for Characterization and Selection of MEMS Inertial Sensorsby Dino Smajlovic and Roman Tkachevby Dino Smajlovic and Roman Tkachev
© 2016, ACUTRONIC © 2016, ACUTRONIC 1

Table of Contents
Summary & Introduction 3Summary & Introduction 3
Sensor Parameter Definitions 5
Selection of Sensor Parameters for Testing 9
Test Methodology 14Test Methodology 14
Test Procedures 21
Test Results 29
Conclusion 33
© 2016, ACUTRONIC 2
Conclusion 33
Content Summary
The presentation is dealing with the question of selecting proper MEMS inertial The presentation is dealing with the question of selecting proper MEMS inertial sensors for your device/application: how to choose sensors that best fit your needs? Sensor Parameter definitionSensor Parameter definition
This section will covers a variety of parameters that typically need to be characterized.
Test methodology overview gy This section will cover how to determine parameter characterization.
Sample test process A sample test report is reviewed demonstrating the parameters and p p g p
methodology discussed previously.
© 2016, ACUTRONIC 3

Introduction
Due to a large number of manufacturers of the inertial MEMS sensors it becomes obviousDue to a large number of manufacturers of the inertial MEMS sensors it becomes obvious selection process is more complicated than ever before.While some of the characteristics of the sensors are easily compared (price, size, number of axes, etc.), performance parameters are typically only partially defined by the manufacturers and can vary greatly from one to another and over different environmentsmanufacturers, and can vary greatly from one to another and over different environments.
Because the expected use of the products with the embedded inertial sensors (smartphones, wearables, smart helmets, VR sets, etc.) can vary greatly the best approach to select MEMS inertial sensors is by conducting characterization tests for a defined set ofto select MEMS inertial sensors is by conducting characterization tests for a defined set of parameters.
In this presentation we are describing the process of testing inertial MEMS sensors (accelerometers and gyroscopes) selection of the parameters and choosing test(accelerometers and gyroscopes), selection of the parameters and choosing test procedures to collect relevant data. Once the data is collected and the product application is considered selection of the appropriate sensors can be made.
© 2016, ACUTRONIC 4

Sensor Parameter Definitions
Inertial sensors measure object’s orientation and position in space Inertial sensors measure object’s orientation and position in space Gyroscopes (gyros), accelerometers and magnetometers are considered
inertial sensors Typically inertial sensor parameters can be divided into two groups: dynamic Typically inertial sensor parameters can be divided into two groups: dynamic
and static. Static measurements include:
Noise and zero input offset informationNoise and zero input offset information Dynamic tests include
Scale factor error and linearity, cross-axis sensitivity, misalignment, full scale range and bandwidth testingg g
Most of these parameters can be tested over temperature to identify any temperature sensitivity.
© 2016, ACUTRONIC 5

Sensor Parameter Definitions
In order to properly define each parameter we recommend using IEEE 2700 In order to properly define each parameter we recommend using IEEE 2700 Standard for Sensor Performance Parameter Definitions by the IEEE Standards Association
In 2012, Intel Corp and Qualcomm Technologies, Inc. published a document to establish an industry standard minimum set of MEMS performance parameters: Standardized Sensor Performance Parameter Definitions (Rev 1)
Later, that working standard become an officially sanctioned standard by IEEE: 2700-2014 - IEEE Standard for Sensor Performance Parameter Definitions
Currently work for is underway for the next edition of the standard
For more information on inertial parameters IEEE Standards dedicated to
© 2016, ACUTRONIC 6
inertial sensors only are released and maintained by Gyro and Accelerometer panel

Some of the Sensor Parameter Definitions from IEEE 2700
Noise – The smallest measurable change in rotation rate expressed as the root mean square (RMS) and calculated as the standard deviation of a minimum of 10,000 sample points under vibration isolation and zero rotational input
Allan Variance – Allan variance is a time domain analysis technique used to determine the character of the underlying random processes that give rise to the data noise It helps identify the source of a given noise term present in thethe data noise. It helps identify the source of a given noise term present in the data
Zero Rate Bias – Zero rotation rate output deviation from expected zeroZero Rate Bias Zero rotation rate output deviation from expected zero rotation rate output value for each sensing axis
© 2016, ACUTRONIC 7

Some of the Sensor Parameter Definitions from IEEE 2700
Sensitivity – The change in rotational rate input corresponding to 1 least significant bit (unit in which digital values are counted) change in output.
Non-Linearity Error – Maximum deviation of measured output from the best fit straight line
Cross-Axis Sensitivity – Ratio of the measured rotation rate for an axis to the input rotational rate along each axis orthogonal to the measured axis.
F ll S l R P k t k t f th h Full Scale Range – Peak to peak measurement range of the sensor per each orthogonal axis.
© 2016, ACUTRONIC 8

Selection of Sensor Parameters for Testing
So which tests are appropriate for your sensor?– It all depends on the application!
In AHRS systems at least zero rate bias (over temperature) and sensitivity/non-linearity should be tested → they are the biggest error contributors to the final orientation angles
Noise and Allan variance measurements should be performed to identify “goodness” of the sensors, impact of noise on error budget, and long term tendency of the sensortendency of the sensor
For high speed rotation/high dynamic applications, bandwidth and full scale range are important → they define sensors ability to track the motion and
© 2016, ACUTRONIC
range are important → they define sensors ability to track the motion and identify the point at which the saturation of the output occurs
9
Selection of Sensor Parameters for Testing
It is very important to keep in mind the end use of the device as that information can drastically decrease the complexity and duration of the tests
– In general, all MEMS sensors, including inertial, are temperature sensitive and performance will be affected by variations in temperature
– If the device is known to work only over a defined temperature range then testing should be performed over that range
E i t ith hi h ib ti t t l ti l i t f– Environments with high vibration content also negatively impact performance; if a device containing inertial sensors is expected to encounter high levels of vibration, then sensors should be tested over vibration environments
© 2016, ACUTRONIC 10

Selection of Sensor Parameters for Testing
When doing thermal testing most companies perform testing at a limited number of discrete temperature points
– Most often 3 temperature points are used (maximum, minimum and room temperature)
– However, if the device is expected to be used over a broader temperature range it may be appropriate to perform thermal testing over the entire range while slewing, at a predetermined temperature rate, from one set point to anotheranother.
– This step could be used during characterization of the sensors
© 2016, ACUTRONIC 11
Selection of Sensor Parameters for Testing
Benefits of doing more thorough thermal testing– It allows for screening of the unusual behavior of the sensors that would
otherwise be undetected by testing at a few discrete temperature points
– Slewing at a predefined ramp rate, for example 1 or 2 °C/min, could mimic the real environment that the device sensor will experience
– If you choose to collect data during the ramp up or down you will get a better model of sensor performance between the set temperatures.
© 2016, ACUTRONIC 12
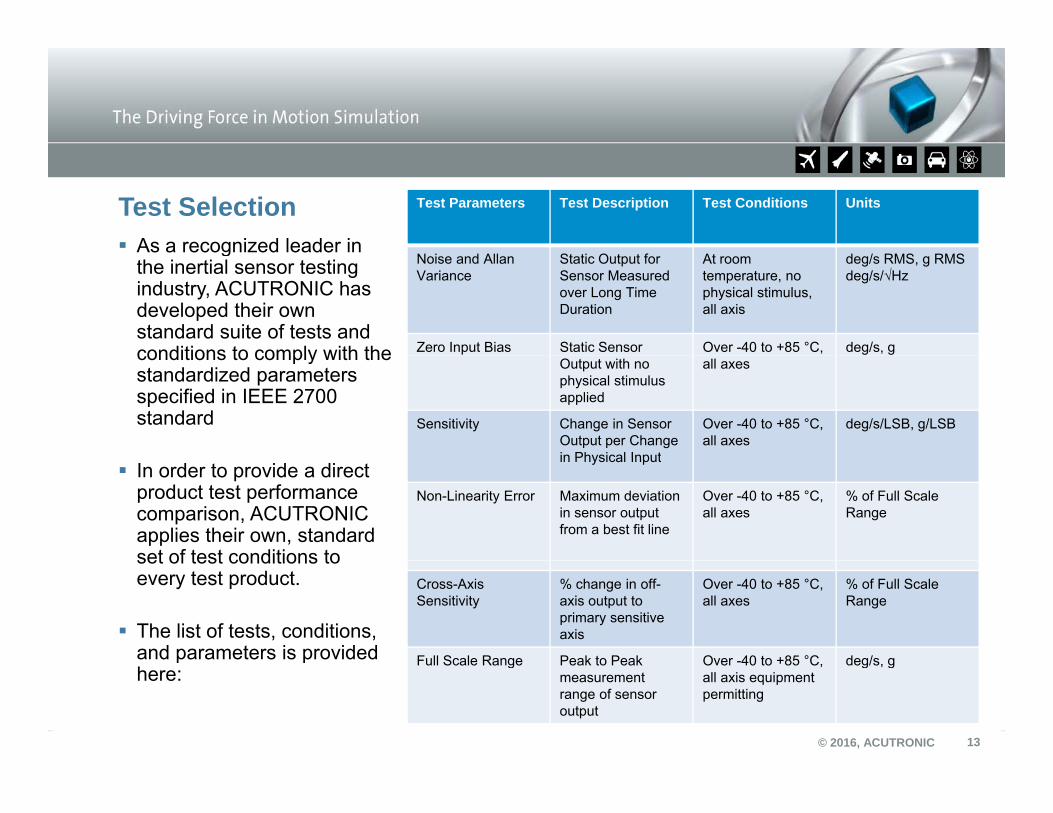
As a recognized leader in
Test Selection Test Parameters Test Description Test Conditions Units
gthe inertial sensor testing industry, ACUTRONIC has developed their own standard suite of tests and conditions to comply with the
Noise and AllanVariance
Static Output for Sensor Measured over Long Time Duration
At room temperature, no physical stimulus, all axis
deg/s RMS, g RMSdeg/s/√Hz
Zero Input Bias Static Sensor Over -40 to +85 °C, deg/s, gconditions to comply with the standardized parameters specified in IEEE 2700 standard
Output with no physical stimulus applied
all axes
Sensitivity Change in Sensor Output per Change in Physical Input
Over -40 to +85 °C, all axes
deg/s/LSB, g/LSB
In order to provide a direct product test performance comparison, ACUTRONIC applies their own, standard set of test conditions to
in Physical Input
Non-Linearity Error Maximum deviation in sensor outputfrom a best fit line
Over -40 to +85 °C, all axes
% of Full Scale Range
set of test conditions to every test product.
The list of tests, conditions, and parameters is provided
Cross-Axis Sensitivity
% change in off-axis output to primary sensitive axis
Over -40 to +85 °C, all axes
% of Full Scale Range
Full Scale Range Peak to Peak Over -40 to +85 °C deg/s g
© 2016, ACUTRONIC
p phere:
13
Full Scale Range Peak to Peak measurement range of sensor output
Over 40 to +85 C, all axis equipment permitting
deg/s, g

Test Methodology
Several hardware platforms that can be used to test both the dynamic and static properties of MEMs sensors. It is possible to use 1-, 2- or 3-axis rate table test systems. Since the market trend is towards full 6 (9) degrees of freedom IMU, a 2-axis rate table provides enough flexibility to perform almost all test groups on all axes in a reasonableprovides enough flexibility to perform almost all test groups on all axes in a reasonable time frame. This section discusses test principles applied to such IMUs.
2-AXIS RATE TABLEACUTRONIC AC216
© 2016, ACUTRONIC 14
ACUTRONIC AC216

Test Methodology Static Tests25 ºC
-40 ºC85 ºCTemperature
Cycle
Zero Input Bias– For gyros, the zero input offset tests can be done with
sensitive axis in any orientation and no rotational motion of the rate table The data can be collected over a 3 minute period at
0 ºC45 ºCrate table. The data can be collected over a 3 minute period at each chosen temperature. At least 5 temperature points should be used, both extremes, ambient and two more temperature in between the 3 others.For accelerometers the sensitive axis has to be placed– For accelerometers, the sensitive axis has to be placed parallel to Earth’s gravity thus providing a zero G input. As such, the motion platform would have to be repositioned at least once to align the 3rd IMU axis parallel to the Earth’s gravity The same temperature profile can be used as forgravity. The same temperature profile can be used as for gyros.
– Both accelerometers and gyros can be tested at the same time during the static tests with the exception being one axis of
l h ld d ddi i l li i
© 2016, ACUTRONIC 15
an accelerometer that would need additional sampling time after proper alignment.

Test Methodology Static Tests25 ºC
-40 ºC85 ºCTemperature
Cycle
Noise Characteristics– These tests should be run at higher sensor sampling rates, as
close to sensor ODR as possible.O er a long period of time (3 to 6 ho rs) to allo eno gh data
0 ºC45 ºC– Over a long period of time (3 to 6 hours) to allow enough data
for statistical analysis.– No reorientation of IMU is needed and data sampling for
accelerometers and gyroscopes can be done at the same time.
– Noise is calculated in terms of the smallest change of rotation measurements in a rotation-resistant environment with no input rotation.
– The Allan Variance computation calculates the random variation in the sensor output due to white noise, random walk, bias instability, etc.
– All the above tests can be done over temperature as well thus
© 2016, ACUTRONIC 16
– All the above tests can be done over temperature as well thus making this a very lengthy portion of the testing.
Test Methodology Dynamic Tests25 ºC
-40 ºC85 ºCTemperature
Cycle
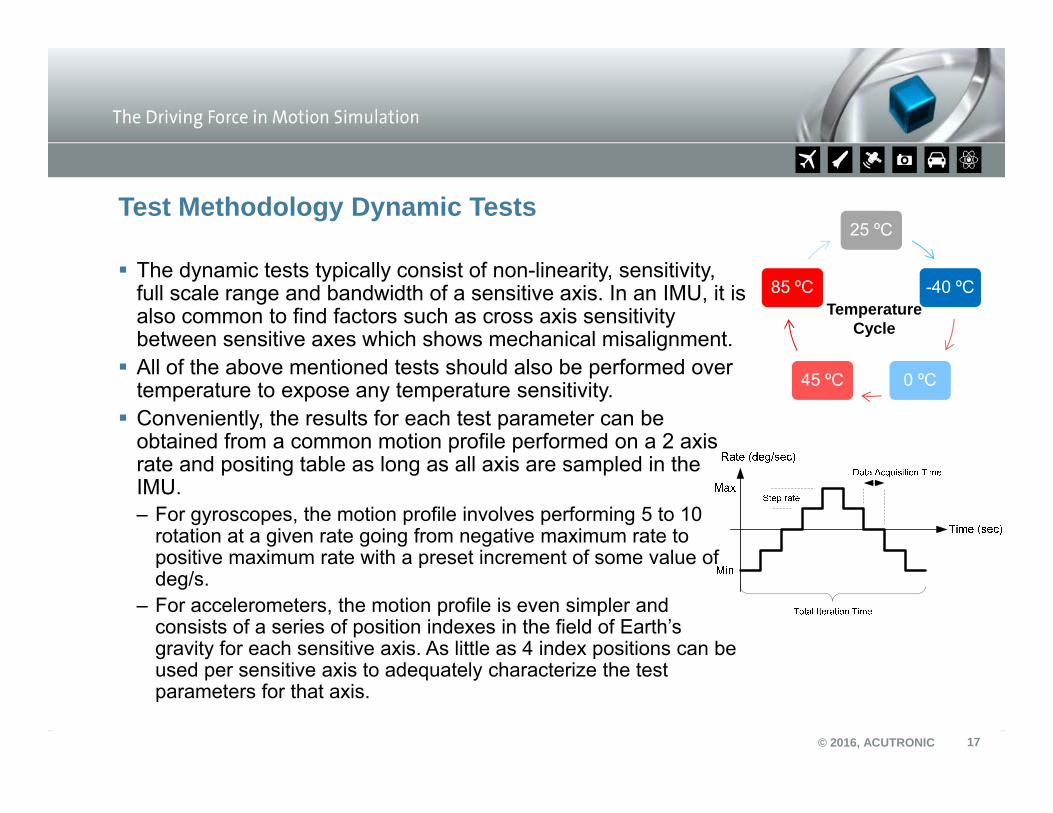
The dynamic tests typically consist of non-linearity, sensitivity, full scale range and bandwidth of a sensitive axis. In an IMU, it is also common to find factors such as cross axis sensitivity between sensitive axes which shows mechanical misalignment.
0 ºC45 ºC All of the above mentioned tests should also be performed over temperature to expose any temperature sensitivity. Conveniently, the results for each test parameter can be
obtained from a common motion profile performed on a 2 axis t d iti t bl l ll i l d i thrate and positing table as long as all axis are sampled in the
IMU.– For gyroscopes, the motion profile involves performing 5 to 10
rotation at a given rate going from negative maximum rate to positive maximum rate with a preset increment of some value ofpositive maximum rate with a preset increment of some value of deg/s.
– For accelerometers, the motion profile is even simpler and consists of a series of position indexes in the field of Earth’s gravity for each sensitive axis. As little as 4 index positions can be
d iti i t d t l h t i th t t
© 2016, ACUTRONIC 17
used per sensitive axis to adequately characterize the test parameters for that axis.

Test Methodology Dynamic Tests
One parameter that takes an exception to a single motion profile is full scale range.– For accelerometers, that have a full scale range
above 1G. Centrifugal force has to be used in order to obtain data at higher Gs. Centrifugal force is defined as the product of the radius and the square of the angular rate Figure to the rightthe square of the angular rate. Figure to the right shows an IMU at a radius to center of rotation. In this case Y axis will experience the G forces.
– For gyroscopes, remounting of the x and y axis maybe necessary to be in plane with table axis if the tilting axis is not able to achieve the same rates as the table axis. In the figure to the right z axis is in plane with the table axis
© 2016, ACUTRONIC
axis is in plane with the table axis.
18

Test Methodology Dynamic Tests
Another parameter that usually takes an exception to using a rate table as a test platform all together is bandwidth
Since most accelerometers and gyros have higher bandwidth (in 100s of Hz) specification, the best tool for this job would be a linear and an angular vibration platform for accelerometers and gyroscopes respectivelyaccelerometers and gyroscopes respectively
© 2016, ACUTRONIC 19
ACUTRONIC 105-AVT

Test Methodology Dynamic Tests
Bandwidth– The test profile for each
type of inertial sensor consists of a logarithmicconsists of a logarithmic or linear frequency sweep from 5 to 2000 Hz on each motion platform while recording the IMU output at maximum sampling rate possible (as close to sensor ODR as possible).
© 2016, ACUTRONIC 20

Test Procedure
Following the methodology described in previous slides ACUTRONIC has Following the methodology described in previous slides ACUTRONIC has tested three 3-axis MEMs gyroscopes from Bosch Sensortec, InvenSenseand STMicroelectronics
The devices used were BMG160, MPU-3050 and L3G3200D
Bandwidth tests were not performed on these devicesBandwidth tests were not performed on these devices
© 2016, ACUTRONIC 21
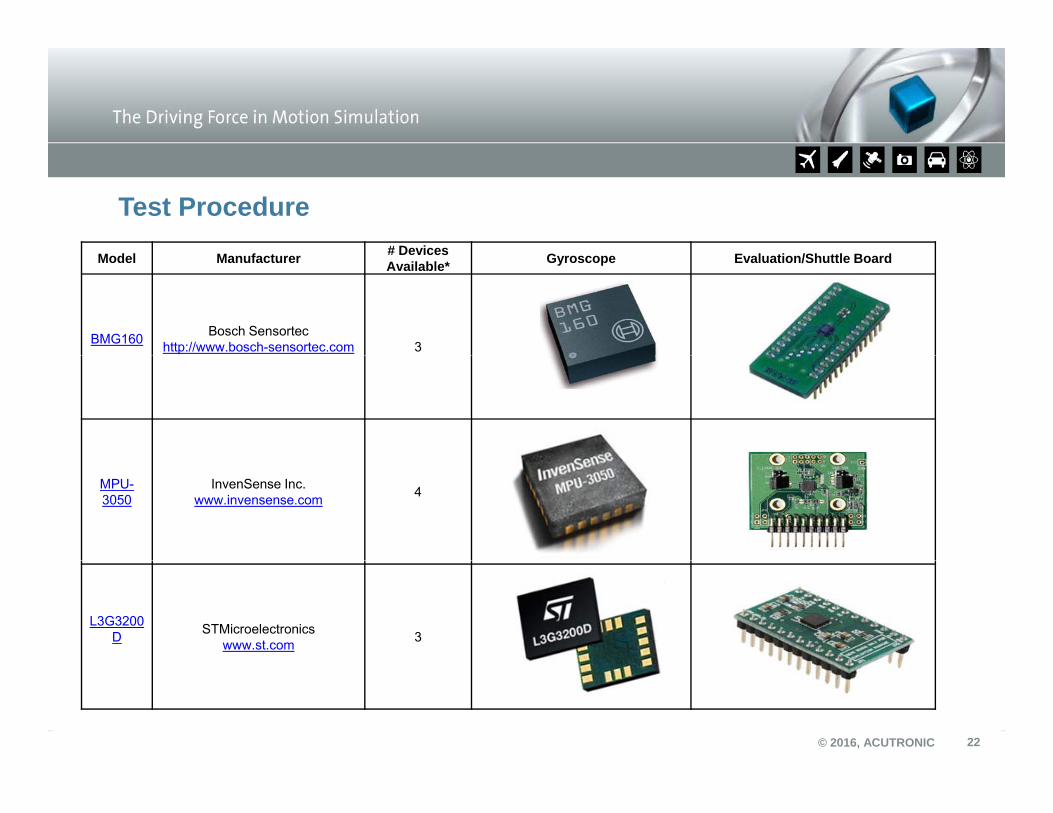
Test Procedure# DevicesModel Manufacturer # Devices Available* Gyroscope Evaluation/Shuttle Board
BMG160 Bosch Sensortechttp://www.bosch-sensortec.com 3
MPU-3050
InvenSense Inc.www.invensense.com 4
L3G3200D STMicroelectronics
www.st.com 3
© 2016, ACUTRONIC 22

Test Procedure – UUT Orientation
ACUTRONIC 2-Axis AC277 Rate Table
MountedBosch BMG160
Axis 1 - CW - Positive (+) Z Negative (-)
MountedOrientation
Onboard ChipOrientation
Axis 1 - CCW - Negative (-) Z Positive (+)
Axis 2 - CCW - Positive (+)* Y Positive (+)
Axis 2 - CW - Negative (-)* Y Negative (-)
Axis 3 - CCW - Positive (+)** X Negative (-)
Axis 3 CW Negative ( )** X Positive (+)Axis 3 - CW - Negative (-)** X Positive (+)
*These results assume ACUTROL Axis 1 is at 0 º.
**The AC277 only has two axes. In order to test the 3rd gyroscope axis, we rotated the ACUTROL Axis 1b 90º d d A i 2
© 2016, ACUTRONIC 23
by 90º and used Axis 2.

Test Procedure – UUT Orientation
ACUTRONIC 2-Axis AC277 Rate Table
MountedInvensense MPU3050
Axis 1 - CW - Positive (+) Z Negative (-)
MountedOrientation
Onboard ChipOrientation
Axis 1 - CCW - Negative (-) Z Positive (+)
Axis 2 - CCW - Positive (+)* Y Positive (+)
Axis 2 - CW - Negative (-)* Y Negative (-)
Axis 3 - CCW - Positive (+)** X Negative (-)
A i 3 CW N ti ( )** X P iti ( )Axis 3 - CW - Negative (-)** X Positive (+)
*These results assume ACUTROL Axis 1 is at 0 º.
**The AC277 only has two axes. In order to test the 3rd gyroscope axis, we rotated the ACUTROL Axis 1b 90º d d A i 2
© 2016, ACUTRONIC 24
by 90º and used Axis 2.
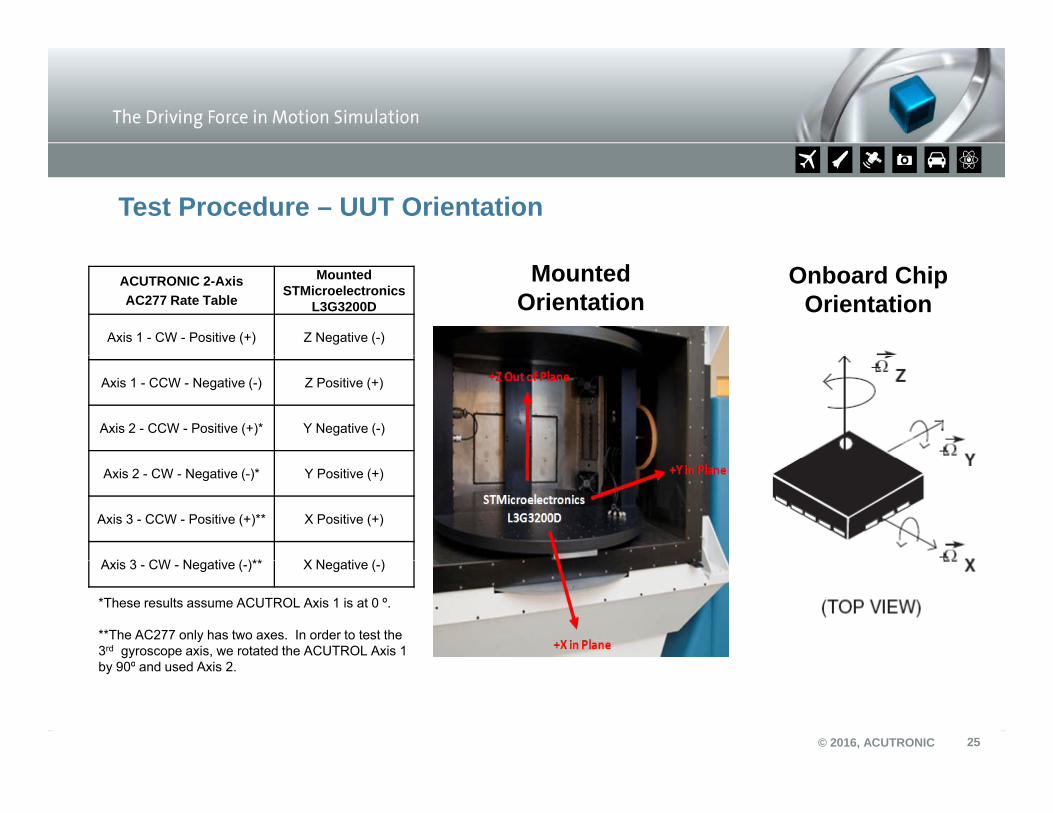
Test Procedure – UUT Orientation
ACUTRONIC 2-Axis AC277 Rate Table
MountedSTMicroelectronics
L3G3200D
Axis 1 - CW - Positive (+) Z Negative (-)
MountedOrientation
Onboard ChipOrientation
Axis 1 - CCW - Negative (-) Z Positive (+)
Axis 2 - CCW - Positive (+)* Y Negative (-)
Axis 2 - CW - Negative (-)* Y Positive (+)
Axis 3 - CCW - Positive (+)** X Positive (+)
A i 3 CW N ti ( )** X N ti ( )Axis 3 - CW - Negative (-)** X Negative (-)
*These results assume ACUTROL Axis 1 is at 0 º.
**The AC277 only has two axes. In order to test the 3rd gyroscope axis, we rotated the ACUTROL Axis 1b 90º d d A i 2
© 2016, ACUTRONIC 25
by 90º and used Axis 2.

The testing is divided into three sessions:
Test Procedure 25 ºC
The testing is divided into three sessions: – First Session:
1. Data is recorded during all stages of the test at 50 Hz via I2C.a) All devices are mounted on a rate table inside a temperature
-20 ºC
-40 ºC85 ºC
65 ºC
TemperatureCycle
chamber. Starting at 25 degrees C, the temperature is controlled at +/-1 °C/min. Data is recorded during the transition periods. 0 ºC45 ºC
b) The temperature cycles negative and then positive stopping at the followingthen positive stopping at the following key temperatures in Celsius: 25, -20, -40, 0, 45, 85, 65, 25. At each stable temperature, a soak of 1.5 hours with no rotational input is recorded.
b) After each soak, before progressing to the next temperature step, the following input rates are applied to the devices for 5 revolutions per rate:
© 2016, ACUTRONIC 26
-2000 to 2000 deg/s (at +/-100 deg/s intervals) for Z axis. -500 to 500 deg/s (at +/- 100 deg/s intervals) for X and Y axes.
Test Procedure
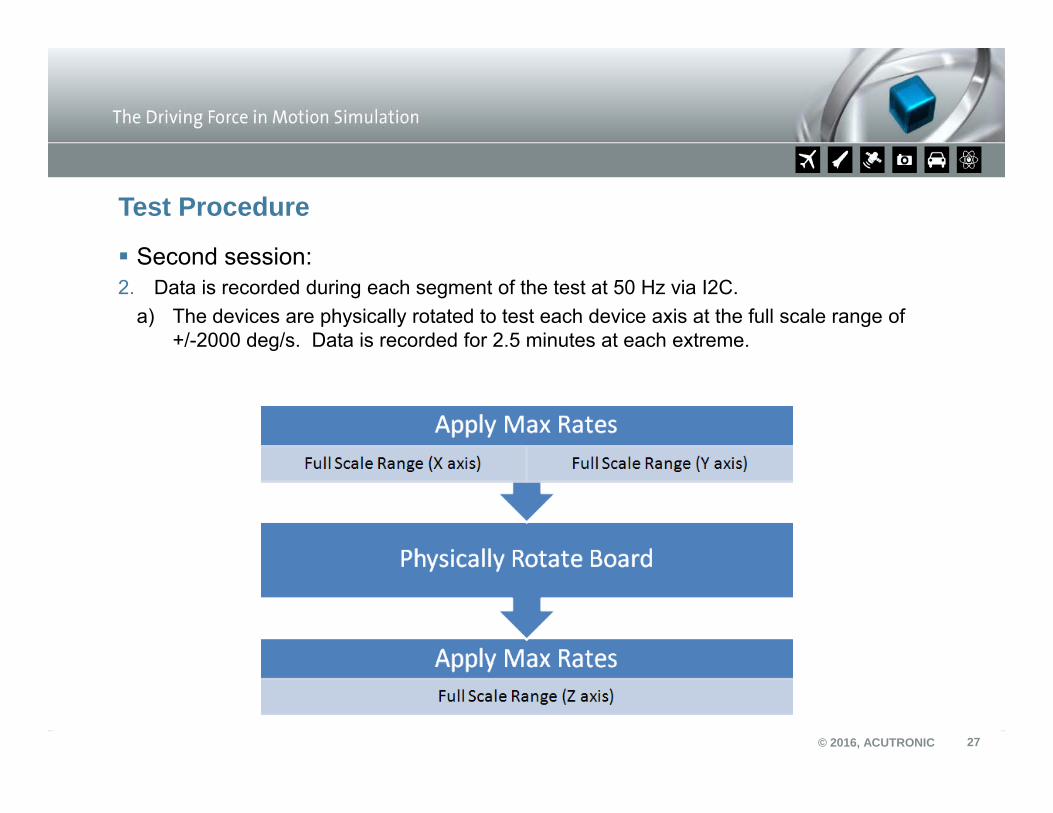
Second session: Second session: 2. Data is recorded during each segment of the test at 50 Hz via I2C.
a) The devices are physically rotated to test each device axis at the full scale range of +/-2000 deg/s. Data is recorded for 2.5 minutes at each extreme.
© 2016, ACUTRONIC 27
Test Procedure
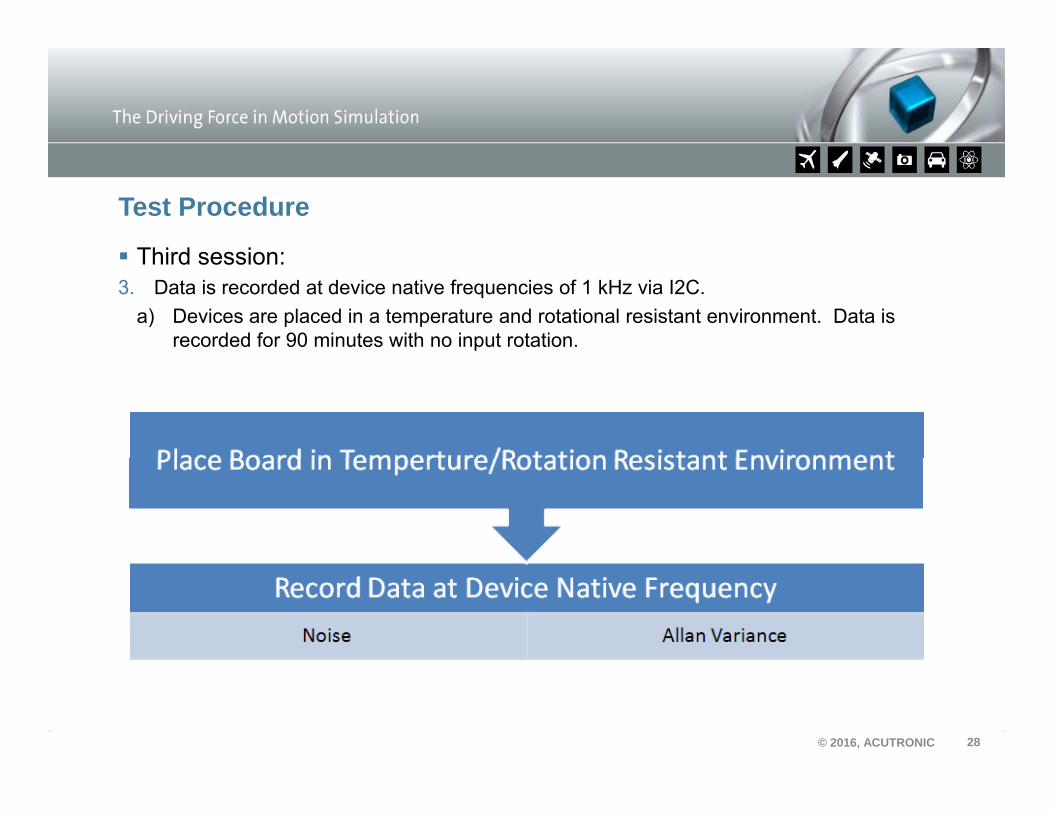
Third session: Third session: 3. Data is recorded at device native frequencies of 1 kHz via I2C.
a) Devices are placed in a temperature and rotational resistant environment. Data is recorded for 90 minutes with no input rotation.
© 2016, ACUTRONIC 28

Test Procedure – Results Noise Tests
RMS Noise calculated for each type of sensor
© 2016, ACUTRONIC 29

Test Procedure – Results Noise Tests Allan Variance calculated for each type of sensoryp
More data on:Noise and Allan VarianceNoise and Allan VarianceZero Input Bias SensitivityNon-Linearity ErrorCross-Axis SensitivityPerformance over temperatureavailable from ACUTRONIC
© 2016, ACUTRONIC 30

Test Procedure – Results Dynamic Tests Full Scale Range for each type of sensorg yp
© 2016, ACUTRONIC 31
Test Procedure – Results Dynamic Tests Cross-Axis Sensitivity for each type of sensory yp
BMG160 MPU3050 L3G3200DParameter Units Mean Mean MeanNoise gyroX deg/s RMS 0.243 0.094 0.202Noise gyroY deg/s RMS 0.269 0.091 0.247Noise gyroZ deg/s RMS 0.222 0.080 0.667gy g/AllVar gyroX deg/s/√Hz 0.047 0.020 0.092AllVar gyroY deg/s/√Hz 0.054 0.020 0.040AllVar gyroZ deg/s/√Hz 0.036 0.017 0.116
Zero Rate Bias gyroX deg/s ±2.63 ±1.744 ±2.139Zero Rate Bias gyroY deg/s ±2.593 ±0.880 ±0.671Zero Rate Bias gyro Z deg/s ±3.010 ±1.582 ±1.203
Z R t Bi T C f X d / /d C ±0 002 ±0 021 ±0 032
More data on:Noise and Allan VarianceZeroRateBiasTempCoef gyroX deg/s/degC ±0.002 ±0.021 ±0.032
ZeroRateBiasTempCoef gyroY deg/s/degC ±0.005 ±0.023 ±0.014ZeroRateBiasTempCoef gyroZ deg/s/degC ±0.001 ±0.106 ±0.023
Sensitivity gyroX deg/s/LSB 0.061 0.060 0.063Sensitivity gyroY deg/s/LSB 0.061 0.064 0.063Sensitivity gyroZ deg/s/LSB 0.061 0.062 0.070
SensitivityTempCoef gyroX %/degC ±0.010 ±0.016 ±0.023
Noise and Allan VarianceZero Input Bias SensitivityNon-Linearity Error
SensitivityTempCoef gyroY %/degC ±0.003 ±0.010 ±0.027SensitivityTempCoef gyroZ %/degC ±0.001 ±0.003 ±0.008
Integral NLE gyroX % FSR ±0.04 0.049 0.337Integral NLE gyroY % FSR ±0.049 0.062 0.151Integral NLE gyroZ % FSR ±0.094 0.017 0.118CrossAxis gryoXY % ±0.075 ±0.522 ±1.235CrossAxis gyroXZ % ±1 781 ±1 162 ±0 452
Cross-Axis SensitivityPerformance over temperatureavailable from ACUTRONIC
© 2016, ACUTRONIC 32
CrossAxis gyroXZ % ±1.781 ±1.162 ±0.452CrossAxis gyroYZ % ±0.649 ±3.719 ±0.627CrossAxis gyroYX % ±0.077 ±0.775 ±1.041CrossAxis gyroZX % ±1.708 ±0.714 ±0.701CrossAxis gyroZY % ±0.427 ±2.051 ±0.105

Conclusion – Testing Approaches
Integrator of MEMS inertial sensors should select testing parameters based on expected application of the device containing MEMS inertial sensors
IEEE 2700 Standard should be used to define parameters that are to be tested
Test methodology needs to be defined, Acutronic can help
Based on test results, developers and integrators can make sensor selection b d ifi d f th t li ti (i l i l bi hi hbased on specific needs for that application (i.e. low noise, low bias, high sensitivity, etc.)
This type of testing provides additional differentiation for the MEMS sensors
© 2016, ACUTRONIC 33
This type of testing provides additional differentiation for the MEMS sensors selection process (in addition to cost, size and power requirements)

Conclusion – Testing Approaches
For example, in the data set one type of sensor (InvenSense MPU3050) has significantly lower Noise RMS values than the other two sensors– If RMS Noise is a very important parameter for the given application this
sensor would have been the choice for that application
Testing also allows comparison of actual live sensors data to manufacturer’s bli h d ifi tipublished specifications
– It provides valuable measurement of “quality” of performance
With th t i i d ACUTRONIC h t l b (iTS L b) t id t ti With that in mind ACUTRONIC has set up a lab (iTS Lab) to provide testing services to encourage wider application of the IEEE 2700 Standard– iTS Lab enables such testing for all types of inertial MEMS sensors
© 2016, ACUTRONIC 34

www.acutronic.com
Thank you for your attention!For more information contact:For more information contact:Dino [email protected] 926 1192412-926-1192
© 2016, ACUTRONIC 35