testing and modeling of nonlinear properties of shock
TRANSCRIPT

Abstract—The objective of this work is to develop a new
testing and analysis methodology to obtain the nonlinear
characteristics of an automotive shock absorber. The front
shock absorber on a Mazda CX-7 was tested on the single-post
shaker test bench. The shock absorber piston velocity test range
is between 0.01m/s and 1.3m/s, corresponding to typical
velocities of a vehicle suspension generated by road
irregularities. Three shock absorber models were built and
validated using experimental shock absorber data. The power
function model and polynomial model accurately capture the
nonlinear characteristics of a shock absorber and can be
quickly fit to experimental data for use in vehicle simulations.
The influence of the shock absorber models on vehicle dynamics
in vertical direction was analyzed.
Index Terms—shock absorber, nonlinearity, vehicle
dynamics.
I. INTRODUCTION
A key aspect of vehicle research is improving ride quality
and handling performance. Target comfort and handling
performance can be achieved through analysis and
modification of the vehicle and modification of its
subsystems such as the electronic stability control and the
suspension controller [1,2,3]. These control systems operate
by comparing vehicle dynamic behavior to a pre-determined
mathematical vehicle model. Therefore, high fidelity
mathematical models that accurately capture the dynamics of
the vehicle suspension system and predict the vehicle
behavior are critical.
A key element in any vehicle suspension system is the
shock absorber. It plays a vital role in the vertical and
horizontal motion of the vehicle. The accuracy of the vehicle
model is highly dependent on the accuracy of the shock
absorber model. The shock absorber is also one of the most
non-linear and complex suspension system elements to
model. There are two approaches to model shock absorbers:
physical modeling based on physical and geometrical data,
and nonparametric modeling based on experimental data.
Each of them has particular advantages and disadvantages.
Manuscript received July 16, 2010.
Yan Cui is with the Beijing Institute of Technology, National Engineering Laboratory for Electric Vehicles, Beijing, 100081, China (phone:
864-320-0873; fax: 864-283-7208; e-mail: yanc@ clemson.edu).
Thomas R. Kurfess is with the Clemson University International Center for Automotive Research, 4 Research Drive, SC 29607 USA (e-mail:
Michael Messman is with the Clemson University International Center for Automotive Research, 4 Research Drive, SC 29607 USA (e-mail:
A. Physical Model of Shock Absorber
Physical models, which are based on a detailed description
of the shock absorber‟s internal structure and ensuing
dynamics during operation, describe the behavior in a large
range of operating conditions very accurately (and are the
most satisfactory ones from the theoretical point of view), but
they are usually computationally complex, requiring time
consuming computations when implemented in a full vehicle
simulation. They contain several parameters whose values
can only be determined by expensive measurements with
special testing equipment. And even a small change of the
shock absorber design may require an adjustment of the
model and a new set of measurements, which in general can
only be performed by the manufacturer of the shock absorber
[4,5,6].
Lang developed a comprehensive physical damper model
in 1977 [5]. This model includes approximately 80
parameters, is computationally complex, and is not suitable
for comprehensive vehicle simulation studies or system
identification. Later, Lang‟s model was condensed and
validated by Morman [6]. Morman‟s model has been shown
to be useful for studying the effects of design changes for a
particular shock. Reybrouck developed a physical model
with fewer parameters in 1994, valid for frequencies up to 20
Hz [7]. This model relied on semi-empirical coefficients, and
did not consider the effect of internal modifications on
damper performance. Talbott developed a model of an Öhlins
NASCAR Nextel Cup shock in 2002 that considered the
effect of damper tuning parameters, such as shim stack
stiffness, shim stack preloads, and bleed orifice area on
damper performance [8]. Emmons extended Talbott‟s model
to include the head valve used in current Penske NASCAR
Nextel Cup shocks [9].
B. Nonparametric Model of Shock Absorber
Nonparametric models establish a relationship between
measured quantities, by purely mathematical means; the
occurring parameters do not have a direct physical meaning.
For the shock absorber, this is the relationship between the
shock force and velocity. In this approach, a shock absorber
is characterized by a „black-box‟ system for a specific range
of test conditions. In contrast to physical models,
nonparametric models accurately describe the behavior of the
system for a limited range of operating conditions that are
tested. Furthermore, this approach yields computationally
efficient models that can easily be adapted to a new set of test
data.
A nonparametric model from experimental data using
system identification techniques has been developed by
Alanoly [10]. The model based on a restoring force surface
Testing and Modeling of Nonlinear Properties of
Shock Absorbers for Vehicle Dynamics Studies
Yan Cui, Thomas R. Kurfess, and Michael Messman
Proceedings of the World Congress on Engineering and Computer Science 2010 Vol II WCECS 2010, October 20-22, 2010, San Francisco, USA
ISBN: 978-988-18210-0-3 ISSN: 2078-0958 (Print); ISSN: 2078-0966 (Online)
WCECS 2010

mapping has been developed [11]. The model considers the
force to be a function of displacement and velocity. Although
this model is limited to single frequency excitation, it serves
as a useful tool for identifying nonlinearities in a system.
A comprehensive physical model of the shock absorber is
necessary to study the effects of design changes and to tune
the shock absorber to obtain the desired performance.
However, if the objective is to characterize the performance
of shock absorbers for full vehicle simulations, the
nonparametric modeling approach is appropriate.
This paper develops three shock absorber models that can
be quickly fit to experimental data and used for vehicle
simulation. These models are based on the understanding that
the shock absorber is predominantly a velocity-dependent
device. The paper is organized as follows: in section II, a
single-post shaker test bench is introduced and the
experimental procedure for the shock absorber testing is
described. In section III, three shock absorber models are
presented and the models are validated via experimental data.
In section IV, the influence of shock absorber models on
vehicle vertical dynamics was analyzed. In section V, future
opportunities for enhancing the shock models are discussed.
II. SHOCK ABSORBER TEST
A. Single-Post Shaker Test Bench
To develop a shock absorber model, the front shock
absorber on the Mazda CX-7 was tested on a shock absorber
test bench that was designed using a modified MTS
single-post shaker, as shown in Fig. 1. A frame with an
integrated load cell was built to mount the shock absorber.
This test bench is actuated by a 40kN hydraulic cylinder, able
of 10 inches of stroke. The system has excellent frequency
response up to 80 Hz and velocities of 1.5 m/s.
The test bench is equipped with force, displacement and
acceleration transducers. During the test, measurements of
shock position, acceleration, and shock absorber force were
recorded. The displacement was measured by a string pot and
also a LVDT (Linear Variable Differential Transformer) that
is installed on the single-post shaker.
It is widely known that shock absorber characteristics vary
with temperature. To account for temperature effects, the
shock absorber was instrumented with a thermocouple
located on the outside of the main body of the shock absorber.
The shock absorber was then excited and warmed up to 30ºC
prior to each test.
Fig. 1: Mazda CX-7 Shock Absorber on a Modified MTS Vibration
Table
B. Data Acquisition
During each test, measurements of shock position,
acceleration, shock force, and temperature were recorded at
2kHz using a SoMat eDAQ system, as shown in Fig. 2. The
SoMat eDAQ is a portable stand-alone data acquisition
system for testing in a wide range of environments. It has
built in signal conditioning and the capability to perform a
broad range of on-board data processing.
C. Shock Absorber Test Input Excitation
Tests on the single-post shaker are controlled by an MTS
407 controller. The controller allows for a wide variety of
inputs, including sine waves, triangle waves and square
waves. In this project, sinusoidal excitations with different
amplitudes and frequencies were used to obtain the behavior
of shock absorber at varying shock velocities. The input
signals that were used during the test are shown in Table I.
These values allow the shock absorber to work in the range of
0.01m/s to 1.3m/s, which correspond to typical velocities
encountered by a vehicle suspension due to road
irregularities.
The data for all the tests were extracted from the Infield
eDAQ native) software format into LabVIEW for further
analysis.
D. Shock Absorber Test Results
Test results of a sine wave input with 15mm amplitude at
15Hz are shown in Fig. 3. From the test results, the velocity
dependent nature of the device is evident, validating the use
of a force-velocity model.
From the data it is clear that the shock absorber force is a
strongly nonlinear function of the piston velocity, and the
behavior is not symmetrical with respect to velocity direction
Fig. 2: SoMAT eDAQ System used for the Shock Absorber Test
Table I: Summary of Sine Wave Inputs
Amplitude
(mm)
Frequency
(Hz)
5 30, 40, 50, 60
10 15, 20, 25, 30, 35
15 10, 15, 20, 25
20 5, 10, 15, 20
30 3, 5, 8, 10, 15
50 0.1, 0.5, 1, 1.5, 2, 3, 5, 10
Proceedings of the World Congress on Engineering and Computer Science 2010 Vol II WCECS 2010, October 20-22, 2010, San Francisco, USA
ISBN: 978-988-18210-0-3 ISSN: 2078-0958 (Print); ISSN: 2078-0966 (Online)
WCECS 2010

(compression and rebound), as shown in Fig. 3(b). This
nonlinearity makes the force in the rebound phase (when
damper rod moves outwards from the damper body) greater
than in the compression phase (when the damper rod moves
into the damper body). From a design perspective this
nonlinearity is important as it is used to optimize stability and
comfort. Unfortunately, different values of damping force
can be obtained with the same value of piston velocity
showing an asymmetrical hysteretic phenomenon when
conducting experiments on the shock absorber test bench, as
shown in Fig. 3(b). In this paper, only the nonlinearity
characteristics of the shock absorber will be modeled.
To reduce the influence of noise on the model fit, the
force-velocity data from all tests were filtered using a
low-pass filter with a cutoff frequency of 50Hz. The plot of
the filtered force-velocity data is shown in Fig. 4.
(a)
(b)
(c)
Fig. 3: Shock Absorber Test Result of Sine Wave input with 15mm
amplitude at 15Hz
(a) Plot of Force-Acceleration; (b) Plot of Force-Velocity;
(c) Plot of Force-Displacement
Fig. 4: Force-Velocity plot for Mazda CX-7 front shock
III. NONPARAMETRIC SHOCK ABSORBER MODELS
The force-displacement-velocity shock absorber model
was discussed in [12]. However, if the model is validated
with laboratory experiments from the shock absorber testing
device only, the implementation of such a model into a
full-vehicle simulation program for rough road investigations
encounters a problem. During a rough road drive the shock
absorber is utilized over its entire length of stroke, and
occasionally the buffers are reached. The stroke of standard
shock absorber testing machine is considerably shorter than
that of the shock absorber, and even in cases when the length
of stroke of the testing machine can be enlarged, it must be at
least 3-4mm smaller than that of the shock absorber, to avoid
possible damage to the testing machine. Thus, the region that
is bounded by the trajectory for the maximum harmonic
excitation frequency does not extend to the entire length of
stroke of the shock absorber.[4]
For this research, the nonparametric force-velocity shock
absorber behavior models which describe the relationship
between shock velocity and force is developed using a least
squares regression where shock velocity (sv ) is the
independent variable and shock force (sF ) is the dependent
variable. The model function has the form ,sf v β , where
the vector β includes m adjustable parameters. β is
adjusted to minimize the objective function, S , the sum of
squared residuals, defined in equations (1) and (2).
, , 1, ,i i sr F f v i m β (1)
2
1
n
i
i
S r
(2)
Each of the model types are discussed in the ensuing text.
A. Linear Shock Absorber Model
This is the simplest model used in simulation-based
analysis. It only considers linear behavior, as shown in (3).
s sF cv (3)
Using experimental data, the linear damping coefficient is
identified. The force-velocity plot for linear shock absorber
model is shown in Fig. 5.
B. Power Function Shock Absorber Model
The second choice for the shock absorber model is a
simple power function, as shown in (4) and (5). For rebound
-0.01 -0.005 0 0.005 0.01-2000
-1000
0
1000
2000
Shock F
orc
e (
N)
Shock Absorber Acceleration (m/s2)
-1 -0.5 0 0.5 1-2000
-1000
0
1000
2000
Shock F
orc
e (
N)
Shock Absorber Velocity (m/s)
-0.01 -0.005 0 0.005 0.01-2000
-1000
0
1000
2000
Shock F
orc
e (
N)
Shock Absorber Displacement (m)
-1.5 -1 -0.5 0 0.5 1 1.5-3000
-2000
-1000
0
1000
2000
3000
Shock Velocity (m/s)
Shock F
orc
e (
Actu
al) (
N)
Rebound Compression
Proceedings of the World Congress on Engineering and Computer Science 2010 Vol II WCECS 2010, October 20-22, 2010, San Francisco, USA
ISBN: 978-988-18210-0-3 ISSN: 2078-0958 (Print); ISSN: 2078-0966 (Online)
WCECS 2010

1
1 1, 0d
F v q v l v (4)
and, for compression
2
2 2 , 0d
F v q v l v (5)
The force-velocity plot for power function shock absorber
model is shown in Fig. 6.
C. Segmented Polynomial Shock Absorber Model
Polynomials were used to fit the shock absorber in
different velocity range. This method produced good fits with
only 4th
and 3rd
order polynomials, as shown in (6) and (7).
For rebound
4
2
42 41 40
4 3 2
54 53 52 51 50 4
0a v a v a
a
v vF v
vv va v a v a v a
(6)
and, for compression
4 3 2
14 13 12 11 10
2
22 21 20
4 3 2
34 33 32 31 3
1
2
0
1
2 0
a v a v a v a v a
a v a v a
a v a v a v a v
v
a
v
F v v v v
v v
(7)
The force-velocity plot for polynomial shock absorber
model is shown in Fig. 7.
Fig. 5 Linear Shock Absorber Model
Fig. 6: Power Function Shock Absorber Model
Fig. 7: Polynomial Shock Absorber Model
D. Model Validation
To validate the models, sinusoidal test data at various
frequencies with a 30 mm amplitude was used. The model
RMS errors are shown in Fig. 8. The power function and
polynomial models capture the nonlinearity characteristics of
shock absorber as is demonstrated by their significantly
smaller RMS errors when compared to the linear model. The
shock absorber forces of the models are compared with the
experimental force in the time domain, as shown in Fig. 9.
The close match between these two models and the
experimental data demonstrate the high level accuracy of the
models.
IV. QUARTER-CAR MODEL SIMULATION
The integration of the shock absorber model into full car
model and being implemented and tested within the full car
simulation in vertical direction is of main interest. However,
prior to this step, the model should be tested with the simpler
quarter-car model. Using the simpler quarter-car model, the
enhanced shock absorber model‟s influence on the sprung
mass vertical acceleration, a key comfort metric, can be
evaluated.
In the quarter-car model, the suspension between the
sprung mass and un-sprung mass is modeled using a spring
element and a previously defined shock absorber model, as
shown in Fig. 10. The representative parameter values for the
quarter-car model simulation are shown in Table II. The
random signal from 0.1 to 50Hz with the peak-to-peak value
of 0.01m was used as road input to excite the quarter-car
model, as shown in Fig. 11.
Fig. 8: Model RMS Error when shock absorber was excited by sine
wave input with 30mm amplitude at different frequencies
——Experimental data
------ Power Function data ------ Polynomial model data
------ Error between Power Function Model and Experimental Data
------ Error between Polynomial Model and Experimental Data
Fig. 9: Experimental, Power function and Polynomial Model Shock
Absorber force (Sine wave input with 30mm amplitude at 5Hz)
-1.5 -1 -0.5 0 0.5 1 1.5-3000
-2000
-1000
0
1000
2000
3000
Shock Velocity (m/s)
Shock F
orc
e (
N)
Real
Linear Model
-1.5 -1 -0.5 0 0.5 1 1.5-3000
-2000
-1000
0
1000
2000
3000
Shock Velocity (m/s)
Shock F
orc
e (
N)
Real
Power Function Model
-1.5 -1 -0.5 0 0.5 1 1.5-3000
-2000
-1000
0
1000
2000
3000
Shock Velocity (m/s)
Shock F
orc
e (
N)
Real
Polynomial Model
0
100
200
300
400
500
3Hz 5Hz 8Hz 10Hz 15Hz
Mo
del
RM
S Er
ror
(N)
Linear Model
Power Function Model
0 0.5 1 1.5 2-2000
-1000
0
1000
2000
3000
Time (s)
Shock F
orc
e (
N)
Proceedings of the World Congress on Engineering and Computer Science 2010 Vol II WCECS 2010, October 20-22, 2010, San Francisco, USA
ISBN: 978-988-18210-0-3 ISSN: 2078-0958 (Print); ISSN: 2078-0966 (Online)
WCECS 2010
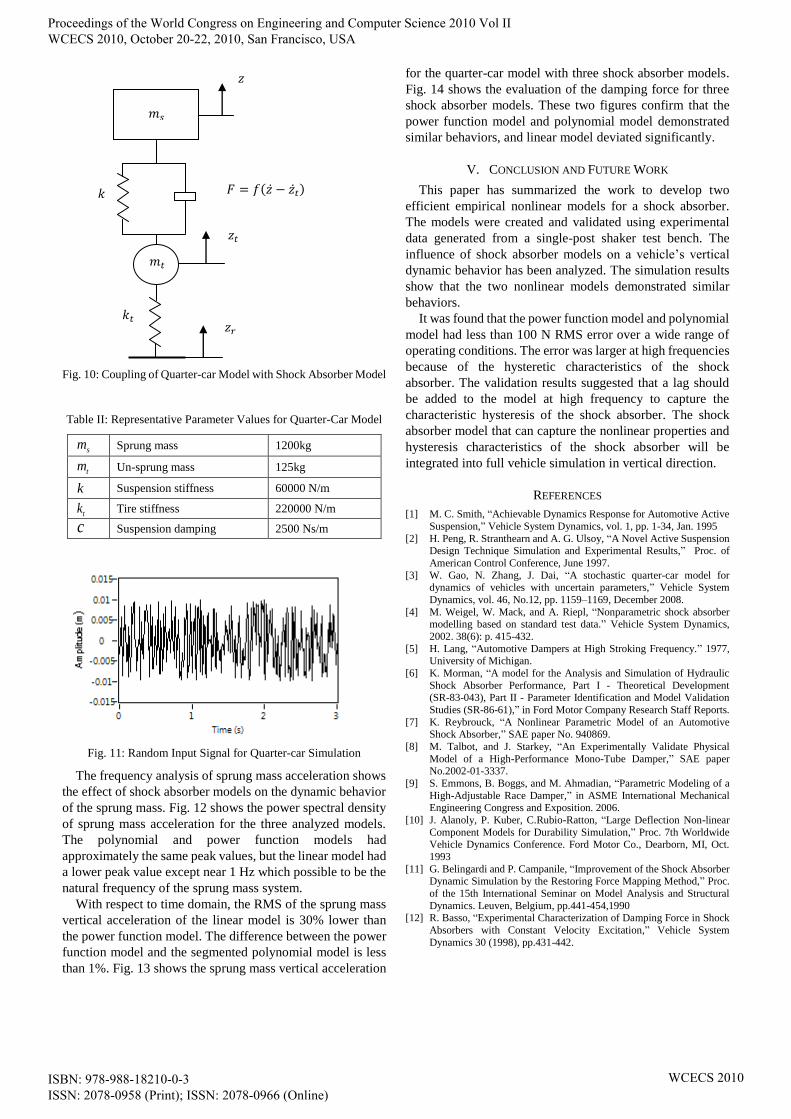
Fig. 10: Coupling of Quarter-car Model with Shock Absorber Model
Table II: Representative Parameter Values for Quarter-Car Model
sm
Sprung mass 1200kg
tm Un-sprung mass 125kg
k Suspension stiffness 60000 N/m
tk Tire stiffness 220000 N/m
c Suspension damping 2500 Ns/m
Fig. 11: Random Input Signal for Quarter-car Simulation
The frequency analysis of sprung mass acceleration shows
the effect of shock absorber models on the dynamic behavior
of the sprung mass. Fig. 12 shows the power spectral density
of sprung mass acceleration for the three analyzed models.
The polynomial and power function models had
approximately the same peak values, but the linear model had
a lower peak value except near 1 Hz which possible to be the
natural frequency of the sprung mass system.
With respect to time domain, the RMS of the sprung mass
vertical acceleration of the linear model is 30% lower than
the power function model. The difference between the power
function model and the segmented polynomial model is less
than 1%. Fig. 13 shows the sprung mass vertical acceleration
for the quarter-car model with three shock absorber models.
Fig. 14 shows the evaluation of the damping force for three
shock absorber models. These two figures confirm that the
power function model and polynomial model demonstrated
similar behaviors, and linear model deviated significantly.
V. CONCLUSION AND FUTURE WORK
This paper has summarized the work to develop two
efficient empirical nonlinear models for a shock absorber.
The models were created and validated using experimental
data generated from a single-post shaker test bench. The
influence of shock absorber models on a vehicle‟s vertical
dynamic behavior has been analyzed. The simulation results
show that the two nonlinear models demonstrated similar
behaviors.
It was found that the power function model and polynomial
model had less than 100 N RMS error over a wide range of
operating conditions. The error was larger at high frequencies
because of the hysteretic characteristics of the shock
absorber. The validation results suggested that a lag should
be added to the model at high frequency to capture the
characteristic hysteresis of the shock absorber. The shock
absorber model that can capture the nonlinear properties and
hysteresis characteristics of the shock absorber will be
integrated into full vehicle simulation in vertical direction.
REFERENCES
[1] M. C. Smith, “Achievable Dynamics Response for Automotive Active
Suspension,” Vehicle System Dynamics, vol. 1, pp. 1-34, Jan. 1995
[2] H. Peng, R. Stranthearn and A. G. Ulsoy, “A Novel Active Suspension Design Technique Simulation and Experimental Results,” Proc. of
American Control Conference, June 1997.
[3] W. Gao, N. Zhang, J. Dai, “A stochastic quarter-car model for dynamics of vehicles with uncertain parameters,” Vehicle System
Dynamics, vol. 46, No.12, pp. 1159–1169, December 2008.
[4] M. Weigel, W. Mack, and A. Riepl, “Nonparametric shock absorber modelling based on standard test data.” Vehicle System Dynamics,
2002. 38(6): p. 415-432.
[5] H. Lang, “Automotive Dampers at High Stroking Frequency.” 1977, University of Michigan.
[6] K. Morman, “A model for the Analysis and Simulation of Hydraulic
Shock Absorber Performance, Part I - Theoretical Development (SR-83-043), Part II - Parameter Identification and Model Validation
Studies (SR-86-61),” in Ford Motor Company Research Staff Reports.
[7] K. Reybrouck, “A Nonlinear Parametric Model of an Automotive Shock Absorber,” SAE paper No. 940869.
[8] M. Talbot, and J. Starkey, “An Experimentally Validate Physical
Model of a High-Performance Mono-Tube Damper,” SAE paper No.2002-01-3337.
[9] S. Emmons, B. Boggs, and M. Ahmadian, “Parametric Modeling of a
High-Adjustable Race Damper,” in ASME International Mechanical Engineering Congress and Exposition. 2006.
[10] J. Alanoly, P. Kuber, C.Rubio-Ratton, “Large Deflection Non-linear
Component Models for Durability Simulation,” Proc. 7th Worldwide Vehicle Dynamics Conference. Ford Motor Co., Dearborn, MI, Oct.
1993
[11] G. Belingardi and P. Campanile, “Improvement of the Shock Absorber Dynamic Simulation by the Restoring Force Mapping Method,” Proc.
of the 15th International Seminar on Model Analysis and Structural
Dynamics. Leuven, Belgium, pp.441-454,1990 [12] R. Basso, “Experimental Characterization of Damping Force in Shock
Absorbers with Constant Velocity Excitation,” Vehicle System
Dynamics 30 (1998), pp.431-442.
Proceedings of the World Congress on Engineering and Computer Science 2010 Vol II WCECS 2010, October 20-22, 2010, San Francisco, USA
ISBN: 978-988-18210-0-3 ISSN: 2078-0958 (Print); ISSN: 2078-0966 (Online)
WCECS 2010

Fig. 12: Power Spectral Density (PSD) of the Sprung mass Acceleration
Fig. 13: Sprung Mass Vertical Acceleration of Random Road Input
Fig. 14: Shock Absorber Force
Proceedings of the World Congress on Engineering and Computer Science 2010 Vol II WCECS 2010, October 20-22, 2010, San Francisco, USA
ISBN: 978-988-18210-0-3 ISSN: 2078-0958 (Print); ISSN: 2078-0966 (Online)
WCECS 2010