test report for pwrog 0s 0 - nrc.gov · 0 0 0 0 0 0 0 0 0 s 0 0 0 0 0 0 0 0 0 0 0 ii record of...
TRANSCRIPT

00
0
0
0
0000
00
0S
0
0
0
00
000
Westinghouse Non-Proprietary Class 3
WCAP-17057-NPRevision 1
September 2011
GSI-191 Fuel AssemblyTest Report for PWROG
Westinghouse

00
0
0
0
WESTINGHOUSE NON-PROPRIETARY CLASS 3
WCAP-17057-NPRevision 1
GSI-191 Fuel Assembly Test Report for PWROG
Susan L. Baier*Systems and Equipment Engineering I
September 2011
Reviewer: Kevin F. McNamee*Systems and Equipment Engineering I
Approved: Timothy D. Croyle*, ManagerSystems and Equipment Engineering I
This work performed under PWROG Project Number PA-SEE-0312.
*Electronically approved records are authenticated in the electronic document management system.
Westinghouse Electric Company LLC1000 Westinghouse Drive
Cranberry Township, PA 16066, USA
© 2011 Westinghouse Electric Company LLC
All Rights Reserved
WCAP-1 7057-NP.docx-092311

0
0
0
0000
00
S
0
0
0
0000
0
0
0
0
ii
RECORD OF REVISIONS
Revision Date Description
0 March 2009 Original
I See EDMS Revision bars are used throughout to highlight changes. Asummary of changes is provided here.Executive Summary:
- Updated to summarize new test data and resultingconclusions.
Section 1:- Updated to discuss purpose of additional FA testing.
Section 3:- Changed STC to RTU (same Westinghouse facility,
simply renamed)- Discussed the changes to testing objective: changed
from defining limits for particulate, fiber, andchemical mass to only defining a maximum fibermass.
- Step 5 of Section 3.1 was updated to reflect smallchange in fiber addition procedure.
- Details added to describe debris types evaluated.- Section 3.3 updated to clarify pressure drop
acceptance criteria used in testing.- Table 3-2 changed "WEC" to "Westinghouse."- Table 3-3 added parameters of tests conducted since
the publication of Revision 0.Section 4:
- Included details on hot leg switchover test.Section 5:
- Updated Table 5-1 to include summary of resultsfrom additional tests (CIB2 1-CIB54 and 1 -W-FPC-0811).
- Added data to Table 5-1 including summary of testparameters, particulate-to-fiber ratio, dP before andafter chemical addition, and notes.
- Removed Figures 5-1, 5-2 and 5-3.Section 6:
- Entire section rewritten to include conclusions fromnew tests and updated debris mass limit.
Section 7:- Entire section rewritten.- Debris limits from Revision 0 removed.- Added new debris limit (fiber only) based upon new
test data.Appendices:
- Added Appendices C, D, E, F, G, and H.
WCAP- 17057-NP September 2011Revision 1

0
00000S
0
00
000000
0
0
0
0
0
111
LEGAL NOTICE
This report was prepared as an account of work performed by Westinghouse Electric Company LLC.Neither Westinghouse Electric Company LLC, nor any person acting on its behalf:
A. Makes any warranty or representation, express or implied including the warranties offitness for a particular purpose or merchantability, with respect to the accuracy,completeness, or usefulness of the information contained in this report, or that the use ofany information, apparatus, method, or process disclosed in this report may not infringeprivately owned rights; or
B. Assumes any liabilities with respect to the use of, or for damages resulting from the use of,any information, apparatus, method, or process disclosed in this report.
COPYRIGHT NOTICE
This report has been prepared by Westinghouse Electric Company LLC and bears aWestinghouse Electric Company copyright notice. As a member of the PWR Owners Group, you arepermitted to copy and redistribute all or portions of the report within your organization; however allcopies made by you must include the copyright notice in all instances.
DISTRIBUTION NOTICE
This report was prepared for the PWR Owners Group. This Distribution Notice is intended to establishguidance for access to this information. This report (including proprietary and non-proprietary versions) isnot to be provided to any individual or organization outside of the PWR Owners Group programparticipants without prior written approval of the PWR Owners Group Program Management Office.However, prior written approval is not required for program participants to provide copies of Class 3Non-Proprietary reports to third parties that are supporting implementation at their plant, and forsubmittals to the NRC.
WCAP- 17057-NP September 2011WCAP-17057-NP September 2011
Revision I

0
0
0
S
0
0
00
0
0S00
00
0
C0
S0
iv
PWR OWNERS GROUPMEMBER PARTICIPATION LIST* FOR PWROG PROJECT PA-SEE-0312
Participant
Utility Member Plant Site(s) Yes No
AmerenUE Callaway (Westinghouse) X
American Electric Power D.C. Cook 1 (Westinghouse) X
Arizona Public Service Palo Verde Unit 1, 2, & 3 (CE) X
Constellation Energy Group Calvert Cliffs 1 & 2 (CE) X
Constellation Energy Group Ginna (Westinghouse) X
Dominion Connecticut Millstone 2 (CE) X
Dominion Connecticut Millstone 3 (Westinghouse) X
Dominion Kewaunee Kewaunee (Westinghouse) X
Dominion VA North Anna 1 & 2 X
Dominion VA Surry 1 & 2 (Westinghouse) X
Duke Energy Catawba 1 & 2, McGuire 1 & 2 X(Westinghouse)
Duke Energy Oconee 1, 2, 3 (B&W) X
Entergy Palisades (CE) X
Entergy Nuclear Northeast Indian Point 2 & 3 (Westinghouse) X
Entergy Operations South Arkansas 2, Waterford 3 (CE) X
Entergy Operations South Arkansas 1 (B&W) X
Exelon Generation Co. LLC Braidwood 1 & 2, Byron 1 & 2 (W) X
Exelon Generation Co. LLC TMI 1 (B&W) X
FirstEnergy Nuclear Operating Co. Beaver Valley 1 & 2 (Westinghouse) X
FirstEnergy Nuclear Operating Co. Davis-Besse (B&W) X
NextEra / FPL St. Lucie 1 X
NextEra / FPL St. Lucie 2 (CE) X
NextEra / FPL Turkey Point 3 & 4, Seabrook X(Westinghouse)
NextEra / FPL Pt. Beach 1 & 2 (Westinghouse) X
Luminant Power Comanche Peak 1 & 2 (Westinghouse) X
Omaha Public Power District Fort Calhoun (CE) X
Pacific Gas & Electric Diablo Canyon 1 & 2 (Westinghouse) X
Progress Energy Robinson 2, Shearon Harris X(Westinghouse), Crystal River 3 (B&W)
PSEG - Nuclear Salem 1 & 2 (Westinghouse) X
Southern California Edison SONGS 2 & 3 (CE) X
South Carolina Electric & Gas V.C. Summer (Westinghouse) X
South Texas Project Nuclear Operating Co. South Texas Project 1 & 2 (Westinghouse) X
WCAP- 17057-NP September 2011Revision 1

V
PWR OWNERS GROUPMEMBER PARTICIPATION LIST* FOR PWROG PROJECT PA-SEE-0312
Participant
Utility Member Plant Site(s) Yes No
Southern Nuclear Operating Co. Farley 1 & 2, Vogtle 1 & 2 (Westinghouse) X
Tennessee Valley Authority Sequoyah 1 & 2 X
Tennessee Valley Authority Watts Bar (Westinghouse) X
Wolf Creek Nuclear Operating Co. Wolf Creek (Westinghouse) X
Xcel Energy Prairie Island 1 & 2 X
* This is a list of participants in this project as of the date the final deliverable was completed. On occasion, additionalmembers will join a project. Please contact the PWROG Program Management Office to verify participation before sendingdocuments to participants not listed above.
PWR OWNERS GROUPINTERNATIONAL MEMBER PARTICIPATION LIST* FOR PWROG PROJECT PA-SEE-0312
Participant
Utility Member Plant Site(s) Yes No
British Energy Sizewell B X
Electrabel (Belgian Utilities) Doel 1, 2 & 4, Tihange 1 & 3 X
Hokkaido Tomari 1 & 2 (MI) X
Japan Atomic Power Company Tsuruga 2 (MHI) X
Mihama 1, 2 & 3, Ohi 1, 2, 3 & 4, Takahama X1, 2, 3 & 4 (Westinghouse & MHI)
Korea Hydro & Nuclear Power Corp. Kori 1, 2, 3 & 4 XYonggwang 1 & 2 (Westinghouse)
Korea Hydro & Nuclear Power Corp. Yonggwang 3, 4, 5 & 6 XUlchin 3, 4, 5 & 6 (CE)
Kyushu Genkai 1, 2, 3, & 4, Sendai 1 & 2 (MHI) X
Nukleama Eleckrarna Kr~ko Kr~ko (Westinghouse) X
Axpo AG Beznau 1 & 2 (Westinghouse) X
Ringhals AB Ringhals 2, 3 & 4 (Westinghouse) X
Shikoku Ikata 1, 2 & 3 (MI) X
Spanish Utilities Asco 1 & 2, Vandellos 2, XAlmaraz 1 & 2 (Westinghouse)
Taiwan Power Co. Maanshan 1 & 2 (Westinghouse) X
tlectricit6 de France 58 Units X
000S0S
S
S
00S
0
0
00
0
SS0
90
0S0
* This is a list of participants in this project as of the date the final deliverable was completed. On occasion, additionalmembers will join a project. Please contact the PWROG Program Management Office to verify participation before sendingdocuments to participants not listed above.
WCAP-17057-NP September 2011Revision 1

0* vi
* TABLE OF CONTENTSSRECO RD OF REV ISION S .......................................................................................................................... 11
LIST OF TABLES ..................................................................................................................................... viii
LIST OF FIGU RE S ..................................................................................................................................... ix
LIST OF ACRONYMS, ABBREVIATIONS, AND TRADEMARKS ................................................. xi
EX ECU TIV E SU M M A RY ......................................................................................................................... xii
1 INTRODU CTION ........................................................................................................................ 1-1
2 BA CK GROU ND .......................................................................................................................... 2-1
3 TEST PLAN .................................................................................................................................. 3-1
3.1 TEST PRO CEDU RE ....................................................................................................... 3-13.2 DEBRIS ........................................................................................................................... 3-2
3.2.1 W ater ................................................................................................................ 3-23.2.2 Particulate ........................................................................................................ 3-2
S3.2.3 Fiber ................................................................................................................. 3-23.2.4 Chemical Precipitates ...................................................................................... 3-2
3.2.5 Calcium Silicate ............................................................................................... 3-23.2.6 M icroporous Insulation .................................................................................... 3-3
3.3 PRESSURE DROP CONSIDERATIONS FOR TESTING ............................................. 3-3
3.3.1 Available Driving H ead (dPavail) ................................................................. 3-33.3.2 Pressure Drop Due to Debris (dPdebi) ......................................................... 3-4
3.4 TEST M ATRIX ................................................................................................................ 3-5
4 TEST FA CILITY D ESCRIPTION ............................................................................................... 4-1
4.1 TEST LOOP .................................................................................................................... 4-1
4.2 FUEL A SSEM BLY AN D FU EL FILTERS ..................................................................... 4-305 SUM M ARY OF TESTS ............................................................................................................... 5-1
6 DISCU SSION OF TEST RESU LTS ............................................................................................. 6-106.1 FA CILITY EVA LUATION .............................................................................................. 6-2
6.1.1 Overview of Baseline Tests ............................................................................. 6-2
6.1.2 Root Cause Investigation ................................................................................. 6-5
6.2 EFFECT OF PARTICU LATE ........................................................................................ 6-22
6.2.1 D ebris Bed Form ation ................................................................................... 6-22
6.2.2 Lim iting P:F Ratio ......................................................................................... 6-236.3 EFFECT OF BREAK LOCATION AND FLOW RATE ............................................... 6-32
6.3.1 Selection of Lim iting Break Location ........................................................... 6-32S0
WCAP-17057-NP September 2011Revision 1S

vii
TABLE OF CONTENTS (cont.) 0
6.3.2 Selection of Limiting Flow Rate ................................................................... 6-336.4 REPEATABILITY EVALUATION ............................................................................... 6-35
6.4.1 Repeatability Testing Conducted at 15.5 gpm ............................................... 6-36 06.4.2 Repeatability Testing Conducted at 44.7 gpm ............................................... 6-36 0
6.5 EVALUATION OF DEBRIS TYPES ............................................................................ 6-40
6.5.1 Eff ect of Particulate ....................................................................................... 6-40
6.5.2 Effect of Microporous Insulation ................................................................... 6-40
6.5.3 Effect of Cal-Sil Insulation ............................................................................ 6-426.5.4 Effect of Chemical Precipitate ....................................................................... 6-42
6.5.5 E ff ect of Fiber ................................................................................................ 6-426.6 EVALUATION OF FUEL HARDWARE AND ALTERNATE FUEL TYPES ............. 6-43
6.6.1 A lternate P-G rid Filter ................................................................................... 6-44
6.6.2 CE Plants and Guardian Grid ........................................................................ 6-44
6.6.3 O pen Fuel A ssem bly ...................................................................................... 6-44
6.6.4 Upper Plenum Injection Plants ...................................................................... 6-45
6.6.5 Applicability of Test Results to Alternate Fuel Designs ................................ 6-466.6.6 Applicability of Test Results to Future Fuel Designs .................................... 6-46 06.6.7 Mixed-Core Fuel Assemblies ........................................................................ 6-46
6.7 EVALUATION OF TEST CONSERVATISMS ............................................................. 6-46
6.7.1 Summary of Conservatisms Evaluated .......................................................... 6-476.7.2 Conservatism Testing Results ........................................................................ 6-48
6.8 DEVELOPMENT OF FIBER LIMIT ............................................................................ 6-50
7 C O N C L U SIO N ............................................................................................................................. 7-1
8 R E F E R E N C E S ............................................................................................................................. 8-1 SAPPENDIX A TEST PROTOCOL FOR PWROG FUEL ASSEMBLY TESTS .............................. A-i
APPENDIX B TEST REPORT NO. 1 ............................................................................................... B-i
APPENDIX C TEST REPORT NO. 2 ............................................................................................... C-1
APPENDIX D TEST REPORT NO. 3 ............................................................................................... D-l 0APPENDIX E TEST REPORT NO. 4 ............................................................................................... E-1
0APPENDIX F TEST REPORT NO. 5 ............................................................................................... F-i
APPENDIX G TEST REPORT NO. 6 ............................................................................................. G-10
APPENDIX H TEST REPORT NO. 7 ............................................................................................... H-1
00
WCAP- 17057-NP September 2011Revision 1
0

viii
*LIST OF TABLES0T ab le 3 -1 [ ]a,c ................................................................................................................. 3 -6
T able 3-2 [ ]a,c ................................................................. 3-6
T ab le 3-3 [ ]a,c .............................................................................. 3 -8
T ab le 5-1 [.]a,c .............................................................................................. 5-2
Table 6-1 Summary of Head Loss Data from CIB39 and CIB44 .................................................... 6-7
Table 6-2 Summary of Final Debris Collection Locations for CIB39 and CIB44 ......................... 6-10
Table 6-3 Summary of Head Loss Data from CIB37 and CIB45 .................................................. 6-11
* Table 6-4 Summary of Final Debris Collection Locations for CIB37 and CIB45 ....................... 6-14
Table 6-5 Summary of Head Loss Data from CIB39, CIB44, and CIB46(Flow R ate = 44.7 gpm ) ................................................................................................. 6-15
Table 6-6 Summary of Head Loss Data from CIB42, C1B47, and CIB48* (Flow R ate = 15.5 gpm ) ................................................................................................. 6-18
Table 6-7 Summary of Mixing Tank Inlet Pipe Location for FA Tests .......................................... 6-21
Table 6-8 Summary of Head Loss Data from P:F Ratio Scoping Tests ......................................... 6-25
Table 6-9 Summary of Head Loss Data from Cold Leg Break P:F Evaluation ............. 6-28
Table 6-10 Summary of Head Loss Data from Hot Leg Break P:F Evaluation ............................. 6-30
* Table 6-11 Summary of HL Break Flow Rate Evaluation ............................................................... 6-34
* Table 6-12 Summary of Results from Repeatability Testing Conducted at 15.5 gpm ..................... 6-36
Table 6-13 Summary of Results from Repeatability Testing Conducted at 44.7 gpm ..................... 6-38
Table 6-14 Test Conditions for Evaluation of Microtherm at Hot Leg Break Conditions(R eference 24) ................................................................................................................ 6-4 3
Table 6-15 Summary of Differences Between CIB54 and 1 -W-FPC-0811 ..................................... 6-500
S0000000
WCAP-17057-NP September 2011Revision 10
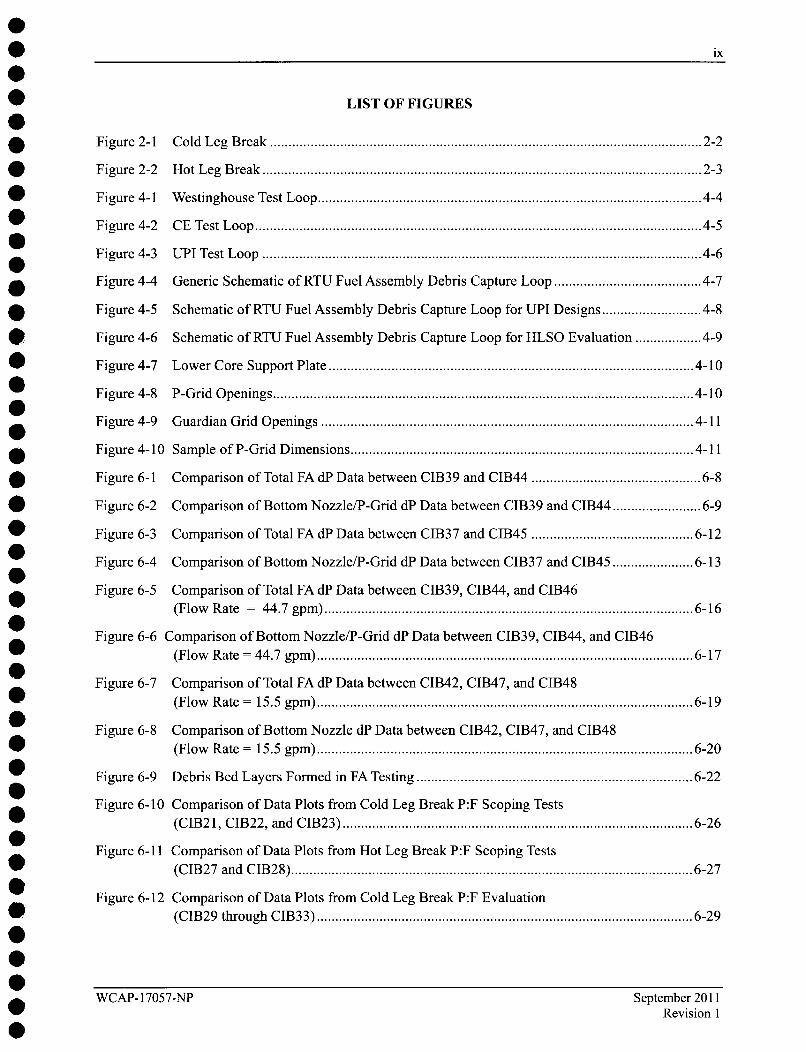
0* ix0
* LIST OF FIGURES0F igure 2-1 C old L eg B reak ..................................................................................................................... 2-2
F igure 2-2 H ot L eg B reak ....................................................................................................................... 2-3
Figure 4-1 W estinghouse Test Loop ........................................................................................................ 4-4
Figure 4-2 C E Test L oop ......................................................................................................................... 4-5
F igure 4-3 U P I Test L oop ....................................................................................................................... 4-6
Figure 4-4 Generic Schematic of RTU Fuel Assembly Debris Capture Loop ........................................ 4-7
Figure 4-5 Schematic of RTU Fuel Assembly Debris Capture Loop for UPI Designs ........................... 4-8
Figure 4-6 Schematic of RTU Fuel Assembly Debris Capture Loop for HLSO Evaluation .................. 4-9
Figure 4-7 Low er C ore Support Plate ................................................................................................... 4-10
Figure 4-8 P-G rid O penings .................................................................................................................. 4-10
Figure 4-9 G uardian G rid O penings ..................................................................................................... 4-11
Figure 4-10 Sam ple of P-G rid D im ensions ............................................................................................. 4-11
Figure 6-1 Comparison of Total FA dP Data between CIB39 and CIB44 .............................................. 6-8
Figure 6-2 Comparison of Bottom Nozzle/P-Grid dP Data between CIB39 and CIB44 ........................ 6-9
Figure 6-3 Comparison of Total FA dP Data between CIB37 and CIB45 ............................................ 6-12
Figure 6-4 Comparison of Bottom Nozzle/P-Grid dP Data between CIB37 and CIB45 ...................... 6-13
Figure 6-5 Comparison of Total FA dP Data between C1B39, C1B44, and CIB46
(Flow R ate = 44.7 gpm ) .................................................................................................... 6-16
Figure 6-6 Comparison of Bottom Nozzle/P-Grid dP Data between CIB39, CIB44, and CIB46
(Flow R ate = 44.7 gpm ) ...................................................................................................... 6-170Figure 6-7 Comparison of Total FA dP Data between CIB42, CIB47, and CIB48
(F low R ate = 15.5 gpm ) ...................................................................................................... 6-19
Figure 6-8 Comparison of Bottom Nozzle dP Data between CIB42, CIB47, and CIB48
(Flow R ate = 15.5 gpm ) ...................................................................................................... 6-20
Figure 6-9 Debris Bed Layers Formed in FA Testing ........................................................................... 6-22
Figure 6-10 Comparison of Data Plots from Cold Leg Break P:F Scoping Tests
(C IB 21, C IB 22, and C IB 23) ............................................................................................... 6-26
Figure 6-11 Comparison of Data Plots from Hot Leg Break P:F Scoping Tests
(C IB 27 and C IB 28) ............................................................................................................. 6-270Figure 6-12 Comparison of Data Plots from Cold Leg Break P:F Evaluation
(C IB 29 through C 1B 33) ...................................................................................................... 6-29000
WCAP-17057-NP September 2011Revision 10

x
LIST OF FIGURES (cont.)
Figure 6-13 Comparison of Data Plots from Hot Leg Break P:F Evaluation(C IB 35 through C IB 39) ...................................................................................................... 6-31
Figure 6-14 Comparison of Maximum dP Recorded at HL Break Flow Rate Evaluation ...................... 6-35
Figure 6-15 Comparison of Data Plots from 15.5 gpm Repeatability Evaluation(C IB 42 and C IB 48) ....................................................................................................... 6-37
Figure 6-16 Comparison of Data Plots from 44.7 gpm Repeatability Evaluation(C IB 49, C IB 50, and C IB 51) ............................................................................................... 6-39
Figure 6-17 Evaluation of Effect of Microporous Debris on Pressure Drop across Total Test FA with FiberA ddition (R eference 24) ..................................................................................................... 6-43
00000000S000000S0
000000S
0000S00000000000
WCAP- 17057-NP September 2011Revision 1

* xi
* LIST OF ACRONYMS, ABBREVIATIONS, AND TRADEMARKSSB&W Babcock & Wilcoxcal-sil calcium silicateCE Combustion EngineeringCL cold legCSS containment spray systemDFBN debris filtering bottom nozzledP or AP differential pressureECCS emergency core cooling systemFA fuel assemblyHL hot legHPSI high pressure safety injectionLTCC long-term core coolingLOCA loss-of-coolant accidentMHI Mitsubishi Heavy Industries, Ltd.NGF Next-Generation FuelNRC Nuclear Regulatory CommissionOD outside diameterOFA optimized fuel assemblyPWR pressurized water reactorPWROG PWR Owners GroupRAI request for additional information
* IRCI root cause investigationRCS reactor coolant systemRHR residual heat removalRV reactor vesselRVI reactor vessel internalsRWST refueling water storage tank
* ISE Safety EvaluationSTD Science and Technology DepartmentUPI upper plenum injectionUT ultrasonic testing0Altuglas®, Plexiglas®, Tuffak®, Solarkote® and DR® are registered trademarks of Arkema.
Nukon® is a registered trademark of Performance Contracting Inc.S5The third-party trademarks used herein are the property of their respective owners.00
SSS
WCAP-17057-NP September 2011Revision 1S

0* xii
*EXECUTIVE SUMMARY0Pressurized water reactor (PWR) containment buildings are designed to facilitate core cooling during apostulated loss-of-coolant-accident (LOCA) event. In some LOCA scenarios, the cooling process requireswater discharged from the break, emergency core cooling system (ECCS), and containment spray system
*(CSS) to be collected in a sump for recirculation by these systems. The discharged coolant water in thesump will contain chemical impurities and debris as the result of interaction with containment materials.
There has been concern that following a LOCA, the chemical precipitate, fibrous and particulate debris0within the sump could collect on the sump screen and block the flow of cooling water into the core. There
is also concern about the effects of the debris that passes through the sump screen. This debris could be*ingested into the ECCS and flow into the reactor coolant system (RCS).
The Pressurized Water Reactor Owners Group (PWROG) sponsored a program to analyze the effects of0debris and precipitates on core cooling for PWRs when the ECCS is realigned to recirculate coolant from
the containment sump. The intent was to demonstrate adequate heat removal capability for all plant*scenarios. This program is documented in WCAP-16793-NP, Revision 0.
*After the publication of WCAP- 16793 -NP, Revision 0, discussions with and requests for additional*information (RAI) from the NRC resulted in the decision to revise WCAP- 16793-NP. The PWROG*initiated prototypical fuel assembly (FA) testing to establish limits on the debris mass (particulate, fibrous,
and chemical) that could bypass the reactor containment building sump screen. Initial head loss tests wereperformed in 2008-2009 by Westinghouse and AREVA to define a bounding debris load for operating
0 PWRs. The Westinghouse test results were documented in Revision 0 of this document.
*After additional discussions with the NRC staff, it was concluded that a broader range of test parametersshould be evaluated and this was communicated through the issuance of requests for additional
*information (RAIs). The additional tests conducted by Westinghouse are recorded in this test report. This0report provides a summary and analysis of the PWROG test program for current Westinghouse fuel*designs.
Core flow is only possible if the manometric balance between the downcomer and the core is sufficient to0overcome the flow losses in the RV downcomer, RV lower plenum, core, and loops at the appropriate0flow rate. The FA test program undertaken by the PWROG is designed to provide reasonable assurance
that sufficient flow will reach the core to remove core decay heat. To that end, it must be demonstratedthat the head available to drive flow into the core is greater than the head loss (also referred to as pressuredrop) across the core due to possible debris buildup. The following relationship must be true to ensure
*sufficient flow is available to maintain long-term core cooling (LTCC):0
dPavail > dPdebris
* The available driving head (dPavail) is a plant-specific value and the pressure drop due to debris (dPdebis) is* defined by the FA test program.0000
WCAP-17057-NP September 2011Revision 10

xiii
0The test program followed the PWROG test protocol. The debris types tested included particulate 0(represented by silicon carbide), fiber (represented by Nukon®), chemical precipitate (represented byaluminum oxyhydroxide), and calcium silicate and microporous insulation (represented by Microtherm®).Previous FA tests determined that fiber was the driver of head loss so the tests were designed toincrementally add fiber until an unacceptable pressure drop was observed or a predetermined mass of 0fiber was added to the test loop. The initial objective of the tests was to define a maximum mass of eachdebris type that can be tolerated before core cooling is compromised. However, the modified objective forthe additional tests conducted to address the RAIs was to define the maximum fiber mass that can betolerated throughout the FA. SThe following observations can be made about the debris loads tested:
* Evaluations and tests demonstrate the Westinghouse test facility is reliable and the data from alltests conducted at Westinghouse can be used to achieve meaningful conclusions related to the Simpact of debris on in-vessel effects.
S* Testing has demonstrated that the amount of particulate tested affects the formation of the debris
bed and the resulting head loss across the FA.
* Tests conducted to simulate a hot leg (HL) break at the maximum flow rate represent the limitingtest condition and should be used for testing designed to define debris limits.
* A series of tests was conducted to evaluate the reliability of the Westinghouse test facility and 0repeatability of the process used to conduct FA tests. This testing demonstrated the Westinghouse 0test facility and test process are repeatable and repeat testing is not necessary in the developmentof debris limits.
" The FA test program evaluated the impact of various debris types (particulate, microporous 0insulation, cal-sil insulation, chemical precipitates, and fiber) on head loss. Testing demonstratedfiber is the limiting variable and, due to the behavior of the other debris types, is the only debrisvariable that requires a limit.
* The majority of FA testing presented in this report was conducted with a [000
* The test program is conservative and bounds all plant types.
" Using the insights garnered from the FA test program, 46 tests were conducted to define the fiber 0limit for plants utilizing Westinghouse fuel.
000
WCAP- 17057-NP September 2011Revision I
0

0
0
00
S0
S
0
0
S
0
0
00S0
0
0
00
xiv
These fuel assembly tests were performed to define the limits on the mass of debris that may bypass thesump screen and still provide for a sufficient flow pressure drop across the fuel assembly such thatsufficient flow is provided to assure long-term core cooling requirements are satisfied. Plants that arewithin the limits of the parameters tested are bounded by the tests and meet the long-term core coolingrequirements. Several courses of action have been identified for plants whose debris loads are outside ofthe limits tested. These actions include, but are not limited to, reduction of debris sources by removing orrestraining the affected debris source or plant-specific fuel assembly testing.
WCAP- 17057-NP September 2011Revision I

0* 1-1
0
* 1 INTRODUCTION
Pressurized water reactor (PWR) containment buildings are designed to facilitate core cooling in the event
of a postulated loss-of-coolant accident (LOCA). In some LOCA scenarios, the cooling process requires
water that is discharged from the break, emergency core cooling system (ECCS) and containment spraysystem (CSS) to be collected in a sump for recirculation by these systems. The discharged coolant water
*in the sump will contain chemical impurities and debris as a result of interaction with containment*materials.
There has been concern that following a LOCA, the chemical precipitate, fibrous and particulate debris
*within the sump after a LOCA could collect on the sump screen and block the flow of cooling water into
the core. There is also concern about the effects of the debris that passes through the sump screen. This
*debris could be ingested into the ECCS and flow into the reactor coolant system (RCS).
0• The debris mass that bypasses the sump screen and enters the RCS could result in sufficiently large head0losses that may impede core inlet flow and challenge long-term cooling of the core. During operation of
*the ECCS to recirculate coolant from the containment sump, debris that has passed through the sump
*screen and into the recirculating fluid may collect throughout the fuel assemblies (FAs). Since the FAs aredesigned with flow passages that provide coolant flow from the reactor vessel (RV) lower plenum into the
0region of the fuel rods, flow resistance through this path may occur.
jThe U.S. Nuclear Regulatory Commission (NRC) identified its concern regarding maintaining adequate
long-term core cooling in Generic Safety Issue (GSI) 191 (Reference 1). Generic Letter (GL) 2004-02
0(Reference 2) identified actions that utilities must take to address the sump blockage issue. The NRC0requires evidence that debris transported to the sump screen after a plant LOCA will not lead to
*unacceptable head loss for the recirculation pumps, will not impede flow through the ECCS and CSS, and*will not adversely affect the long-term operation of either the ECCS or the CSS.
The Pressurized Water Reactor Owners Group (PWROG) sponsored a program to provide analyses and
*information on the effects of debris and chemical products on core cooling for PWRs when the ECCS isrealigned to recirculate coolant from the containment sump. The intent was to demonstrate adequate heat
removal capability for all plant scenarios. This program is documented in WCAP-16793-NP, Revision 0(Reference 3).
*After the publication of WCAP-16793-NP, Revision 0 (Reference 3), discussions with and requests for
*additional information (RAIs) from the NRC resulted in the decision to revise WCAP-16793-NP. ThePWROG initiated prototypical fuel assembly (FA) testing to establish limits on the debris mass
(particulate, fibrous, and chemical) that could bypass the reactor containment building sump screen.*Initial head loss tests were performed in 2008-2009 by Westinghouse and AREVA to define a bounding
debris load for PWRs. The Westinghouse results were documented in Revision 0 of this document and the
results of both the Westinghouse and AREVA tests were integrated into Revision 1 of WCAP-16793-NP
(Reference 12).
S000
WCAP-17057-NP September 2011Revision 10

1-2
After additional discussions with the NRC staff, it was concluded that a broader range of test parametersshould be evaluated and this was communicated through the issuance of additional RAIs (Reference 13).The additional tests conducted by Westinghouse are recorded in this test report and the results of theadditional testing conducted by both Westinghouse and AREVA will be integrated into Revision 2 ofWCAP-16793-NP.
This report provides a summary and analysis of the PWROG test program for current Westinghouse fueldesigns. This report is prepared for the PWROG under project authorization PA-SEE-0312. The resultspresented in this report are restricted to use by the participants identified within.
0000000000000000000000000000000000000000000
WCAP- 17057-NP September 2011Revision 1

0
0
0
0
0
0
00
0
0
0
0S
0
S
2-1
2 BACKGROUND
Following a LOCA, clean water from the refueling water storage tank (RWST) and accumulators providecooling flow until sufficient water has accumulated in the containment emergency sump to initiateswitchover to sump recirculation. As some debris may pass through the sump screens, the ECCS willdeliver fluid and debris to the CSS and RCS. Of the debris that reaches the RCS, the amount that istransported to the core is dependent on the ECCS injection configuration and break location. ECCS flowis delivered to the RCS in two locations depending on the plant type. For most PWRs, ECCS is deliveredto the cold legs (CLs) or upper RV downcomer.
At the time of sump switchover, the core has been fully recovered and the fluid inventory in the RCS hasrefilled the system to the break location. For any RCS pipe break, the two-phase mixture level is abovethe top of the core. The core decay heat is being removed by ECCS injection. The actual core flow andvessel level depend on the break location, plant design, and ECCS injection rate.
For postulated CL breaks (Figure 2-1), the pumped ECCS liquid injected into the intact CLs ordowncomer provides liquid to the core to make up for boiloff. The ECCS liquid keeps the downcomer fullto at least the bottom of the CL nozzles; any excess liquid flows out of the broken CL and back into thecontainment sump. The core level is controlled by the manometric balance between the downcomer liquidlevel, the core level, and RCS pressure drop through the loops. The core flow is limited to the flowrequired to make up for core boiling to remove the decay heat. For postulated CL breaks, most ECCSliquid spills directly out of the break.
For a break in the hot leg (HL) (Figure 2-2), the entire ECCS volume must pass through the core to exitthe break. The core level will be at least equal to the HL nozzle elevation, and the core flow rate will beequal to the ECCS flow rate.
WCAP- 17057-NP September 2011Revision 1

2-2
SmmFmw wLnwps
000S
00
00
0
00
S
0S
000
0
000
0000000
Debis thaa has s--ede
Figure 2-1 Cold Leg Break
WCAP- 17057-NP September 2011Revision 1

000000S00000S
0000
0000
0
0
0
000
000000000
2-3
Figure 2-2 Hot Leg Break
WCAP- 17057-NP September 2011Revision 1

* 3-10
* 3 TEST PLAN0The PWROG developed a common test protocol to ensure that testing for all PWROG members wasconsistent among all PWROG fuel test programs. The test protocol is described in Reference 5. TheWestinghouse test procedures, debris details, pressure drop acceptance criteria for testing, and test matrixwere developed based on this protocol. Details of these items are provided in the following subsections.S
*3.1 TEST PROCEDURE
S I The test plan was developed by the Westinghouse Research and Technology Unit (RTU) based on: (1) the* PWROG test protocol (Reference 5), (2) Westinghouse experience with simulated FA testing, and (3) the
S I objective of maximizing the head loss due to debris. The initial objective of the tests was to define themaximum mass of each debris type that can be tolerated at the core entrance before core cooling iscompromised. However, the modified objective for the additional tests conducted to address the RAIs(Reference 13) was to define the maximum fiber mass that can be tolerated throughout the FA. Themodification to this objective was based upon the test results recorded in the initial revision of this
0document.
Previous FA testing experience has indicated that fiber has the greatest impact on the pressure drop in theScore. The acceptable fiber mass was determined by adding fiber to the test FA in small increments until an0unacceptable pressure drop was determined or a predetermined fiber mass was added to the FA.
Highlights of the test procedure are outlined in the following steps. For more specific details, seeAppendices A through H.
1. The fuel filter design to be tested is selected and mounted on the partial-height FA. The assemblyis inserted into the test loop, and the loop is filled with water.
2. Debris quantities are measured and verified.
3. The pump is started, and the flow is set to the desired flow rate. The clean head loss is recorded.
4. Particulate debris is added to system, and the head loss is recorded.'05. Fiber is added in batches and at least two turnover times are allowed to pass between additions
until either a previously defined maximum mass of fiber has been added or the head loss exceedsthe defined safety limits of the facility. Head loss is recorded.
6. Chemical precipitates are added and head loss is recorded.0
7. Head loss is allowed to reach a predefined steady state for test termination as described inAppendices B-H. The final head loss readings are recorded, and the test is terminated.
00
1. The debris sequencing follows the guidance provided in Reference 4.
0WCAP-17057-NP September 2011
Revision 10

S3-2
S3.2 DEBRIS
SThe debris used in the tests is described in detail in Appendices B-H. The following is a summary of the
debris sizes and quantities used in the tests.
3.2.1 Water0
Filtered tap water is used for all tests. The initial volume is prepared according to the respective test plans.
3.2.2 Particulate 0The particulate debris was represented by silicon carbide that is 10 pim ±2 lim in diameter (Reference 5).
The silicon carbide used for testing is product SICF600 from UK Abrasives. The NRC Safety Evaluation
(SE) for NEI 04-07 (Reference 30) identified particle size as a key parameter for the selection of
representative debris. Specifically, the SE states that major contributors to head loss are the increasing
smaller particles. All testing was conducted with silicon carbide particles approximately 10 jtm in size,
allowing the debris to act as a fine particulate debris that collects within a fiber bed and results in a
maximum head loss. Silicon carbide is representative of all particulate debris. 03.2.3 Fiber 0Fibrous debris was represented by Nukon® fibers (Reference 5), and the material purchased was pre-heat
treated at the factory on a 600'F hot plate from one side only for several hours. This method of
pre-treatment is consistent with industry guidance (Reference 14, Appendix B). As described in the test
plans, this fiber was produced by placing coarse chopped and baked Nukon® in a blender for 25 seconds.
Specific values for the distribution of fiber lengths are required for the PWROG testing and the target
fiber size distribution can be found in Table 3-1. The fiber was added to the test in small batches, typically
5 to lOg at a time. 03.2.4 Chemical Precipitates
Chemical precipitate was represented by aluminum oxyhydroxide (AlOOH), which represents the most
limiting chemical precipitate in terms of head loss (Reference 8). The AIOOH was prepared in accordance
with WCAP-16530-NP-A (Reference 9). Each batch of AlOOH had a concentration of 11 g/L and was
tested to ensure it met the settling criteria defined by WCAP-16530-NP-A (Reference 9).
3.2.5 Calcium Silicate 0Calcium silicate (cal-sil) insulation material manufactured by Industrial Insulation Group, Lot #S 15-276
was pulverized into a fine powder by Performance Contracting Incorporated. Upon receipt at RTU, the
material was passed dry through a #7 sieve (hole size of 0.11 inch), and the material that remained in the
sieve was removed and discarded. The resultant material was characterized and used in testing.0000
WCAP- 17057-NP September 2011Revision I
0

0* 3-30
* 3.2.6 Microporous Insulation0Microtherm, Inc. provided material to RTU. Upon receipt, the material was passed dry through a #7 sieve
(hole size of 0.11 inch), and the material that remained in the sieve was removed and discarded. Theresultant material was characterized and used in testing.0
*3.3 PRESSURE DROP CONSIDERATIONS FOR TESTING
The FA testing program undertaken by the PWROG is designed to provide reasonable assurance that
sufficient flow will reach the core to remove core decay heat. To that end, it must be demonstrated that the0head available to drive flow into the core is greater than the head loss (also referred to as pressure drop)
across the core due to possible debris buildup. The following relationship must be true to ensure sufficient
flow is available to maintain LTCC:
0dPavaiI > dPdebris0* The available driving head (dPavail) is a plant-specific value and the pressure drop due to debris (dPdebis) is
determined by the FA test program.
*3.3.1 Available Driving Head (dPavail)0Core flow is only possible if the manometric balance between the downcomer and the core is sufficient to
overcome the flow losses in the RV downcomer, RV lower plenum, core, and loops at the appropriate
0flow rate.0* APavail = APd& - APfow (3-1)
where:0APavaiI = total available driving headAP& = pressure head due to liquid level between downcomer and core
APow = pressure head due to flow losses in the RCS
0The manometric differences are determined considering plant geometry and core void fractions. The flowlosses are calculated using the following form of the Darcy-Weisbach equation:
Sk ca2
AP, k (3-2)f-pow A2 288-pg-gc
where:0*APflow = differential pressure (psid)
k = form loss coefficientA = area on which the form loss coefficient is based (ft2)
*0 = flow rate (lbm/s)00
WCAP-17057-NP September 2011Revision 10

03-4
Spg = liquid density (lbm/ft3)g, = gravitational constant (32.2 lbm-ft/lbf-sec 2)
For CL breaks, the ECCS liquid from each CL runs to the break, ensuring that the downcomer is full to atleast the bottom of the CL nozzles. The core level is established by the manometric balance between thedowncomer liquid level, the core level, and RCS pressure drop through the loops. The core flow is onlywhat is required to make up for core boiling to remove the decay heat. For CL breaks, most of the ECCSvolume spills directly out of the break. The flow downstream of the core at recirculation would betwo-phase with entrained liquid or a bubbly flow wherein the flow and elevation heads balance thedowncomer elevation head to produce a flow rate matching decay heat plus the rate of cooldown for thesteam generators (SGs). As debris builds up, the flow of liquid into the core decreases. The liquid leveldownstream of the core lowers or entrained liquid is not replaced until the critical condition is reachedwhere the flow is just sufficient to match boiloff due to decay heat and no downstream liquid remains.This condition is commensurate with the maximum allowed blockage at the core inlet. 0For a break in the HL, the ECCS liquid must pass through the core to exit the break. The driving force isthe manometric balance between the liquid in the downcomer and that in the core. Should a debris bedbegin to build up in the core, the liquid level will begin to build in the CLs and the SGs. As the levelbegins to rise in the SG tubes, the elevation head to drive the flow through the core increases as well. Thedriving head reaches its peak when the shortest SG tube has been filled (in the Westinghouse and CEplant designs). This is conservative as it provides for the minimum static head available in the steamgenerator tubes. The core mixture level will be at least to the HL nozzle elevation, and the core flow ratewill equal the ECCS flow rate. S3.3.2 Pressure Drop Due to Debris (dPdebris)
The PWROG FA test program was designed to define the dPdebi, values associated with a specific amountof debris. The results of this program provide a dPdebris value that corresponds to specific debris loading.Testing was conducted to define dPdebris values corresponding to specific fiber loads. A high-levelsummary of the testing is provided here:
1. The test facility is a closed-loop system that continually recirculates fluid and debris through asingle test fuel assembly. 0
2. The test chamber is formed by Plexiglas® walls that are sized to match the FA pitch. The distancefrom the end of the test FA to the chamber walls is half the distance between adjacent FAs. 0
3. The flow entering the bottom of the FA is uniform and constant.0
4. All debris is available to form debris beds at either the bottom nozzle or at the intermediate spacergrids. 0
All these design features contribute to the promotion of debris capture in the test loop and provide aconservative representation of the debris capture in an actual core.
00
WCAP- 17057-NP September 2011Revision 1
0

0S
00000
0
0
00
000
0
0
00
0
S
3-5
In either HL or CL break case, core heatup will not occur until there is sufficient debris accumulation to
limit the core flow rate to the point where the fluid is exactly saturated steam at the core exit. Therefore,
for either the HL or CL break, the calculation of allowed pressure drop for debris should not consider any
liquid associated with entrainment or bubbly frothy flow downstream of the core at the limiting condition.
As long as the pressure drop due to debris is less than the available driving head, flow through the core
will not be impeded by the presence of debris.
3.4 TEST MATRIX
Westinghouse offers a variety of fuel and FA fuel filter designs. These designs include the p-grid, alternate
p-grid, and Guardian grid. Each of these configurations is designed to reduce FA fretting problems and
reduce fuel failures during normal operations. A summary of the plants to which Westinghouse provides
batch fuel and fuel filter designs is presented in Table 3-2 (Reference 25).
The test matrix is shown in Table 3-3. Since each of the fuel filter designs is geometrically different, the
first tests were intended to compare the standard p-grid design to the CE Guardian grid [
]ac. Tests CIBO1 through CIB04 were used to define a baseline debris load for the standard
p-grid design to then test against the Guardian grid (CIB05).
]a C The remaining tests were conducted to define a debris
load that will not impede core cooling and to verify the most limiting test conditions were used to define
that debris limit.
WCAP- 17057-NP September 2011Revision 1
3-6
a,c
S0SSSSSSSSSSSSSSSSSSSSSSSSSSSSSSSSSSSSSSSS
WCAP- 17057-NP September 2011Revision 1

0S
00
0
0
S00
00
0
00
0
00S00
3-7
Table 3-2 [ ]ac
(cont.) a,c-1
1~ *1- I
1~ *1* 1- 1
4- + I- 4
1- *I. I I
-I ___ I____ I __ ___ ____
WCAP-17057-NP September 2011Revision 1

3-8
Table 3-3 a,c
a,c
4 4- + 4 4 4
4 + 4 4 4 4 4 4
4 + * 4 4 4 4 4
4 + 4 4 4 4 4
4 + 4 4 I 4 4 4
4 + 4 4 4 4 4
4 + 4 4 1 1 1
4 .4. 4 4 1 1 1
WCAP- 17057-NP September 2011Revision 1

3-9
WCAP-17057-NP September 2011Revision 1

3-10
Table 3-3 1 1a,c
kcont.) a,c
WCAP- 17057-NP September 2011Revision 1
0 0 0 0 0 0 0 0 0 0 0 0 9 0 0 0 . 0 * 9 * & 0

0* 4-10
* 4 TEST FACILITY DESCRIPTION
* IWestinghouse performed FA tests at the Westinghouse RTU in Churchill, PA. RTU designed andconstructed a test loop to measure the head loss across a full-area, partial-height FA with various bottomnozzles and associated bottom grids. The details of the test loop are provided in Section 4.1. The details of
*the test FA and fuel filters provided by Westinghouse are described in Section 4.2. (Detailed discussion of*the test facility can be found in Appendices B-H.)
4.1 TEST LOOP
*The test loop for testing the debris capture characteristics of a full-area FA is shown in Figure 4-1*(Westinghouse), Figure 4-2 (CE), and Figure 4-3 (upper plenum injection [UPI]). A schematic of the test*loop is given in Figure 4-4 (representative of both CE and Westinghouse configurations), Figure 4-5 (UPI
configuration) and Figure 4-6 (hot leg switchover [HLSO] evaluation). The test loop is composed of fourmain parts:0
* Mixing tank system0 Recirculation system0 Test column
0 Computer monitoring system
*Mixing Tank System
*The mixing tank system includes a 250-gallon plastic tank with a conical bottom, a temperature control*system, and a mixing pump. The mixing tank is where debris can be added during the test. The conical*bottom of the tank helps preclude the settling and loss of debris on the bottom of the tank. The
I recirculating water in the loop flows out of the 1.5-inch bottom nozzle of the tank and into the top of thetank. The temperature of the water in the tank is controlled by running water at a higher or lower
* I temperature through a copper coil attached to a heater/chiller. The water temperature can be controlled*from a low temperature of approximately 60'F to a high temperature of approximately 100°F, and the
temperature of the water is measured continuously in the tank by a submerged thermocouple. Mixing ofthe tank is achieved by the use of a Performance Pro Cascade 1/2 HP pump that pulls water from the
*bottom of the tank and pumps it back in at a different point at the top of the tank.
*Recirculation System
The recirculation system pumps the water from the tank, through the test column and back into the tank. A0Performance Pro Cascade 3/4 HP pump draws the water out of the bottom of the mixing tank. The flow
*rate is controlled by a pneumatic press that partially compresses the 1.5-inch clear, plastic tubing. A
magnetic flow meter measures the flow rate and provides feedback to the pneumatic press to control theamount of compression applied to the tubing. A specific flow rate can be chosen and the flow controlautomatically regulates the flow rate to maintain that value. The recirculation system is continuous duty to
0accommodate longer tests.00
0WCAP-17057-NP September 2011
Revision 10
4-2
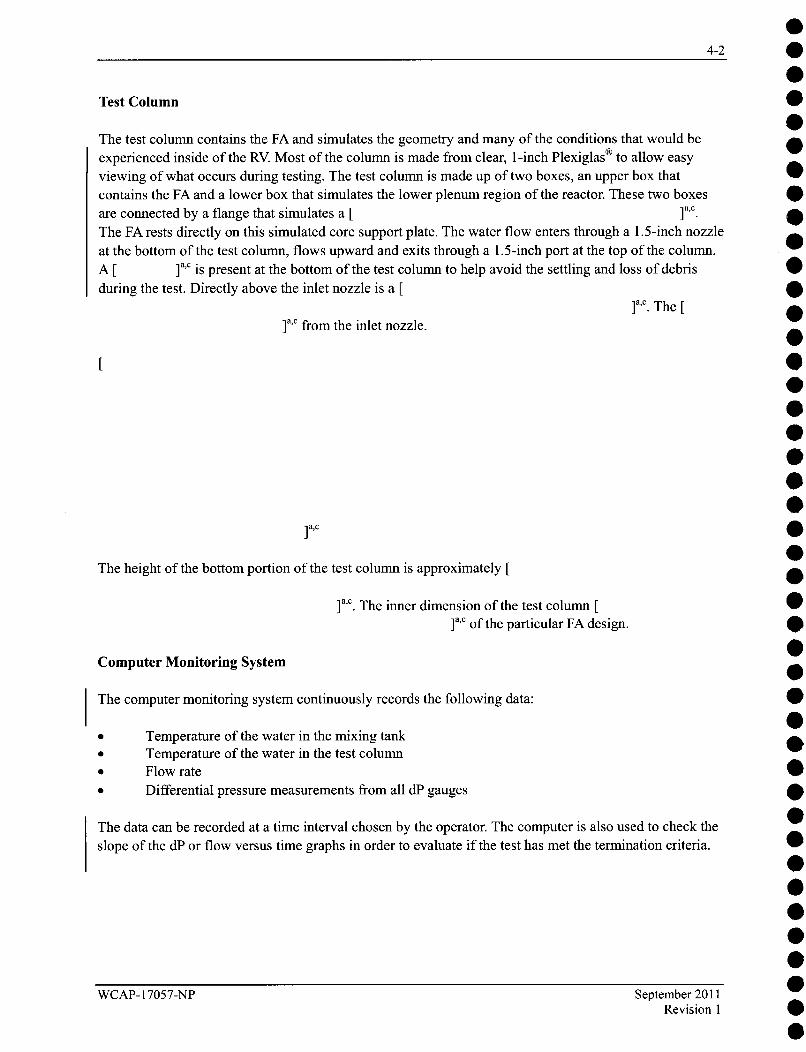
Test Column
The test column contains the FA and simulates the geometry and many of the conditions that would beexperienced inside of the RV. Most of the column is made from clear, 1-inch Plexiglas® to allow easyviewing of what occurs during testing. The test column is made up of two boxes, an upper box thatcontains the FA and a lower box that simulates the lower plenum region of the reactor. These two boxesare connected by a flange that simulates a [ ]ac.
The FA rests directly on this simulated core support plate. The water flow enters through a 1.5-inch nozzleat the bottom of the test column, flows upward and exits through a 1.5-inch port at the top of the column.A [ pc is present at the bottom of the test column to help avoid the settling and loss of debrisduring the test. Directly above the inlet nozzle is a
]a,,. The]ac from the inlet nozzle.
a,c
The height of the bottom portion of the test column is approximately
S0
S
000
0
0000
00
0
0
0
000
0
S
]ac. The inner dimension of the test column []apc of the particular FA design.
Computer Monitoring System
The computer monitoring system continuously records the following data:
* Temperature of the water in the mixing tank* Temperature of the water in the test column* Flow rate* Differential pressure measurements from all dP gauges
The data can be recorded at a time interval chosen by the operator. The computer is also used to check theslope of the dP or flow versus time graphs in order to evaluate if the test has met the termination criteria.
WCAP- 17057-NP September 2011Revision 1

* 4-3
* 4.2 FUEL ASSEMBLY AND FUEL FILTERS
A schematic of the assembly used for Westinghouse fuel tests is shown in Figure 4-4 (dimensions are
representative) and a picture is shown in Figure 4-1. The test assembly is approximately [It represents a [The
SFA[ ]a[c. This dimension was used to size the inside of the test
chamber.
A picture of the assembly used for CE Guardian grid fuel tests is shown in Figure 4-2.* ]ac The height and FA tested differ from the
Westinghouse fuel test. The test assembly is approximately [ ]ac. It represents a [* ]a,c. The [ ]ac. This dimension was
used to size the inside of the test chamber.
0A schematic of the assembly used for Westinghouse UPI fuel tests with representative dimensions is*shown in Figure 4-5 and a photograph is shown in Figure 4-3. This test [
]a. The test assembly is approximately [ ]Th . It represents a [S]a,c . The [
]ac. This dimension was used to size the inside of the test chamber.
0A schematic of the test loop used for the Westinghouse HLSO tests with representative dimensions is
shown in Figure 4-6. This test loop [* ]a,c. The test
0 assembly is approximately [ ]a~c It represents a]a,c. The [ ]a,c. This
dimension was used to size the inside of the chamber.
* The fuel filters that were tested included the Westinghouse p-grid and Guardian grid.
]ac Photographs of the p-grid openings are shown in Figure 4-8, and
photographs of the Guardian grid openings are shown in Figure 4-9. Figure 4-10 provides an overview of
*typical Westinghouse fuel filter dimensions.000
0000000
WCAP-17057-NP September 2011Revision 10

4-4
a,c
S0S
S0SS0
000
0
S
S
0
0
0
S
0
00000S0
Figure 4-1 Westinghouse Test Loop
WCAP- 17057-NP September 2011Revision 1

00000
0000000000000
000000000000
00
0000000
4-5
a,c
Figure 4-2 CE Test Loop
WCAP- 17057-NP September 2011Revision 1

4-6
a,c
S
S
S0
S0
S0S
00
SSS
000SS0SS
Figure 4-3 UPI Test Loop
WCAP- 17057-NP September 2011Revision 1

000S
0
0
0
0
00
000
0
00
0
00S
0
4-7
a,c
Figure 4-4 Generic Schematic of RTU Fuel Assembly Debris Capture Loop
WCAP- 17057-NP September 2011Revision 1

4-8
a,c
0
0000000
000
00000000000000000000000000000
Figure 4-5 Schematic of RTU Fuel Assembly Debris Capture Loop for UPI Designs
WCAP- 17057-NP September 2011Revision 1

0S0
0
0
0
SS0
0
00
S0
0S0
4-9
a,c
Figure 4-6 Schematic of RTU Fuel Assembly Debris Capture Loop for HLSO Evaluation
WCAP-17057-NP September 2011Revision 1

4-10a,c
Figure 4-7 Lower Core Support Plate
a,c
00
00000000000000000000000000000000000000
Figure 4-8 P-Grid Openings
WCAP- 17057-NP September 2011Revision 1

000
S
0
000
S
000
S
S
0
0
S
0
0S
4-11
a,c
Figure 4-9 Guardian Grid Openings
a,c
Figure 4-10 Sample of P-Grid Dimensions
WCAP-17057-NP September 2011Revision 1

00
0
0
0
0
0
S
0
00
0
0
00
000
0
0
5-1
5 SUMMARY OF TESTS
The Westinghouse test reports (Appendices B-H) provide a complete presentation of the test resultsincluding pressure drops in the FA as a function of time during the tests. A summary of these results ispresented in Table 5-1. A detailed analysis of the test results is presented in Section 6. Table 5-1 has beenupdated to include a summary of the tests conducted since the publication of Revision 0 of this document.Tests CIB21 through CIB54 and 1-W-FPC-0811 were conducted to address RAIs (Reference 13) andinformal questions brought up by the NRC staff.
While the initial test program was intended to specifically evaluate core inlet blockage, the test programevolved to an evaluation of debris accumulation within the core. The following table of information ispresented for this purpose and will be used in the discussion of results in Section 6.
I Material was added during the tests in the following order: particulate, fiber, and chemical precipitates.Per Reference 4, introducing particulate first is the most conservative approach. The fiber additions had
I the most significant effect on head loss in the tests. To gather information about the effect of fiber, fiberwas added in approximately 10 gram increments. This provided the opportunity for a thin bed to developand provided flexibility in the test to determine the maximum fiber load by discontinuing fiber additionsprior to reaching the maximum allowable head loss. The pressure drop that occurred as the fiber wasadded (but before chemical precipitates were added) may provide some insight into debris accumulationin the core. In the initial tests, particulate and chemical precipitates did not induce a significant pressuredrop at any location in the FA. However, subsequent testing provided more insight to the effects ofparticulate and chemicals and head loss and this is discussed in Section 6.
WCAP- 17057-NP September 2011WCAP-17057-NP September 2011
Revision I
5-2
Table 5-1 4 1a'c
WCAP- 17057-NP September 2011Revision 1

00009000000000000000000000000000000000000035-3
Table 5-1(cont.)
I ia,c
a,cr 1 1 1 1 r T 11 1T~
4 I 4- 4- 4----------------'4. 4 4 I
.4. 4 + 4- 4- 4- 4- 4 4 4 4--4-
4- 4 4- 4- 4- + + * * 4 4 +
4 1 4- 4- 4- 4- 4- 4 4 4 4- 4-
.4. 4 4- 4- + 4- 4- 4 4 4 .4. 4-
4- 4 4- 4- 4- + + 4 4 4
4 4 -t 4- 4- 4- 4- 4 4 4
WCAP-17057-NP September 2011Revision I

5-4
Table 5-1 [ Ia'c(cont.) a,c
WCAP- 17057-NP September 2011Revision 1
00000*4b*000900000000000000000000000000000oO

000*00000000000000000000000000000000000000055-5
Ia,c
,C
WCAP- 17057-NP September 2011Revision 1

0* 6-10
* 6 DISCUSSION OF TEST RESULTS0The data from Table 5-1 are used as the basis for the discussion presented in this section.
The initial tests (CIBO1 - CIB 11), summarized in Revision 0 of this document, were all performed at
* particulate-to-fiber mass (p:f) ratios in the range of approximately 3 to 65, with the majority of testsconducted at high p:f ratios. In order to address the questions presented in RAIs (Reference 13) and
brought up in discussions with the NRC staff, additional testing was conducted to evaluate a broaderrange of conditions. This section has been updated to include insights and conclusions drawn from the
additional test data. Specifically,
0 The evaluations and tests conducted to demonstrate the Westinghouse test facility is reliable andthe data from all tests conducted at Westinghouse can be used to achieve meaningful conclusions
related to the impact of debris on in-vessel effects are provided in Section 6.1.
Testing has demonstrated that the amount of particulate tested affects the formation of the debrisbed and the resulting head loss across the FA. Section 6.2 provides an overview of the debris bed
Sformation and the testing conducted to evaluate the effect of particulate mass loading on head
*loss.
0 Tests conducted to simulate a hot leg break at the maximum flow rate represent the limiting test
*condition and should be used for testing designed to define debris limits. An evaluation of break
locations and flow rate effects on head loss is provided in Section 6.3.
0 A series of tests was conducted to evaluate the reliability of the Westinghouse test facility and
repeatability of the process used to conduct FA tests. This testing demonstrated the Westinghouse
test facility and test process are repeatable and repeat testing is not necessary in the development
*of debris limits. This evaluation is summarized in Section 6.4.
0 The FA test program evaluated the impact of various debris types (particulate, microporous
0insulation, cal-sil insulation, chemical precipitates, and fiber) on head loss. Testing demonstrated*fiber is the limiting variable and, due to the behavior of the other debris types, is the only debris
variable that requires a limit. The details of this evaluation are provided in Section 6.5.
*The majority of FA testing presented in this report was conducted with a [
* ]ac. Debris limits defined with this hardware are applicable to all hardware
* and configurations evaluated in this report including:* ]a,c. This evaluation is
summarized in Section 6.6.
The test program was designed to be conservative enough to bound all plant types. A few of the
test conservatisms were evaluated and summarized in Section 6.7.
Using the insights garnered from the FA test program, 46 tests were conducted to define the fiberlimit for plants utilizing Westinghouse fuel. These tests and resulting fiber limits are summarized
*in Section 6.8.0000
WCAP-17057-NP September 2011Revision 10

6-2
6.1 FACILITY EVALUATION
Additional FA testing was conducted by AREVA and Westinghouse to address the RAIs (Reference 13)and it was discovered that, at low particulate-to-fiber mass (p:f) ratios, the debris limits were significantlydifferent between vendors (Reference 18). In the process of reviewing this data and the correspondingdebris limits, the NRC staff began to investigate the reasons for the differences and requested thePWROG conduct a single "cross-test" to eliminate concerns regarding any possible test facility effects.
This section provides an overview of testing and evaluations performed to ensure the reliability of theWestinghouse test facility. Subsection 6.1.1 summarizes baseline tests conducted to evaluate therepeatability and consistency of the Westinghouse test loop and subsection 6.1.2 discusses the root causeinvestigation (RCI) conducted to evaluate the reasons and scope of impact of the unexpected baseline testresults. It is concluded the Westinghouse facility is reliable and FA test results can be used to achievemeaningful conclusions related to the impact of debris on in-vessel effects.
6.1.1 Overview of Baseline Tests
[
]a,c
00000000
0
0
00
000
00000
00
000000000
6.1.1.1 Summary of Tests Conducted at P:F = 1:1
[
]a,c
6.1.1.1.1 Head Loss
]a,c
WCAP- 17057-NP September 2011Revision 1

0000000000
000
0000S0000000000
000
0000
00
6-3
6.1.1.1.2 Debris Bed
]ac
6.1.1.2 Summary of Tests Conducted at P:F = 5:1
[
]a,c
6.1.1.2.1 Head Loss
I
]a,c
WCAP- 17057-NP September 2011
WCAP-17057-NP September 2011Revision I

6-4
6.1.1.2.2 Debris Bed
[
]a.c
6.1.1.3 Key Findings
[
00SS0SSSSSSSSSSSSSSSSSSSSSSSSSSSSSSSSSSSSSS
S
0
S
]a,c
WCAP- 17057-NP September 2011Revision 1

000
0
000
00000000000000000
0000S
00
6-5
6.1.2 Root Cause Investigation
[
]a.c
6.1.2.1 Air Entrainment
[
]ac
WCAP- 17057-NP September 2011
WCAP- 17057-NP September 2011Revision I

6-6
6.1.2.2 Inlet Pipe Location
[
]a,c
6.1.2.2.1 Evaluation of Pipe Location Effect on Tests Conducted at 44.7 gpm
[
00
00
0S
000
0S0
00S000
00
S00
000
]a,c
6.1.2.2.2 Evaluation of Pipe Location Effect on Tests Conducted at 15.5 gpm
I
WCAP-17057-NP September 2011Revision 1

0000000
00
000000
00000
S
0
000
6-7
]a~c
6.1.2.2.3 Key Findings from Inlet Pipe Effect Testing
* [
]ac
Table 6-1 Summary of Head Loss Data from CIB39 and CIB44 ax
WCAP- 17057-NP September 2011Revision 1

6-8
a,c
Figure 6-1 Comparison of Total FA dP Data between CIB39 and CIB44
WCAP- 17057-NP September 2011Revision 1

6-9
a,c
Figure 6-2 Comparison of Bottom Nozzle/P-Grid dP Data between CIB39 and CIB44
WCAP- 17057-NP September 2011
WCAP-17057-NP September 2011Revision I

6-10
Table 6-2 Summary of Final Debris Collection Locations for CIB39 and CIB44 a,c
o
00000000000000000000000000000000000000000
WCAP-17057-NP September 2011Revision 1

0
0
00S
0
S
0
0
0
S
0
0SS0
00000
6-11
Table 6-3 Summary of Head Loss Data from CIB37 and CIB45 a,c
-t
4 4
4 4
+ 4
+ +
LJ~
WCAP-17057-NP September 2011Revision 1

6-12
a,c
Figure 6-3 Comparison of Total FA dP Data between CIB37 and CIB45
WCAP- 17057-NP September 2011Revision 1
*10 0 * 0 0 0 0 0 0 0 0 0 0 0 * 0 0 0 0 0 0
**Ooo*O@@@eo*e@@@@eOS@@@Oe0eOO@@e@S0ee0ee6-13
ac
Figure 6-4 Comparison of Bottom Nozzle/P-Grid dP Data between CIB37 and CIB45
WCAP- 17057-NP September 2011
WCAP-17057-NP September 2011Revision I

6-14
Table 6-4 Summary of Final Debris Collection Locations for CIB37 and CIB45a,x
00000000000000000000000
0000000000000000000
WCAP- 17057-NP September 2011Revision 1

000
0
0000
0
0
0
0
00000
0
6-15
Table 6-5 Summary of Head Loss Data from C1B39, CIB44, and CIB46 (Flow Rate = 44.7 gpm) a,c
4 i
4 4 4
4 4 4
4 4 4
4 4 4
4 4 4
4 4 4
WCAP- 17057-NP September 2011Revision 1

6-16
a,c
Figure 6-5 Comparison of Total FA dP Data between CIB39, CIB44, and CIB46 (Flow Rate = 44.7 gpm)
WCAP-17057-NP September 2011Revision 1O0000004P00S000001000000000000000000*000000000
6-17
a,c
Figure 6-6 Comparison of Bottom Nozzle/P-Grid dP Data between CIB39, CIB44, and CIB46 (Flow Rate = 44.7 gpm)
W CAPl- 1 /05 /-INP September 2011Revision 1

6-18
Table 6-6 Summary of Head Loss Data from C1B42, CIB47, and CIB48 (Flow Rate = 15.5 gpm)-.1- .14 U
4 4 4
4 4 4
4 4 4
4 4
1 4 1
I I I
000
acd
00000000
S0000
00000
00
0000S0000
0
00
0WCAP-17057-NP September 2011
Revision 1
6-19
a,c
Figure 6-7 Comparison of Total FA dP Data between C1B42, CIB47, and CIB48 (Flow Rate = 15.5 gpm)
WCAP- 17057-NP September 2011
WCAP- 17057-NP September 2011Revision I

6-20
a,c
Figure 6-8 Comparison of Bottom Nozzle dP Data between CIB42, CIB47, and CIB48 (Flow Rate = 15.5 gpm)
WCAP- 17057-NP September 2011Revision 10000000600000000000*0000000000000000000000000

6-21
Table 6-7 Summary of Mixing Tank Inlet Pipe Location for FA Tests a,c~14 r T
t 1- 4
& 4- 4
t 1- 4
4 + 4
4 + 4
4 .4.
1 1 11 1 1
WCAP- 17057-NP September 2011Revision 1

6-22
6.2 EFFECT OF PARTICULATE
This section provides an overview of the debris bed formation (subsection 6.2.1) and the testingconducted to evaluate the effect of particulate loading on head loss (subsection 6.2.2). The additionaltesting has demonstrated that the amount of particulates affects the formation of the debris bed. If the p:fratio is at the limiting condition, the presence of chemical precipitates will cause a significant increase inthe overall pressure drop throughout the FA.
6.2.1 Debris Bed Formation
The initial tests (CIB01 - CIB 11) confirmed that fiber must be present for a pressure drop to occur. Thatis, the particulates tested simply passed through the FA until a fiber bed had formed; it was only upon theintroduction of fiber that the dP across the FA increased. Therefore, it is concluded that fiber is thelimiting variable. However, while reviewing the test data from CIB0 I-CIB 11, there were a few instanceswhere dP values were unexpectedly higher in tests that were conducted at low p:f ratios. (This observationwas confirmed with subsequent testing that will be discussed in subsection 6.2.2.) This observation can beexpanded upon by providing a discussion of how a debris bed might form throughout a FA.
Fibrous debris could snag on the leading edges of spacer grids or filters and begin to build a bed acrossthe smaller portions of the openings (e.g., from the comers). Fiber by itself is fairly porous (see C1B22,Reference 15), even with very small fibers. The particulates can fill the interstitial gaps among the fibersand decrease the porosity of the debris bed. In general terms, the debris bed formation observed in thesetests can be described by Figure 6-9.
0S
00
0
00
Particulate/Fiber Layer
Fiber Layer
I Flow
Figure 6-9 Debris Bed Layers Formed in FA Testing
If no particulate is present, then the debris bed will be made up entirely of the fiber layer. If particulatesare present in abundance, then the debris bed will be made up entirely of the particulate/fiber layer. For
some p:f ratios, both layers will be present.
The pressure drop through the debris bed is dependent upon the thickness of each layer and the
compression of the fiber layer when chemical precipitates are introduced. As the thickness of each debrisbed layer increases, the resistance associated with each layer increases. The filtration resistance can bewritten as a sum of the resistances in series:
R = RF + RPF
where:RF: resistance of the fiber only layerRPF: resistance of the particulate/fiber layer
WCAP- 17057-NP September 2011Revision 1
00000000000S0000000000

0* 6-230
*The total resistance of the debris bed is dependent upon the extent of the particulate/fiber and fiber layers.Once the chemical precipitates are added, the equation can be expanded to:
R = RF + RPF + Rchem
where:
Rchem: resistance of chemical precipitates
Testing has indicated that if a fiber-only layer is not present (i.e., particulates are available in abundance,or a high p:f ratio), the chemical introduction has little to no effect on the dP across the debris bed.However, if a particulate/fiber and a fiber-only layer exist (i.e., all particulates are filtered by the bed, or alower p:f ratio), then the compression of the bed by chemical precipitates may have an effect on the dPacross the bed.
* 6.2.2 Limiting P:F Ratio
*As previously stated, the original test matrix did not contain information about low particulate debrisloads. Therefore, a series of tests was conducted at varying flow rates to evaluate the effect of particulateloading on head loss. Initial scoping tests (CIB21, C1B22, C1B23, C1B27, and C1B28) were conducted to
*evaluate if the particulate load did have an impact on head loss. (C0B24, CIB25 and CIB34 were also*scoping tests but did not result in new insights so they are not included in this discussion.) From these*tests (results summarized in Table 6-8, Figure 6-10, and Figure 6-11), it was determined the p:f ratio did
have an effect on head loss. Additionally, by comparing CIB22 to CIB21 and CIB23, it was concluded*that fiber by itself does not provide enough resistance to result in the limiting head loss. That is, C1B22, a*test conducted without particulate, had a head loss value less than CIB21 and C1B23, tests conducted at*the same fiber loading but with particulate. It is concluded that particulate needs to be present to fill the*interstitial gaps in the bed, resulting in a high resistance that is increased with the introduction of chemical
precipitates.
From these scoping tests, the results from the cold- and hot leg break tests differed enough that it was*decided a full analysis must be conducted to define the limiting p:f ratios at all test conditions. The tests
and conclusions are summarized in the following subsections.
*6.2.2.1 Cold Leg Break
The original test matrix only included a single cold leg break test. Therefore, a new series of tests wasconducted to determine the effect of low particulate on cold leg break conditions. All tests were
0conducted within a month of each other with the same inlet pipe location, which minimizes any of theroot cause findings related to unpredictable results; therefore, these tests are valid and can be compared toeach other.
Five tests, CIB29 through C1B33, were conducted and documented in Reference 15. This test series was*conducted with a constant fiber load (18 g) and five different p:f ratios: 5, 15, 30, 45, and 60. The purpose*of this test series was to identify the p:f ratio that resulted in the highest head loss at cold leg break* conditions. The results are provided in Table 6-9 and Figure 6-12.
00
WCAP-17057-NP September 2011Revision 1

6-24
The limiting p:f ratio for tests conducted at 3.0 gpm, a flow rate representative of a cold leg break, was 0defined as 45:1. Therefore, all tests conducted at this flow rate should be conducted at 45: Ito ensure
conservatism.
6.2.2.2 Hot Leg Break
The original test matrix included eight hot leg break tests, but the initial tests were not designed to
expressly evaluate the impact of the particulate amount on head loss. Therefore, a series of tests was
conducted to determine the effect of low particulate on hot leg break conditions. All tests were conducted
within a month of each other with the same inlet pipe location, which minimizes any of the root cause
findings related to unpredictable results; therefore, these tests are valid and can be compared to each
other.
Five tests, CIB35 through CIB39, were conducted and documented in Reference 15. This test series was
conducted with a constant fiber load (150 g) and five different p:f ratios: 1, 2, 5, 15, and 30. The purpose Sof this test series was to identify the p:f ratio that resulted in the highest head loss at hot leg break
conditions. The results are provided in Table 6-10 and Figure 6-13.
At p:f ratios greater than 5:1, very little additional pressure drop is recorded when the chemical surrogate
is introduced, indicating that testing with less particulate is conservative. With the lower quantity of
particulate, the debris bed seems to compress more as the chemical surrogate is added and provide a
greater resistance to flow. The limiting p:f ratio for tests conducted at 44.7 gpm, a flow rate representative
of a hot leg break with all trains in operations, was defined as 1: 1. SFurther, the baseline tests discussed in subsection 6.1.1 evaluated p:f ratios of 1:1 and 5:1 with the inlet
pipe submerged. These tests also confirmed conservative head loss values are recorded at p:f ratio of 1:1
even with the inlet pipe submerged.
In addition to evaluating the flow rate representative of maximum ECCS flow, p:f ratio was also
evaluated at a reduced flow rate intended to represent a single train in operation. Two tests wereconducted within the same week and the same inlet pipe location, resulting in comparable data. These
tests, CIB42 and C1B43, displayed the same behavior as observed in the test series conducted at
44.7 gpm. That is, the test conducted at a p:f ratio of 1:1 had a higher head loss than the test conducted at5:1 and these results are summarized in Table 6-10.
It is concluded the 1:1 ratio is limiting for all tests conducted at hot leg break conditions. Therefore, all
tests conducted to evaluate hot leg break conditions should be conducted at a p:f ratio of 1:1 to ensure
conservatism.SSS0
SS
WCAP- 17057-NP September 2011Revision 1
S

00
0
00
0S
0
S
0
0000
0
00000
6-25
Table 6-8 Summary of Head Loss Data from P:F Ratio Scoping Tests 6-C
WCAP-17057-NP September 2011Revision 1

6-26
a,c
Figure 6-10 Comparison of Data Plots from Cold Leg Break P:F Scoping Tests (CIB21, CIB22, and CIB23)
WCAP- 17057-NP September 2011Revision 1OOOQOOOO0 0 e 9 0 0 0 0 0 0 * * * 010 0QQ

*eeoe0eee@@e@@[email protected]@@es@@@@@@
6-27
ac
Figure 6-11 Comparison of Data Plots from Hot Leg Break P:F Scoping Tests (CIB27 and CIB28)
WCAP-17057-NP September 2011Revision I

6-28
Table 6-9 Summary of Head Loss Data from Cold Leg Break P:F Evaluation a,c
~J~Jb V T
t I I 4 1-
I I I
I. I I * I
I I I I I
I. I 1 4
4 I I 4
I I I I I I
000000000000000000000000000000000000000000
WCAP- 17057-NP September 2011Revision 1

6-29
a,x
Figure 6-12 Comparison of Data Plots from Cold Leg Break P:F Evaluation (CIB29 through CIB33)
~111f AID 1 '7nC7 1.JfVV •.•_-'•.•-I IV,.) l-i'•I- September 2011
Revision 1

6-30
Table 6-10 Summary of Head Loss Data from Hot Leg Break P:F Evaluation a,cTh r T 1 r r 1 II-
4 4 4- 4 4 + 4
4 4 4- 4 4 4- 4
4 4 4- 4 4 + 4
4 4 4- 4 4 .4- 4
4 4- + 4 4 4
4 4- + 4 4 -4- &
WCAP-17057-NP September 2011Revision 1

6-31
a,c
Figure 6-13 Comparison of Data Plots from Hot Leg Break P:F Evaluation (CIB35 through CIB39)
WCAP- 17057-NP September 2011
WCAP-17057-NP September 2011Revision I

6-32
6.3 EFFECT OF BREAK LOCATION AND FLOW RATE
An evaluation was conducted to determine the break location and flow rate that should be used to developan acceptance criterion for the mass of debris that can be deposited at the core entrance and not impedeLTCC flows to the core. Subsection 6.3.1 evaluates CL and HL break conditions and subsection 6.3.2evaluates the impact of flow rate on testing. It is concluded the hot leg break condition at the maximumflow rate represents the most conservative test conditions and should be used for testing designed todefine debris limits.
6.3.1 Selection of Limiting Break Location
The amount of debris that reaches the RV lower plenum and core inlet after a CL break should besignificantly less than the amount that reaches the core for a HL break. As described in Section 2, theECCS flow that reaches the core is only that necessary to make up for core boiloff. The boiloff rate is afunction of time as a result of the LOCA, the core exit pressure and decay heat. Over time, decay heatdecreases such that the core boiloff rate decreases. Any ECCS flow over and above the boiloff rate isreturned to the containment via the break. Once in the sump, the debris may settle or be refiltered throughthe sump screens before it can return to the RCS.
In order for the debris to transport through the RCS, it must be fairly well mixed in the ECCS fluid.Therefore, the debris is homogeneously mixed with the ECCS fluid such that the fraction of debris thatreaches the RV lower plenum is proportional to the fraction of ECCS flow that reaches the RV lowerplenum. SBased on the well mixed assumption and the core to break flow split characteristics, significantly lessdebris reaches the RV lower plenum for the CL break than for the HL break.
Further, in addition to the reduced debris quantities in a CL break, the total flow into the core issignificantly less than what would occur in a HL break. If no failures occur in the ECCS, the total ECCSflow to the RCS may be as high as 8500 gpm for the Westinghouse-designed three- and four-loop plants(Reference 10). CE-designed plants typically only use the high-pressure safety injection (HPSI) pumpsduring sump recirculation so the flow rates are considerably lower. The maximum flow rate is expected tobe approximately 1500 gpm (Reference 10). Equation 3-2 can be used to quantify the effect of lower flowrate on head loss. The flow-pressure relationship was demonstrated in the initial test matrix through acomparison of results from CIB08 and CIB09.
Additionally, the conservatisms inherent to the CL break testing of the FA test program are restrictive.These conservatisms include:
1. The PWROG FA test program conservatively used a constant 3 gpm as the flow rate for theCL break evaluations. In the event of a CL break, the actual core flow rate is defined by the initialcore power and core decay heat. At the time of sump switchover (the earliest time that debris canreach the core), the flow rate will be highest because the core decay heat is highest. Over time,the core decay heat decreases as does the core boiloff rate. The flow rate decrease results in adecreased pressure drop through the debris bed that formed. It also reduces the velocity in theRV LP and decreases the ability of debris to be lifted to the core inlet. Maintaining a constant, S
WCAP- 17057-NP September 2011Revision 1
S

* 6-330
* high flow rate ensures that all debris that might reach the RV over 30 days is introduced to the0 core and ensures the most resistant debris bed. Therefore, maintaining a constant flow in the tests
results in a conservatively high head loss value.
0 2. A flow rate of 3 gpm corresponds to the highest expected core boiloff rate at approximately* 20 minutes after the LOCA. A sump switchover time of 20 minutes is conservatively determined* by considering no failures of the ECCS and minimum liquid volumes in the RWST. At the
minimum assured ECCS flow rate, this time is approximately an hour or longer. At one hour afterthe event, the decay heat has decreased to a point at which the core boiloff rate is approximately
* 2/3 of the boiloff rate at 20 minutes. A lower flow rate will form a less resistant debris bed anddecrease the pressure drop through any bed that has formed. Again, maintaining a constant, highflow in the tests results in a conservatively high head loss value.
Finally, work has been conducted for a separate PWROG program (PA-ASC-0689) to evaluate boric acid* precipitation and this work has unintentionally quantified the conservatisms associated with the CL FA
testing. In support of the boric acid program, a test column has been developed to simulate an RV after a* CL break. Coolant and debris enter through a downcomer and flow through the LP into the simulated core
region. Additionally, the coolant is heated and the flow decreases over time as dictated by the Appendix K0 decay heat curve. This program tested significant quantities of debris (including fiber) and did not record0 any debris accumulation on the bottom nozzle and/or grids (Reference 22). This test demonstrates that0 when more prototypic conditions are simulated, the CL break does not form debris beds at the core inlet
or spacer grids.
* Based on the CL-specific conditions including (1) the reduction in debris that reaches the core, (2) the0 lower flow rates that result in lower head loss, and (3) testing that demonstrates debris beds do not form* in CL break prototypic conditions, it is determined the HL break represents the limiting test condition and
the debris limits will be defined from HL break tests.
* 6.3.2 Selection of Limiting Flow Rate0
In the event of an HL break, there are two possible flow scenarios. The first scenario assumes all ECCStrains are in operation, resulting in a maximum flow of approximately as 8500 gpm (Reference 10). Thesecond scenario assumes only a single ECCS train is in operation, resulting in a minimum HL flow of
* approximately 3000 gpm (Reference 23).0A series of five tests (two tests at 15.5 gpm and three tests at 44.7 gpm) was conducted to define thelimiting flow condition for HL break tests. The results are summarized in Table 6-11. A bar chart that
* compares the 0P before chemical introduction and after chemical introduction is provided in Figure 6-14.0These tests consistently demonstrated the maximum head loss occurs at the high-flow conditions,confirming the pressure-flow relationship defined in Equation 3-2. It is concluded the most conservative
* head loss values are recorded at high flows and debris limits should be defined at these test conditions.00000
WCAP-17057-NP September 2011Revision 10

6-34
Table 6-11 Summary of HL Break Flow Rate Evaluationa,c
4 4 4- 4- +
4 1 4- 4- 4-
0SS0SS0S0SSSS0SSSSSSSSSSSSSSSSSSSSSSSSSSSS
WCAP-17057-NP September 2011Revision 1

000000
0
0
0
0
00
000000
00
S
00
0000
6-35
a,c
Figure 6-14 Comparison of Maximum dP Recorded at HL Break Flow Rate Evaluation
6.4 REPEATABILITY EVALUATION
]ac
WCAP- 17057-NP September 2011
WCAP- 17057-NP September 2011Revision I

6-36
6.4.1 Repeatability Testing Conducted at 15.5 gpm
[
6.4.2 Repeatability Testing Conducted at 44.7 gpm
[
0S00
00000S
00000
0
]a,c
]a,c
Table 6-12 Summary of Results from Repeatability Testing Conducted at 15.5 gpm
4 1
* I
i i
4 i
4 4
i 4
i 4
0a,c
0000000000000000000
4 4
4 4
WCAP- 17057-NP September 2011Revision 1

6-37
a,c
Figure 6-15 Comparison of Data Plots from 15.5 gpm Repeatability Evaluation (CIB42 and CIB48)
WLAf-1 IU~ I-IN? September 2011
w, UAI- I / U5/-IN September 2011Revision I

6-38
Table 6-13 Summary of Results from Repeatability Testing Conducted at 44.7 gpm
I. 1- 1-
-lb ___________________________ ______________________ ______________________ ______________________
S000000000000000000000000000000000000000000
WCAP-17057-NP September 2011Revision 1

6-39
a,c
Figure 6-16 Comparison of Data Plots from 44.7 gpm Repeatability Evaluation (CIB49, CIB50, and CIB51)
WCAP- 17057-NP September 2011Revision 1

6-40
6.5 EVALUATION OF DEBRIS TYPESS
FA testing was conducted to evaluate the impact of various debris types on head loss: particulate is
discussed in subsection 6.5.1, microporous debris is discussed in subsection 6.5.2, cal-sil debris is
discussed in subsection 6.5.3, chemical precipitate is discussed in subsection 6.5.4, and fibrous debris is
discussed in subsection 6.5.5.
As discussed in Section 6.2, the amount of particulate tested can affect the overall results and the impact
of chemical effects. There is a limiting p:f ratio that will produce the highest head loss and tests conducted
at lower or higher p:f ratio, for a constant fiber loading, will result in lower head loss values. The FAtesting demonstrated that cal-sil and microprous debris behave like a particulate and are characterized as
such; plants that generate these types of debris are bound by test results conducted with only particulate
debris. FA testing also demonstrated only a small amount of chemical surrogate material is needed to
achieve the maximum head loss; subsequent additions of chemical surrogate do not increase head loss
through the FA.
Fiber is the limiting variable. Upon the introduction of fiber to the test loop, a dP across the FA is
immediately recorded. Subsequent fiber additions always result in an increase in head loss. This test
program has demonstrated that the only debris type that requires a limit is fiber. The fiber limit must be
defined by tests conducted at the limiting p:f ratio and include chemical surrogate. Because particulateloadings less than or greater than the loading tested to achieve the limiting p:f ratio will result in a
decrease in head loss, a maximum allowable particulate limit does not need to be defined. Further, since
only a small amount of chemical precipitate material is necessary to achieve the maximum head loss and
subsequent chemical introductions do not increase head loss, a maximum allowable chemical loadingdoes not need to be defined.
6.5.1 Effect of Particulate 0Particulate debris was represented by silicon carbide. The effects of particulate loading are discussed in
detail in Section 6.2 and summarized here.
It has been concluded that the amount of particulates affects the formation of the debris bed. If the p:fratio is at the limiting condition, the presence of chemical precipitates will cause a significant increase in
the overall pressure drop. At the limiting p:f ratio, the manner in which the debris bed forms results in thelargest resistance, which results in conservatively high head loss values. Tests conducted at lower or
higher p:f ratio for a constant fiber load will result in lower head loss values. Testing demonstrated the
limiting p:f ratio for CL breaks was 45:1 and 1:1 for HL breaks. S6.5.2 Effect of Microporous Insulation
CIB07 included Microtherm to represent microporous insulation. Previous experience in sump strainer
testing indicated that this type of insulation would provide significant increases in the pressure drop
across the debris bed. Since a few plants that Westinghouse provides fuel for have both microprous and
cal-sil insulation, this test was conducted with both debris types. CIB07 had a lower head loss (2.50 psid)
than CIB03 (4.11 psid), so it is concluded that tests conducted with silicon carbide will bound plants thathave microporous and cal-sil insulation. 0
WCAP- 17057-NP September 2011Revision I
0

* 6-410
*Additional testing was conducted to address RAIs (Reference 13) related to Microtherm. In
*December 2009, a presentation was made to the NRC staff that used data from the AREVA FA testprogram to demonstrate that plants that have particulate debris and microporous debris but do not have
cal-sil debris are still bound by results obtained from tests conducted with only silicon carbide. The test*and test parameters are provided in Table 6-14 (Reference 24). The pressure drop with each fiber addition
*is shown in Figure 6-17 (Reference 24). The test with Microtherm and silicon carbide provided similar
results as a test with only silicon carbide, demonstrating that Microtherm behaves like a particulate andplants with this insulation are bound by testing conducted with silicon carbide as the particulate surrogate.
*Additional testing, CIB26 and CIB40, was conducted to evaluate how Microtherm behaves at CL break
conditions. In order to provide a meaningful comparison of these tests, the particle size of silicon carbide
and Microtherm requires consideration. Microtherm has approximately the same particle size as siliconcarbide; however, the density of Microtherm is much less than that of silicon carbide. The density ofMicrotherm (Pmicrothem) is 2,199 g/ft3 (Reference 15) and silicon carbide (Psic) is 28,260 g/ft3
0(Reference 15). A comparison of a test with silicon carbide to a test with Microtherm should be based on
the number of particles tested, because the pressure drop is due, in part, to how the particles fill the*interstitial gaps in the fiber bed. If the mass is used, then the number of particles will be different, which
means that a different number of gaps will be filled. Since both particulates have the same particle size,
the volume of the particle will cancel out and the determination of the number of particles reduces to a
simple density ratio. The density ratio, Psic/Pmicrotherm, is equal to 12.9. Therefore, to test the same number
of particles, the mass of silicon carbide would need to be 12.9 times greater than the mass of Microtherm.
The amount of silicon carbide in CIB30 is nine times greater than the amount of Microtherm used in
0CIB26. Therefore, these tests will have a similar number of particles and the results can be meaningfullyScompared. CIB26 was conducted with Microtherm as the sole source of particulate and CIB30 was
conducted with silicon carbide as the sole source of particulate. This test showed that even at a fiber load
of 30 g (compared to the 18 g of fiber tested in CIB30), the pressure drop of CIB26 before chemicals are
added to the bed (0.30 psid) is less than the pressure of CIB30 before chemicals are added (0.32 psid).*(The maximum dP after chemicals were added resulted in a higher dP for CIB26 than C1B30, which is the*anticipated result as CIB26 had almost double the amount of fiber.) This comparison supports the
classification of Microtherm as a particulate.
*CIB40 was conducted with both Microtherm and SiC to see if there was an effect due to the combination*of particle sources. Accounting for the density difference between SiC and Microtherm, the p:f ratio in
*CIB40 is approximately:
*12.9.135+135p:f= =104 - 100:1f= 18
0*The highest p:f ratio of the CL break tests with only SiC and 18 g of fiber is 60:1. However, the results of
CIB40 continue the pressure drop trend of test CIB29 through CIB33. That is, the maximum dP was
established at a p:f ratio of 45:1. As the p:f ratio increases beyond the limiting condition of 45:1, the*pressure drop decreases. Overall, CIB40 trended with the other CL break tests, further illustrating
Microtherm can be classified as a particulate.
000
WCAP-17057-NP September 2011Revision 10

06-42
S6.5.3 Effect of Cal-Sil Insulation
0CIB06 included cal-sil debris. Cal-sil is made up of a combination of particulates and fibers.Consequently, it represents the worst of both debris types in that it is readily transportable and easily
catches on components. The cal-sil must pass through the sump screens, openings of approximately
0.1 inch, to reach the RCS. Therefore, cal-sil debris for the Westinghouse test was prepared by passing thematerial through a 0.1-inch sieve. As a consequence of this process, the fibers and particulates were
separated, with the bulk of fiber being removed.
Previous experience in sump strainer testing indicated that cal-sil would provide significant increases in
the pressure drop across the debris bed; this was not the case in FA testing. The cal-sil actually seemed toimprove the head loss across at the core inlet and spacer grids. This is likely due to the characteristics of
the cal-sil that reach the RCS. Consequently, the pressure drop through the debris bed is lower. Sincetesting with only SiC results in more conservative results, plants with cal-sil debris are bound by limits
defined by tests conducted only with SiC as the particulate surrogate.
6.5.4 Effect of Chemical Precipitate
In the majority of tests, chemical precipitates (aluminum oxyhydroxide or AlOOH) were added. Previous
experience in sump strainer testing indicated that A1OOH would provide significant increases in thepressure drop across the debris bed; this was observed only at certain conditions during FA testing. At
high (non-conservative) p:f ratios, chemical precipitates had little to no effect on the head loss at the core
inlet or spacer grids as evidenced by the time-history data plots presented in Appendices B-H. However,if the p:f ratio is at the limiting condition, the presence of chemical precipitates will cause a significant
increase in the overall pressure drop.
The amount of chemicals required to reach the maximum dP is independent of p:f ratio. That is, it onlyrequires a very small amount of chemical precipitate to reach the maximum head loss. The introduction of
additional chemical precipitates, after the maximum dP has been achieved, does not increase the head loss
at the core inlet or spacer grids. This behavior is consistent through all tests with A1OOH as evidenced bythe time-history data plots presented in Appendices B-H.
6.5.5 Effect of Fiber
Fibrous debris was represented by baked Nukon®.
Fiber is the limiting variable - without fiber, the debris flows freely throughout the FA and does not causea measurable head loss. Upon the introduction of fiber to the test loop, a dP across the FA is immediately
recorded. Subsequent fiber additions result in an increase in head loss. This behavior is observed in everyFA test and can be confirmed by a review of the test data presented in Appendices B-H.
SSSSS
WCAP- 17057-NP September 2011Revision I
S

000
000000
0
0
S0
00
0
00
0
0
0
6-43
Table 6-14 Test Conditions for Evaluation of Microtherm at Hot Leg Break Conditions (Reference 24)
Flow Rate Particulate Fiber Chemical MicroporousTest (gpm) (g) (g) (g) (g)
FG-FPC-W-2 44.7 13,154 150 4,540 0
FG-FPMC-W-6 44.7 13,154 150 4,540 544
Figure 6-17
*
U9. *
9 **
I*
* .* 9
0*
U
9.
0
I86 d-D-Z- 0I
Evaluation of Effect of Microporous Debris on Pressure Drop across Total Test FAwith Fiber Addition (Reference 24)
6.6 EVALUATION OF FUEL HARDWARE AND ALTERNATE FUEL TYPES
]a,c
WCAP- 17057-NP September 2011Revision 1

6-44
6.6.1 Alternate P-Grid Filter
I
] a,c
6.6.2 CE Plants and Guardian Grid
[
0S0SS0SSSSSSSSSSSSS0SSSSSSSSSSSSS
]a,c
6.6.3 Open Fuel Assembly
[
]ac
S
0S
September 2011Revision 1 5
SWCAP- 17057-NP

00
0S0000
0
0
00
000
0
0
S0S
SS0
0S
6-45
6.6.4 Upper Plenum Injection Plants
I
]a,c
6.6.4.1 Background
HL Break
I
]ac
CL Break
[
]a,c
6.6.4.2 Test Description
I
]a,c
6.6.4.3 Test Results
[
]ac
WCAP- 17057-NP September 2011
WCAP-17057-NP September 2011Revision I

6-46
6.6.5 Applicability of Test Results to Alternate Fuel Designs
pac
6.6.6 Applicability of Test Results to Future Fuel Designs
I]a,c
6.6.7 Mixed-Core Fuel Assemblies
Westinghouse is continually refining fuel designs to meet the challenges of the industry. While the majorcomponents of the design (e.g., fuel filters) do not change significantly, other aspects of the fuel designthat are not affected by GSI-191 may change. To that end, current Westinghouse customers may changethe fuel design in the core.
During each reload, a large portion of the fuel in the core is replaced (typically about one-third of thefuel). The new fuel may be different from the resident fuel, which creates a mixed core situation. In thissituation, the most conservative approach for applying the acceptance criteria developed here is to onlyconsider the limiting fuel design. At the current time, all Westinghouse fuel filters have the same debrisload acceptance criteria, so they are equally limiting.
It is also possible that Westinghouse fuel products could be co-resident with another vendor's product.Guidance for applying varying debris limits to the core is provided in WCAP- 16793-NP.
6.7 EVALUATION OF TEST CONSERVATISMS
The previously discussed tests did not model prototypic conditions following a LOCA. The majority oftests (CIBO1-CIB51) were designed to provide a conservative basis for setting the fiber limit for theoperating fleet. It was recognized that testing should be conducted to quantify the inherent conservatismsin the test process. To that end, a series of conservatism scoping tests was designed to evaluate the effectsof higher temperature, simulation of hot leg switchover, boron and buffer agents, and chemical additionrate effects on pressure drop. The results of these tests are discussed in the following subsections.
0000000000000000000000000000000000000000000
WCAP-17057-NP September 2011Revision 1

* 6-470
*6.7.1 Summary of Conservatisms Evaluated06.7.1.1 Increased Temperature
Immediately following a LOCA, the temperature of the sump is elevated. In fact, in the days following0the event, the sump temperature decreases but remains at temperatures higher than approximately 120'F.* Over the first 30 days following a LOCA the sump temperature is likely to range from -25 0 F to 1307F.
Previous Test Conditions: In spite of the fact none of the operating PWR sumps will have temperatures0around 70'F, the FA testing was conducted at ambient conditions. This temperature was chosen to0maximize the water viscosity and promote higher head losses through the debris beds. However, to not*quantify the temperature effect is to ignore a significant test conservatism that leads to the definition of*very restrictive fiber limit for the utilities.
*Change to Test Method: Darcy's Law provides the basis for the pressure drop (AP)-viscosity (ýI)relationship:
0AP/co=LP/K
0where:0AP = pressure drop across bed0) = flow velocity (ftls)
*L = length of porous bed (ft)* = dynamic viscosity (lbf=sec/in 2)*K = permeability (ft 2)
This equation illustrates that as viscosity decreases, the pressure drop through the debris bed will also0decrease. Therefore, the conservatism testing evaluated the head loss recorded with heated mixing tank
water.
6.7.1.2 Boron and Buffering Agents0Boron is used by all plants to achieve shutdown margin after a LOCA and buffering agents are used by all
*plants to neutralize the pH of the system after a LOCA.
Previous Test Conditions: In spite of the fact boron and buffering agents will be present in the sump*after a LOCA, the FA testing was conducted without these agents in the tested mixing tank water. The
initial test plan realized the chemical precipitates may have increased solubility in an environment withelevated pH values and boron present. However, to not quantify the effects of these agents is to ignore asignificant test conservatism that leads to the definition of very restrictive fiber limit for the utilities.
*Change to Test Method: Boron and buffering agents were included in testing. The quantities andbuffering agent used were designed to be representative of the operating fleet.
000
WCAP-17057-NP September 2011Revision 10

6-48
6.7.1.3 Rate of Chemical Introduction
In the event of a LOCA, chemical products will slowly form in the sump. This behavior was not modeledin the PWROG FA test program. Further, the chemical precipitate concentrations in the sump will besignificantly lower than those tested in the PWROG test program.
Previous Test Conditions: The testing will continue to use AIOOH prepared in accordance with themethod provided in WCAP-16530-NP-A (Reference 9) to be representative of chemical precipitateproducts. Additionally, tap water will continue to be used to produce the surrogate. This decision issupported by information provided in References 8 and 27:
* Testing summarized in Reference 8 supports the use of AlOOH as a conservative chemicalsurrogate. Further, this testing demonstrated that surrogates made with high-purity water were notas effective or as stable as those made with tap water.
" The objective of the tests in Reference 27 was to compare head loss associated with precipitateformation from aluminum coupon corrosion with those WCAP- 16530-NP-A (Reference 9)precipitates. These tests found that AlOOH surrogate prepared per WCA-P-16530-NP-A(Reference 9) results in conservative head loss; therefore, this surrogate is suitable for FA testing.
However, in the previous tests, the chemical surrogate was added to the loop in excess of production rateand expected concentration. This resulted in a very conservative increase in head loss upon the addition ofchemicals.
Changes to Test Method: Chemicals were introduced at a rate that is two times greater than the fastestrate from the operating fleet. Additionally, the concentration of the mixing tank will be monitored. Theconcentration that causes an unacceptably high dP will be recorded. Utilities that can demonstrate theirchemical precipitate concentration does not reach these levels, can demonstrate a tolerance for a largeramount of fibrous insulation. The same total mass of chemicals used in previous FA testing will be used inthis test.
6.7.2 Conservatism Testing Results
6.7.2.1 Effect of Boron and Buffering Agents
00S0S0SSSSSSSSS
SSSSSSSSSSSSSSSSSSSSSSSSSSS
WCAP- 17057-NP September 2011Revision 1

000S0S0SSSSSSSSSSSSSSS
0S
0S
0SSS
6-49
]ac
6.7.2.2 Effect of High Temperature and Credit for Hot Leg Switchover
[
]ac
6.7.2.3 Effect of High Temperature
I
P ac
WCAP- 17057-NP September 2011Revision 1

6-50
6.8 DEVELOPMENT OF FIBER LIMIT
I
ac
Table 6-15 Summary of Differences Between CIB54 and 1-W-FPC-0811
S0000
00000
000S
a0
000
a 0
0
00
0
0
This test demonstrated that the head loss results collected at limiting p:f ratio are impacted by smallfacility differences. Both Westinghouse and CDI facilities were designed with the intention of producingoverly conservative results. These results indicate the CDI facility is more conservative than theWestinghouse facility but these results do not mean results from the Westinghouse loop are invalid. Inorder to quantify the conservatism of the Westinghouse loop, additional testing would have to beconducted to evaluate the loop behaviors to prototypic plant conditions.
It is important to note that differences between facilities are not significant at p:f ratios greater than 10:1as presented in Reference 24. In spite of this, and without additional testing to provide a technical basis,the fiber limit for the Westinghouse-fueled fleet will be set at the lowest fiber limit that did not causeunacceptable head loss when tested in the CDI loop. Plants with Westinghouse fuel can use the followingto evaluate the impact of debris on LTCC:
WCAP- 17057-NP September 2011Revision 1

0
0
00
0
0
0
0
00000
000000S0
000
0
0
6-51
* The AREVA testing conducted in support of this program demonstrated that 15 g of fiber/FA doesnot cause a blockage that will challenge LTCC, [ ]a,C. This dP valueis from Reference 29 and can be verified by review of the AREVA proprietary test report (51-9106285). Therefore, plants utilizing Westinghouse fuel can demonstrate LTCC is not impeded ifthe plant-specific debris load is less than or equal to 15 g of fiber/FA.
* The test conducted with Westinghouse fuel at CDI to evaluate test facilities, 1 -W-FPC-08 11, was
conducted with 25 g fiber/FA. This test demonstrated flow was able to continue to enter the core,even though the flow rate had to be reduced during the test. The maximum dP recorded duringthis test is [
]a". Therefore, plants with Westinghouse fuel that have a driving head greater than orequal to this dPdebris value, and operate at conditions similar to tested conditions, can withstand 25g fiber/FA.
" As demonstrated by CIB54, Westinghouse-fueled plants that can maintain high sump watertemperatures can decrease the dPdebris at a specific fiber loading. This results in the capability ofincreasing allowable fiber load.
" CIB53 demonstrated that if plants can delay the formation of chemical precipitates until afterHLSO, a greater amount of fiber will be able to enter the core without impeding LTCC thandemonstrated by the AREVA test at 15 g of fiber and the Westinghouse test, 1 -W-FPC-08 11.
* All tests conducted at the limiting p:f ratio conditions, see the largest increase in head loss whenchemical precipitates are added to the test loop. If a plant can demonstrate chemical precipitatesdo not form, the dPdebris values for tests CIB41 - CIB54 (not including CIB46 and C1B47) (listedin Table 5-1 as 'Max FA Head Loss - Before Chem (psid)') can be used to make a determinationon the amount of allowable fiber.
WCAP- 17057-NP September 2011WCAP- 17057-NP September 2011
Revision I

0
0
0
0
0
0
0
0
0
00
SS
000000
00
0000
7-1
7 CONCLUSION
The purpose of the FA testing described in this report was to justify acceptance criteria for the mass ofdebris that can reach the RCS and not impede long-term core cooling flows to the core. The testingrecorded in this report supports the conclusion that fiber is the limiting variable and is the only debris typerequiring a limit.
The options presented in Section 6.8 must be considered when determining if the plant-specific fiberloading will not impede LTCC. This determination will be used in conjunction with WCAP- 16793-NP,Revision 2 to demonstrate adequate flow for long-term decay heat removal.
Plants that are within the limits of the parameters tested are bounded by the tests and meet the long-termcore cooling requirements. Several courses of action have been identified for plants whose debris loadsare outside of the limits tested. These actions include, but are not limited to, reduction of debris sourcesby removing or restraining the affected debris source or plant-specific fuel assembly testing.
If a plant elects to conduct plant-specific testing, the following must be considered during testing:
* Tests must be conducted at the limiting p:f ratio. Testing can only occur at a different p:f ratio inthe event a plant can provide a technical basis.
" Testing should be conducted at the highest expected flow rate.
* All pipes in the test loop should be submerged.
* Testing should follow the following debris addition order: all particulate (allowed to circulatethrough the loop a minimum two loop turnover times), fiber in no more than 10 gram increments(allowed to circulate through the loop a minimum of two loop turnover times), and chemicalsurrogate.
WCAP- 17057-NP September 2011WCAP-17057-NP September 2011
Revision I

0* 8-10
* 8 REFERENCES0* 1. Generic Safety Issue, GSI-191, "Potential of PWR Sump Blockage Post-LOCA," 1998.0
2. Nuclear Regulatory Commission Generic Letter GL 2004-02, "Potential Impact of DebrisBlockage on Emergency Recirculation During Design Basis Accidents at Pressurized Water
*Reactors," September 2004.0
I 3. Westinghouse Report WCAP-16793-NP, Rev. 0, "Evaluation of Long-Term Cooling ConsideringParticulate, Fibrous and Chemical Debris in the Recirculating Fluid," May 2007.
4. Revised Guidance for Review of Final Licensee Responses to Generic Letter 2004-02,*"Potential Impact of Debris Blockage on Emergency Recirculation During Design Basis
Accidents at Pressurized Water Reactors," March 2008. [ADAMS Accession Number:ML080230112]
5. PWROG Letter OG-09-107, "Transmittal of PWROG Fuel Assembly Debris Capture and Head*Loss Protocol to PWROG Members (PA-SEE-0479 and PA-SEE-0480)," March 12, 2009.
6. Reference not used.S7. PG&E Letter DCL-08-059, "Supplemental Response to Generic Letter 2004-02,
'Potential Impact of Debris Blockage on Emergency Recirculation during Design Basis Accidentsat Pressurized Water Reactors' (Revision 1)," July 2008.0
* 8. "Technical Letter Report on Evaluation of Chemical Effects; Studies on Precipitates Used inStrainer Head Loss Testing," January 30, 2008. NRC Contract #JCN 3216. [ADAMS AccessionNumber: ML080600223]0
9. Westinghouse Report WCAP-16530-NP-A, "Evaluation of Post-Accident Chemical Effects in*Containment Sump Fluids to Support GSI-191," March 2008.
10. Westinghouse Letter LTR-SEE-I-09-35, "Communication of Representative Hot Leg Break Flow*Rates for Use in the PWROG Fuel Assembly Test Protocol," March 10, 2009.0
11. Westinghouse Report STD-MCE-09-24, "Summary of Core Inlet Blockage Tests," March 2009.
12. Westinghouse Report WCAP- 16793-NP, Rev. 1, "Evaluation of Long-Term Cooling Considering*Particulate, Fibrous and Chemical Debris in the Recirculating Fluid," April 2009.0
13. "Request for Additional Information RE: Pressurized Water Reactor Owners Group TopicalReport WCAP-16793-NP, Revision 1, 'Evaluation of Long-Term Cooling Considering
* Particulate, Fibrous and Chemical Debris in the Recirculating Fluid' (TAC No. ME 1234),"January 8, 2010. [ADAMS Accession Number: ML 101800087]
000
WCAP-17057-NP September 2011Revision 10

08-2
014. NUREG/CR-6914, Volume 1, "Integrated Chemical Effects Test Project: Consolidated Data 0
Report," December 2006.0
15. Westinghouse Report STD-MCE-10-12, Rev. 0, "Summary of Results from PWROG Core InletBlockage Tests: CIB21 through CIB40," February 2010. 0
16. Westinghouse Report RTU-MCE-11-13, Rev. 0, "Summary of Results from PWROG Core InletBlockage Tests: CIB41 - CIB43, CIB48 - CIB5 1," February 2011.
17. PWROG Letter OG-10-442, "Transmittal of LTR-SEE-I-10-132, 'Root Cause InvestigationReport (NS-ENG-6237): PWROG LTCC Program Repeat Test Results (GSI-191),' (PA-SEE-0312 Revision 1)," December 23, 2010.
18. PWROG Letter OG-10-339, "Status Update on Fuel Assembly Cross-Test Associated with
WCAP-16793-NP, Revision 1 for Evaluation of Long-Term Cooling Associated withSump Debris Effects (PA-SEE-0312)," September 29, 2010.
19. Westinghouse Report RTU-MCE-10-150, Rev. 0, "Summary of Results from PWROG Core Inlet
Blockage Tests: CIB44 and CIB45," November 2010.0
20. PWROG Letter OG- 10-291, "Transmittal of Fuel Assembly Cross-Facility Test Plans for
Evaluation of Long-Term Cooling Associated with Sump Debris Effects (PA-SEE-0312)," August
31, 2010. 021. Westinghouse Report RTU-MCE-11-15, Rev. 0, "Summary of Results from PWROG Core Inlet
Blockage Tests: CIB46 - CIB47," June 2011.
22. PWROG Letter OG-10-382, "Summary of NRC 09-15-2010 Visit to Westinghouse RTU to
Observe ASC-689 Testing," November 5, 2010.
23. Westinghouse Letter LTR-SEE-I-10-99, "Communication of Representative Flow Rates for One-Train Operation in Westinghouse-Designed Plants," August 19, 2010. 0
24. NRC Public Document, "12/17/2009 Meeting Presentation, 'Evaluation of Long-Term Cooling
Considering Particulate, Fibrous and Chemical Debris in the Reciruclating Fluid',"December 2009. [ADAMS Accession Number: ML093570160]
25. Westinghouse Letter SFAD-11-81, "Westinghouse Fuel Information for GSI-191 and WCAP-
17057," June 22, 2011.
26. Westinghouse Report RTU-MCE-11-79, Rev. 0, "Summary of Results from PWROG Core Inlet
Blockage Scoping Tests: CIB52, CIB53 and CIB54," August 2011.0
27. "Technical Letter Report on Evaluation of Head Loss by Products of Aluminum AlloyCorrosion," August 11, 2008. NRC Contract #JCN 3216. [ADAMS Accession Number:
ML082330167] 0
WCAP- 17057-NP September 2011Revision I
0

S000S0S
0
00
00S0
000
00000000
0
000000
0
8-3
28. CDI Test Report 11-16, "Westinghouse PWROG Fuel Assembly Test Report," September 2011.
29. Attachment to e-mail sent February 23, 2011, "ConservatismPathForward_021811 .docx," fromVictor Hatman to Susan Baier (Proprietary).
30. NEI 04-07, Rev. 0, "Pressurized Water Reactor Sump Performance Evaluation Methodology -Volume 2," December 6, 2004. [ADAMS Accession Number: ML050550156]
WCAP- 17057-NP September 2011Revision 1

000000
000S
0
00
000S
00
00
0
0
0
A-I
APPENDIX ATEST PROTOCOL FOR PWROG FUEL ASSEMBLY TESTS
The following section provides the test protocol that was used for the PWROG fuel assembly testprogram. This appendix is proprietary in its entirety and will not be included in the non-proprietaryversion of this document.
WCAP- 17057-NP September 2011
WCAP- 17057-NP September 2011Revision I

0000000
0
0
0
00S
0
0
00
00
00
0
B-1
APPENDIX BTEST REPORT NO. 1
This appendix contains Reference 11 in its entirety. This appendix will not be included in thenon-proprietary version of this document.
WCAP- 17057-NP September 2011
WCAP- 17057-NP September 2011Revision I

0
00
00
0
0
000
0
0
00
000
00S0000
C-1
APPENDIX CTEST REPORT NO. 2
This appendix contains Reference 15 in its entirety. This appendix will not be included in thenon-proprietary version of this document.
WCAP- 17057-NP September 2011
WCAP-17057-NP September 2011Revision I

00
0000
0
0
0
000
S0
00
0000S0
0
000
D-I
APPENDIX DTEST REPORT NO. 3
This appendix contains Reference 16 in its entirety. This appendix will not be included in thenon-proprietary version of this document.
WCAP- 17057-NP September 2011Revision 1

000
0
0
00
00
00
00
0S0
S0
S
000
E-1
APPENDIX ETEST REPORT NO. 4
This appendix contains Reference 19 in its entirety. This appendix will not be included in thenon-proprietary version of this document.
WCAP- 1 7057-NP September 2011
WCAP- 17057-NP September 2011Revision I

000000S0S
0
00
00
0000S
S00
000
0
S
0
F-1
APPENDIX FTEST REPORT NO. 5
This appendix contains Reference 21 in its entirety. This appendix will not be included in thenon-proprietary version of this document.
WCAP- 17057-NP September 2011WCAP-17057-NP September 2011
Revision I

00
0000
00
00000
0
00
000
0S0S
0
000
G-1
APPENDIX GTEST REPORT NO. 6
This appendix contains Reference 26 in its entirety. This appendix will not be included in thenon-proprietary version of this document.
WCAP- 17057-NP September 2011Revision I

0
S
0
00
0
0
0
S
0
0
0
00000
0
0
000
0
H-1
APPENDIX HTEST REPORT NO. 7
This appendix contains Reference 28 in its entirety. This appendix will not be included in thenon-proprietary version of this document.
WCAP- 17057-NP September 2011Revision 1