test preparation for the gre analytical ... preparation for the gre analytical ability measure:...
TRANSCRIPT

TEST PREPARATION FOR THE GRE
ANALYTICAL ABILITY MEASURE:
DIFFERENTIAL EFFECTS FOR
SUBGROUPS OF GRE TEST TAKERS
Donald E. Powers
GRE Board Professional Report GREB No. 82-6bP ETS Research Report 86-40
November 1986
This report presents the findings of a research project funded by and carried out under the auspices of the Graduate Record Examinations Board.
Test Preparation for the GRE Analytical Ability Measure: Differential Effects for Subgroups of GRE Test Takers
Donald E. Powers
GRE Board Professional Report No. 82-6bP
November 1986
Copyright @ 1986 by Educational Testing Service All rights reserved.
Abstract
A previous study of the initial version of the GRE analytical ability measure (Powers & Swinton, 1984) revealed practically and statistically significant effects of test familiarization on analytical test scores. (Two susceptible item types were subsequently removed from the test.) Data from this study were reanalyzed for evidence of differential effects for subgroups of examinees classified by age, ethnicity, degree aspiration, English language dominance, and performance on other sections of the GFU3 General Test.
The results suggested little, if any, difference among subgroups of examinees with respect to their response to the particular kind of test preparation considered in the study. Within the limits of the data, no particular subgroup appeared to benefit significantly more or significantly less than any other subgroup.

Test Preparation for the GRE Analytical Ability Measure: Differential Effects for Subgroups of GRE Test Takers
The question of who can profit most from special test preparation has received very little attention (Cole, 1982) despite concerns that those who may benefit most are those who can least afford to purchase effective preparation. Compared with the longstanding search for how student characteristics relate to responses to various educational interventions (see, for example, Cronbach and Snow, 1977), there has apparently been very little concern about possible interactions between examinees characteristics or experiences and their responses to various kinds of special test preparation. This is true despite speculation that such variables as motivation and previous test-taking experience may moderate the effectiveness of test preparation.
A few studies, nearly all related to the Scholastic Aptitude Test (SAT), have provided some information regarding possible differential effects of test preparation for particular subgroups of test takers. In a study conducted at two secondary schools for boys, Dyer (1953) noted an interaction between coaching and enrollment in mathematics courses. The effect of coaching on SAT mathematical scores was greater for students who were not taking mathematics than for those who were. French (1955) found a similar pattern of effects for male students, according to whether or not they were enrolled in mathematics courses. However, he observed the opposite pattern for female students; that is, coaching was more effective for females who were studying mathematics than for those who were not.
More recently, a reanalysis by Messick (1980) of data collected for the Federal Trade Commission's study of commercial coaching schools (Federal Trade Commission, 1979) detected several interaction effects at one of the two schools studied. Specifically, the effect of coaching on SAT verbal scores was significantly greater for a very small group of Black test takers (N = 13) than for non-Black examinees. The effect on verbal scores was also greater for test takers who reported low family incomes than for those whose parental incomes were higher. This latter result led to the speculation that examinees with below-average financial means might have especially strong motivation to perform well on the test. In a reanalysis of another data set, collected by Alderman and Powers (1980) in a randomized study of high school verbal test preparation programs, Messick (1980) found little evidence for the differential effectiveness of test preparation for the eight specially prepared Black students that were identified.
In a study of the Graduate Management Admission Test &MAT), in which larger numbers of minority examinees could be identified, Leary and Wightman (1983) suggested that the effects associated with various kinds of test preparation varied somewhat across four ethnic subgroups (Black, Oriental/Asian, Spanish, and White). However, when differences in ability (as measured by earlier scores on the same test) were controlled statistically, the effect of using each of five methods of preparation was small, and for most methods, not

-2-
statistically significant. Moreover, the investigators correctly pointed out that the nonexperimental nature of the study resulted in an inevitable confounding of examinee characteristics with methods of preparation.
Over the past several years the GRE Program has sponsored a number of studies designed to establish the degree to which performance on the initial, experimental GFIE analytical measure, which was introduced in the 1977-78 testing year, might be susceptible to improvement through special test preparation. Swinton and Powers (1983) developed a brief program (about seven contact hours) of special preparation for the analytical section and administered it to a small group of students who were planning to take the GRE Aptitude (now General) Test. The subsequent analytical scores of these students were about 66 points higher than those of a comparison group. Subsequently, Powers and Swinton (1982, 1984) “packaged” this effective program and mailed its components, in various sets, to random samples of GRE test registrants in order to learn whether or not GRE test takers might benefit as much from independent study as from instructor-based test preparation. Examinees who had received and were encouraged to use the complete set of preparation materials (practice tests, explanations of correct answers to questions, and suggested strategies for approaching each analytical test item type) showed a 53-point advantage over examinees who did not receive any materials. This advantage was achieved, according to examinee reports, with an average of about four hours of preparation.
The objective of the study reported here was to determine, through further analysis of data, whether the highly effective test preparation that was offered in the previous experimental study of the initial version of the GRE analytical ability measure (Powers & Swintonl 1982; 1984) was more effective for some examinees than for others. The key features of the data base that made reanalysis attractive were (a) the randomized nature of the study, (b) the sizes of the samples employed (complete data on test scores, background data, and treatment utilization were available for more than 3,000 examinees), and (c) the practically and statistically significant effect on test scores (i.e., the 53-point effect that was observed for the treatment group getting the most extensive preparation).
Although the GRE General Test was revised after the study so that it no longer contains the two test item types that were found to be susceptible to special test preparation, the previously collected data provided a vehicle for assessing subgroup effects for a particular kind of test preparation. Because the initial version of the GRE analytical measure was shown to be clearly susceptible to improvement through preparation, it seemed possible that differential effects would be more likely for this test than for other, less susceptible tests.

-3-
Procedures
The Data Base
As stated above, the data for this study were from an experimental study of the effects of several combinations of special test preparation materials on GRE analytical ability scores. Briefly, about five weeks before the test date, random samples of GRE test takers (a total of more than 6,000) were mailed various combinations of test-preparation materials for the analytical ability portion of the test. These materials were designed to enable prospective test takers, through self-study, to become more familiar with the analytical ability section of the test. The materials included full-length sample analytical tests, explanations of all questions and hints for approaching each of the three types of analytical questions. Four different combinations of materials were assembled and sent to samples of examinees. A control group received only the GRE Information Bulletin, which is provided to all GRE test takers. Half of the test takers in each group, including those comprising the control group, were given extra encouragement, in the form of a strongly worded persuasive letter, to prepare for the test. Thus, a total of 10 distinct treatment conditions were employed in the study. More complete details about procedures and the materials used can be found in Powers and Swinton (1982). The major findings of the study, which are given in greater detail elsewhere (Powers & Swinton, 1984), were that the special preparation was effects were very strongly related to using the materials.
Data Analysis
highly effective and that the the amount of time devoted to
The major variables used in the study reported here were (a) GRE analytical ability scores, (b) background data (in particular, ethnicity, age, primary language, and degree aspiration) that examinees provide when registering to take the test, and (c) examinee self-reports of the amount of time they devoted to using the special test-preparation materials they received. Table 1 gives the numbers of examinees, their mean GRE analytical ability scores, and the average time spent using the preparation materials for each subgroup. Several specific subgroup classifications were chosen for analysis for the following reasons:
(a)
b)
(4
(d)
Age was thought to be a good proxy for recency of test-taking experience prior to taking the GRE
Primary language (English or other) might be related to facility with English language tests
Degree aspiration (doctorate vs. master's) might be related to motivation to perform well on the test
Ethnicity (Native American, Oriental, Puerto Rican, Chicano or Mexican American, Black, Other Hispanic, White, or Other) might be related to previous test-taking experience

-4-
Insert Table 1 About here
With respect to ethnicity, for some analyses, samples were judged to be sufficiently large only for Black examinees, since this was the only minority subgroup for which examinees were found in each cell of the design. All categorical variables were coded 0 or 1, except for ethnicity, which was coded as a set of n - 1 variables (where n is the number of ethnic categories) of the form: subgroup 1 = 1, 0, . . . , 0 on the n - 1 variables and subgroup n = 0, 0, . . . 0 on these variables.
An additional subgroup classification of interest was the degree to which examinees tend to perform better or worse on standardized admissions tests than might be expected from other information, in particular, indications of previous achievement. This variable was of interest here because of the FTC study conclusion that coaching can be effective for examinees who do not do well (or who, in the terminology of the FTC study, “underachieve” ) on standardized tests. Because test-taker characteristics were confounded with the kind of coaching school attended (and because different schools were observed to be differentially effective), this conclusion, although qualified in the FTC report, has been criticized as being too strong (Messick, 1980).
Effects of treatments on test preparation time. A first question of interest was “Did the treatment (in particular, encouragement to prepare) have any differential effects on the amount of time devot to preparing the analytical portion of the test?” To answer this question, time spent preparing (as self-reported by test takers) was regressed on the set of variables indicating treatment characteristi cst i.e., encouragement, receipt tests, etc. Nex t, background variables (age, aspi rations, and primary language) were added equation and the increase in the multiple car I
of additional practi ethnicity, degree to the regression -elation computed to
:ed
ce
determine if some subgroups of examine& tended to prepare more for the test than did others. Finally, a set of product variables was added to the regression to reflect the interaction among treatment characteristics and examinee background characteristics. The increase in the multiple correlation was then tested for significance to determine if any treatment features seemed to be related differentially to the time that particular subgroups of examinees spent on test preparation.
Effects on test scores. In order to assess possible differential effects of test preparation on subgroup performance, GRE analytical ability scores were regressed on the combination of treatment characteristics and examinee background variables. Again, a set of variables was then added to reflect interactions between treatment characteristics and background characteristics, and the significance of the increase in the multiple correlation was tested.

-5-
Operationally, the degree to which GRE examinees were “underachievers” on standardized tests was defined separately on the basis of both GRE verbal and GRE quantitative scores. Residuals were formed by regressing verbal (or quantitative) scores on undergraduate major area and self-reported undergraduate grade average in the major field. The difference between the actual and the predicted score was used as an indication of an individual’s degree of facility with standardiz,ed tests. The use of GRE verbal and quantitative scores for this purpose is justified because, although obtained at the same time as GRE analytical ability scores, they were not expected to increase, nor did they (see Powers & Swinton, 1984, for details), as a result of the special test preparation, which focused only on the analytical portion of the test.
A second set of analyses was conducted using test score means and mean test preparation times for each treatment group and for the subgroup classifications of interest. This alternative analysis was undertaken because, within each treatment group, test preparation time was related negatively to GRE scores. Average test preparation time was therefore treated as a characteristic of each treatment. For each of several subgroups, the mean GRE analytical score was regressed on the mean preparation time over the 10 treatment conditions. A variable indicating subgroup membership was also included in the regression. Next, an interaction variable (subgroup membership by mean test preparation time) was added, and the significance of its contribution to the increase in prediction was determined as an indication of the extent to which test preparation was more effective for some subgroups than for others.
Results
Effects of Treatments on Test Preparation Time
The combination of variables indicating the presence or absence of each of four treatment features, including encouragement to prepare, was related significantly to the amount of reported preparation for the analytical section, R = .17, F (4, 3284) = 23.4, p < l OOl. When examinee background variables (ethnicity, age, degree aspiration, and primary language) were added, the multiple R increased from .17 to .24. This statistically significant increase, F (10, 3274 ) = 10.8, p < .OOl, confirmed differences among subgroups (as can be seen in Table 1) in the amount of time they devoted to preparing for the GRE analytical test. Older (over 30 years old) examinees and doctoral degree seekers reported significantly more preparation time than did younger examinees or master’s degree seekers. (These effects were consistent for each of two forms of the test.) Black examinees also reported more time preparing than did Flhite examinees in each of the 10 treatment groups.
When interaction terms (treatment characteristics by subgroups) were added next, no increase in the multiple R was noted, thus providing no evidence that any particular treatment feature, including encouragement, was more or less instrumental in promoting test preparation for some subgroups than for others.

-6-
Effects on Test Scores
The individual as the unit of analysis. The prediction of GRE analytical scores from the combination of treatment features and examinee background characteristics (ethnicity, age, degree aspiration, and primary language) was significant R = .45, F (15, 3273) = 55.6, p < .OOl. Ken the appropriate set of subgroup- by-treatment interaction variables was added to this combination, the multiple R increased significantly only for ethnicity, from R = .45 to R- .47, F (35, 3238) = 1.63, p < .05. A more detailed analysis revealed that this small increase resulted on only one of the two test forms that were used, and stemmed primarily from a significantly lower effect of time spent on test scores for Oriental examinees, t (3238) = -4.13, p < .OOl. Thus we are reluctant to focus on-this result. The multiple R of .45 did not increase when interaction variables were added to reflect age, degree aspiration, primary language, or expectations for either verbal or quantitative test performance.
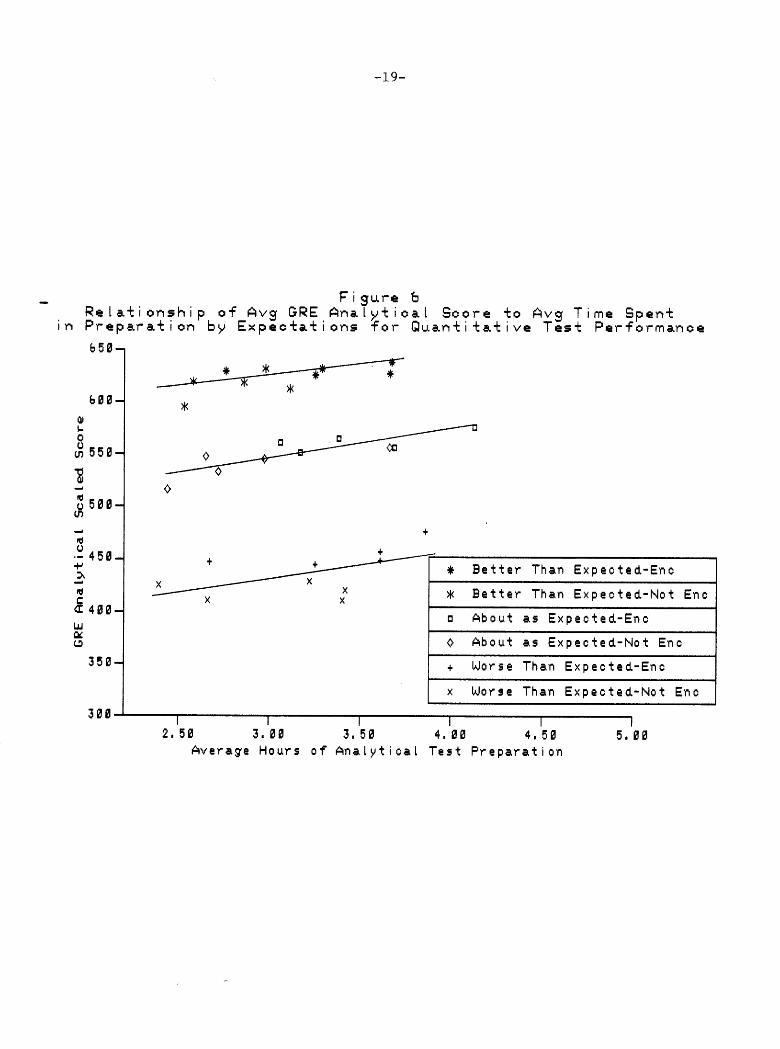
Analysis based on subqroup means across treatment conditions. Figures l-6 show the relationships between the mean GRE analytical scores and the mean preparation time for each of the examinee subgroups of interest. Generally, the relationship between average time spent preparing and average GRE analytical score was strong for each subqroup. Correlations ranqed from .67 and .71 for doctoral degree aspirants and Black test takers to .84, .87, .89, .92, and .92, respectively, for older (greater than 30 years old) examinees, master’s degree aspirants, white test takers, younger examinees (30 years old or younger), and test takers whose primary language was English. The relationship was weak (R = .12) only for those examinees who reported that English was not their primary language. An examination of regression weights showed that, on average, an additional hour of preparation time translated to an averaqe GRE analytical score increase of about 30 score points for most subgroups. Although these we ights suggested the possibility of somewhat greater effects for Black test takers (about 46 points per hour) and somewhat lower effects for doctoral aspirants (21~points) and examinees for whom English was a second language (4 points), these apparent differentials were not significant.
---------------
Insert Figures l-6 About Here
when subgroups were defined according to whether they performed better, worse, or about as expected on the verbal (or quantitative) section of the test, an hour of analytical test preparation time translated to about 25 (or 23) points for those who performed worse than expected from their undergraduate records, 28 (or 27) points for those who performed about as expected, and 11 (or 19) points for those who performed better than expected.

-7-
No significant interactions were detected for any of the groupings based on either demographic characteristics or expectations of test performance. For each classification, variables indicating (a) average time spent preparing for the test and (b) subgroup membership were highly predictive of average analytical score over the treatment conditions. Multiple R’s ranged from a low of .40 for the prediction of average GRE analytical from average time preparing and English fluency, and from .85 to .99 for other classifications.
The largest increase in the multiple R (from .40 to .43) occurred when the interaction term (English fluency x average time) was added to the prediction equation. However, this increase was not statistically significant, F (1, 16) = 0.58, p > .05. No other multiple R increased by more than .Ol, and none was statistically significant. Thus, a separate estimate of treatment effect for any of the subgroups considered here was not warranted, and the best estimate for each subgroup of the effect of an hour of preparation for the analytical test is in the range of 25-35 points on the 200-800 GRE analytical score scale.
Discussion
Speculation has been advanced concerning the possibility that coaching or other forms of special test preparation may be differentially beneficial for some kinds of test takers. The majority of studies of special test preparation have been unable to address this hypothesis adequately because of (a) the relatively small numbers of test takers from subgroups of interest and (b) the failure to demonstrate unequivocally the presence of any practically and statistically significant effect for test takers in general. This second shortcoming has resulted largely from the inability to conduct true experimental studies of the effects of test preparation, thus leaving self-selection as a plausible rival hypothesis.
A reanalysis was undertaken here of experimental data in which a practically and statistically significant effect of test preparation had been found for a large sample of GRE test takers, who were not previously differentiated according to background characteristics. Alternative data analyses did not reveal any consistently and significant interaction effects for any of the examinee subgroups considered here. In fact, the effects of the test preparation, which was developed for the initial version of the GRE analytical measure, were remarkably uniform over various subgroups of examinees. The only hint of a possible differential effect was for the small number of test takers whose primary language was not English. For these examinees the time spent in test preparation was not predictive of GRE analytical scores. (We note, however, that we were unable to say with any statistical confidence that the relationship for this subgroup of examinees differed significantly from that for test takers whose

-8-
primary language was English.) Because the test preparation involved the self-study of a relatively substantial amount of verbal material, we might speculate that test takers whose primary language is not English might benefit less from this kind of test preparation than test takers whose primary language is English. Although the results do not warrant a conclusion of this nature, they may suggest the desirability in any future studies of classifying examinees according to whether or not English is the primary language.
We did not find any evidence to support the possibility that test preparation may pay greater dividends for test takers who score lower on standardized admission tests than would be expected from records of previous achievement. When examinees were grouped according to their verbal and quantitative test performances, after first adjusting for previous grades and major field of study, no significant differential effects were noted. Because these adjusted verbal and quantitative performances were highly related to the unadjusted scores, they also provide some indication of the extent to which general scholastic abilities may moderate (or, in this case, fail to moderate) the effectiveness of test preparation. In this regard, it may be informative to consider test preparation as an educational intervention in the context of the aptitude-treatment interaction literature. On one hand, as noted previously, we found no convincing evidence that low-scoring test takers may benefit more than high scorers from test preparation. On the other, however, we found even less evidence that more able test takers, as defined by their verbal and quantitative scores, may achieve greater benefits from effective test preparation than their less able counterparts. This latter result contrasts sharply with what Cronbach and Snow (1977) have characterized as the I’. . . power of general abilities [such as those measured by scholastic aptitude tests] to predict success in learning” (p. 498). In their comprehensive review they found that regression slopes (treatment effects) were more likely to differ from treatment to treatment for general abilities than for any other aptitude considered in the aptitude-treatment literature. In short, those who succeed in early intellectual endeavors tend to have developed the skills and abilities that will serve them well in subsequent undertakings.
The low test scoring groups considered in this study benefited as much from a certain kind of test preparation as did their higher- scoring counterparts. This suggests, perhaps, that the skills needed to benefit from test preparation may not be the same as the more relevant academic abilities reflected in the test scores. Because standardized ability tests such as the GRE General Test reflect the variety of academic experiences that examinees bring with them, it is not surprising that unequal academic preparation contributes to between-group test score differences. On the other hand, our results suggest that, when offered the same relevant pre-examination experience of the particular kind considered here, various subgroups, even those that differ radically with respect to initial test scores, can achieve similar improvements in test scores.

-9-
The significance of equal test score improvement by initially unequal subgroups might best be considered from a normative perspective. We might speculate, for example, that on the initial version of the GRE analytical measure (which, as noted above, has since been revised by removing the two item types that were susceptible to test preparation) a test score improvement of 30 points for an average-scoring Black examinee (from 358 to 388 in our sample) might result in a greater increase in the probability of gaining admission than would a 30-point improvement for a typical White examinee (from 524 to 554). As Messick (1981) has suggested, score improvements may be more significant for examinees whose test scores place them at the "margins of admissibility." The significance of any test score improvements undoubtedly varies, however, with such factors as the quality of the applicant pool and the selectivity of the graduate department.
Finally, we note the limitations of the study. First, the results were based on a no-longer-used version of the GRE analytical ability measure that contained item types shown to be extremely susceptible to test preparation. It is not known to what extent these results may apply to other tests or to other test-taking populations that are less experienced with standardized tests than are most GRE test takers. Nor is it known whether subgroups of test takers might benefit in different ways from test preparation other than the kind that involves self-study and practice. Nonetheless, the results do seem to reinforce the importance of encouraging all test takers to utilize the information bulletins, practice tests, and other test preparation resources that are becoming increasingly available from test publishers and from other commercial sources, lest between-group test score differences increase.

-lO-
References
Alderman, D. L., & Powers, D. E. (1980). Effects of special preparation on SAT-verbal scores. American Educational Research Journal, 2, 239-251.
Cole, N. (1982). The implications of coaching for ability testing. In A. Wigdor and W. R. Garner (Eds.), Ability Testing: Uses, Consequences, and Controversies (Part II: Documentation Sections). Washington, DC: National Academy Press.
Cronbach, L. J., & Snow, R. E. (1977). Aptitudes and instructional methods. New York: Irvington Publishers.
Dyer, H. S. (1953). Does coaching help? College Board Review, 19, 331-335.
Fede ral Trade Commission. (1979). Effects of coaching on standardized admission examinations: Revised statistical analysis of data gathered by the Boston Regional Office of Federal Trade Commission. Washington, DC: Federal Trade Commission.
the
French, J. W. (1955). The coachability of the SAT in public schools (ETS RB 55-26). Princeton, NJ: Educational Testing Service.
Leary, L. F., & Wightman, L. E. (1983). Estimating the relationship between use of test-preparation methods and scores on the Graduate Management Admission Test (GMAC Research Report 83-1, ETS Research Report RR-83-22.) Princeton, NJ: Educational Testing Service.
Messick, S. (1980). The effectiveness of coaching for the SAT: Review and reanalysis of research from the fifties to the FTC. Princeton, NJ: Educational Testing Service.
Messick, S. (1981). The controversy over coaching: Issues of effectiveness and equity. In B. F. Green (Ed.), Issues in testing: Coaching, disclosure, and ethnic bias. San Francisco: Jossey-Bass, 21-53.
Powers, D. E., & Swinton, S. S. (1984). Effects of self-study for coachable test item types. Journal of Educational Psychology, 76(2), 266-278.
Powers, D. E., & Swinton, S. S. (1982). The effects of self-study of test familiarization materials for the analytical section of the GRE Aptitude Test (GRE Board Research Report GREB No. 79-9). Princeton, NJ: Educational Testing Service.
Swinton, S. S., & Powers, D. E. (1983). A study of the effects of special preparation on GRE analytical scores and item types. Journal of Educational Psychology, 75(l), 104-115. -

-ll-
Acknowledgments
The author would like to thank the Research Committee of the, Graduate Record Examinations Board for sponsoring this research; Robert Altman, Robert Boldt, Maria Pennock-Roman, Linda Wightman, and Warren Willingham for helpful reviews of an earlier draft of this report; Richard Harrison for programming the analyses; and Lorraine Simon for preparing the manuscript.

Table 1
Mean GRE Analytical Scores and Mean Test Preparation Times for Examinee Subgroups by Treatment Group
Not Encouraged Encouraged
0 1 2 3 4 0 1 2 GRE-A Time GRE-A Time GRE-A Time GRE-A Time GRE-A Time GRE-A Time GRE-A Time GRE-A Time
4 GRE-A Time GRE-; Time Group
Self Description
Black, Afro-American, Negro 358 3.81 358 3.00 373 4.10 110 2.74 114 2.49 118 2.92
26 17 15
524 2.36 551 2.54 544 2.76 110 2.47 108 2.33 114 2.34
506 252 264
361 3.71 372 3.96 350 2.98 444 4.19 386 4.24 426 3.91 437 4.74 109 2.74 102 2.84 89 2.47 142 2.38 107 2.61 125 2.54 116 2.46
14 14 21 16 23 17 19
543 3.05 568 3.32 559 2.90 558 3.18 564 3.41 568 3.27 583 3.90 112 2.29 106 2.27 108 2.33 110 2.34 106 2.22 104 2.31 103 2.21
267 248 279 267 276 266 278
M SD N
M SD N
M 525 2.37 549 2.66 542 2.59 544 2.96 553 3.19 555 2.78 556 3.05 563' 3.40 557 3.11 583 3.89 SD 112 2.45 116 2.40 125 2.34 118 2.30 121 2.28 113 2.32 112 2.26 107 2.24 116 2.26 108 2.25 N 432 212 215 224 209 237 228 240 235 227
M 473 2.82 499 2.59 510 3.55 501 3.69 542 3.93 502 3.41 521 3.89 509 3.74 544 4.34 SD 124 2.69 120 2.34 115 2.46 116 2.29 109 2.37 130 2.38 130 2.48 137 2.24 104 2.43 N 142 76 79 74 69 81 76 76 71
532 4.15 116
86 2.22 ;
IQ
M 504 2.26 529 2.66 526 2.66 513 2.95 538 3.28 529 2.86 540 3.27 541 3.43 547 3.03 565 3.88 SD 114 2.40 113 2.39 117 2.34 121 2.23 121 2.36 112 2.39 121 2.33 113 2.23 113 2.26 112 2.26 N 398 197 192 204 186 218 211 222 208 220
M 531 2.97 550 2.59 548 3.20 577 3.53 576 3.55 571 3.11 563 3.24 572 3.60 569 4.18 579 4.13 SD 123 2.69 130 2.39 132 2.49 102 2.47 110 2.25 129 2.26 109 2.40 124 2.28 114 2.36 114 2.18 N 176 91 102 94 92 100 93 94 98 93
M 432 4.04 432 3.00 459 2.25 476 5.55 446 4.81 458 3.95 SD 125 2.77 114 2.52 138 2.76 126 1.90 133 1.87 118 2.77 N 14 8 8 10 8 10
410 2.90 498 2.50 78 2.35 77 2.67
532 3.71 118 2.36
12
487 4.50 174 2.71
M 514 2.44 538 2.63 536 2.87 535 3.05 554 3.33 545 2.91 550 3.26 551 3.50 555 3.38 570 3.95 SD 117 2.50 118 2.38 122 2.39 118 2.29 117 2.32 119 2.33 I.17 2.35 118 2.24 113 2.36 110 2.23 N 560 280 286 288 270 308 299 312 294 307
30 or
Older than 30
Degree Objective
Master's or Intermediate
Doctorate or Postdoctorate
English Fluency
English Secondary Language
English Primary Language

Encouraged
0 1 2 3 4 GRE-A Time GRR-A Time GRE-A Time GRB-A Time GRE-A Time
Not Encouraged
0
GRR-A Time
1
GRE-A Time
2
GRE-A
3
GRE-A Time
4
GRE-A Time Group
Test Performance (Verbal)
Worse than expected M 403 2.75 428 2.83 439 2.71 427 2.94 444 3.57 449 2.95 435 2.85 431 3.87 446 3.43 474 3.87
SD 108 2.69 114 2.42 108 2.58 108 2.40 115 2.41 110 2.39 100 2.19 119 2.48 111 2.31 118 2.30 N 153 61 77 88 83 105 77 71 84 83
About as expected M 516 2.45 536 2.58 540 2.94 543 2.95 553 3.50 564 2.98 549 3.54 554 3.51 562 3.56 574 3.96
SD 95 2.49 102 2.41 105 2.43 97 2.27 96 2.46 97 2.32 100 2.48 95 2.29 86 2.41 93 2.36 N 306 168 164 154 133 152 169 194 147 166
Better than expected M 605 2.42 629 2.49 625 2.91 614 3.65 633 3.10 625 2.65 633 3.27 638 3.49 635 3.12 642 4.01
SD 87 2.49 87 2.29 91 2.25 92 2.31 82 2.10 81 2.28 87 2.28 76 2.01 78 2.31 80 2.06
N 151 76 79 78 83 80 82 73 93 83
Test Performance (Quantit
Worse than expected 447 2.67 444 3.25 547 3.61 449 3.61 476 3.86
121 2.19 110 2.43 116 2.41 106 2.45 107 2.27
96 80 92 85 83
M 411 2.66 425 2.39 429 3.22 410 3.40 420 3.12 SD 107 2.57 107 2.14 107 2.64 112 2.57 115 2.51
N 152 64 86 82 60
About as expected M 516 2.44 533 2.72 548 2.65 546 2.97 556 3.66 562 3.06 551 3.17 556 3.69 565 3.38 576 4.13
SD 104 2.52 105 2.43 106 2.34 85.0 2.19 98 2.45 95 2.37 101 2.34 95 2.27 95 2.28 99 2.29
N 304 146 165 155 162 173 170 171 142 166
Better than expected M 596 2.53 620 2.58 632 2.98 612 3.11 619 2.86 630 2.76 627 3.66 632 3.29 626 3.25 637 3.67
SD 88 2.57 86 2.46 76 2.29 93 2.33 91 1.92 75 2.41 86 2.37 95 2.09 78 2.40 88 2.21
N 154 95 69 83 77 68 78 75 97 83
Materials :
0 - None
1 = Explanations of answers to one sample analytical test (This full-length sample test is included in the GRE test information that all test takers get.) 2 = A second sample analytical test
3 = Explanations of answers to one sample analytical test (This full-length sample test is included in the GRE test information that all test takers get.) 4 = All of the materials listed In 1, 2, and 3 above.

-14-
Fi gure ZL Relationship of Average GRE Analytical Score
to Average Time Spent in Prrparat i on by Black and White Examiners
650
300
I-
I-
X
IJ Blacks-Enc.
0 Blacks-NO Enc.
+ Wh i tes-Enc, b , I X Whites-Not Enc. 1
2.‘50 3.‘00 3.‘50 4.‘00 4.‘50 Average Hours of Analytical Test Preparation
58’00

-J_5-
Figure 2 Relationship of Average GRE Analytkal Score to Average Time Spent in Preparation by Age
b50
b00
350
I a 30 or Younger-Enc. I
I o 30 or Younger-Not Enc. 1
I + Older Than 30-Enc, -1
I X Older Than 30-Not Enc. 1
300 ’ I I I I I 1 2, 50 3, 00 3, 50 4, 00 4, 50 5, 00
Average Hours of Ana.Lyt ical Test Preparation

-16-
Figure 3 Relationship of Avrrage GRE Analytical Scclre
to Average Time Spent in Preparat i an by Ilegree Object i vs!
650
b00
-
zl $450
1 d
P a400
k (3
350
300
0 Master's or Intermed-Eno
0 Master's or Intermed-Not Enc
I + Doctorate or PostDoc-Enc I
I X Doctorate or PostDoc-Not En
2.158 3.'00 38'50 4.'00 4.'50
Average Hours of Analytical Test Preparation
5.'00

-17-
Fi gura 4 Relationshi
to Average Time % of Average
pant GRE Analytical Score
in Preparat i on by Engl i sh Fluency
650
600
: 0 ; 550
1 4
; 500
4
3 .- 450 Y A 4
2 Q 400
: U
350
300
+ +
.lL
x t X
X X
t I 0 Eng, Pr imary Lang-Enc I
1 0 Eng,Pr imary Lang-Not Enc--)
I t Eng, Secondary Lang-Em I
I X Eng, Secondary Lang-Not Enc 7
2, 50 3. 00 3. 50 4.00 4, 50 5.00 5, 50 Average Hours of Analytical Test Preparation

-18-
Figure 5 Relationship of Av
I! GRE Analytical Score to Avg Time Spent
in Preparati on by xpeetat i ens for Verbal Test Performance
b50-
600.
t
s Better Than Expected-Em
* Better Than Expected-Not Em X
P About as Expected-Enc
350-
0 About as Expected-Not Em A
+ Worse Than Expected-Em
I X Worse Than Expected-Not em 1
300-
2, 20 2, 40 2. bO 2. 00 3,00 3, 20 3.40 3. b0 3. 80 4.00 4, 20 4. 40 4. b0 4,80 5. 00 Average Hours of Analytical Test Preparation
-19-
Figure 6 Relationship of Avg GRE Analytical Scora to Avg Time Sp+nt
in Prrparat i on by Expectations for Quant i tat i ve Test Pw-formanca
b50
600
E 8 v) 550
s 4
; 500
4
3 ; 450
h 4
2 Q 400
: c3
350
300
v
S Better Than Expected-Em
$ Better Than Expected-Not Enc
I 0 About as Expected-Enc I
0 About as Expected-Not Enc
+ Worse Than Expected-Em I
1 x Worse Than Expected-Not Enc 1
2, 50 3‘00 3, 50 4.00 4, 50 5.00 Average Hours of Analytical Test Preparation