test equipment communications system analyzer operator's
TRANSCRIPT
@ MOTOROLA INC.
test equipment
Communications System Analyzer OPERATOR'S MANUAL
R-2001 D
.. ~
68P81069A66-B
MOTOROLA TEST EQUIPMENT PRODUCTS LIMITED WARRANTY
(EXCLUDES EXPORT SHIPMENTS)
Motorola Test Equipment Products (herein the " product") that are manufactured or di stributed by Motoro la Commun ications Group Parts Department are warranted by Motorola for a period of one (I) year from date of shipment against de fects in material and workmanship.
This express warranty is extended to the original purchaser only . In the event of a defect , malfunction , o r failure during the per iod of warranty, Motorola, at its option , will either repair, or replace the product providing that Motorola receives written not ice specifying the nature of the defect during the period of warranty , and the defective product is returned to Motorola at 1313 East Algo nquin Road , Schaumburg , IL 60196 transport ation prepaid . Proof of purchase and evidence of date of shipment (packing list o r in voice) must accompa ny the return o f the de fective product. Transportation charges for the return of the product to Purchaser shall be prepaid by Motorola .
This warranty is void, as determined in the reasonable judgement of Motorola , if :
(a) The product has not been operated in accordance with the procedures described in the o perat ing inst ruc tio n ;
(b) The seals on non -user serviceable components or modules are broken ;
(c) The product has been subject to misuse , abuse , damage, acc iden t , negligence, repair or alterat ion .
In no event shall Motorola be liable for any special, incidental, or consequential damages.
In the event Motorola elects to repair a defective product by replacing a module or subassembly, Moto ro la , a t it s optio n, may rep lace such defective module or subassembly with a new o r reconditioned replacement module or subassembly. On ly the unexpired warrant y of the warranty product will remain in force on the replacement module or subassembly . EXCEPT AS SPEC IFICALLY SET FORTH H EREIN . ALL WARRANTI ES EXPRESS OR IMPLIED, INCLUDING ANY IMPLIED WARRANTY OF FITNESS FOR A PARTICULAR PURPOSE O R MERC HA NTABILI TY, ARE EXCLUDED.
EPS-30828-0
SUPPORT SERVICES
Fo r service on your Moto rola test equipment in the U.S . contact the Test Equi pment Service Center , Schaumburg, 13 13 E. Algonquin Rd. , Scha umburg, Illino is 60196 o r call the Test Equ ipment Service Hot line: 800/ 323-6967 duri ng no rmal business hours. In lllinoi' call 1-312-576-7025. Outside the U.S. contact your nea rest Motorola representative.
MODULE EXCHANGE PROGRAM
Modular constructio n o f the R2001 a llows field replacement o f ind ivid ua l assemblies. Contact the Test Eq uipmem Service Cent er for pricing a nd delivery. Out side the U.S. contact your nea rest Mo torola representa tive .
COMPUTER SOFTWARE COPYRIGHTS
The Motorola products described in this instruction manual may include copyrighted Motorola computer programs stored in semiconductor memories or other media. Laws in the United States and other countries preserve for Motorola certain exclusive rights for copyrighted computer programs, including the exclus ive right to copy or reproduce in any form the copyrighted computer program. Accordingly , any copyrighted Motorola computer programs contained in the Motorola products described in this instruction manual may not be copied or reproduced tn any manner without the express written permission of Motorola. Furthermore, the purchase of Motorola products shall not be deemed to grant either directly or by implicat ion , estoppel , or otherwise, any license under the copyrights , patents or patent applications of Motorola, except for the normal non-exclusive. royalty free license to use that arises by operation of law in the sale of a product.
Specifications subject to change without notice. ~, Motorola , Prlvate·Line, and Digital Pnvate·Line are trademarks ot Motorola , Inc.
• Printed in U.S.A. • «' 1985 Motorola Inc .
EPS-34440-B
n

. ® MOTOROLA Communications Sector
m II 1.1
II II a a a II
?OWER
a ~ II • II
,J .t.:
OISP I. AY FUNCTION ) . .. II'\ • • • ~ ~·
• • ''·' ,.. "lOP, • TM • . • "'t'l>ll"" • 1··~ :!"'1'" • !\M . '"'"' " • • ~ II C'<(•"· 0 r,.~,a • , .. • W<> C\1 .. , I . 'l'"'lil'q • ··~ • . ,t . .. •. lh•t • 10)~ .. ~ ... 1'1011'
am am a MON'TOR
I<''> .. ... '
COMMUNICATIONS SYSTEM
«:JMotorola, Inc. 1985 All Rights Reserved Printed in U.S.A.
ANALYZER R-2001 D
® Motorola Test Equipment Products
1313 E. Algonquin Rd. Schaumburg, IL 60196
iii
68P81069A66-B 7/ 15/ 85 PHI

® MOTOROLA INC.
Communications Sector
SAFE HANDLING OF CMOS INTEGRATED CIRCUIT DEVICES
Many of the integrated circuit devices used in communications equipment are of the CMOS (Complementary Metal Oxide Semiconductor) type. Because of their high open circuit impedance, CMOS ICs are vulnerable to damage from static charges. Care must be taken in handling, shipping, and servicing them and the assemblies in which they are used.
Even though protection devices are provided in CMOS IC inputs, the protection is effective only against overvoltage in the hundreds of volts range such as are encountered in an operating system. In a system, circuit elements distribute static charges and load the CMOS circuits, decreasing the chance of damage. However, CMOS circuits can be damaged by improper handling of the modules even in a system.
To avoid damage to circuits, observe the following handling, shipping, and servicing precautions.
1. Prior to and while servicing a circuit module, particularly after moving within the service area, momentarily touch both hands to a bare metal earth grounded surface. This will discharge any static charge which may have accumulated on the person doing the servicing.
NOTE Wearing Conductive Wrist Strap (Motorola No. RSX-4015A) will minimize static buildup during servicing.
WARNING When wearing Conductive Wrist Strap, be careful near sources of high voltage. The good ground provided by the wrist strap will also increase the danger of lethal shock from accidentally touching high voltage sources.
2. Whenever possible, avoid touching any electrically conductive parts of the circuit module with your hands.
3. Normally, circuit modules can be inserted or removed with power applied to the unit. However, check the INSTALLATION and MAINTENANCE sections of the manual as well as the module schematic diagram to insure there are no objections to this practice.
4. When servicing a circuit module, avoid carpeted areas, dry environments, and certain types of clothing (silk, nylon, etc.) because they contribute to static buildup.
5. All electrically powered test equipment should be grounded. Apply the ground lead from the test equipment to the circuit module before connecting the test probe. Similarly, disconnect the test probe prior to removing the ground lead.
6. If a circuit module is removed from the system, it is desirable to lay it on a conductive surface (such as a sheet of aluminum foil) which is connected to ground through 1 OOk of resistance.
WARNING If the aluminum foil is connected directly to ground, be cautious of possible electrical shock from contacting the foil at the same time as other electrical circuits .
7. When soldering, be sure the soldering iron is grounded.
8. Prior to connecting jumpers, replacing circuit components, or touching CMOS pins (if this becomes necessary in the replacement of an integrated circuit device), be sure to discharge any static buildup as described in procedure 1. Since voltage differences can exist across the human body, it is recommended that only one hand be used if it is necessary to touch pins on the CMOS device and associated board wiring.
© Motorola, Inc. 1982 All Rights Reserved Printed in U.S.A.
~klrrnu@@ll WRU~irrng :f@lf\V/U~ 68P81106E84-C 12/ 10/ 82- PH! 1301 E. Algonquin Road, Schaumburg, II. 60196
v

9. When replacing a CMOS integrated circuit device, leave the device in its metal rail container or conductive foam until it is to be inserted into the printed circuit module.
10. All low impedance test equipment (such as pulse generators, etc.) should be connected to CMOS
VI
device inputs after power is applied to the CMOS circuitry. Similarly, such low impedance equipment should be disconnected before power is turned off. ~
11. Replacement modules shipped separately from the factory will be packaged in a conductive material. Any modules being transported from one area to another should be wrapped in a simlar material (aluminum foil may be used). NEVER USE NONCONDUCTIVE MATERIAL for packaging these modules.
~
~

R-2001 D Communications System Analyzer
'--....-- Specifications
Signal Generator Mode Monitor Mode (Continued)
Operating/Display DEVIATION Modes: AM/FM/CW/SSB Monitor MEASUREMENT
AM/FMICW/DSBSC Generate Scales: 1. 10. 100 kHz full scale Signalling Simulator Accuracy: ± 5% of readmg
Spectrum Analyzer Peak Deviation Duplex Generator Lim it: Set v1a keyboard to 100 Hz resolution (0 kHz to Memory Tables 99.9 kHz). Aud1ble alarm 1nd1cates l1m1t cond1-Frequency Counter t1on and will be active 1n all Mon1tor Modes Digital Voltmeter AM MODULATION Wattmeter MEASUREMENTS IF Display Range: 0 to 100 % Oscilloscope Accuracy: ± 5% of reading Signal Strength Meter
SIGNAL STRENGTH SINADIDistort10n Meter METER
FREQUENCY Range: 1 MHz to 999 9999 MHz Range: 10kHz to 999.9999 MHz Sensitivity: - 100 dBm to +52 dBm. combined spec1f1ca-
Resolution: 100Hz t1on of antenna and transceiver ports. Accuracy: Refer to accuracy of master osc1llator Selectivity: 30 kHz Max. @ 3 dB bandwidth
Stabilization Time: 1 Sec RF WATTMETER
OUTPUT Range: 1 Watts to 125 Watts Attenuator: 16 dB variable plus 10 dB steps over 13 ranges Scales: 9.99. 99.9. 125 Watts Range FM: 1 p.V to 1 VRMS Accuracy: ± 10% from 1 Watt to 125 Watts Range AM: 1 p.V to .4 VRMS Protection: Over-temperature Accuracy: ± 3 dB maximum wi th step attenuator in 0 dB
pOSI!IOn. + 4 dB max1mum 1n any other state General
SPECTRAL PURITY SPECTRUM ANALYZER Spurious: -40 dBc Frequency Range: 1 MHz to 1 GHz Harmonics: - 15 dBc Dynamic Range: 75 dB min1mum
FREQUENCY Scan Width: 100kHz per divis1on to 1 MHz per divis1on con-MODULATION t1nuously adtustable
Deviation: 0-75 kHz peak Sensitivity: - 95 dBm m1n1mum Residual FM: 20 Hz max. @ 300 to 3kHz from fc DUPLEX GENERATOR Residual AM: 1.0% max. @ 300 to 3kHz from fc
Frequency Offset: 0 MHz to ± 10 MHz and fixed ± 45 MHz Externa Ill nterna I Frequency Resolution: 5kHz Frequency Range: 5 Hz to 20 kHz. ± 3 dB
Frequency Accuracy: ± .002% Modes: Internal . external. microphone or all Output level: - 35 dBm minimum 1nto 50 ohm load Simultaneously
Deviation Range: 0 to ± 20 kHz peak AMPLITUDE Frequency Response: 5 Hz to 20 kHz. ± 3 dB
MODULATION OSCILLOSCOPE Range: 0 to 80% from 1 to 500 MHz
CRT Size: 8cmx10cm External/Internal Frequency Response: DC to 5 MHz. 3 dB po1nt Frequency Range: 5 Hz to 10 kHz. ± 3 dB
External Vertical External Input: Approx . 150 mV for 80% Input Ranges: 10 mV. 100 mV. tV. 10V per d1v Modes: Internal , external. microphone or all Sweep Rates: 1 us. 10 us .. 1 ms. 1 ms .. 01 sec. 1 sec per Simultaneously
diViSIOn DOUBLE SIDEBAND SUPPRESSED CARRIER Synchronization: Internal. normal. and automatic mode w1th ad-
Range: 1 MHz to 500 MHz JUStable tngger level.
Carrier Suppression: -15 dB FREQUENCY COUNTER Normal
SWEEP GENERATOR MODE Range: 10Hz to 35 MHz Adjustable sweep w1dth from 10kHz to 10 MHz at a fixed sweep rate . Syn- Display: 5 dig1t autorang1ng chronized to internal scope display. Input Sensitivity: 50 mV m1n1mum
Period Counting Frequency Determination Monitor Mode Range: 10Hz -100kHz
Display: 4 dig'it autoranging to 3 kHz. 3 digit autorangmg Frequency Range: 1 MHz to 999.9999 MHz ' to tOO kHz
Resolution: 100Hz Auto Tune (SCAN LOCK) Accuracy: Equal to that of master oscillator t1me base
Range: In the monitor mode. the unit has the capab1l1ty FREQUENCY ERROR to automatically find and then tune to an 1t1put
Indicator: Autoranging CRT display. Resolut ion ± 10 Hz s1gnal above -30 dBm. Operates from 1 MHz for frequency error measurements on 1.0 kHz. to 1 GHz 10.0 kHz and 100.0 kHz full scale ranges 1 Hz Acquisition Time: 5 sec. typ1ca1 to less than 1 sec. IF l1m1ted scan resolution for frequency error less than 100 Hz is utilized . Special funct1on control Will allow direct Ire- Accuracy: ± 1 Hz of actual mput frequency quency readout to 1 Hz resolution
Input Sensitivity: 1.5 11 V for 10 dB EIA SINAD Specifications continued on next page (over the 4 MHz (narrow band ± 6 kHz mod. acceptance)
to 999.9999 MHz range) 7.0 p.V for 10 dB EIA SINAD (w1de band ± 100 kHz mod. acceptance)
Spurious Response: - 40 dB typical 0 dB image at ± 21.4 MHz - 10 dB at L. O. harmonics ± 10.7 MHz
vii

R-2001 D Communications System Analyzer
~
General (Continued) General (Continued)
DIGITAL VOLTMETER Power and Environmental Readout : Autorangmg 3 d1g11 d1sptay 1. 10 100. 300 volt
lull scale AC: 100 VAC to 130 VAC or 200 VAC to 260 VAC DC Accuracy: ± 1% of lull scale ± 1 LSD swl!ch selectable 47 Hz to 63 Hz and 400 Hz AC Accuracy: ± 5% of lull scale DC: + 11 0 to + 16 VDC external 1nput
AC Bandwidth: 50 Hz to 20 kHz Battery Option: 13 6 Volts. 50 m1nutes typ1cal
SIGNALLING Dimensions: 8 25 1n h1gh x 15 50 1n w1de x 20 00 1n deep SIMULATOR (21 em x 39 4 em x 50 8 em)
Modes of Operation: Encode and Decode capability lor Weight : 35 5 pounds (baSIC model) exclud1ng ballery 1 kHz l1xed tone pack cover accessones ( 16 1 kg) S1ngle Tone Vanable Frequency Model Nomenclature Two-Tone sequent1al pag1ng Un1versal 10 tone sequential R·2001 D Basic Model D,g,tal sub-aud1ble squelch
R·2001 D/HS With high stability oscillator Base Stat1on Tone Remote Mob1le Telephone R·2002D With IEEE-488 option
IMTS R·2002D/HS High stability oscillator and IEEE-488 Bus option MTS 2805 Hz R·2004D With Motorola DES option
5/6 tone pagmg R·2004D/HS High stability oscillator and Motorola DES option Select V S1gna1tmg
R·2005D With Motorola SECURENET option Frequency Range: 5 Hz to 9999.99 Hz encode, 5.0 Hz to 9999.9
Hz decode R·2005D/HS High stability oscillator and Motorola SECURENET Resolution: 0.1 Hz, 5Hz to 9999.9 Hz option
Output Level: 3 Volts RMS into 600 ohm R·2008D With cellular option Input Impedance: 10 K ohms minimum
R·2008D/HS High stability oscillator and cellular option Sl NAD/DISTORTION
METER R·2009D With IEEE-488 Bus and cellular options
Input Level : 0 5 V to 10 Volts RMS R·2009D/HS With high stability oscillator, IEEE-488 Bus and cellular SINAD Accuracy: ± 1 dB at 12 dB SINAD option Distortion Range: 1% lb 20 % R·2010D With UK cellular option
Distortion Accuracy: 0 5% d1Siort1on 1n 1% to 10% range 2% distortiOn 1n 10% to 20 % range R·2010D/HS High stability oscillator and UK cellular option ,..-----.,..,
ANALOG R-2011 D With IEEE·488 Bus and UK cellular option SYNTHESIZER R-2011 D/HS High stability oscillator, IEEE-488 Bus, and UK cellular TUNING (AST) option
Step Size: Var~able steps from 3200Hz to 3 2 GHz per R-2021 D With Motorola Trunked Radio option 360 o of rotat1on
Calibration: 32 steps per 360° rotation (approximately) R·2021D/HS High stability oscillator and Motorola Trunked Radio
TIME BASE option
Standard TCXO: Ag1ng ± 1 X 10 - 6 per year R·2045D With Motorola DES and SECURENET options Temp ± 1 x 10 - 6 max1mum error over the 0 o R·2045D/HS High stability oscillator and Motorola's DES
to +55 oc temperature range and SECURENET options Optional Ovenized
NOTE: Factory set 220 Volt models are also available. Add "/220" High Stability: Agmg ± 1 x 10 - 6 per year Temp ± 05 x 10- 6 max1mum error over the to model number.
oo to + 55°C temperature range Optional Accessories (Warmup to ± 5 x 10-' of I mal Ire· quency w1thm 20 mmutes) RTP·1002A Battery Pack
RTL·4056B Protective Canvas Cover
RTL·4065A Transit Case
RTL·4075A RF Detector Probe
RTA·4000A Telescoping Antenna
~
Vlll

OPERATOR'S MANUAL COMMUNICATIONS SYSTEM ANALYZER R-2001D
TABLE OF CONTENTS
Page
Limited Warranty ii RF Sweep Generator Safe Handling v Monitor Mode Specifications VII Special Function Mode Table of Contents ix Special Function Control Codes List of Illustrations XI Auto Tune Mode List of Tables Xll Scan Latch Mode List of Abbreviations xiii Monitor Section
Volume And Squelch Controls Section I - Introduction I Off-The-Air Monitor
Signal Strength Meter Scope of Manual 1-l FM Demodulation Service 1-l Audio Filters Test Equipment Service Centers 1-l AM Demodulation Replacement Parts Orders l-2 Single Sideband Demodulation Area Parts Offices l-2 Audio Monitor Installation l-3 Modulation Packing l-3 Spectrum Analyzer Initial Set-up l-3 Duplex Generator Battery Pack l-3 RF Memory Trace Rotation Adjustment l-3 Entry With Memory Table Accessories l-4 Entry Without Memory Table
Preset Turn-On Section 2 - Description I Signaling Sequence
Signaling Sequence Menu Description 2-1 Decode Mode Screens Front Panel 2-2 PL Decode Rear Panel 2-10 DPL Decode Bottom Panel 2-10 A/ B Encode
Two-Tone Sequential Paging Section 3 - Operation I 516 Tone Encode
Cap Codes General 3-1 516 Tone Decode Power Section 3-l Select V Encode Self-Test 3-l Select V Decode Keypad 3-l General Encode CRT Display Screen 3-2 General Decode System Warnings 3-2 Mobile Telephone Signaling Function Section 3-2 IMTS Mobile Originated Modulation Section 3-3 IMTS Base Originated Fixed I KHz Tone 3-3 MTS Mobile Telephone Code Synthesizer 3-3 2805 Base Originated Modulation/Function 3-3 Tone Sequence External Level 3-4 Tone Remote (Encode) Display Section 3-4 Tone Remote (Decode) Generate/Monitor Metering 3-4 Frequency Counter Generate 3-4 (DVM/ DIST) Digital Voltmeter/ Distortion Mode RF Level 3-4 External Wattmeter RF Output Level 3-4 Intermediate Frequency (IF) Mode Generate Mode 3-5 Oscilloscope Section RF Scan Control 3-5 Scope AC or Scope DC Analog Synthesizer Tuning (AST) 3-5 Addendum - Self Test Displays
ix
Page 3-5 3-5 3-6 3-7 3-8 3-8 3-8 3-8 3-8 3-8 3-8 3-9 3-9 3-9 3-9 3-9 3-9 3-10 3-10 3-ll 3-ll 3-ll 3-11 3-11 3-11 3-12 3-13 3-13 3-13 3-13 3-14 3-14 3-14 3-15 3-15 3-15 3-15 3~ 16
3-16 3-16 3-17 3-17 3-17 3-17 3-18 3-18 3-19 3-19 3-20 3-20 3-21

Section 4 - Applications
Service Shop Setups Receiver Sensitivity Test, 12 DB SINAD,
Audio Distortion Receiver Sensitivity Test, 20 DB Quieting Squelch Sensitivity Test Audio Power Output Test Audio Frequency Response Modulation Acceptance Bandwidth RF Preselector Shape and Bandwidth Receiver Frequency Adjustment Basic FM Transmitter Tests: Power, Frequency,
& Deviation Basic Terminated Measurements Off-The-Air Measurements "In-Line" Power Measurements
Audio Distortion Audio Frequency Response
Page
4-1
4-3 4-5 4-7 4-7 4-9 4-9 4-11 4-13
4-15 4-15 4-15 4-16 4-19 4-21
X
Page
AM Modulation Test 4-23 AM Modulation Linearity Test 4-24 Analyzer IF DISPLAY 4-25 Community Repeater Modulation 4-26 Wire Line Remote Base Modulation 4-28 Wire Line Remote Base; Phone Line Levels 4-30
Phone Line Levels 4-30 Transmit Line Input 4-30 Receive Line Input 4-30 Measuring Levels Across A Balanced Lin~ 4-32 Generating Signals Across A Balanced Line 4-34
Bandpass Cavity Tuning 4-36 Cavity & Duplexer Tuning; Bandpass Adjustment 4-38
Passband Adjustment 4-38 Adjustment of Reject Notch On Receive Leg 4-40 Adjustment of Reject Notch On Transmit Leg 4-42
Desensitization Test: In-Service Duplexer 4-44 Ferrite Isolator Test 4-46 Service Request Form 4-49
~
~
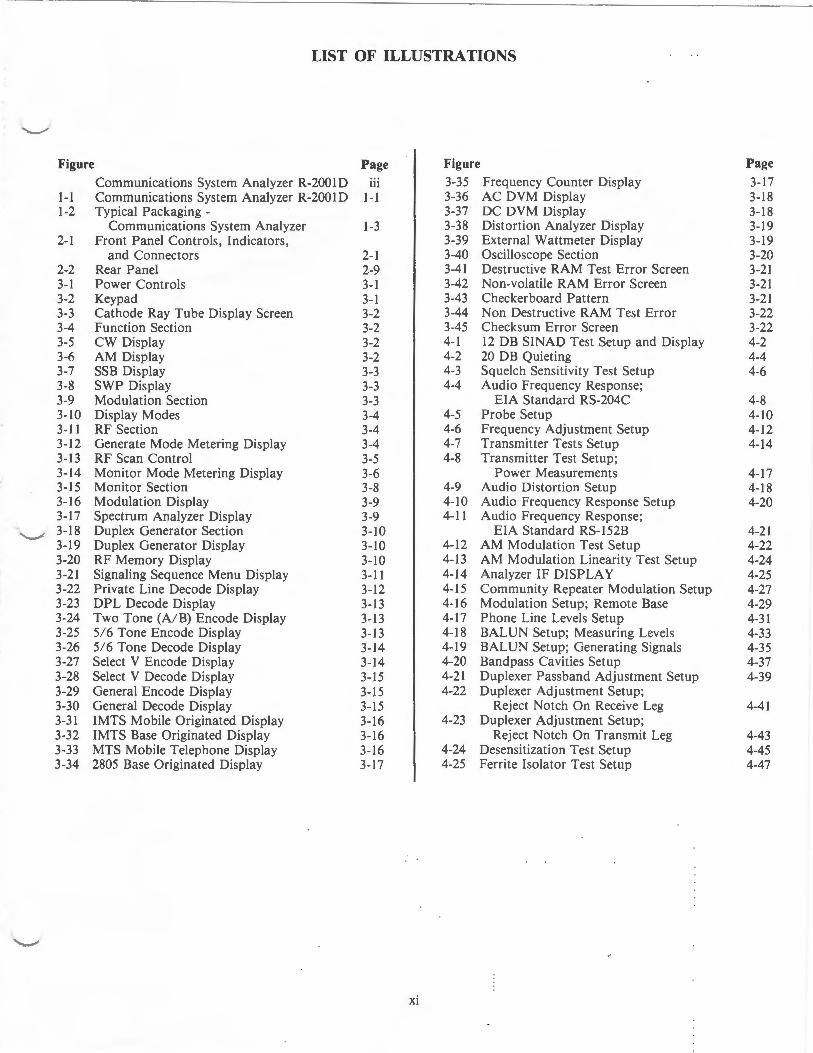
LIST OF ILLUSTRATIONS
Figure Page Figure Page
Communications System Analyzer R-2001D iii 3-35 Frequency Counter Display 3-17 1-1 Communications System Analyzer R-2001D 1-1 3-36 AC DVM Display 3-18 1-2 Typical Packaging - 3-37 DC DVM Display 3-18
Communications System Analyzer 1-3 3-38 Distortion Analyzer Display 3-19 2-1 Front Panel Controls, Indicators, 3-39 External Wattmeter Display 3-19
and Connectors 2-1 3-40 Oscilloscope Section 3-20 2-2 Rear Panel 2-9 3-41 Destructive RAM Test Error Screen 3-21 3-1 Power Controls 3-1 3-42 Non-volatile RAM Error Screen 3-21 3-2 Keypad 3-1 3-43 Checkerboard Pattern 3-21 3-3 Cathode Ray Tube Display Screen 3-2 3-44 Non Destructive RAM Test Error 3-22 3-4 Function Section 3-2 3-45 Checksum Error Screen 3-22 3-5 CW Display 3-2 4-1 12 DB SINAO Test Setup and Display 4-2 3-6 AM Display 3-2 4-2 20 DB Quieting 4-4 3-7 SSB Display 3-3 4-3 Squelch Sensitivity Test Setup 4-6 3-8 SWP Display 3-3 4-4 Audio Frequency Response; 3-9 Modulation Section 3-3 EIA Standard RS-204C 4-8 3-10 Display Modes 3-4 4-5 Probe Setup 4-10 3-11 RF Section 3-4 4-6 Frequency Adjustment Setup 4-12 3-12 Generate Mode Metering Display 3-4 4-7 Transmitter Tests Setup 4-14 3-13 RF Scan Control 3-5 4-8 Transmitter Test Setup; 3-14 Monitor Mode Metering Display 3-6 Power Measurements 4-17 3-15 Monitor Section 3-8 4-9 Audio Distortion Setup 4-18 3-16 Modulation Display 3-9 4-10 Audio Frequency Response Setup 4-20 3-17 Spectrum Analyzer Display 3-9 4-11 Audio Frequency Response; 3-18 Duplex Generator Section 3-10 EIA Standard RS-152B 4-21 3-19 Duplex Generator Display 3-10 4-12 AM Modulation Test Setup 4-22 3-20 RF Memory Display 3-10 4-13 AM Modulation Linearity Test Setup 4-24 3-21 Signaling Sequence Menu Display 3-11 4-14 Analyzer IF DISPLAY 4-25 3-22 Private Line Decode Display 3-12 4-15 Community Repeater Modulation Setup 4-27 3-23 DPL Decode Display 3-13 4-16 Modulation Setup; Remote Base 4-29 3-24 Two Tone (A/ B) Encode Display 3-13 4-17 Phone Line Levels Setup 4-31 3-25 516 Tone Encode Display 3-13 4-18 BALUN Setup; Measuring Levels 4-33 3-26 5/ 6 Tone Decode Display 3-14 4-19 BALUN Setup; Generating Signals 4-35 3-27 Select V Encode Display 3-14 4-20 Bandpass Cavities Setup 4-37 3-28 Select V Decode Display 3-15 4-21 Duplexer Passband Adjustment Setup 4-39 3-29 General Encode Display 3-15 4-22 Duplexer Adjustment Setup; 3-30 General Decode Display 3-15 Reject Notch On Receive Leg 4-41 3-31 IMTS Mobile Originated Display 3-16 4-23 Duplexer Adjustment Setup; 3-32 IMTS Base Originated Display 3-16 Reject Notch On Transmit Leg 4-43 3-33 MTS Mobile Telephone Display 3-16 4-24 Desensitization Test Setup 4-45 3-34 2805 Base Originated Display 3-17 4-25 Ferrite Isolator Test Setup 4-47
xi
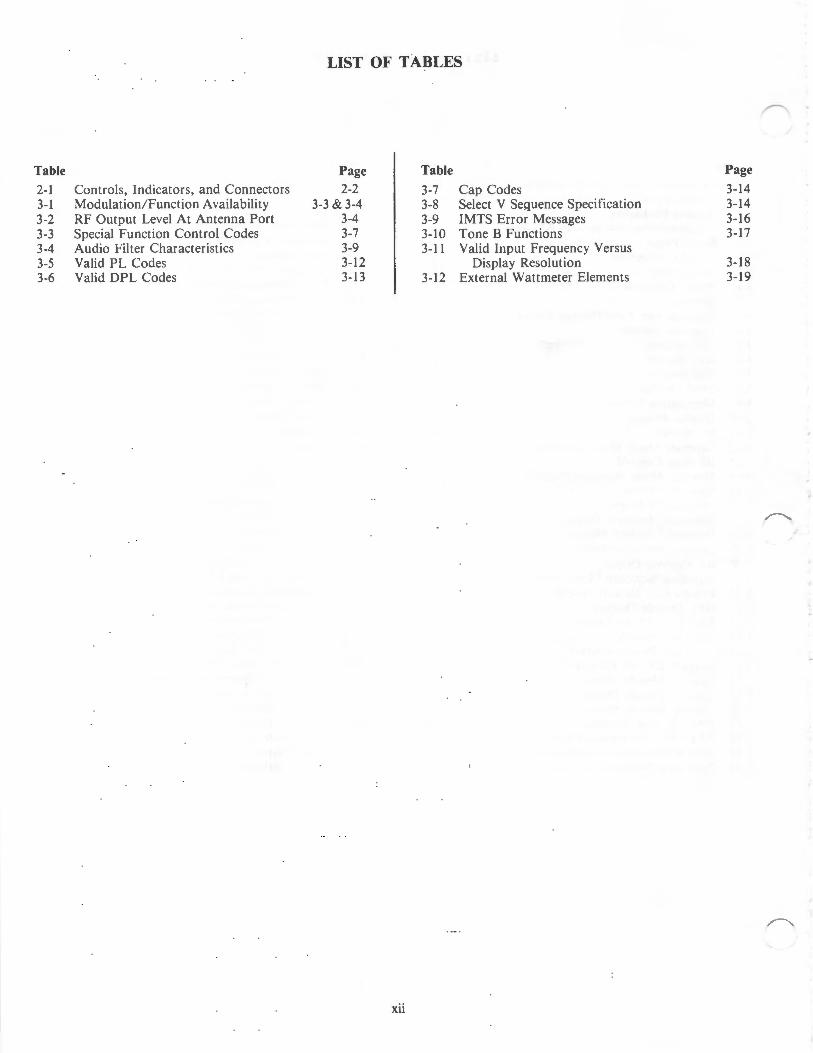
LIST OF TABLES
~
Table Page Table Page
2-1 Controls, Indicators, and Connectors 2-2 3-7 Cap Codes 3-14 3-1 Modulation/ Function Availability 3-3 & 3-4 3-8 Select V Sequence Specification 3-14 3-2 RF Output Level At Antenna Port 3-4 3-9 IMTS Error Messages 3-16 3-3 Special Function Control Codes 3-7 3-10 Tone B Functions 3-17 3-4 Audio Filter Characteristics 3-9 3-11 Valid Input Frequency Versus 3-5 Valid PL Codes 3-12 Display Resolution 3-18 3-6 Valid DPL Codes 3-13 3-12 External Wattmeter Elements 3-19
r--.....
/'...
xii

A AC AM ANT AST ATTEN AUTO
BALUN BAT or Batt BFO BNC B.O. B.O.S.
BW
c Cal CCIR
C&E
em CMOS
CONN Cont CRT cw
dB dBc dBm DC Demod DEY DISC Dispr DIST Div Dly DPL
Dplx DSBSC DVM
E/D EEA EIA Ext
FM FREQ FWD
LIST OF ABBREVIATIONS
Ampere Alternating Current Amplitude Modulation Antenna Analog Synthesizer Tuning Attenuation Automatic
Balanced-to-unbalanced Battery Beat Frequency Oscillator Bayonnet Type Connector Base Originated Behorden Organisationen mit Sicherheitsaufgaben, (a German Standards Association) Bandwidth
Celsius Calibrate International Radio Consultative Committee Communications and Electronics (part of Motorola) Centimeters Complementary Metal Oxide Semiconductor Connect Continuous Cathode Ray Tube Continuous Wave
Decibel Decibel (referred to carrier) Decibel (referred to lmW into 50 ohms) Direct Current Demodulation Deviation Disconnect Dispersion Distortion Division Delay Digital Private Line, (a Motorola registered trademark) Duplex Double Sideband Suppressed Carrier Digital Voltmeter
Encode/Decode Electronic Engineering Association Electronics Industry Association External
Frequency Modulation Frequency Forward
xiii
GEN GHz
Horiz HPFL HS Hz
IC lD IDC IEEE
IF IM IMTS ln.
l/0
Kohm kg KHz
LED LPFL Lvl
MAX MHz MIC or mic MIN M.O. MOD MOD. MON or Mon us ms MSEC Mtr MTS MV or mV uV mW
NA or N/ A NB NEG No . #
ORIG
PCT PL
PN POS
Generate Gigahertz
Horizontal High Pass Filter High Stability Hertz
Integrated Circuit Identification Number Instantaneous Deviation Control Institute of Electrical and Electronics Engineers Intermediate Frequency Intermodulation Improved Mobile Telephone System Inches Input/ Output
Kilohm Kilograms Kilohertz
Light-Emitting Diode Low Pass Filter Level
Maximum Megahertz Microphone Minimum Mobile Originated Modulation Modified Monitor Microsecond Millisecond Millisecond Metering Mobile Telephone System Millivolts Microvolts Milliwatt
Not Applicable Narrow Bandwidth Negative Number Number
Originated
Percent Private Line, a Motorola registered trademark Part Number Position

~
pos Positive I TCXO Temperature Compensated Crystal Oscil-+I - Plus or minus lator
TEL Telephone R Resistor Temp Temperature REF Reference TN Tone REV Reverse Trig Trigger RF Radio Frequency TX Transmitter RMS or rms Root-Mean-Square Rptr Repeater I UHF Ultra High Frequency RS Receiver Specification UUT Unit Under Test
SEC or sec Second v Volts SEL Select VAC Volts Alternating Current SENS Sensitivity VCE Voice SEQ or seq Sequence VDC Volts Direct Current Sig Signal Vert Vertical
Signal +Noise+ Distortion VRMS Volts (root-mean-square) SIN AD Ratio of
Noise+ Distortion VSWR Voltage Standing Wave Ratio
SSB Single Sideband
I w Watts STD Standard WB Wide Bandwidth sw Switch
SWP Sweep
I XY (Select Any Valid Number) syncs Synchronizes
ZVEI Zentral-Verband der Elektro-Industrie, (a ,--....... German Electronics Industry Association)
~
/
xiv
_ ......_/
SECTION 1 INTRODUCTION
1.1 SCOPE OF MANUAL
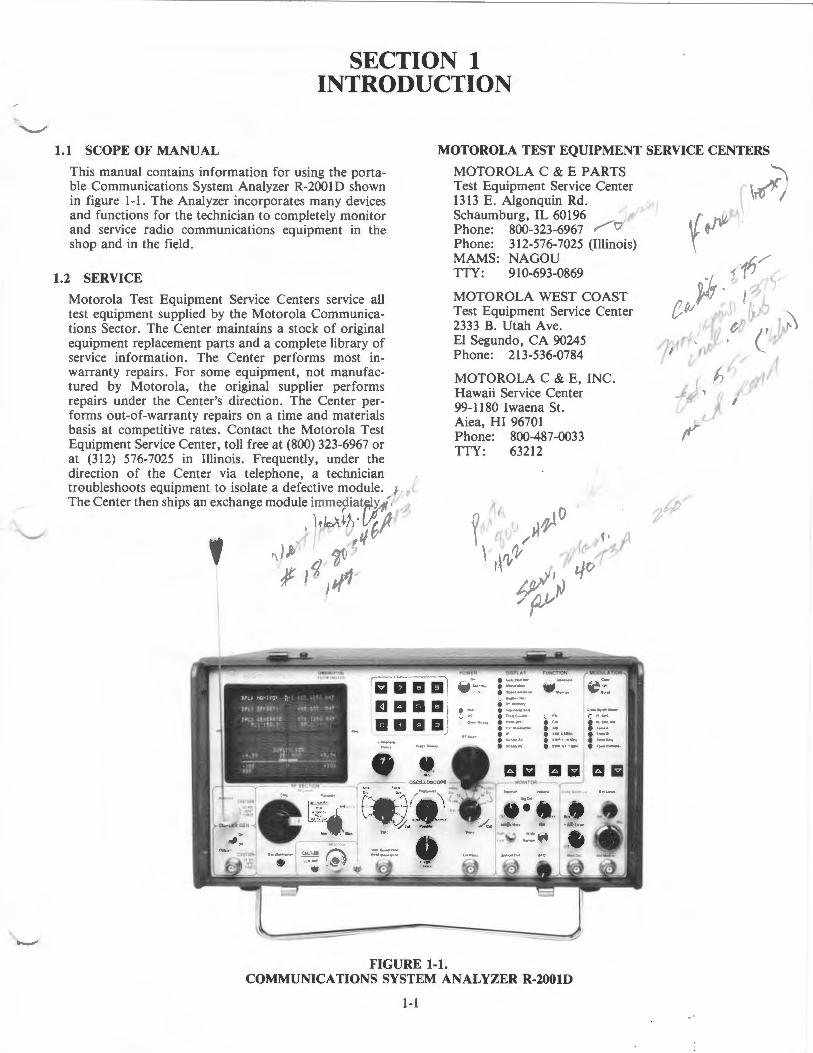
This manual contains information for using the portable Communications System Analyzer R-20010 shown in figure 1-1. The Analyzer incorporates many devices and functions for the technician to completely monitor and service radio communications equipment in the shop and in the field.
MOTOROLA TEST EQUIPMENT SERVICE CENTERS
MOTOROLA C & E PARTS
1.2 SERVICE
Motorola Test Equipment Service Centers service all test equipment supplied by the Motorola Communica-tions Sector. The Center maintains a stock of original equipment replacement parts and a complete library of service information. The Center performs most inwarranty repairs. For some equipment, not manufac-tured by Motorola, the original supplier performs repairs under the Center's direction . The Center performs out-of-warranty repairs on a time and materials basis at competitive rates. Contact the Motorola Test Equipment Service Center, toll free at (800) 323-6967 or at (312) 576-7025 in Illinois. Frequently, under the direction of the Center via telephone, a technician troubleshoots equipment to isolate a defective module. l The Center then ships an exchange module immediatE~Y;i ~
I • [' Jl . JF ··v t/GI v"rr ), ~t.,
¥ I~ JJ!1'
-
maail liD II II mama
FIGURE 1-1.
Test Equipment Service Center 1313 E. Algonquin Rd. Schaumburg, IL 60196 • Phone: 800-323-6967 ,/ Phone: 312-576-7025 (Illinois) MAMS: NAGOU TTY: 910-693-0869
MOTOROLA WEST COAST Test Equipment Service Center 2333 B. Utah Ave. El Segundo, CA 90245 Phone: 213-536-0784
MOTOROLA C & E, INC. Hawaii Service Center 99-1180 I waena St. Aiea, HI 96701 Phone: 800-487-0033 TTY: 63212
;;(( . l'1't0 1·
~,; ~0~ ,) '(~~ . , \f/; rv 11.io
I .j' '1
'fv~
( .. . ,. •.. e •U ntft.•( . ~ ..... ' ·~ -·· • s ..... . ,. _ ,
c ~ ~ • ••. ()10, ...
• r- A e •o>W• . ·-~ . ,_,. __
COMMUNICATIONS SYSTEM ANALYZER R-20010
1-1
/· r \Tt
v~· ,L/
·/ J tJ 0.-:J ~ 1'-.,.
Ctur ~~ ~~ 1"'~-:Jt _cQ ci);::-,
(/ // t1 f./') -~1
T1' ' v I ?
tj/1;/

MOTOROLA TEST EQUIPMENT SERVICE CENTERS
MOTOROLA AUSTRALIA PTY. LTD. Test Equipment Service Center 666 Wellington Rd. Mulgrave, VIC 3170 Melbourne Phone: 3-561-3555 Telex: 32516 MOTOCOMA AA Cable: MOTOCOM MELBOURNE MAMS: FEMEL
MOTOROLA CANADA, LTD. Test Equipment Service Center 3420 Pharmacy Ave. Unit 11 Scarborough, Ontario MIW 2P7 Phone: 416-499-1441 TTY: 610-492-2713 MAMS: NAWIL
MOTOROLA FRANCE S.A. Test Equipment Service Center Zone Industrielle de la Petite Montagne Sud 14 Allee du Cantal CE 1455 F-91020 Evry Cedex Phone: (6) 07779025 Telex: 600434F MOTEV MAMS: FAFEV
MOTOROLA GmbH F and V. ABT. Frachtzentrum FZF 6000 Frankfurt Main/ Flughafen West Germany Attn: METEC Phone: (0) 6128-702130 Telex: (0) 4182761 MOT D
MOTOROLA SOUTH AFRICA (PTY.) LTD. Motorola House 5th St. P .0. Box 39586 Wynberg Phone: 011-786-6165 Telex: 422-070-SA Cable: MOTOROLA JOHANNESBURG MAMS: FESAF
1.3 REPLACEMENT PARTS ORDERS
Send orders for replacement parts to the nearest Motorola Area Parts Office or Test Equipment Service Center. Be sure to include the complete identification number located on the equipment. Direct inquiries to the Area Parts Office including requests for part number identification and test equipment calibration or repair.
MOTOROLA AREA PARTS OFFICES
MOTOROLA C & E PARTS 1313 E. Algonquin Rd. Schaumburg, IL 60196 Phone: 800-323-6967
312-576-3900
1-2
MOTOROLA AREA PARTS OFFICES
EASTERN AREA PARTS 85 Harristown Rd. Glenrock, NJ 07452 Phone: 201-444-9662 TWX: 710-988-5602
EAST CENTRAL AREA PARTS 12995 Snow Rd. Parma, OH 44130 Phone: 216-433-1560 TWX: 810-421-8845
GULF STATES AREA PARTS 1140 Cypress Station P.O. Box 73115 Houston, TX 77090 Phone: 713-537-3636 TWX: 910-881-6392
MID-ATLANTIC AREA PARTS 7230 Parkway Drive Hanover, Maryland 20176 Phone: 301-796-8763 TWX: 710-862-1941
MIDWEST AREA PARTS 1313 E. Algonquin Rd. Schaumburg, IL 60196 Phone: 312-576-7430 TWX: 910-693-0869
PACIFIC SOUTHWESTERN AREA PARTS P.O. Box 85036 San Diego, CA 92138 Phone: 714-578-8030 TWX: 910-335-1516
SOUTHEASTERN AREA PARTS P.O. Box 368 Decatur, GA 30031 Phone: 504-987-2232 TWX: 810-766-0876
SOUTHWESTERN AREA PARTS P .0. Box 34290 3320 Belt Line Rd. Dallas, TX 75234 Phone: 214-620-8511 TWX: 910-860-5505
WESTERN AREA PARTS 1170 Chess Drive, Foster City San Mateo, CA 94404 Phone: 415-349-8621 TWX: 910-375-3877
MOTOROLA CANADA LTD. National Parts Department 3125 Steeles Ave., East Willowdale, Ontario M2H 2H6 Phone: 416-499-1441 TWX: 610-491-1032 Telex: 06-526258
r--.....
~
~
..-...
ALL OTHER COUNTRIES:
MOTOROLA INC. International Parts Dept. Schaumburg, IL 60196 U.S.A. Phone: 312-576-6482 TWX: 910-693-0869 Telex: 722443 Cable: MOTOL PARTS
1.4 INSTALLATION
• PACKING
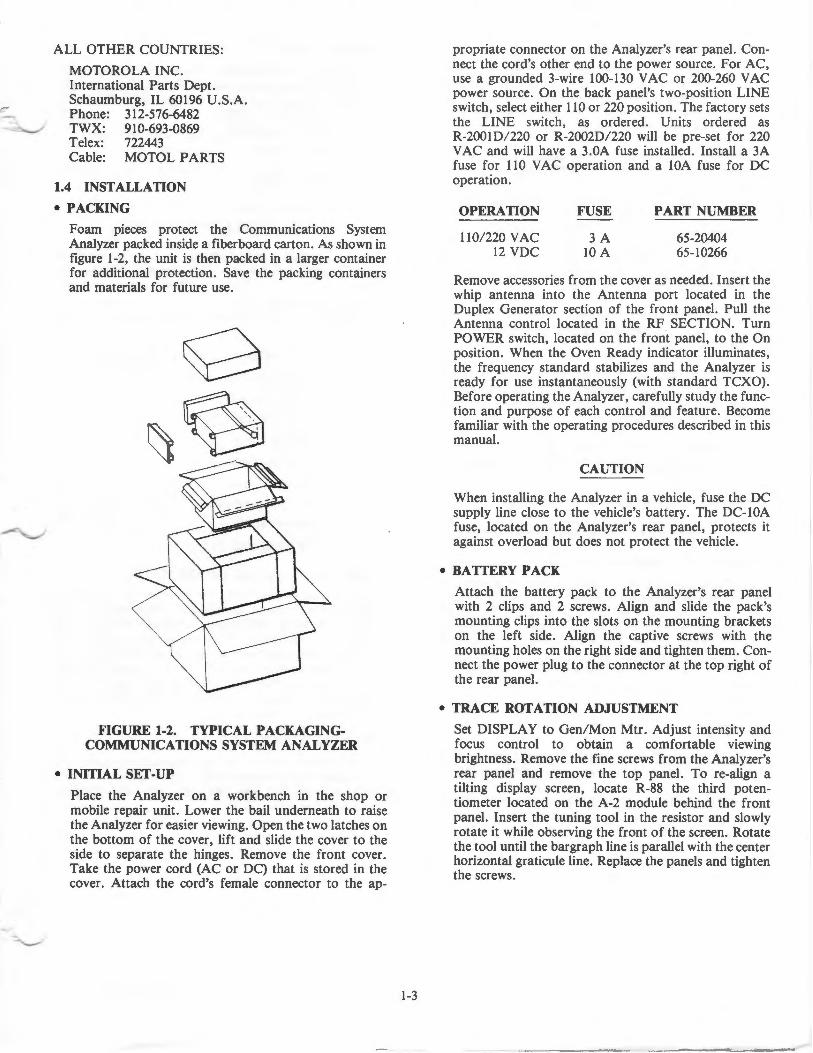
Foam pieces protect the Communications System Analyzer packed inside a fiberboard carton. As shown in figure 1-2, the unit is then packed in a larger container for additional protection. Save the packing containers and materials for future use.
0 ~~
FIGURE 1-2. TYPICAL PACKAGINGCOMMUNICATIONS SYSTEM ANALYZER
• INITIAL SET -UP
Place the Analyzer on a workbench in the shop or mobile repair unit. Lower the bail underneath to raise the Analyzer for easier viewing. Open the two latches on the bottom of the cover, lift and slide the cover to the side to separate the hinges. Remove the front cover. Take the power cord (AC or DC) that is stored in the cover. Attach the cord's female connector to the ap-
1-3
propriate connector on the Analyzer's rear panel. Connect the cord's other end to the power source. For AC, use a grounded 3-wire 100-130 V AC or 200-260 V AC power source. On the back panel's two-position LINE switch, select either 110 or 220 position. The factory sets the LINE switch, as ordered. Units ordered as R-2001D/220 or R-2002D/220 will be pre-set for 220 V AC and will have a 3.0A fuse installed. Install a 3A fuse for 110 VAC operation and a lOA fuse for DC operation.
OPERATION
110/220 VAC 12 VDC
FUSE
3A lOA
PART NUMBER
65-20404 65-10266
Remove accessories from the cover as needed. Insert the whip antenna into the Antenna port located in the Duplex Generator section of the front panel. Pull the Antenna control located in the RF SECTION. Turn POWER switch, located on the front panel, to the On position. When the Oven Ready indicator illuminates, the frequency standard stabilizes and the Analyzer is ready for use instantaneously (with standard TCXO). Before operating the Analyzer, carefully study the function and purpose of each control and feature. Become familiar with the operating procedures described in this manual.
CAUTION
When installing the Analyzer in a vehicle, fuse the DC supply line close to the vehicle's battery. The DC-lOA fuse, located on the Analyzer's rear panel, protects it against overload but does not protect the vehicle.
• BATTERY PACK
Attach the battery pack to the Analyzer's rear panel with 2 clips and 2 screws. Align and slide the pack's mounting clips into the slots on the mounting brackets on the left side. Align the captive screws with the mounting holes on the right side and tighten them. Connect the power plug to the connector at the top right of the rear panel.
• TRACE ROTATION ADJUSTMENT
Set DISPLAY to Gen/Mon Mtr. Adjust intensity and focus control to obtain a comfortable viewing brightness. Remove the fine screws from the Analyzer's rear panel and remove the top panel. To re-align a tilting display screen, locate R-88 the third potentiometer located on the A-2 module behind the front panel. Insert the tuning tool in the resistor and slowly rotate it while observing the front of the screen. Rotate the tool until the bargraph line is parallel with the center horizontal graticule line. Replace the panels and tighten the screws.

• ACCESSORIES SUPPLIED
FRONT COVER - The front cover protects the front panel and its components during transit or while the Analyzer is not in use. The front cover stores the power cord, antenna, cables, and other equipment needed for on-site servicing. PN # 15-80335A 70.
ANTENNA - The fused BNC connected antenna receives off-the-air signals. PN #TEKA-24A.
BNC to Type N Adapter. PN #58-84300A98. DC POWER CONNECTOR KIT. PN #RPX-4097A. In-Line Wattmeter Adapter. PN #RTL-4055B.
MANUAL - The Operator's Manual contains descriptions and instructions for properly using the Analyzer. PN #68P81069A66-0.
Oscilloscope & Meter Probe - A probe (x1), with attachments, provides general servicing needs. PN #RTL-4058A.
POWER CORD - The three-conductor cord powers the Analyzer by AC and charges the optional battery pack. Its right-angle design allows the Analyzer to stand on end. PN #30-80336A36.
SUN SHADE - Snap the Sun Shade over the CRT screen to observe displays even in bright sunlight. PN #15-80335A55.
TEST MICROPHONE. PN #RTM-4000B.
12 VDC POWER CONNECTOR KIT. PN #RPX-4097A.
• OPTIONAL ACCESSORIES
BATTERY PACK - A 13.6 volt battery attaches directly to the back of the Analyzer to provide 50 minutes of continuous operation. Built-in circuitry charges the battery when the power switch is in Off or Standby position. If battery power falls below 11 volts, a warning appears on the CRT. The battery can be installed in the field but it cannot be used in conjunction with IEEE-448 Interface Bus or Blower. PN #RTP-1002A.
DELUXE TELESCOPING ANTENNA. PN #RT A-4000A.
600 OHM LINE MATCHING TRANSFORMER Use for 600 ohm balanced lines. PN #RTL-1003A.
PROTECTIVE CANVAS COVER - A rugged, padded fabric cover protects the Analyzer from excessive field wear. PN #RTL-4056B.
RF DETECTOR PROBE. PN #RTL-4075A. I
TRANSIT CASE. PN #RTL-4065A.
1-4
• MODEL OPTIONS
• Cellular Test Functions - Model R-2008D provides capability in one test instrument for servicing traditional FM communications and, with the cellular option, the new cellular radio systems:
• CELL-TO-MOBILE SIGNALING ACCEPTANCE TESTS
• MOBILE-TO CELL SIGNALING ACCEPTANCE TESTS
• AUTOMATIC RF TESTS
• MANUALLY SELECTED RF TESTS.
• High Stability (HS) Oscillator - Use this oscillator to improve stability over the standard TCXO time base to + 1-5 x 10-s maximum error, over the temperature range of 0 to 55 °C. A front panel LED (Oven Ready) indicates when the ovenized crystal has stabilized.
MODELS (See Specifications)
R-2001D Basic Model
R-2001D/ HS
R-2001D/ HS/220
R-2002D/ HS
R-2002D/ HS/220
R-2008D/ HS
R-2008D/ HS/220
R-2009D/ HS
R-2009D/ HS/220
• IEEE-488 STANDARD INTERFACE BUS
This option enables using the Analyzer as a programmable measurement instrument. For example, Analyzer Model R-2002D when combined with the suitable programmable controller and applications software becomes the heart of an automated RF test system. Control or monitor all of the Analyzer's functions via the IEEE Bus. Perform full sequential test routines, quickly and repetitively, with little operator interaction.
• MODULE SERVICE KIT
The Extender Board Kit aids servicing the Analyzer's modules with printed circuit board edges. Use with A2, A3, A4, A5, A6, A7, A9, and A12 modules. PN #RPX-4379A.
~
,...
'-"
~
dB
CO MMUNiCATIONS SYSH~ A ~JI\'1[11
11(;~·1
SECTION 2 DESCRIPTION
a a a a1
II BElli maaaj
• '"h'P .. >I) ,., Dt'>O• Swt>t•p
I MH•
POWER On
Stitnlltl'f
Oc:Oif
• 8.)\1
AC
(., o,e,., Ae.~d,.
RF SCiJ"l
DISPLAY
• Gen MooMI!
e Modvi;)!IOn
8 Spec! An,ttyltor
(J Duple:.: Gen
8 AF Memor~
• Stqnahrtg Seq
8 F rt>q Counter
DVM DIST
8 E.~et Wo~~umerer
• IF
e ScopeAC
• ScopeOC
1!11
Genf:'J;)If'
Mon•tor
FM
• cw
• AM
• SSB DSBSC
• SWP 1 tO MHz
0 SWP 01-1 MHz
r M.ODULA
~~~· I Bwst
I Cod• Syn!h Mode
() 0 L OPi.
• Pl DPLinv
8 Tonr.A
• Tone B
• Tone SPq
• Tone Remotf'
ma ---~.J OSCILLOSCOPE ----.._ _____ MONITOR---.,.___,
1<111 E1tV
Vert
Vert Sm.td O•sl
DVM Counter 1r1
Hortz
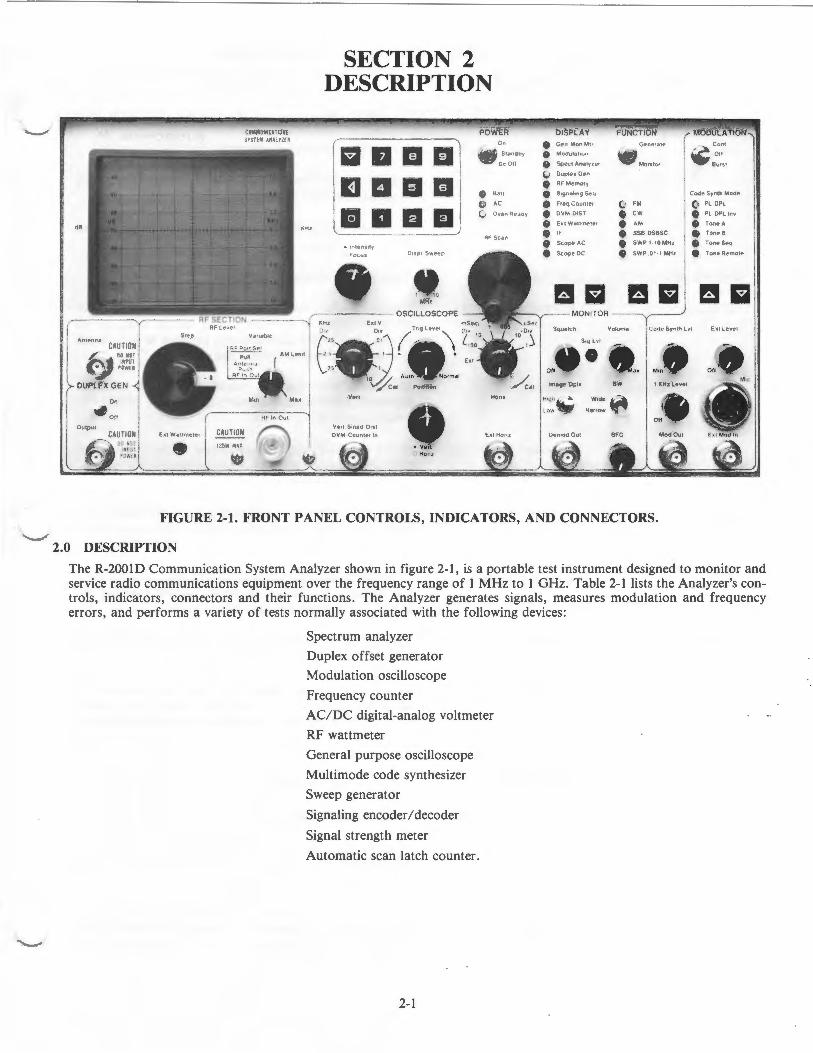
FIGURE 2-1. FRONT PANEL CONTROLS, INDICATORS, AND CONNECTORS.
2.0 DESCRIPTION
E•tlevel
The R-20010 Communication System Analyzer shown in figure 2-1, is a portable test instrument designed to monitor and service radio communications equipment over the frequency range of 1 MHz to 1 GHz. Table 2-1 lists the Analyzer's controls, indicators, connectors and their functions. The Analyzer generates signals, measures modulation and frequency errors, and performs a variety of tests normally associated with the following devices:
Spectrum analyzer
Duplex offset generator
Modulation oscilloscope
Frequency counter
AC/ DC digital-analog voltmeter
RF wattmeter
General purpose oscilloscope
Multimode code synthesizer
Sweep generator
Signaling encoder I decoder
Signal strength meter
Automatic scan latch counter.
2-1
ITEM
Power
Batt indicator
AC indicator
Oven Ready indicator
KEYPAD
... ~
0 through 9
CRT
• Intensity
o Focus
Dispr / Sweep Control
RF Scan Control
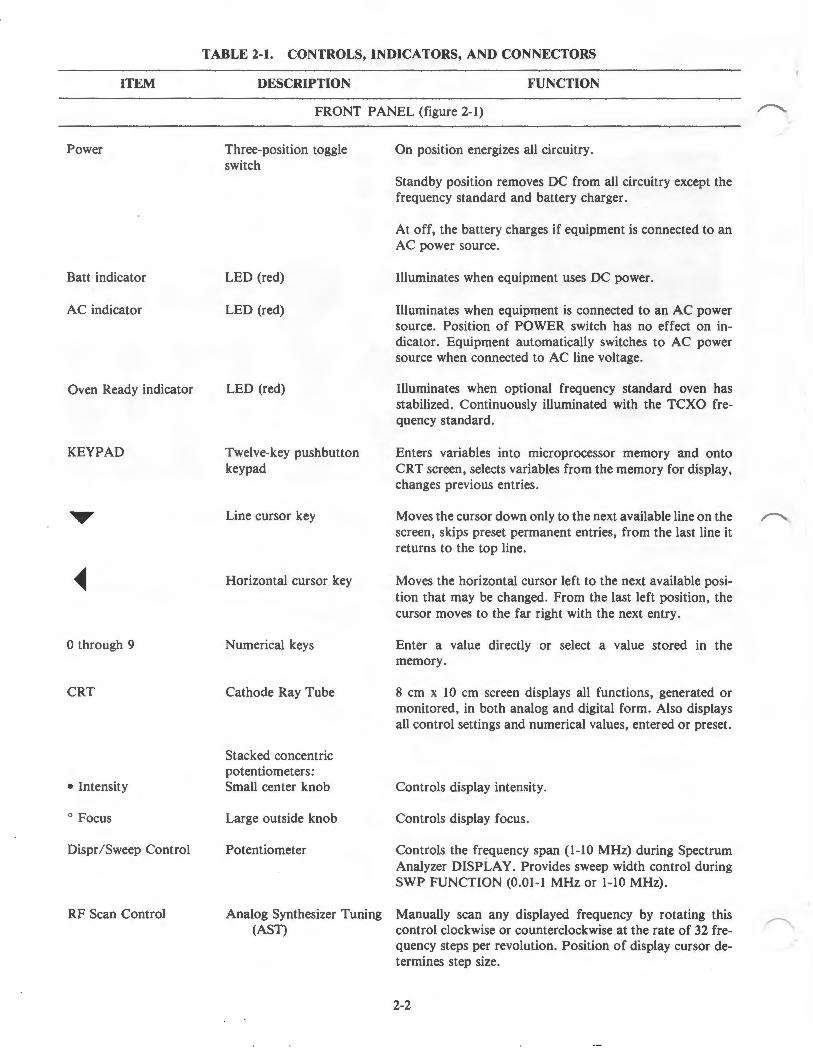
TABLE 2-1. CONTROLS, INDICATORS, AND CONNECTORS
DESCRIPTION FUNCTION
FRONT PANEL (figure 2-1)
Three-position toggle switch
LED (red)
LED (red)
LED (red)
Twelve-key pushbutton keypad
Line cursor key
Horizontal cursor key
Numerical keys
Cathode Ray Tube
Stacked concentric potentiometers: Small center knob
Large outside knob
Potentiometer
On position energizes all circuitry.
Standby position removes DC from all circuitry except the frequency standard and battery charger.
At off, the battery charges if equipment is connected to an AC power source.
Illuminates when equipment uses DC power.
Illuminates when equipment is connected to an AC power source. Position of POWER switch has no effect on indicator. Equipment automatically switches to AC power source when connected to AC line voltage.
Illuminates when optional frequency standard oven has stabilized. Continuously illuminated with the TCXO frequency standard.
Enters variables into microprocessor memory and onto CRT screen, selects variables from the memory for display, changes previous entries.
Moves the cursor down only to the next available line on the screen, skips preset permanent entries, from the last line it returns to the top line.
Moves the horizontal cursor left to the next available position that may be changed. From the last left position, the cursor moves to the far right with the next entry.
Enter a value directly or select a value stored in the memory.
8 em x 10 em screen displays all functions, generated or monitored, in both analog and digital form. Also displays all control settings and numerical values, entered or preset.
Controls display intensity.
Controls display focus.
Controls the frequency span (1-10 MHz) during Spectrum Analyzer DISPLAY. Provides sweep width control during SWP FUNCTION (0.01-1 MHz or 1-10 MHz).
Analog Synthesizer Tuning Manually scan any displayed frequency by rotating this (AST) control clockwise or counterclockwise at the rate of 32 fre
quency steps per revolution. Position of display cursor determines step size.
2-2
~
~

ITEM
DISPLAY indicators
. :......___./
TABLE 2-1. CONTROLS, INDICATORS, AND CONNECTORS
DESCRIPTION FUNCTION
FRONT PANEL (figure 2-1)
Twelve LED's Illuminate one at a time to indicate the function or type of operation the equipment is performing and displaying on the CRT. Select by pressing one of the arrow keys under the DISPLAY section.
2-3
1. Gen/ Mon Mtr - In generate mode, the CRT displays center frequency, output power, and RF output modulation depth. In monitor mode, the CRT displays center frequency, input power, frequency error, and received carrier modulation depth.
2. Modulation - The CRT displays modulation audio in generate mode or demodulated audio in monitor mode.
3. Spectrum Analyzer - CRT displays the RF spectrum and operating center frequency . Use the Spectrum Analyzer to identify interference, trace RF and IF signals, measure transmitter harmonics, check spurious response and receiver local oscillator radiation.
4. Duplex Gen - CRT displays duplex generate frequency and modulation depth on the generator output or monitor frequency and modulation depth on the received carrier. FUNCTION switch position selects the reading. In this mode, the Analyzer simultaneously generates and receives signals for duplex radio servicing. The Duplex Generator provides enhanced capability to service equipment such as repeaters, car telephones and emergency medical telemetry portables.
5. RF Memory - Stores and displays programmable frequencies and codes up to a total of 32 entries.
6. Signaling Sequence - Simulates encode and decode tone sequence for all code synthesizer modes. Press an arrow key in the Modulation section to select one of the six modes. Encode in generate function and decode in monitor function.
7. Frequency Counter - Measures 10Hz to 35 MHz inputs in either generate or monitor function. In monitor function, measure transmitted carrier frequency and other signals less than 35 MHz. Use the frequency counter to measure and set offset oscillators, pager IF's, PL frequencies, and other external input signals .

ITEM
FUNCTION switch
FUNCTION indicators
TABLE 2-1. CONTROLS, INDICATORS, AND CONNECTORS
DESCRIPTION FUNCTION
FRONT PANEL (figure 2-1)
Two-position toggle switch
Six LED's (red)
8. DVM/ DIST a. DVM - The digital voltmeter displays AC/ DC
voltage readings (digital and analog) with the corresponding dBm value on the CRT screen, in either generate or monitor function. Select AC or DC with the display cursor and keypad. The screen displays battery voltage and a signal's true RMS at the front panel DVM jack. Use the meter to check and set power supply voltage, bias level, and audio level.
b. DISTORTION- This mode automatically measures fixed frequency EIA Sinad/ Distortion (signal to noise and distortion ratio). The Analyzer generates a 1 KHz tone of known quality. Measure distortion of AM or FM transmitter modulation. Use the distortion meter for a comprehensive check of a receiver's performance.
9. Ext Wattmeter - Select the element and the screen displays the forward and reflected power passed through that element mounted in the RTL-4055 wattmeter adapter.
10. IF - The screen displays the 700KHz IF signal from the monitor receiver for AM and SSB receiver servicing.
11. Scope AC - The screen displays the voltage waveform applied to the vertical input (AC coupled).
12. Scope DC - The screen displays the voltage waveform applied to the vertical input (DC coupled).
Select either generate or monitor function.
1. Generate - The equipment generates and outputs an RF signal.
2. Monitor - The equipment monitors input signals with the input terminated into the receive mixer. Use this position for off-the-air monitoring.
Indicates the mode of signal the equipment is set up to generate or monitor. Select by pressing one of the arrow keys under the FUNCTION section.
2-4
1. FM - Equipment generates or monitors frequency modulated signals.
2. CW - Equipment generates an unmodulated RF signal (continuous wave). Monitor position provides only frequency error measurement.
,..--,
~
~

/
TABLE 2-1. CONTROLS, INDICATORS, AND CONNECTORS
ITEM DESCRIPTION FUNCTION
FRONT PANEL (figure 2-1)
MODULATION switch Three-position toggle switch
3. AM - Equipment generates or monitors amplitude modulated signals.
4. SSB/ DSBSC - Single Side Band/ Double Side Band Suppressed Carrier signal. The level of the generated signal is not calibrated. Use it only for relative measurements . Monitor SSB mode receives SSB signals with the use of the BFO.
5. SWP 1-10 MHz - Equipment generates a swept RF signal having a sweep width of 1 to 10 MHz, controlled by the Dispr/ Sweep control. Monitor position has no effect, equipment remains in generate mode.
6. SWP 0.01-1 MHz - Equipment performs as in 5. above except sweep width limits are 0.01 MHz to 1 MHz.
Controls the Code Synthesizer modulation source.
2-5
1. Coot - Continuous modulation signal output, generates repetitive cycles.
2. Off - No modulation generated. Terminates code sequences.
3. Burst - Generates a single cycle, spring loaded, returns to Off.
a. PL, Tone A, Tone B Output is present as long as switch is held in Burst.
b. DPL, DPL Inv
c. Tone Sequence
d. Tone Remote
DPL turn-off code as long as switch is held down. DPL code output when switch is moved to Coot position. Burst of DPL turn-off code is output when switch is moved from Coot to Off.
Output is a single signaling sequence.
Output is a tone remote access sequence; leaves Tone A at a low level for transmit-type commands until the switch is returned to Off.
il
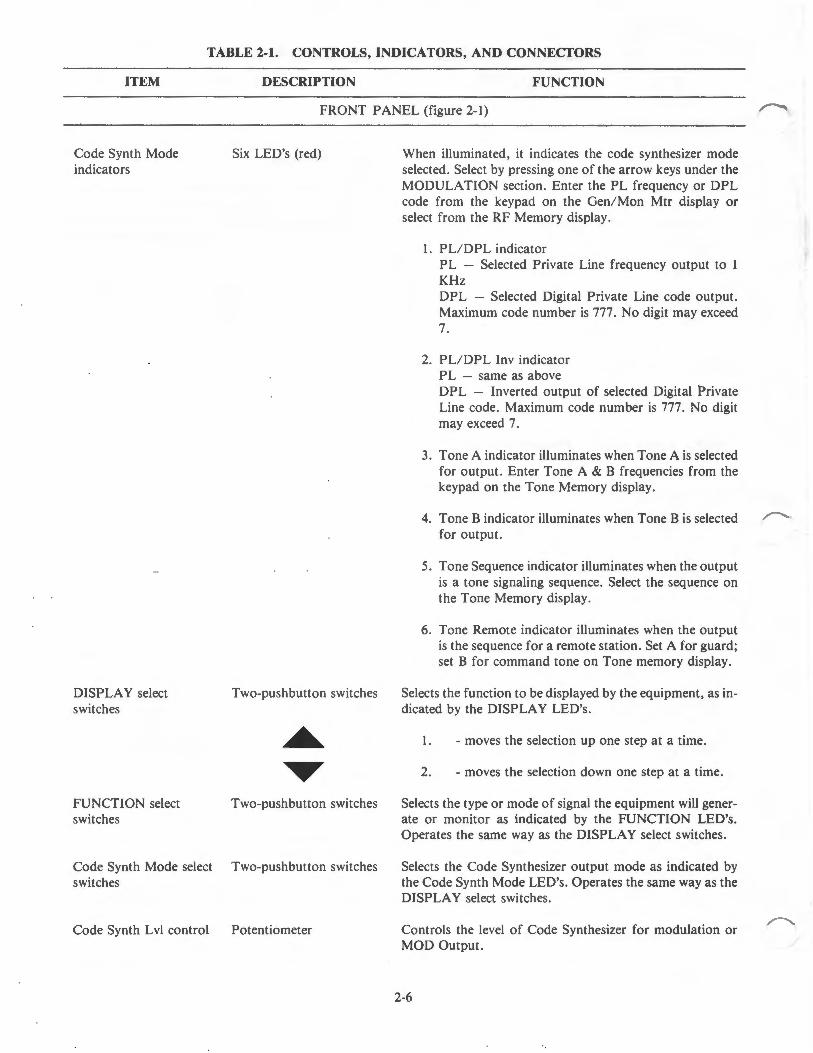
TABLE 2-1. CONTROLS, INDICATORS, AND CONNECTORS
ITEM DESCRIPTION FUNCTION
FRONT PANEL (figure 2-1)
Code Synth Mode indicators
DISPLAY select switches
Six LED's (red)
Two-pushbutton switches
• ... FUNCTION select Two-pushbutton switches switches
Code Synth Mode select Two-pushbutton switches switches
Code Synth Lvl control Potentiometer
When illuminated, it indicates the code synthesizer mode selected. Select by pressing one of the arrow keys under the MODULATION section. Enter the PL frequency or DPL code from the keypad on the Gen/Mon Mtr display or select from the RF Memory display.
I. PLIDPL indicator PL - Selected Private Line frequency output to KHz DPL - Selected Digital Private Line code output. Maximum code number is 777. No digit may exceed 7.
2. PLIDPL Inv indicator PL - same as above DPL - Inverted output of selected Digital l>rivate Line code. Maximum code number is 777. No digit may exceed 7.
3. Tone A indicator illuminates when Tone A is selected for output. Enter Tone A & B frequencies from the keypad on the Tone Memory display.
4. Tone B indicator illuminates when Tone B is selected r--for output.
5. Tone Sequence indicator illuminates when the output is a tone signaling sequence. Select the sequence on the Tone Memory display.
6. Tone Remote indicator illuminates when the output is the sequence for a remote station. Set A for guard; set B for command tone on Tone memory display.
Selects the function to be displayed by the equipment, as indicated by the DISPLAY LED's .
1. - moves the selection up one step at a time.
2. - moves the selection down one step at a time.
Selects the type or mode of signal the equipment will generate or monitor as indicated by the FUNCTION LED's. Operates the same way as the DISPLAY select switches.
Selects the Code Synthesizer output mode as indicated by the Code Synth Mode LED's. Operates the same way as the DISPLAY select switches.
Controls the level of Code Synthesizer for modulation or MOD Output.
2-6
~

,... ITEM
Ext Level control
1 KHz Level control
Mic connector
Ext Mod In connector
Mod Out connector
MONITOR section:
Volume control
BW switch
BFO control
Sig Lvl indicator
Squelch control
lmage/Dplx toggle switch
Demod Out connector
TABLE 2-1. CONTROLS, INDICATORS, AND CONNECTORS
DESCRIPTION FUNCTION
FRONT PANEL (figure 2-1)
Potentiometer /switch
Potentiometer /switch
4-pin connector Pre-emphasis and IDC are used
BNC connector
BNC connector
Potentiometer
Two-position toggle switch
Potentiometer I switch
LED (red)
Potentiometer
Two-position switch
BNC connector
Controls modulation level of external input (microphone and other external generators). Switch at full counterclockwise position disables external modulation inputs.
Internal 1 KHz tone modulation level control. Switch at full counterclockwise position disables 1 KHz modulation tone.
Microphone input. Provides microphone bias and PUSH TO TALK (GENERATE) connection to equipment. Uses RTM-4000 microphone or handset.
External modulation signal input.
Output connector for all modulation signals (all signals combined).
Controls speaker output level.
In monitor mode, selects IF bandwidth. Wide BW is ± 100 KHz mod acceptance. Narrow BW is ±5KHz mod acceptance. In Gen, FM mode selects modulation range: 0-100 KHz deviation in WB or 0-25 KHz in NB.
BFO on/off and beat frequency control for sideband reception. To minimize interference, turn off the BFO when not in use.
Squelch indicator.
Adjusts squelch threshold level, full counterclockwise position disables squelch.
NOTE: Monitor sensitivity is greatly decreased (for highlevel use) as the control is increased clockwise beyond the quieting point.
In duplex generation mode, controls the duplex frequency output for above (High) or below (Low) the receive programmed frequency. In monitor mode it selects the frequency of the local oscillator injection above or below the programmed monitor frequency to remove image interference.
Receiver audio output.
2-7

TABLE 2-1. CONTROLS, INDICATORS, AND CONNECTORS
ITEM
OSCILLOSCOPE section:
Horiz switch
Horiz vernier control
Ext Horiz
Trig Level
Position controls
• Vert
o Horiz
Vert switch
Vert Vernier control
Vert/Sinad/Dist DVM/Counter In
connector
DESCRIPTION FUNCTION
FRONT PANEL (figure 2-1)
Seven-position rotary switch
Potentiometer
BNC connector
Stacked concentric potentiometer and switch
Concentric potentiometers
When in the oscilloscope mode, selects the horizontal sweep rate or external horizontal input.
Horizontal sweep rate vernier or external horizontal input gain vernier. Calibrated position is fully clockwise.
Allows external horizontal inputs for oscilloscope. High input impedance.
Selects oscilloscope trigger level and trigger mode. Center knob selects the level of trigger. Outside (largest) knob controls the trigger mode. In Auto position, continuous sweep with no vertical input signal, syncs on vertical input. Normal position, no sweep unless vertical input is present, syncs on vertical input.
CAUTION
During Tone Sequence mode, entering a scope trigger delay prevents normal operation of scope triggering.
Controls the position of the CRT display, when in the oscilloscope mode.
Center (small) control knob Controls the vertical position of the CRT display
Outside (large) control Controls the horizontal position of the CRT display knob
Four-position rotary switch Oscilloscope operation uses values marked to the right of the switch, indicating volts per division on the CRT. Modulation display mode uses values marked to the left of the switch, indicating range for calibrated FM deviation. This switch also controls Frequency Counter sensitivity.
Potentiometer Vernier gain control for vertical inputs to the CRT when in the oscilloscope mode. Calibrated position is fully clockwise.
BNC connector Signal input to the equipment for the following operations (one megohm input impedance):
1. External vertical for oscilloscope operation
2. SINAD/ Distortion Meter
3. Digital Voltmeter
4. Frequency Counter
2-8
~-
~
~

"-.___/
TABLE 2-1. CONTROLS, INDICATORS, AND CONNECTORS
ITEM
RF SECTION:
RF In/Out connector
RF Level Variable control
RF Level Step attenuator
Ext Wattmeter
DUPLEX GEN switch
Output connector
Antenna Port
DESCRIPTION FUNCTION
FRONT PANEL (figure 2-1)
Type N connector
Potentiometer
14-position ganged attenuator and switch
Connector
Two-position toggle switch
BNC connector
Fused BNC connector PN #09-80378A51
/).Jt(. v,?~ f~· 1 f/V 1 r -"l{l .c ~
I .A<l' ~P ~ ' fv~"' J ,)JI' , f/ .. ; ·o '/ ti'-IJ 1 !J~'·t ~~~~~ a,. 17
vel'
RF input in monitor mode, RF output in generate mode.
Vernier control of RF output level. Pull for antenna port. Push for RF In/ Out port. Exceeding the Am Limit marking in AM generate mode may result in distorted output.
Ten dB per step control of RF output level in generate mode. Also serves as RF input level step attenuator in monitor and spectrum analyzer modes.
Allows input from Motorola ST-1200 series inline wattmeter elements for measurement and CRT display of forward and reflected transmitted power.
Select either On or Off. Duplex output from DUPLEX port is enabled with switch On.
Output connector for duplex generator output.
Connector for the whip antenna.
FUSE REPLACEMENT PROCEDURE: Place a male BNC connector on the antenna port. Use a pair of slip-joint pliers to grab onto the knurled portion of the male BNC connector. Turn counterclockwise to loosen. Unscrew the connector all the way, off the front panel. The fuse is plugged into the female center pin. Use a needle-nose pliers to remove the defective fuse and replace it with a 0.10 A mini-fuse, PN #65-80377A61.
FIGURE 2-2. REAR PANEL
2-9

ITEM
LINE power control
AC POWER
DC POWER
10 MHz STD
AC3A DC lOA
FAN POWER
CELL BUS
Frequency Standard 10 MHz control
TABLE 2-1. CONTROLS, INDICATORS, AND CONNECTORS
DESCRIPTION FUNCTION
REAR PANEL (figure 2-2)
Recessed switch
Connector
Connector
BNC Connector
Line fuseholders
Connector
Bus connector
Recessed switch
Select primary AC voltage, either 110 V or 220 V line.
Primary AC power input.
Primary DC power input port and battery charger output.
Input/ Output for 10 MHz reference frequency . See bottom panel.
AC and DC line fuses:
OPERATION 110/220 VAC
12 VDC
FUSE 3A
10 A
Power connector for the cooling fan.
PART NUMBER 65-20404 65-10266
Placement of l/0 connector when cellular service option is installed (R-2008D).
BOTTOM PANEL
Select either the internal 10 MHz frequency standard or an external 10 MHz source applied to the appropriate rear panel connector. This switch makes the rear panel 10 MHz port an output when operating from the internal standard or as an input otherwise.
2-10
~
r-...
~
SECTION 3 OPERATION
'-..___...~ 3.0 OPERATION • SELF-TEST DISPLAY EXAMPLES:
\,_,_./
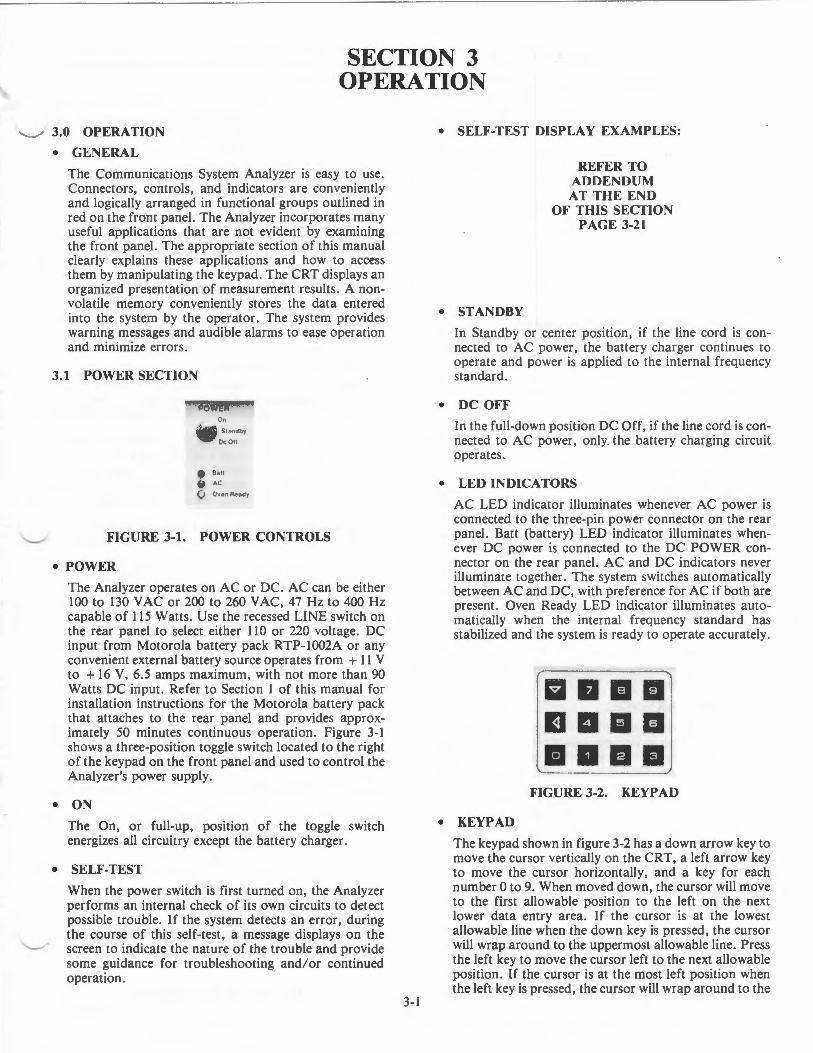
• GENERAL
The Communications System Analyzer is easy to use . Connectors, controls, and indicators are conveniently and logically arranged in functional groups outlined in red on the front panel. The Analyzer incorporates many useful applications that are not evident by examining the front panel. The appropriate section of this manual clearly explains these applications and how to access them by manipulating the keypad. The CRT displays an organized presentation of measurement results. A nonvolatile memory conveniently stores the data entered into the system by the operator. The system provides warning messages and audible alarms to ease operation and minimize errors.
3.1 POWER SECTION
Oo
Standby
De Oil
• Ban AC
O OvenReoddy
FIGURE 3-1. POWER CONTROLS
• POWER
The Analyzer operates on AC or DC. AC can be either 100 to 130 VAC or 200 to 260 VAC, 47 Hz to 400Hz capable of 115 Watts. Use the recessed LINE switch on the rear panel to select either 110 or 220 voltage. DC input from Motorola battery pack RTP-1002A or any convenient external battery source operates from + 11 V to + 16 V, 6.5 amps maximum, with not more than 90 Watts DC input. Refer to Section 1 of this manual for installation instructions for the Motorola battery pack that attaches to the rear panel and provides approximately 50 minutes continuous operation . Figure 3-1 shows a three-position toggle switch located to the right of the keypad on the front panel and used to control the Analyzer's power supply.
• ON
The On, or full-up, position of the toggle switch energizes all circuitry except the battery charger.
• SELF-TEST
When the power switch is first turned on, the Analyzer performs an internal check of its own circuits to detect possible trouble. If the system detects an error, during the course of this self-test, a message displays on the screen to indicate the nature of the trouble and provide some guidance for troubleshooting and/ or continued operation.
3-1
• STANDBY
REFER TO ADDENDUM AT THE END
OF THIS SECTION PAGE 3-21
In Standby or center position, if the line cord is connected to AC power, the battery charger continues to operate and power is applied to the internal frequency standard.
• DC OFF
In the full-down position DC Off, if the line cord is connected to AC power, only the battery charging circuit operates .
• LED INDICATORS
AC LED indicator illuminates whenever AC power is connected to the three-pin power connector on the rear panel. Batt (battery) LED indicator illuminates whenever DC power is connected to the DC POWER connector on the rear panel. AC and DC indicators never illuminate together. The system switches automatically between AC and DC, with preference for AC if both are present. Oven Ready LED indicator illuminates automatically when the internal frequency standard has stabilized and the system is ready to operate accurately.
• KEYPAD
-
11111111 IIIIEIEI 11111111
FIGURE 3-2. KEYPAD
The keypad shown in figure 3-2 has a down arrow key to move the cursor vertically on the CRT, a left arrow key to move the cursor horizontally, and a key for each number 0 to 9. When moved down, the cursor will move to the first allowable position to the left on the next lower data entry area. If the cursor is at the lowest allowable line when the down key is pressed, the cursor will wrap around to the uppermost allowable line. Press the left key to move the cursor left to the next allowable position. If the cursor is at the most left position when the left key is pressed, the cursor will wrap around to the

most right position on the same line. Select and press a numbered key to enter numeric information into the system and onto the CRT display screen. When a numbered key is pressed the system replaces an existing number on the screen, over which the display cursor is set, with the number on the pressed key. The system correctly places the decimal point. Use the keypad to enter input frequency for RF and IF generators, private line frequencies, timing information for paging systems, etc.
MONITORFM - -) 553.9999 MHz
-77.3 DBM INPUT LEVEL
-15 -99.9
-100
ERROR KHZ
0 DEV KHZ
0
DEV ALARM 07.0 KHZ
FIGURE 3-3.
30.2 uV
+23.7
+ 15 +99.9
+ 100
CATHODE RAY TUBE DISPLAY SCREEN
• CRT DISPLAY SCREEN
• lnlen'>•l\'
Focu!r.
The CRT screen (figure 3-3) displays fixed alphanumerics, a movable cursor, operator enterable numeric information, and system generated data outputs. The CRT continuously displays all functions, control settings, and measurements (generated or monitored) in both analog and digital forms. Bargraphs aid the autoranging digital readouts. Each bargraph has a base line, calibration markers, and intensified segment showing the measured value. When the Analyzer is switched into another mode, the CRT instantly displays all pertinent information. Use the dual control located at the lower right-hand corner of the CRT, to adjust the intensity and focus of the display. See Section 1 for Trace Rotation Adjustment procedure to re-align a tilting display screen.
• SYSTEM WARNINGS
The Analyzer provides protection against accidental application of high level energy into the RF ports. A fused BNC connector provides protection for the high level generator output antenna port. At the transceiver port, where the system is automatically in power monitor mode, the application of RF energy in excess of 100 milliwatts switches the Analyzer from generate to monitor mode. When too much RF is applied to the transceiver, an audible alarm warns and a visual warning appears on the CRT. Displays also warn of low battery power, improp,er attenuator setting for particular measurements, or overheated RF load. A continuous audible alarm sounds when a preset deviation limit is exceeded in monitor mode. An RF overload warning displays on the CRT in place of the modulation metering for strong RF input levels which could introduce measurement error. The warning does not display for input levels below -40 dBm at the antenna port and below -10 dBm at the transceiver port with the RF Step
3-2
attenuator in the 0 dB position. Use the attenuator to reduce the input signal level and thus remove the overload warning.
Gi>nerO'tt>
Mon1tor
FM
• cw • AM
• SSB OSBSC
• SWP 1 ·10 MHZ
• SWP 01 -1 MHl
111m FIGURE 3-4. FUNCTION SECTION
3.2 FUNCTION SECTION
Figure 3-4 shows the front panel FUNCTION section with the toggle switch (Generate or Monitor), two arrow selection keys - up or down, and six modes with their LED's:
FM cw AM
SSB/ DSBSC
SWP 1-10 MHz SWP .01-1 MHz
MONITORCW
--.- DBM
-15
FREQUENCY MODULATION CONTINUOUS WAVE AMPLITUDE MODULATION SINGLE SIDE BAND/DOUBLE SIDE BAND SUPPRESSED CARRIER SWEEP 1 MHz to 10 MHz SWEEP 0.01 MHz to 1MHz
- -) 101.1000 MHZ
INPUT LEVEL
ERROR KHZ -0
---.- w
-44.
+ 15
FIGURE 3-S. CW DISPLAY
A typical Continuous Wave display screen (figure 3-5) shows set frequency, frequency error, and RF input level. Modulation data is not monitored.
MONITOR AM - -) 101.1000 MHZ
--.- DBM INPUT LEVEL ---.- w
ERROR KHZ -41
• -15 0 + 15
-60.5 PCTAM +70.4
-100 0 + 100
FIGURE 3-6. AM DISPLAY
~
~

'-._...)
A typical Amplitude Modulation display screen (figure 3-6) shows set frequency, frequency error, percent AM modulation, and RF input level.
MONITORSSB - -) 101.1000 MHZ
--.- DBM INPUT LEVEL --.- w
BFO ERROR KHZ +3.62
-15 0 + 15
FIGURE 3-7. SSB DISPLAY
A typical Single Side Band display screen (figure 3-7) shows set frequency, RF input level, and BFO frequency error. Modulation data is not monitored.
GENSWP - -) 101.1000 MHZ
RF LEVEL 419mV +5.4DBM
FIGURE 3-8. SW:e DISPLAY
A typical Sweep display screen (figure 3-9) shows only set frequency and RF output level. Modulation data is not monitored. In sweep function, select either 0.01-1 MHz or 1-10 MHz range. Use the Dispr/Sweep vernier to control the sweep width. The minimum position is fully counterclockwise and the maximum position is fully clockwise.
Code Syrllh Mode
(; Pl DPl
• Pl DPlln'
8 Tone A
• ToneS
• fone Seq
e Tone Remo1e
rill Code Synth lvl E•t Lt!- .... el
FIGURE 3-9. MODULATION SECTION 3-3
3.3 MODULATION SECTION
Figure 3-9 shows the connectors, controls, and indicators located in the front panel MODULATION section. The modulation generator provides the RF generator with the modulating signal internally connected to either frequency, amplitude, or sideband function. The modulating signal sums the inputs of three sources: Internal fixed 1 KHz test tone, multimode audio code synthesizer, and external inputs. Adjust the level of each source independently. The modulating signal is available at the Mod Out BNC connector.
• FIXED 1KHz TONE
A 1 KHz test tone provides a convenient modulation source for general troubleshooting,. SINAD and DISTORTION measurement, and distortion measurement. Adjust the level with the 1 KHz Level control. The Off position turns off the 1 KHz tone.
• CODE SYNTHESIZER
The code synthesizer generates either a single tone, a multitone sequence, or a DPL sequence in response to front panel and CRT display inputs. Press a MODULATION arrow key to select one of the six modes:
PL/DPL PL/DPL Inv
Tone A Tone B
Tone Seq Tone Remote
Private Line/Digital Private Line Private Line/ Inverted Digital Private Line Tone A frequency only Tone B frequency only Signaling Sequence Remote Base Control Sequence.
Use the keypad to select frequencies in the 5 Hz to 1,000 Hz range for PL or DPL modes and in the 5 Hz to 20,000 Hz range for the other modes (0.1 Hz increments). The MODULATION toggle switch initiates the programmed tone sequence:
Cont - Continuous position generates repetitive cycles
Off - Position terminates modulation Burst - Position generates a single tone sequence .
Table 3-1, Modulation/Function, tabulates what works when.
MODULATION Code Synth Mode
0 PL/DPL
0 PL/DPL Inv
0 Tone A
0 Tone B
FUNCTION
Available only in FM Generate or FM Duplex Gen.
Available only in FM Generate or FM Duplex Gen.
Available as Modulation in FM, AM, or SSB FUNCTION only in Generate position. Available at Mod Out jack, at all times if selected, in both Generate and Monitor positions.
Same as Tone A.

0 Tone Seq
0 Tone Remote
Available in FM, AM, or SSB FUNCTION only in Generate position.
Same as Tone A.
Note: All modulation sources are available at Mod Out jack while in use as generator modulation. Code Synthesizer Level control simultaneously sets both the output level and the modulation level.
TABLE 3-1. MODULATION/FUNCTION AVAILABILITY
• EXTERNAL LEVEL
External Modulation Inputs from a microphone (Motorola RTM-4000B) plugged into the front panel and a signal applied to the Ext Mod In sum together to provide a single external modulating signal. The microphone input provides standard mobile radio preemphasis, clipping, and frequency roll-off. The microphone push-to talk switch switches the system from monitor to generate mode. Adjust the external input sensitivity or impedance with the External Level control, for analyses with external instruments. The Off position turns off the composite external modulation signal path .
• The Mod Out connector provides external access to the composite modulation signals. Output impedance is 600 ohms.
DISPLAY
• Gcn MooMtr
e ModuiJI!Ofl
• Spet:l Analyl.~r
O Duple• Gcn
• RFMef'l'lory
• S1gnahng Seq
• Fr~q Counter
• OVM OIST
• E.111 Wattmeter
• IF
9 Scope AC
• Scope DC
1!111 FIGURE 3-10. DISPLAY MODES
3.4 DISPLAY SECTION
To select one of the twelve DISPLAY modes shown in figure 3-10, press an arrow key located under the DISPLAY list to activate up or down movement of the adjacent LED indicator. If a DISPLAY mode is located at the top or bottom of the list when a key is pressed, the DISPLAY mode will wrap around. Confirm the selected configuration by the appropriate display on the CRT.
• GENERATE/MONITOR METERING
• GENERATE
In Generate FUNCTION the Analyzer generates an RF signal at a controllable output level useful for receiver testing. Many forms of internal and external modulation can be simultaneously impressed on the carrier frequency to generate composite signals for servicing. Use
3-4
the keypad to select any frequency of the generator from 10KHz to 1,000 MHz in 100Hz increments. The output range at the antenna port and the transceiver port provides sufficient amplitude to get through misaligned tuners and receivers. It is especially effective to change a receiver's frequency.
----- RF SECTION ----~ RF Level
Step Vaflable
Mal(
E• t Wattmew I CAUTION 125W MAX
w FIGURE 3-11. RF SECTION
• RF LEVEL
In the RF SECTION of the front panel (figure 3-11) a push-pull switch associated with the Variable level control selects either the antenna port or the transceiver port. The out-position (Pull) selects the antenna port. Control the output over a 16 dB range with the Variable RF Level control and the attenuation with the 14 Step attenuator at 10 dB per step. Use the attenuator to extend the range to the maximum antenna input level of + 10 dBm.
FUNCTION VOLTS RMS DBM
FM and CW 0.1 uV to 1 V -127 to + 13
AM 0.1 uV to 0.4 V -127 to +5
TABLE 3-2. RF OUTPUT LEVEL AT ANTENNA PORT
• RF OUTPUT LEVEL
Table 3-2 shows RF output levels available at the antenna port. At the in-position (Push) transceiver port (RF In/Out) the output level is attenuated by a nominal 30 dB below the level at the antenna port.
GENERATEFM PL) 150.0
0.61 uV
RF LEVEL
--) 154.1250 MHZ DPL) ---
-111.4DBM
12.4 PCT DIST SINAD -18.1 DB
-60 0
-4.74 DEY KHZ +4.75
-100 0 + 100
FIGURE 3-12. GENERATE MODE METERING DISPLAY
r-..
,--......,
~
• GENERATE MODE
Figure 3-12 defines a generate mode metering display. To operate, place FUNCTION switch in Generate posi-
' · tion. Press a FUNCTION arrow key to select a signal, FM for example. From the keypad, enter the desired frequency. The Gen/Mon Mtr and FM LED's illuminate and the CRT displays GENERATE FM and the carrier frequency. Use RF Scan control to tune up or down. Adjust deviation using the 1 KHz Level control. The CRT displays a complete summary of all parameters including carrier frequency, selected code, RF level in volts and dBm (analog and digital), deviation or percent modulation. The display is explained here line-by-line.
,.
1) GENERATE FM • ·) 154.1250 MHZ
Line 1 displays the mode, function, and current operating frequency.
2) PL) 150.0 DPL) • • •
Line 2 displays the PL or DPL code associated with the generate frequency. The system does not allow simultaneous PL and DPL. If the operator enters the PL code, the DPL display changes to dashes. If he enters the DPL code, the PL display changes to dashes. The programmed PL or DPL applies to the carrier automatically. Control its level with the Code Synthesizer Level knob.
4) RF LEVEL 5) 0.61 uV -111.4DBM
Line 5 displays RF output level in volts rms and in dBm. The voltage reading autoranges in three digits with the symbols uV for microvolts and MV for millivolts. The dBm reading appears in four digits with 0.1 dB resolution.
8) 12.4 PCT 9)
10) -60
DIST/SINAD -18.1 DB
0
The distortion of an input signal applied to the multipurpose input jack displays in percent with 0.1 OJo resolution. SINAD displays in dB with 0.1 dB resolution. The bargraph responds linearly to the SINAD reading, originating at the left side at -60 dB SINAD and extending to the right side for SINAD values to 0 dB.
12) -4.74 DEY KHZ +4.74 13) ___ _j __ .._ ___ _
14) -100 0 + 100
Lines 12, 13, & 14 display the level of frequency modulation applied to the system RF output. Positive and negative readings autorange in 3 digits. The zerocentered bargraph extends to the right and left of center corresponding to the modulation level. The graph responds in a modified logarithmic manner that provides a smooth nonranging analog display with a full scale of ± 100 KHz FM.
15) The w·ord ANT appears only when the antenna input on the front panel is enabled.
3-5
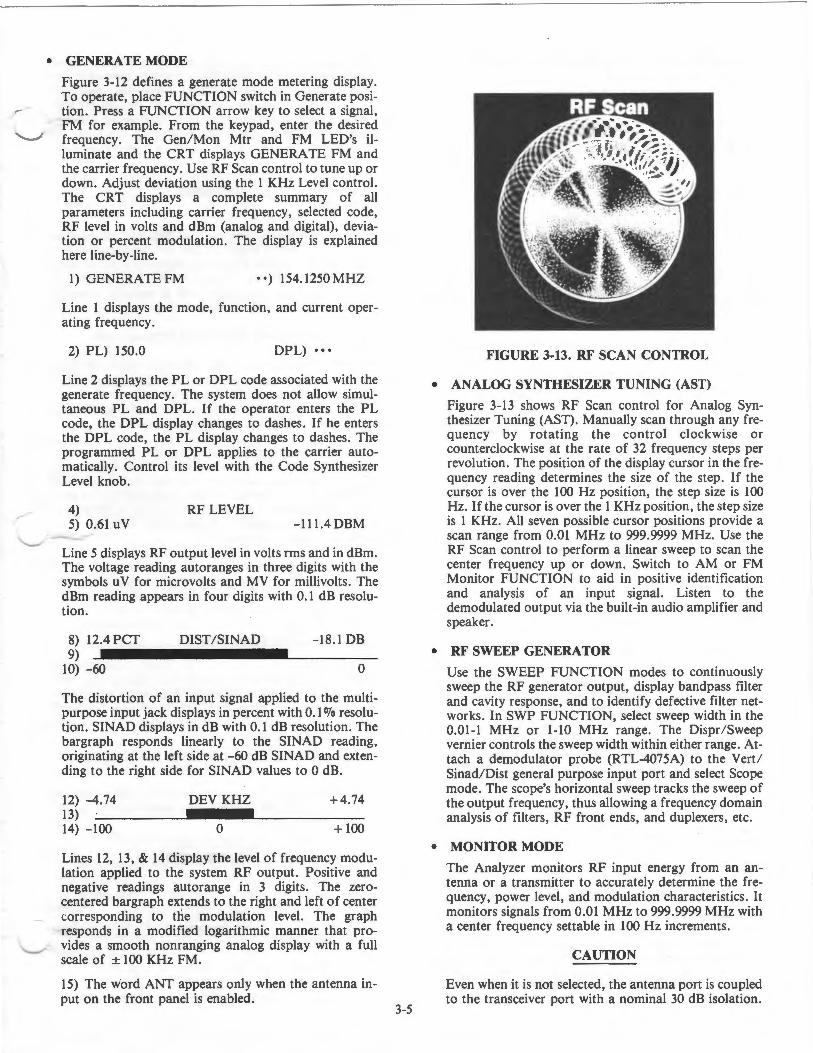
FIGURE 3-13. RF SCAN CONTROL
• ANALOG SYNTHESIZER TUNING (AST)
Figure 3-13 shows RF Scan control for Analog Synthesizer Tuning (AST). Manually scan through any frequency by rotating the control clockwise or counterclockwise at the rate of 32 frequency steps per revolution. The position of the display cursor in the frequency reading determines the size of the step. If the cursor is over the 100 Hz position, the step size is 100 Hz. If the cursor is over the 1 KHz position, the step size is 1 KHz. All seven possible cursor positions provide a scan range from 0.01 MHz to 999.9999 MHz. Use the RF Scan control to perform a linear sweep to scan the center frequency up or down. Switch to AM or FM Monitor FUNCTION to aid in positive identification and analysis of an input signal. Listen to the demodulated output via the built-in audio amplifier and speaker.
• RF SWEEP GENERA TOR
Use the SWEEP FUNCTION modes to continuously sweep the RF generator output, display bandpass filter and cavity response, and to identify defective filter networks. In SWP FUNCTION, select sweep width in the 0.01-1 MHz or 1-10 MHz range. The Dispr/Sweep vernier controls the sweep width within either range. Attach a demodulator probe (RTL-4075A) to the Vert/ Sinad/Dist general purpose input port and select Scope mode. The scope's horizontal sweep tracks the sweep of the output frequency, thus allowing a frequency domain analysis of filters, RF front ends, and duplexers, etc.
• MONITOR MODE
The Analyzer monitors RF input energy from an antenna or a transmitter to accurately determine the frequency, power level, and modulation characteristics. It monitors signals from 0.01 MHz to 999.9999 MHz with a center frequency settable in 100 Hz increments.
CAUTION
Even when it is not selected, the antenna port is coupled to the transceiver port with a nominal 30 dB isolation.
When using the transceiver port (RF In/ Out) disconnect the antenna from its port.
MONITORFM --) 466.9750 MHZ
INPUT WATTS 2.05
0 125
ERROR KHZ 0.50
-15 0 + 15
-5.13 DEY KHZ +5.23
-100 0 + 100
DEY ALARM 07.0 KHZ
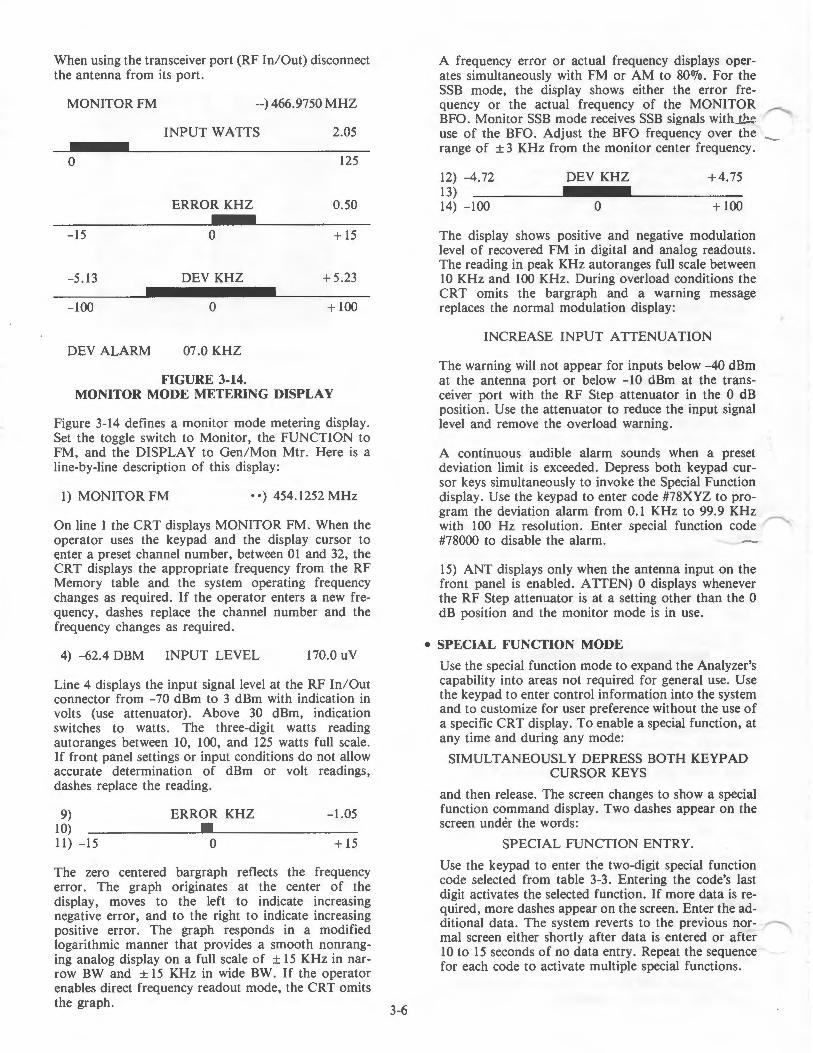
FIGURE 3-14. MONITOR MODE METERING DISPLAY
Figure 3-14 defines a monitor mode metering display. Set the toggle switch to Monitor, the FUNCTION to FM, and the DISPLAY to Gen/ Mon Mtr. Here is a line-by-line description of this display:
1) MONITOR FM • •) 454.1252 MHz
On line 1 the CRT displays MONITOR FM. When the operator uses the keypad and the display cursor to t:nter a preset channel number, between 01 and 32, the CRT displays the appropriate frequency from the RF Memory table and the system operating frequency changes as required. If the operator enters a new frequency, dashes replace the channel number and the frequency changes as required.
4) -62.4 DBM INPUT LEVEL 170.0 uV
Line 4 displays the input signal level at the RF In/ Out connector from -70 dBm to 3 dBm with indication in volts (use attenuator). Above 30 dBm, indication switches to watts. The three-digit watts reading autoranges between 10, 100, and 125 watts full scale. If front panel settings or input conditions do not allow accurate determination of dBm or volt readings, dashes replace the reading.
9) 10) 11) -15
ERROR KHZ
• 0
-1.05
+ 15
The zero centered bargraph reflects the frequency error. The graph originates at the center of the display, moves to the left to indicate increasing negative error, and to the right to indicate increasing positive error. The graph responds in a modified logarithmic manner that provides a smooth nonranging analog display on a full scale of ± 15 KHz in narrow BW and ± 15 KHz in wide BW. If the operator enables direct frequency readout mode, the CRT omits the graph.
3-6
A frequency error or actual frequency displays operates simultaneously with FM or AM to 800Jo. For the SSB mode, the display shows either the error frequency or the actual frequency of the MONITOR BFO. Monitor SSB mode receives SSB signals with~~ use of the BFO. Adjust the BFO frequency over the range of ± 3 KHz from the monitor center frequency.
12) -4.72 DEY KHZ +4.75 13) ___ ___. ________ _
14) -100 0 + 100
The display shows positive and negative modulation level of recovered FM in digital and analog readouts. The reading in peak KHz autoranges full scale between 10 KHz and 100KHz. During overload conditions the CRT omits the bargraph and a warning message replaces the normal modulation display:
INCREASE INPUT ATTENUATION
The warning will not appear for inputs below -40 dBm at the antenna port or below -10 dBm at the transceiver port with the RF Step attenuator in the 0 dB position. Use the attenuator to reduce the input signal level and remove the overload warning.
A continuous audible alarm sounds when a preset deviation limit is exceeded. Depress both keypad cursor keys simultaneously to invoke the Special Function display. Use the keypad to enter code #78XYZ to program the deviation alarm from 0.1 KHz to 99.9 KHz with 100 Hz resolution. Enter special function code ·~ #78000 to disable the alarm.
15) ANT displays only when the antenna input on the front panel is enabled. ATTEN) 0 displays whenever the RF Step attenuator is at a setting other than the 0 dB position and the monitor mode is in use.
• SPECIAL FUNCTION MODE
Use the special function mode to expand the Analyzer's capability into areas not required for general use. Use the keypad to enter control information into the system and to customize for user preference without the use of a specific CRT display. To enable a special function, at any time and during any mode:
SIMULTANEOUSLY DEPRESS BOTH KEYPAD CURSOR KEYS
and then release. The screen changes to show a special function command display. Two dashes appear on the screen under the words:
SPECIAL FUNCTION ENTRY.
Use the keypad to enter the two-digit special function code selected from table 3-3. Entering the code's last digit activates the selected function. If more data is required, more dashes appear on the screen. Enter the additional data. The system reverts to the previous normal screen either shortly after data is entered or after 10 to 15 seconds of no data entry. Repeat the sequence for each code to activate multiple special functions.
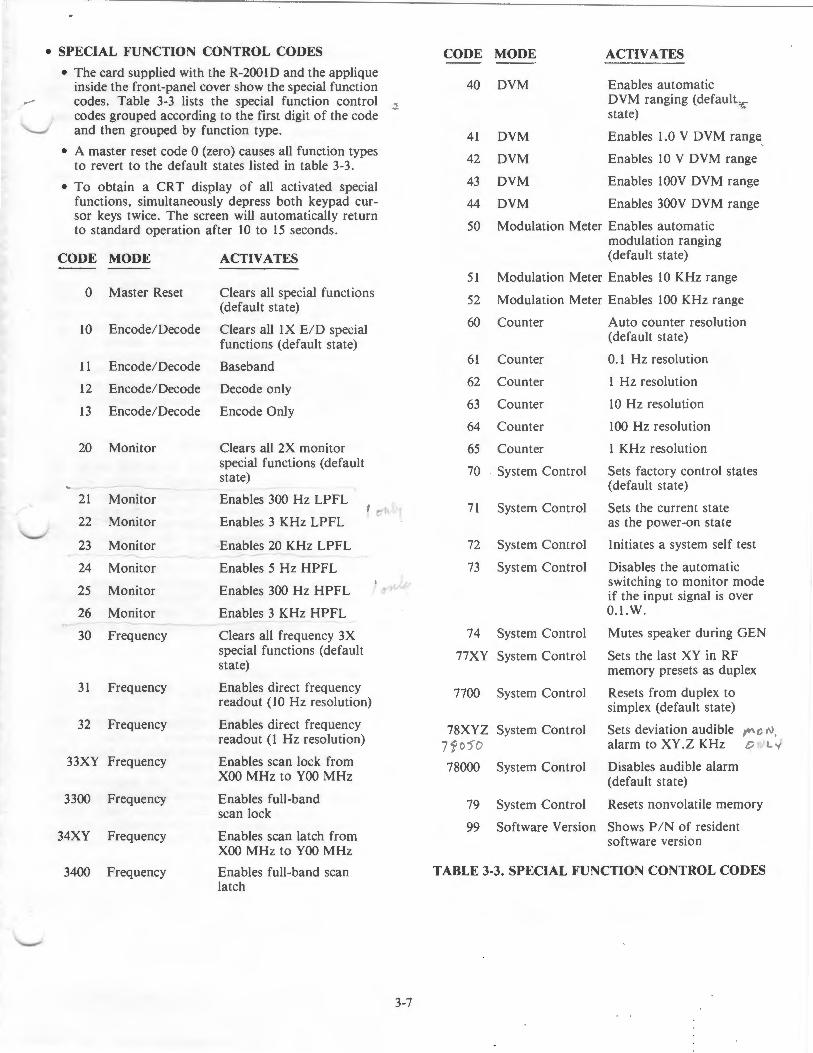
• SPECIAL FUNCTION CONTROL CODES CODE MODE ACTIVATES -- ---• The card supplied with the R-2001D and the applique
inside the front-panel cover show the special function 40 DVM Enables automatic
-- codes. Table 3-3 lists the special function control ' DVM ranging (default _~-
codes grouped according to the first digit of the code state) and then grouped by function type. 41 DVM Enables 1.0 V DVM range
• A master reset code 0 (zero) causes all function types 42 DVM Enables 10 V DVM range to revert to the default states listed in table 3-3.
• To obtain a CRT display of all activated special 43 DVM Enables 100V DVM range
functions, simultaneously depress both keypad cur- 44 DVM Enables 300V DVM range sor keys twice. The screen will automatically return
50 Modulation Meter Enables automatic to standard operation after 10 to 15 seconds. modulation ranging
CODE MODE ACTIVATES (default state) --
51 Modulation Meter Enables 10 KHz range 0 Master Reset Clears all special functions
52 Modulation Meter Enables 100 KHz range (default state)
10 Encode/ Decode Clears all IX E/ D special 60 Counter Auto counter resolution
functions (default state) (default state)
11 Encode/ Decode Baseband 61 Counter 0.1 Hz resolution
12 Encode/ Decode Decode only 62 Counter 1 Hz resolution
13 Encode/ Decode Encode Only 63 Counter 10 Hz resolution
64 Counter 100 Hz resolution
20 Monitor Clears all 2X monitor 65 Counter 1 KHz resolution special functions (default
70 System Control Sets factory control states state) (default state)
21 Monitor Enables 300 Hz LPFL r c t .. :'r 71 System Control Sets the current state
22 Monitor Enables 3 KHz LPFL as the power-on state
23 Monitor Enables 20 KHz LPFL 72 System Control Initiates a system self test
24 Monitor Enables 5 Hz HPFL 73 System Control Disables the automatic
Monitor I ~-#-'' switching to monitor mode
25 Enables 300 Hz HPFL if the input signal is over 26 Monitor Enables 3 KHz HPFL O.l.W.
30 Frequency Clears all frequency 3X 74 System Control Mutes speaker during GEN special functions (default 77XY System Control Sets the last XY in RF state) memory presets as duplex
31 Frequency Enables direct frequency 7700 System Control Resets from duplex to readout (10 Hz resolution) simplex (default state)
32 Frequency Enables direct frequency 78XYZ System Control Sets deviation audible t¥\O tJ, readout (1 Hz resolution) 7ro5o alarm to XY.Z KHz (I) Ly
33XY Frequency Enables scan lock from 78000 System Control Disables audible alarm XOO MHz to YOO MHz (default state)
3300 Frequency Enables full-band 79 System Control Resets nonvolatile memory scan lock
34XY Frequency Enables scan latch from 99 Software Version Shows PI N of resident
XOO MHz to YOO MHz software version
3400 Frequency Enables full-band scan TABLE 3-3. SPECIAL FUNCTION CONTROL CODES latch
3-7

• AUTO TUNE MODE
Enable full-band scan lock with special function control code #3300 (table 3-3). The monitor scans its specified frequency range to automatically acquire and tune a strong input signal within five seconds. For faster acquisition, use special function control code #33XY to limit the scan range to 100 MHz increments. The minimum input signal level for automatic frequency acquisition is -30 dBm at the antenna port and 0 dBM at the transceiver port. The word SCANNING replaces the programmed frequency display. Line 8 displays the actual input frequency ± l KHz as shown in the example in figure 3-10. When tuned, dashes replace the SCANNING display and a dash in the cursor replaces the channel number. When the input signal is removed, scanning resumes.
• SCAN LATCH MODE
Select this variation of the auto tune mode, using special function control code #3400 or 34XY to program and latch an auto tune frequency. In this mode, the input signal is acquired and tuned in the same manner as for auto tune. However, the programmed frequency display shows the word:
• LATCHED
and a dash under the cursor instead of the preset number.
The second line on the metering display reads
• PRESS 0 TO RESCAN
If the input signal is removed, the system remains programmed to the last frequency tuned. When the operator activates the 0 key, scanning resumes and the word SCANNING replaces the word LATCHED on the display. The preset number 0 appears under the cursor. Also, the CRT omits the second line on the display as scanning resumes.
The scan latch mode is useful for locating the transmit frequency of trunked radios.
3.6 MONITOR SECTION
Squelch
Stg lvl
• -Off
Image Opll 8W
H1gh~ Wtde
Low Narrow
Oemod Out BFO
FIGURE 3-15. MONITOR SECTION
3-8
• VOLUME AND SQUELCH CONTROLS
The Volume control adjusts the speaker output level. The Squelch control located to the left of the Volume control (figure 3-15) is continuously variable from Off,.-....... position (disabled squelch) to a maximum squelch lev( of -25 dBm ± 10 dB at the antenna port. When th Signal Level LED illuminates, it indicates an open position (unsquelched). When the LED is not illuminated, it indicates a closed position (from threshold to tight squelch).
• OFF-THE-AIR MONITOR
Use the Analyzer's antenna port for off-the-air monitoring. The Analyzer receiver's 1.5 uV sensitivity allows off-the-air monitoring to measure transmitter frequency error and deviation to 1000 MHz. Monitor weak signals with the variable squelch. But for accurate measurement, set them higher to ensure proper signal-to-noise ratio. More accurate measurements result from using a higher signal level. The off-the-air monitor function enables frequent parameter checks to spot system degradation early and reduce service costs. Set Wide bandwidth for off-channel signal location or wide band FM. Set Narrow bandwidth for maximum sensitivity and selectivity.
• SIGNAL STRENGTH METER
Place the FUNCTION switch in Monitor mode. The frequency selective signal strength indicator, operates simultaneously with other monitor functions over the full input frequency range of the monitor. It uses a maximum 30KHz bandwidth around the monitor center fre quency. At the antenna port, the signal strength indicator operates for input levels from -99.9 dBm to -30 dBm with the Step attenuator in the 0 dB position. For a non-zero attenuate both limits are increased by the amount of the attenuation. Measure higher level signals by inserting loss, using the rotary attenuator. The displayed measurement compensates for the attenuation.
• FM DEMODULATION
The monitor demodulates FM to 75KHz peak deviation in the wide band position and to 5 KHz in the narrow band position. Selectable highpass and lowpass filter sections determine the monitor's frequency response with characteristics as shown in table 3-4. Select bandwidth via BW switch or special function control. The wide band position enables the 5 Hz highpass and 20 KHz lowpass filters. The narrow band position enables the 5 Hz highpass and 3 KHz lowpass filters. Special Function overrides the BW switch to enable selection of any combination of high and low pass filtering as defined in table 3-3.

• AUDIO FILTERS
Table 3-4 lists audio filter characteristics.
Filter Char
acteris tic
High pass:
Lowpass:
Filter Frequency
Mode (Not More Than 0.5 dB)
5Hz 5Hz
300Hz
3KHz
20KHz 20KHz
3KHz
300Hz
Frequency
(Not More Than 3 dB)
300Hz
3KHz
3KHz
300Hz
Frequency
(At Least 20 dB)
170 Hz
1.7 KHz
40 KHz
5.4 KHz
540 Hz
TABLE 3-4. AUDIO FILTER CHARACTERISTICS
• AM DEMODULATION
The monitor demodulates AM to a 10007o modulation level. The frequency response is the same as for FM except that the lowest allowable highpass filter cutoff is 300Hz.
• SINGLE SIDEBAND DEMODULATION
The monitor has a minimum dynamic range of 30 dB in the sideband mode. The frequency response is the same as for FM.
• AUDIO MONITOR
A speaker monitors the recovered signal in the monitor mode and the modulating signal in the generate mode. The speaker drive signal is also applied to the receive audio pin of the microphone/headset connector. Use special function control to disable the speaker while maintaining the headset audio signal with volume control. The audio signal frequency response ranges from 300 Hz to 20 KHz in the wide band and from 300 Hz to 3 KHz in the narrow band.
FIGURE 3-16. MODULATION DISPLAY
3-9
• MODULATION
In the frequency MODULATION DISPLAY (figure 3-16), view the composite modulation audio waveform in generate mode or the demodulated audio in monitor mode. Analyze waveforms on the scope to measure deviation graphically. Use the MONITOR BW switch to select wide or narrow bandwidth. In the wide position, adjust frequency modulation level from 0 to 75 KHz peak deviation. In the narrow position, adjust the range from 0 to 20 KHz. The display's vertical deflection is calibrated for FM, generate and monitor modes, in three ranges with 0.25 KHz, 2.5 KHz, and 25 KHz per graticule division. Use the OSCILLOSCOPE modulation controls shown in figure 3-41 to select deviation level, vertical and horizontal. To set the range, adjust the Vert control to the proper KHz/ Div. The modulating signal is generated internally by the MODULATION SECTION. Refer to paragraph 3.3 in this manual.
CENTERFREQ 07) 156.2800 MHz
dB KHz
FIGURE 3-17. SPECTRUM ANALYZER DISPLAY
• SPECTRUM ANALYZER
The Spectrum Analyzer display, figure 3-17, shows center frequency, channel number, and operating frequency. Use the keypad to enter the channel number, from 01 to 32 or enter a center frequency directly. Use the Spectrum Analyzer to identify interference, trace RF and IF signals, measure transmitter harmonics, check spurious response and receiver local oscillator radiation. The CRT displays the appropriate frequency from the RF Memory table and changes the system operating frequency as required. Entering a new frequency changes the channel number to a dash and changes the system operating frequency as required. The CRT displays a window of the RF spectrum at either the antenna or transceiver port in a range selected from 1 MHz to 1 ,000 MHz programmable in 100 Hz increments. The observed window for the Analyzer can be controlled with the Dispr /Sweep and RF Scan controls. The Spectrum Analyzer has a dynamic range of at least 75 dB with the Step attenuator in the 0 dB position. With the attenuator, the usable range can be extended up to the maximum allowable input levels. When using the attenuator, add 10 dB per step attenuation to the actual dB reading on the scope. The usable sensitivity is at least -95 dBm at the antenna port and -65 dBm at the transceiver port.
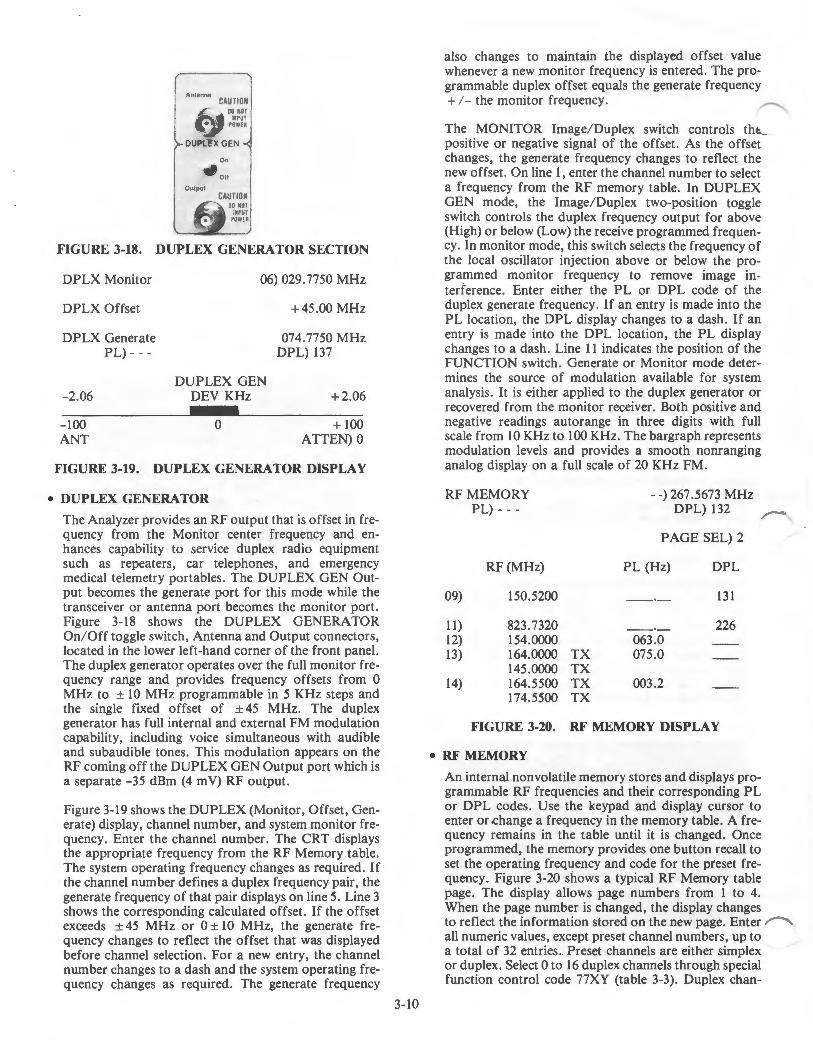
Ant(>nna
L CAUTION
DD hOI INtUT
'0*U
DUPLEX GEN
On
011
Ou!pu l
OD NO! 'kPUI
I'OW[A
FIGURE 3-18. DUPLEX GENERATOR SECTION
DPLX Monitor
DPLX Offset
DPLX Generate PL)---
-2.06
-100 ANT
06) 029.7750 MHz
DUPLEX GEN DEV KHz
0
+45.00 MHz
074.7750 MHz DPL) 137
+2.06
+ 100 ATTEN) 0
FIGURE 3-19. DUPLEX GENERATOR DISPLAY
• DUPLEX GENERA TOR
The Analyzer provides an RF output that is offset in frequency from the Monitor center frequency and enhances capability to service duplex radio equipment such as repeaters, car telephones, and emergency medical telemetry portables. The DUPLEX GEN Output becomes the generate port for this mode while the transceiver or antenna port becomes the monitor port. Figure 3-18 shows the DUPLEX GENERATOR On/ Off toggle switch, Antenna and Output connectors, located in the lower left-hand corner of the front panel. The duplex generator operates over the full monitor frequency range and provides frequency offsets from 0 MHz to ± 10 MHz programmable in 5KHz steps and the single fixed offset of ± 45 MHz. The duplex generator has full internal and external FM modulation capability, including voice simultaneous with audible and subaudible tones. This modulation appears on the RF coming off the DUPLEX GEN Output port which is a separate -35 dBm (4 mV) RF output.
Figure 3-19 shows the DUPLEX (Monitor, Offset, Generate) display, channel number, and system monitor frequency. Enter the channel number. The CRT displays the appropriate frequency from the RF Memory table. The system operating frequency changes as required. If the channel number defines a duplex frequency pair, the generate frequency of that pair displays on line 5. Line 3 shows the corresponding calculated offset. If the offset exceeds ± 45 MHz or 0 ± 10 MHz, the generate frequency changes to reflect the offset that was displayed before channel selection. For a new entry, the channel number changes to a dash and the system operating frequency changes as required. The generate frequency
3-10
also changes to maintain the displayed offset value whenever a new monitor frequency is entered. The programmable duplex offset equals the generate frequency + I- the monitor frequency.
The MONITOR Image/ Duplex switch controls tht positive or negative signal of the offset. As the offset changes, the generate frequency changes to reflect the new offset. On line 1, enter the channel number to select a frequency from the RF memory table. In DUPLEX GEN mode, the Image/ Duplex two-position toggle switch controls the duplex frequency output for above (High) or below (Low) the receive programmed frequency. In monitor mode, this switch selects the frequency of the local oscillator injection above or below the programmed monitor frequency to remove image interference. Enter either the PL or DPL code of the duplex generate frequency. If an entry is made into the PL location, the DPL display changes to a dash. If an entry is made into the DPL location, the PL display changes to a dash . Line 11 indicates the position of the FUNCTION switch. Generate or Monitor mode determines the source of modulation available for system analysis. It is either applied to the duplex generator or recovered from the monitor receiver. Both positive and negative readings autorange in three digits with full scale from 10KHz to 100KHz. The bargraph represents modulation levels and provides a smooth nonranging analog display on a full scale of 20KHz FM.
RF MEMORY PL) - - -
RF(MHz)
09) 150.5200
11) 823 .7320 12) 154.0000 13) 164.0000 TX
145.0000 TX 14) 164.5500 TX
174.5500 TX
- -) 267.5673 MHz DPL) 132
PAGE SEL) 2
PL (Hz) DPL
-·- 131
-·- 226 063.0 075.0
003.2
FIGURE 3-20. RF MEMORY DISPLAY
• RF MEMORY
An internal nonvolatile memory stores and displays programmable RF frequencies and their corresponding PL or DPL codes. Use the keypad and display cursor to enter or .change a frequency in the memory table. A frequency remains in the table until it is changed. Once programmed, the memory provides one button recall to set the operating frequency and code for the preset frequency. Figure 3-20 shows a typical RF Memory table page. The display allows page numbers from 1 to 4. When the page number is changed, the display changes to reflect the information stored on the new page. Enter all numeric values, except preset channel numbers, up to a total of 32 entries. Preset channels are either simplex or duplex. Select 0 to 16 duplex channels through special function control code 77XY (table 3-3). Duplex chan-
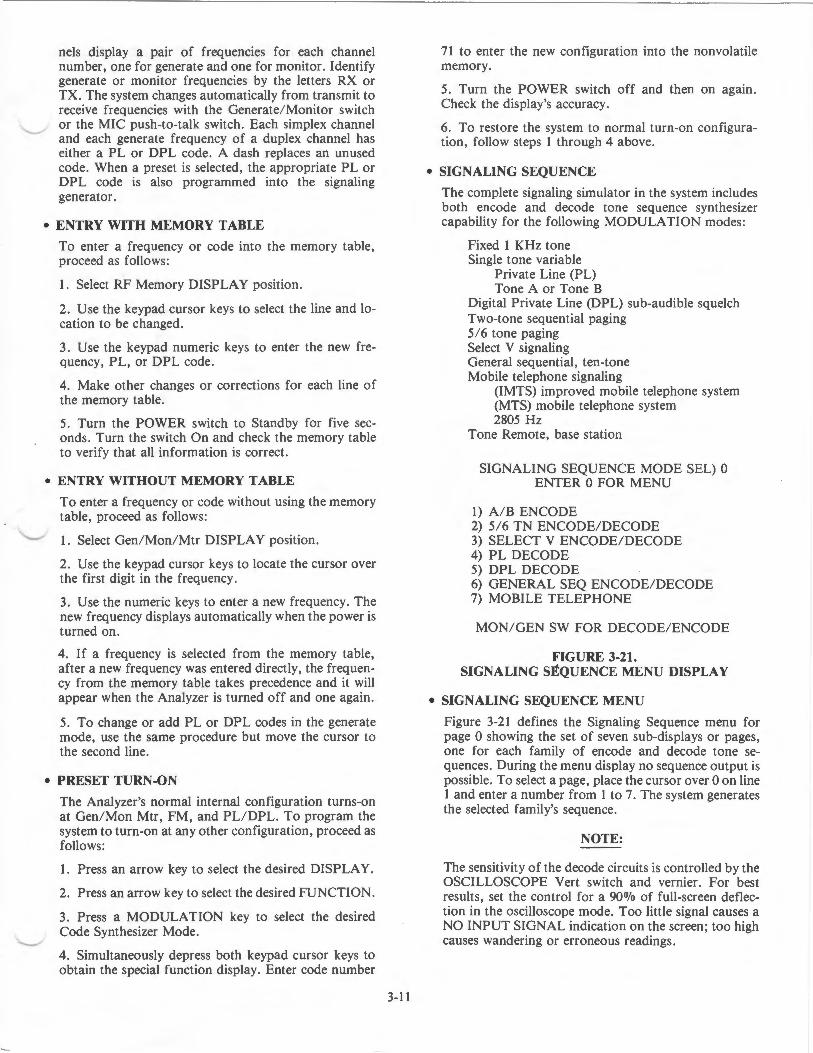
"---"
nels display a pair of frequencies for each channel number, one for generate and one for monitor. Identify generate or monitor frequencies by the letters RX or TX. The system changes automatically from transmit to receive frequencies with the Generate/ Monitor switch or the MIC push-to-talk switch . Each simplex channel and each generate frequency of a duplex channel has either a PL or DPL code. A dash replaces an unused code. When a preset is selected, the appropriate PL or DPL code is also programmed into the signaling generator.
'--._....-
• ENTRY WITH MEMORY TABLE
To enter a frequency or code into the memory table, proceed as follows:
1. Select RF Memory DISPLAY position.
2. Use the keypad cursor keys to select the line and location to be changed .
3. Use the keypad numeric keys to enter the new frequency, PL, or DPL code.
4. Make other changes or corrections for each line of the memory table.
5. Turn the POWER switch to Standby for five seconds. Turn the switch On and check the memory table to verify that all information is correct.
• ENTRY WITHOUT MEMORY TABLE
To enter a frequency or code without using the memory table, proceed as follows:
I. Select Gen/ Mon/ Mtr DISPLAY position.
2. Use the keypad cursor keys to locate the cursor over the first digit in the frequency.
3. Use the numeric keys to enter a new frequency. The new frequency displays automatically when the power is turned on.
4. If a frequency is selected from the memory table, after a new frequency was entered directly, the frequency from the memory table takes precedence and it will appear when the Analyzer is turned off and one again.
5. To change or add PL or DPL codes in the generate mode, use the same procedure but move the cursor to the second line.
• PRESET TURN-ON
The Analyzer's normal internal configuration turns-on at Gen/ Mon Mtr, FM, and PL/ DPL. To program the system to turn-on at any other configuration, proceed as follows:
1. Press an arrow key to select the desired DISPLAY.
2. Press an arrow key to select the desired FUNCTION.
3. Press a MODULATION key to select the desired Code Synthesizer Mode.
4. Simultaneously depress both keypad cursor keys to obtain the special function display. Enter code number
3-11
71 to enter the new configuration into the nonvolatile memory.
5. Turn the POWER switch off and then on again . Check the display's accuracy.
6. To restore the system to normal turn-on configuration, follow steps 1 through 4 above.
• SIGNALING SEQUENCE
The complete signaling simulator in the system includes both encode and decode tone sequence synthesizer capability for the following MODULATION modes :
Fixed 1 KHz tone Single tone variable
Private Line (PL) Tone A or Tone B
Digital Private Line (DPL) sub-audible squelch Two-tone sequential paging 5/ 6 tone paging Select V signaling General sequential, ten-tone Mobile telephone signaling
(IMTS) improved mobile telephone system (MTS) mobile telephone system 2805Hz
Tone Remote, base station
SIGNALING SEQUENCE MODE SEL) 0 ENTER 0 FOR MENU
1) A/ B ENCODE 2) 5/ 6 TN ENCODE/ DECODE 3) SELECT V ENCODE/ DECODE 4) PL DECODE 5) DPL DECODE 6) GENERAL SEQ ENCODE/ DECODE 7) MOBILE TELEPHONE
MON/ GEN SW FOR DECODE/ ENCODE
FIGURE 3-21. SIGNALING SEQUENCE MENU DISPLAY
• SIGNALING SEQUENCE MENU
Figure 3-21 defines the Signaling Sequence menu for page 0 showing the set of seven sub-displays or pages, one for each family of encode and decode tone sequences. During the menu display no sequence output is possible. To select a page, place the cursor over 0 on line 1 and enter a number from 1 to 7. The system generates the selected family's sequence.
NOTE:
The sensitivity of the decode circuits is controlled by the OSCILLOSCOPE Vert switch and vernier. For best results, set the control for a 90o/o of full-screen deflection in the oscilloscope mode. Too little signal causes a NO INPUT SIGNAL indication on the screen; too high causes wandering or erroneous readings.

• DECODE MODE SCREENS PL CODE FREQ. HZ PL CODE FREQ. HZ
All decode screens have a "start" decode select. This will start the specified decode and put the software into a xz 67.0 4Z 136.5
tight loop. This assures the best accuracy possible, but wz 69.3 4A 141.3 r-....... to do so, the analyzer ignores all switch selections and key entries except to go to the "menu" or to "end" the
XA 71.9 4B 146.2 decode loop. During the decode loop, a "DECODE" message appears near the top of the screen. In general, a
WA 74.4 5Z 151.4 "0" entry on the 2nd line will return the screen to menu, a "1" entry starts a decode or will reset a decode in proc-
XB 77.0 SA 156.7 ess, and a "2" will end the decode.
SIGNALING SEQUENCE MODE SEL) 4 WB 79.7 5B 162.2
0) MENU 1) START 2) END YZ 82.5 6Z 167.9
PL DECODE YA 85.4 6A 173.8
FREQ: 076.3 YB 88.5 6B 179.9
CODE: - zz 91.5 7Z 186.2
FIGURE 3-22. PRIVATE LINE DECODE DISPLAY ZA 94.8 7A 192.8
• PL DECODE ZB 97.4 M1 203.5
Select Signaling Sequence DISPLAY, Monitor FUNC- 1Z 100.0 8Z 206.5 TION, and PL Mode. Use special function control to select the signal source for the decoder. The decoder ac- 1A 103.5 M2 210.7 cepts signal inputs from either the internal monitor demodulator output or from the Ext Mod In port. The 1B 107.2 M3 218.1 Analyzer decodes tone sequence, PL and DPL signals, to determine the generating code. Figure 3-22 shows a 2Z 110.9 M4 225.7 ~ page 4 display of a decoded PL frequency and code. Frequencies readout to a maximum 300 Hz with 0.1 Hz 2A 114.8 9Z 229.1 resolution . The code of the nearest valid frequency will be displayed. Dashes display if the frequency exceeds . 2B 118.8 M5 233.6 the limit. Table 3-5 lists all valid PL codes and their fre-quencies. 3Z 123.0 M6 241.8
3A 127.3 M7 250.3
3B 131.8
TABLE 3-5. VALID PL CODES
3-12

023 071 134 223 306 411 503 631 734
025 072 143 226 311 412 506 632 743
026 073 152 243 315 413 516 654 754 "-..._..,.
031 074 155 244 331 423 532 662
032 114 156 245 343 431 546 664
043 115 162 251 346 432 565 703
047 116 165 261 351 445 606 712
051 125 172 263 364 464 612 723
054 131 174 265 365 465 624 731
065 132 205 271 371 466 627 732
TABLE 3-6. VALID DPL CODES
SIGNALING SEQUENCE MODE SEL) 5 0) MENU 1) START 2) END
DPL DECODE
DPL CODE: 321
- NO INPUT SIGNAL -
FIGURE 3-23. DPL DECODE DISPLAY "-..._..,.
• DPL DECODE
Figure 3-23 shows a display of a detected valid code on page 5. If the system detects an invalid code, dashes re-place the code number. Table 3-6 lists the valid DPL codes.
SIGNALING SEQUENCE MODE SEL) 1 ENTER 0 FOR MENU
A/BENCODE SEQ SEL) 1 A) 01200.0 Hz B) 00300.0 Hz
A DLY B DLY (SEC) 1) 0.40 0.00 0.20 1.00 TONE 2) 1.00 0.00 3.00 1.30 TN&VCE 3) 0.10 0.10 0.10 0.10 4) 0.20 0.20 0.20 0.20
SCOPE TRIG DL Y) 0.000 SEC
FIGURE 3-24. TWO TONE (A/B) ENCODE DISPLAY
3-13
• A/B ENCODE
Figure 3-24 shows a display for page 1 of the menu. To select sequence input, enter a number from 1 to 4. Enter Tone A and Tone B frequencies. Each frequency has a maximum value of 20,000 Hz with a resolution of 0.1 Hz. The system responds to changes in the tone frequency to allow the next complete signaling sequence to be executed with the new tone frequency. The majority of two-tone pagers use the first two fixed sequences listed in the tone sequence table. The operator cannot change the first two sequences but he can change the last two . Each delay entry has a maximum value of 10 seconds. The system responds to new entries during an active sequence to allow the next complete signaling sequence to be executed with the new timing mformation. For triggered sweep on the oscilloscope program the scope trigger delay to a maximum 10 seconds (0.001 second resolution). If time entered exceeds Tone Sequence time, the oscilloscope will not trigger. Enter 000.0 to disable trigger delay.
• TWO-TONE SEQUENTIAL PAGING
Program a two-tone pager access sequence with Tone A and Tone B frequencies, tone durations, and time between tones as defined in figure 3-24. Select Tone Sequence mode for the code synthesizer, A/ B sequence on the Signaling Sequence DISPLAY, and Generate FUNCTION. The timing format for this mode consists of Tone A for the programmed time, followed by the programmed delay, followed by Tone B for the programmed time, followed by the second programmed delay. This sequence will repeat in continuous position but generate only a single sequence in burst position.
SIGNALING SEQUENCE MODE SEL) 2 ENTER 0 FOR MENU
5/6 TONE ENCODE 1) 5-TONE SEQ
SEQ SEL) 2 2) 6-TONE SEQ
CAP CODE) 2-13340X
SCOPE TRIG DL Y) 0.000 SEC
FIGURE 3-25. 5/6 TONE ENCODE DISPLAY
• 5/6 TONE ENCODE
Figure 3-25 shows an encode display for page 2 of the menu. Select either 5-tone or 6-tone paging. Table 3-7 lists the cap code digits and their frequencies. Enter the cap code digit for the desired output sequence. The code has a preamble tone number followed by a 5-digit sequence number. An X automatically appears at the end of the cap code. The system responds to changes in the cap code to allow the next complete signaling sequence to be executed with the new code information. The sixth or X tone may not be transmitted by selecting the 5-tone sequence. If the tone is not transmitted, a delay equal to the normal tone X time is inserted. With the MODULATION switch in continuous position, the output consists of the preamble tone followed by a continuous cycling 5 or 6 tone sequence. Cycling terminates only when the switch is moved to the off position or the mode is

changed. Burst position generates a single cycle preamble tone followed by the 5 or 6 tone sequence after which the output terminates.
DIGIT FREQUENCY HZ
0 600
741
2 882
3 1023
4 1164
5 1305
DIGIT FREQUENCY HZ
6 1446
7 1587
8 1728
9 1869
R 459
X 2010
TABLE 3-7. CAP CODES
SIGNALING SEQUENCE MODE SEL) 2 0) MENU 1) START 2) END
5/ 6 TONE DECODE
CODE: 2 - 4 5 3 1 1 X FREQ: 0082 Hz 1164
TIME: SEC
.035 .035
1305 0741 1023
.035 .035 .035
- NO INPUT SIGNAL -
1446 0429
.035 .035
FIGURE 3-26. 5/ 6 TONE DECODE DISPLAY
• 516 TONE DECODE
Figure 3-26 shows the decode display on page 2. If the reset is activated by entering a "1" for "START", all decode information is replaced by dashes and the decoder sequence resumes. If the decode sequence detects the presence of the sixth or X tone, the X appears at the end of the code. Otherwise, that space remains blank . If the sequence detects an invalid frequency, a dash replaces that digit. The display shows the detected frequency for each digit of the cap code. The format staggers a line with the appropriate frequency directly below the code digit. Frequencies readout to a maximum value of 10,000 Hz with 1 Hz resolution. If the decode sequence cannot detect an input signal, a warning message displays. The display retains the last decoded sequence information, regardless of signal input condition, until the operator initiates another decode or changes the display.
3-14
SIGNALING SEQUENCE MODE SEL) 3 ENTER 0 FOR MENU
SELECT V ENCODE 1) ZVEI
SEQ SEL) 1 2) MODIFIED ZVEI 4) CCIR (lOOMS)
/""'\ 3) CCIR (70MS) 5) EEA
ACCESS CODE) 12345
SCOPE TRIG DL Y) 0.000 SEC
FIGURE 3-27. SELECT V ENCODE DISPLAY
• SELECT V ENCODE
Figure 3-27 shows an encode display on page 3. Select one of the five sequences to display the five-digit access code for Select V. The processor responds to the entry of a new access code to execute the next complete sequence. Table 3-8 lists tone frequencies and time duration in milliseconds for each digit of the five sequences. A sequence consists of a single series of five tones in response to the five-digit access code. Each tone lasts for the specified duration. Select single or repetitive cycles, using the burst or continuous switch position.
TONE ZVEI / B.O.S. MOD. ZVEI
NUMBER HZ HZ
1060 970
2 1160 1060
1270 1160
4 1400 1270
1530 1400
6 1670 1530
7 1830 1670
8 2000 1830
9 2200 2000
0 2400 2200
R* 2600 2400
TONE
LENGTH
ms 70 70
CCIR
HZ
1124
1197
1275
1358
1446
1540
1640
1747
1860
1981
2110
100
EEA
HZ
1124
1197
1275
1358
1446
1540
1640
1747
1860
1981
2110
40
CCIR
HZ
1124
1197
1275
1358
1446
1540
1640
1747
1860
1981
2110
70
*R is the repeat tone which is inserted wherever there is a repeat of the same tone in adjacent time slots (Example: Encode 13334 as 13R34).
TABLE 3-8. SELECT V SEQUENCE SPECIFICATION ----..,..
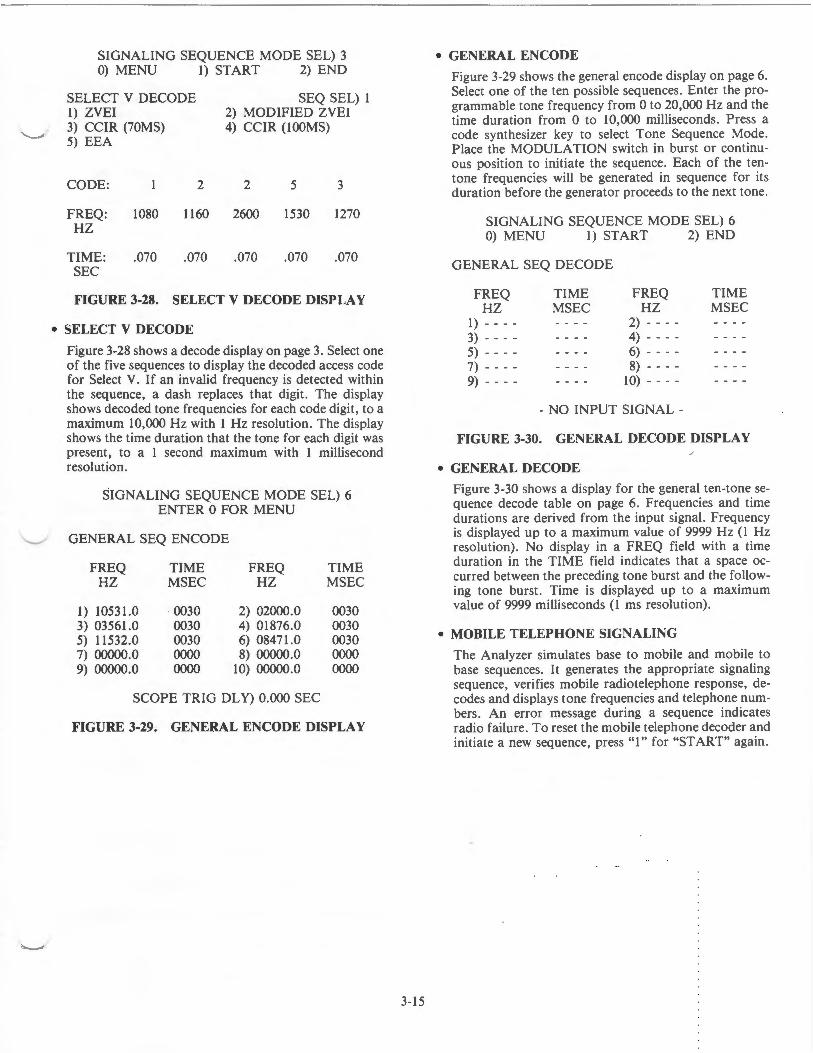
~
'-...___/
SIGNALING SEQUENCE MODE SEL) 3 0) MENU 1) START 2) END
SELECT V DECODE 1) ZVEI 3) CCIR (70MS) 5) EEA
CODE:
FREQ: 1080 HZ
TIME: .070 SEC
2
1160
.070
SEQ SEL) 1 2) MODIFIED ZVEI 4) CCIR (lOOMS)
2 5 3
2600 1530 1270
.070 .070 .070
FIGURE 3-28. SELECT V DECODE DISPLAY
• SELECT V DECODE
Figure 3-28 shows a decode display on page 3. Select one of the five sequences to display the decoded access code for Select V. If an invalid frequency is detected within the sequence, a dash replaces that digit. The display shows decoded tone frequencies for each code digit, to a maximum 10,000 Hz with 1 Hz resolution. The display shows the time duration that the tone for each digit was present, to a 1 second maximum with 1 millisecond resolution.
SIGNALING SEQUENCE MODE SEL) 6 ENTER 0 FOR MENU
GENERAL SEQ ENCODE
FREQ TIME FREQ TIME HZ MSEC HZ MSEC
1) 10531.0 0030 2) 02000.0 0030 3) 03561.0 0030 4) 01876.0 0030 5) 11532.0 0030 6) 08471.0 0030 7) 00000.0 0000 8) 00000.0 0000 9) 00000.0 0000 10) 00000.0 0000
SCOPE TRIG DL Y) 0.000 SEC
FIGURE 3-29. GENERAL ENCODE DISPLAY
3-15
• GENERAL ENCODE
Figure 3-29 shows the general encode display on page 6. Select one of the ten possible sequences. Enter the programmable tone frequency from 0 to 20,000 Hz and the time duration from 0 to 10,000 milliseconds. Press a code synthesizer key to select Tone Sequence Mode. Place the MODULATION switch in burst or continuous position to initiate the sequence. Each of the tentone frequencies will be generated in sequence for its duration before the generator proceeds to the next tone.
SIGNALING SEQUENCE MODE SEL) 6 0) MENU 1) START 2) END
GENERAL SEQ DECODE
FREQ HZ
1) - - - -3) - - - -5) - - - -7) - - - -9) - - - -
TIME MSEC
FREQ HZ
2) - - - -4) - - - -6) - - - -8) - - - -
1 0) - - - -
- NO INPUT SIGNAL -
TIME MSEC
FIGURE 3-30. GENERAL DECODE DISPLAY
• GENERAL DECODE
Figure 3-30 shows a display for the general ten-tone sequence decode table on page 6. Frequencies and time durations are derived from the input signal. Frequency is displayed up to a maximum value of 9999Hz (1 Hz resolution). No display in a FREQ field with a time duration in the TIME field indicates that a space occurred between the preceding tone burst and the following tone burst. Time is displayed up to a maximum value of 9999 milliseconds (1 ms resolution) .
• MOBILE TELEPHONE SIGNALING
The Analyzer simulates base to mobile and mobile to base sequences. It generates the appropriate signaling sequence, verifies mobile radiotelephone response, decodes and displays tone frequencies and telephone numbers. An error message during a sequence indicates radio failure. To reset the mobile telephone decoder and initiate a new sequence, press "1" for "START" again .

SIGNALING SEQUENCE MODE SEL) 7 0) MENU 1) START 2) END
MOBILE TEL SEQ SEL)1 1) IMTS 2) MTS 3) 2805
1) MOBILE ORIG TONE 1) 2000Hz
TEST SEQ SEL) 1 2) BASE ORIG
TONE 2) 1800Hz
MOBILE ID DIALED NO GUARD FREQ CONN FREQ DISC FREQ
- - - - Hz - - - - Hz - - - - Hz
FIGURE 3-31. IMTS MOBILE ORIGINATED DISPLAY
• IMTS MOBILE ORIGINATED
Figure 3-31 shows a page 7 display. Select one of the three phone systems, by Sequence Select and either mobile or base originated, by Test Sequence Select. Here the display shows a test sequence menu for IMTS with the information decoded from the mobile radio for a mobile originated sequence. The mobile ID and dialed number vary up to a maximum number of seven and ten digits, respectively. The maximum decoded frequency is 10,000 Hz with 1 Hz resolution. Error messages display under DISC FREQ (refer to the tone sequence diagrams in your IMTS Manual).
ERROR MESSAGE
B.O. means base originated; M.O. means mobile originated.
01 Incorrect IMTS tone. M.O. tone was not
02
03
04
05
one of the three possible receive tones: Connect Guard Disconnect.
This error can happen only after the guard tone has been received.
Too many digits decoded (IMTS- M.O.). The mobile ID or phone number had too many pulses (more than ten).
Time-out error (IMTS - M.O. or B.O.). Tone lasted longer than spec, in specified state.
Improper sequence (M.O.). Sent mobile ID before seize tone.
No guard tone (B.O.). Mobile doesn't respond to seize tone.
3-16
ERROR MESSAGE
06 Illegal tone transition (M.O.). Mobile ID or phone number sequence is incorrect. For example, guard tone space, guard tone, or connect tone-space-connect tone would generate an error.
TABLE 3-9. IMTS ERROR MESSAGES
SIGNALING SEQUENCE MODE SEL) 7 0) MENU 1) START 2) END
MOBILE TEL SEQ SEL) 1
1) IMTS 2) MTS 3) 2805
IMTS 1) MOBILE ORIG
TEST SEQ SEL) 2 2) BASE ORIG
MOBILE ID GUARD FREQ CONN FREQ DISC FREQ
7635412 - -- - Hz - - - - Hz - - - - Hz
SCOPE TRIG DL Y) 0.000 SEC
FIGURE 3-32. IMTS BASE ORIGIN A TED DISPLAY
• IMTS BASE ORIGINATED
Figure 3-32 shows a page 7 display allowing the operator to enter a 1 to 7 digit ID for the mobile being tested. Enter a number in the most significant location. Dashes replace the desired number of digits. Enter the desired number of digits. The other digit locations remain as dashes. The processor responds to changes in the telephone number to allow the next complete dialing sequence to be executed with the new number. The display shows decoded signaling tone frequencies for an IMTS base originated sequence, with 10,000 Hz maximum frequency and 1 Hz resolution. Error messages display on the line above SCOPE. The Analyzer encodes and decodes the information defined by figures 3-31 and 3-32.
SIGNALING SEQUENCE MODE SEL) 7 ENTER 0 FOR MENU
MOBILE TEL
BURST TO START
SEQ SEL) 2 1) IMTS 2) MTS 3) 2805
MTS
TONE 1) 2000Hz TONE 2) 1800Hz MOBILE ID 7635412
SCOPE TRIG DL Y) 0.000 SEC
~
~
FIGURE 3-33. MTS MOBILE TELEPHONE DISPLAY ~
• MTS MOBILE TELEPHONE
Figure 3-33 shows a page 7 display of tone 1 & tone 2 frequencies used in generating mobile telephone MTS

and 2805 sequences. Enter frequencies up to a maximum 10,000 Hz with 1 Hz resolutions. The processor responds to changes in tone frequencies to allow the next complete sequence to be executed with the new tone frequencies. The MTS sequence requires no test se-
~ quence select and has no mobile to base system.
.._____..,
SIGNALING SEQUENCE MODE SEL)7 ENTER 0 FOR MENU BURST TO START
MOBILE TEL
1) IMTS 2) MTS 3) 2805
2805
TONE 1) 0000 Hz MOBILE 10
SEQ SEL) 3
TONE 2) 2805 Hz
FIGURE 3-34. 2805 BASE ORIGINATED DISPLAY
• 2805 BASE ORIGINATED
Figure 3-34 shows a page 7 display for the mobile telephone 2805 sequence, base originated. Figure 3-34 defines the encode information for 2805 sequences. The 2805 sequence requires no test sequence select and has no mobile to base system.
• TONE SEQUENCE
Select Tone Sequence Mode (memory display) for the code synthesizer. Encode in generate function, decode in monitor function, or use special function control to encode or decode in either generate or monitor function. The tone memory table displays details for all signaling systems. Program frequency, time duration, and time interval.
• TONE REMOTE (ENCODE)
The System can be used to simulate a tone remote control console, or to troubleshoot tone control decoding circuitry in remote base station. These useful tone bursts are available at the MOD OUT jack on the front panel so that they can be coupled onto phone lines or any other place they may be needed. Activate the tone bursts by selecting TONE REMOTE mode in the MODULATION section of the front panel. Select the two appropriate frequencies of the tone bursts by programming Tone A and Tone B frequencies in the Two-Tone paging sequence. Typical guard tone frequency (Tone A) is 2175 Hz. Function tones (Tone B) vary by system. Select Tone B from table 3-10. Refer to your Tone Remote Instruction Manual for detailed information .
3-17
Control & Function I Freq. Systems
Fl Transmit 1950Hz F2 Transmit N/ A Fl Transmit w/ o PL N/ A PL Monitor 2050 Hz R2 Off/ R2 On N/ A Rptr Off!Rptr On 1550/ 1450 Hz PL On/ PL Off 1550/ 1450 Hz Wild Card I 1350/ 1250 Hz Wild Card II 1150/ 1050 Hz
2 Freq. Systems
1950Hz 1850Hz N/ A 2050Hz 1750/ 1650 Hz N/ A 1550/ 1450 Hz 1350/ 1250 Hz 1150/ 1050 Hz
Paging Systems
1950Hz N/ A 1850Hz 2050Hz N/ A 155011450 Hz 1550/ 1450 Hz 1350/ 1250 Hz 1150/ 1050 Hz
TABLE 3-10. TONE B FUNCTIONS
Unlike the other signaling sequences, this special mode provides no repetitive sequences. Institute the TONE REMOTE sequence by moving the MODULATION switch to BURST or CONTINUOUS. The sequence issues TONE A for 115 ms followed by TONE B for 40 ms at a level 10 dB below that of Tone A. Tone A follows at a level 30 dB below that of the initial Tone A for as long as the MODULATION Switch is held in either the BURST or CONTINUOUS position. The level of these bursts is adjustable with the MOD LEVEL control, and may be observed with the MODULATION DISPLAY similar to any signaling sequence.
• TONE REMOTE (DECODE)
Connect the Analyzer's Vert/Sinad/Dist input to the Tone Remote unit's output. Select Signaling Sequence DISPLAY and Monitor FUNCTION. Select General Sequence Decode Mode, as shown in figure 3-30, and enter Special Function control code #11. The screen displays frequency and time duration for both high level guard tone (A) and function tone (B). After obtaining the information for F-1, press either keypad cursor key once to reset. Obtain information for F-2 and reset, etc.
GENERATEFM PL) 936.0
COUNT MODE SEL) 2 1) FREQUENCY
RESOLUTION SEL) 6 1) 0.1 Hz 3) 10Hz 5) 1 KHz
04) 285.7750 MHz DPL)---
2) PERIOD
2) 1.0 Hz 4) 100Hz 6) AUTO
INPUT FREQUENCY * 10.723 MHz
- RANGE SW NOT AT MAX SENS POS -
FIGURE 3-35. FREQUENCY COUNTER DISPLAY

• FREQUENCY COUNTER
Figure 3-35 shows a Frequency Counter display. The internal Frequency Counter measures input from 10Hz to 35 MHz. To measure signals higher than 35 MHz, use the frequency error readout in the monitor mode. The CRT displays an autoranging output allowing the operator to measure precisely and set offset oscillators, IF's, PL frequencies, and other external input signals. Frequency counter operates in either generate or monitor function. Use PL/ DPL decode modes for measuring these codes off the air. Enter number 1 or 2 to select either frequency counting or period counting. In the counting mode, select one of the five display resolutions or automatic ranging. Frequency counting is preferred above 1 KHz. Period counting is preferred below 1 KHz. Adjust sensitivity with the OSCILLOSCOPE Vert switch and vernier. For best results, set the control for a 900Jo of full-screen deflection. Too little signal causes a NO INPUT SIGNAL indication on the screen; too high causes wandering or erroneous readings. The display shows the calculated input frequency, the five digit frequency readout with operator selected resolution, the acronym for the multiplier (Hz, KHz, MHz) and position of the decimal point as identified in table 1. The system automatically ranges to display the best resolution of the input frequency consistent with table 1. If the operator selects a resolution inconsistent with table 1, an appropriate warning message: INCREASE RESOLUTION or DECREASE RESOLUTION replaces this entire line. The processor programs for a new resolution and attempts a new frequency reading. When the processor updates a frequency, the asterisk on line 12 blanks for 0.1 second. The warning message displays on line 14, whenever the input range attenuator is not in its most sensitive position. Table 3-11 lists the relationships between frequency and resolution.
Counting
Multiplier
Frequency
Hz
KHz
MHz
Period
Hz
KHz
MHz
0.1
0.0-6000.0
NA
NA
2.0-999.9
NA
NA
Resolution Hz
I 10 100 1000 -NA NA NA NA
0.0-6000.0 0.0-600.0 0.0-6000.0 NA
NA NA NA 0.0-35 .0
10-2999 NA NA NA
NA 0.0-9.99 0.0-29 .9 0.0-99.9
NA NA NA NA
TABLE 3-11. VALID INPUT FREQUENCY VERSUS DISPLAY RESOLUTION
• (DVM/ DIST) DIGITAL VOLTMETER/ DISTORTION MODE
The Analyzer provides an AC-DC voltmeter. The voltage automatically ranges between full scale values of 1, 10, 100, and 300 volts. The CRT displays the voltage
3-18
and the corresponding dBm value. Use the voltmeter to check audio level, bias level, and power supply voltage. The voltmeter operates in generate or monitor function. Connect the probe RTL-4011A to the Vert/Sinad/ Dist connector. Move the cursor to the mode select position. Select AC, DC, or DISTORTION mode, as required. Implement fixed ranges with special function control techniques.
WARNING
THE METER'S COMMON LEAD IS CONNECTED TO THE ANALYZER'S CHASSIS GROUND. DO NOT ATTEMPT TO MEASURE FLOATING CIRCUITS WITH THE ANALYZER, BECAUSE THAT WOULD CONNECT THE FLOATING CIRCUIT TO GROUND! FOR EXAMPLE, DO NOT MEASURE AC POWER MAINS WITH THE ANALYZER. SERIOUS SHOCK HAZARD COULD RESULT.
GENERATE FM PL) 035.0
9.33 uV
+ 12.1 DBM
0 DVM MODE
1) AC VOLTS 2) DC VOLTS 3) DISTORTION
ANT
RF LEVEL
V AC
04) 285.7750 MHZ DPL)---
-87.5 DBM
3.00
300 MODE SEL) 1
BAT 11.0V
FIGURE 3-36. AC DVM DISPLAY
Figure 3-36 shows an AC DVM display of the center frequency and the PL or DPL code in the generate mode. The bargraph responds to the magnitude of the voltage in a modified logarithmic manner to provide a smooth nonranging analog display. Line 14 displays the voltage of the primary DC power source.
MONITORFM
+24.0 DBM
0 DVM MODE
1) AC VOLTS 2) DC VOLTS 3) DISTORTION ANT
04) 400.0000 MHz
INPUT LEVEL
V DC
3.3 v
+.001
300 MODE SEL) 2
BAT 0.0 V
FIGURE 3-37. DC DVM DISPLAY
.~
~

Figure 3-37 shows a DC DVM display of the + or- input voltage. In the DC mode, the voltage response to frequencies above 50 Hz attenuates at least 20 dB.
04) 285.7750 MHz MONITORFM -30 DBM INPUT LEVEL 2.94 mV
03.0 PCT
DVM MODE l) AC VOLTS 2) DC VOLTS 3) DISTORTION ANT
DIST/ SINAD 30.5 DB
MODE SEL) 3
BAT ll.O V ATTEN) 0
FIGURE 3-38. DISTORTION ANALYZER DISPLAY
Figures 3-38 and 3-12 show displays for the DISTORTION mode which automatically measures fixed frequency (l KHz) EIA Sinad/ Distortion in the generate or monitor function. Select mode 3 to obtain measurements.
EXT WATTMETER l) 2.5 2) 5 4) 25 5) 50 7) 250 8) 500
ELEMENT NO.5 3) 10 6) 100 9) 1000
FWD WATTS 1.25
REV WATTS 2.5
0.25
2.5 ANT ATTEN)O
FIGURE 3-39. EXTERNAL WATTMETER DISPLAY
• EXTERNAL WATTMETER
'--.,./
To measure forward and reflected antenna power, connect Motorola's wattmeter (series ST-1200) with the front panel phone jack input. The accessories include a wattmeter adapter (RTL-4055B) to accept the external elements. Figure 3-39 shows the External Wattmeter DISPLAY. Select an entry from one to nine to obtain the appropriate element power range. The CRT displays the nonranging digital reading for the detected power flowing in the forward direction. The bargraph responds logarithmically in proportion to the forward wattmeter reading on a full scale equal to the wattage range of the selected element. The detected power flowing in the reverse direction displays similarily. The Analyzer contributes not more than ± 2.50Jo of reading to the readout error for power levels greater than 10% of full scale. Table 3-12 describes the external wattmeter elements.
3-19
Maximum "N" Type "UHF" Type Frequency Power Connector Connector
(MHZ) (Watts) Model Model
2-30 250 ST-1296 2-30 2500** ST-1299
25-60 5 ST-12808 ST-12818 25-60 10 ST-12858 ST-12848
50-125 5 ST-12838 ST-12828 50-125 10 ST-12868 ST-12878
25-100 25 ST-12048 ST-12448 25-100 50 ST-1205B ST-1245B 25-100 100 ST-12068 ST-12468 25-100 250 ST-12078 ST-12478 25-100 5oo•••• ST-12088 ST-12488
100-250 5 ST-12128 ST-12528 100-250 10 ST-12138 ST-12538 100-250 25 ST-12148 ST-12548 100-250 50 ST-12158 ST-12558 100-250 100 ST-12168 ST-12568 100-250 250 ST-12178 ST-12578 100-250 5oo•••• ST-12188 ST-12588
200-250 2.5 ST-12218 ST-12618 200-550 5 ST-12228 ST-12628 200-550 10 ST-12238 ST-12638 200-550 25 ST-12248 ST-12648 200-550 50 ST-12258 ST-12658 200-550 100 ST-12268 ST-12668 200-550 250 ST-12278 ST-12678 200-550 500**** ST-12288 ST-12688
500-1000 2.5 ST-12318* ST-12718 500-1000 5 ST-12328* ST-12728 500-1000 10 ST-12338* ST-12738 500-1000 25 ST-12348* ST-12748 500-1000 50 ST-12358* ST-12758 500-1000 100 ST-12368* ST-12768 500-1000 250*** ST-12378* ST-12778 500-1000 500••• ST-12388* ST-12788
•, The N type connector is recommended for best accuracy in the 500-1000 MHz frequency range.
•• Calibrated at 1000 W, but useable to 2500 W. ••• Calibrated at 125 W, useable to full scale.
•••• Calibrated at 250 W, useable to full scale.
TABLE 3-12. EXTERNAL WATTMETER ELEMENTS
• INTERMEDIATE FREQUENCY (IF) MODE
The Analyzer's IF envelope displays on the CRT when the IF mode is selected. Use the IF mode to qualitatively and quantitatively assess a transmitter's amplitude modulation envelope.
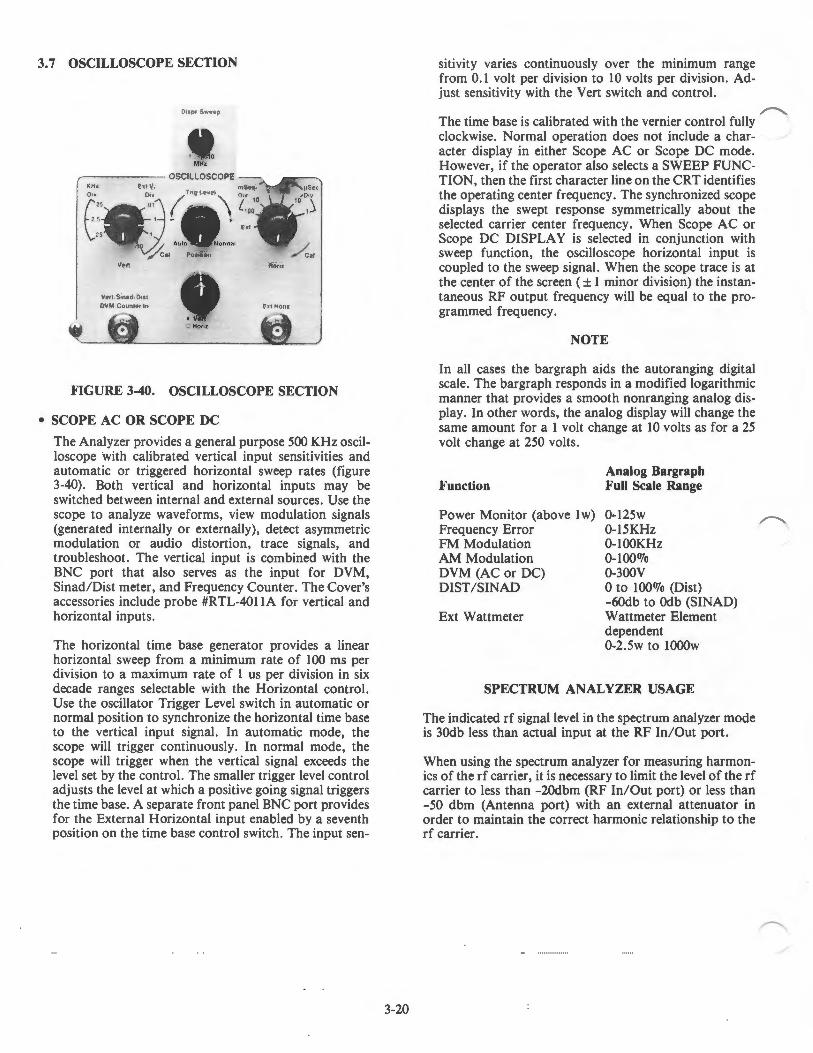
3. 7 OSCILLOSCOPE SECTION
Otspr Sweep
~------ OSCILLOSCOPE KHz Ext V
Vett
Vert Sm.-d Otsl DVM Countetln
Honz
E~t Honz
FIGURE 3-40. OSCILLOSCOPE SECTION
• SCOPE AC OR SCOPE DC
The Analyzer provides a general purpose 500 KHz oscilloscope with calibrated vertical input sensitivities and automatic or triggered horizontal sweep rates (figure 3-40). Both vertical and horizontal inputs may be switched between internal and external sources. Use the scope to analyze waveforms, view modulation signals (generated internally or externally), detect asymmetric modulation or audio distortion, trace signals, and troubleshoot. The vertical input is combined with the BNC port that also serves as the input for DVM, Sinad/ Dist meter, and Frequency Counter. The Cover's accessories include probe #RTL-4011A for vertical and horizontal inputs.
The horizontal time base generator provides a linear horizontal sweep from a minimum rate of 100 ms per division to a maximum rate of 1 us per division in six decade ranges selectable with the Horizontal control. Use the oscillator Trigger Level switch in automatic or normal position to synchronize the horizontal time base to the vertical input signal. In automatic mode, the scope will trigger continuously. In normal mode, the scope will trigger when the vertical signal exceeds the level set by the control. The smaller trigger level control adjusts the level at which a positive going signal triggers the time base. A separate front panel BNC port provides for the External Horizontal input enabled by a seventh position on the time base control switch. The input sen-
3-20
Sitivlty varies continuously over the minimum range from 0.1 volt per division to 10 volts per division. Adjust sensitivity with the Vert switch and control.
The time base is calibrated with the vernier control fully ~ clockwise. Normal operation does not include a char-acter display in either Scope AC or Scope DC mode. However, if the operator also selects a SWEEP FUNCTION, then the first character line on the CRT identifies the operating center frequency. The synchronized scope displays the swept response symmetrically about the selected carrier center frequency . When Scope AC or Scope DC DISPLAY is selected in conjunction with sweep function, the oscilloscope horizontal input is coupled to the sweep signal. When the scope trace is at the center of the screen ( ± 1 minor division) the instantaneous RF output frequency will be equal to the programmed frequency.
NOTE
In all cases the bargraph aids the autoranging digital scale. The bargraph responds in a modified logarithmic manner that provides a smooth nonranging analog display. In other words, the analog display will change the same amount for a 1 volt change at 10 volts as for a 25 volt change at 250 volts.
Function
Power Monitor (above 1 w) Frequency Error FM Modulation AM Modulation DVM (AC or DC) DIST/SINAD
Ext Wattmeter
Analog Bargraph Full Scale Range
0·125w 0-15KHz 0-100KHz 0-100o/o 0-300V 0 to 100% (Dist) -60db to Odb (SINAD) Wattmeter Element dependent 0-2.5w to 1000w
SPECTRUM ANALYZER USAGE
The indicated rf signal level in the spectrum analyzer mode is 30db less than actual input at the RF In/Out port.
When using the spectrum analyzer for measuring harmonics of the rf carrier, it is necessary to limit the level of the rf carrier to less than -20dbm (RF In/Out port) or less than - 50 dbm (Antenna port) with an external attenuator in order to maintain the correct harmonic relationship to the rf carrier.
.~
...
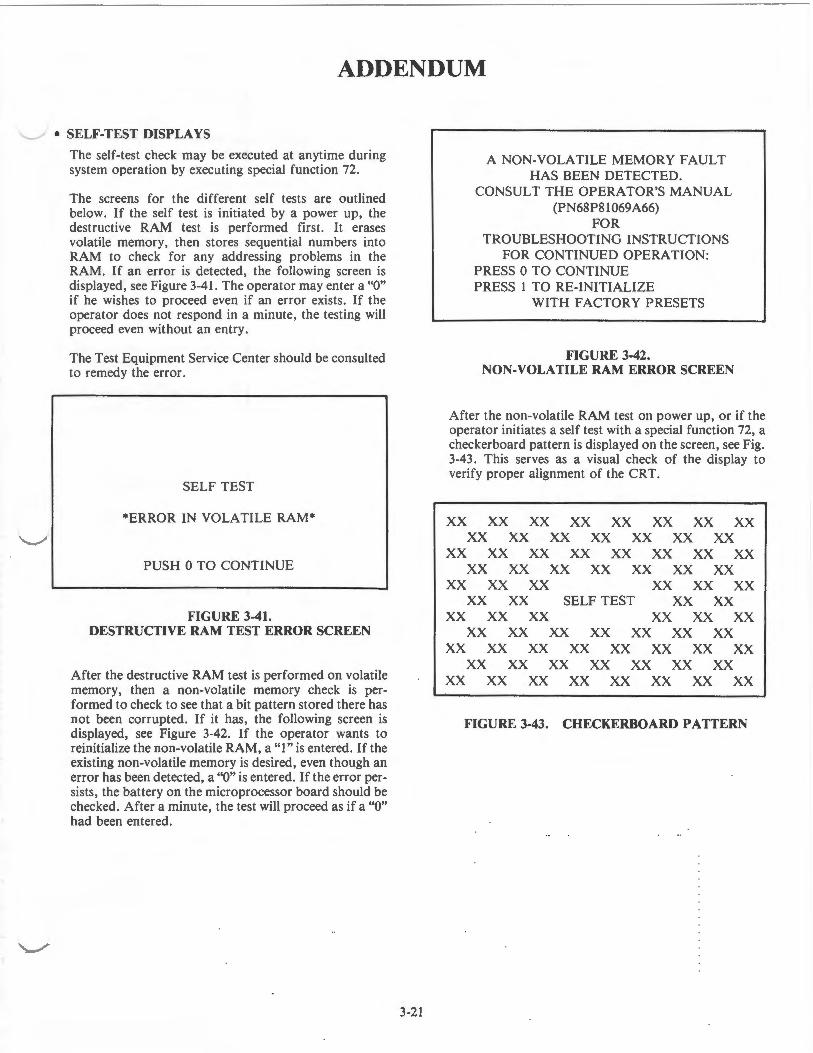
ADDENDUM
'-.._../ • SELF-TEST DISPLAYS
'-..__/
The self-test check may be executed at anytime during system operation by executing special function 72.
The screens for the different self tests are outlined below. If the self test is initiated by a power up, the destructive RAM test is performed first. It erases volatile memory, then stores sequential numbers into RAM to check for any addressing problems in the RAM. If an error is detected, the following screen is displayed, see Figure 3-41. The operator may enter a "0" if he wishes to proceed even if an error exists. If the operator does not respond in a minute, the testing will proceed even without an entry.
The Test Equipment Service Center should be consulted to remedy the error.
SELF TEST
*ERROR IN VOLATILE RAM*
PUSH 0 TO CONTINUE
FIGURE 3-41. DESTRUCTIVE RAM TEST ERROR SCREEN
After the destructive RAM test is performed on volatile memory, then a non-volatile memory check is performed to check to see that a bit pattern stored there has not been corrupted. If it has, the following screen is displayed, see Figure 3-42. If the operator wants to reinitialize the non-volatile RAM, a "1" is entered. If the existing non-volatile memory is desired, even though an error has been detected, a "0" is entered. If the error persists, the battery on the microprocessor board should be checked. After a minute, the test will proceed as if a "0" had been entered.
3-21
A NON-VOLATILE MEMORY FAULT HAS BEEN DETECTED.
CONSULT THE OPERATOR'S MANUAL (PN68P81069A66)
FOR TROUBLESHOOTING INSTRUCTIONS
FOR CONTINUED OPERATION: PRESS 0 TO CONTINUE PRESS I TO RE-INITIALIZE
WITH FACTORY PRESETS
FIGURE 3-42. NON-VOLATILE RAM ERROR SCREEN
After the non-volatile RAM test on power up, or if the operator initiates a self test with a special function 72, a checkerboard pattern is displayed on the screen, see Fig. 3-43. This serves as a visual check of the display to verify proper alignment of the CRT.
XX XX XX XX XX XX XX XX XX XX XX XX XX XX XX
XX XX XX XX XX XX XX XX XX XX XX XX XX XX XX
XX XX XX XX XX XX XX XX SELF TEST XX XX
XX XX XX XX XX XX XX XX XX XX XX XX XX
XX XX XX XX XX XX XX XX XX XX XX XX XX XX XX
XX XX XX XX XX XX XX XX
FIGURE 3-43. CHECKERBOARD PATTERN

A non destructive RAM test is performed that stores known characters to each RAM location. The value is read back and verified. The original value is finally replaced. If an error is detected, the following display is shown; see Fig. 3-44. The operator may enter a "0" to continue the self test. Otherwise, the test resumes automatically after about a minute.
SELF TEST COMPLETE
*ERROR IN VOLATILE RAM*
PUSH 0 TO CONTINUE
FIGURE 3-44. NON-DESTRUCTIVE RAM TEST ERROR
Next, a checksum check is performed to verify that the PROM program has not changed. The error screen for this type of error is shown in Fig. 3-45. If a checksum error is detected in an PROM device, then an alphanumeric specifier identifies the socket it is in. M l identifies the PROM device in the leftmost socket on the microprocessor board, M2 the 2nd from the left, M3 the 3rd from the left, and so on. The operator can enter a "0" to allow testing to proceed. If no entry is made in a minute, the test will proceed automatically.
3-22
SELF TEST COMPLETE
*CHECKSUM ERROR IN ROM* ROM NUMBER
Ml M2 M3 M4 M5
PUSH 0 TO CONTINUE
FIGURE 3-45. CHECKSUM ERROR SCREEN
NOTE
If a non-destructive RAM error and checksum error are both detected, then they appear on the same screen.
The testing is completed with a final checkerboard pattern with a "SELF TEST COMPLETED" message.
~
~
~

...___. 4.0 SERVICE SHOP SETUPS
SECTION 4 APPLICATIONS
This section of the manual guides troubleshooting, diagnosing, and adjusting communications equipment ranging from pocket pagers to repeaters. It contains information on how to connect equipment under test to the R-20010 Analyzer and how to set controls and indicators to obtain the anticipated CRT display. Maintain a permanent written log of all measurements and information important to your operation.
CAUTION
These are typical applications and are not all-inclusive. Not every test works with every transceiver. Motorola takes no responsibility for their accuracy, applicability, or safety. Always refer to your own transceiver's service manual for recommended test methods and specifications.
The Analyzer's DVM input is unbalanced (ground referenced). Use an appropriate interface to measure balanced circuits, such as certain receiver audio outputs or telephone lines.
4-1

®MOTOROLA
••
RECEIVER SENSITIVITY TEST 12 DB SINAD
COJIIIJIIIUIICATIOI$ USJ[JIIIUALTlU
AUDIO DISTORTION
@J00C!l @]GJ0~
0~00
POWER On
@st•ndby DeOU
i .... AC
OvenReildy
RfScan
r-----.,.,----- RF SECTION--- '~'~''-0 @Antoooo CA~~~~ 0'"• ""'"' .,.,,.,. t~~•:@'§'~ /@''~'""" r©\ ~~~~."
•lntenstty
@ ·q· MH<
IIPUT 25 0 ' f I 0 I\ ... 0 ,) PCIWEII - + 25 1 ht
)--DUPLEX GEN O to // A~o~to NOfmet - - ~ ®On "/Col p,.,,_ /c 011 _______ _] "'
RFin 'Ovl /
"'
@ Output
@CAUTION
DDIGT IIPUT
MIWEI
E•tWettmeter
~ CAUTION
1ZSWIIAX
®
Vert/StnadtDIII DVM/Co~omter In E•tHonr
© • Vert O Hortl e ~
DISPLAY FUNCTION r MODULATION Q Gen MonMir ®Generate @ Cont Q ModullltOn 011
Q Spect Analyter Mom tor Burtt 8 Duple• Get~ RFMemory
0 St9nehngSeq Code Synth Mode
0 FreqC01.1nter 0FM 0 PLIDPL
0 DVM DIST Ocw Q PLIOPlln'f
0 £11 WeUmeter 0 AM Q Tone A
0" Q SSB ,OSBSC 0 ToneS
Q ScopeAC Q SWP 1· 10MHz 0 Tone Seq
Q ScoJMOC 0 SWP .01 · 1 MHz 0 Tone Remote
@]@] @]@] §]@] MONITOR
Squelch Volume Code Synlh L•l E•t Level
o··o'Q Ott M••
0 0 Mtn Ofl
lrn•ge Dpll BW ~~
~~0~ OernodOul BFO Mod Oul Eat Mod In
© 0 ® ©
nANT SPEAKER
MOBILE RECEIVER
FUNCTION GENERATE FM .. ) PL) 100.0
DIGITAL DIST READING RF LEVEL
50000 MHZ FREQUENCY DPL) . . . DPL CODE
RF OUTPUT LEVEL
ANALOG SINAD INDICATOR
lOOOuV -47.0 DBM 5.0 PCT DIST/ SINAD 26.0 DB
-60 0
NEG DEVIATION -3.0 DEV KHZ +3.0
-100 0 + 100
DIGITAL SIN AD OR DISTORTION READING
POS DEVIATION
ANALOG DEVIATION INDICATOR
FIGURE 4-1. 12 DB SINAD TEST SETUP AND DISPLAY 4-2
~
r'\
~

'-.../
---./
RECEIVER SENSITIVITY TEST 12 DB SINAD
AUDIO DISTORTION
Use the R-20010 signal generator and SINAD meter to measure a receiver's performance by the following procedure:
1. As shown in figure 4-1, connect the Analyzer's RF In/ Out to the antenna connector of the receiver under test. Connect the Analyzer's Vert/ Sinad/ Dist to the receiver's audio output. Disable all PL's and open the Squelch .
2. Set DISPLAY to Gen/ Mon Mtr mode. Select a FUNCTION and set the FUNCTION switch to Generate.
3. Select the RF carrier frequency from an RF Memory table channel number or enter directly from the keypad.
4. Adjust 1KHz Level control for 600Jo of rated deviation as indicated on the CRT. To prevent spurious noise modulation, set MODULATION switch to Off and Ext Level control to Off.
a. With a lOOOuV RF input level, adjust the volume control to rated audio power output. EIA RS-204-C specifies that the receiver be set to produce rated audio power before measuring 12dB SINAD.
b. Read % distortion directly from the DIST / SIN AD scale.
5. Set RF Step attenuator to -llOdB and the variable control to mid-range. The display's RF LEVEL should indicate about 2uV. Adjust the attenuator (IOdB steps) and the variable RF control until a 12dB SINAD reading appears on the display.
6. From the RF LEVEL on the display, read the receiver's 12dB SINAD sensitivity in uV and dBM.
4-3

..
® MOTOROLA CIIMMUIICATIOIS SllUMlUlflU
RECEIVER SENSITIVITY TEST 20 DB QUIETING
""'
@]00[!] @]~ITJ0
0~0r:B elnleniiiW
@ ·g
POWER On
@st~mdby De Off
i .... At
0¥enReldy
RF Scan
DISPLAY 0 Gen MonMtr
Q Modulal1on
0 S~t An.lyut 8 OupteaGan RFMemory
0 Stgnahng Seq
Q freqCo~o~nler Q DVM OIST
Q EatWaltmatar
0" Q Scope:AC
Q SeopaOC
@] @] MONITOR
FUNCTION MODULATION
~Generate @ C0t1t 011
Mom tor lturll
Code Synlh Mode
QFM 0 PLIOPL
Ocw Q Pl/OPllnw
0 AM Q Tone A
Q SSI!I rOSBSC 0 ToneB
Q SWP 1· 10 MHz 0 Tone Seq
0 SWP .01 ·1 Ml'h: 0 Tone A emote
@]@] @]@] ,-----,.,-----RF SECTION____ ~'~"00" 0 @ ....... CA~~~ 0'"• """'' ........ E::©·§·~~ ft@'"•'"''" 2:·:©; ~~~~· ~ Sq~al<: h Volume lcode Synlhlvl Eat level
NIPMT 25 0 I - 0 I\ .. 0 I
POWU 25 E.t
0 I
DUPLEX GEN 10 // Aulo Normet ~On /Col p0.,,~ /c,, OI,O''o' Q .. J M •• O OliO '"'•9• Dpla OW
~ Moo Mu Yo"
Off ( RF ln /Oul
"""'
© Hoghft Wodo~
Low~ Narfow 'l::f"
Output
© CAUTIOM
DOIDT IIPUT rowu
Eat Wattmeter CAUTIOM
(9) IUW lUI
®
vart/StnadiD••t DVM/CO\Interln
0 ~ • Vert O Hortl
EatHont
© Oe"'odOul BFO
© 0
nANT SPEAKER
MOBILE RECEIVER
GENERATE FM PL .. .
00) 150.000 MHZ DPL ...
RF LEVEL 0.50uV -117.0 DBM
VAC
0 300 DVM MODE MODE SEL)I
I AC VOLTS 2 DC VOLTS 3 DISTORTION
FIGURE 4-2. 20 DB QUIETING TEST SETUP AND DISPLAY
4-4
(Q)~
'"0 011
Mod Out Ell Mod In
~ ©
II /'
~
~
./
\.._/
·~
RECEIVER SENSITIVITY TEST 20 DB QUIETING
1. Connect the Analyzer to the receiver under test, as shown in Figure 4-2. Set DISPLAY to DVM/ DIST, FUNCTION switch to Monitor and select FM or CW FUNCTION .
2. Turn on the receiver (unsquelched) and turn up the receiver audio gain to feed audio noise to the Analyzer (at least 1 I 4 rated audio power). Read the audio noise voltage fed to the Analyzer. Note the noise reading (REF) in dBm.
3. Set FUNCTION switch to Generate. With all modulation off, adjust RF LEVEL until display reads 20 dB less than REF above (O.lOX the REF Voltage).
4. Read the RF LEVEL reading required to produce 20 dB quieting in uV (left side) and dBm (right side) on the CRT screen.
4-5
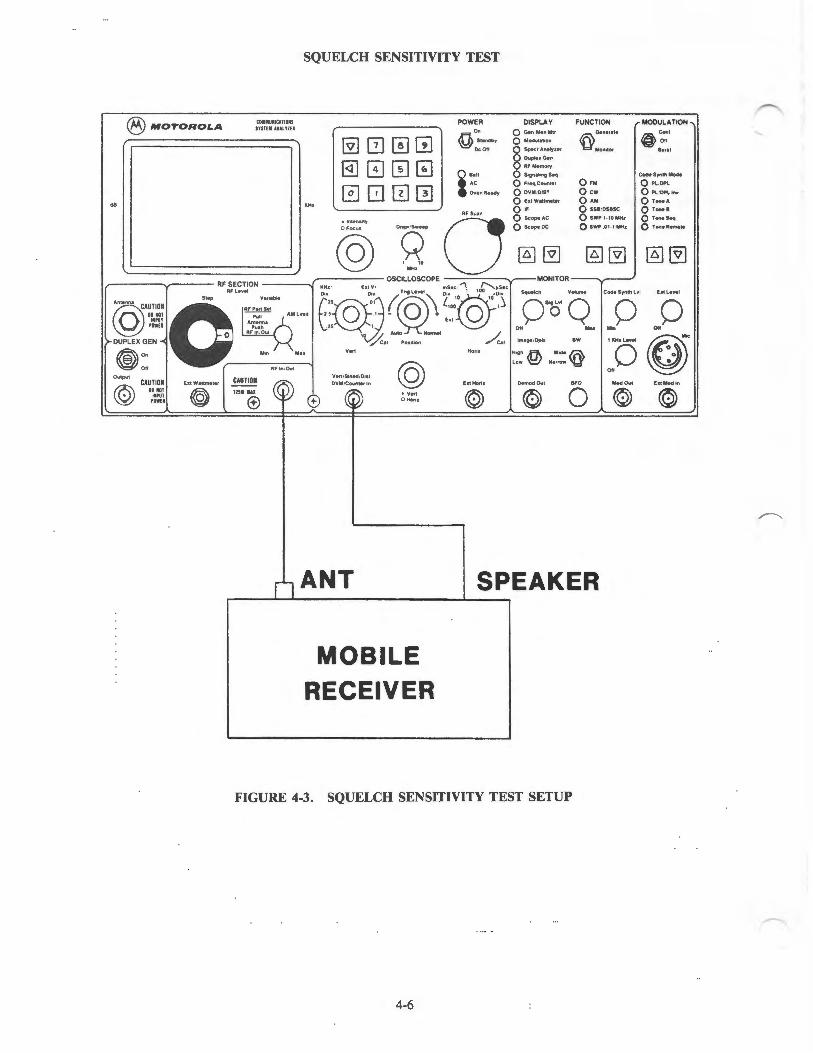
SQUELCH SENSITIVITY TEST
®MOTOROLA
..
COJIIIIUitCATIDIS SfSHIAIAlUU
,------v---- RF SECTION RF Level
""'
@][2]0[!] @]00~ 0000
~A~~~i O Step I"' :::~:~• AMLomot
~ POWEl A~':,":• DUPLEX GEN O RF tn!Out
~On M,.· Mu
r:::gjl 011 ( AF In/Out @ Output
© CAUTION
DO lOT tlrUT
POWU
EatWet1meter CAUTION
@ mw •.n
® OVM/Counter In
~ • Vert O Hortt e
nANT
MOBILE RECEIVER
POWER 0"
ft Stendby
'&J OcOtl
i .... AC
Oven Ready
""
EaiHOtil
©
DISPLAY
Demod Out
©
FUNCTION
Generete
~MOnitOr
0FM 0 cw 0 AM
Q SSIItDSIISC
0 SWP 1· 10 MHa
0 SWP .01 · 1 MHa
~@]
BFO Mod Out
0 ©
SPEAKER
FIGURE 4-3. SQUELCH SENSITIVITY TEST SETUP
4-6
MODULATION
a_ Coni
~Ott Burst
Code Synth Mode
0 PLtDPL
0 PL IOPli!W
0 Tone A
O Tone a Q Tone Seq
0 ToneAemote
~@]
El!Mocltn
©
~
...----....
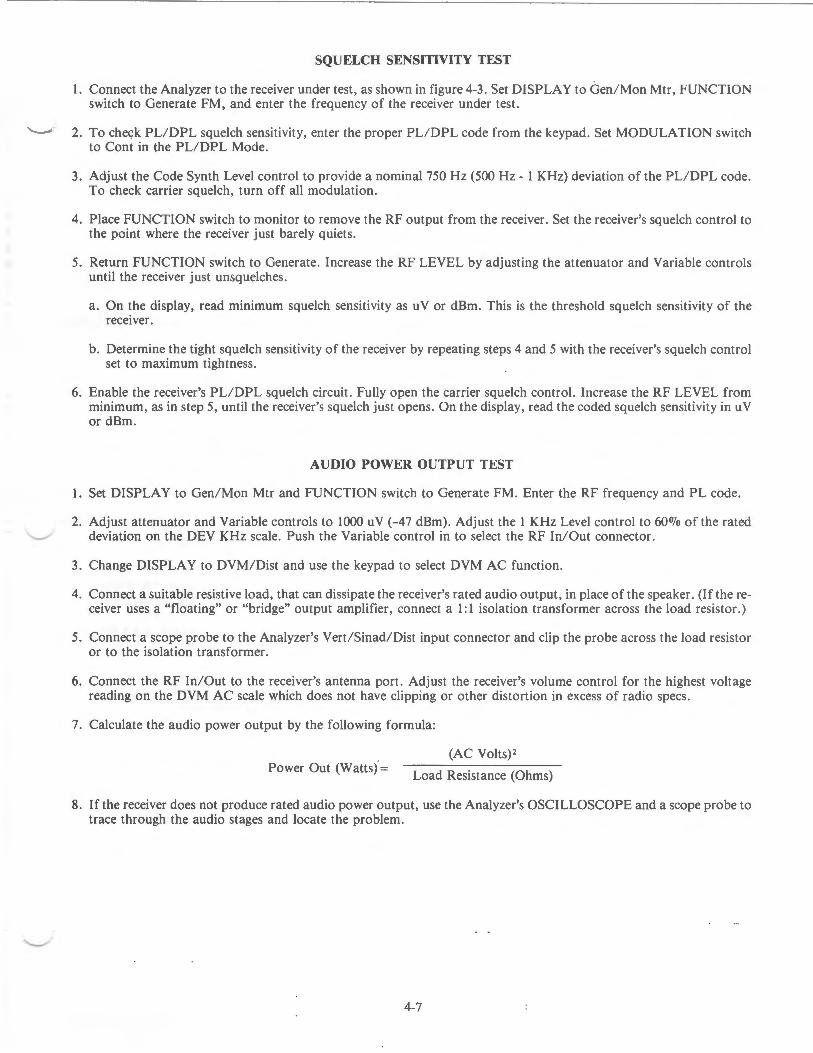
SQUELCH SENSITIVITY TEST
1. Connect the Analyzer to the receiver under test, as shown in figure 4-3. Set DISPLAY to Gen/ Mon Mtr, FUNCTION switch to Generate FM, and enter the frequency of the receiver under test.
'----"' 2. To check PLIDPL squelch sensitivity, enter the proper PLIDPL code from the keypad. Set MODULATION switch
'--....--'
to Cont in the PLIDPL Mode.
3. Adjust the Code Synth Level control to provide a nominal 750Hz (500Hz- 1 KHz) deviation of the PL/DPL code. To check carrier squelch, turn off all modulation.
4. Place FUNCTION switch to monitor to remove the RF output from the receiver. Set the receiver's squelch control to the point where the receiver just barely quiets.
5. Return FUNCTION switch to Generate. Increase the RF LEVEL by adjusting the attenuator and Variable controls until the receiver just unsquelches.
a. On the display, read minimum squelch sensitivity as uV or dBm. This is the threshold squelch sensitivity of the receiver.
b. Determine the tight squelch sensitivity of the receiver by repeating steps 4 and 5 with the receiver's squelch control set to maximum tightness .
6. Enable the receiver's PL/ DPL squelch circuit. Fully open the carrier squelch control. Increase the RF LEVEL from minimum, as in step 5, until the receiver's squelch just opens. On the display, read the coded squelch sensitivity in uV or dBm.
1.
2.
3.
4.
5.
6.
7.
AUDIO POWER OUTPUT TEST
Set DISPLAY to Gen/ Mon Mtr and FUNCTION switch to Generate FM. Enter the RF frequency and PL code.
Adjust attenuator and Variable controls to 1000 uV (-47 dBm). Adjust the 1 KHz Level control to 60% of the rated deviation on the DEY KHz scale. Push the Variable control in to select the RF In/ Out connector.
Change DISPLAY to DVM/ Dist and use the keypad to select DVM AC function.
Connect a suitable resistive load, that can dissipate the receiver's rated audio output, in place of the speaker. (If thereceiver uses a "floating" or "bridge" output amplifier, connect a 1:1 isolation transformer across the load resistor.)
Connect a scope probe to the Analyzer's Vert/ Sinad/ Dist input connector and clip the probe across the load resistor or to the isolation transformer.
Connect the RF In/ Out to the receiver's antenna port. Adjust the receiver's volume control for the highest voltage reading on the DVM AC scale which does not have clipping or other distortion in excess of radio specs.
Calculate the audio power output by the following formula:
(AC Volts)2 Power Out (Watts)·=
Load Resistance (Ohms)
8. If the receiver does not produce rated audio power output, use the Analyzer's OSCILLOSCOPE and a scope probe to trace through the audio stages and locate the problem.
4-7
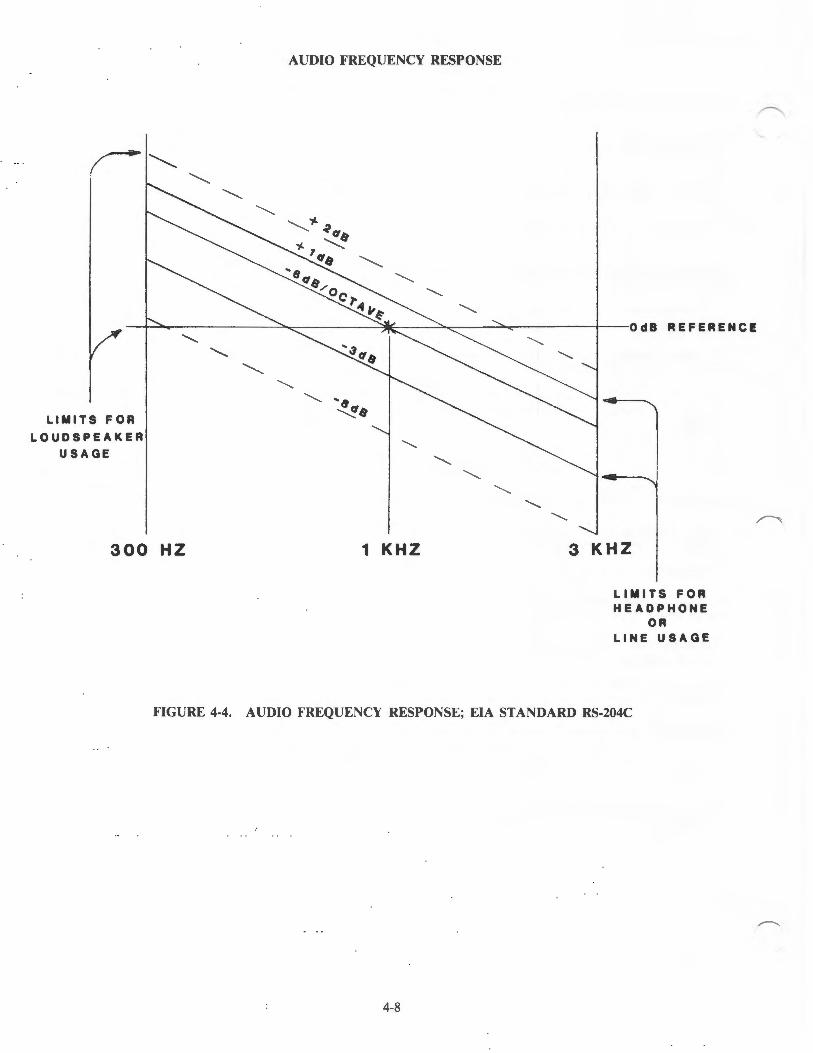
AUDIO FREQUENCY RESPONSE
fl''" '-.....
'-.....
~ ..............
............
I '"• ......_....,. "'jj(. .....,_ <::: "'> < I 0 dB REFER EN C I!
LIMITS FOR
LOUDSPEAKER
USAGE
..........
300 HZ
............
"--.. ............
............
..............
1 KHZ
............
..............
............
............ ..........
3 KHZ
LIMITS FOR HEADPHONE
OR LINE USAGE
FIGURE 4-4. AUDIO FREQUENCY RESPONSE; EIA STANDARD RS-204C
4-8
~
~
~
"-.__..,.
1.
2.
3.
4.
5.
AUDIO FREQUENCY RESPONSE
Use the keypad to enter the frequency and PL/ DPL code (if any) of the receiver under test.
Set FUNCTION to Generate FM, attenuator and Variable level controls to 1000 uV (-47 dBm).
Select tone memory display and set Tone A to 1000Hz. Set MODULATION switch to Cont, Code Synthesizer Mode to Tone A, and change DISPLAY to Gen/ Mon Mtr.
Adjust the Code Synth Level control for 200fo of rated deviation on the DEY KHZ scale, for example: 1 KHz in a 5KHz system. Change DISPLAY to DVM/ Dist and select DVM AC function.
Connect the Analyzer's RF In/Out out to the receiver's antenna port. Push the Variable control in to select the RF In/Out connector. Connect the Vert/ Sinad/ Dist input connector to the receiver's speaker output, using a scope probe. If the speaker is "floating", use an isolation transformer to avoid shorting the output stage.
6. Adjust the receiver's volume control to obtain a reference level reading on the AC volts scale which is free of clipping at any frequency within the 300 to 3,000 Hz band. Note this reading in dBm as the reference value.
7. Refer to the audio response curve in the receiver's Service Manual. Change the Tone A frequency on the tone memory screen to the value for each point on the curve to be measured.
8. Maintain FM deviation at 20% of the rated deviation, as set in step 4. Change DISPLAY to DVM AC and read the audio level at this frequency. Note this audio level. Repeat this step for each frequency tested.
9. EIA RS-204C specifies the frequency response for NBFM receivers over the range of 300 to 3000 Hz as follows :
a. Audio response for receivers using loud-speakers shall not vary more than + 2 dB or -8 dB from a standard 6 dB per octave curve, with reference taken as 1000 Hz.
b. Audio response for receivers using either headphones or telephones lines shall not vary more than + 1 dB or -3 dB from a standard 6 dB per octave curve, with reference taken at 1000 Hz.
~ 10. Add or subtract the 1KHz reference value from each reading taken in step 7. Plot the resulting values on a curve and
'-.__../
compare them with the 6 dB per octave curve in your receiver's Service Manual or with the standard EIA specification RS-204C, as shown in figure 4-4.
MODULATION ACCEPTANCE BANDWIDTH
1. Perform the 12 dB SINAD Sensitivity Test with the Analyzer in the same setup as shown in figure 4-l. Note: It is necessary to perform this test with the volume control set to 10% of rated audio output.
2. Increase the RF output level 6 dB above the 12 dB SINAD level, to double the voltage. For example, 0.35 uV increased 6 dB=0.7 uV.
3. Turn the 1 KHz Level control clockwise to increase the deviation until the SINAD level returns to 12 dB . Read the amount of deviation on the display as the modulation acceptance bandwidth of the receiver.
4. A typical modulation acceptance value for a receiver is 7 KHz. Refer to the specification for the specific receiver under test. Any loss of modulation acceptance bandwidth indicates improper alignment or a component failure in a receiver's IF circuit.
4-9

®MOTOROLA
..
RF PRESELECTOR SHAPE & BANDWIDTH
COIIIIU.ICATIO•s SUTEI UALUEII
@1[£]0[!] @]GJ0~ 0000
POWER
0" ft Standby
~Oc Oll
i "'" AC
0¥enAeady
''"""'"' 0"''"" @O F~•• 7:)'
' 10
--- MH<
DISPLAY Q Gen MonMtr
Q Modulahon
Q SpectAnatyrer 8 Ouple•Gen RfMemory
0 SrgnahngSeq
Q FreqCounter
0 0\I M DIST
Q Eat WaUmeter
0" Q ScopeAC
Q Scope DC
@]@] MONITOR
FUNCTION r MODULATION <Q)Gene,.te @ Co"!
ott
Morutor Burst
Code S1nth Mode
0FM 0 PLOPL
Ocw 0 Pl OPllnw
0 AM Q Tone A
Q SSB DSBSC O ToneB
Q SWP t -10 MHr O Tone Seq
0 SWP 01 · 1MHr 0 Tone Remote
@]@] ~@]
Squelch
RF SECTION { OSCILLOSCOPE ----.,----
"""" E~7.:rst·§·~~ 0~, ... , .... ~ 2::©; ·~~~~, Volume lcode SynthL.-t E•tlenl Varrabte
RFPOf1Set
Pull Antenna
P~otth RF in Ovt
AMLtmtl @AUTIO~ 5100
DUPLEXG:il 0 ~0" Mo"· M"
~CHI ( ---.-,"-10.-l-~ Ovtpvl
© CAUTIOM
oo•or I.,UT ,DWU
htWat1meter CAUTIOM
~ 1l5W Ul
® e
r - - - - - - - - - - - · - -
L---
· 0·-0· 0 25 I ht
10 // Ar.IIO NOfmat /
CH.o··a· Q .. l M."O CH.O '/Cel Potrllon / Cel lmege Opla OW
Vort
YertiS•ned 'DI•t DVM!CCM~nterln
®
'"'' • c.
@ . ..,., O Hom
.....
HOrtl
E•tHom
©
Htgh ft_ Wide fro lO'Jf ~ NeffOW 'Y'
OemodOul OFO
© 0
INJECTION FREQ SIGNAL
U.lfltl (lf SIGIIAU ,_trlfOOYiflO rtH1N '"'JfCrtONHfiOUINCY SIGMAt
0 I I ' I I I I k"' I
510 I
I I I I
·-,:c. .• , i I
' I ' I ' ---------- ___ J
©)<
'"0 CHI Mod Out
©
1-F SIGNAL
htModln
©
c .,
w I:D 0 a: a. LL. ~
.... 0 • ..J 1-~
' )
y
FIGURE 4-5. PROBE SETUP
4-10
~
r-.....

RF PRESELECTOR SHAPE & BANDWIDTH
Use this test to insure proper preselector alignment for multi-frequency receivers. Tune the preselector for greater rejection of an interfering frequency from nearby transmitters.
"---~ 1. Connect the Analyzer's RF In/ Out to the antenna connector of the receiver under test. Connect the Analyzer's
"--/
Vert/ Sinad/ Dist to the RF probe. Connect the probe to the first available low impedance point following the preselector, as shown in figure 4-5.
2. Disable the receiver's mixer injection.
3. Set DISPLAY to Scope DC, FUNCTION to SWP 1-10 MHz with switch in Generate, and Dispr/ Sweep control fully clockwise to 10 MHz.
4. Enter the proper receiver frequency.
5. Set RF Step attenuator to OdB and RF Variable control to mid-range.
6. Use the OSCILLOSCOPE Vertical control to move the horizontal sweep line to the bottom of the graticule. Set the Ext V / Div control to 0.01 and its inner knob fully clockwise to Cal position.
7. Adjust the RF output level to produce a CRT display at the lowest readable level to minimize the possibility of overloading the circuits being tested.
8. The 3db (. 707 of peak) and 6db (.50 of peak) bandwidth points can be checked. Each major horizontal division corresponds to 1 MHz with dispersion control fully clockwise and to .1 MHz with dispersion control fully counterclockwise. The response should be checked for uniformity and symmetry. Tuning adjustments can be made accordingly.
4-11

RECEIVER FREQUENCY ADJUSTMENT
r---..
®MOTOROLA COMM ll l lt.UIOIS POWER DISPLAY FUNCTION MODULATION SJSTEIAIALUE R 0" Q GenMonMtr ~Generate @ Coni
@] 0 0[!} @standb~ O Modutahon 011 OcOII Q Spec! Analy zer Mon•tor BufSI
@] GJ 0~ 8 Duple:r:Gen
RF Memoty . .... 0 Stgnahng 54-q Code Synth Mode
0 0 0ITJ AC Q FreqCounter 0 ' " Q PL OPL
OvenReildy 0 DVM OIST O cw Q PLOPllnv
Q Ex tWan meter 0 •• Q Tone A .. KH• 0 " Q SSB/DSBSC 0 ToneB
RFSun
• lntenloly
0 Q Scope AC 0 SWPI · IOMHr 0 Tone Seq
O Focus D•spr Sweep Q ScopeOC 0 S WP .Ot - IMH :r: 0 Tone Remote
@ Q @] @] g)@] §]@] ' " ""'
RF SECTION OSCILLOSCOPE MONITOR
I(Hr E1t Vi mSec ; lO~IlS.c Rf Leve l
t~_C@~~:7~ Squelch Volume Code Synth l vl E:r:tlevel
Antenna CAUTION Step V1uabte o··o'Q 0 0 0 ~
tO lOT Pull AM L1m11
IIPUT Antenn• POWU Puth Oft Mu " '" Cll•
Afln 0\lt
©5 )-DUPLE X GEN -< lm1ge Opl :r: BW IKH:r: Lewel
® 0" ·~ ... .. " HOrtl Htgh @ Wode @ 0
@ Low Narrow
ou Afln /0111 Cll• Output Vert /Sin•d l01tl
©CAUTION e.•w• n mel er CAUTION
@ OVM/Counter In Elt Horu Oemod Out BFO Mod Out h i Mod In
DDIOT (9) 12SW MAl
© • Vert © © 0 © © IIPUT e e PDWU O Hom:
A.
r---..
ro-' PICK UP LOOP
I' \
COAX CABLE
UNIT UNDER TEST
FIGURE 4-6. FREQUENCY ADJUSTMENT SETUP ~
4-12
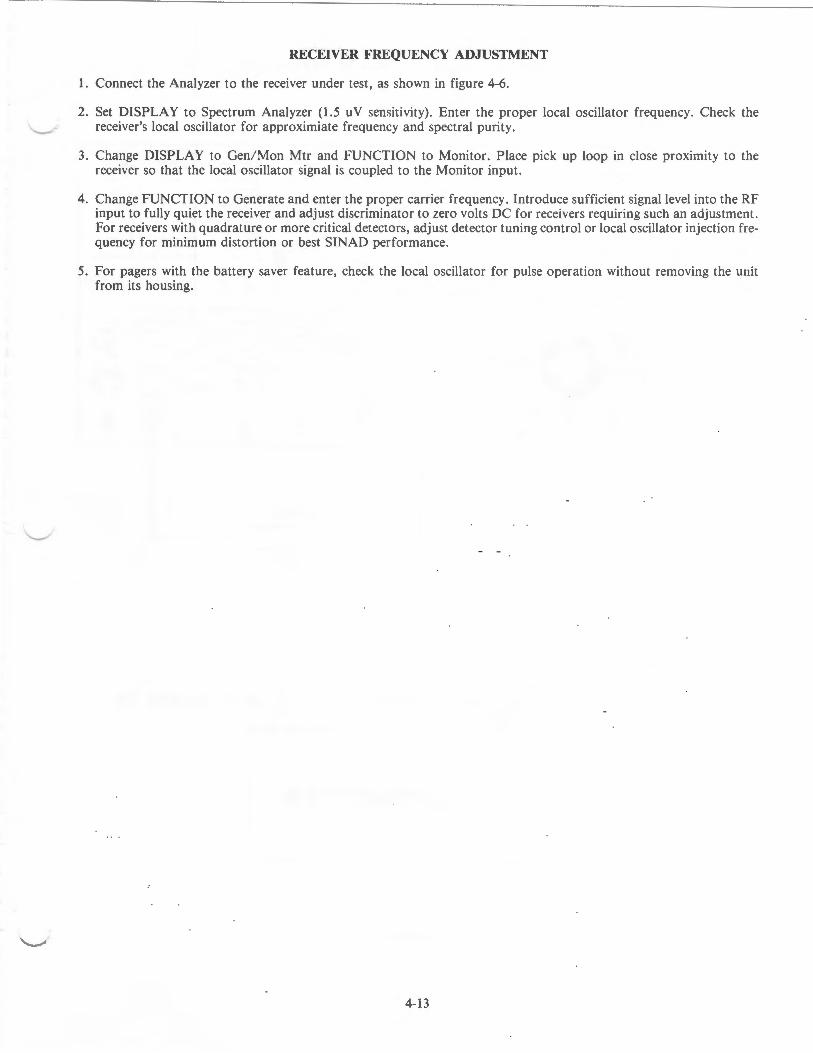
RECEIVER FREQUENCY ADJUSTMENT
I. Connect the Analyzer to the receiver under test, as shown in figure 4-6.
2. Set DISPLAY to Spectrum Analyzer (1.5 uV sensitivity). Enter the proper local oscillator frequency . Check the '---"' receiver's local oscillator for approximiate frequency and spectral purity.
'----"'
~
3. Change DISPLAY to Gen/ Mon Mtr and FUNCTION to Monitor. Place pick up loop in close proximity to the receiver so that the local oscillator signal is coupled to the Monitor input.
4. Change FUNCTION to Generate and enter the proper carrier frequency . Introduce sufficient signal level into the RF input to fully quiet the receiver and adjust discriminator to zero volts DC for receivers requiring such an adjustment. For receivers with quadrature or more critical detectors, adjust detector tuning control or local oscillator injection frequency for minimum distortion or best SINAD performance.
5. For pagers with the battery saver feature, check the local oscillator for pulse operation without removing the unit from its housing.
4-13
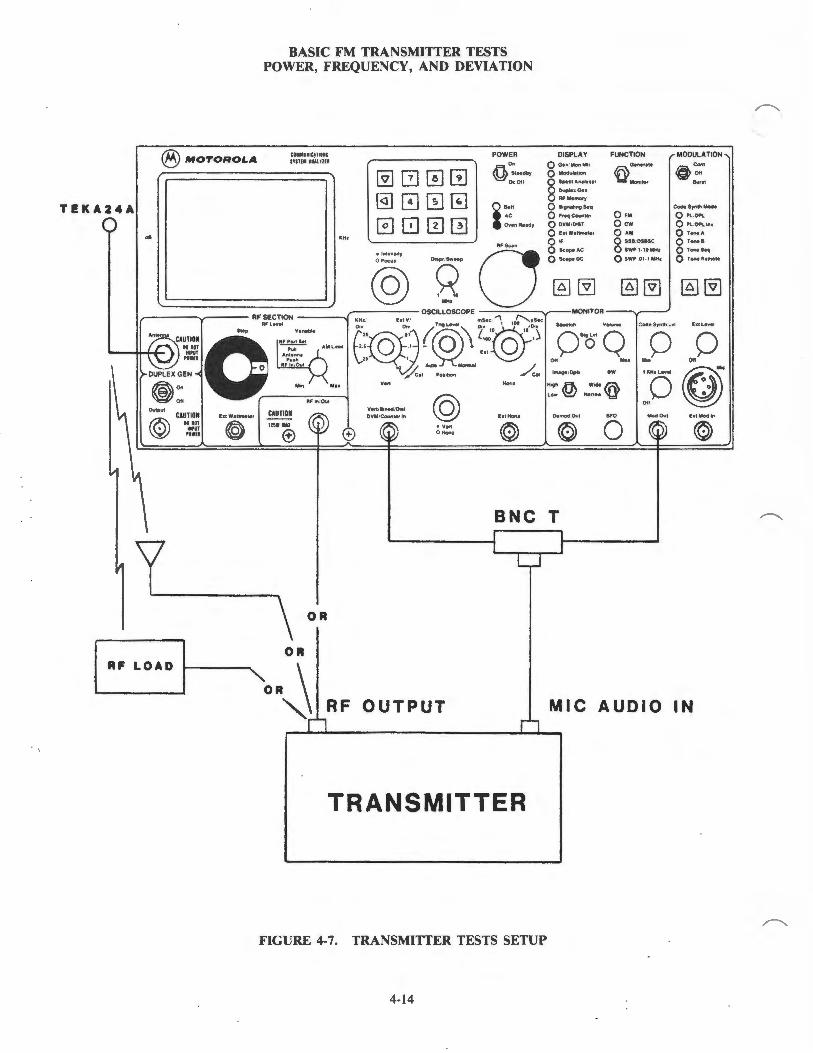
®MOTOROLA
TEKA24A
••
E•t Wettmeter
(@
BASIC FM TRANSMITTER TESTS POWER, FREQUENCY, AND DEVIATION
CDMMUIICt'TIIll$ SYIHIAIAlYlU
CAUTION
IUW IIAJ
®
'"'
0
@1[2]0[!] @J0!II0 0000
@,~=:" ~o·
1 10 MH<
··-Vel'tl l•ned!Ditt @ DYM/C-te~ln
~ • Yel't 0 Hon•
POWER
"" ft St•ndby
~De Ott
i loll
AC
Oven Reedy
......
h!Horr.a
©
DISPLAY FUNCTION rMODULATION Q Gen 'Mon Mtr ® Generete @ Cont Q Modutetton Oft § ... "."'t''" Moni!Of Burtt
OupltiGtn
RF Memory
0 S~nehng Seq Cock SyntPI Mode
Q FreqCounter 0FM Q Pl. tDPl
Q OVM/ OIST O cw 0 PllDPLin•
0 f1t Wenmeter 0 AM Q Tone A
0" Q SSirDSBSC O ToneB
Q ScopeAC Q SWP l · tOMHt O ToneS.q
Q Scope DC 0 SWP .01 · 1 MH1 0 Tone Remote
@] @] @]@] @]@] MONITOR
Squektl Vol~o~me l codeSynthLvt £•1Lt..,.l
o,o··ot Q .. l M."O Otto lmege tOpb OW
• ... .ft w ... 1m Lo• ~ Nt,ow 'Y'
OtrnodOut IFO
~ 0 ©5
~
'"0 Oft Mod Out EatMoclln
©
BNC T
OR
OR
" \ OR
" I RF OUTPUT
RF LOAD
MIC AUDIO IN
TRANSMITTER
FIGURE 4-7. TRANSMITTER TESTS SETUP
4-14
~
~
~

'--"'
BASIC FM TRANSMITTER TESTS POWER, FREQUENCY, AND DEVIATION
A. Basic Terminated Measurements
1. Connect the Analyzer's RF In/ Out to the RF output of the unit under test and make the other connections as shown in figure 4-7.
CAUTION
For power output measurements, connect a transmitter only to the Analyzer's RF In/Out. Do not connect it to the Analyzer's antenna port.
The built-in RF load dissipates up to 50 W for three minutes and up to 125 W for one minute. If a technician keys a high-power transmitter into the Analyzer for a time long enough to threaten overheating the power-measuring circuitry, the system's audible alarm sounds and the display changes to read the RF LOAD OVER-TEMP warning to un-key.
2. Set DISPLAY to Gen/ Mon Mtr, FUNCTION switch to Monitor FM, and MONITOR Squelch control to threshold. Enter the correct transmitter carrier frequency via the keypad or RF Memory table.
3. Set the attenuator to -30 dB . For low-power transmitters, it may be necessary to reduce the attenuator setting to unsquelch the monitor. Too high an attenuator setting or too tight a squelch setting inhibits the frequency error display. Accurate measurements require sufficient signal level from the radio to fully quiet the Analyzer's Monitor receiver.
4. Use good quality cables of minimum length because cable-loss can be a significant factor in RF power measurement, especially at UHF and above. Key the transmitter and read the power indicated on the display.
5. Read any transmitter frequency error indicated on the display.
6. Refer to the radio's service manual to determine if POWER and FREQUENCY are within spec limits and determine if any adjustments are required.
7. Proceed to check MODULATION as follows:
a. Turn off all modulation sources at the Mod Out of the Analyzer in order to check the level of PL or DPL deviation from the transmitter.
b. Key up transmitter with appropriate PL or DPL enabled and read DEVIATION from the GEN/ MON MTR DISPLAY. Refer to radio service manual to determine if adjustment is necessary.
c. With PL or DPL modulation properly set, introduce 1 KHz modulation to transmitter audio input by adjusting the 1 KHz LEVEL control. Check service manual to determine the minimum level required for proper MIC sensitivity as well as the maximum level required to insure proper IDC function. Read MOD OUT levels on the DVM by temporarily switching the DISPLAY to DVM/DIST, ACVM.
d. At the maximum audio input level, read DEVIATION on the display and verify that it falls within the maximum rated system deviation specified in the radio's service manual. Make adjustments as required.
e. Verify proper MIC sensitivity by setting Mod Out Level to the minimum threshold level per the service manual and reading corresponding DEVIATION on the display.
B. Off-The-Air Measurements.
1. Connect the TEKA-24A pick up antenna to the Analyzer's antenna connector. Pull the Variable control out to enable the antenna port.
2. Operate the transmitter under test either into its own antenna or into a dummy RF load, as shown in figure 4-7.
3. Set DISPLAY to Gen/Mon Mtr, FUNCTION SWITCH to Monitor FM, MONITOR Squelch control to threshold, and enter the correct carrier frequency.
4-15

BASIC FM TRANSMITTER TESTS POWER, FREQUENCY, AND DEVIATION
4. Adjust the attenuator as in step A-3 above, to produce an adequate signal level to the Analyzer's Monitor receiver.
5. Adjust the transmitter and follow the same procedure outlined in steps A-5 through A-7 above, to measure frequency and deviation.
6. This same method may be used to verify frequency and deviation of a remotely located transmitter by reducing the attenuator setting to fully realize the 1.5uV for 10db SINAD sensitivity of the Analyzer's "of-the-air" monitor function . To insure sufficient measurement accuracy however, make sure the Monitor receiver is fully quieted as in step A-3 above.
C. "In-Line" Power Measurements
1. Referring to figure 4-8, connect the RTL-4055B in-line wattmeter adapter with the appropriate ST-1200 series element in the 50 ohm antenna line with the arrow pointing towards the antenna. Plug the adapter's cable into the Analyzer's Ext Wattmeter jack. Refer to table 3-12 in this Manual for further description of elements.
2. Set DISPLAY to Ext Wattmeter, FUNCTION switch to Monitor FM, and the attenuator to -30 dB. In this step, FUNCTION switch and attenuator do not function but should be set in case RF power is inadvertently applied to the RF In/ Out connector.
3. Use the keypad to select the scale that corresponds to the ST-1200 element in use.
4. Key the transmitter. Read forward and reflected power on the display.
4-16
,--.....,.
,--.....,.
,--.....,.
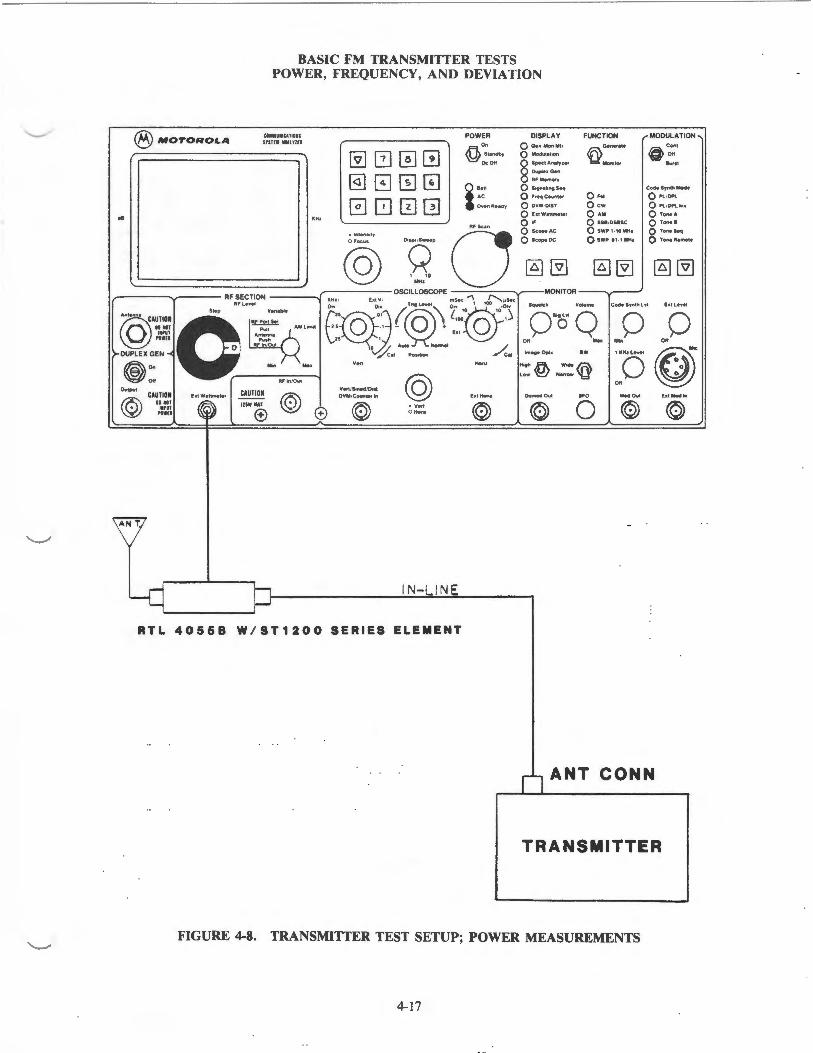
'--'~
'-.__.....
BASIC FM TRANSMITTER TESTS POWER, FREQUENCY, AND DEVIATION
®MOTOROLA
••
CDMMUIICATIOU ITITEI AUlUU
KHt
@1[2]0[!] @]00~
0000
POWER On @stendbr
De Oft
i .... AC
OwenRe•Oy
AF Sun
,------------- RF SECTION--- 0~'"'~~ 0 E@~r@\~@}1
• lntensoly
@ ·q· ...,,
RFLe•el
N lOT AFPortS.I
POWEI Antenna P~ottft
lln!T 1-,;--- AM Lon•ut
•"t'""' ~ .... ..,. ....
@AUTIOIO
).DUPLEX GEN O RFin /Ovt t~ Avxmot
y cet Po1otoon /c .. ®On Mo" • ' M"
Ofl ( AF In /Out
O~ottP\11
© CAUTIOI
IDIOT 111UT ,own
....... T.
EatWenrneter CAUTIOI
~ U!IWUI
®
~
®
Vert
Vert /Stned/DIII OVM /Cour'!ler In
0 ® @ ...... , O Hor11
IN-LINE
RTL 40568 W/ST1200 SERIES ELEMENT
Hom
Eat~r
©
DISPLAY FUNCTION r MODULATION Q Gen MonMtr ®a.nerete @ Cont Q Modulet!Ofl Oft 8 ... "."'t''" Mon•tor IIIII!
Duple• Gen
AFIIlemor.,
0 S•gnahngSeq CocM Syntft Mode
Q FreqCounter 0FM 0 PL rDPL
0 OVM! OIST Ocw 0 Pl iOPllf'l'l
0 Ell Wenmeter 0 AM Q Tone A
0" Q SSIIDSBSC O Tone I
Q ScotMAC Q SWP 1· 10 MHt 0 ToneS.q
Q Scope DC 0 SWP .01 ·1 M~b 0 Tone Remote
@]@] @]@] I @]@] MONITOR
Sq~kh Volume Jcode Srnth L•t Eatle•~
Ofto···O' Q .. I_O Ofto
uo r[;f Oft ~
lm•ve •Dph ... """ ~ ..... /No. Low V:::!/ Ha,ow 'Y'
O.modOul OFO Mod Ovt h1Moc1m
© 0 © ©
rl ANT CONN
TRANSMITTER
FIGURE 4-8. TRANSMITTER TEST SETUP; POWER MEASUREMENTS
4-17
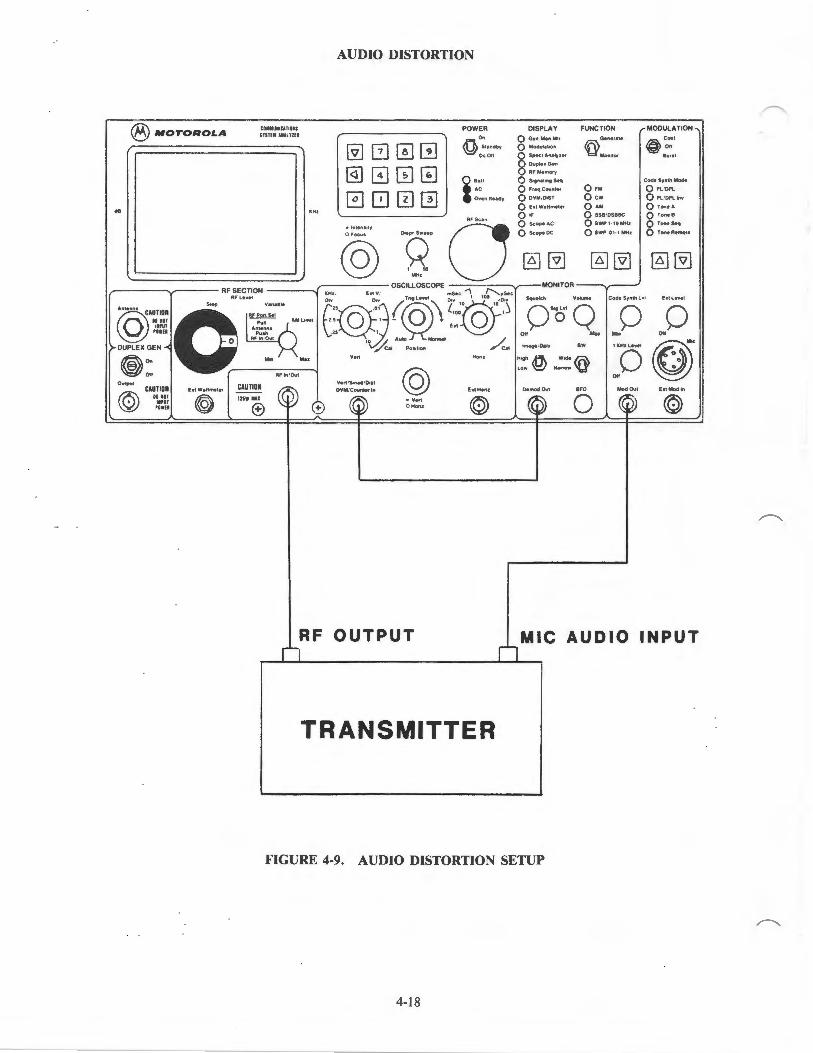
® MOTOROLA
..
RFlewel
COMM UIIUTIDI S nsn• ••unu
..... ,. ~ .... .. ...... ©AUTIOMO
to lOT RF Por1 Sel IIPUT I PuH AM ltmtl
'lWEI Antenn•
' "''"' )-DUPLEX GEN O "'In o.o
® "" ·~· ... Ofl ( AF lnfOvl
CMpvt
© CAUTIOM
~~ lOT II,UT
POWU
E•t W11tmeter
@ tAUT IOM
IUWIUJ
® e J'..
AUDIO DISTORTION
@]00[!] @]G][f]~
0[i]00 • lntenslly
@ ·g.·
DYM!Covnter In @ ~
• Vert OHom
POWER
"" @ s••ndby De Ott
i .... AC
Oven Rudy
Horoz
f • t Hortl
©
DISPLAY Q Gen Mon Mtt
Q Modulthon
Q SpectAnlly l l r
8 Ouple•Gen
RF Memory
0 St~nlhng Seq
Q FreqCounter
0 DVM OIST
0 E•tWitlmeter
0 " Q ScopeAC
Q Scope DC
@] @]
DemodC\11
~
FUNCTION GIMflll
® ...... .
0 ·· 0 cw 0 •• Q SSB DSBSC
0 SWP 1-tO MHz
Q SWP .OH MH1
@]@]
BFO
0
MODULATION
~Coni
~ Oil Burt t
Code Synth Mode
Q Pl10Pl
0 PL/OPlln•
Q Tone A
O ToneB
0 Ton. Seq
0 Tone Remote
~@]
htModln
@
RF OUTPUT n llMIC AUDIO INPUT
TRANSMITTER
FIGURE 4-9. AUDIO DISTORTION SETUP
4-18
~
r---..
~.

'---
AUDIO DISTORTION
1. Before starting this test, adjust the transmitter's IDC to specification.
2. Connect the Analyzer to the transmitter, as shown in figure 4-9.
3. Turn off the MODULATION switch. Disable PL or DPL.
4. Key the transmitter and adjust the 1 KHz MOD Level control for 600Jo of full-rated transmitter deviation on the Gen/ Mon Mtr DISPLAY.
5. Select DVM/ Dist DISPLAY and mode 3, DIST/ SINAD. Read transmitter % DISTORTION from the display. Unkey the transmitter.
4-19
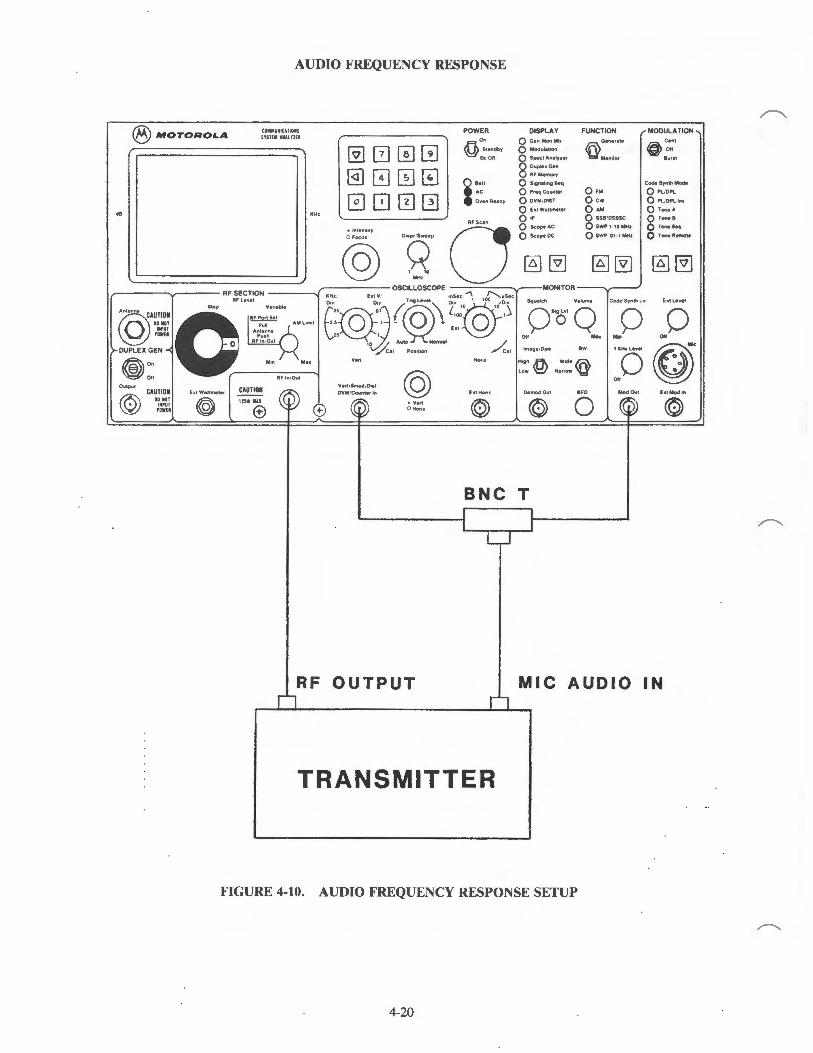
®MOTOROLA
••
AUDIO FREQUENCY RESPONSE
COIIIIIIUIIICATIOIS SYSTEIIIUAlYlU
'"'
@J00C!l @JGJ00 000~ •lntensoty
@ "8
POWER 0"
ft st~ndbr ~0~011
i .... AC
Oven Rudy
RFSun
DISPLAY Q Gen MonMtr
Q Modul1hon
Q Spec! An1tyrer 8 Ouple•Gel'l
RF Memory
0 SognehngSeq
0 FreqCounter
0 DVM OIST
Q E1!We1tmeter
0" Q Scope AC
Q Scope DC
~@]
FUNCTION r MODULATION ® Gener•le @ Coni
Ott
Mono tor Burtt
Code Synth Mode
0 FM Q PL/DPL
Ocw 0 PLIDPLinw
0 •• Q Tone A
Q SSB1DS8SC O ToneS
0 SWP 1· 10 MHt 0 ToneS.q
0 SWP .01 · 1 MHt 0 ToneRemote
g)@] I g)@] ,------...,,;------ RF SECTION---- O~'~OOOO" 0 (QY~!!i o·~ ~"·:.~:- EX0~ (@\ ~~w:r ~
)... DUPLEX GEN :0 .,Xo•m•l ~On /Col Po""o" / ~ - /~ OU ( RFin /0...1 "i
... I ··- HOfll
@
MONITOR
0,.0'''0' Q .. l "'"0 0 ,.0 g ' "0
Squelch
tmage/Opla
Hogh fi Wide {ffi LOW V:::::!/ NlrtOW 'Y'
Volume Code Synlhlwl Edlewel
BW
Oi.ltput
© CAUTION
DOIIOT II,UT
POWU
Ott
E•tW11tmeter CAUTION Vert /Smecl /0111
OVM/Counter In E1tHonz Mod Out Oemod Out BFO Ea!Modln
e ® • Vert © O Hortt IUW MU
® {9) @> © © 0
BNC T
l r 0
RF OUTPUT n
MIC AUDIO IN n
TRANSMITTER
FIGURE 4-10. AUDIO FREQUENCY RESPONSE SETUP
4-20
~
,r---...
~

'-......-/
AUDIO FREQUENCY RESPONSE
1. As shown in figure 4-10, connect the Analyzer's RF In/Out port to the transmitter's RF output and the Vert/Sinad/ Dist input jack to the Mod Out jack through a BNC tee fitting connected to the transmitter's microphone audio input. Disable PL and DPL.
2. Select DVM/Dist DISPLAY and set it to mode 1, AC DVM. Set FUNCTION to Monitor FM, attenuator to -40 dB, MODULATION to Cont and Tone A. Use the keypad to enter the transmitter frequency. Turn off the 1KHz and Ext Mod controls.
3. Set DISPLAY to Signaling Sequence. Use the keypad to enter mode I, A/B encode, Tone A and enter the frequency to be tested.
4. Set DISPLAY to Gen/Mon Mtr, key the transmitter, and adjust Code Synth Level control to provide 300Jo of rated transmitter deviation.
5. Change DISPLAY to DVM/Dist. Note both the transmitter MIC Audio input level in dBm and the test frequency, for later use.
6. Repeat the above procedure, adjusting Code Synth Level to maintain 30% of rated deviation, for each frequency to be tested.
7. Plot the data points obtained above in db relative to the I KHz Level and compare with the transmitter's specifications. EIA RS-152B specifies that a transmitter's frequency response be within + 1 or -3 dB of a + 6 dB per octave pre-emphasis from 300 to 3000 Hz (6 dB per octave roll-off allowed between 2500 and 3000Hz). Refer to figure 4-11 below, Frequency Response diagram.
0 db +1 uy I
-3 db
10.5 db
300 Hz
>r~<
1000 Hz
.~o<$6 ~
o o'O,c~-
.5db
2500 3000 Hz Hz
FIGURE 4-11. AUDIO FREQUENCY RESPONSE; EIA STANDARD RS-1528
4-21

®MOTOROLA
••
COIIUIUCATIOIIS SYSTEM AIIAlllU
""'
AM MODULATION TEST
@1[2]0[!] @1000 0000
POWER Oo
ft. Stendby
~OcOit
i .... AC
OvenRe1dy
RF Sun
- 0 •lntenllly
@ ·g
DISPLAY Q Gen MonMtr
Q Modullhon
Q SpectAnllyur 8 Dupl1uGen
RFMemory
0 Stgnehng Seq
Q Freq Counter
0 DVM IOIST
0 E11We11meter
0" Q Scope AC
Q ScopeOC
@]@]
FUNCTION r MODULATION ®Generete @Coni
011
Mont! Of Burst
Code Syntl't Mode
0FM 0 PL ,OPL
0 cw 0 PL tOPltnv
0 AM Q Tone A
Q SSII rOSBSC O ToneB
Q SWPt-IOMHz Q ToneS.q
0 SWP .OHMHz 0 Tone Remote
~@] I ~@] RF SECTION OSCILLOSCOPE ----:--v-MONITOR
AF len! IUobl ht VI mSec ""\ ~ Sec Squelch Volume Code Synthlwt Eltlewel
011 OIIO''o' Q .. J M,"O 0 @
•""""' A~:~~~ s .. , v .. ~.,. (o",@o;~ (;'"•'"'''-. {:~©' •oo •o~'\ ""'Q ... o§· -@1\ o ~ ~ .25 1
DUPLEX '3EN 0 to // Auto Normel / Image Opll BW
Hot~z ~·-- .
@ ® -;,/Cel Posthon /c 1
Do Mro' 'M,. J Yort
0
, • _
Oil / __ _ / - -- ·-·
Output
© CAUTION
DDIDT II PUT
POWU
E•tWattmeter
@ CAUTION
mw ux
® 0
Vert/ Stned/0111
DVM/Counter In
~ I I
1' LEVEL SETUP
_0_ ANT
I I
t
f•t Hortl
• Vert © O Honz
DISTORTION
I
~·c
AM TRANSMITTER
Demod Out
~
6 BNCT
FIGURE 4-12. AM MODULATION TEST SETUP
4-22
8FO
0
J
~<
'"0 011
Mod Out h!Mocltn
~ ©
/"'-..
~
/"'-..
'....__/
AM MODULATION TEST
1. Connect the Analyzer's RF In/ Out to the output connector of the transmitter under test, as shown in figure 4-12. Set FUNCTION to Monitor AM.
2. Connect the Analyzer's Mod Out connector to its Vert/ Sinad/ Dist input connector and to the transmitter's microphone input using a BNC tee connector.
3. Set DISPLAY to DVM/ Dist and the AC voltmeter function.
4. Adjust the 1 KHz Level control to provide the proper input signal level to the transmitter. Refer to the transmitter's service manual to obtain the value for this level.
5. Key the transmitter. Read OJo AM on the display. Change to IF DISPLAY to observe the RF envelope's distortion .
6. To check the transmitter's distortion, connect the Analyzer's Demod Out connector to the Vert/ Sinad/ Dist input jack. Set DISPLAY to DVM/ Dist and Distortion. Read OJo distortion on the display.
4-23
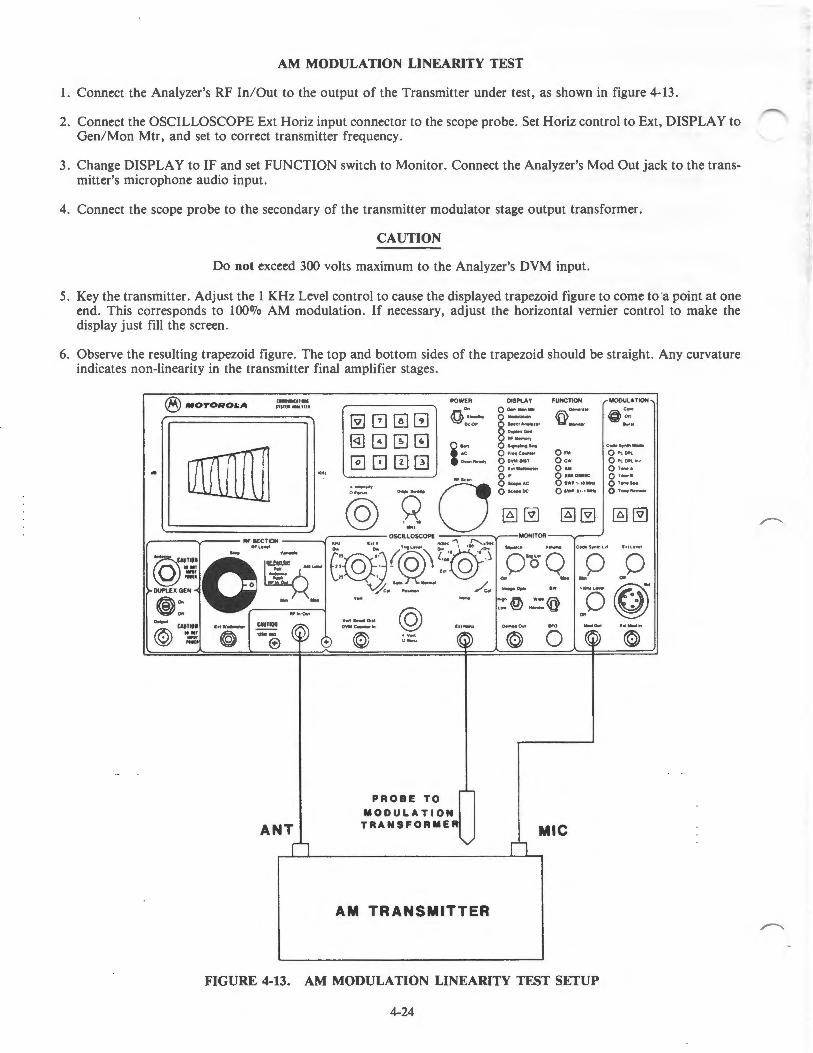
AM MODULATION LINEARITY TEST
1. Connect the Analyzer's RF In/Out to the output of the Transmitter under test, as shown in figure 4-13.
2. Connect the OSCILLOSCOPE Ext Horiz input connector to the scope probe. Set Horiz control to Ext, DISPLAY to Gen/Mon Mtr, and set to correct transmitter frequency.
3. Change DISPLAY to IF and set FUNCTION switch to Monitor. Connect the Analyzer's Mod Out jack to the transmitter's microphone audio input.
4. Connect the scope probe to the secondary of the transmitter modulator stage output transformer.
CAUTION
Do not exceed 300 volts maximum to the Analyzer's DVM input.
5. Key the transmitter. Adjust the 1 KHz Level control to cause the displayed trapezoid figure to come to ·a point at one end. This corresponds to lOOOJo AM modulation. If necessary, adjust the horizontal vernier control to make the display just fill the screen.
6. Observe the resulting trapezoid figure. The top and bottom sides of the trapezoid should be straight. Any curvature indicates non-linearity in the transmitter final amplifier stages.
C .. WIICAIIIIIS ®MOTORO&;A •nn ...... nu
@][2]0[!] @]00~
0000
POWER DISPLAY FUNCTION MODULATION
@ o; .• ~, g ~--:-Mit 1m a........ I @ :· 0< 00< § $pHI All.lyl•f Y' MoniiCM ......
~.a. .. 11, .... _,
i ••n 0 ,..,. . ..,.,S.4 CooteSynlft Mode
AC Q f•"IC-ICM 0 fM 0 1'\.0f>l
O.•""•NJ QovMOIST O cw QI"LDt'!. tn• 0 hllihn,....., 0 AM 0 ,_ ..,
•trsu.. 0 " 0 snosuc 0 ,_ . ami ·-M·
0 o "-" o ........... o •- ... - @ 9_ o;~ o~·~ o~·;
r-----v---- RF !ECTION •uh h• 11 OSCILLOSCOPE ..,5H ..., ('... .SH MONITOR
~AUT~~· .... '-·~- E~ .. IQ'(~ r@\ r~~~~ -0· ·a ·0- ,_n·· ··0 ...... ~';:Sl 0 •i;:• ,.,_ •:.0.'~- X • '"J...:::::!J "" "" ... Y o•
OUI'I.El GEN O "• o.o '~• •~·,,,_ -- ...-<. ~- .,., ow """"" ©5• "" ®0. - Mo• 'M @ _, :@.::@ 0 eO - .. _ -~ tA T 0 t&UTIOI v.., ..._. Ott~
© ~1 "(i~ -.. -.. -®-+ ~ 0 ···~· ~=. ·~ .. i . 0 ~ '©"
ANT _0
PROBE TO
MODULATION TRANSFORMER
AM TRANSMITTER
MIC ri
FIGURE 4-13. AM MODULATION LINEARITY TEST SETUP
4-24
~
r----
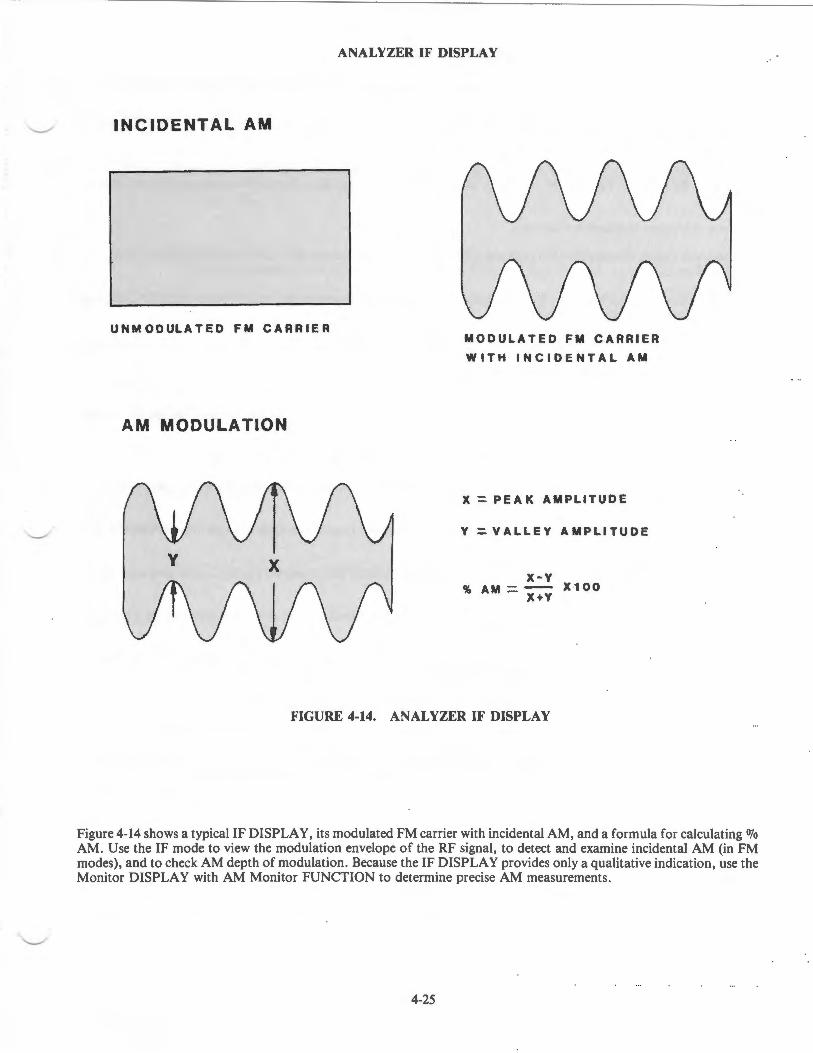
\......_/
INCIDENTAL AM
UNMODULATED FM CARRIER
AM MODULATION
ANALYZER IF DISPLAY
MODULATED FM CARRIER
WITH INCIDENTAL AM
X::. PEAK AMPLITUDE
Y::. VALLEY AMPLITUDE
x-v cr, AM=- X·100
X+Y
FIGURE 4-14. ANALYZER IF DISPLAY
Figure 4-14 shows a typical IF DISPLAY, its modulated FM carrier with incidental AM, and a formula for calculating o/o AM. Use the IF mode to view the modulation envelope of the RF signal, to detect and examine incidental AM (in FM modes), and to check AM depth of modulation. Because the IF DISPLAY provides only a qualitative indication, use the Monitor DISPLAY with AM Monitor FUNCTION to determine precise AM measurements.
4-25

COMMUNITY REPEATER MODULATION
1. Connect the Analyzer to the repeater under test as shown in figure 4-15. The diagram illustrates a MICOR Community Repeater. Disable the receiver PL and set the squelch to threshold.
2. Set DISPLAY to DVM, FUNCTION switch to Monitor FM, and MODULATION switch in off position. Set MONITOR BW switch to narrow, Squelch control to threshold, and Duplex Gen switch to off.
3. Set the attenuator to -30 dB. For low-power transmitters, it may be necessary to reduce the attenuator setting to unsquelch the monitor. Too high an attenuator setting or too tight a squelch setting inhibits the modulation deviation display.
4. Enter the proper transmitter frequency.
5. Move the display cursor down to DVM and enter I for AC mode. Adjust the 1 KHz Level control for 1 VAC, indicated on the display, to put 1 volt of 1 KHz test tone into the transmitter modulation limiter.
6. Set DISPLAY to Gen/Mon Mtr. Key the transmitter. Adjust the transmitter IDC control for 4 KHz DEV indicated on the display. Un-key the transmitter.
7. Disconnect the cable from the Duplex Gen output to the receiver antenna to prevent the transmitter from keying up on repeat.
8. Disconnect the cable from the Mod Out connector, leaving SINAD IN connected to test point at the repeater level.
9. Set DISPLAY to Duplex Gen, FUNCTION switch to Generate FM, and Duplex Gen switch to On. Set the MONITOR Image/Duplex switch to High or Low as required. Enter the proper offset frequency.
10. Move the display cursor down to PL or DPL and enter a PL/DPL code used in the repeater.
11. Turn off the 1 KHz Level control. Set MODULATION switch in the Cont position and adjust Code Synth Level control for 0.75 KHz DEV indicated on the display.
12. Set FUNCTION switch to Monitor. Reconnect the cable from the Duplex Gen Output to the receiver antenna connector. The transmitter should now key-up.
13. Adjust the PL deviation control in the repeater controller for 0.75 KHz repeated PL/DPL code indicated on the display.
14. Set FUNCTION switch to Generate and adjust the 1KHz Level control for 4.75 KHz DEV indicated on the display (0.75 KHz PLIDPL + 4KHz test tone = 4.75 KHz).
15. Set DISPLAY to DVM, FUNCTION switch to monitor, and turn the repeat level to minimum. Slowly increase the repeat level control until the proper voltage is indicated on the display.
16. Change DISPLAY to Gen/Mon Mtr. Confirm that the repeated modulation is 4.75 KHz.
17. Disconnect the cable from the Duplex Gen Output to the receiver antenna. The repeater should un-key.
18. Radiate a weak signal from the Duplex Gen Output to simulate the weakest signal that will be repeated. Adjust squelch key control on the squelch gate module to the point that the transmitter just keys-up.
4-26
~
~
~

I I
I I I I I
I I I_
®MOTOROLA
..
_[J_ANT
RECEIVER
COMMUNITY REPEATER MODULATION
COMMUIICATIOIS SYSHMA.AlYlEII
~[2]0[!] @JG][f]~
0000
(Q) • v.n O Hori1
POWER
E.tHom:
~
DISPLAY FUNCTION
, .. s::a. Wi~@ ~ N•now
DemodOut BFO
~ 0
D I I t--
1 I
BNCT
Mod Out
©
MODULATION
~Coni
~ Ott !urtt
Code Swnth Mode
Q PL.IDPL
0 PLIDPllnv
Q ToneA
O Tonel!l
Q Tone Seq
0 ToneRemote
~@]
E•tModln
©
-·- 1
...._ .....
h
~ ~
COMMUNITY REPEATER
ruNT I ~
~~ TRANSMI;.;eR
I l I I I I I l
FIGURE 4-15. COMMUNITY REPEATER MODULATION SETUP
4-27

WIRE LINE REMOTE BASE MODULATION
1. Set-up this station in two steps: Transmitter modulation and phone line levels.
2. Connect the Analyzer to the transmitter under test as shown in figure 4-16.
3. Set DISPLAY to DVM, FUNCTION switch to Monitor, and MODULATION switch to off. Set MONITOR BW switch to narrow and squelch control to threshold.
4. Set the attenuator to -30 dB. For low-power transmitters, it may be necessary to reduce the attenuator setting to unsquelch the monitor. Too high an attenuator setting or too tight a squelch setting inhibits the modulation deviation display.
5. Enter the proper transmitter frequency. Move the display cursor down to DVM and enter 1 for AC mode. Adjust the 1 KHz Level control for 1 V AC indicated on the display, to put 1 volt of 1 KHz test tone into the transmitter modulation limiter.
6. Set DISPLAY to Gen/ Mon Mtr. Key the transmitter and adjust the transmitter. IDC control for 5 KHz DEY indicated on the display. Un-key the transmitter.
7. Follow the base station phone level setting outlined in the next procedure.
4-28
~
~
~
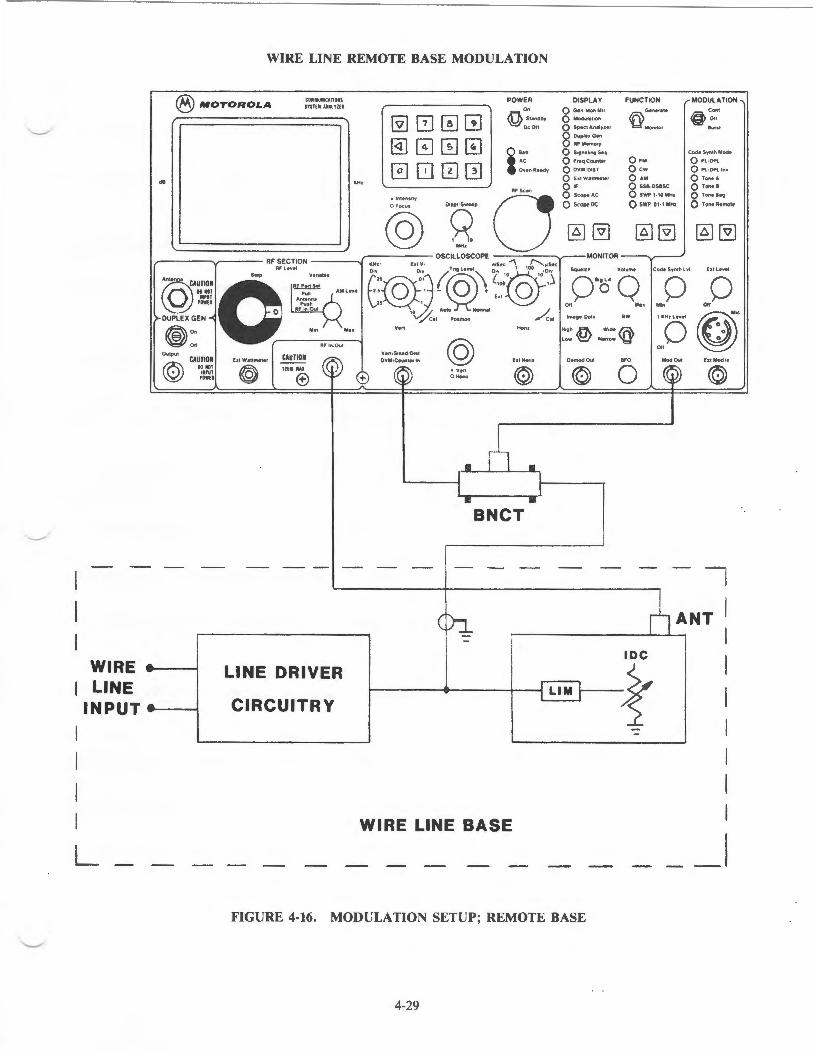
WIRE LINE REMOTE BASE MODULATION
®MOTOROLA
..
COMMUMJOTIOIIS SUHM U.UUU
@][2]~[!]
@]GJ~~
000~ •lnlenslly © ·g·
POWER 0"
fi Stendby
'&/ D<:Ott
i ... , AC
Owen Reedy
RFScen
0 r------,.,----- RF SECTION OSCILLOSCOPE
(QJA~ai Q.... ..... ·- 0:©~ r@\ ~f§:l )-DUPLEX GEN O
15 ~~ A"Xo,mol • /
® :,/Cet Pos•hon /c11
On Mtn Mu Vert
Oll -..
@ Ov!pul
© CAUTIOM
DOIIOT III~Ul
PDWEI
Eat Wattmeter
(2) CAUTIOM IZSW MAl
®
Vert / StnediOttl
OVM/Counter In
e @) • ven O Hom
EttHoru
~
DISPLAY FUNCTION ~MODULATION Q GenMonM!r ®Gene,.le @Coni Q Modulehon 011
Q SpectAnaly.r:er Mondor Burt! 8 OuJMeaGen
RFMem01'y
0 St<o~nehngSeq Code Synth Mode
Q Freq Counter 0FM Q PL'DPL
Q DVM DIST Ocw Q Pl ' DPLin•
0 Eat Wenmeter 0 AM Q Tone A
0" Q SSB DSBSC 0 Tonel
Q Scope AC 0 SWP 1-10 MH.r: O Tone SeQ
Q Scope DC Q SWP .01 ·1 MHr 0 Tone Remote
@]@] g)@] ~@] MONITOR
Squelch Volume fCode Synlh l¥1 E•lll¥11
Ollo··o· Q .. l M'"o Olio lmege OpiJ BW
Htgh .ft._ Wide {d.. Low~ Neno•Y
DemodOut BFO
© 0 ~
' ··o Oll Mod Out EJI Mod In
~ ©
~ I I 1 I
II a BNCT
~
--~
L-• -----1Ck--------,~ ANT :
IDC WIRE • I LINE DRIVER
~t I I I LINE
INPUT • I CIRCUITRY
I I I I WIRE LINE BASE
L _I FIGURE 4-16. MODULATION SETUP; REMOTE BASE
4-29

A. Phone Line Levels
WIRE LINE REMOTE BASE PHONE LINE LEVELS
1. Perform the Transmitter Modulation procedure, outlined in the previous method, before proceeding with the phone line level adjustments.
2. Connect the Analyzer to the base station under test as shown in figure 4-17. Connect RF In/Out to the antenna connector and Mod Out - DVM/Counter In connector to the station phone line input.
CAUTION
Disconnect the telephone line from the base station and connect a 600 ohm load across the input. Failure to do so will introduce hum and noise that will cause erroneous readings.
3. To measure levels across a balanced phone line, refer to paragraph D. To generate signals across a balanced phone line, refer to paragraph E.
B. TRANSMIT Line Input
1. Set DISPLAY to DVM, FUNCTION switch to Monitor FM, and MODULATION switch to off. Set MONITOR BW switch to narrow and squelch control to threshold.
2. Set attenuator to -30 dB. For low-power transmitters, it may be necessary to reduce the attenuator setting to unsquelch the monitor. Too high an attenuator setting or too tight a squelch setting inhibits the modulation deviation display.
3. Enter the proper transmitter frequency. Move the display cursor down to DVM and enter 1 for AC mode.
4. Adjust the 1 KHz Level control for the DBM level expected from the remote control console. The typical value of -16 dBm will be +I -4 dB of most actual levels.
5. Remove the cable from the DVM/Counter In connector coming from Mod Out. Connect the cable coming from the line driver output to DVM/Counter In.
6. Adjust the exciter level control on the station control module for the value stamped on the exciter, as indicated on the display.
7. Set DISPLAY to Gen/Mon Mtr. Make a line push-to-talk by applying the proper control signal to the input line. Verify that modulation is 5 KHz.
C. RECEIVE Line Output
1. Disconnect the cable from the Mod Out and DVM/Counter In connectors. Connect the cable from the receiver line driver output to the DVM/Counter ln.
2. Set DISPLAY to Gen/Mon Mtr, FUNCTION switch to Generate FM, and MODULATION switch to off.
3. Adjust the 1 KHz Level control for 5 KHz DEY indicated on the display. Set the attenuator to -30 dB and the Variable control to mid-range.
4. Set DISPLAY to DVM. Enter the proper receiver frequency. Move the display cursor down to DVM and enter 1 for AC mode.
5. Adjust the line level control on the line driver module for the desired level on the phone line. A typical value for carrier - type lines is 0 dBm.
4-30
~
~
r---..

®MOTOROLA
••
WIRE LINE REMOTE BASE PHONE LINE LEVELS
COMMUIIICATIOIIS SUUMAUtflU
. ..
@][2]0[!] @]GJ~~
0000
POWER 0•
.ft. Stendby
'WOe Oil
i Boll
AC
Owen Reedy
RFSun
- 0 •lntenstty
©8'
DISPLAY
Q Gen 'Moll Mtr
Q Modulehon § ···"'"''''" OupleaGel'l
RFMemor~
0 S•gnehn9 Seq
Q FreqCounter
Q OVM1DIST
Q EatWettmeter
QIF Q Sc:opeAC
Q Scope DC
@]@]
FUNCTION r MODULATION ®Generate @ Cont
Oil
Mon•tor Burst
Code Synth Mode
QFM Q Pt.. IOPL
Ocw Q PliOPLin'f
0 AM Q Tone A
Q SSBrDSBSC 0 , ..... 0 SWP 1-10 MH1: O Tone Seq
0 SWP .01 · 1 MH~: 0 ToneRemote
~@] I ~@] MONITOR ,.-------...,.----- RF SECTION OSCILLOSCOPE
RFL I KHl EltV mS.c ""'\ ~~~Sec
(QJ"i ~. ·· ·- E:r§t· (@\ ~7{QP Qo· 0 ,_fS ·o DUPLEX GEN 0 °~ 00'~,- 0
""0 /~ :.. - 00 •• ::.... ~Oil M"
~On Mea Vert Hotll High .ft. Wide {ffi 0 0 o
~Oil Afln/Out @ Low V::::!.J Ne,ow 'Y' 0
Output CAUTION Vert /Stned/Dtll 0 Oil
DO lOT ~ at Mod In
© CAUTIO• htWenmeter ___ ~ OVMICO\Interln htHont OemodOut BFO ModOut E
;:~:~ ~ "'"® 0 ~ ~~:~. © © 0 ~ ©
I
' ' . ['] .
r a ar
BNCT
") --- ----,
~ : IRcvRI I I I
,·--I -- -: _j I STATION RF CONN4 ANT
1
<D----.---1 eo on.
: ELA~
LINE DRIVER
CIRCUITRY
1
I I I
~ I • I~
IDC
k TRANSMITTER
WIRE LINE BASE
FIGURE 4-17. PHONE LINE LEVELS SETUP
4-31
---.-
1---
I
_l
WIRE LINE REMOTE BASE PHONE LINE LEVELS
D. MEASURING LEVELS ACROSS A BALANCED LINE
1. Use a BALUN (balanced-to-unbalanced) device because of the unbalanced nature of the DVM/ Counter In jack. The BALUN must be high impedance (6K ohm or more) to make bridging measurements without upsetting levels.
2. Connect the BALUN's balanced side (high impedance) across the phone line. Connect the BALUN's unbalanced side to the DVM/Counter In jack, as shown in figure 4-18. Set the BALUN switch in the OPEN position.
3. Set DISPLAY to DVM AC mode. Measure the test tone level on the phone line by interpolating the AC VOLTSDBM scale on the display.
4. Set DISPLAY to Scope AC. Analyze waveform and measure AC volts peak-to-peak by interpolating the volts per division.
5. With the BALUN switch in the OPEN position, the BALUN represents a nominal 10db insertion loss from the balanced side to the unbalanced side. For example, an actual line level of Odbm will indicate -10 dbm at the DVM input. Characterize your unit before use.
4-32
/"'-..

I I
I L
WIRE LINE REMOTE BASE PHONE LINE LEVELS
®MOTOROLA
••
CDIMUIICATIOIS USHIAIAlU£1
[Yll2J0[!] @]G]ITJ~
0800
POWER On
~Standby DeDI!
i .... AC
0\fenA•ady
DISPLAY Q Gen:Mon Mtr
Q Modulation 8 ...... , .. ,, .. OYpleaGen
AFMetnOfy
0 S~gnahntS.q 0 FreqCO\Inter
0 OVMIDIST
0 Eat Wattmeter
0" Q Sc:o~AC
Os..,.oc
FUNCTION ~MODULATION ~Generate o:'
Mono!Of ..... COde Synth Mode
0FM 01'1.1091. Ocw QPll~lnw 0 AM QroneA Q SSI!DHSC 0 ,., .. 0 SWP1 · 10MHa or ....... Q SWP .01·1 MH& O Ton.Aemo~ ; ~::;" ~-···· 0
,-----v---- "!'"-'~ { '"" ~' ,,;.~-~ (:@.~(@\:~®':I
§]@] g)@] g}@] MONITOR
....... Y"'"mo Jcoct.Syntt\Ltl btlawal
'""""' ~ .... v .......
@AUTIO· a IOIOT ~ I.,UT Pull ...... 1·~~:··
DUPLEX GEN O ""In/Out
~On Min • 'Mea
~ Oft ( AF In /Out ~ Ol.olpllt
©
BRDG
CAUTIO. IDIOT
III'Ul I'DWEI
@ CAUTIO• fat Wattmeter
(9) U5WIIAJ e
3.8K
,'0_ ••~••mol / "/Cal POSitiOn /Cal
y..,
Yert/SNdtOi•t DVM/Countltfln @ .....
O Hotia
-1 I I I I
-· Eatttotir
~
BALUN 25CB4202A01
T201 FROM T1380
I I I I I
_j
E R.T.L.
E LINE DRIVER MODULE
Oflo··a· Q .. l ~,0 Oflo 35lf)5
lmafe/Opla IW
.... ft. ··~ Lo• 't:!/ Narrow 'Y'
Demod Out IFO Mod0.1 htMoclln
© 0 ~ ~
FIGURE 4-18. BALUN SETUP; MEASURING LEVELS
4-33

WIRE LINE REMOTE BASE PHONE LINE LEVELS
E. GENERATING SIGNALS ACROSS A BALANCED LINE
1. Connect the BALUN's balanced side (600 ohm) to the phone line, as shown in figure 4-19. Disconnect any other equiment (consoles, etc.) connected to the line. Connect the BALUN's unbalanced side to the Mod Out- DVM/ Counter In jack.
2. Set DISPLAY to DVM AC mode and FUNCTION switch to Generate. Adjust the 1 KHz Level control to the level desired on the line, as interpolated from the DBM scale. A typical value for carrier-type lines is 0 dBm.
3. Set DISPLAY to DVM AC mode, FUNCTION switch to Generate, and 1KHz Level control to off position to generate tone remote control commands.
4. Set MODULATION switch to Cont Tone Remote. High-level guard tone, function tone, and then the continuous low-level guard tone will go out. Adjust Code Synth Level control for -30 dBm level of low-level guard tone on the phone line, as interpolated from the DBM scale. This is equivalent to 0 dBm speech test tone level.
5. Switch to Burst position each time that a tone remote control command sequence is desired.
6. Connect the service microphone into the Analyzer's MIC jack. Adjust the Ext. Level control for voice peaks about 6 dB higher than the desired test tone level.
7. With the BALUN switch in the CLOSED position, the BALUN represents a nominal Odb insertion loss from the unbalanced side to the balanced side. For example, a modulation output of Odbm will be a Odbm input into the 600 ohm line. Characterize your unit before use.
4-34
r---...
~
~

"-..,.--
'-----"'
® MOTOROI.A
..
WIRE LINE REMOTE BASE PHONE LINE LEVELS
CDHUIICATIOIS SYSTEIAIIAlUEII
'"'
[Y][2]0[!] @]GJ[f]~
0C!J0ITJ
POWER Oo
@st•ndb~ De Oil
i .... AC
Oven Re.dw
RF Sun
© s:-•lntensrtw
- 0
DISPLAY Q Gen 'Mon Mtr
Q Modulatron
Q S~ct Anetyur 8 Duple•Gen RFMemory
0 SrgnaltngSeq
Q FreqCounter
Q OVM/01ST
0 E•tWetlmeter
0" 0 ScopeAC
0 Scope DC
@]@] ,----......,.,------ RF SECTION OSCILLOSCOPE ----:---::---v-MONITOR
FUNCTION ~MODULATION ®Generate @ Cont
011
Monrtor Surtt
Code Synth Mode
0FM 0 PLIDPL
Ocw Q Pl/OPllnw
0 AM Q Tone A
Q SSB/DSBSC 0 ToneS 0 SWP 1·10MHI 0 Tone Seq
0 SWP .01 -1 MHa 0 Tone Remote
~@] I ~@]
@A"''""' CA~~~~ 0.... """" .. ri.... E~~·:·@·§·~:~ r;@'"•'"''~ 2::ey·\ ·~~~' Squelch Vo+ume CodeSynthlwl Ellle¥11
~.o··o· Q .. l M .. o IIIPIT 2.5 0 .1 - 0 + 0 I'IWfl hi .25 1
0 011
DUPLEX GEN 0 to .// Autc Normal / lmege iDpb BW ~ '/Col Po,.toon /Col
~ Oft Mn Y•O HM" High ft WI ..
Ott AFin /Out @ Low ~ Nerrow ~ OutJKjl 0 'bY
DD IDT ~ --- 0 DYM/CCNnterln E Hot'
© CAUTIO I Ext W•nmeter CAUTIOI @ Vei1JS•n•dJOist
i:~~~ ~ "'"® . e ®J ;=. ~ 0(6)' 0
,-1
BRDG 0
f-----0:.:>::::---.
R. T .L.
(:---(l)~ I I I I I_
0
BALUN
3.1K
2SCI4202A01
T20.1 FROM T1380
I I I I I
_j
FIGURE 4-19. BALUN SETUP; GENERATING SIGNALS
4-35
35CQJ MoO Out E•IModln
@

BANDPASS CAVITY TUNING
Use this procedure to peak-tune bandpass cavities, duplexers, crystal filters and other bandpass devices. Tune the bandpass to center frequency. After tuning, use normal gain or loss measuring techniques to measure insertion loss.
1. Connect the Analyzer to the device under test, as shown in figure 4-20. When tuning a single cavity, connect the RF In/Out to the cavity's output connector. When tuning a bandpass duplexer, connect the RF In/Out to the duplexer's antenna port.
2. Set DISPLAY to Duplex Gen, FUNCTION switch to Generate, and attenuator to -lOdb.
3. Change the FUNCTION switch to Monitor. Enter pass frequency on the display. Set the offset to 0 MHz.
4. Change DISPLAY to Spectrum Analyzer. Set Dispr /Sweep control fully clockwise to 10 MHz. Turn the Duplex Generator on.
5. Tune the cavity, or both cavities in the duplexer leg, to a peak indication on the display's center graticule. The single cavity is ready for service.
6. For duplexer tuning, move the output cable from the Duplex Gen Output connector to the duplexer's other end. Repeat steps 2 through 4. Put the duplexer into service. Check the duplexer for insertion loss according to its specifications.
4-36
r--.....
~
~

'-"'
"-.__.,/
BANDPASS CAVITY & DUPLEXER TUNING
®MOTOROLA COMIUI ItAHOI S SYS TEM AIAlYlU
POWER
0"
ft. St11ndby
'&I Oc:OU
DISPLAY
Q Gen Mon Mtr
FUNCTION r MODULATION ® Gener•t• @ Cont
••
Antenn•
@AUTION
DO lOT I I~UT
POWU
DUPLEX GEN
~
CAUTION DOIOT
II,UT PDWU
""'
@J00C!J @]GJ~~
0000 i 8oU
AC
Ovel'tReady
Q Modul•t•on
Q Spect Analyter 8 OupleJ Gen RF Memory
0 Sogn1hngSeq
Q FreqCounter
0 DVM OIST
0 E1 1W1 1tme!er
0 " Q Sc:opeAC
Q Scope DC
~ @]
011 Mo n 110r Burst
Code Synlh Mode
0 FM Q PLOPL
0 cw Q PLIOPLtnv
0 •• Q Tone A
Q SSB DSBSC O Tone B
0 SWPI · ID MHr O Tone Seq
0 SWP 01 · 1 MHt 0 Tone Remote
g)@] g]@] MONITOR
- @ ·q· 0"'"' RF SECTION MHt
es top "''"'I v onobto ~~: ,,, y OSCILLOSCOPE~
C:YfY:-§0;~. 0~'0"~ 2::.:©,' 0 ,;. .:~~~'
E• t W11tmeter
®)
T I '00
Squelch Volume CodeSynthlvl E1tle¥el
\,25~1 Eat
10 // Auto Normal
"'" • "" /' Col ''"'''" /c
~~o··ol Q .. l .'"0 0110
r RF 1" '
0"' ~ Col
Vo"
@
lm•!ile OpiJ
H1 g h st. W!dO 1m Low ~ N•rrow 't::f
CAUTION ~::! SII\Id Ott! Counter In E• tHont Oemod Oul BFO
© IUW Ill
® 0 ® ..... , 0 Hon1 0 ©
err
T 1507
FIGURE 4-20. BANDPASS CAVITIES SETUP
4-37
g ' ··o 011
Mod Oul E• I Modlll
@> ©
tr

A. Passband Adjustment
CAVITY & DUPLEXER TUNING BANDPASS ADJUSTMENT
1. Connect the Analyzer's RF In/Out to the in-service duplexer antenna port as shown in figure 4-21.
2. Set DISPLAY to Gen/Mon Mtr, FUNCTION switch to Generate FM, and MODULATION switch to off position.
3. Enter the receiver frequency.
4. Set the RF Step attenuator to -30 dB and the Variable control to mid-range, to allow adequate signal to get through a mistuned duplexer and quiet the receiver. Reduce the signal generator output, as necessary, to keep the receiver limiter meter reading below saturation.
5. Tuqe the pass-band knobs of the cavities in the duplexer receive leg, for a peak reading on the receiver limiter meter. Reduce the signal generator output, as necessary, to keep the receiver limiter meter reading below saturation. This completes the pass-band adjustment for the receiver leg.
6. Set the FUNCTION switch to Monitor FM and the attenuator to -30 dB. For low-power transmitters, it may be necessary to reduce the attenuator setting to unsquelch the monitor. Too high an attenuator setting or too tight a squelch setting will inhibit the display of frequency and deviation information.
7. Enter the transmitter frequency. Key the transmitter and tune the pass-band knobs of the cavities in the duplexer transmit leg for maximum power output. This completes pass-band adjustments.
4-38
~
.~
~
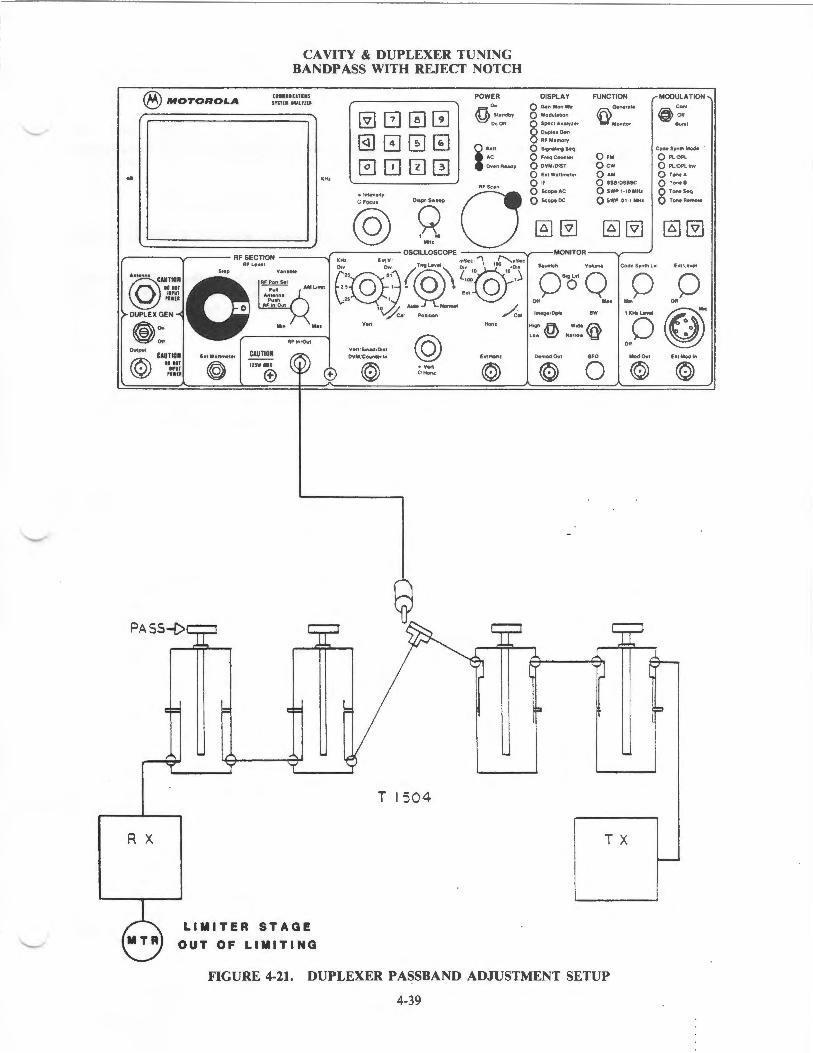
'--"'
®MOTOROLA
..
CAVITY & DUPLEXER TUNING BANDPASS WITH REJECT NOTCH
COIIUI ICAHOI$ USHIAIAlUU
""'
@J00C!J @]000 0800 • tnten111y
@ ~g·
POWER On
@standby Oc:OII
i .... AC
Oven Ready
AFSun
DISPLAY Q Gen MonMtr
Q Modulahon
Q Spec! Analyzer 8 Duple•Gen RFMemory
0 SognahngSeq
Q FraqCountar
0 DVM OIST
0 IE•! Wattmeter
0" Q ScopeAC
Q Scope DC
@] @]
FUNCTION r MODULATION ® Generate @ Coni
ou Monotor Buflt
Coda Synth Mode
0FM Q PL IDPL
O cw Q PLIDPllnw
0 AM Q Tone A
0 sse osasc O TonaB
Q SWP 1· 10 MHt O Tone Seq
0 SWP .01 · 1 MHt 0 Tone Remote
@]@] I §_]@] MONITOR
Sq11ekh Volume Code Syn!l'llwl fltlewel
~.o··o· Q .. l M .. O ~.0 ©)
< ··o Image Opl• BW
H1gh .ft. Wode {ffi Low ~ Narrow't::f"
r-----,.------ RF SECTION·~--- O~U~~ 0 ©'""""' CA~:~~~ o•"• "'""' ••.,•••• E~~•::©•§·~~ /@''~'"" "\ r©; ·~~s~, --
tiPUT 25 0 1 (10'' 100 0 ,.,1
'IWU + .2S 1 ht
DUPLEX GEN O 10 // Auto NOfmll ~On • / C•• •'"'"" /c., ~ M•n Ma•
Ofl ( AF tn /O...t ~ ··- lion a
@ Output
© CAUTIOM
oo•n II,Uf 'DWU
PASS~
E•tW•nmeter CAUTION
e ~ lnWIUI
®
ou Ver1 rSon•d Dolt DVM,Covnter In E•tHona DemociOvt BFO Mod Out
0 © © © • Ver1 © O Hom
T 1504
R X I I T X
LIMITER STAGE
OUT OF LIMITING
FIGURE 4-21. DUPLEXER PASSBAND ADJUSTMENT SETUP
4-39
E•tModln
©
CAVITY & DUPLEXER TUNING BANDPASS WITH REJECT NOTCH
B. Adjustment of Reject Notch on Receive Leg
1. Connect the Analyzer's RF In/ Out to the in-service duplexer as shown in figure 4-22. Disconnect the cable at the duplexer receiver port that comes from the receiver. Move the Analyzer's RF In/ Out cable from the duplexer antenna port to the duplexer receiver port. Connect a power-rated dummy load to the duplexer antenna port.
2. Set DISPLAY to Spectrum Analyzer, FUNCTION switch to Monitor, and attenuator to -30 dB. Verify that the display's center frequency reads the same as the transmit frequency in step A-7 above.
3. Key the transmitter and adjust the reject notch adjustments on the duplexer receive leg cavities for minimum signal on the display. Change the attenuator, as necessary, to keep the signal on the display.
4. Loosen the cavity reject adjustment nut and slide it within its slot while watching the display. Tighten the adjustment nut. Be careful not to mistune the rejection adjustment. Fine-tune the rejection adjustment by turning the bandpass knob a maximum + I -15 o. This completes the duplexer receiver leg reject notch adjustment.
4-40
~
~
~

~
....___.,
®MOTOROLA
••
CAVITY & DUPLEXER TUNING BANDPASS WITH REJECT NOTCH
COIMl/llCAHOIS SfSHIAIUUER
""'
@]12]0[!] @JGJ0~ 0000
' "
POWER 0"
@Standby
OcOU
i .... AC
o ... enReaCiy
@;~· ·o o···"'" ,-----.,.~---- RF SECTION---- OSCIL:~SCOPE
DUPLEX GEN ~~ .,Xo<mol
DISPLAY FUNCTION r MODULATION Q Gen MonMtr ®Gener~te @ Coni Q Modulahon 011 Q SpectAnalyrer MOnitOr Bunt 8 Duple•Gen
RFMemory
0 S•gnal'"g Seq Code Synth Mode
Q Freq Counter 0FM 0 PL 1DPL
0 DVM DIST O cw 0 PLOPLin•
0 E1t Wanmeter 0 AM 0 Tone A
0" 0 SSB DSBSC O TonaB
Q ScopeAC 0 SWP 1- 10 MH~ O Tone Seq
Q Scope DC 0 SWP OHMHz 0 Tone Remote
~ @) g)@] ~@] MONITOR
Squelch Volume Code Synlh l•l Ell lawai
0110~0· Q .. l M."o Olio Image Dpl• BW
(Qy:~!~i
0 .. ~·"~_·._._ ... _·:_;· --· ~;,@,V@\ ~~@J:i
® / Col p00,,.. /c
On Mtn ' 'Mu ~ Ver1 Cat Otl _ HO<"
1" '"' CO w~. ~
( RFin/Out /
'"Of}' ~· ~
....
@ Output
© CAUTIOM
~~ lOT IIPUT
PDWU
£•1 W•nmeler
@
,. -REJECT
I
~
\
\
CAUTIOM IZSWIU
®
\
\
\
\
~
e Yer1 /Sonadf0tll
OVM ICOUnler In E•IHonr Oemod Out
© • Vert O Honz © ©
'0"'- PO'W e: R LOA 0
FIGURE 4-22. DUPLEXER ADJUSTMENT SETUP; REJECT NOTCH ON RECEIVE LEG
4-41
8FO Mod Out hi Mod In
0 ® ©
TX

CAVITY & DUPLEXER TUNING BANDPASS WITH REJECT NOTCH
C. Adjustment of Reject Notch on Transmit Leg
1. Connect the Analyzer's RF In/Out to the in-service duplexer as shown in figure 4-23. Disconnect the cable at the duplexer transmitter port that comes from the transmitter. Move the Analyzer's RF In/Out cable from the duplexer receiver port to the duplexer transmission port. Reconnect the cable coming from the receiver to the duplexer receiver port. Disable the receiver PL.
2. Set DISPLAY to Gen/Mon Mtr, FUNCTION switch to Generate FM, and enter the receiver frequency.
3. Set the attenuator to -30 dB and the Variable control to mid-range, to allow adequate signal to get through the duplexer and quiet the receiver. Reduce the signal generator output, as necessary, to keep the receiver limiter meter below saturation.
4. Adjust the reject notch adjustments on the duplexer transmit leg cavities for minimum signal level on the receiver limiter meter. Change the signal generator output, as necessary, to keep the received signal up out of the noise and below saturation.
5. Loosen the cavity reject adjustment nut and slide it within its slot while watching the meter. Tighten the adjustment nut. Be careful not to mistune the rejection adjustment. Fine-tune the reject notch adjustment by turning the bandpass knob a maximum of +I -15 o.
6. Remove the test equipment and connect the duplexer back to the repeater. Check the duplexer for insertion loss according to its specifications.
4-42
~
~
~

® MOTOROLA
••
CAVITY & DUPLEXER TUNING BANDPASS WITH REJECT NOTCH
co••u•tu.no•s SUTI.AUlUU
. ..
[Y)[2]0[!] @J0[f]~
0800
POWER On
@ St1ndby
De Oft
i .... AC
OnnRtldy
RFSnn
- 0 • lnttnllly © .8.
DISPLAY Q Oen MonMtr
Q Modulthon § ......... , ... Oupj.eaGen
RFMtmCH'y
0 S~gneltng S.q
0 FreqCOUIIIet
0 DVM OIST
0 E•IWtllmtlfi
QIF Q Scop.AC
QikopeDC
@]@] r------...r----- RF SECTION OSCILLOSCOPE ~ MONITOR
FUNCTION rMOOULATION ®Gentrllt @ Cont Ofl
MonitOr llllrtl
Code Srntl'l MoM
o ... 0 Pl10Pl
Ocw 0 PLIDPlln't
0 ... Or-A 0 sse,osasc 0 TontB
0 SWP 1- 10 MHI 0 TontStq
0 SWP .01·1 MHI 0 Tontfttmott
~@] I ~@] RF Lt¥tl KHI/ ht Il l mStc "\ ~
@Antonno CA~~~ 0"'• ... ~••• Eo""@§~~ (;@''~""'~ {:~©' ,,. ··~~· Squelch Vol11mt JcodeSrnthlvt E•ILtt~el
IIPIT 2.5 0 .t - 0 + 0 MIWf. _2S 1 ht
DUPLEX GEN 0 to // Auto Notm* /
~ , , /'C" •••"- / c,1
~On ""' "••) ··"
Oft ( RF In/Out ~ / @ Ovtp.ll
©
RX
CAUTIO I IDIOT
II,UT rtwu
I!I!Wtn~tet
<@
r
CAUTIOI ltSWUI
®
LIMITER STAGE OUT OF LIMITING
Yt11/ 11t1HfDill
OYMtCounter In
e ~ ..... , o-.,
50""-
-vvvvv-
-..
htHoru:
@
Of.o··rs Q .. l .. ~0 Ofto Image Dph
De!NHt~t
©
~
ow
BFO
0
\
\
35©5 .... o.. E•tMod'"
© ~
~
REJECT-
FIGURE 4-23. DUPLEXER ADJUSTMENT SETUP; REJECT NOTCH ON TRANSMIT LEG
4-43
DESENSITIZATION TEST IN-SERVICE DUPLEXER
Perform this test after retuning a duplexer or after detecting inadequate isolation between transmitter and receiver. The following conditions may make a duplexer appear mistuned: ~
• High VSWR antenna
• IM between the repeater's transmitter and an external signal
• Faulty cables or connectors
• Improper cable length or configuration
Normally, repairing or replacing cables solves the problem without retuning. Check the duplexer manufacturer's data sheets to determine proper installation.
1. Connect the Analyzer to the repeater/ duplexer under test, as shown in figure 4-24. Connect the RF In/Out to the duplexer's antenna port through an RF tap-off isolating device.
CAUTION
To prevent RF overload into the generate, provide sufficient isolation between the tap-off and the straight-through feed. For example a 1000 W transmitter requires 50 dB isolation.
2. Connect the DVM input to the receiver speaker connection. Disconnect the cable from the RF In/Out to prevent the transmitter from keying up on repeat.
3. Set DISPLAY to Gen/ Mon Mtr, FUNCTION to Generate FM, and enter the receiver frequency.
4. Set the attenuator to -60 dB and the Variable control to mid-range.
5. Adjust the 1 KHz Level control for 3.0 KHz DEY on the screen.
6. Reconnect the cable from RF In/ Out to the RF tap-off and enable the transmitter to key-up. For example, it may be necessary to provide 0.75 KHz PL/ DPL deviation for a PL/DPL accessed repeater.
7. With this generated signal introduced to the RF tap-off, adjust the signal generator level Step attenuator and the Variable control to the 12 dB SINAD level as indicated on the display. Note the generator RF LEVEL.
8. Disable the transmitter from key-up. Readjust the signal generator to obtain 12 dB SINAD again. Note the generator RF LEVEL.
9. The difference between the RF LEVEL for 12 dB SINAD with the transmitter off (step 8) and with the transmitter on (step 7), is the amount of system desensitization.
10. More than 2 dB desensitization may indicate:
• defective antenna system
• loose shields
• transmitter spurs
• improper or defective duplexer cable.
Check them all, before attempting to retune the duplexer.
4-44
..--.....
~

, ~
®MOTOROLA
..
COMMUI ICAT IOI S USTE MAIAlUU
DESENSITIZATION TEST IN-SERVICE DUPLEXER
@][2]0[!]
@]00~ 0800
POWER 0"
ft_ SIIndby
'&} OcOII
i Bo10
AC
OvenRt•dy
RF Sc1n
© ·q·o DISPLAY
Q Gen Mon Mtr
Q Modul111on
Q Spect Analyler 8 Ouple • Gen
RF Memory
0 S•gnehngSeq
Q FreqCounter
0 DVM OIST
Q Eat W1ttmeter
0 " Q Scope AC
Q Scope DC
@] @]
FUNCTION r MODULATION ® Generete @ Coni 010
MOntiOr Burst
Code Synth Mode
0 FM Q PlDPl
0 cw 0 Pl OPlln-.
0 AM Q Tol'leA
Q SSB OSB SC Q Tone B
Q SWP 1·10 MHl Q Tone Seq 0 SWP 01 · 1 MH1 0 ToneR1mote
@]@] @]@] ,-----,~---- RF SECTION~--- OSCIL:~SCOPE -------
@'""""' CA~:~~~ 0'"• "''"" v'"' "' (~~•:@•§·~~ /@'"'""'" 2:·~©-"', ·~';,~," ,--
MONITOR
Squel<:h Volume Code S~nth lvl C.tlevel
ti,UT 25 0 , f/0\' IOO 0 ,J 'own + 25 I Ell
DUPLEX GEN 0 10 // A wto Notmlt
®"" :/<" .,.,,_ ~
010o ··a · Q .. l MmO 0 011
Outpul
©
- - " Image Opt• BW
Htgh .fi_ Wtde ~
Low ~ Narrow 'Y' 010 RF in!Owt @ CAUTIOIIII h i W1 t1 mete t J CAUTIO Ill ~ ~lr1 IStnld Dtl l 0
~~.:~~ I ~ ' , ,-·'~'\ , DVM Cwntet In E•l Hofll Oemo<IOul BFO
,own ~
TX
1UW IUJ
® ..... , O Horll © ©
v~'< T EIHU OR y DU1o41o4Y l.OAO
DU Pl.£XER
58-80313837 OR SLN 63218
RF TAP-OFF
FIGURE 4-24. DESENSITIZATION TEST SETUP
4-45
0
RX
'"0 {}' ou ~
Mod Out Eat Modln
© ©

FERRITE ISOLATOR TEST
1. Use the Analyzer to test isolators for insertion loss and isolation. Connect the Analyzer to the isolator under test, as shown in figure 4-25.
2. Set DISPLAY to Duplex Gen and FUNCTION switch to Monitor FM. Enter the transmitter frequency and an offset ofO MHz.
3. Use an RF adapter (bullet) to temporarily connect together the cables to the isolator. Turn on the Duplex Gen switch. Set DISPLAY to Gen/Mon Mtr and attenuator to 0 dB.
4. Note the RF LEVEL input value in dB, on the display. Use this value as the reference level to determine insertion loss and isolation values.
5. Reconnect the cables to the isolator; Duplex Gen to isolator input and RF In/Out to isolator output.
6. Note the RF LEVEL input value in dB, on the display. Subtract this value from the value found in step 4, to obtain the insertion loss in dB.
7. Reverse the connections to the isolator and again note the RF LEVEL input value in dB. Subtract this value from the value found in step 4, to obtain the isolation value in dB for the isolator under test.
8. Test dual isolators (connected in series) by the same procedure.
4-46
r--....
,---..,
~ ..

••
®MOTOROLA CDIMUIICATIOIS IUTEIAIALUU
FERRITE ISOLA TOR TEST
. ..
[Y][2]0[!] @]000 0000
POWER 0•
ft St11ndby
'W De Oil
i BoU
AC
O...enReady
© ·q·o DISPLAY
0 Gen Mon Mtr
O Modul1t10n
Q Spec.tAnal.,ur 8 DupteoGen RFMemory
0 5'9"•""9 S.q Q Fr•qC~nter Q DVM OIST
Q Eo!W•tlmeter
0" Q ScopeAC
0 5COP4'0C
@] @]
FUNCTION r MODULATION
®Gene•••• @ Cont Ott Mon1tor Buill
Code Synth Mode
O•M Q Pl OPl
Ocw Q Pl OPllflv
0 AM Q ToneA
0 sse osasc O Tonel
0 SWP 1· 10MHa O Tonekq
0 SWP .01 · 1 MH1 0 ToneReii'\Ote
@]@] @]@]
Squelch
lmege Dpll
Volumt
ow
Code Syntl'll¥1 fit Le•el
Oil
MONITOR ,------..,.;------ RF SECTION ---- DSCIL:~SCOPE -------
@A•lo••o CA~~~~ OS!ep "'"'' Yonoblo E~~•:@•§•~ (;~'"'""''\ 2::ey•", ~~~~~' ~
IIPUT 2S 0 1 - 0 \ \ 0 I
POW(II .2S 1 Eat
DUPLEX GEN O tO // Avto Noun•! / ~o. /Cot .,.,,_ /cot ~ Mu Yert
Ott RF In/Out /
......
@
Ot.o··o· Q .. l M •• o o ··o f{;f ~· ~
OUIP\11 CAUTIOM
DO lOT IIPUT 'IWU
h!Wanmeter
(@
I I I I I L
CAUTIOM
1f$W lUI
®
Vert/S•n•d Chtl OVMICcKmlerln
e ©
ISOLATOR
-1 I RF ADAPTOR
(BULLET)
• Ver1 0 Hot"tl
I I I I I
J
E•tHom Oemod 0111
© © IFO .... , ... h!Modln
0 ~ ~
FIGURE 4-25. FERRITE ISOLATOR TEST SETUP
4-47

gp-p
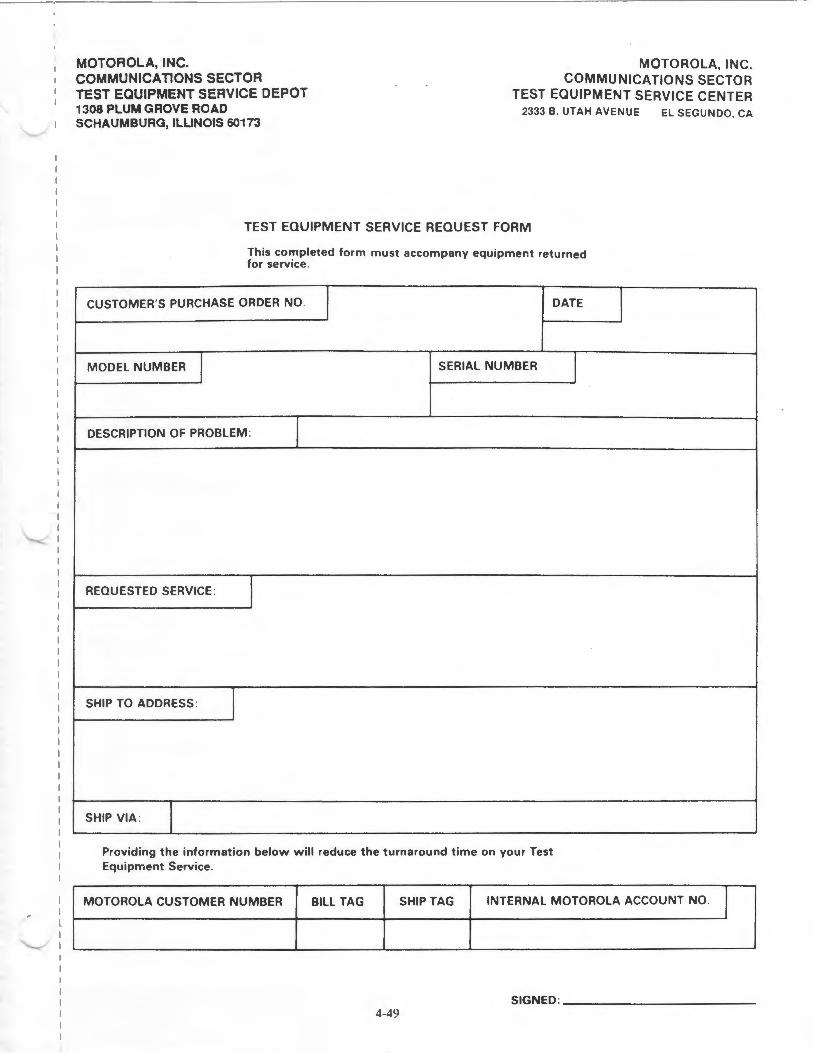
MOTOROLA, INC. COMMUNICATIONS SECTOR TEST EQUIPMENT SERVICE DEPOT 1308 PLUM GROVE ROAD
MOTOROLA, INC. COMMUNICATIONS SECTOR
TEST EQUIPMENT SERVICE CENTER
~ , SCHAUMBURG, ILUNOIS 60173 2333 B. UTAH AVENUE EL SEGUNDO, CA
,.
TEST EQUIPMENT SERVICE REQUEST FORM
This completed form must accompany equipment returned for service.
CUSTOMER'S PURCHASE ORDER NO. I
MODEL NUMBER I SERIAL NUMBER
DESCRIPTION OF PROBLEM : I
REQUESTED SERVICE : I
SHIP TO ADDRESS : I
SHIP VIA : I Providing the information below will reduce the turnaround time on your Test Equipment Service.
DATE
I
I
MOTOROLA CUSTOMER NUMBER BILL TAG SHIP TAG INTERNAL MOTOROLA ACCOUNT NO. 1
I
SIGNED :------------4-49

--

'f.J O
PE
RA
TO
R'S
MA
NU
AL
C
OM
MU
NIC
AT
ION
S S
YS
TE
M A
NA
LY
ZE
R
\ R
-2001 D
68P81069A
66-B
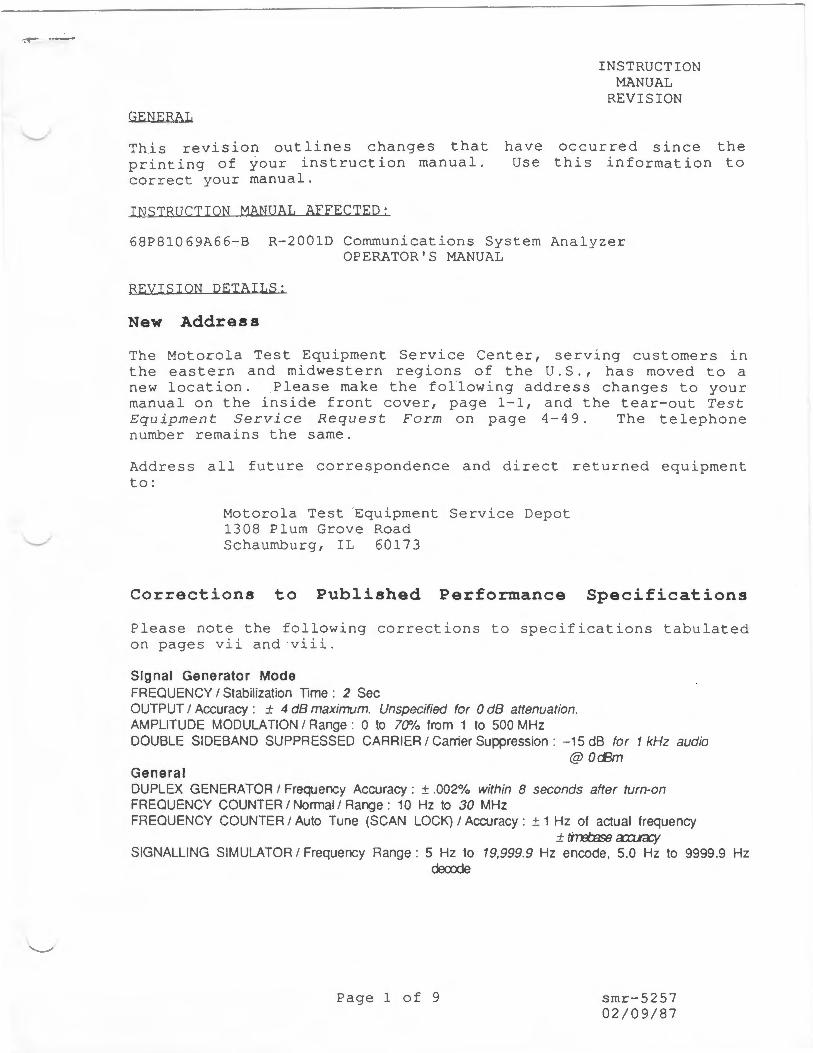
"';~ --
"-....__./
'--"
'----..../
GENERAL
INSTRUCTION MANUAL
REVISION
Th.is revision outlines changes that printing of your instruction manual. correct your manual.
have Use
occurred since the this information to
INSTRUCTION MANUAL AFFECTED:
68P81069A66-B R-20010 Communications System Analyzer OPERATOR'S MANUAL
REVISION DETAILS:
New Address
The Motorola Test Equipment Service Center, serving customers in the eastern and midwestern regions of the U.S., has moved to a new location. Please make the following address changes to your manual on the inside front cover, page 1-1, and the tear-out Test Equipment Service Request Form on page 4-4 9. The telephone number remains the same.
Address all future correspondence and direct returned equipment to:
Motorola Test -Equipment Service Depot 1308 Plum Grove Road Schaumburg, IL 60173
Corrections to Published Performance Specifications
Please note the following corrections to spe c ifications tabulated on pages vii and viii.
Signal Generator Mode FREQUENCY I Stabilization Time : 2 Sec OUTPUT I Accuracy : ± 4 dB maximum. Unspecified for 0 dB attenuation. AMPLITUDE MODULATION I Range: 0 to 7(J% from 1 to 500 MHz DOUBLE SIDEBAND SUPPRESSED CARRIER I Carrier Suppression : -15 dB for 1kHz audio
@Ocftn General DUPLEX GENERATOR I Frequency Accuracy: ± .002% within 8 seconds after turn-on FREQUENCY COUNTER I Normal I Range : 10 Hz to 30 MHz FREQUENCY COUNTER I Auto Tune (SCAN LOCK) I Accuracy : ± 1 Hz of actual frequency
± tin:tase a:n.rc:cy SIGNALLING SIMULATOR I Frequency Range: 5 Hz to 19,999.9 Hz encode, 5.0 Hz to 9999.9 Hz
dea:lde
Page 1 of 9 smr-5257 02/09/87

'-.._....;
The following specification has been added, which is applicable to units shipped after January 1, 1987.
SERIAL PRINTER INTERFACE PORT
Data Format: Connector Type:
Signals: Baud Rate:
Parity: Stop Bits:
Transmit Bits: Auto Line Feed:
Serial per EIA Standard RS-232-C S-pin DIN Printer Data, Data Set Ready, Ground Selectable; 75, 150, 300, 600, 1200, 2400,4800,or9600 Selectable; odd, even, or no parity Selectable; 1 or 2 per character Selectable; 7 or 8 per character Selectable on or off
New Product Features {on units shipped after January 1, 1987)
All of the following changes rev is ions which included the features:
are with following
respect to enhancements
software and new
• added Print Screen utility and serial printer port as a standard feature;
• added DTMF encode and decode capability as a standard feature;
• simplified system part number screen, Special Function "99", to show only system version numbers and not file version numbers.
Page 2-7. The Ext Level control is also used to set the output level for DTMF encode signals, in addition to controlling the modulation level produced by external inputs.
A low impedance signal generator, connected to the Ext Mod In BNC-type connector, will disable the DTMF encoder.
Page 2-8. In addition to setting the vertical input gain for the oscilloscope and the sensitivity for the frequency counter, the Vert coarse (outside) and vernier (center) control knobs also set the sensitivity of the DTMF decoder. This applies to decoding signals offthe-air as well as from the front panel vertical input (baseband mode) .
Page 2 of 9 smr-5257 02/09/87

\._,"
Page 3-7. For Special Function "9 9", the system part number screen will be displayed for 7 to 8 seconds, before normal operation is resumed. Only one . screen is necessary for the Main system and all possible options, where previously there was one screen for each. In addition to showing the software version numbers, this screen also shows a true checksum value for the softwares, as well as the card cage slot position in which any options are installed. An example of this screen is shown.
Screen
SPECIAL FUNCTION 99
SYSTEM
MAIN SECOM
VERS CHKSUM SLOT
02A83 (CSC) 02AB2 (BB6)
A14 A12
Special Functions "75" and "15", "16", and "17" are described in the following sections.
Print Operating Instructions
Special Function "75" allows you to select a specific RS-232-C configuration. The default values are given in the following example.
PRINTER INfT (SPFC 75) SEL)-0) EXIT
BAUD RATE SEL 5) 1200 BAUD
STOP BITS SEL 1) 1 STOP BIT
PARITY SEL 1) NO PARITY
AUTO LINE FEED 1) YES
TRANSMIT BITS I CHAR 2) 8 BITS
Printer Port Configuration
Using Special Function "75", you can set up the System Analyzer for a specific RS-232 configuration. When you select this Special Function, the Printer Init screen is displayed, as shown above. This screen shows the default values in the System Analyzer that occur when Special Function "79" (default reset) is performed. To change any of these values, move the cursor to the line you want to change and enter the number.
Page 3 of 9 smr-5257 02/09/87

,.
'-......./
The options for each of the selections are as follows:
Baud Rate
1 75 baud 2 150 baud 3 300 baud 4 600 baud 5 1200 baud 6 2400 baud 7 4800 baud 8 9600 baud
Auto Line Feed
1 on 2 off
Stop Bits
1 1 stop bit/character 2 2 stop bits/character
Parity
1 no parity 2 even parity 3 odd parity
Transmit Bits
1 7 bits/character 2 8 bits/character
If you change any of these values, the changes are retained in nonvolatile memory until Special Function "79" is selected.
Printer Connection
On the right side of the System Analyzer, at the rear, is a S-pin DIN type printer output connector. This connect ion can be used to generate and receive RS-232-C signals similar to those in a personal computer. When the System Analyzer is properl y connected to a printer and correctly configured (see above), you can print the data displayed on the screen.
Many types Analyzer, Motorola:
o f printers can be used with the System including the following printers fr o m
RT-RX80 /8 14 3
RT-RXS0 /8 14 3/2 20 (220 Vo lt versi on)
The printer cable accessory is a Motorola RTK-4081A. You can als o u s e a serial printer cable for an Appl e IIc®.
® Apple IIc is a registered trademark of Apple Computer Corp .
Page 4 of 9 smr-5257 02/09/87

-·
\....__...;
'-._../
Printing the Screen
To print a screen, simultaneously press the 0 key and the < (left cursor) key. Any characters displayed on the screen are printed directly. If a bar graph is displayed, the # character is printed to show the length of the bar. Wave forms cannot be printed.
If you try to print the screen when the printer is off line, a "PRINTER BUSY" message is displayed for 3 seconds (unless a waveform screen is displayed) . If the System Analyzer's character buffer is full, a "WAIT" message will appear for about 3 seconds. If the printer accepts the output, you'll hear a beep from the System Analyzer's speaker.
Page 3-11 • SIGNALING SEQUENCE
Dual Tone Multiple Frequency (DTMF) encode and decode capability has been added to the System Analyzer.
• SIGNALING SEQUENCE MENU
With the addition of the DTMF functions, the signaling sequence menu shown in Figure 3-21 is changed to the following:
SIGNALING SEQUENCE MODE SEL) o-
1 ) A I 8 ENCODE 2) 5 I 6 TN ENCODE I DECODE 3) SElECT V ENCODE I DECODE 4) PL DECODE 5] DPL DECODE 6] GENERAL SEQ ENCODE I DECODE 7] MOBILE TELEPHONE 8] DTMF ENCODE I DECODE
Page 5 of 9 smr-5257 02/09/87

'-...__./
'-..__./
DTMF Encoder /Decoder Instructions
• DTMF ENCODE
Operating
DTMF encode mode may be entered from either the Signaling Sequence screen, by entering 8 from the keypad, or by initiating Special Function 11 15 11 or 11 16 11
•
The following figure shows the DTMF screen, which is used for both encode and decode mode. The lower half of the screen is for DTMF encode.
SIGNALING SEQUENCE MODE SEL ) -1 ) RESET DECODE
DTMF DECODE
DTMF ENCODE SEL) -PRESS KEY FOR DTMF TONE PRESS LEFT CURSOR FOR BURST
BURST ENCODE NUMBER 123456789.0#ABCD
TONE ) 01 00 MS DELAY ) 0050 MS
Manual Keypad Entry
When you move the cursor to the SEL area (opposite DTMF ENCODE), a help message, shown in ita~ics above, automatically appears. If you press and hold a DTMF key at this time, the tone is generated and remains on until you release the key.
The active DTMF keys are digits 1 through 9 and 0, and the 6 front panel up/down selector keys immediately below the DISPLAY, FUNCTION, and MODULATION LED indicators. The normal function of these keys is disabled in the DTMF mode, so be sure to preselect the desired function and code synthesizer mode before entering the DTMF screen. (See Setting Modu~ation Leve~ below for more information on this subject.) The DTMF symbols are screened on the front panel above these keys on current production units. For users who retrofit this feature, the symbols are assigned left to right as follows: A, B, C, D, *, and #.
Page 6 of 9 smr-5257 02/09/87
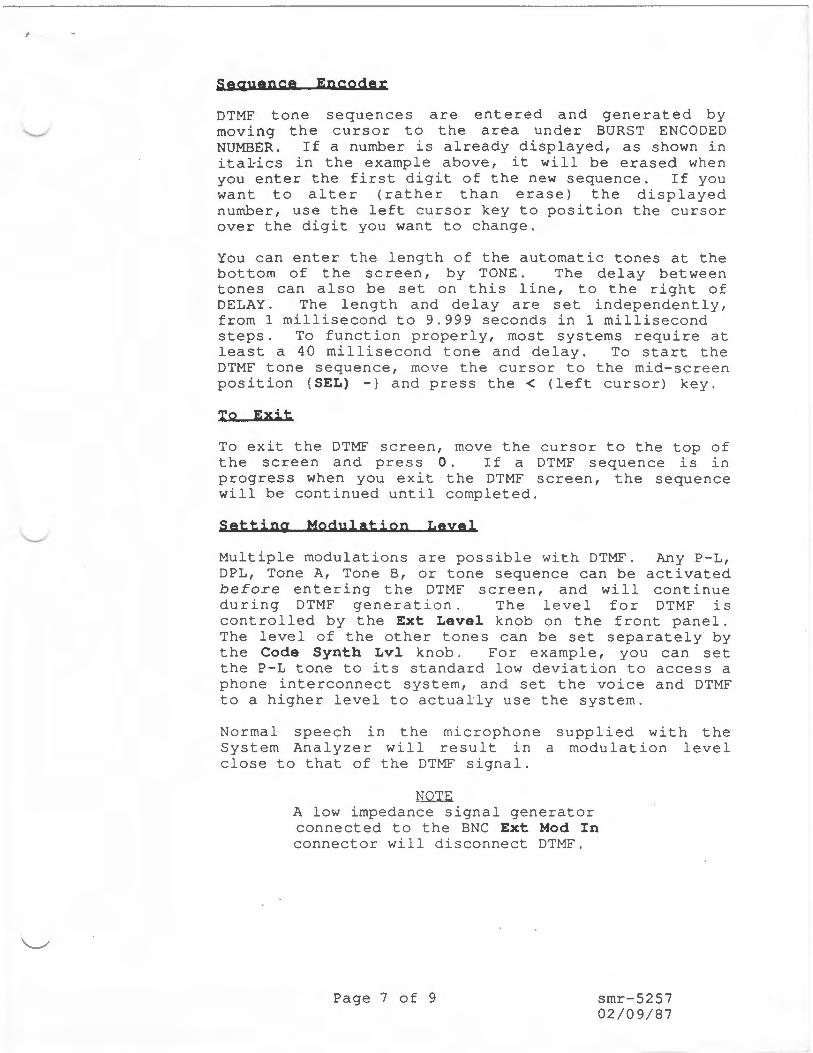
3
~
'---'
"--../
Seguence Encoder
DTMF tone sequences are entered and generated by moving the cursor to the area under BURST ENCODED NUMBER. If a number is already displayed, as shown in ital-ics in the example above, it wi 11 be erased when you enter the first digit of the new sequence. If you want to alter (rather than erase) the displayed number, use the left cursor key to position the cursor over the digit you want to change.
You can enter the length of the automatic tones at the bottom of the screen, by TONE. The delay between tones can also be set on this line, to the right of DELAY. The length and delay are set independently, from 1 millisecond to 9.999 seconds in 1 millisecond steps. To function properly, most systems require at least a 40 millisecond tone and delay. To start the DTMF tone sequence, move the cursor to the mid-screen position {SEL) -) and press the < (left cursor) key.
To Exit
To exit the DTMF screen, move the cursor to the top of the screen and press 0. If a DTMF sequence is in progress when you exit the DTMF screen, the sequence will be continued until completed.
Setting Modulation Leyel
Multiple modulations are possible with DTMF. Any P-L, DPL, Tone A, Tone B, or tone sequence can be activated before entering the DTMF screen, and will continue during DTMF generation. The level for DTMF is controlled by the Ext Level knob on the front panel. The level of the other tones can be set separately by the Code Synth Lvl knob. For example, you can set the P-L tone to its standard low deviation to access a phone interconnect system, and set the voice and DTMF to a higher level to actually use the system.
Normal speech in the microphone supplied with the System Analyzer will result in a modulation level close to that of the DTMF signal.
lillT.E. A low impedance signal generator connected to the BNC Ext Mod In connector will disconnect DTMF.
Page 7 of 9 smr-5257 02/09/87

. ,
'-...__../
Generator Dev i ati o n Setup
Setting the deviation level for DTMF modulation requires the use of a Special Function, to activate the DTMF encoder without being in the signaling sequence screen. The procedure is as follows:
1. Select the Gen/Mon Mtr display and switch to the Generate function.
2. Enable Special Function "16" by pressing both cursor control keys simultaneously and entering 16 .
3. Press and hold any DTMF key and adjust the Ext Level pot to the desired deviation level - typically 3 kHz peak deviation.
4. Disable Special Function " 16" by entering Special Function "17".
5. Operate the manual or sequence encoder as described in the paragraphs above.
• DTMF DECODE
DTMF decode mode may be entered from either the Signaling Sequence screen , by entering 8 from the keypad, or by initiating Special Function "15".
The upper half of the DTMF screen shown in the previous section applies to DTMF decode. When you have selected this screen, DTMF decode is automatic. The decoded DTMF digits are displayed sequentially under DTMF DECODE. Up to 30 digits can be displayed. To decode correctly, the length of the tones must be at least 40 milliseconds and there must be at least a 40 millisecond delay between tones. To clear the DTMF decode line, enter 1 at the top of the screen.
DTMF Decoder Sensitivity
The DTMF decoder receives its signal from the oscilloscope's CRT input. To decode reliably, the signal amplitude must be adjusted for a peak-to-peak level of 20% to 80% of the total screen height when displayed on the oscilloscope. Use the Vert sensitivity controls to adjust the amplitude of the input signal. Do this before entering the DTMF screen.
The p r ocedure for setting sensitivity depends upon the input source you select. The default condition is to decode the signal from the monitor receiver (off-the-air). To decode from the front panel's Vert Input , you need to select ~pecial Function "11", b a seband. You can cancel baseband operation by en t ering Special Function "10".
Page 8 of 9 smr-5257 02/09/87

,• .
"-_../
Setting PTMF Decoder Sensitiyity
1. Select the input port- RF or baseband, as described above - and switch to the Monitor function.
2. Apply the external signal to the selected port. 3. Select the Scope AC display (for baseband) or the
Modulation display (for RF) 4. Calibrate the input signal by adjusting the scope
Vert coarse (outside) and verier (center) control knobs until the trace covers between 20% and 80% o f the screen.
5. Re-enter the DTMF mode.
Page 9 of 9 smr-5257 02/09/87

/
.....__./
MOTOROLA, INC. MOTOROLA, INC. COMMUNICATIONS SECTOR TEST EQUIPMENT SERVICE DEPOT 1308 PLUM GROVE ROAD SCHAUMBURG, ILLINOIS 60173
COMMUNICATIONS SECTOR TEST EQUIPMENT SERVICE CENTER
2333 B. UTAH AVENUE EL SEGUNDO, CA
TEST EQUIPMENT SERVICE REQUEST FORM
This completed form must accompany equipment returned for service.
CUSTOMER'S PURCHASE ORDER NO. I DATE
MODEL NUMBER I SERIAL NUMBER
DESCRIPTION OF PROBLEM : I
REQUESTED SERVICE : I
SHIP TO ADDRESS : I
SHIP VIA : I Providing the information below will reduce the turnaround time on your Test Equipment Service.
I
I
MOTOROLA CUSTOMER NUMBER BILL TAG SHIP TAG INTERNAL MOTOROLA ACCOUNT NO . I
I
!
SIGNED : __________ _
4-49