test and item specifications october...
TRANSCRIPT

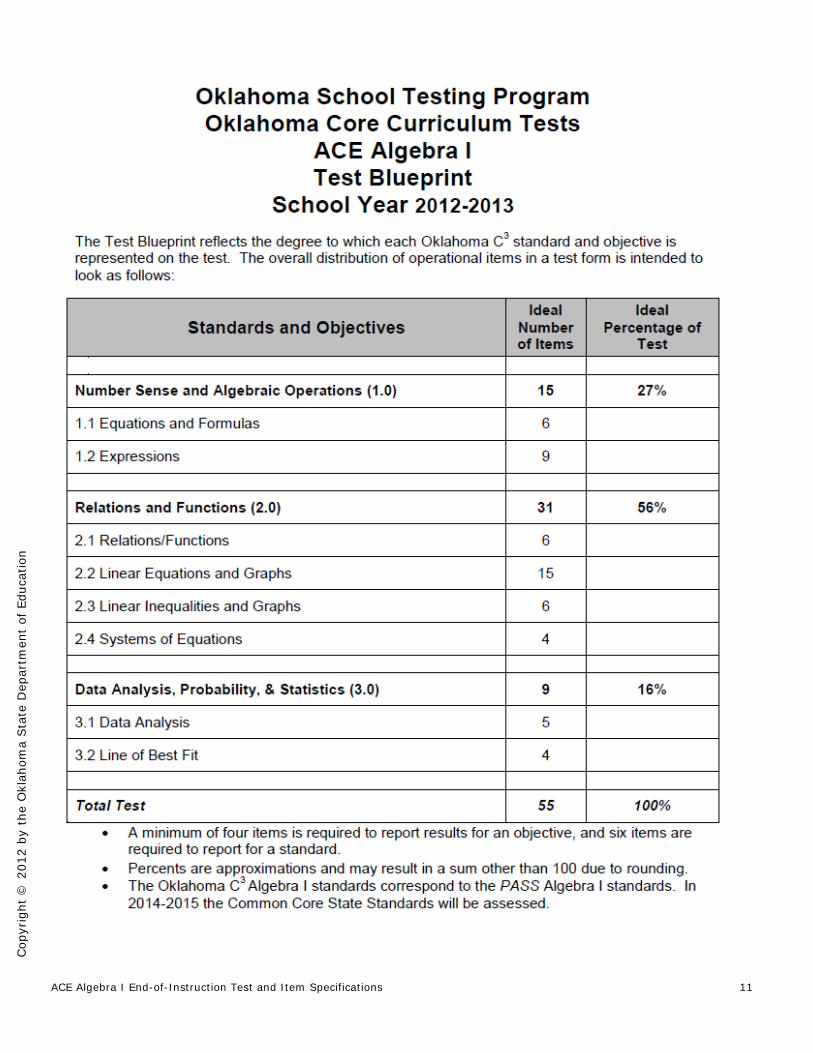
OKLAHOMA SCHOOL TESTING PROGRAM OKLAHOMA CORE CURRICULUM TESTS
TEST AND ITEM SPECIFICATIONS October 2012
End-of-Instruction ACE Algebra I
ACE Algebra I End-of-Instruction Test and Item Specifications Revised October 2012


ACE Algebra I End-of-Instruction Test and Item Specifications 3
Oklahoma School Testing Program Test and Item Specifications
ACE Algebra I End-of-Instruction
Purpose
The purpose of this test is to measure Oklahoma students’ level of proficiency at the end of instruction in Algebra I. On the ACE Algebra I End-of-Instruction (EOI) test, students are required to respond to a variety of items linked to the Algebra I content standards identified in the Oklahoma C3 Standards.
Each Algebra I test form will test each identified content standard and objective listed below. The following content standards and objectives are intended to summarize the knowledge as identified in Oklahoma C3 Standards.
Copyright © 2012 by the Oklahoma State Department of Education. All rights reserved. Only State of Oklahoma educators and citizens may copy, download, and/or print the document, located online at http://ok.gov/sde/test-support-teachers-and-administrators. Any other use or reproduction of this document, in whole or in part, requires written permission of the Oklahoma State Department of Education.
Oklahoma C3 Standards Algebra I
Content Standards and Objectives
Number Sense and Algebraic Operations
Equations and Formulas (1.1) Expressions (1.2)
Relations and Functions
Relations and Functions (2.1) Linear Equations and Graphs (2.2) Linear Inequalities and Graphs (2.3) Systems of Equations (2.4)
Data Analysis, Probability, and Statistics
Data Analysis (3.1) Line of Best Fit (3.2)

ACE Algebra I End-of-Instruction Test and Item Specifications
Cop
yrig
ht ©
201
2 by
the
Okl
ahom
a Sta
te D
epar
tmen
t of
Edu
catio
n
4
MATHEMATICS CONTENT STANDARDS
Algebra I (Updated August 2006)
The following skills are required of all students completing Algebra I. Major Concepts should be taught in depth using a variety of methods and applications (concrete to the abstract). Maintenance Concepts have been taught previously and are a necessary foundation for this course. The major concepts are considered minimal exit skills, and districts are strongly encouraged to exceed these skills when building an Algebra I curriculum. Visual and physical models, calculators, and other technologies are recommended when appropriate and can enhance both instruction and assessment.
Standard 1: Number Sense and Algebraic Operations—The student will use expressions and equations to model number relationships.
1. Equations and Formulas a. Translate word phrases and sentences into expressions and equations
and vice versa.
b. Solve literal equations involving several variables for one variable in terms of the others.
c. Use the formulas from measurable attributes of geometric models (perimeter, circumference, area and volume), science, and statistics to solve problems within an algebraic context.
d. Solve two-step and three-step problems using concepts such as rules of exponents, rate, distance, ratio and proportion, and percent.
Oklahoma C3 Standards
MAJOR CONCEPTS MAINTENANCE CONCEPTS
Number Systems and Algebraic Operations—Polynomials, Exponents, Expressions
Number Sense & Algebraic Reasoning—Equations, Inequalities, Exponents, Rational Numbers
Relations and Functions—Linear Functions & Slope Formulas
Geometry—Volume, Surface Area, Ratio, Proportion, Formulas
Data Analysis, Statistics, & Probability—Tables, Graphs, Charts, Scatter Plots
Data Analysis & Statistics—Graphical Representations, Measures of Central Tendency

ACE Algebra I End-of-Instruction Test and Item Specifications 5
Cop
yrig
ht ©
201
2 by
the
Okl
ahom
a Sta
te D
epar
tmen
t of
Edu
catio
n
2. Expressions a. Simplify and evaluate linear, absolute value, rational and radical
expressions. b. Simplify polynomials by adding, subtracting, or multiplying. c. Factor polynomial expressions.
Standard 2: Relations and Functions—The student will use relations and functions to model number relationships.
1. Relations and Functions a. Distinguish between linear and nonlinear data. b. Distinguish between relations and functions. c. Identify dependent and independent variables, domain and range. d. Evaluate a function using tables, equations, or graphs.
2. Linear Equations and Graphs
a. Solve linear equations by graphing or using properties of equality.
b. Recognize the parent graph of the functions y = k, y = x, y = |x|, and predict the effects of transformations on the parent graph.
c. Slope
I. Calculate the slope of a line using a graph, an equation, two points, or a set of data points.
II. Use the slope to differentiate between lines that are parallel, perpendicular, horizontal, or vertical.
III. Interpret the slope and intercepts within the context of everyday life (e.g., telephone charges based on base rate [y-intercept] plus rate per minute [slope]).
d. Develop the equation of a line and graph linear relationships given the following: slope and y-intercept, slope and one point on the line, two points on the line, x-intercept and y-intercept, a set of data points.
e. Match equations to a graph, table, or situation and vice versa.
3. Linear Inequalities and Graphs a. Solve linear inequalities by graphing or using properties of inequalities. b. Match inequalities (with 1 or 2 variables) to a graph, table, or situation
and vice versa. 4. Solve a system of linear equations by graphing, substitution, or elimination.

ACE Algebra I End-of-Instruction Test and Item Specifications
Cop
yrig
ht ©
201
2 by
the
Okl
ahom
a Sta
te D
epar
tmen
t of
Edu
catio
n
6
*5. Nonlinear Functions
a. Match exponential and quadratic functions to a table, graph, or situation and vice versa.
b. Solve quadratic equations by graphing, factoring, or using the quadratic formula.
Standard 3: Data Analysis, Probability, and Statistics—The student will use data analysis, probability, and statistics to formulate and justify predictions from a set of data.
1. Data Analysis
a. Translate from one representation of data to another and understand that the data can be represented using a variety of tables, graphs, or symbols and that different modes of representation often convey different messages.
b. Make valid inferences, predictions, and/or arguments based on data from graphs, tables, and charts.
c. Solve two-step and three-step problems using concepts such as probability and measures of central tendency.
2. Collect data involving two variables and display on a scatter plot; interpret results using a linear model/equation and identify whether the model/ equation is a line best fit for the data.
Note: Asterisks (*) have been used to identify standards and objectives that must be assessed by the local school district. All other skills may be assessed by the Oklahoma School Testing Program (OSTP).
ACE Algebra I End-of-Instruction Test and Item Specifications 7
Cop
yrig
ht ©
201
2 by
the
Okl
ahom
a Sta
te D
epar
tmen
t of
Edu
catio
n
PROCESS STANDARDS
High School
The National Council of Teachers of Mathematics (NCTM) has identified five process standards: Problem Solving, Reasoning and Proof, Communication, Connections, and Representation. Active involvement by students using these processes is likely to broaden mathematical understandings and lead to increasingly sophisticated abilities required to meet mathematical challenges in meaningful ways.
Standard 1: Problem Solving
1. Apply a wide variety of problem-solving strategies (identify a pattern, use equivalent representations) to solve problems from within and outside mathematics.
2. Identify the problem from a described situation, determine the necessary data and apply appropriate problem-solving strategies.
Standard 2: Communication
1. Use mathematical language and symbols to read and write mathematics and to converse with others.
2. Demonstrate mathematical ideas orally and in writing.
3. Analyze mathematical definitions and discover generalizations through investigations.
Standard 3: Reasoning
1. Use various types of logical reasoning in mathematical contexts and real-world situations.
2. Prepare and evaluate suppositions and arguments.
3. Verify conclusions, identify counter-examples, test conjectures, and justify solutions to mathematical problems.
4. Justify mathematical statements through proofs.
Standard 4: Connections
1. Link mathematical ideas to the real world (e.g., statistics helps qualify the confidence we can have when drawing conclusions based on a sample).
2. Apply mathematical problem-solving skills to other disciplines.
3. Use mathematics to solve problems encountered in daily life.
4. Relate one area of mathematics to another and to the integrated whole (e.g., connect equivalent representations to corresponding problem situations or mathematical concepts).

ACE Algebra I End-of-Instruction Test and Item Specifications
Cop
yrig
ht ©
201
2 by
the
Okl
ahom
a Sta
te D
epar
tmen
t of
Edu
catio
n
8
Standard 5: Representation
1. Use algebraic, graphic, and numeric representations to model and interpret mathematical and real-world situations.
2. Use a variety of mathematical representations as tools for organizing, recording, and communicating mathematical ideas (e.g., mathematical models, tables, graphs, spreadsheets).
3. Develop a variety of mathematical representations that can be used flexibly and appropriately.
ACE Algebra I End-of-Instruction Test and Item Specifications 9
Cop
yrig
ht ©
201
2 by
the
Okl
ahom
a Sta
te D
epar
tmen
t of
Edu
catio
n
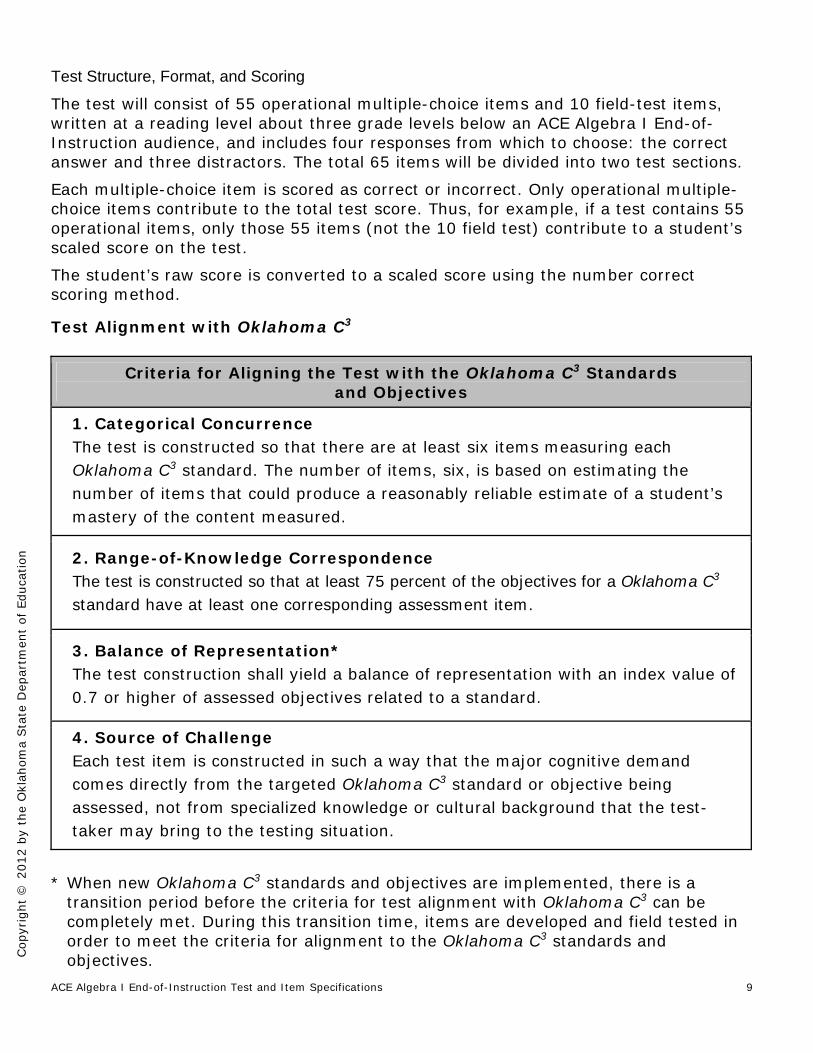
Test Structure, Format, and Scoring
The test will consist of 55 operational multiple-choice items and 10 field-test items, written at a reading level about three grade levels below an ACE Algebra I End-of-Instruction audience, and includes four responses from which to choose: the correct answer and three distractors. The total 65 items will be divided into two test sections.
Each multiple-choice item is scored as correct or incorrect. Only operational multiple-choice items contribute to the total test score. Thus, for example, if a test contains 55 operational items, only those 55 items (not the 10 field test) contribute to a student’s scaled score on the test.
The student’s raw score is converted to a scaled score using the number correct scoring method.
Test Alignment with Oklahoma C3
* When new Oklahoma C3 standards and objectives are implemented, there is a transition period before the criteria for test alignment with Oklahoma C3 can be completely met. During this transition time, items are developed and field tested in order to meet the criteria for alignment to the Oklahoma C3 standards and objectives.
Criteria for Aligning the Test with the Oklahoma C3 Standards and Objectives
1. Categorical Concurrence The test is constructed so that there are at least six items measuring each Oklahoma C3 standard. The number of items, six, is based on estimating the number of items that could produce a reasonably reliable estimate of a student’s mastery of the content measured.
2. Range-of-Knowledge Correspondence The test is constructed so that at least 75 percent of the objectives for a Oklahoma C3 standard have at least one corresponding assessment item.
3. Balance of Representation* The test construction shall yield a balance of representation with an index value of 0.7 or higher of assessed objectives related to a standard.
4. Source of Challenge Each test item is constructed in such a way that the major cognitive demand comes directly from the targeted Oklahoma C3 standard or objective being assessed, not from specialized knowledge or cultural background that the test-taker may bring to the testing situation.

ACE Algebra I End-of-Instruction Test and Item Specifications
Cop
yrig
ht ©
201
2 by
the
Okl
ahom
a Sta
te D
epar
tmen
t of
Edu
catio
n
10
Depth-of-Knowledge Assessed by Test Items
The test will approximately reflect the following “depth-of-knowledge” distribution of items:1
Level 1 requires the student to recall facts, terms, definitions, or simple procedures, perform simple algorithms or apply formulas. One-step, well-defined, or straight algorithmic procedures should be included at this level.
Level 2 requires the student to make some decisions as to how to approach the problem or activity. Level 2 activities include making observations and collecting data; classifying, comparing, and organizing data; and organizing and displaying data in tables, charts, and graphs.
Level 3 requires reasoning, planning, using evidence, and a higher level of thinking. Level 3 activities include making conjectures, drawing conclusions from observations, citing evidence and developing a logical argument for concepts, explaining phenomena in terms of concepts, and using concepts to solve nonroutine problems.
Level 4 requires complex reasoning, planning, developing, and thinking most likely requiring an extended amount of time. The cognitive demands of the item should be high and the work should be very complex. Students are required to make several connections (relate ideas within the content area or among content areas) and have to select one approach among many alternatives on how the situation should be solved in order to be at this highest level.
Note: These descriptions are adapted from Review Background Information and Instructions, Standards and Assessment Alignment Analysis, CCSSO TILSA Alignment Study, May 21–24, 2001, Version 2.0.
For an extended description of each depth-of-knowledge level, see the student assessment Web site at http://www.ok.gov/sde/test-support-teachers-and-administrators.
1 This is the ideal depth-of-knowledge distribution of items. There may be slight differences in the actual distribution of the upcoming testing session.
Depth-of-Knowledge Percent of
Items
Level 1—Recall and Reproduction 10–15%
Level 2—Skills and Concepts 60–70%
Level 3—Strategic Thinking Level 4—Extended Thinking
15–25%
ACE Algebra I End-of-Instruction Test and Item Specifications 11
Cop
yrig
ht ©
201
2 by
the
Okl
ahom
a Sta
te D
epar
tmen
t of
Edu
catio
n

ACE Algebra I End-of-Instruction Test and Item Specifications
Cop
yrig
ht ©
201
2 by
the
Okl
ahom
a Sta
te D
epar
tmen
t of
Edu
catio
n
12
General Considerations—Oklahoma Core Curriculum Tests
Each End-of-Instruction test is meant to be administered in two sections within one day or consecutive days with the exception of English II and ACE English III, which will be administered in three sections over two or three days. Estimated time for scheduling purposes is given in the table below.
ACE Algebra I Online Test Time Schedule
Distributing login information
Section 1: Test instructions/tutorial and reviewing sample items
Total:
Approximately 5 minutes
Approximately 15 minutes
Approximately 20 minutes
Administering Section 2 of the ACE Algebra I Online Test
Total:
Approximately 60 minutes
Approximately 60 minutes
Distributing login information
Administering Section 3 of the ACE Algebra I Online Test
Total:
Approximately 5 minutes
Approximately 60 minutes
Approximately 65 minutes
ACE Algebra I End-of-Instruction Test and Item Specifications 13
Cop
yrig
ht ©
201
2 by
the
Okl
ahom
a Sta
te D
epar
tmen
t of
Edu
catio
n
1. Items deal with issues and details that are of consequence in the stimulus and central to students’ understanding and interpretation of the stimulus.
2. Test items are varied and address all Oklahoma C3 standards listed in the ACE Algebra I EOI Test Blueprint.
3. To the greatest extent possible, no item or response choice clues the answer to other items.
4. All items reviewed and approved by the Oklahoma Item Review Committee are assigned a Oklahoma C3 standard and/or objective. The Test Blueprints and score reports reflect the degree to which each Oklahoma C3 standard and/or objective is represented on the test.
5. Test items are tied closely and particularly to the stimuli from which they are derived, so that the impact of outside (prior) knowledge, while never wholly avoidable, is minimized.
6. Each multiple-choice item contains a question and four answer options, only one of which is correct. Correct answers are approximately equally distributed among As, Bs, Cs, and Ds.
7. The four choices are approximately the same length, have the same format, and are syntactically and semantically parallel; students should not be able to rule out a wrong answer or identify a correct response solely because it looks different from the other answer choices.
8. Distractors adopt the language and sense of the material in the stimuli so that students think their way to the correct answer rather than simply identify incorrect responses by virtue of a distractor’s obviously inappropriate nature.
9. Distractors should always be plausible (but, of course, incorrect) in the context of the stimulus.
10. Order of presentation of item types is dictated by logic (chronologically, spatially, etc.). 11. Items are worded precisely and clearly. The better focused an item, the more
reliable and fair it is certain to be, and the more likely all students will understand it in the same way.
12. It is not possible to measure every Oklahoma C3 objective on the test. However, at least 50% of the objectives from each Oklahoma C3 content standard are included on the test.
13. The range of items measuring a Oklahoma C3 objective consisting of more than one skill will provide a balanced representation of those skills.
14. Items should be focused on what all students should know and be able to do as they complete their End-of-Instruction coursework.
15. The responses “Both of the above,” “All of the above,” “None of the above,” and “Neither of the above” will not be used.
16. The material presented is balanced, culturally diverse, well written, and of interest to End-of-Instruction level students. The stimuli and items are fairly presented in order to gain a true picture of students’ skills.
17. Across all forms, a balance of gender and active/passive roles by gender is maintained.
18. Forms attempt to represent the ethnic diversity of Oklahoma students.

ACE Algebra I End-of-Instruction Test and Item Specifications
Cop
yrig
ht ©
201
2 by
the
Okl
ahom
a Sta
te D
epar
tmen
t of
Edu
catio
n
14
19. Approved calculators may be used on specified sections of the ACE Algebra I EOI. No other resource materials may be used by students during the test.
20. The stimuli avoid subject matter that might prompt emotional distress on the part of the students.
21. In addition to the 55 operational items, there will be 10 field test items per form.
22. Permission to use stimuli from copyrighted material is obtained as necessary by CTB/McGraw-Hill.
Item Types
Each multiple-choice item has four responses—the correct answer and three distractors. Distractors are developed based on the types of errors students are most likely to make.
For item review committee purposes, information regarding the Oklahoma C3 standard(s) and objectives addressed, item format, and correct answer key accompany each item.
Each item begins with a stem that asks a question or poses a clear problem. A stem will seldom include an incomplete sentence.
Most stems are positively worded—avoiding the use of the word “not.” If a negative is required, it is underlined for emphasis (e.g., if a bag has the same number of red, blue, and black marbles, what is the probability that a marble randomly selected from the bag is not red?).
A stimulus that gives information precedes a question or a set of questions.
Stimulus Materials
Stimulus materials are the passages, graphs, models, figures, etc., that students must read and examine in order to respond to items. The following characteristics are necessary for stimulus materials:
1. When students are given information to evaluate, they should know the question and the purpose of the information.
2. Passages, graphics, tables, etc., provide sufficient information for assessment of multiple objectives.
3. Stimulus materials for a set of items may be a combination of multiple stimuli. 4. Information in stimulus materials is based on situations students would encounter
in or beyond school. 5. For conceptual items, stimulus materials are necessary but not conceptually
sufficient for student response. 6. There is a balance of graphic and textual stimulus materials within a test form.
Approximately 50 percent of the items will have appropriate pictorial or graphical representations. Graphs, tables, or figures are clearly associated with their intended items. Graphics appear either on the same page as the stimulus or on the facing page.

ACE Algebra I End-of-Instruction Test and Item Specifications 15
Cop
yrig
ht ©
201
2 by
the
Okl
ahom
a Sta
te D
epar
tmen
t of
Edu
catio
n
Online Administration
Test questions will be presented one at a time.
Answers may be selected by using either the mouse or the keyboard.
Navigation buttons appear at the end of the page for each question. For longer items, a scroll bar will appear on the right-hand side of the window to allow scrolling through answer choices.
Tools (including a scientific calculator on the ACE Algebra I and ACE Geometry assessments and a graphing calculator for the ACE Algebra II assessment) appear at the top of the screen/page to aid in answering questions.
Students will be able to use scratch paper for all online multiple choice assessments. This paper must be taken up and destroyed by the test administrator immediately following the test. The test administrator must not look at what the student has written on the scratch paper.
The stimulus and question will appear on the screen at the same time.
ACE Algebra I End-of-Instruction Test and Item Specifications
Cop
yrig
ht ©
201
2 by
the
Okl
ahom
a Sta
te D
epar
tmen
t of
Edu
catio
n
16
Item Specifications
It is necessary to create test items that are reliable, fair, and targeted to the Oklahoma C3 standards listed on the following pages. There are some general considerations and procedures for effective item development. These considerations include, but are not limited to, the following:
1. Each test form contains items assessing all content standards.
2. Test items that assess each standard are not limited to one particular type of response format.
3. Test questions attempt to focus on content that is authentic and that End-of-Instruction level students can relate to and understand.
4. Test items are worded precisely and clearly. The better focused an item, the more reliable and fair it is likely to be, and the more likely all students will understand what is required of them.
5. All items are reviewed to eliminate language that shows bias or that would otherwise likely disadvantage a particular group of students. That is, items do not display unfair representations of gender, race, ethnicity, disability, culture, or religion; nor do items contain elements that are offensive to any such groups.
6. Items are written so that calculations are kept to a minimum, and numbers are selected to minimize the time spent on computations.
7. All test items and answer choices have appropriate labels and units.
8. Most graphs are placed on a gray grid, with the x- and y-axes labeled and marked.
9. All multiple-choice answer choices—keys and distractors—are similar in length, syntax, or magnitude or have two sets of parallel answer choices (e.g., two short and two long). Students should not be able to rule out a wrong answer or identify a correct response solely by its appearance. Distractors are created so that students reason their way to the correct answer rather than simply identify incorrect responses because of a distractor’s obviously inappropriate nature. Distractors should always be plausible (but incorrect) in the context of the item stem. Correct responses will be approximately equally distributed among answer choices.
All items developed using these specifications are reviewed annually by Oklahoma educators and approved by the Oklahoma State Department of Education. The distribution of newly developed items is based on difficulty, cognitive ability, percentage of art/graphics, and grade-level appropriateness as determined by an annual Item Development Plan approved by the Oklahoma State Department of Education.

ACE Algebra I End-of-Instruction Test and Item Specifications 17
Cop
yrig
ht ©
201
2 by
the
Okl
ahom
a Sta
te D
epar
tmen
t of
Edu
catio
n
Universal Design Considerations
Universal design, as applied to assessments, is a concept that allows the widest possible range of students to participate in assessments and may even reduce the need for accommodations and alternative assessments by expanding access to the tests themselves. In the Oklahoma End-of-Instruction tests, modifications have been made to some items that simplify and clarify instructions, and provide maximum readability, comprehensibility, and legibility. This includes such things as reducing the language load in content areas other than Language Arts, increasing the font size, displaying fewer items per page, and boxing the items to assist visual focus. These modifications are evident in the sample items included in this document.
Multiple-Choice Item Rules
All items must clearly indicate what is expected in a response and direct students to focus on their responses.
Each multiple-choice item has a stem (question, statement, and/or graphic component) and four answer options, only one of which is correct.
Multiple-choice item stems present a complete problem so that students will know what to do before looking at the answer choices. Students should not need to read all answer choices before knowing what is expected.
In summary, ACE Algebra I test items assess whether students understand algebraic concepts and procedures, whether they can communicate their understandings effectively in mathematical terms, and whether they can approach problems and develop viable solutions.
ACE Algebra I End-of-Instruction Test and Item Specifications
Cop
yrig
ht ©
201
2 by
the
Okl
ahom
a Sta
te D
epar
tmen
t of
Edu
catio
n
18
OVERVIEW OF ITEM SPECIFICATIONS
For each Oklahoma C3 standard, item specifications are organized under the following headings:
Oklahoma C3 Standard
Oklahoma C3 Objective (and Skills)
Item Specifications
a. Emphasis
b. Stimulus Attributes
c. Format
d. Content Limits
e. Primary Process Standard(s)
f. Distractor Domain
g. Sample Test Items
The headings “Oklahoma C3 Standard” and “Oklahoma C3 Objective” state the Oklahoma C3 standard followed by the Oklahoma C3 objective being measured in the mathematics section of the Oklahoma C3 Standards document.
For each objective, the information under the heading “Item Specifications” highlights important points about a test item’s emphasis, stimulus attributes, format, content limits, primary Process Standard(s), and distractor domain. Sample test items are included with each objective to illustrate these specifications. Although it is sometimes possible to score single items for more than one concept, all items in these tests are written to address a single content standard as the primary concept.
Note: With the exception of content limits, the Item Specifications offer suggestions of what might be included and do not provide an exhaustive list of what can be included.
In addition, the sample test items are not intended to be definitive in nature or construction—the stimuli and the test items that follow them may differ from test form to test form, as may their presentations.
ACE Algebra I End-of-Instruction Test and Item Specifications 19
Cop
yrig
ht ©
201
2 by
the
Okl
ahom
a Sta
te D
epar
tmen
t of
Edu
catio
n
Oklahoma C3 Standard: Standard 1: Number Sense and Algebraic Operations
Oklahoma C3 Objective: Objective 1.1: Equations and Formulas
Oklahoma C3 Skill: Skill 1.1a: Translate word phrases and sentences into expressions and
equations and vice versa.
Item Specifications:
Emphasis: Communicate mathematical and everyday situations using algebraic notation.
Stimulus Attributes: Test items may include tables, graphs, charts, or diagrams.
Format: Identify algebraic expressions and equations that represent mathematical and
real-world situations. Identify mathematical and real-world situations that can be represented by
specific algebraic expressions and equations.
Content Limits: No more than two distinct operations Limit real-life and mathematical contexts to age-appropriate situations.
Primary Process Standards: Communication Representation
Distractor Domain: Common algebraic misconceptions

ACE Algebra I End-of-Instruction Test and Item Specifications
Cop
yrig
ht ©
201
2 by
the
Okl
ahom
a Sta
te D
epar
tmen
t of
Edu
catio
n
20
Sample Test Items for Skill 1.1a
Depth-of-Knowledge: 1
Correct Response: A
Depth-of-Knowledge: 1
Correct Response: C
When a number is multiplied by six and the product is decreased by nine, the final result is 33. Which equation represents this statement?
A 6 9 33x
B 9 6 33x
C 6( 9) 33x
D 9( 6) 33x
6 4n n
Which sentence represents this equation?
A Six times a number is 4 less than the number.
B A number is 4 minus the product of 6 and the number.
C A number is 4 less than the product of the number and 6.
D Six times the difference of a number and 4 is equal to the number.

ACE Algebra I End-of-Instruction Test and Item Specifications 21
Cop
yrig
ht ©
201
2 by
the
Okl
ahom
a Sta
te D
epar
tmen
t of
Edu
catio
n
Depth-of-Knowledge: 2
Correct Response: D
Depth-of-Knowledge: 2
Correct Response: D
Anne practiced piano for x hours. Steve practiced piano three more hours than Anne. Kate practiced piano five times as long as Steve. Which expression represents the total time they practiced piano?
A 3 5x x
B 5( 3)x x
C 3 5x x x
D 3 5( 3)x x x
Sue’s age is twelve years less than twice Jack’s age. Let J represent Jack’s age and S represent Sue’s age. Which equation represents Sue’s age?
A 2(12 )S J
B 2( 12)S J
C 12 2S J
D 2 12S J
ACE Algebra I End-of-Instruction Test and Item Specifications
Cop
yrig
ht ©
201
2 by
the
Okl
ahom
a Sta
te D
epar
tmen
t of
Edu
catio
n
22
Oklahoma C3 Standard: Standard 1: Number Sense and Algebraic Operations
Oklahoma C3 Objective: Objective 1.1: Equations and Formulas
Oklahoma C3 Skill: Skill 1.1b: Solve literal equations involving several variables for one variable in
terms of the others.
Item Specifications:
Emphasis: The student will use literal equations to solve for variables.
Stimulus Attributes: Test items may include literal equations or formulas.
Format: Identify equivalent forms for a given equation or formula.
Content Limits: Limit geometric and scientific formulas to ones appropriate for Algebra I. Limit nongeometric and nonscientific equations to first degree with no more
than four variables. Limit real-life and mathematical contexts to age-appropriate situations. Limit to equations that do not require factoring.
Primary Process Standards: Problem Solving Representation
Distractor Domain: Common algebraic misconceptions
ACE Algebra I End-of-Instruction Test and Item Specifications 23
Cop
yrig
ht ©
201
2 by
the
Okl
ahom
a Sta
te D
epar
tmen
t of
Edu
catio
n
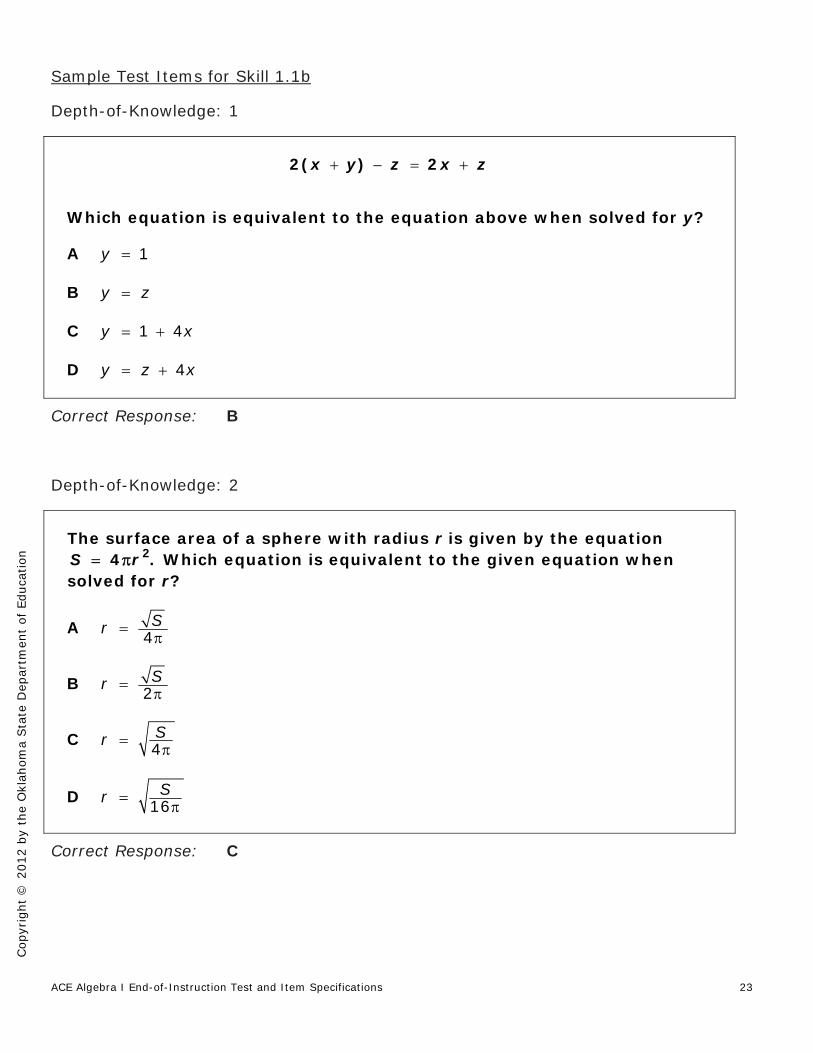
Sample Test Items for Skill 1.1b
Depth-of-Knowledge: 1
Correct Response: B
Depth-of-Knowledge: 2
Correct Response: C
2( ) 2x y z x z
Which equation is equivalent to the equation above when solved for y?
A 1y
B y z
C 1 4y x
D 4y z x
The surface area of a sphere with radius r is given by the equation 24 .S r Which equation is equivalent to the given equation when
solved for r?
A 4Sr
B 2Sr
C 4Sr
D 16Sr
ACE Algebra I End-of-Instruction Test and Item Specifications
Cop
yrig
ht ©
201
2 by
the
Okl
ahom
a Sta
te D
epar
tmen
t of
Edu
catio
n
24
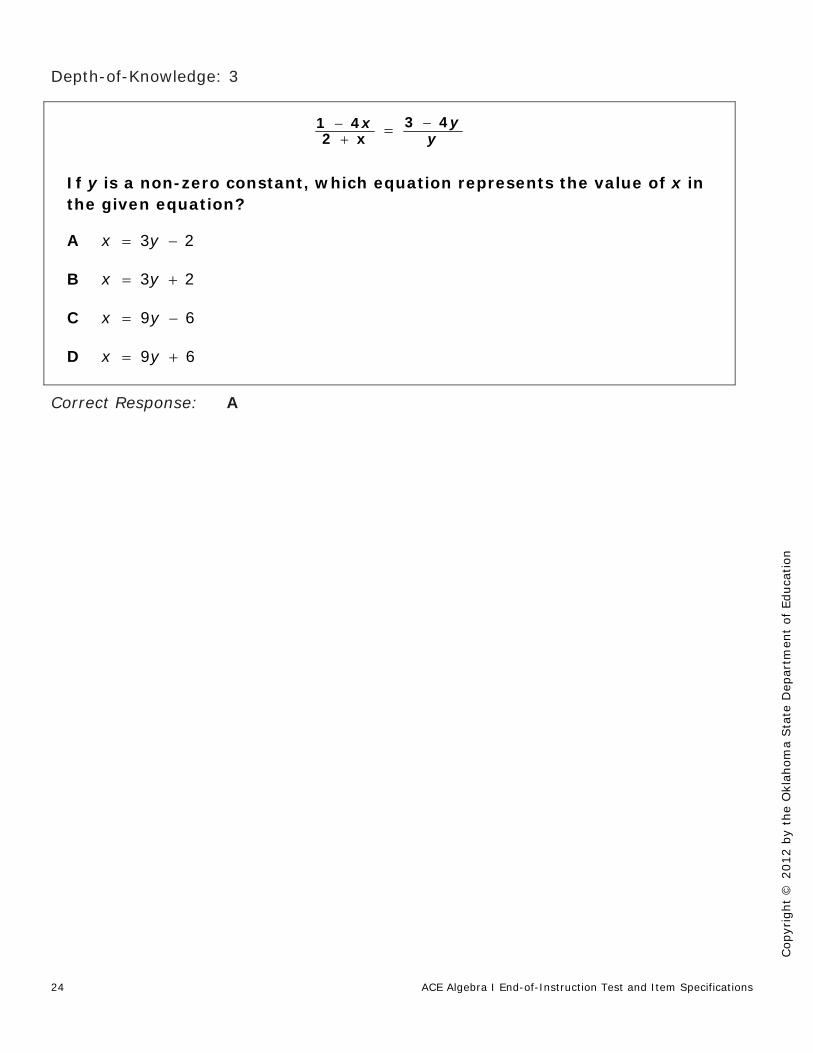
Depth-of-Knowledge: 3
Correct Response: A
3 41 4
2 xyx
y
If y is a non-zero constant, which equation represents the value of x in the given equation?
A 3 2x y
B 3 2x y
C 9 6x y
D 9 6x y

ACE Algebra I End-of-Instruction Test and Item Specifications 25
Cop
yrig
ht ©
201
2 by
the
Okl
ahom
a Sta
te D
epar
tmen
t of
Edu
catio
n
Oklahoma C3 Standard: Standard 1: Number Sense and Algebraic Operations
Oklahoma C3 Objective: Objective 1.1: Equations and Formulas
Oklahoma C3 Skill: Skill 1.1c: Use the formulas from measurable attributes of geometric models
(perimeter, circumference, area and volume), science, and statistics to solve problems within an algebraic context.
Item Specifications:
Emphasis: Make connections across curriculums and to the real world with algebraic
concepts.
Stimulus Attributes: Test items may include tables, graphs, and geometric figures or diagrams.
Format: Use scientific formulas to solve problems algebraically. Use geometric formulas to solve problems algebraically. Use formulas from statistics to solve problems algebraically.
Content Limits: Formulas may be provided. Limit scientific content to 7th-grade material. Limit geometric content to 9th-grade material.
Primary Process Standards: Problem Solving Connections
Distractor Domain: Computational errors Common algebraic misconceptions

ACE Algebra I End-of-Instruction Test and Item Specifications
Cop
yrig
ht ©
201
2 by
the
Okl
ahom
a Sta
te D
epar
tmen
t of
Edu
catio
n
26
Sample Test Items for Skill 1.1c
Depth-of-Knowledge: 2
Correct Response: D
Depth-of-Knowledge: 2
Correct Response: B
A drink container is shaped like a cylinder. The height of the container is 10 centimeters, and the radius of the container is 6 centimeters. What is the approximate volume of the container? (Use 3.14 for .)
A 283 cubic centimeters
B 360 cubic centimeters
C 452 cubic centimeters
D 1,131 cubic centimeters
The temperature of a gas is 76° Fahrenheit. What is the temperature of the gas in degrees Celsius?
A 96 °C
B 60 °C
C 44 °C
D 25 °C
ACE Algebra I End-of-Instruction Test and Item Specifications 27
Cop
yrig
ht ©
201
2 by
the
Okl
ahom
a Sta
te D
epar
tmen
t of
Edu
catio
n
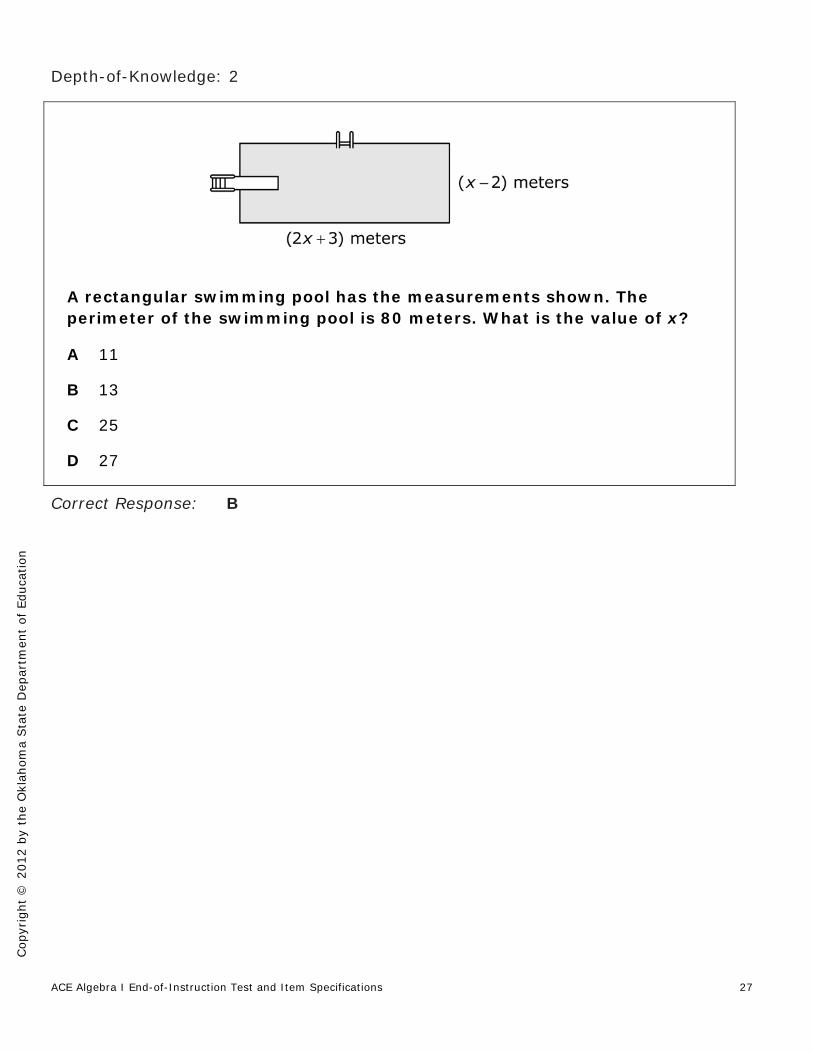
Depth-of-Knowledge: 2
Correct Response: B
A rectangular swimming pool has the measurements shown. The perimeter of the swimming pool is 80 meters. What is the value of x?
A 11
B 13
C 25
D 27
ACE Algebra I End-of-Instruction Test and Item Specifications
Cop
yrig
ht ©
201
2 by
the
Okl
ahom
a Sta
te D
epar
tmen
t of
Edu
catio
n
28
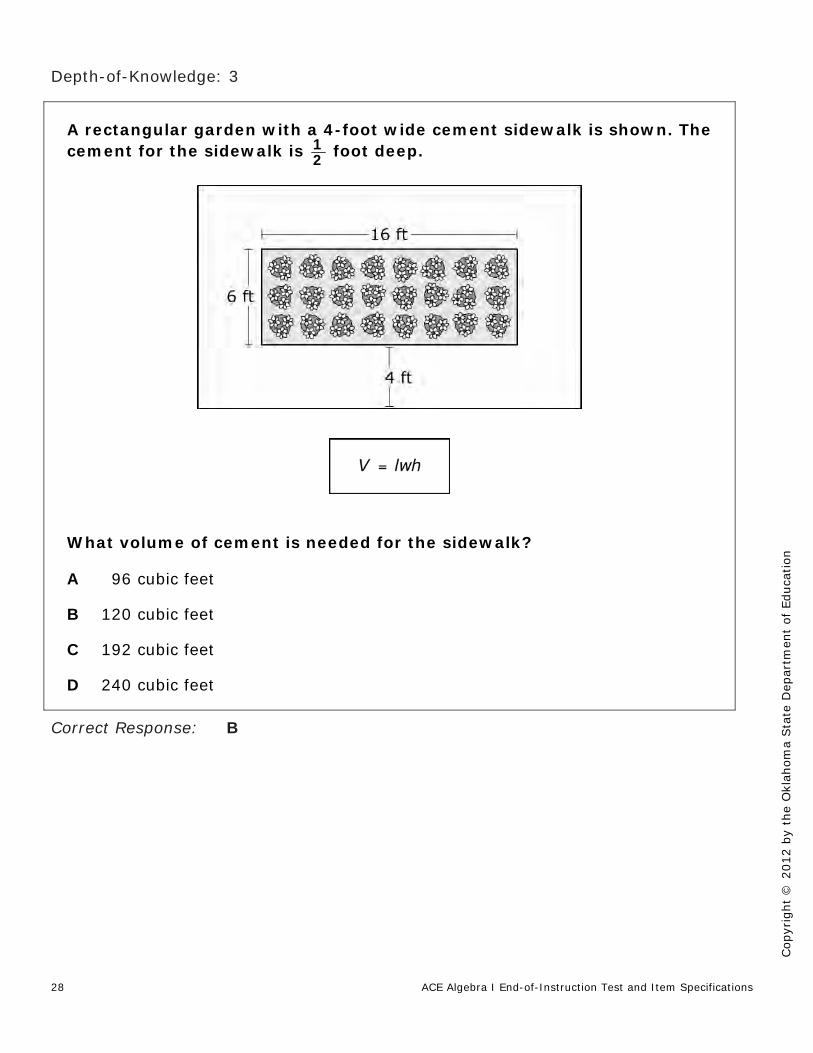
Depth-of-Knowledge: 3
Correct Response: B
A rectangular garden with a 4-foot wide cement sidewalk is shown. The cement for the sidewalk is 1
2 foot deep.
What volume of cement is needed for the sidewalk?
A 96 cubic feet
B 120 cubic feet
C 192 cubic feet
D 240 cubic feet

ACE Algebra I End-of-Instruction Test and Item Specifications 29
Cop
yrig
ht ©
201
2 by
the
Okl
ahom
a Sta
te D
epar
tmen
t of
Edu
catio
n
Depth-of-Knowledge: 3
Correct Response: C
The circumference of a circle is 10 inches. What is the area of the circle?
A 5 square inches
B 10 square inches
C 25 square inches
D 100 square inches

ACE Algebra I End-of-Instruction Test and Item Specifications
Cop
yrig
ht ©
201
2 by
the
Okl
ahom
a Sta
te D
epar
tmen
t of
Edu
catio
n
30
Oklahoma C3 Standard: Standard 1: Number Sense and Algebraic Operations
Oklahoma C3 Objective: Objective 1.1: Equations and Formulas
Oklahoma C3 Skill: Skill 1.1d: Solve two-step and three-step problems using concepts such as
rules of exponents, rate, distance, ratio and proportion, and percent.
Item Specifications:
Emphasis: Determine solutions to mathematical and real-world situations using the
concepts of algebra.
Stimulus Attributes: Test items may include graphs, tables, and diagrams.
Format: Solve mathematical and everyday problems using the concepts from algebra.
Content Limits: Limit situations to age-appropriate material.
Primary Process Standards: Problem Solving Reasoning Connections
Distractor Domain: Computational errors Common algebraic misconceptions

ACE Algebra I End-of-Instruction Test and Item Specifications 31
Cop
yrig
ht ©
201
2 by
the
Okl
ahom
a Sta
te D
epar
tmen
t of
Edu
catio
n
Sample Test Items for Skill 1.1d
Depth-of-Knowledge: 2
Correct Response: C
Depth-of-Knowledge: 2
Correct Response: D
The weights and prices of four brands of dog food are shown in this table.
Which brand has the lowest unit price?
A Brand W
B Brand X
C Brand Y
D Brand Z
At a candle store, the ratio of green candles to red candles is 2 to 5. The store has 4,900 candles. How many candles are red?
A 350 red candles
B 700 red candles
C 1,400 red candles
D 3,500 red candles

ACE Algebra I End-of-Instruction Test and Item Specifications
Cop
yrig
ht ©
201
2 by
the
Okl
ahom
a Sta
te D
epar
tmen
t of
Edu
catio
n
32
Depth-of-Knowledge: 2
Correct Response: B
Depth-of-Knowledge: 2
Correct Response: B
At a football game, 80% of the fans were rooting for the Rams. Of the fans rooting for the Rams, 20% bought souvenir footballs. What percent of the fans at the game rooted for the Rams and bought souvenir footballs?
A 4%
B 16%
C 60%
D 100%
A drink dispenser fills cups at a rate of 2 ounces per second. Adrian has a 64-ounce cup that already contains 18 ounces of water. How long will it take the dispenser to fill the rest of Adrian’s cup with water?
A 9 seconds
B 23 seconds
C 92 seconds
D 128 seconds

ACE Algebra I End-of-Instruction Test and Item Specifications 33
Cop
yrig
ht ©
201
2 by
the
Okl
ahom
a Sta
te D
epar
tmen
t of
Edu
catio
n
Depth-of-Knowledge: 2
Correct Response: A
Depth-of-Knowledge: 2
Correct Response: C
Antonio read the first 60 pages of his book in 40 minutes. At this rate, how long should it take Antonio to read the rest of his 210-page book?
A 100 minutes
B 130 minutes
C 135 minutes
D 225 minutes
An angstrom is a unit of length defined as 10-8 centimeters. Using a microscope, a scientist is looking at a particle 103 angstroms long. What is the length of the particle in centimeters?
A 10-24 centimeters
B 10-11 centimeters
C 10-5 centimeters
D 10-3 centimeters

ACE Algebra I End-of-Instruction Test and Item Specifications
Cop
yrig
ht ©
201
2 by
the
Okl
ahom
a Sta
te D
epar
tmen
t of
Edu
catio
n
34
Depth-of-Knowledge: 2
Correct Response: D
Depth-of-Knowledge: 3
Correct Response: B
The snowfall in Jackson Creek was recently measured at 0.4 inches per hour over a period of 9 hours and 30 minutes. How many inches of snow did Jackson Creek receive?
A 3.41 inches
B 3.60 inches
C 3.72 inches
D 3.80 inches
Sarah drove her boat at 5 miles per hour for 45 minutes and at 4 miles per hour for 30 minutes. What was the total distance, in miles, that Sarah drove her boat?
A 2 miles
B 345 miles
C 9 miles
D 1216 miles
ACE Algebra I End-of-Instruction Test and Item Specifications 35
Cop
yrig
ht ©
201
2 by
the
Okl
ahom
a Sta
te D
epar
tmen
t of
Edu
catio
n
Oklahoma C3 Standard: Standard 1: Number Sense and Algebraic Operations
Oklahoma C3 Objective: Objective 1.2: Expressions
Oklahoma C3 Skill: Skill 1.2a: Simplify and evaluate linear, absolute value, rational and radical
expressions.
Item Specifications:
Emphasis: Apply the properties of algebra (distributive, commutative, associative,
identity, inverse, etc.) to simplify a variety of algebraic expressions.
Stimulus Attributes: Test items may include algebraic expressions.
Format: Simplify and evaluate linear algebraic expressions. Simplify and evaluate rational algebraic expressions. Simplify and evaluate algebraic expressions that involve radicals. Simplify and evaluate algebraic expressions involving absolute value. Radical expressions in the denominator are limited to a single term and must
be perfect squares, 2 and 3.
Content Limits: Limit radical expressions to those containing square roots up to 144 with no
variables under the radical. Limit computations involving decimals to the tenths place.
Primary Process Standards: Problem Solving
Distractor Domain: Computational errors Common algebraic misconceptions
ACE Algebra I End-of-Instruction Test and Item Specifications
Cop
yrig
ht ©
201
2 by
the
Okl
ahom
a Sta
te D
epar
tmen
t of
Edu
catio
n
36
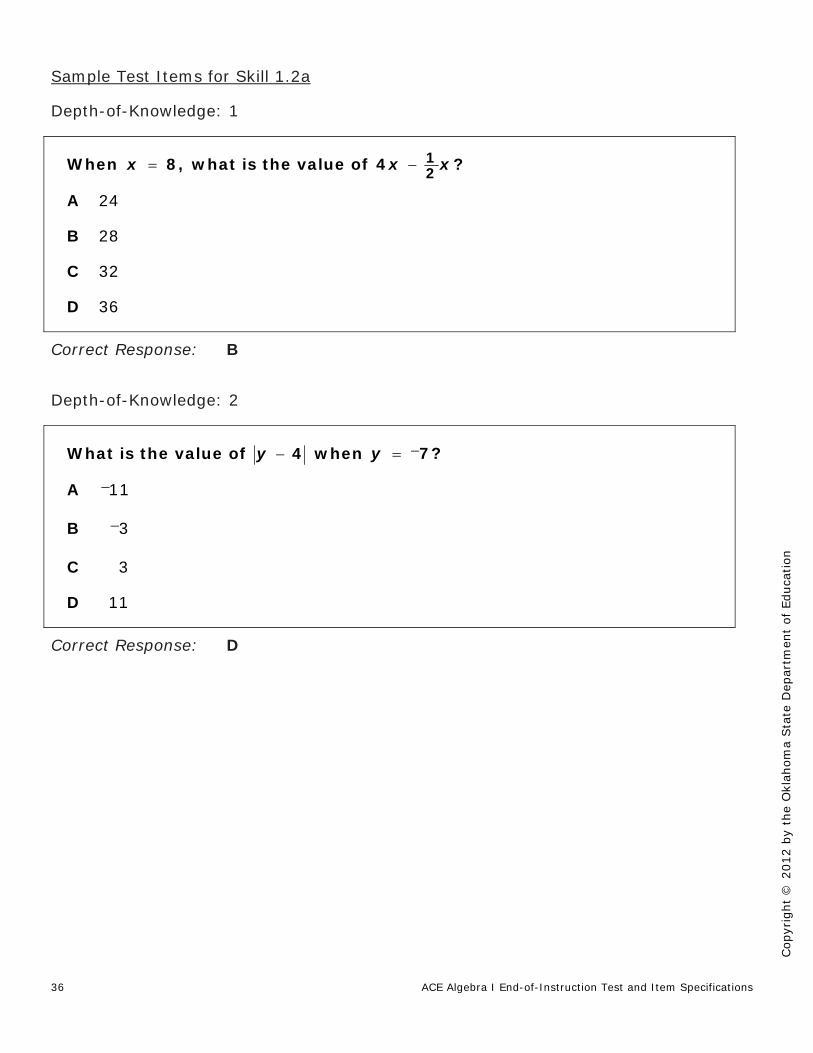
Sample Test Items for Skill 1.2a
Depth-of-Knowledge: 1
Correct Response: B
Depth-of-Knowledge: 2
Correct Response: D
When 8,x what is the value of 124 ?x x
A 24
B 28
C 32
D 36
What is the value of 4y when 7?y
A 11
B 3
C 3
D 11
ACE Algebra I End-of-Instruction Test and Item Specifications 37
Cop
yrig
ht ©
201
2 by
the
Okl
ahom
a Sta
te D
epar
tmen
t of
Edu
catio
n
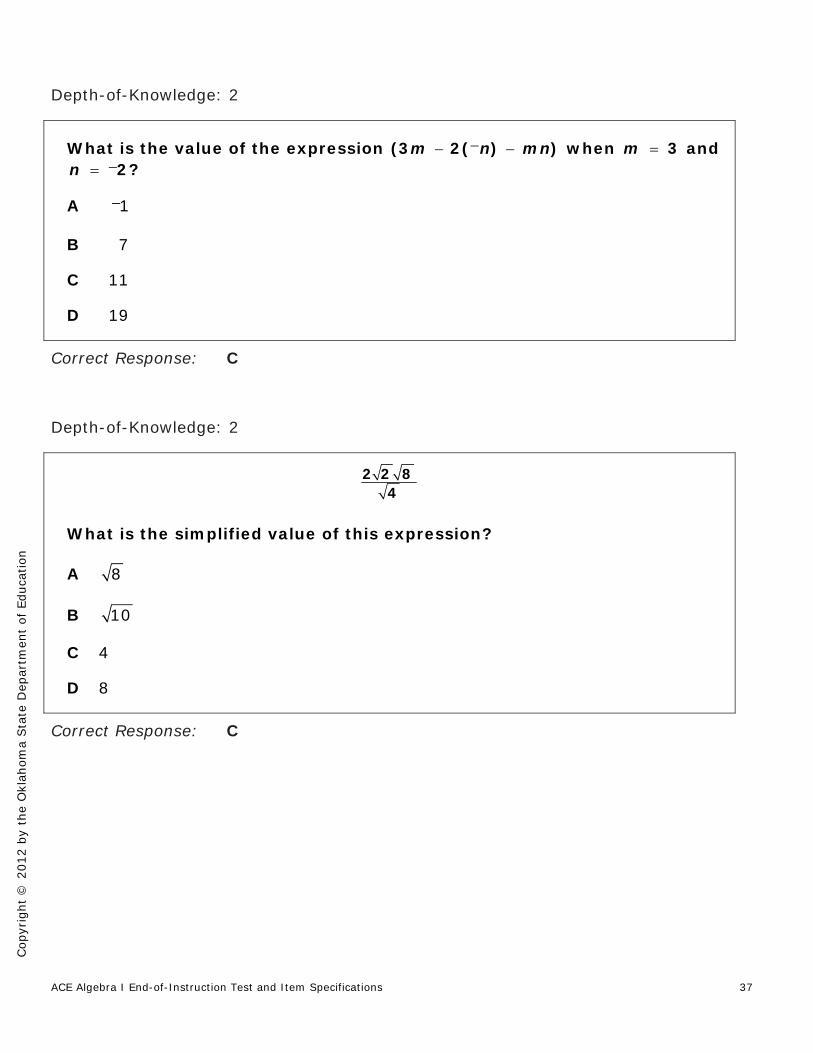
Depth-of-Knowledge: 2
Correct Response: C
Depth-of-Knowledge: 2
Correct Response: C
What is the value of the expression (3 2( ) )m n mn when 3m and 2?n
A 1
B 7
C 11
D 19
2 2 84
What is the simplified value of this expression?
A 8
B 10
C 4
D 8

ACE Algebra I End-of-Instruction Test and Item Specifications
Cop
yrig
ht ©
201
2 by
the
Okl
ahom
a Sta
te D
epar
tmen
t of
Edu
catio
n
38
Depth-of-Knowledge: 2
Correct Response: B
32
What is the simplified value of this expression?
A 32
B 3 22
C 2 3
D 3 2

ACE Algebra I End-of-Instruction Test and Item Specifications 39
Cop
yrig
ht ©
201
2 by
the
Okl
ahom
a Sta
te D
epar
tmen
t of
Edu
catio
n
Oklahoma C3 Standard: Standard 1: Number Sense and Algebraic Operations
Oklahoma C3 Objective: Objective 1.2: Expressions
Oklahoma C3 Skill: Skill 1.2b: Simplify polynomials by adding, subtracting, or multiplying.
Item Specifications:
Emphasis: Perform the operations of addition, subtraction, or multiplication of
polynomials.
Stimulus Attributes: Test items may include algebraic polynomials and geometric formulas.
Format: Identify the sum of two or more polynomials. Identify the difference of two polynomials. Identify the product of two polynomials.
Content Limits: Limit polynomial to no more than four terms. In multiplication of polynomials, limit the factors to no more than a trinomial by
a binomial.
Primary Process Standards: Problem Solving
Distractor Domain: Computational errors Common algebraic misconceptions

ACE Algebra I End-of-Instruction Test and Item Specifications
Cop
yrig
ht ©
201
2 by
the
Okl
ahom
a Sta
te D
epar
tmen
t of
Edu
catio
n
40
Sample Test Items for Skill 1.2b
Depth-of-Knowledge: 1
Correct Response: B
Depth-of-Knowledge: 1
Correct Response: A
(2 3) (3 4)x x
What is the simplified value of this expression?
A 1x
B 7x
C 5 1x
D 5 7x
2 5 7x y x y
What is the simplified form of this expression?
A 9 4x y
B 9 5x y
C 9 6x y
D 9 4x y

ACE Algebra I End-of-Instruction Test and Item Specifications 41
Cop
yrig
ht ©
201
2 by
the
Okl
ahom
a Sta
te D
epar
tmen
t of
Edu
catio
n
Depth-of-Knowledge: 2
Correct Response: D
Depth-of-Knowledge: 2
Correct Response: B
23 8 10x x
25 4 2x x
What is the sum of these two expressions?
A 22 4 8x x
B 22 4 8x x
C 22 4 12x x
D 22 4 12x x
What is the area of the rectangle?
A 22 18x
B 22 5 18x x
C 22 13 18x x
D 22 13 18x x

ACE Algebra I End-of-Instruction Test and Item Specifications
Cop
yrig
ht ©
201
2 by
the
Okl
ahom
a Sta
te D
epar
tmen
t of
Edu
catio
n
42
Oklahoma C3 Standard: Standard 1: Number Sense and Algebraic Operations
Oklahoma C3 Objective: Objective 1.2: Expressions
Oklahoma C3 Skill: Skill 1.2c: Factor polynomial expressions.
Item Specifications:
Emphasis: The student will factor polynomial expressions.
Stimulus Attributes: Test items may include algebraic polynomial expressions.
Format: Identify a factor of a polynomial expression. Identify a polynomial expression in factored form. Identify the Greatest Common Factor for a polynomial expression.
Content Limits: Limit exponents to no more than the power of 6. Limit to binomials and trinomials.
Primary Process Standards: Problem Solving
Distractor Domain: Computational errors Common algebraic misconceptions

ACE Algebra I End-of-Instruction Test and Item Specifications 43
Cop
yrig
ht ©
201
2 by
the
Okl
ahom
a Sta
te D
epar
tmen
t of
Edu
catio
n
Sample Test Items for Skill 1.2c
Depth-of-Knowledge: 1
Correct Response: D
Depth-of-Knowledge: 2
Correct Response: A
Which expression is the factored equivalent of 3 2 2 2?x y x y
A 2 2( )x x y
B 2 2( )y x y
C 2 2( 1)x y y
D 2 2( 1)x y x
Which expression is the factored equivalent of 23 4 1?x x
A (3 1)( 1)x x
B (3 1)( 1)x x
C (3 1)( 1)x x
D (3 1)( 1)x x

ACE Algebra I End-of-Instruction Test and Item Specifications
Cop
yrig
ht ©
201
2 by
the
Okl
ahom
a Sta
te D
epar
tmen
t of
Edu
catio
n
44
Depth-of-Knowledge: 3
Correct Response: B
Which expression is a factor of 24 2 2?x x
A ( 1)x
B ( 1)x
C ( 2)x
D ( 2)x

ACE Algebra I End-of-Instruction Test and Item Specifications 45
Cop
yrig
ht ©
201
2 by
the
Okl
ahom
a Sta
te D
epar
tmen
t of
Edu
catio
n
Oklahoma C3 Standard: Standard 2: Relations and Functions
Oklahoma C3 Objective: Objective 2.1: Relations and Functions
Oklahoma C3 Skill: Skill 2.1a: Distinguish between linear and nonlinear data.
Item Specifications:
Emphasis: Identify characteristics of linear and nonlinear data defined graphically and
numerically.
Stimulus Attributes: Test items may include graphs and tables.
Format: Distinguish between linear and nonlinear data represented graphically,
numerically, in equation form, and in tables, etc.
Content Limits: Exclude expressions in the form of xy. Exclude step functions or trigonometric functions.
Primary Process Standards: Communication Reasoning
Distractor Domain: Computational errors Common algebraic misconceptions

ACE Algebra I End-of-Instruction Test and Item Specifications
Cop
yrig
ht ©
201
2 by
the
Okl
ahom
a Sta
te D
epar
tmen
t of
Edu
catio
n
46
Sample Test Items for Skill 2.1a
Depth-of-Knowledge: 1
Correct Response: B
Which graph shows points that represent a nonlinear relation?
A
B
C
D

ACE Algebra I End-of-Instruction Test and Item Specifications 47
Cop
yrig
ht ©
201
2 by
the
Okl
ahom
a Sta
te D
epar
tmen
t of
Edu
catio
n
Depth-of-Knowledge: 2
Correct Response: B
Which set of data represents a linear relation?
A
B
C
D

ACE Algebra I End-of-Instruction Test and Item Specifications
Cop
yrig
ht ©
201
2 by
the
Okl
ahom
a Sta
te D
epar
tmen
t of
Edu
catio
n
48
Oklahoma C3 Standard: Standard 2: Relations and Functions
Oklahoma C3 Objective: Objective 2.1: Relations and Functions
Oklahoma C3 Skill: Skill 2.1b: Distinguish between relations and functions.
Item Specifications
Emphasis: Identify characteristics of relations and functions represented graphically,
numerically, or in diagrams and tables.
Stimulus Attributes: Test items may include graphs, diagrams, and tables.
Format: Identify a function from a group of relations represented graphically,
numerically, or in diagrams and tables.
Content Limits: Exclude expressions in the form of xy. Exclude step functions or trigonometric functions.
Primary Process Standards: Communication Reasoning
Distractor Domain: Computational errors Common algebraic misconceptions

ACE Algebra I End-of-Instruction Test and Item Specifications 49
Cop
yrig
ht ©
201
2 by
the
Okl
ahom
a Sta
te D
epar
tmen
t of
Edu
catio
n
Sample Test Items for Skill 2.1.b
Depth-of-Knowledge: 1
Correct Response: B
Which relation diagram represents a function?
A
B
C
D

ACE Algebra I End-of-Instruction Test and Item Specifications
Cop
yrig
ht ©
201
2 by
the
Okl
ahom
a Sta
te D
epar
tmen
t of
Edu
catio
n
50
Depth-of-Knowledge: 1
Correct Response: C
Which graph represents a function?
A
B
C
D

ACE Algebra I End-of-Instruction Test and Item Specifications 51
Cop
yrig
ht ©
201
2 by
the
Okl
ahom
a Sta
te D
epar
tmen
t of
Edu
catio
n
Depth-of-Knowledge: 2
Correct Response: D
Depth-of-Knowledge: 2
Correct Response: C
Which set of ordered pairs represents a function?
A (2, 1), (2, 2), (2, 3)
B (4, 2), (2, 4), (4, 4)
C (0, 0), (0, 1), (1, 0), (1, 1)
D (1, 1), (2, 2), (3, 3), (4, 4)
Which set of data represents a function?
A
B
C
D
ACE Algebra I End-of-Instruction Test and Item Specifications
Cop
yrig
ht ©
201
2 by
the
Okl
ahom
a Sta
te D
epar
tmen
t of
Edu
catio
n
52
Oklahoma C3 Standard: Standard 2: Relations and Functions
Oklahoma C3 Objective: Objective 2.1: Relations and Functions
Oklahoma C3 Skill: Skill 2.1c: Identify dependent and independent variables, domain and range.
Item Specifications:
Emphasis: Determine the dependent and independent variables, domain, and range of
various relations and functions represented mathematically and in real-world contexts.
Stimulus Attributes: Test items may include graphs, diagrams, and tables.
Format: Identify the dependent and independent variables and the domain and range of
various relations and functions represented algebraically, graphically, numerically, and in tables.
Content Limits: Exclude relations that include xy. Exclude step functions and trigonometric functions.
Primary Process Standards: Communication Reasoning
Distractor Domain: Computational errors Interchange range and domain Common algebraic misconceptions

ACE Algebra I End-of-Instruction Test and Item Specifications 53
Cop
yrig
ht ©
201
2 by
the
Okl
ahom
a Sta
te D
epar
tmen
t of
Edu
catio
n
Sample Test Items for Skill 2.1c
Depth-of-Knowledge: 1
Correct Response: B
Depth-of-Knowledge: 1
Correct Response: C
(0, 1), (2, 4), (4, 2), (4, 8), (8, 2), (8, 5)
Which set of numbers represents the domain?
A 1, 2, 4, 5, 8
B 0, 2, 4, 8
C 0, 1, 2, 4, 8
D 0, 1, 2, 4, 5, 8
(0, 1), (2, 2), (4, 3), (8, 4)
Which set of numbers represents the range?
A 0, 2, 4, 8
B 1, 2, 4, 8
C 1, 2, 3, 4
D 0, 1, 2, 3, 4, 8
ACE Algebra I End-of-Instruction Test and Item Specifications
Cop
yrig
ht ©
201
2 by
the
Okl
ahom
a Sta
te D
epar
tmen
t of
Edu
catio
n
54
Depth-of-Knowledge: 1
Correct Response: A
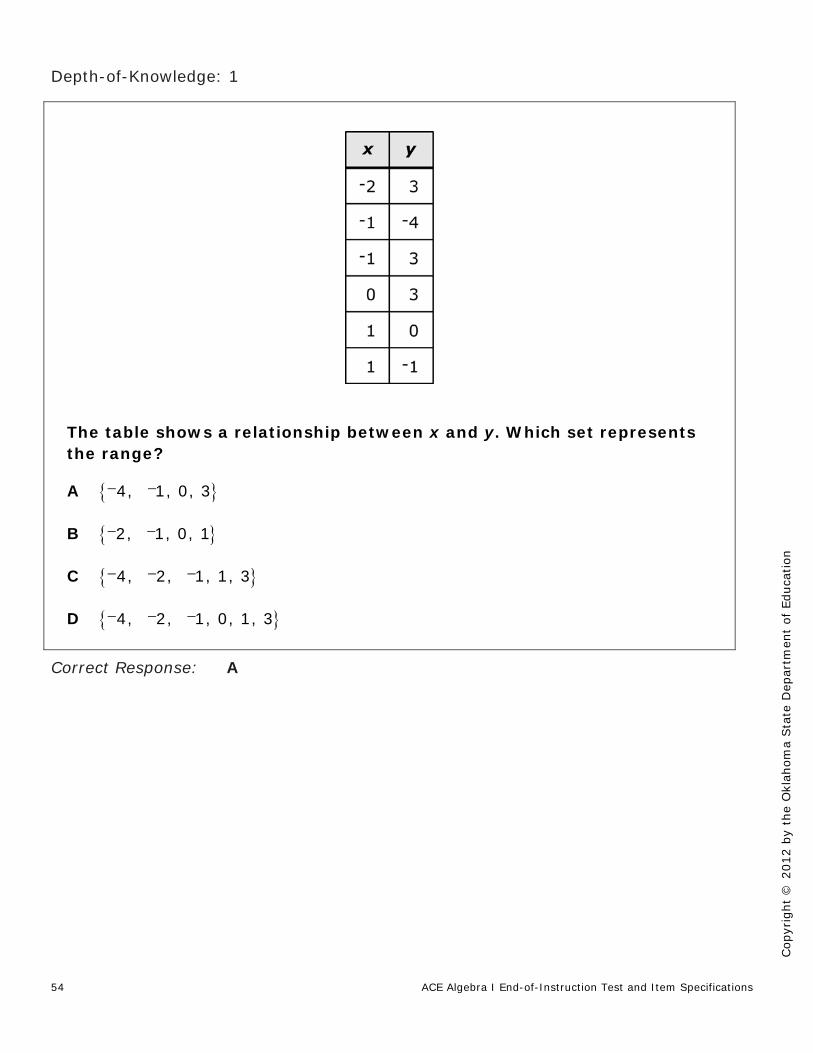
The table shows a relationship between x and y. Which set represents the range?
A 4, 1, 0, 3
B 2, 1, 0, 1
C 4, 2, 1, 1, 3
D 4, 2, 1, 0, 1, 3

ACE Algebra I End-of-Instruction Test and Item Specifications 55
Cop
yrig
ht ©
201
2 by
the
Okl
ahom
a Sta
te D
epar
tmen
t of
Edu
catio
n
Depth-of-Knowledge: 2
Correct Response: B
John owns a window-cleaning business. He charges different prices for cleaning windows of different sizes. What are the independent and dependent variables?
A Independent variable: window size Dependent variable: type of business
B Independent variable: window size Dependent variable: price charged
C Independent variable: type of business Dependent variable: price charged
D Independent variable: price charged Dependent variable: window size

ACE Algebra I End-of-Instruction Test and Item Specifications
Cop
yrig
ht ©
201
2 by
the
Okl
ahom
a Sta
te D
epar
tmen
t of
Edu
catio
n
56
Depth-of-Knowledge: 3
Correct Response: C
The graph shows the average squirrel population in a city park from the years 1970 to 2000. What are the domain and range of the data shown on the graph?
A Domain: All real numbers Range: All real numbers
B Domain: 1970 2,000x Range: 0 4,000y
C Domain: 1970 2,000x Range: 700 4,000y
D Domain: 700 4,000x Range: 1970 2,000y
ACE Algebra I End-of-Instruction Test and Item Specifications 57
Cop
yrig
ht ©
201
2 by
the
Okl
ahom
a Sta
te D
epar
tmen
t of
Edu
catio
n
Oklahoma C3 Standard: Standard 2: Relations and Functions
Oklahoma C3 Objective: Objective 2.1: Relations and Functions
Oklahoma C3 Skill: Skill 2.1d: Evaluate a function using tables, equations, or graphs.
Item Specifications:
Emphasis: Use a variety of representations of functions to find an element in the range
that corresponds with an element in the domain or vice versa.
Stimulus Attributes: Test items may include tables, graphs, data sets, and algebraic equations.
Format: Identify a corresponding element in the range with an element in the domain of
a function that is represented algebraically, graphically, or in data sets.
Content Limits: Limit functions to algebraic functions.
Primary Process Standards: Problem Solving Connections
Distractor Domain: Computational errors Interchange range and domain Common algebraic misconceptions

ACE Algebra I End-of-Instruction Test and Item Specifications
Cop
yrig
ht ©
201
2 by
the
Okl
ahom
a Sta
te D
epar
tmen
t of
Edu
catio
n
58
Sample Test Items for Skill 2.1d
Depth-of-Knowledge: 1
Correct Response: D
2 5y x
What is the value of x when 1?y
A 5
B 3
C 1
D 3

ACE Algebra I End-of-Instruction Test and Item Specifications 59
Cop
yrig
ht ©
201
2 by
the
Okl
ahom
a Sta
te D
epar
tmen
t of
Edu
catio
n
Depth-of-Knowledge: 1
Correct Response: A
What is the value of y when x is 2?
A 4
B 43
C 2
D 8
ACE Algebra I End-of-Instruction Test and Item Specifications
Cop
yrig
ht ©
201
2 by
the
Okl
ahom
a Sta
te D
epar
tmen
t of
Edu
catio
n
60
Depth-of-Knowledge: 2
Correct Response: C
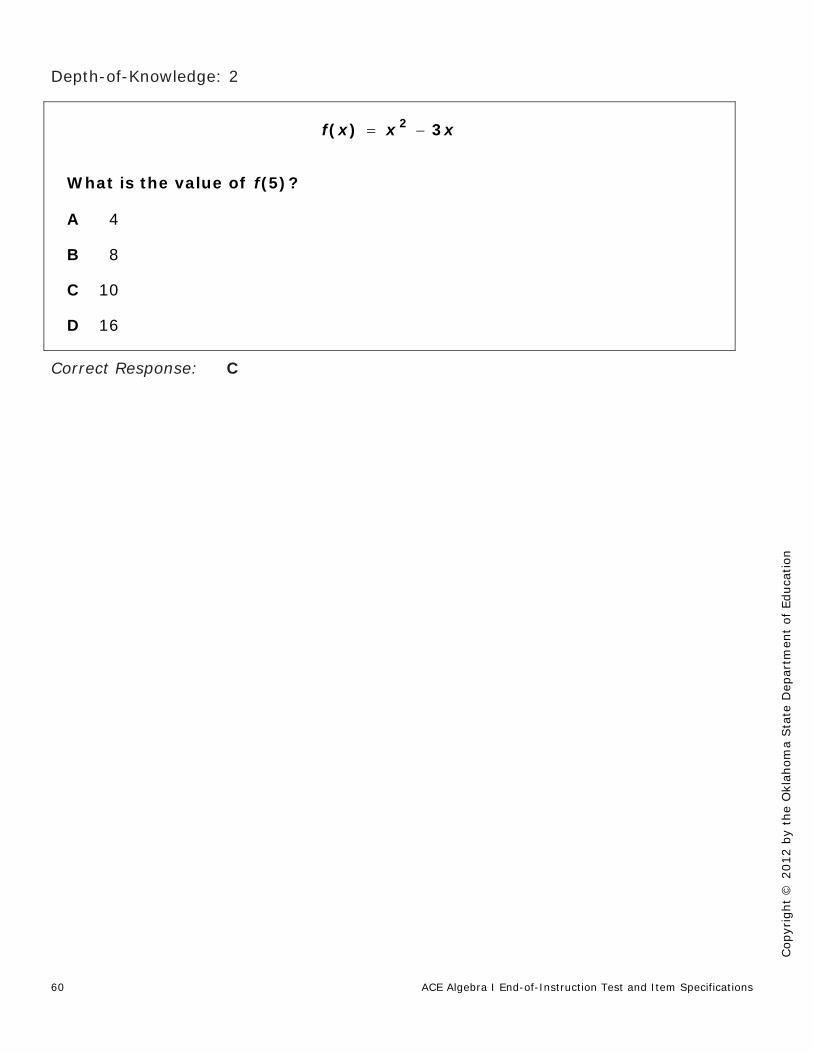
2( ) 3f x x x
What is the value of (5)?f
A 4
B 8
C 10
D 16

ACE Algebra I End-of-Instruction Test and Item Specifications 61
Cop
yrig
ht ©
201
2 by
the
Okl
ahom
a Sta
te D
epar
tmen
t of
Edu
catio
n
Depth-of-Knowledge: 2
Correct Response: D
The graph of the function ( )y f x is shown.
What is ( 3)?f
A 3
B 1
C 0
D 2

ACE Algebra I End-of-Instruction Test and Item Specifications
Cop
yrig
ht ©
201
2 by
the
Okl
ahom
a Sta
te D
epar
tmen
t of
Edu
catio
n
62
Depth-of-Knowledge: 2
Correct Response: D
Depth-of-Knowledge: 3
Correct Response: A
The function ( )f x is linear.
What is the value of (2)?f
A 6
B 2
C 3
D 7
If ( ) 2 5,f x x which expression represents ( 1)?f x
A 2 3x
B 2 4x
C 2 5x
D 2 7x
ACE Algebra I End-of-Instruction Test and Item Specifications 63
Cop
yrig
ht ©
201
2 by
the
Okl
ahom
a Sta
te D
epar
tmen
t of
Edu
catio
n
Oklahoma C3 Standard: Standard 2: Relations and Functions
Oklahoma C3 Objective: Objective 2.2: Linear Equations and Graphs
Oklahoma C3 Skill: Skill 2.2a: Solve linear equations by graphing or using properties of equality.
Item Specifications:
Emphasis: Determine solutions to algebraic equations by writing equivalent forms of
equations and using graphical representations.
Stimulus Attributes: Test items may include graphs, tables, and functions.
Format: Solve equations algebraically. Solve equations graphically.
Content Limits: Limit equations to linear.
Primary Process Standards: Problem Solving Reasoning
Distractor Domain: Computational errors Common algebraic misconceptions
ACE Algebra I End-of-Instruction Test and Item Specifications
Cop
yrig
ht ©
201
2 by
the
Okl
ahom
a Sta
te D
epar
tmen
t of
Edu
catio
n
64
Sample Test Items for Skill 2.2a
Depth-of-Knowledge: 1
Correct Response: D
Depth-of-Knowledge: 1
Correct Response: B
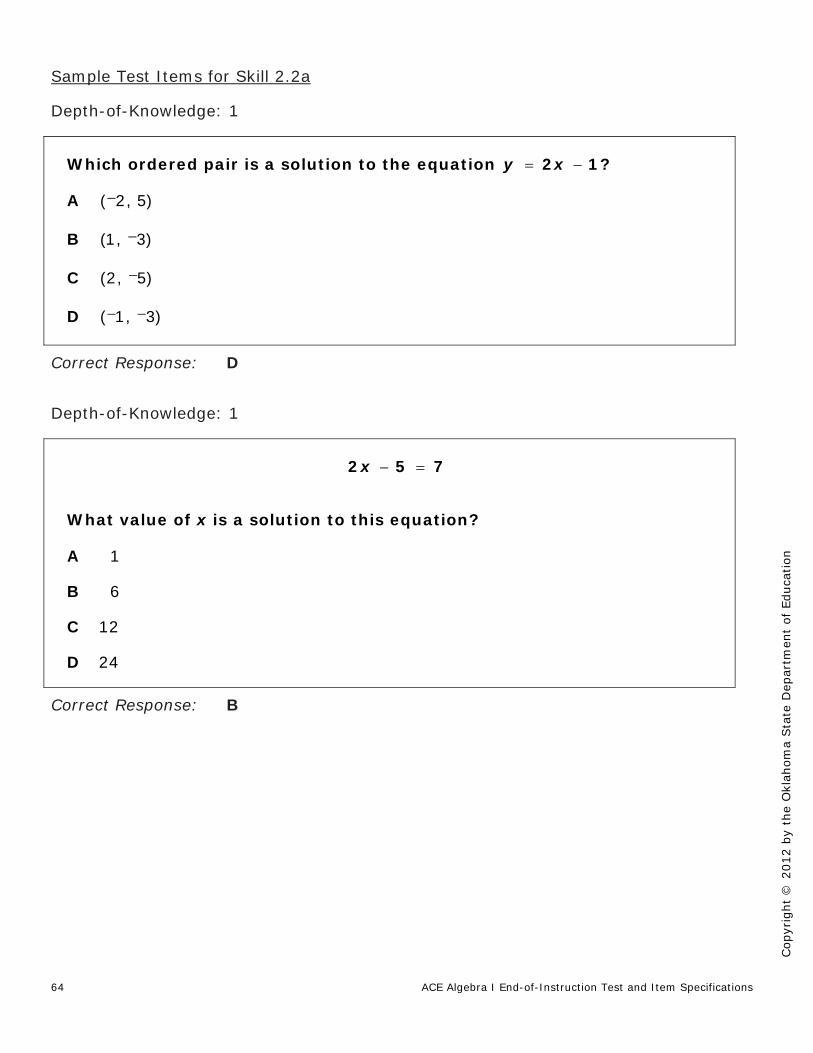
Which ordered pair is a solution to the equation 2 1?y x
A ( 2, 5)
B (1, 3)
C (2, 5)
D ( 1, 3)
2 5 7x
What value of x is a solution to this equation?
A 1
B 6
C 12
D 24

ACE Algebra I End-of-Instruction Test and Item Specifications 65
Cop
yrig
ht ©
201
2 by
the
Okl
ahom
a Sta
te D
epar
tmen
t of
Edu
catio
n
Depth-of-Knowledge: 2
Correct Response: B
Depth-of-Knowledge: 2
Correct Response: C
The equation below represents the cost (y) of a large pizza with different numbers of toppings (x).
10.25 1.25y x
Before tax, Carla paid $19.00 for a large pizza. How many toppings were on Carla’s pizza?
A 6 toppings
B 7 toppings
C 8 toppings
D 9 toppings
The profit (P) an ice cream store makes in one day when producing x gallons of ice cream is given by the equation 60 420.P x For what value of x is the store’s profit equal to 0?
A 0
B 1
C 7
D 8

ACE Algebra I End-of-Instruction Test and Item Specifications
Cop
yrig
ht ©
201
2 by
the
Okl
ahom
a Sta
te D
epar
tmen
t of
Edu
catio
n
66
Depth-of-Knowledge: 2
Correct Response: C
Brad graduated from college and started a new job. This table shows his yearly salary (y) for each year (x) for the next four years.
If Brad’s salary continues to increase at the same rate, what will be his salary for the 7th year at this job?
A $44,900
B $47,000
C $49,100
D $51,200
ACE Algebra I End-of-Instruction Test and Item Specifications 67
Cop
yrig
ht ©
201
2 by
the
Okl
ahom
a Sta
te D
epar
tmen
t of
Edu
catio
n
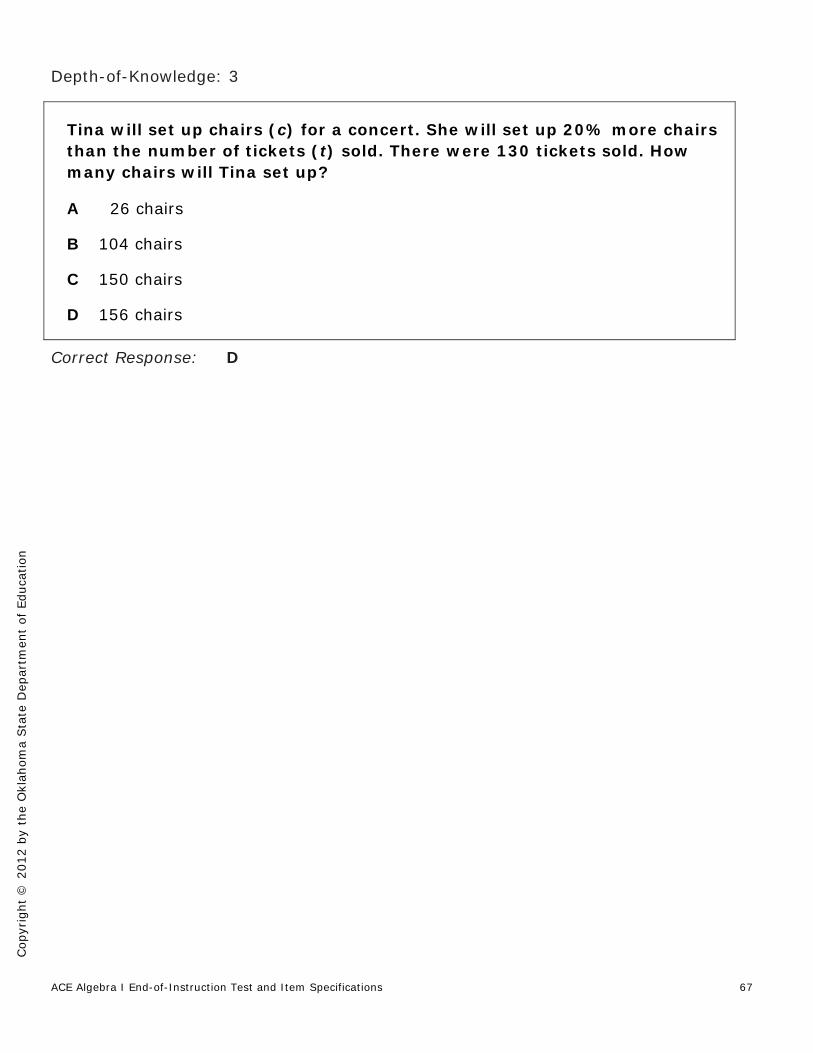
Depth-of-Knowledge: 3
Correct Response: D
Tina will set up chairs (c) for a concert. She will set up 20% more chairs than the number of tickets (t) sold. There were 130 tickets sold. How many chairs will Tina set up?
A 26 chairs
B 104 chairs
C 150 chairs
D 156 chairs

ACE Algebra I End-of-Instruction Test and Item Specifications
Cop
yrig
ht ©
201
2 by
the
Okl
ahom
a Sta
te D
epar
tmen
t of
Edu
catio
n
68
Oklahoma C3 Standard: Standard 2: Relations and Functions
Oklahoma C3 Objective: Objective 2.2: Linear Equations and Graphs
Oklahoma C3 Skill: Skill 2.2b: Recognize the parent graph of the functions y = k, y = x, y = |x|,
and predict the effects of transformations on the parent graph.
Item Specifications:
Emphasis: Predict how a change in the algebraic representation of a parent function will
affect the graph of the function.
Stimulus Attributes: Test items may include algebraic and graphical representations of parent
functions, functions, and families of functions.
Format: Identify the parent function from graphs of functions or families of functions. Describe how a change in algebraic form of a function will affect the graph of
the function.
Content Limits: Exclude step functions. Limit functions to linear and absolute value functions.
Primary Process Standards: Communication Reasoning Representation
Distractor Domain: Common algebraic misconceptions

ACE Algebra I End-of-Instruction Test and Item Specifications 69
Cop
yrig
ht ©
201
2 by
the
Okl
ahom
a Sta
te D
epar
tmen
t of
Edu
catio
n
Sample Test Items for Skill 2.2b
Depth-of-Knowledge: 1
Correct Response: C
Which graph represents the function 1?y
A
B
C
D
ACE Algebra I End-of-Instruction Test and Item Specifications
Cop
yrig
ht ©
201
2 by
the
Okl
ahom
a Sta
te D
epar
tmen
t of
Edu
catio
n
70
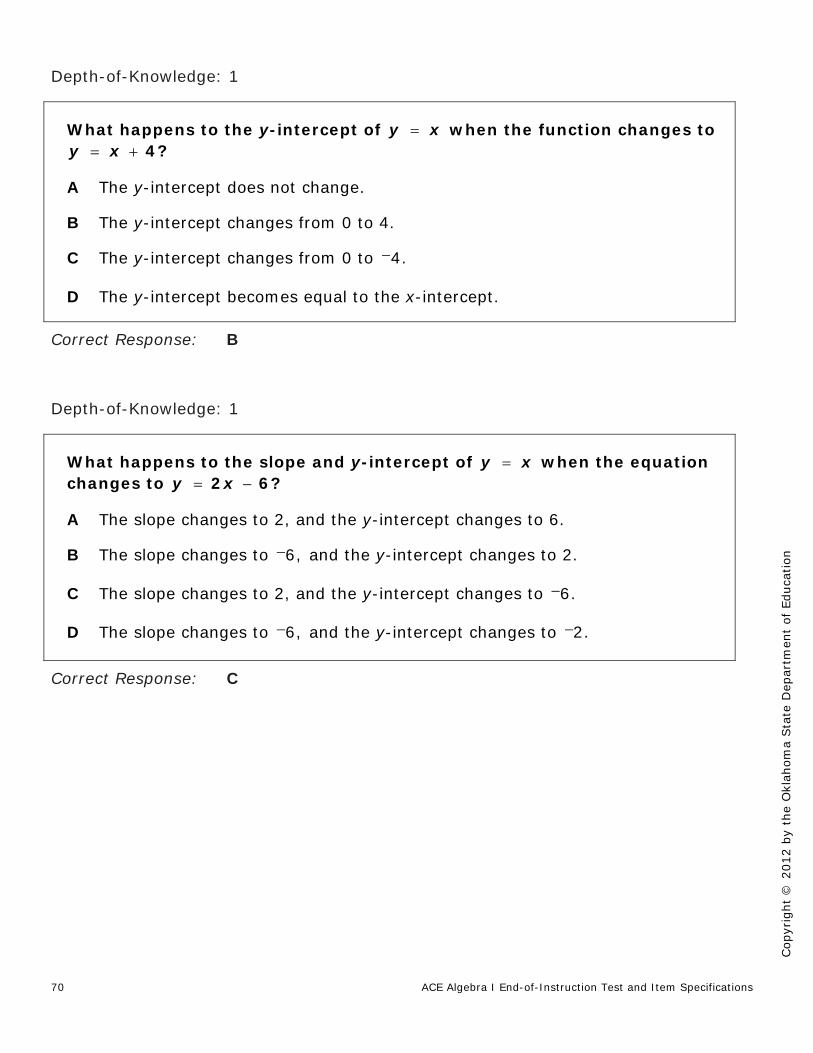
Depth-of-Knowledge: 1
Correct Response: B
Depth-of-Knowledge: 1
Correct Response: C
What happens to the y-intercept of y x when the function changes to 4?y x
A The y-intercept does not change.
B The y-intercept changes from 0 to 4.
C The y-intercept changes from 0 to 4.
D The y-intercept becomes equal to the x-intercept.
What happens to the slope and y-intercept of y x when the equation changes to 2 6?y x
A The slope changes to 2, and the y-intercept changes to 6.
B The slope changes to 6, and the y-intercept changes to 2.
C The slope changes to 2, and the y-intercept changes to 6.
D The slope changes to 6, and the y-intercept changes to 2.
ACE Algebra I End-of-Instruction Test and Item Specifications 71
Cop
yrig
ht ©
201
2 by
the
Okl
ahom
a Sta
te D
epar
tmen
t of
Edu
catio
n
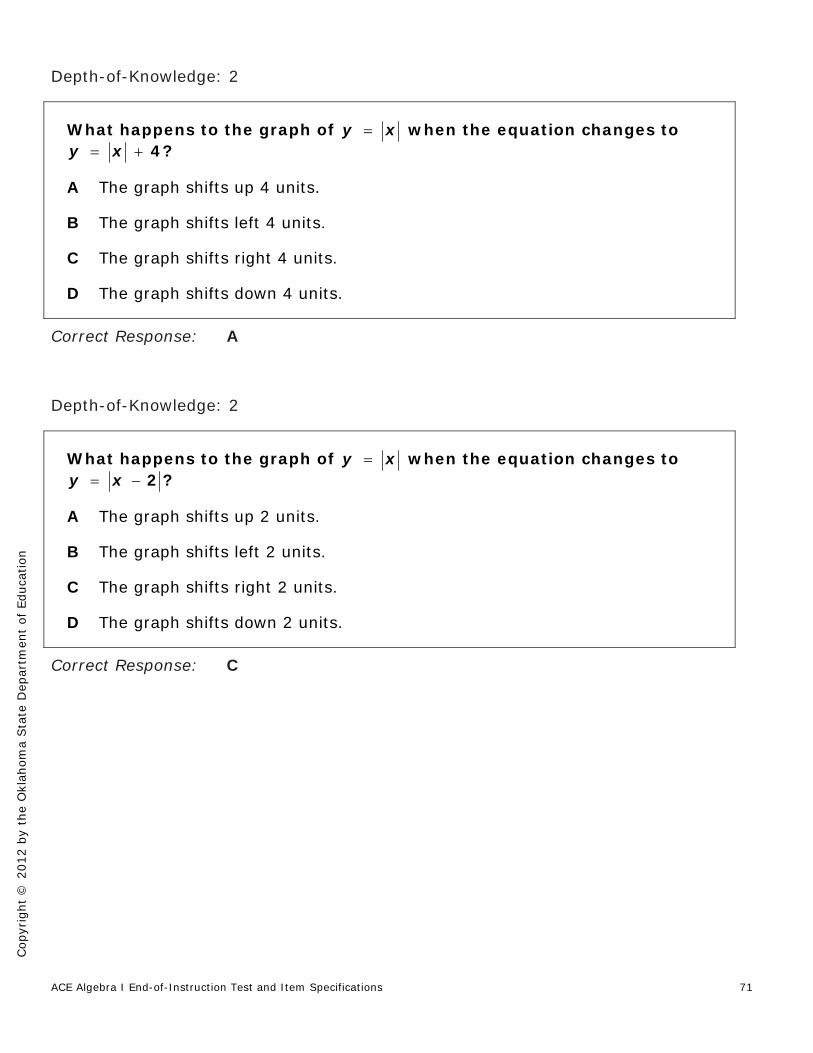
Depth-of-Knowledge: 2
Correct Response: A
Depth-of-Knowledge: 2
Correct Response: C
What happens to the graph of y x when the equation changes to 4?y x
A The graph shifts up 4 units.
B The graph shifts left 4 units.
C The graph shifts right 4 units.
D The graph shifts down 4 units.
What happens to the graph of y x when the equation changes to 2 ?y x
A The graph shifts up 2 units.
B The graph shifts left 2 units.
C The graph shifts right 2 units.
D The graph shifts down 2 units.

ACE Algebra I End-of-Instruction Test and Item Specifications
Cop
yrig
ht ©
201
2 by
the
Okl
ahom
a Sta
te D
epar
tmen
t of
Edu
catio
n
72
Oklahoma C3 Standard: Standard 2: Relations and Functions
Oklahoma C3 Objective: Objective 2.2: Linear Equations and Graphs
Oklahoma C3 Skill: Skill 2.2c: Slope
Oklahoma C3 SubSkill: SubSkill 2.2c.I: Calculate the slope of a line using a graph, an equation, two
points or a set of data points.
Item Specifications:
Emphasis: Determine the slope of linear functions that are represented algebraically,
geometrically, and by sets of data.
Stimulus Attributes: Test items may include graphs, points, ordered pairs, tables, and equations.
Format: Identify the slope from a graph. Identify the slope using the slope formula. Identify the slope from the equation of a line.
Content Limits: Limit to linear functions.
Primary Process Standards: Problem Solving Connections Representation
Distractor Domain: Computational errors Common algebraic misconceptions
ACE Algebra I End-of-Instruction Test and Item Specifications 73
Cop
yrig
ht ©
201
2 by
the
Okl
ahom
a Sta
te D
epar
tmen
t of
Edu
catio
n
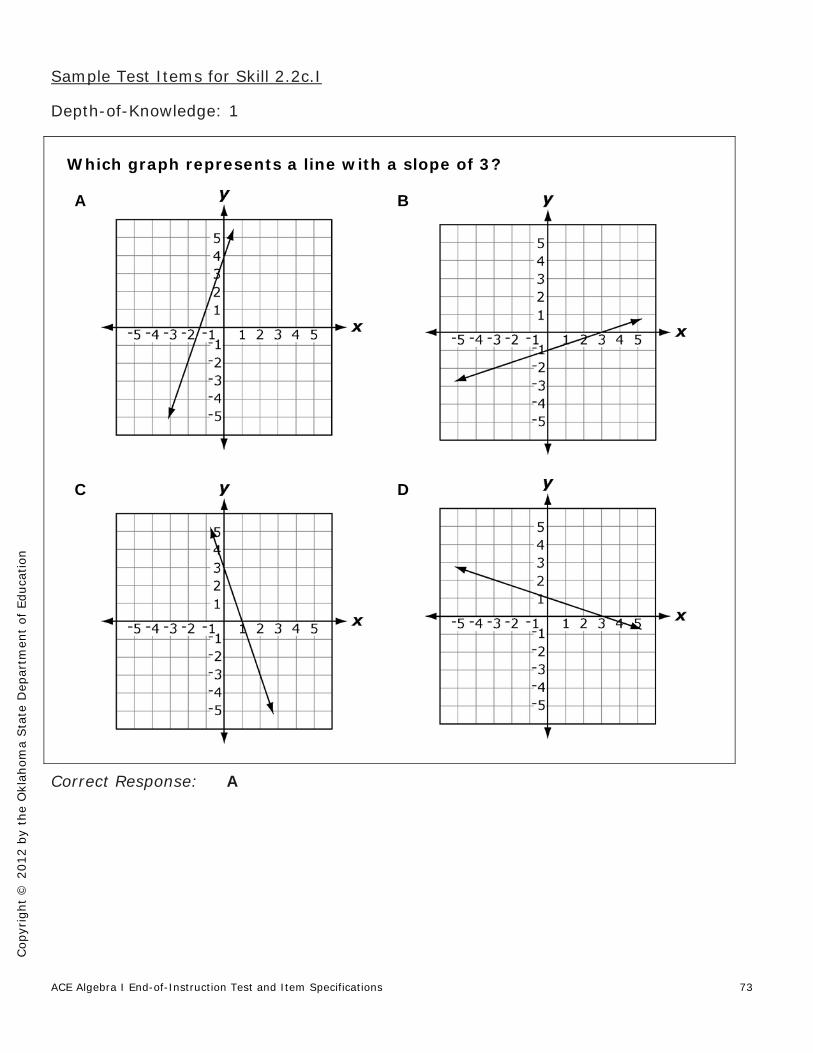
Sample Test Items for Skill 2.2c.I
Depth-of-Knowledge: 1
Correct Response: A
Which graph represents a line with a slope of 3?
A
B
C
D

ACE Algebra I End-of-Instruction Test and Item Specifications
Cop
yrig
ht ©
201
2 by
the
Okl
ahom
a Sta
te D
epar
tmen
t of
Edu
catio
n
74
Depth-of-Knowledge: 1
Correct Response: B
What is the slope of this graphed line?
A 3
B 13
C 13
D 3

ACE Algebra I End-of-Instruction Test and Item Specifications 75
Cop
yrig
ht ©
201
2 by
the
Okl
ahom
a Sta
te D
epar
tmen
t of
Edu
catio
n
Depth-of-Knowledge: 2
Correct Response: A
Depth-of-Knowledge: 2
Correct Response: D
What is the slope of the line that passes through the points ( 5, 2) and (2, 3)?
A 17
B 13
C 3
D 7
What is the slope of the line that passes through the points in this table?
A 6
B 4
C 5
D 6

ACE Algebra I End-of-Instruction Test and Item Specifications
Cop
yrig
ht ©
201
2 by
the
Okl
ahom
a Sta
te D
epar
tmen
t of
Edu
catio
n
76
Depth-of-Knowledge: 3
Correct Response: C
2 3 6x y
What is the slope of this line?
A 2
B 23
C 23
D 2

ACE Algebra I End-of-Instruction Test and Item Specifications 77
Cop
yrig
ht ©
201
2 by
the
Okl
ahom
a Sta
te D
epar
tmen
t of
Edu
catio
n
Oklahoma C3 Standard: Standard 2: Relations and Functions
Oklahoma C3 Objective: Objective 2.2: Linear Equations and Graphs
Oklahoma C3 Skill: Skill 2.2c: Slope
Oklahoma C3 SubSkill: SubSkill 2.2c.II: Use the slope to differentiate between lines that are parallel,
perpendicular, horizontal, or vertical.
Item Specifications:
Emphasis: Identify geometric characteristics of linear functions by analyzing slopes of the
functions.
Stimulus Attributes: Test items may include equations or graphs.
Format: Characterize a given set of lines by analyzing the slopes of the lines.
Content Limits: Limit sets to at most two lines.
Primary Process Standards: Problem Solving Communication Reasoning
Distractor Domain: Algebraic misconceptions Geometric misconceptions

ACE Algebra I End-of-Instruction Test and Item Specifications
Cop
yrig
ht ©
201
2 by
the
Okl
ahom
a Sta
te D
epar
tmen
t of
Edu
catio
n
78
Sample Test Items for Skill 2.2c.II
Depth-of-Knowledge: 1
Correct Response: C
Depth-of-Knowledge: 1
Correct Response: B
Which equation represents a horizontal line?
A y x
B 3x
C 5y
D x y
What is the slope of the line perpendicular to 2 3?y x
A 13
B 12
C 2
D 3
ACE Algebra I End-of-Instruction Test and Item Specifications 79
Cop
yrig
ht ©
201
2 by
the
Okl
ahom
a Sta
te D
epar
tmen
t of
Edu
catio
n
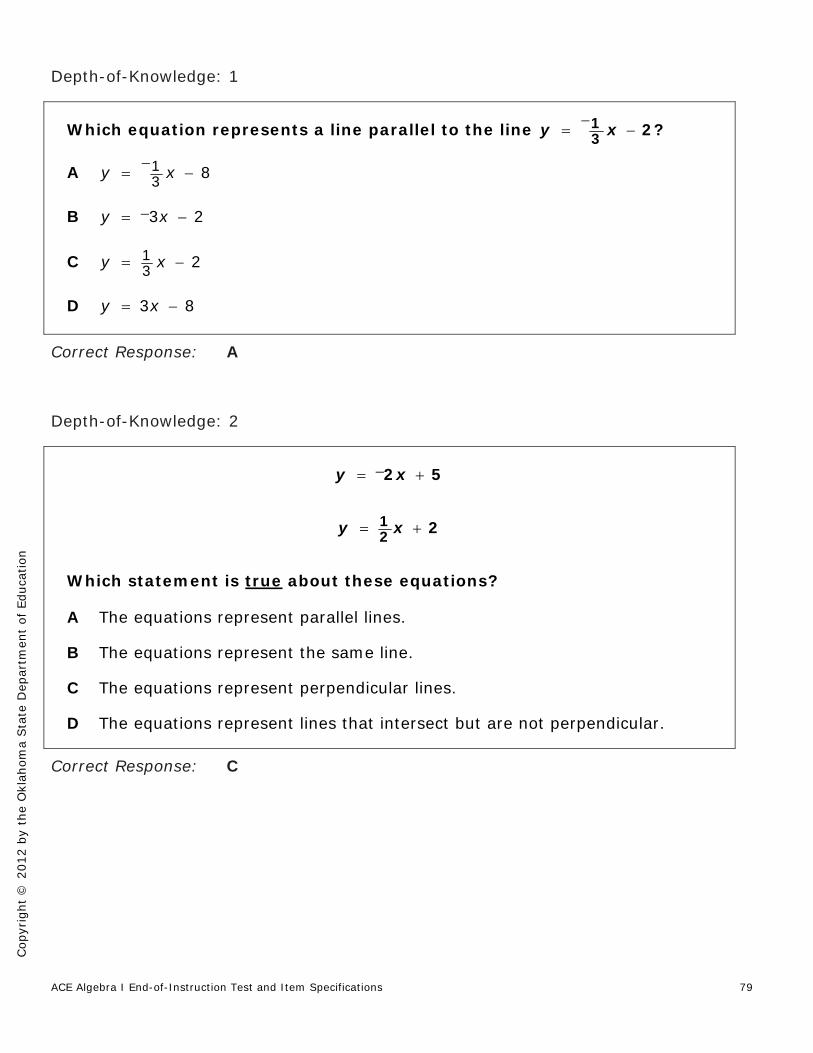
Depth-of-Knowledge: 1
Correct Response: A
Depth-of-Knowledge: 2
Correct Response: C
Which equation represents a line parallel to the line 1
3 2?y x
A 13 8y x
B 3 2y x
C 13 2y x
D 3 8y x
2 5y x
12 2y x
Which statement is true about these equations?
A The equations represent parallel lines.
B The equations represent the same line.
C The equations represent perpendicular lines.
D The equations represent lines that intersect but are not perpendicular.

ACE Algebra I End-of-Instruction Test and Item Specifications
Cop
yrig
ht ©
201
2 by
the
Okl
ahom
a Sta
te D
epar
tmen
t of
Edu
catio
n
80
Depth-of-Knowledge: 2
Correct Response: A
Which statement describes the line that contains the points ( 3, 4) and ( 3, 5)?
A The line is vertical.
B The line is horizontal.
C The line has a positive slope.
D The line has a negative slope.

ACE Algebra I End-of-Instruction Test and Item Specifications 81
Cop
yrig
ht ©
201
2 by
the
Okl
ahom
a Sta
te D
epar
tmen
t of
Edu
catio
n
Depth-of-Knowledge: 3
Correct Response: A
Which equation represents a line that is perpendicular to this graphed line?
A 12 2y x
B 12 2y x
C 2 2y x
D 2 2y x

ACE Algebra I End-of-Instruction Test and Item Specifications
Cop
yrig
ht ©
201
2 by
the
Okl
ahom
a Sta
te D
epar
tmen
t of
Edu
catio
n
82
Oklahoma C3 Standard: Standard 2: Relations and Functions
Oklahoma C3 Objective: Objective 2.2: Linear Equations and Graphs
Oklahoma C3 Skill: Skill 2.2c: Slope
Oklahoma C3 SubSkill: SubSkill 2.2c.III: Interpret the slope and intercepts within the context of
everyday life (e.g., telephone charges based on base rate [y-intercept] plus rate per minute [slope]).
Item Specifications:
Emphasis: Apply the concepts of slope and intercepts of linear relations to real-world
contexts.
Stimulus Attributes: Test items may include tables and graphs.
Format: Identify rates of constant change. Identify the meaning of intercepts in real-world contexts. Identify the meaning of rates of change in real-world contexts.
Content Limits: Limit real-world contexts to those that are of age-appropriate recognition.
Primary Process Standards: Problem Solving Communication Connections
Distractor Domain: Conceptual errors Computational errors

ACE Algebra I End-of-Instruction Test and Item Specifications 83
Cop
yrig
ht ©
201
2 by
the
Okl
ahom
a Sta
te D
epar
tmen
t of
Edu
catio
n
Sample Test Items for Skill 2.2c.III
Depth-of-Knowledge: 2
Correct Response: A
The graph shows the hours worked and total pay for Paul’s part-time job.
What does the slope of this graph represent?
A hourly pay
B days worked
C hours worked
D money earned

ACE Algebra I End-of-Instruction Test and Item Specifications
Cop
yrig
ht ©
201
2 by
the
Okl
ahom
a Sta
te D
epar
tmen
t of
Edu
catio
n
84
Depth-of-Knowledge: 2
Correct Response: B
The table shows how much Donna charges for doing yard work. She charges a fixed fee plus an hourly rate.
What is Donna’s hourly rate?
A $5.50 per hour
B $6.00 per hour
C $8.50 per hour
D $11.00 per hour
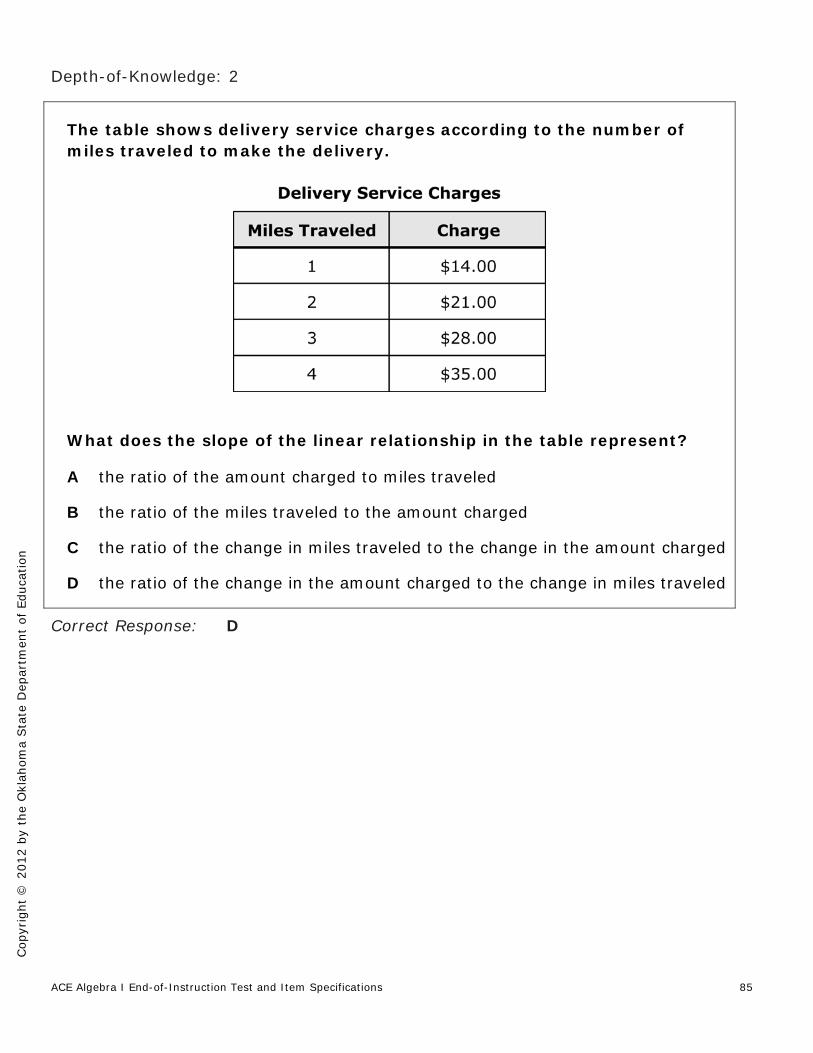
ACE Algebra I End-of-Instruction Test and Item Specifications 85
Cop
yrig
ht ©
201
2 by
the
Okl
ahom
a Sta
te D
epar
tmen
t of
Edu
catio
n
Depth-of-Knowledge: 2
Correct Response: D
The table shows delivery service charges according to the number of miles traveled to make the delivery.
What does the slope of the linear relationship in the table represent?
A the ratio of the amount charged to miles traveled
B the ratio of the miles traveled to the amount charged
C the ratio of the change in miles traveled to the change in the amount charged
D the ratio of the change in the amount charged to the change in miles traveled

ACE Algebra I End-of-Instruction Test and Item Specifications
Cop
yrig
ht ©
201
2 by
the
Okl
ahom
a Sta
te D
epar
tmen
t of
Edu
catio
n
86
Depth-of-Knowledge: 2
Correct Response: D
Todd deposited $200 in his account. The graph shows how the money in his account will increase over the next ten years.
What does the y-intercept of this graph represent?
A the rate of interest
B the increase per year
C the amount of money earned
D the original amount deposited
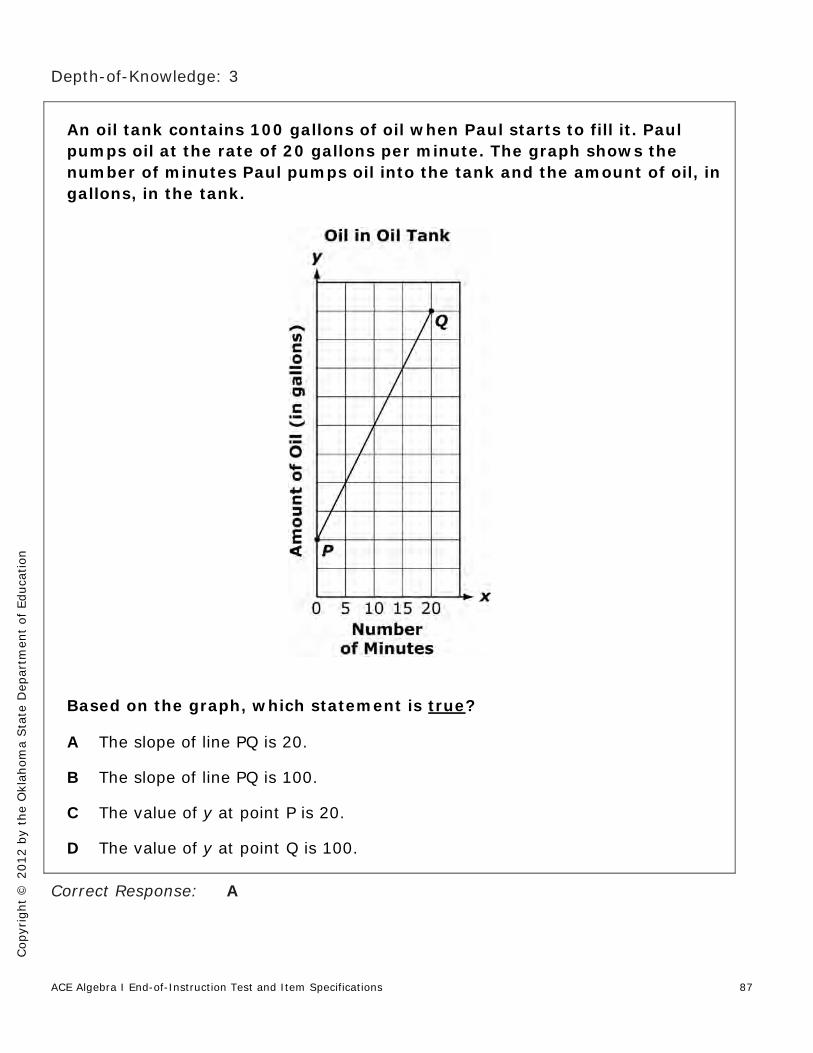
ACE Algebra I End-of-Instruction Test and Item Specifications 87
Cop
yrig
ht ©
201
2 by
the
Okl
ahom
a Sta
te D
epar
tmen
t of
Edu
catio
n
Depth-of-Knowledge: 3
Correct Response: A
An oil tank contains 100 gallons of oil when Paul starts to fill it. Paul pumps oil at the rate of 20 gallons per minute. The graph shows the number of minutes Paul pumps oil into the tank and the amount of oil, in gallons, in the tank.
Based on the graph, which statement is true?
A The slope of line PQ is 20.
B The slope of line PQ is 100.
C The value of y at point P is 20.
D The value of y at point Q is 100.

ACE Algebra I End-of-Instruction Test and Item Specifications
Cop
yrig
ht ©
201
2 by
the
Okl
ahom
a Sta
te D
epar
tmen
t of
Edu
catio
n
88
Oklahoma C3 Standard: Standard 2: Relations and Functions
Oklahoma C3 Objective: Objective 2.2: Linear Equations and Graphs
Oklahoma C3 Skill: Skill 2.2d: Develop the equation of a line and graph linear relationships given
the following: slope and y-intercept, slope and one point on the line, two points on the line, x-intercept and y-intercept, a set of data points.
Item Specifications:
Emphasis: Determine algebraic and graphical representations of linear functions using a
variety of information.
Stimulus Attributes: Test items may include tables, ordered pairs, and graphs.
Format: Identify the graph of the line given any of a variety of characteristics. Identify the equation of the line given any of a variety of characteristics.
Content Limits: Limit to linear functions.
Primary Process Standards: Problem Solving Connections Representation
Distractor Domain: Computational errors Common algebraic misconceptions

ACE Algebra I End-of-Instruction Test and Item Specifications 89
Cop
yrig
ht ©
201
2 by
the
Okl
ahom
a Sta
te D
epar
tmen
t of
Edu
catio
n
Sample Test Items for Skill 2.2d
Depth-of-Knowledge: 1
Correct Response: A
Which graph represents a line with a y-intercept of 4 and a slope of 3?
A
B
C
D

ACE Algebra I End-of-Instruction Test and Item Specifications
Cop
yrig
ht ©
201
2 by
the
Okl
ahom
a Sta
te D
epar
tmen
t of
Edu
catio
n
90
Depth-of-Knowledge: 2
Correct Response: B
Depth-of-Knowledge: 2
Correct Response: D
What is the equation of the line that has a slope of 5 and passes through the y-axis at 2?
A 5 2y x
B 5 2y x
C 5( 2)y x
D 5( 2)y x
What is the equation of the line with a slope of 2 that passes through the point (4, 3)?
A 4 3( ( 2))y x
B 3 4( ( 2))y x
C 4 2( 3)y x
D 3 2( 4)y x

ACE Algebra I End-of-Instruction Test and Item Specifications 91
Cop
yrig
ht ©
201
2 by
the
Okl
ahom
a Sta
te D
epar
tmen
t of
Edu
catio
n
Depth-of-Knowledge: 2
Correct Response: A
What is the equation of the line that passes through the points in this table?
A 6y x
B 60y x
C 6 10y x
D 60 10y x

ACE Algebra I End-of-Instruction Test and Item Specifications
Cop
yrig
ht ©
201
2 by
the
Okl
ahom
a Sta
te D
epar
tmen
t of
Edu
catio
n
92
Depth-of-Knowledge: 2
Correct Response: A
Which graph represents a line with a slope of 2 that passes through the point ( 1, 2)?
A
B
C
D
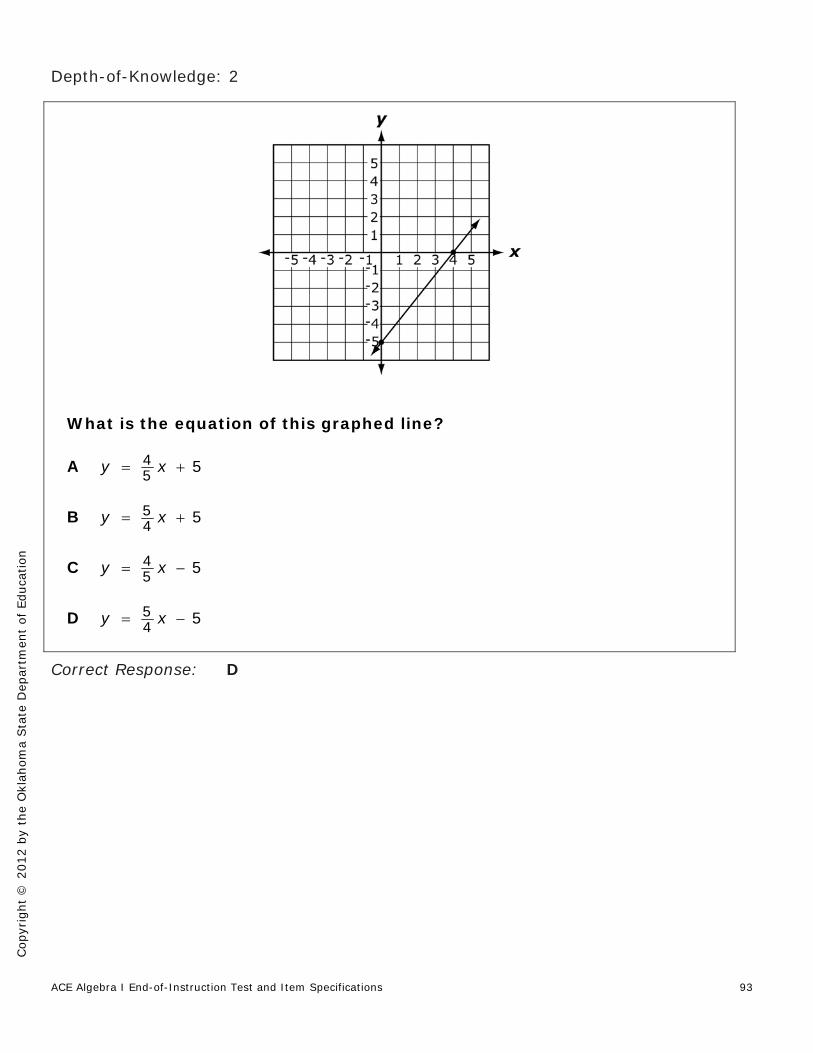
ACE Algebra I End-of-Instruction Test and Item Specifications 93
Cop
yrig
ht ©
201
2 by
the
Okl
ahom
a Sta
te D
epar
tmen
t of
Edu
catio
n
Depth-of-Knowledge: 2
Correct Response: D
What is the equation of this graphed line?
A 45 5y x
B 54 5y x
C 45 5y x
D 54 5y x
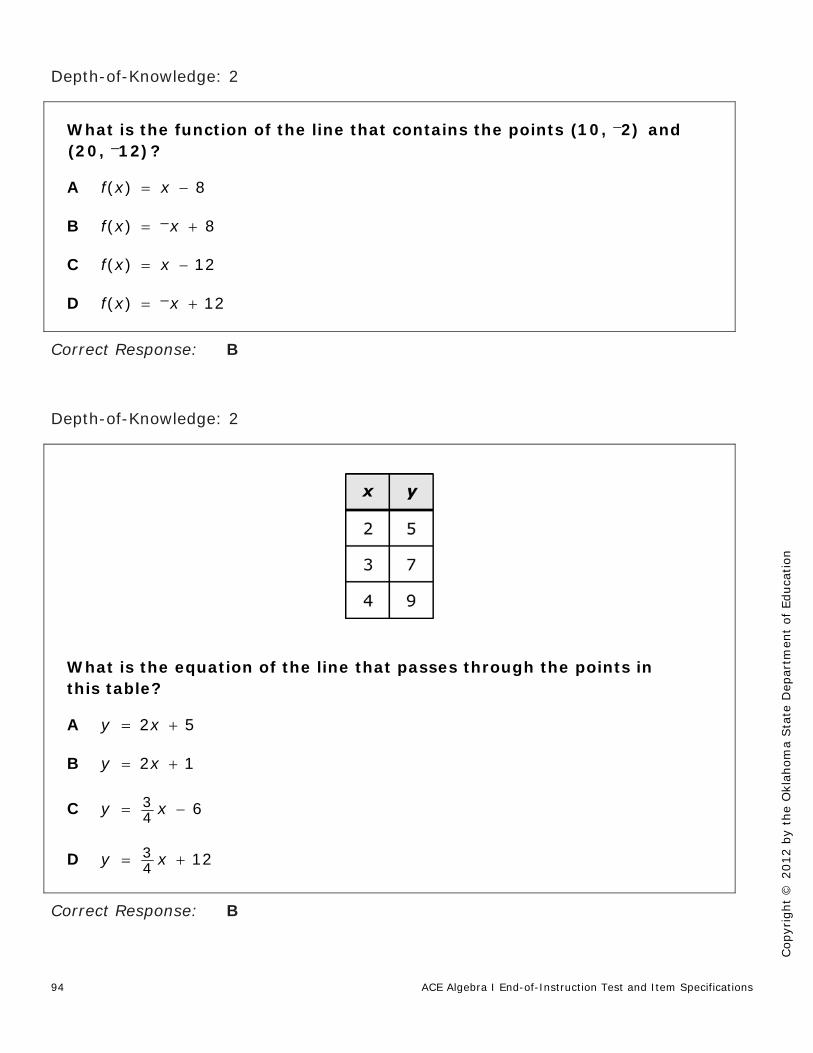
ACE Algebra I End-of-Instruction Test and Item Specifications
Cop
yrig
ht ©
201
2 by
the
Okl
ahom
a Sta
te D
epar
tmen
t of
Edu
catio
n
94
Depth-of-Knowledge: 2
Correct Response: B
Depth-of-Knowledge: 2
Correct Response: B
What is the function of the line that contains the points (10, 2) and (20, 12)?
A ( ) 8f x x
B ( ) 8f x x
C ( ) 12f x x
D ( ) 12f x x
What is the equation of the line that passes through the points in this table?
A 2 5y x
B 2 1y x
C 34 6y x
D 34 12y x

ACE Algebra I End-of-Instruction Test and Item Specifications 95
Cop
yrig
ht ©
201
2 by
the
Okl
ahom
a Sta
te D
epar
tmen
t of
Edu
catio
n
Depth-of-Knowledge: 3
Correct Response: D
Depth-of-Knowledge: 3
Correct Response: A
What is the equation of the line with a slope of 3 that passes through the x-axis at 1?
A 3 1y x
B 3 1y x
C 3 3y x
D 3 3y x
What is the equation of the line that passes through the points ( 2, 4) and (3, 1)?
A 2y x
B 3 2y x
C 6y x
D 3 145 5y x

ACE Algebra I End-of-Instruction Test and Item Specifications
Cop
yrig
ht ©
201
2 by
the
Okl
ahom
a Sta
te D
epar
tmen
t of
Edu
catio
n
96
Depth-of-Knowledge: 3
Correct Response: A
Depth-of-Knowledge: 3
Correct Response: B
The population of a small town in 1990 was 1,200 people, and the population in 2000 was 2,700 people. Let x represent the number of years since 1990. Let y represent the population. Which linear equation represents this data?
A 150 1,200y x
B 150 2,700y x
C 1,200 2,700y x
D 2,700 1,200y x
What is the equation of the line with an x-intercept of 3 and a y-intercept of 6?
A 2 3y x
B 2 6y x
C 3 3y x
D 3 6y x

ACE Algebra I End-of-Instruction Test and Item Specifications 97
Cop
yrig
ht ©
201
2 by
the
Okl
ahom
a Sta
te D
epar
tmen
t of
Edu
catio
n
Oklahoma C3 Standard: Standard 2: Relations and Functions
Oklahoma C3 Objective: Objective 2.2: Linear Equations and Graphs
Oklahoma C3 Skill: Skill 2.2e: Match equations to a graph, table, or situation and vice versa.
Item Specifications:
Emphasis: Translate among various representations of equations.
Stimulus Attributes: Test items may include graphs, tables, and situations.
Format: Identify the appropriate situation that corresponds to an algebraic equation. Identify the appropriate algebraic equation that represents a situation
described graphically or verbally.
Content Limits: Limit to age-appropriate situations. Limit to linear equations.
Primary Process Standards: Communication Connections Representation
Distractor Domain: Common algebraic misconceptions

ACE Algebra I End-of-Instruction Test and Item Specifications
Cop
yrig
ht ©
201
2 by
the
Okl
ahom
a Sta
te D
epar
tmen
t of
Edu
catio
n
98
Sample Test Items for Skill 2.2e
Depth-of-Knowledge: 1
Correct Response: A
Depth-of-Knowledge: 2
Correct Response: D
A furnace technician charges $20 per hour and a one-time service charge of $30. Which equation represents the total charge (y) for working x hours?
A 20 30y x
B 30 20y x
C 20( 30)y x
D 20( 30)y x
The table shows the amount Donna charges (y) for doing yard work. She charges a fixed fee plus an hourly rate.
Which equation represents the amount Donna charges for working x hours?
A 6y x
B 10y x
C 5 6y x
D 6 5y x
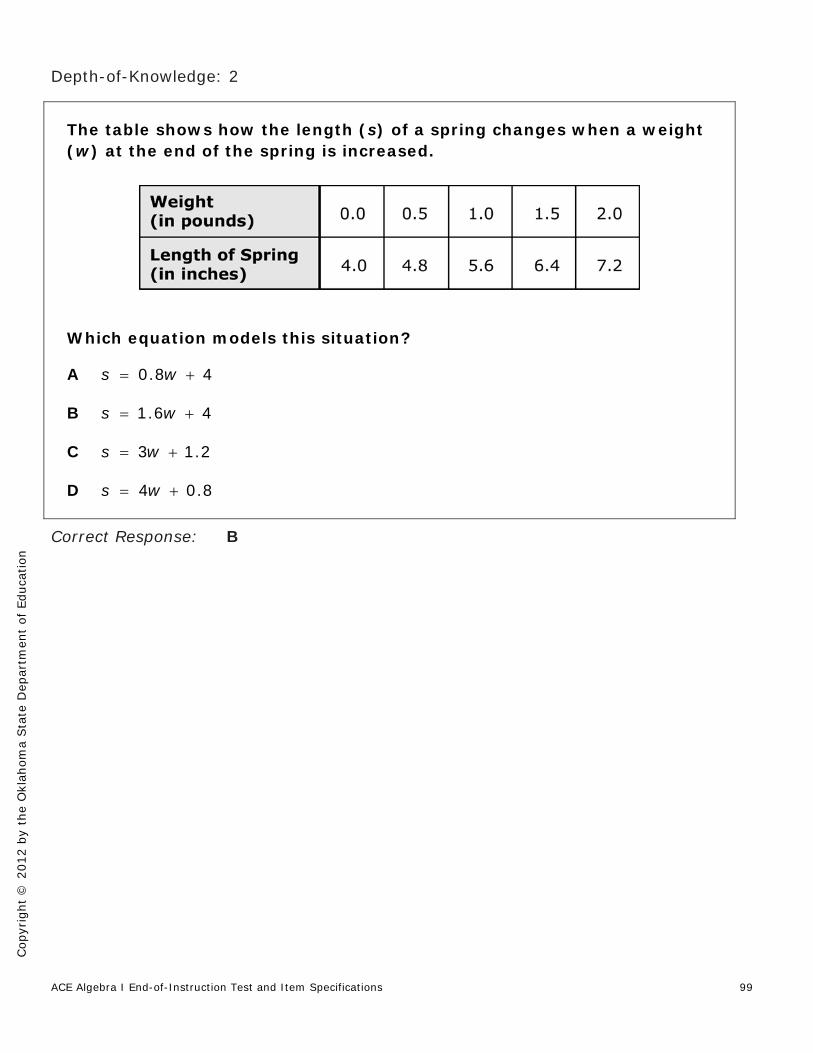
ACE Algebra I End-of-Instruction Test and Item Specifications 99
Cop
yrig
ht ©
201
2 by
the
Okl
ahom
a Sta
te D
epar
tmen
t of
Edu
catio
n
Depth-of-Knowledge: 2
Correct Response: B
The table shows how the length (s) of a spring changes when a weight (w) at the end of the spring is increased.
Which equation models this situation?
A 0.8 4s w
B 1.6 4s w
C 3 1.2s w
D 4 0.8s w

ACE Algebra I End-of-Instruction Test and Item Specifications
Cop
yrig
ht ©
201
2 by
the
Okl
ahom
a Sta
te D
epar
tmen
t of
Edu
catio
n
100
Depth-of-Knowledge: 2
Correct Response: A
What is the equation of this graphed function?
A 3 1xy
B 3 3xy
C 3 1y x
D 3 3y x
ACE Algebra I End-of-Instruction Test and Item Specifications 101
Cop
yrig
ht ©
201
2 by
the
Okl
ahom
a Sta
te D
epar
tmen
t of
Edu
catio
n
Oklahoma C3 Standard: Standard 2: Relations and Functions
Oklahoma C3 Objective: Objective 2.3: Linear Inequalities and Graphs
Oklahoma C3 Skill: Skill 2.3a: Solve linear inequalities by graphing or using properties of
inequalities.
Item Specifications:
Emphasis: Determine solutions to algebraic inequalities by writing equivalent forms of
inequalities and using graphical representations.
Stimulus Attributes: Test items may include graphs or number lines.
Format: Solve linear inequalities graphically. Solve linear inequalities algebraically.
Content Limits: Limit inequalities to rational coefficients.
Primary Process Standards: Problem Solving Reasoning
Distractor Domain: Computational errors Common algebraic misconceptions Incorrectly filled or blank points on number lines Misdirected arrows on number lines or wrong shading of graphs

ACE Algebra I End-of-Instruction Test and Item Specifications
Cop
yrig
ht ©
201
2 by
the
Okl
ahom
a Sta
te D
epar
tmen
t of
Edu
catio
n
102
Sample Test Items for Skill 2.3a
Depth-of-Knowledge: 2
Correct Response: B
Depth-of-Knowledge: 2
Correct Response: A
Which number line represents the solution set to the inequality 4 4 4?x
A
B
C
D
Which number line represents the solution set to the inequality 6 2 14?x
A
B
C
D
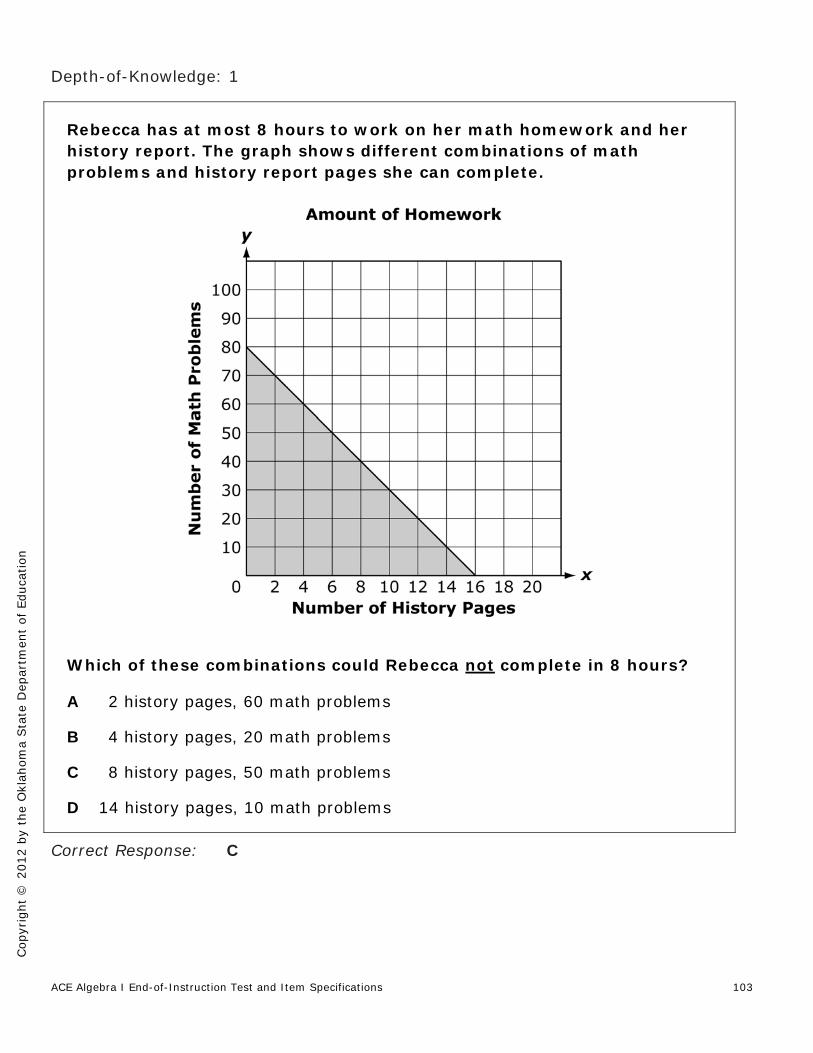
ACE Algebra I End-of-Instruction Test and Item Specifications 103
Cop
yrig
ht ©
201
2 by
the
Okl
ahom
a Sta
te D
epar
tmen
t of
Edu
catio
n
Depth-of-Knowledge: 1
Correct Response: C
Rebecca has at most 8 hours to work on her math homework and her history report. The graph shows different combinations of math problems and history report pages she can complete.
Which of these combinations could Rebecca not complete in 8 hours?
A 2 history pages, 60 math problems
B 4 history pages, 20 math problems
C 8 history pages, 50 math problems
D 14 history pages, 10 math problems
ACE Algebra I End-of-Instruction Test and Item Specifications
Cop
yrig
ht ©
201
2 by
the
Okl
ahom
a Sta
te D
epar
tmen
t of
Edu
catio
n
104
Depth-of-Knowledge: 2
Correct Response: D
Depth-of-Knowledge: 3
Correct Response: A
What values of x represent the solutions to the inequality 2 4 8?x
A 4x
B 4x
C 2x
D 2x
Jorge cut a 40-inch rope into 3 pieces. The first piece is 18 inches long. The second piece is at least 9 inches long, but no greater than 15 inches long. Which inequality represents the length (x) of the third piece?
A 7 13x
B 7 33x
C 13 27x
D 13 33x

ACE Algebra I End-of-Instruction Test and Item Specifications 105
Cop
yrig
ht ©
201
2 by
the
Okl
ahom
a Sta
te D
epar
tmen
t of
Edu
catio
n
Oklahoma C3 Standard: Standard 2: Relations and Functions
Oklahoma C3 Objective: Objective 2.3: Linear Inequalities and Graphs
Oklahoma C3 Skill: Skill 2.3b: Match inequalities (with 1 or 2 variables) to a graph, table, or
situation and vice versa.
Item Specifications:
Emphasis: Translate among various representations of inequalities.
Stimulus Attributes: Test items may include graphs, tables, situations, and number lines.
Format: Identify the appropriate situation that corresponds to an algebraic inequality. Identify the appropriate algebraic inequality that represents a situation
described graphically or verbally.
Content Limits: Limit to age-appropriate situations. Limit to linear inequalities.
Primary Process Standards: Communication Connections Representation
Distractor Domain: Common algebraic misconceptions Incorrectly filled or blank points on number lines Misdirected arrows on number lines or wrong shading of graphs
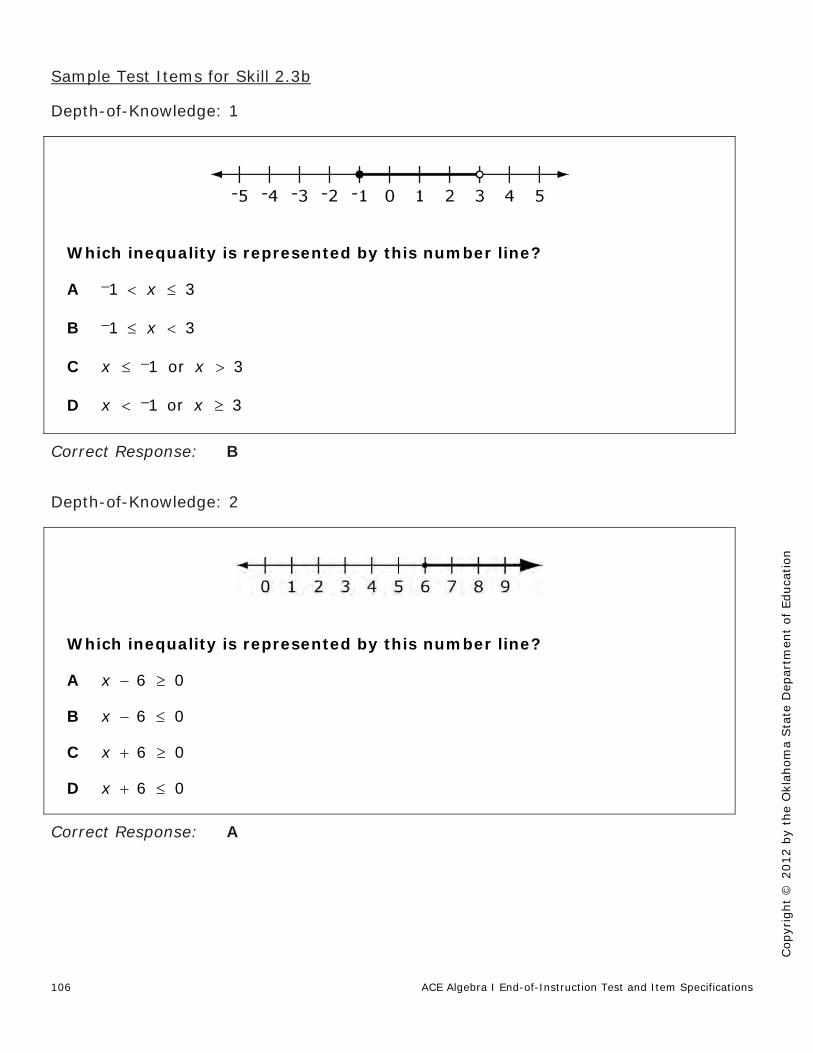
ACE Algebra I End-of-Instruction Test and Item Specifications
Cop
yrig
ht ©
201
2 by
the
Okl
ahom
a Sta
te D
epar
tmen
t of
Edu
catio
n
106
Sample Test Items for Skill 2.3b
Depth-of-Knowledge: 1
Correct Response: B
Depth-of-Knowledge: 2
Correct Response: A
Which inequality is represented by this number line?
A 1 3x
B 1 3x
C 1 or 3x x
D 1 or 3x x
Which inequality is represented by this number line?
A 6 0x
B 6 0x
C 6 0x
D 6 0x
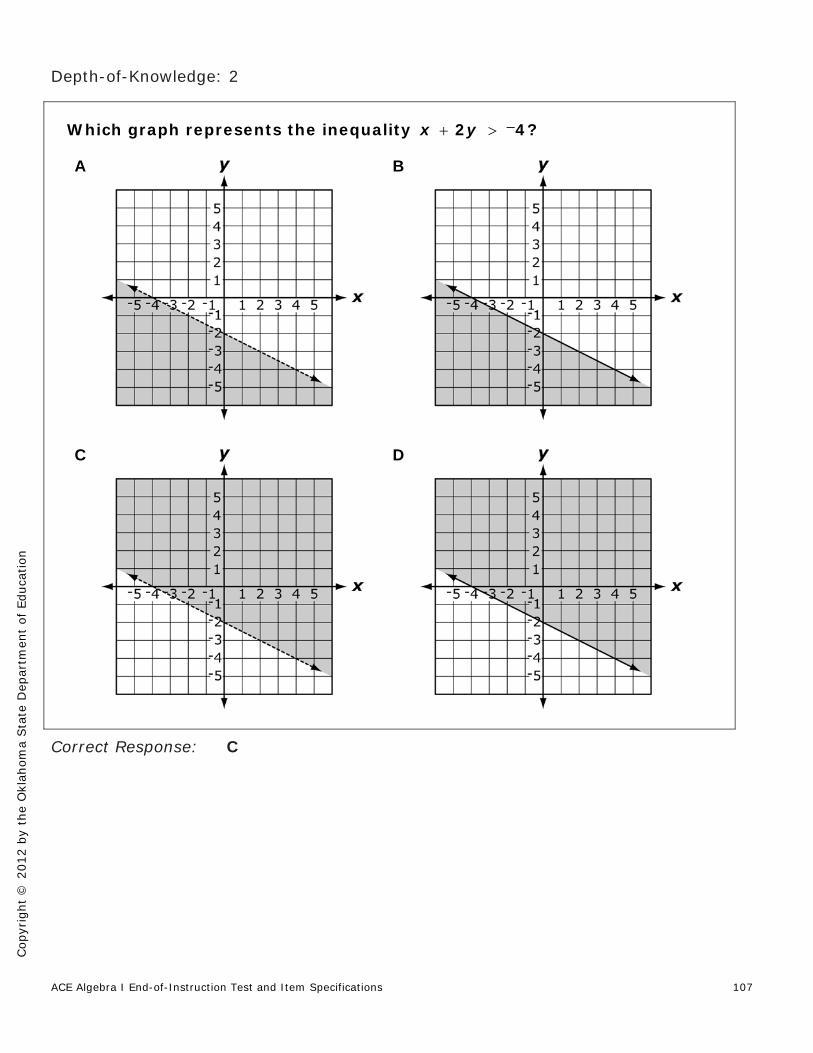
ACE Algebra I End-of-Instruction Test and Item Specifications 107
Cop
yrig
ht ©
201
2 by
the
Okl
ahom
a Sta
te D
epar
tmen
t of
Edu
catio
n
Depth-of-Knowledge: 2
Correct Response: C
Which graph represents the inequality 2 4?x y
A
B
C
D

ACE Algebra I End-of-Instruction Test and Item Specifications
Cop
yrig
ht ©
201
2 by
the
Okl
ahom
a Sta
te D
epar
tmen
t of
Edu
catio
n
108
Depth-of-Knowledge: 2
Correct Response: D
Which inequality is represented by this graph?
A 23 3y x
B 23 3y x
C 32 3y x
D 32 3y x

ACE Algebra I End-of-Instruction Test and Item Specifications 109
Cop
yrig
ht ©
201
2 by
the
Okl
ahom
a Sta
te D
epar
tmen
t of
Edu
catio
n
Depth-of-Knowledge: 2
Correct Response: B
Juan is three years older than Pedro. The sum of their ages is less than 27. Let x represent Pedro’s age. Which inequality can be used to find the possibilities of Pedro’s age?
A 2 3 27x
B 2 3 27x
C 2 3 27x
D 2 3 27x

ACE Algebra I End-of-Instruction Test and Item Specifications
Cop
yrig
ht ©
201
2 by
the
Okl
ahom
a Sta
te D
epar
tmen
t of
Edu
catio
n
110
Oklahoma C3 Standard: Standard 2: Relations and Functions
Oklahoma C3 Objective: Objective 2.4: Solve a system of linear equations by graphing, substitution, or
elimination.
Item Specifications:
Emphasis: Determine solutions to systems of equations using algebraic and graphical
means.
Stimulus Attributes: Test items may include graphs, tables, and diagrams.
Format: Identify the value of one variable that is the solution of two linear equations
represented algebraically. Identify an ordered pair that is the solution of two linear equations represented
algebraically or graphically.
Content Limits: Limit ordered pairs to integers for graphing. Limit ordered pairs to rational numbers for algebraic systems.
Primary Process Standards: Problem Solving Connections
Distractor Domain: Computational errors Incorrect ordered pairs
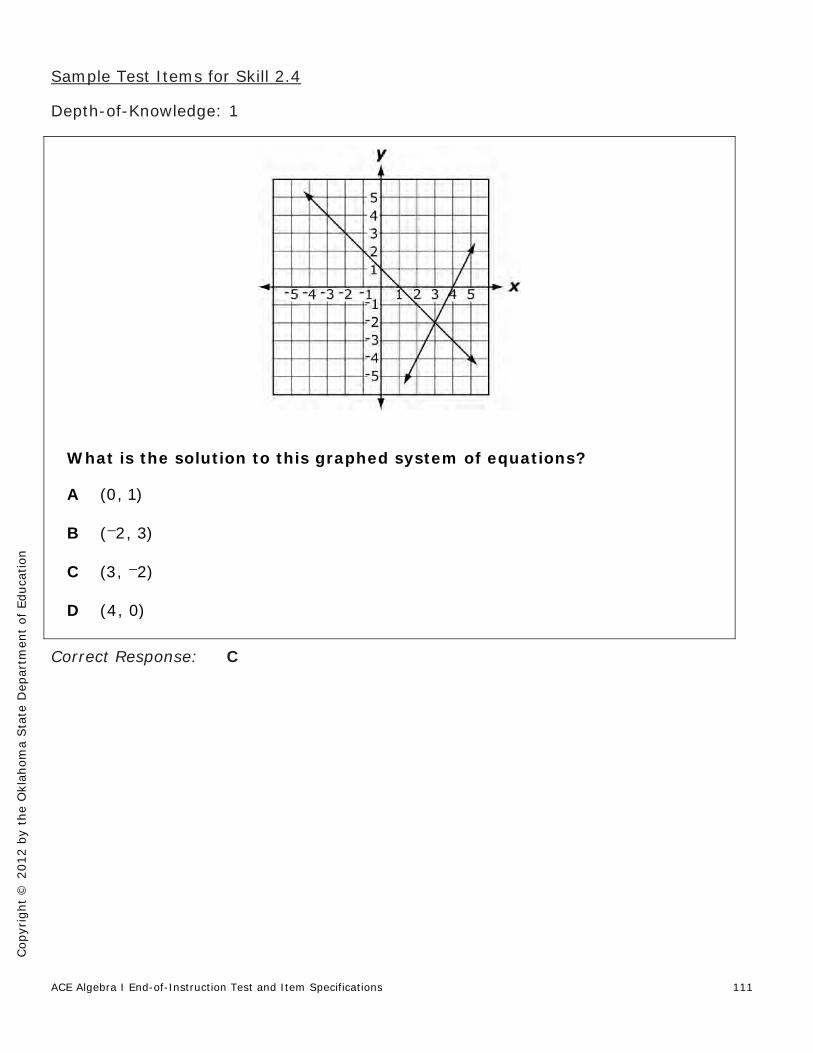
ACE Algebra I End-of-Instruction Test and Item Specifications 111
Cop
yrig
ht ©
201
2 by
the
Okl
ahom
a Sta
te D
epar
tmen
t of
Edu
catio
n
Sample Test Items for Skill 2.4
Depth-of-Knowledge: 1
Correct Response: C
What is the solution to this graphed system of equations?
A (0, 1)
B ( 2, 3)
C (3, 2)
D (4, 0)

ACE Algebra I End-of-Instruction Test and Item Specifications
Cop
yrig
ht ©
201
2 by
the
Okl
ahom
a Sta
te D
epar
tmen
t of
Edu
catio
n
112
Depth-of-Knowledge: 1
The graph shows two options to buy tickets for amusement park rides. Julie can pay $12 for a daily pass or she can pay $1.50 per ride.
For what number of rides is the cost of both options the same?
A 7 rides
B 8 rides
C 9 rides
D 12 rides
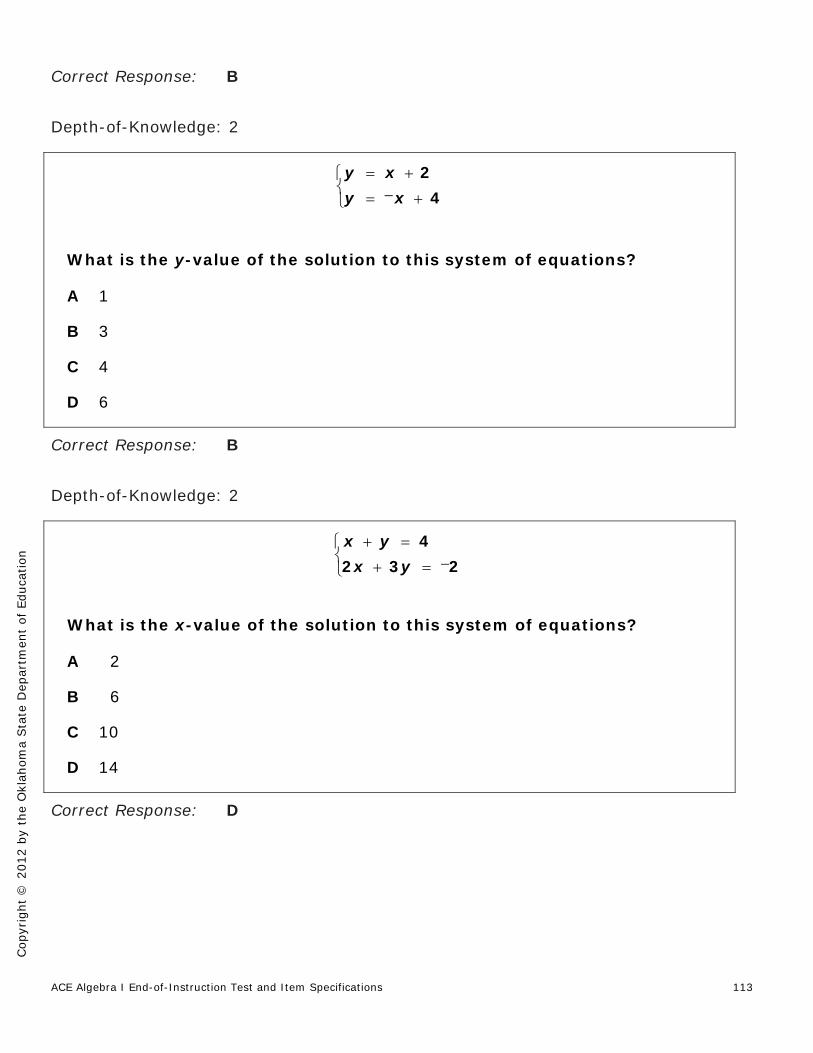
ACE Algebra I End-of-Instruction Test and Item Specifications 113
Cop
yrig
ht ©
201
2 by
the
Okl
ahom
a Sta
te D
epar
tmen
t of
Edu
catio
n
Correct Response: B
Depth-of-Knowledge: 2
Correct Response: B
Depth-of-Knowledge: 2
Correct Response: D
24
y xy x
What is the y-value of the solution to this system of equations?
A 1
B 3
C 4
D 6
42 3 2x yx y
What is the x-value of the solution to this system of equations?
A 2
B 6
C 10
D 14

ACE Algebra I End-of-Instruction Test and Item Specifications
Cop
yrig
ht ©
201
2 by
the
Okl
ahom
a Sta
te D
epar
tmen
t of
Edu
catio
n
114
Depth-of-Knowledge: 3
Correct Response: D
Depth-of-Knowledge: 3
Correct Response: C
Hanna has $11.20 in a jar that contains only nickels and dimes. There are 140 coins in the jar. How many dimes are in Hanna’s jar?
A 28 dimes
B 42 dimes
C 56 dimes
D 84 dimes
Matt starts with $15 and saves $10 a week. At the same time, Julie starts with $45 and saves $5 a week. In how many weeks will they have the same amount of money?
A 2 weeks
B 4 weeks
C 6 weeks
D 8 weeks

ACE Algebra I End-of-Instruction Test and Item Specifications 115
Cop
yrig
ht ©
201
2 by
the
Okl
ahom
a Sta
te D
epar
tmen
t of
Edu
catio
n
Oklahoma C3 Standard: Standard 2: Relations and Functions
Oklahoma C3 Objective: Objective 2.5: Nonlinear Functions
Oklahoma C3 Skill: * Skill 2.5a: Match exponential and quadratic functions to a table, graph, or
situation and vice versa.
_________________________ Note: Asterisks (*) have been used to identify standards and objectives that must be assessed by the local school district. All other skills may be assessed by the Oklahoma School Testing Program (OSTP).

ACE Algebra I End-of-Instruction Test and Item Specifications
Cop
yrig
ht ©
201
2 by
the
Okl
ahom
a Sta
te D
epar
tmen
t of
Edu
catio
n
116
Oklahoma C3 Standard: Standard 2: Relations and Functions
Oklahoma C3 Objective: Objective 2.5: Nonlinear Functions
Oklahoma C3 Skill: * Skill 2.5b: Solve quadratic equations by graphing, factoring, or using the
quadratic formula.
_________________________ Note: Asterisks (*) have been used to identify standards and objectives that must be assessed by the local school district. All other skills may be assessed by the Oklahoma School Testing Program (OSTP).

ACE Algebra I End-of-Instruction Test and Item Specifications 117
Cop
yrig
ht ©
201
2 by
the
Okl
ahom
a Sta
te D
epar
tmen
t of
Edu
catio
n
Oklahoma C3 Standard: Standard 3: Data Analysis, Probability and Statistics
Oklahoma C3 Objective: Objective 3.1: Data Analysis
Oklahoma C3 Skill: Skill 3.1a: Translate from one representation of data to another and
understand that the data can be represented using a variety of tables, graphs, or symbols and that different modes of representation often convey different messages.
Item Specifications:
Emphasis: Demonstrate a conceptual understanding of a wide variety of displays of data
and how some displays are inherently suited to convey specific messages.
Stimulus Attributes: Test items may include tables, graphs, stem-and-leaf graphs, scatter plots,
box-and-whisker plots, circle graphs, histograms, bar graphs, and frequency tables.
Format: Translate data between tables and graphs. Identify the most appropriate graph for conveying a message. Translate data from one graph to another.
Content Limits: Limit data to age-appropriate situations.
Primary Process Standards: Communication Reasoning Connections Representation
Distractor Domain: Common algebraic misconceptions Incorrectly organized data sets

ACE Algebra I End-of-Instruction Test and Item Specifications
Cop
yrig
ht ©
201
2 by
the
Okl
ahom
a Sta
te D
epar
tmen
t of
Edu
catio
n
118
Sample Test Items for Skill 3.1a
Depth-of-Knowledge: 2
Correct Response: D
The stem-and-leaf graph shows the noontime temperatures over a one-month period in Norman, Oklahoma.
Which of these is not an advantage of presenting the data in a stem- and-leaf graph?
A The shape of the data is apparent.
B It is easy to find the mode of the data.
C The temperatures are organized from least to greatest.
D It is easy to determine which day of the month had the greatest temperature.

ACE Algebra I End-of-Instruction Test and Item Specifications 119
Cop
yrig
ht ©
201
2 by
the
Okl
ahom
a Sta
te D
epar
tmen
t of
Edu
catio
n
Depth-of-Knowledge: 2
Correct Response: A
James made a circle graph showing how he spent last month’s allowance of $80.
Which graph best reflects the information in the circle graph?
A B
C
D

ACE Algebra I End-of-Instruction Test and Item Specifications
Cop
yrig
ht ©
201
2 by
the
Okl
ahom
a Sta
te D
epar
tmen
t of
Edu
catio
n
120
Depth-of-Knowledge: 3
Correct Response: B
The box-and-whisker plot below summarizes the ages of the members of a health club.
What information is conveyed on this box-and-whisker plot that is not conveyed by a bar graph of the same data?
A the mean age of the members
B the median age of the members
C the most common age of the members
D the number of members of the health club
ACE Algebra I End-of-Instruction Test and Item Specifications 121
Cop
yrig
ht ©
201
2 by
the
Okl
ahom
a Sta
te D
epar
tmen
t of
Edu
catio
n
Oklahoma C3 Standard: Standard 3: Data Analysis, Probability and Statistics
Oklahoma C3 Objective: Objective 3.1: Data Analysis
Oklahoma C3 Skill: Skill 3.1b: Make valid inferences, predictions, and/or arguments based on data
from graphs, tables, and charts.
Item Specifications:
Emphasis: Analyze, describe, and interpret displays of data to make and verify
hypotheses.
Stimulus Attributes: Test items may include tables, graphs, geometric figures, and diagrams.
Format: Identify data that best supports an argument. Use data representations to make predictions and draw conclusions. Use measures of central tendency to make inferences or predictions.
Content Limits: Limit data to age-appropriate material.
Primary Process Standards: Problem Solving Communication Reasoning Connections Representation
Distractor Domain: Common errors Incomplete lists Lists that are complete but contain inaccurate information

ACE Algebra I End-of-Instruction Test and Item Specifications
Cop
yrig
ht ©
201
2 by
the
Okl
ahom
a Sta
te D
epar
tmen
t of
Edu
catio
n
122
Sample Test Items for Skill 3.1b
Depth-of-Knowledge: 1
Correct Response: D
Brian recorded the maximum temperature each day for 14 days and made this graph to display the results.
Between which two days did the maximum temperature change the most?
A Day 2 and Day 3
B Day 6 and Day 7
C Day 11 and Day 12
D Day 12 and Day 13
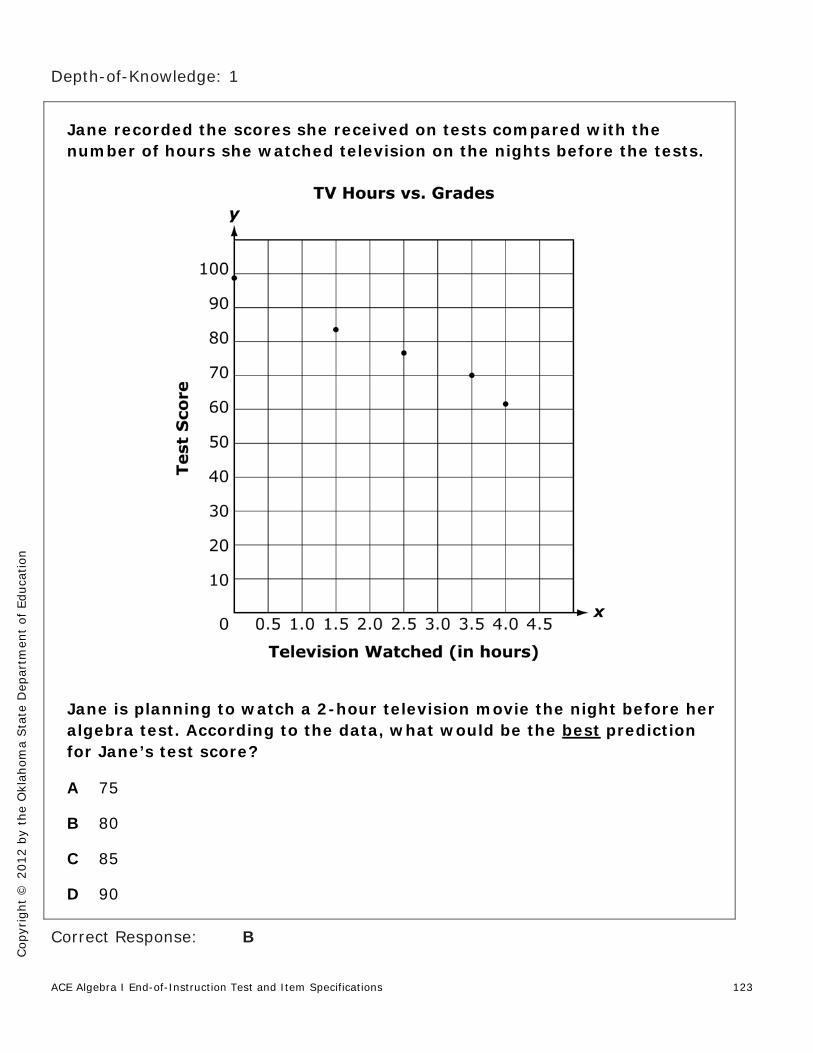
ACE Algebra I End-of-Instruction Test and Item Specifications 123
Cop
yrig
ht ©
201
2 by
the
Okl
ahom
a Sta
te D
epar
tmen
t of
Edu
catio
n
Depth-of-Knowledge: 1
Correct Response: B
Jane recorded the scores she received on tests compared with the number of hours she watched television on the nights before the tests.
Jane is planning to watch a 2-hour television movie the night before her algebra test. According to the data, what would be the best prediction for Jane’s test score?
A 75
B 80
C 85
D 90

ACE Algebra I End-of-Instruction Test and Item Specifications
Cop
yrig
ht ©
201
2 by
the
Okl
ahom
a Sta
te D
epar
tmen
t of
Edu
catio
n
124
Depth-of-Knowledge: 2
Correct Response: D
The graphs shown compare two quarterbacks’ performances over the same three years. Each graph compares the number of touchdowns and the number of interceptions.
Which quarterback in a particular year had the biggest difference between touchdowns and interceptions?
A quarterback A; 2004
B quarterback B; 2004
C quarterback A; 2003
D quarterback B; 2002

ACE Algebra I End-of-Instruction Test and Item Specifications 125
Cop
yrig
ht ©
201
2 by
the
Okl
ahom
a Sta
te D
epar
tmen
t of
Edu
catio
n
Depth-of-Knowledge: 2
Correct Response: C
The table below shows the number of visitors to a theme park on each of the four Wednesdays in July.
The park manager wants to predict the total number of people who will visit the park on the five Wednesdays in July. Which of these is the best estimate?
A 6,000 visitors
B 8,000 visitors
C 10,000 visitors
D 14,000 visitors

ACE Algebra I End-of-Instruction Test and Item Specifications
Cop
yrig
ht ©
201
2 by
the
Okl
ahom
a Sta
te D
epar
tmen
t of
Edu
catio
n
126
Depth-of-Knowledge: 2
Correct Response: C
The frequency table shows the prizes offered in a school raffle. There are 1,000 total tickets for the raffle.
A local business purchased 100 tickets. How many free movie tickets should the business expect to win?
A 10 movie tickets
B 20 movie tickets
C 50 movie tickets
D 100 movie tickets

ACE Algebra I End-of-Instruction Test and Item Specifications 127
Cop
yrig
ht ©
201
2 by
the
Okl
ahom
a Sta
te D
epar
tmen
t of
Edu
catio
n
Oklahoma C3 Standard: Standard 3: Data Analysis, Probability and Statistics
Oklahoma C3 Objective: Objective 3.1: Data Analysis
Oklahoma C3 Skill: Skill 3.1c: Solve two-step and three-step problems using concepts such as
probability and measures of central tendency.
Item Specifications:
Emphasis: Determine solutions to mathematical and real-world situations using the
concepts of algebra.
Stimulus Attributes: Test items may include graphs, tables, fair number cubes, spinners, and
diagrams.
Format: Solve mathematical and everyday problems using the concepts from algebra.
Content Limits: Limit situations to age-appropriate material.
Primary Process Standards: Problem Solving Reasoning Connections
Distractor Domain: Computational errors Common algebraic misconceptions

ACE Algebra I End-of-Instruction Test and Item Specifications
Cop
yrig
ht ©
201
2 by
the
Okl
ahom
a Sta
te D
epar
tmen
t of
Edu
catio
n
128
Sample Test Items for Skill 3.1c
Depth-of-Knowledge: 2
Correct Response: D
Judy has test scores of 82, 75, and 78. What does she need to score on her next test so that she has an average test score of 80?
A 75
B 78
C 80
D 85

ACE Algebra I End-of-Instruction Test and Item Specifications 129
Cop
yrig
ht ©
201
2 by
the
Okl
ahom
a Sta
te D
epar
tmen
t of
Edu
catio
n
Depth-of-Knowledge: 3
Correct Response: C
Depth-of-Knowledge: 3
Correct Response: A
A bag contains 16 red checkers and 16 black checkers. Anne removes 1 black checker and 2 red checkers from the bag and does not replace them. She then reaches into the bag and selects a checker at random. What is the probability that the checker is red?
A 12
B 1415
C 1429
D 1529
Of the first 80 customers to use a gumball machine, 25 received blue gumballs and 35 received yellow gumballs. Carlos purchases a gumball. Based on this information, what is the probability that his gumball is neither blue nor yellow?
A 14
B 57
C 712
D 1116

ACE Algebra I End-of-Instruction Test and Item Specifications
Cop
yrig
ht ©
201
2 by
the
Okl
ahom
a Sta
te D
epar
tmen
t of
Edu
catio
n
130
Depth-of-Knowledge: 3
Correct Response: C
Seven students had a long jump competition. Each student jumped a different length. Joan was one of the students in the competition. What is the probability that Joan’s jump was greater than the median jump length?
A 12
B 13
C 37
D 47
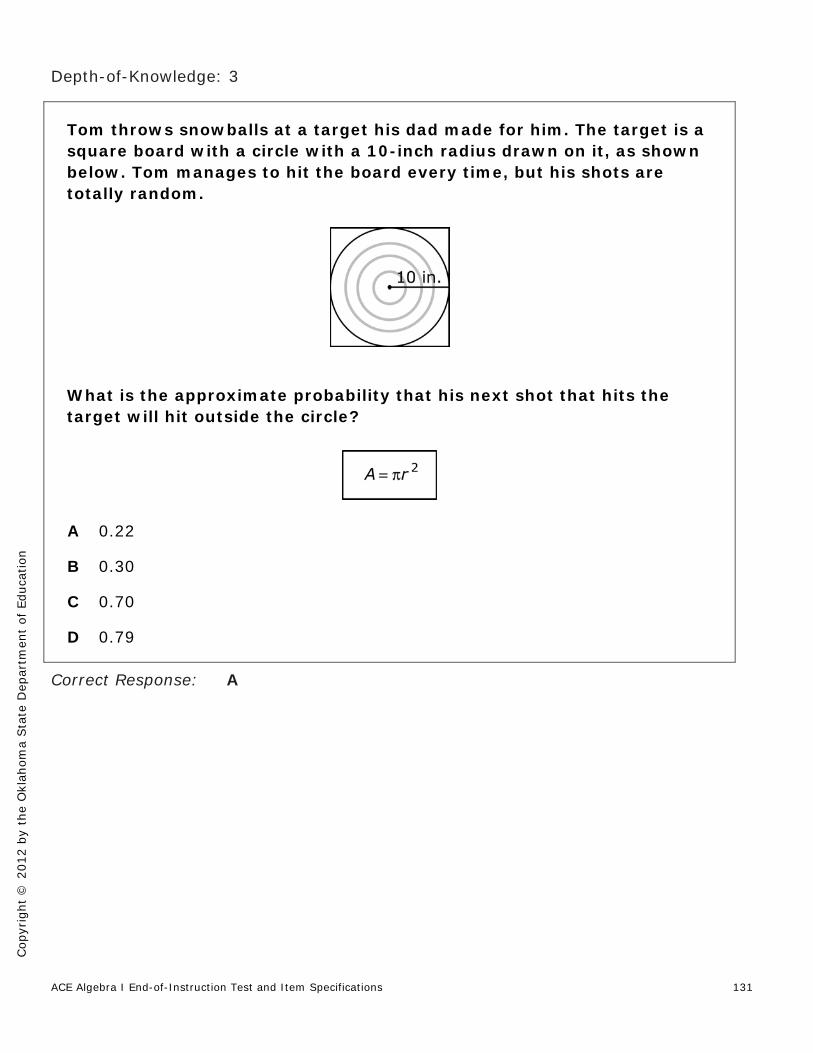
ACE Algebra I End-of-Instruction Test and Item Specifications 131
Cop
yrig
ht ©
201
2 by
the
Okl
ahom
a Sta
te D
epar
tmen
t of
Edu
catio
n
Depth-of-Knowledge: 3
Correct Response: A
Tom throws snowballs at a target his dad made for him. The target is a square board with a circle with a 10-inch radius drawn on it, as shown below. Tom manages to hit the board every time, but his shots are totally random.
What is the approximate probability that his next shot that hits the target will hit outside the circle?
A 0.22
B 0.30
C 0.70
D 0.79

ACE Algebra I End-of-Instruction Test and Item Specifications
Cop
yrig
ht ©
201
2 by
the
Okl
ahom
a Sta
te D
epar
tmen
t of
Edu
catio
n
132
Oklahoma C3 Standard: Standard 3: Data Analysis, Probability and Statistics
Oklahoma C3 Objective: Objective 3.2: Collect data involving two variables and display on a scatter plot;
interpret results using a linear model/equation and identify whether the model/equation is a line of best fit for the data.
Item Specifications:
Emphasis: Analyze, describe, and interpret data involving two variables to specifically
identify the best linear model.
Stimulus Attributes: Test items may include graphs, scatter plots, and data tables.
Format: Identify characteristics of a scatter plot. Determine the best-fit line of a set of data. Interpret the results of data using linear models.
Content Limits: Limit data displayed to strong positive or negative correlations. Limit correlation to include negative or positive correlation but not strong/weak
positive/negative correlation.
Primary Process Standards: Problem Solving Reasoning Connections Representation
Distractor Domain: Computational errors Common algebraic misconceptions
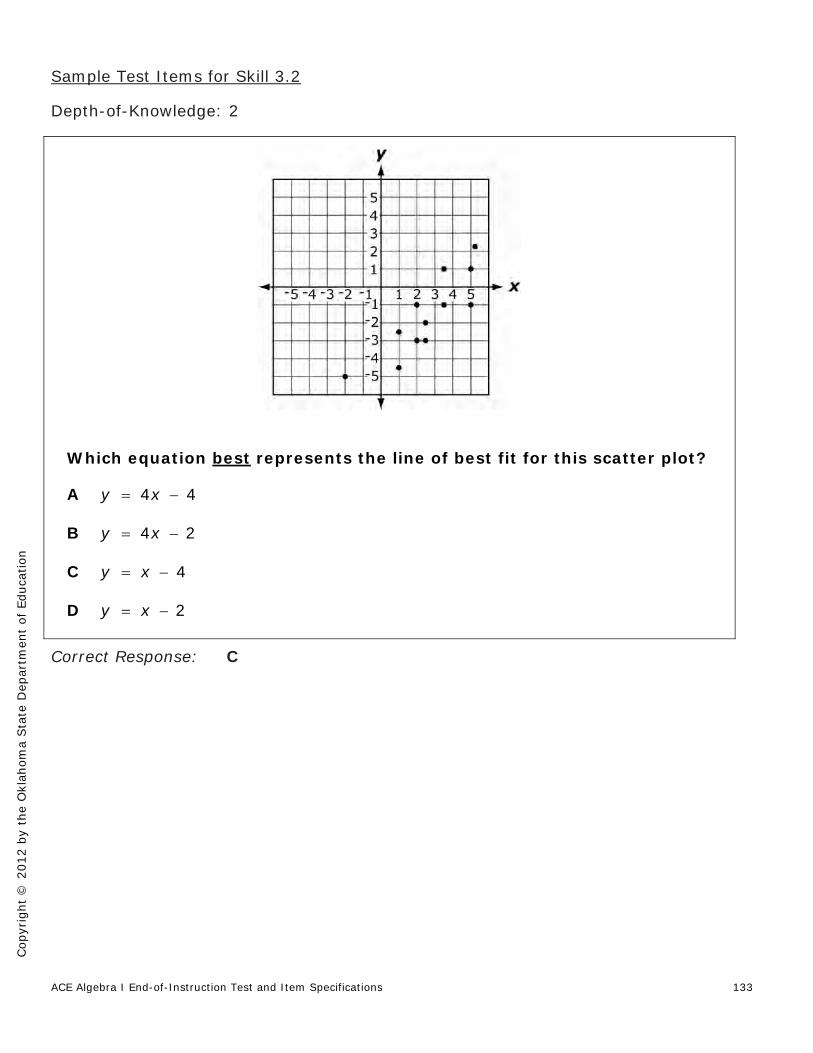
ACE Algebra I End-of-Instruction Test and Item Specifications 133
Cop
yrig
ht ©
201
2 by
the
Okl
ahom
a Sta
te D
epar
tmen
t of
Edu
catio
n
Sample Test Items for Skill 3.2
Depth-of-Knowledge: 2
Correct Response: C
Which equation best represents the line of best fit for this scatter plot?
A 4 4y x
B 4 2y x
C 4y x
D 2y x

ACE Algebra I End-of-Instruction Test and Item Specifications
Cop
yrig
ht ©
201
2 by
the
Okl
ahom
a Sta
te D
epar
tmen
t of
Edu
catio
n
134
Depth-of-Knowledge: 2
Correct Response: D
Jane recorded the scores she received on tests compared with the number of hours she watched television on the nights before the tests.
What does the scatter plot imply about the relationship between her test scores and the number of hours of television she watched the night before the test?
A Jane’s grades are going down.
B Jane will never watch more than four hours of television.
C Getting higher grades will cause Jane to watch less television.
D Jane’s lower grades tend to follow nights where she watched more television.

ACE Algebra I End-of-Instruction Test and Item Specifications 135
Cop
yrig
ht ©
201
2 by
the
Okl
ahom
a Sta
te D
epar
tmen
t of
Edu
catio
n
Depth-of-Knowledge: 2
Correct Response: C
Tamara recorded the population of Medville for certain years in this table.
She determined the line of best fit that models this data is 18 1,520,y x where x represents the number of years since 1985
and y represents the population. According to Tamara’s model, what is the best prediction for the population of Medville in 1997?
A 1,680
B 1,700
C 1,736
D 1,797