tertiary education in madagascar - world bank
TRANSCRIPT

i | P a g e
WORLD BANK
Tertiary education in Madagascar
A review of the Bologna process (LMD), its implementation in Madagascar, the status of
recent World Bank analyses and recommendations, and suggestions for the
immediate future
Richard SACK and Farasoa RAVALITERA
Juin 2011
Pub
lic D
iscl
osur
e A
utho
rized
Pub
lic D
iscl
osur
e A
utho
rized
Pub
lic D
iscl
osur
e A
utho
rized
Pub
lic D
iscl
osur
e A
utho
rized
Pub
lic D
iscl
osur
e A
utho
rized
Pub
lic D
iscl
osur
e A
utho
rized
Pub
lic D
iscl
osur
e A
utho
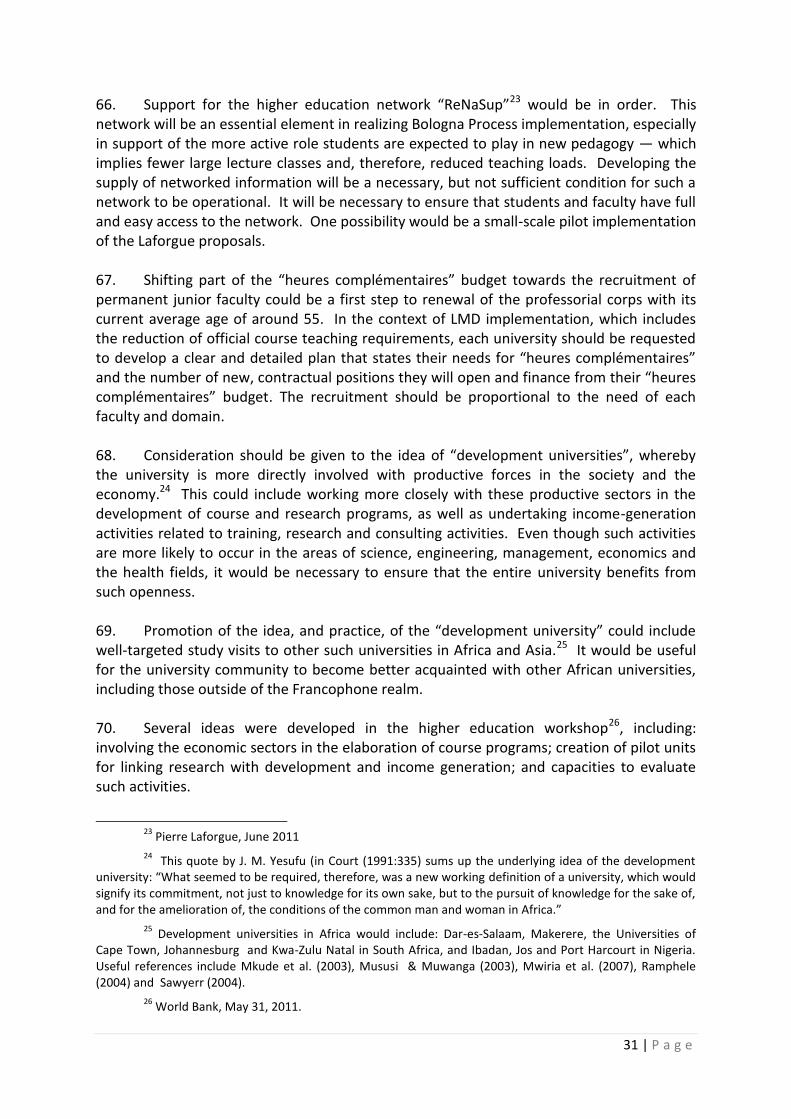
rized
Pub
lic D
iscl
osur
e A
utho
rized

ii | P a g e
Contents Abbreviations and Acronyms ...................................................................................................................... iii I. Introduction ............................................................................................................................................ 1 II. The Bologna Process and LMD implementation ..................................................................................... 2
Diploma structure ................................................................................................................................... 4 Academic credit units ............................................................................................................................. 4 National Qualifications Frameworks ...................................................................................................... 5 Quality assurance ................................................................................................................................... 6 Lessons from non-European countries................................................................................................... 11
Turkey .............................................................................................................................................. 11 Cameroon......................................................................................................................................... 12
Latin America ................................................................................................................................... 12
Taking stock of the Bologna Process and its implementation................................................................ 14 III. Tertiary education in Madagascar: review of previous studies .............................................................. 16
Key findings from previous studies: the current condition .................................................................... 16 Key recommendations from previous studies ....................................................................................... 19
IV. Recent trends .......................................................................................................................................... 22 Quantitative trends ................................................................................................................................ 22 Policy and Bologna Process/LMD implementation ................................................................................ 27
V. Strategic considerations and activities ................................................................................................... 29 References ................................................................................................................................................... 32 Annexes ....................................................................................................................................................... 36
Annex 1. Enrollments in higher education 1993 - 2006 ........................................................................ 34 Annex 2. Enrollments in public higher education (except CNTEMAD): 1969-2006 .............................. 34 Annex 3. Baccalauréat graduates from secondary school: 1975-2006 ................................................. 35 Annex 4. Admission rates into tertiary education ................................................................................. 35 Annex 5. Structure of the labor force by sector and level of education ............................................... 36 Annex 6. Teachers and student-teacher ratios by institution ............................................................... 39 Annex 7. Structure of higher education recurrent expenditures (2006)............................................... 38 Annex 8. Resources generated by tuition programs: 2002-2006 .......................................................... 40 Annex 9. Evolution the Antananarivo University budget (2007-2009) ................................................. 40 Annex 10. Status of the implementation of the Bologna process in Madagascar ................................. 40 Annex 11. Terms of Reference for a study comparing success rates of the two ISTs — an
indicative outline ............................................................................................................................... 41 Tables and Figures Figure 1. Timeline of the Bologna Process .................................................................................................. 3 Table 1. What is covered by the European standards and guidelines for quality assurance in the EHEA ............................................................................................................................................................. 8 Table 2. Overview of key findings from World Bank studies on tertiary education in Madagascar .......... 16 Table 3. Enrollments in higher education: 2007-2010 ................................................................................ 22 Figure 2. Enrollments by type of training: two graphs comparing 2005-06 and 2009-10 .......................... 23 Figure 3. Rates of success by tertiary institution ......................................................................................... 24 Figure 4. Age of University teachers in 2006/2007 (in the 6 public universities) ...................................... 24 Table 4. Full-time (permanent, “fonctionnaires”) teachers by rank in public higher education: 2007 - 2010 ............................................................................................................................................................. 25 Figure 5. Student-teacher ratios in public higher education, by university ................................................ 26 Figure 6. University of Antananarivo: Inflation adjusted annual variations for selected budget categories ..................................................................................................................................................... 27
iii | P a g e
Abbreviations and Acronyms
BPUG Bologna Follow-Up Group CNH Conseil national d’habilitation CNTEMAD Centre national de télé-enseignement de Madagascar (Distance learning center) ECTS European Credit Transfer and Accumulation System EHEA European Higher Education Area ENQA European Association for Quality Assurance in Higher Education ESG European Standards and Guidelines EU European Union IST Institut supérieur de technologie (Technical training institutes) ISTN Institut supérieur de technologies nucléaires LMD Licence (often called Bachelor) - Master - Doctorate MENRS Ministère de l’éducation nationale et de la recherche scientifique (Ministry of
Education and Scientific Research) NQF National Qualifications Framework QA Quality Assurance VET Vocational education and training
1 | P a g e
I. INTRODUCTION 1. Higher education in Madagascar appears to be in a state of effervescence. On the one hand, its viability has been compromised by a combination of accommodations to demographically-driven demand and increasing resource constraints resulting from years of relative neglect. This constitutes a threat to the very sustainability of higher education in Madagascar. This situation is best summarized by one statistical fact: the average age of the full-time professorial corps (all ranks), which is around about 55 years, only five years from the official retirement age.1 On the other hand, the system is undergoing a major transformation as it moves to adoption of the Bologna Process and the LMD (Licence, Masters, Doctorate) diploma structure. 2. The move towards organizing higher education around the Bologna Process, its structures and institutional arrangements, has the potential to move beyond the mechanical transformation of diploma structures and associated mechanisms for quality control. The move implies greater transparency in the development of course offerings and the teaching resources required to staff them. The move into Bologna Process implementation contains a strong potential for a broader rationalization and reform of higher education that could also rationalize resource allocations to the sector. 3. After a review of the Bologna Process, its components and implementation experience in Europe and elsewhere, this report reviews the recommendations of recent World Bank studies on higher education in Madagascar and updates both the status of these recommendations and quantitative trends. Recent policy directions are also noted. The report concludes with suggestions for strategic options, as well as several actions that could be undertaken within the limits of the current context.
1 Although university professors can, optionally, extend it to 70.
2 | P a g e
II. THE BOLOGNA PROCESS AND LMD IMPLEMENTATION 4. The Bologna Declaration was signed by 27 European countries in 1999; in 2009, 47 countries were participating in the process.2 The core of the Declaration aimed at the creation of a European Higher Education Area (EHEA) by 2010. Higher education systems were expected to become more uniformly structured and to have qualifications that are more universally understandable. The major elements of this process include:3
A diploma structure that converges around the Bachelor/Licence-Masters-Doctorate (LMD) degrees, with completion of the Licence 3-4 years after secondary school completion. This convergence is expected to ensure portability of diplomas within the participating systems.
A credit system — the European Credit Transfer and Accumulation System (ECTS). The first, licence cycle normally requires 180 credits over three years (although some countries require 240 credits over four years). The second cycle master programs generally require another 120 credits over two years.
The Diploma Supplement is a document attached to the diploma which provides a standardized description of the nature, level, context, content and status of the studies completed by the diploma holder. This was designed to facilitate academic and professional recognition of qualifications.
The National Qualifications Framework (NQF) is a single description, at a given level (national or other) of the education system. It clarifies and explains the relationship between higher education qualifications. NQFs are internationally understood and clearly describe all qualifications and other learning achievements in higher education and relate them to each other. They are tools for describing and achieving clarity on the similarities and differences between qualifications in all cycles and levels of education. The NQF is expected to spell out the goals and purposes for review and development of qualifications and provide a context for the design of new qualifications. The principle elements are: learning outcomes; competences; levels; credits; workload; and profile. The design of the NQF has proved to be a complex task which was underestimated in many countries.
Student mobility and portability of diplomas within the Bologna Process area. The Bologna Declaration emphasized a commitment to overcome “obstacles to the
2 In 1999 the following countries signed onto the Bologna Process: Austria, Belgium, Bulgaria, the
Czech Republic, Denmark, Estonia, Finland, France, Germany, Greece, Hungary, Iceland, Ireland, Italy, Latvia, Lithuania, Luxembourg, Malta, Netherlands, Norway, Poland, Portugal, Romania, Slovakia, Slovenia, Spain, Sweden, Switzerland, United Kingdom. Croatia, Cyprus, Liechtenstein, Turkey joined in 2001; Albania, Andorra, Bosnia and Herzegovina, Holy See, Russia, Serbia, Macedonia joined in 2003; Armenia, Azerbaijan, Georgia, Moldova and Ukraine in 2005; Montenegro in 2007; and Kazakhstan in 2010.
3 There are many sources of information on the Bologna Process; just as there is variety in its
implementation. This summary overview is based on Eurydice (2009).
3 | P a g e
effective exercise of free movement, with particular attention to … access to study and training opportunities and to related services.”
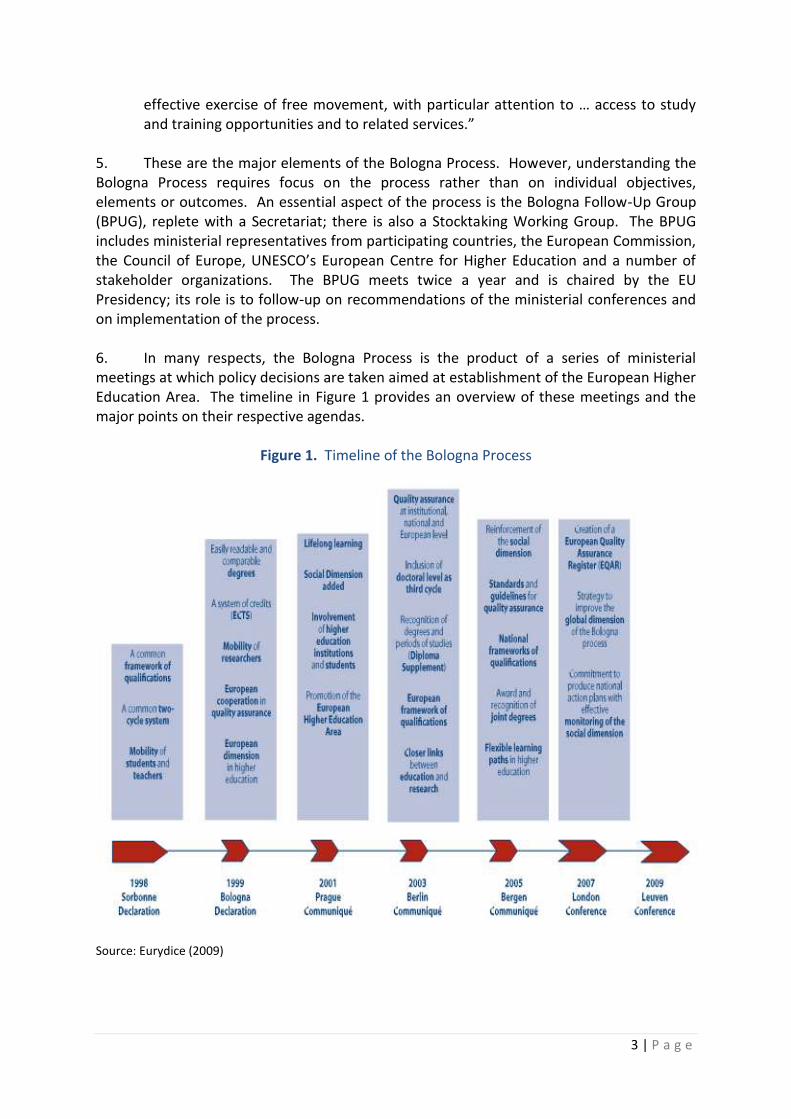
5. These are the major elements of the Bologna Process. However, understanding the Bologna Process requires focus on the process rather than on individual objectives, elements or outcomes. An essential aspect of the process is the Bologna Follow-Up Group (BPUG), replete with a Secretariat; there is also a Stocktaking Working Group. The BPUG includes ministerial representatives from participating countries, the European Commission, the Council of Europe, UNESCO’s European Centre for Higher Education and a number of stakeholder organizations. The BPUG meets twice a year and is chaired by the EU Presidency; its role is to follow-up on recommendations of the ministerial conferences and on implementation of the process. 6. In many respects, the Bologna Process is the product of a series of ministerial meetings at which policy decisions are taken aimed at establishment of the European Higher Education Area. The timeline in Figure 1 provides an overview of these meetings and the major points on their respective agendas.
Figure 1. Timeline of the Bologna Process
Source: Eurydice (2009)

4 | P a g e
Diploma structure 7. For the first degree (bachelor/licence) two structural models have been adopted within the Bologna Process countries. A majority4 has opted for a three-year program based on 180 ECTS credits. Four year programs (240 ECTS credits) are in practice in other countries.5 Other countries have no single model. 8. For Master programs, most countries have a two year, 120 ECTS credit program. Here, too, however there is variety: some countries have 90 credit master programs and others6 have one year, 60 credit programs. Some master programs even require 180 credits (3 years). 9. When looking at the Bachelor and Master levels together, there are three models:
The 180 + 120 credit model which corresponds to 3+2 academic years. According to Eurydice (2009), this model prevails in 17 countries (Andorra, Croatia, Denmark, Estonia, Finland, France, Holy See, Hungary, Iceland, Italy, Liechtenstein, Luxembourg, Montenegro, Norway, Poland, Slovakia and Switzerland).
The 240 + 60 credit model which corresponds to 4+1 academic years. This model prevails in Bulgaria; a 240 + 90 credit model is the norm in Scotland.
The 240 + 120 credit model which corresponds to 4+2 academic years and is found in Armenia, Georgia, Lithuania, Russia and Turkey.
10. However, in other Bologna Process countries — about half of all participating countries — no one model dominate. For example, in the Flemish Community of Belgium all Licence programs are 180 credits and the credit load for Masters programs vary. In other words, the diploma structures vary according to the institutions and fields of study. It is also worth noting that the Bologna model does not cover vocational education and training programs in most countries.
Academic credit units 11. The ECTS system has become a central element in the Bologna Process. Its major objective is to make higher education more transparent and understandable throughout Europe. This system was developed in the late 1980s, well before the Bologna Declaration. Once the decision was made by the Bologna Process to create an EHEA, the ECTS developed and became a core instrument in the overall Bologna Process. The number of credits
4 Andorra, Austria, Belgium, Croatia, Denmark, Estonia, Finland, France, the Holy See, Iceland, Italy,
Liechtenstein, Luxembourg, Montenegro, Norway, Poland, Slovakia, Sweden and Switzerland.
5 Armenia, Bulgaria, Cyprus, Georgia, Greece, Lithuania, Moldova, Russia, Spain, Turkey and the
United Kingdom (Scotland).
6 Bulgaria, Serbia and the United Kingdom (Scotland).
5 | P a g e
associated with a course or period of study is based on the workload needed to achieve the expected learning outcomes. 12. In most, but not all, countries, the ECTS credit system was introduced through legislation, often before 2000. The Czech Republic, Ireland, Russia and Azerbaijan are examples of countries that use credit systems without underpinning legislation. The United Kingdom, where universities are independent, has a non-regulatory approach to the use of a credit system and is a good example of where institutional autonomy means that there are no legal obstacles to introducing elements of the Bologna Process. 13. The ECTS credit system is implemented in a variety of ways, according to (i) the use of contact hours, student workload and/or learning outcomes in accounting for credits, and (ii) the proportion of institutions and programs that have implemented the credit system. Five categories of implementation approaches have been identified (Eurydice, 2009):
Where more than 75% of institutions and programs are using ECTS for both transfer and accumulation purposes (Belgium, Bosnia and Herzegovina, Denmark, Macedonia, Georgia, Iceland, Italy, Liechtenstein, Moldova, Netherlands, Norway, Serbia and Switzerland). Both learning outcomes and student workload are used.
Where more than 75% of institutions and programs use the ECTS for transfer and accumulation, but where student workload, rather than contact hours, is the reference for defining credits (Austria, Finland, France, Hungary, Malta, Portugal and Ukraine). Learning outcomes are not a reference.
Where contact hours (perhaps combined with student workload) are the reference and where more than 75% of institutions and programs use ECTS for transfer and accumulation purposes (Azerbaijan, Croatia, Cyprus, Czech Republic, Ireland, Montenegro and Poland).
Where ECTS is implemented in less than 75% of institutions and/or programs that are using various references to define the credits (Albania, Andorra, Armenia, Bulgaria, Germany, Greece, Romania, Russia, Slovakia, Slovenia and Spain). Diffusion of ECTS practice is the challenge here.
Where national credit systems exist in parallel with ECTS (Latvia, Lithuania, Estonia, Sweden, Turkey and the United Kingdom). In these countries, ECTS is used mainly for transfer purposes.
14. In order to mitigate this variety of approaches, most countries have set up guidance and information mechanisms that include information campaigns, training, and handbooks.
National Qualifications Frameworks
15. NQFs are designed to describe the differences between qualifications in all cycles and levels. The idea here is to ensure clarity and transparency so that all concerned

6 | P a g e
throughout participating Bologna Process countries and institutions will understand the qualifications issued in in different education systems. Putting the NQFs in place has been a somewhat arduous process, taking more time than expected. Only five countries (Denmark, Estonia, France, Ireland, and the United Kingdom) began the process before 2004 and eight countries (Luxembourg, Portugal, Macedonia, Yugoslavia, Cyprus, Lithuania, Ukraine and Russia) started after 2008. 16. Three examples illustrate the extent to which NQFs are seen as broad avenues, in which there is space to maneuver according to the traditions and preferences of each country (Karseth, 2010):
Scotland has a greater diversity of degrees and more levels than the Bologna LMD cycles. Scotland follows a learning outcomes-based structure based on a consistent qualifications nomenclature, levels, descriptors and credits. The framework emphasizes higher education as a public responsibility and an integral part of a lifelong learning project.
Germany’s framework categories are based on knowledge (acquired professional competence) and understanding (generic competencies) that are associated with skills.
Denmark does not see the need for a perfect match between the descriptors used in the Bologna and Danish frameworks. For example, Bologna Process descriptors include “critical analysis” for the third (doctorate) cycle whereas Denmark considers this to have already been acquired in secondary education; also the Bologna Process calls for the ability to reflect on ethical issues to be included in the first cycle (licence), whereas Denmark considers that this is embedded in each discipline.
17. It should also be noted that there is a contradiction between national and institutional autonomy on the one hand, and the Bologna Process premise of a universal qualifications framework and standardization on the other hand (Karseth & Solbrekke 2010). This evokes issues of diversity, comparability and compatibility. This does not come out in the official documents, but appears in the course of implementation. This may account for the slow progress in the implementation of NQFs because of lack of shared cultural and epistemological understandings.
Quality assurance
18. The European Standards and Guidelines (ESG)7 focus on how to conduct quality assurance (QA) exercises in higher education. Standards include the following: how to conduct QA in institutions of higher education; how external QA should be conducted; and how external QA agencies should be evaluated (Stensaker 2010). The ESG attempts to take into account the challenges related to internationalization, transparence and accountability on the one hand, and the national characteristics, aims and responsibilities for higher
7 See www.enqa.eu.

7 | P a g e
education on the other hand. These standards are part of the overall governance framework of the Bologna Process — a form of governance without government. 19. It is in this context that the European Association for Quality Assurance in Higher Education (ENQA) has published “Standards and Guidelines for Quality Assurance in the European Higher Education Area”8 that covers standards for: (i) internal quality assurance within higher education institutions; (ii) external quality assurance of higher education; and (iii) external quality assurance agencies. Each of these areas includes a number of components, for which the document provides standards and guidelines. Table 1 presents the areas and their components covered by these standards and guidelines. 20. In their review of the ESG in agency evaluations, Stensaker et al. (2010:585) conclude that it is “debatable whether the external review process is as transparent as it appears in theory.” They are concerned that the review processes are not promoting trust and transparence within the higher education institutions because of the weight given to formalities. This may be of concern for European higher education institutions which see themselves as contenders for the international league tables. However, such considerations may be less pertinent in countries that are building their institutional infrastructure, which includes a culture of assessment and quality control.
8 See ENQA (2009).

8 | P a g e
Table 1. What is covered by the European standards and guidelines for quality assurance in the EHEA
Area Components Standards & guidelines (brief summary)
1) Internal quality assurance within higher education institutions
Policy and procedures for quality assurance
Institutions should have a policy and associated procedures for the assurance of the quality and standards of their programs and awards. They should also commit themselves explicitly to the development of a culture which recognizes the importance of quality, and quality assurance, in their work. To achieve this, institutions should develop and implement a strategy for the continuous enhancement of quality. The strategy, policy and procedures should have a formal status and be publicly available. They should also include a role for students and other stakeholders.
Approval, monitoring and periodic review of programs and awards
Institutions should have formal mechanisms for the approval, periodic review and monitoring of their programs and awards.
Assessment of students Students should be assessed using published criteria, regulations and procedures which are applied consistently
Quality assurance of teaching staff Institutions should have ways of satisfying themselves that staffs involved with the teaching of students are qualified and competent to do so. They should be available to those undertaking external reviews, and commented upon in reports.
Learning resources and student support
Institutions should ensure that the resources available for the support of student learning are adequate and appropriate for each program offered.
Information systems Institutions should ensure that they collect, analyze and use relevant information for the effective management of their programs of study and other activities.
Public information Institutions should regularly publish up to date, impartial and objective information, both quantitative and qualitative, about the programs and awards they are offering.
2) External quality assurance of higher education
Use of internal quality assurance procedures
External quality assurance procedures should take into account the effectiveness of the internal quality assurance processes described the European Standards and Guidelines.
Development of external quality assurance processes
The aims and objectives of quality assurance processes should be determined before the processes themselves are developed, by all those responsible (including higher education institutions) and should be published with a description of the procedures to be used.
Criteria for decisions Any formal decisions made as a result of an external quality assurance activity should be based on

9 | P a g e
Area Components Standards & guidelines (brief summary)
explicit published criteria that are applied consistently.
Processes fit for purpose All external quality assurance processes should be designed specifically to ensure their fitness to achieve the aims and objectives set for them.
Reporting Reports should be published and should be written in a style, which is clear and readily accessible to its intended readership. Any decisions, commendations or recommendations contained in reports should be easy for a reader to find.
Follow-up procedures Quality assurance processes which contain recommendations for action or which require a subsequent action plan, should have a predetermined follow-up procedure which is implemented consistently.
Periodic reviews External quality assurance of institutions and/or programs should be undertaken on a cyclical basis. The length of the cycle and the review procedures to be used should be clearly defined and published in advance.
System-wide analyses Quality assurance agencies should produce from time to time summary reports describing and analyzing the general findings of their reviews, evaluations, assessments etc.
3) Standards for external quality assurance agencies
Use of external quality assurance procedures for higher education
The external quality assurance of agencies should take into account the presence and effectiveness of the external quality assurance processes described in the European Standards and Guidelines.
Official status Agencies should be formally recognized by competent public authorities in the European Higher Education Area as agencies with responsibilities for external quality assurance and should have an established legal basis. They should comply with any requirements of the legislative jurisdictions within which they operate.
Activities Agencies should undertake external quality assurance activities (at institutional or program level) on a regular basis.
Resources Agencies should have adequate and proportional resources, both human and financial, to enable them to organize and run their external quality assurance process(es) in an effective and efficient manner, with appropriate provision for the development of their processes and procedures.
Mission statement Agencies should have clear and explicit goals and objectives for their work, contained in a publicly available statement.

10 | P a g e
Area Components Standards & guidelines (brief summary)
Independence Agencies should be independent to the extent both that they have autonomous responsibility for their operations and that the conclusions and recommendations made in their reports cannot be influenced by third parties such as higher education institutions, ministries or other stakeholders.
External quality assurance criteria and processes used by the agencies
The processes, criteria and procedures used by agencies should be pre-defined and publicly available. They should include: a self-assessment or equivalent procedure by the subject of the quality assurance process; an external assessment by a group of experts, including, as appropriate, student member(s), and site visits as decided by the agency; publication of a report, including any decisions, recommendations or other formal outcomes; and follow-up procedure to review actions taken by the subject of the quality assurance process in the light of any recommendations contained in the report.
Accountability procedures Agencies should have in place procedures for their own accountability.
Source: European Association for Quality Assurance in Higher Education (ENQA) (2009). “Standards and Guidelines for Quality Assurance in the European Higher Education Area.” Helsinki, European Association for Quality Assurance in Higher Education: http://www.enqa.eu/files/ESG_3edition%20%282%29.pdf

11 | P a g e
Lessons from non-European countries Turkey9 21. Modernization, associated with Western Europe, has been a defining concept in Turkish politics since the beginning of the Twentieth Century. Candidacy for EU membership is a continuation of this and Turkey’s motivation to join the Bologna Process is part of this policy. Expansion of higher education has led to the doubling in the number of universities in the past ten years. Since joining the Bologna Process in 2001, a number of reforms have been introduced in the areas of degree structures, mobility and recognition, quality assurance, lifelong learning and the social dimensions. The new universities developed along Bologna Process lines; this was not the case for the older ones. 22. The following points characterize higher education in Turkey as it adopted the Bologna Process:
The three cycle degree structure (LMD) already existed, with the exception of medical and related fields. The first degree is a four year program and the master’s degree a two year program.
Nonetheless, internalization of the substance of the Bologna Process reforms has been relatively slow. This is another example where the “soft” reform areas (student involvement in governance, lifelong learning, student-centered learning, defining learning outcomes) are not advancing as quickly as the structural aspects.
Mobility and diploma recognition have been based on bilateral university agreements. Many students do Master’s and Doctorate training in the US. Diploma recognition is important for increased mobility.
Work on a national qualifications framework started in 2006 with the creation of the Commission for National Qualifications Framework for Higher Education and the Higher Education Qualifications Framework of Turkey in 2008.
Quality assurance is done through the Higher Education Auditing Council and the Inter-university Council, which are defined by law as the bodies responsible for quality assurance. Assessment includes analysis of annual university reports; an external evaluation is recommended but not compulsory. The Commission for Academic Assessment and Quality Improvement in Higher Education was established in 2005.
A lifelong learning strategy that defines 16 priority actions is part of the process.
The social dimension is aimed at increasing equity in higher education; this includes admissions policies and student aid.
9 This section is based on Yagci (2010).
12 | P a g e
The evolving governance arrangements, as characterized by the establishment of new bodies for quality assurance and NQF. The Council on Higher Education plays the major coordinating role.
23. Implementation of the Bologna Process has brought to the fore several new issues such as quality assurance, qualifications framework, and student councils. New units were created to accommodate for these issues. Most changes have been structural and were implemented by central bodies. One impact has been a lack of understanding of the substance of the reforms. For example, the quality assurance structures are in place, but are implemented in less than a quarter of the universities. 24. The national team of Bologna Experts played a key role by introducing the Bologna Process reforms and worked closely with the universities. It became increasingly involved in the implementation of the reforms, and organized workshops at all levels. It also led the monitoring process. The Student Councils also played a role — although limited — in developing better understanding of the reforms. Cameroon10
25. Feudjio’s (2009) analysis of LMD implementation highlights the differences between the ideal and the real. On the one hand (the ideal), LMD implementation has clear political support at the highest levels of government and within the academy where it is seen as promoting: economic growth and employment; a knowledge economy; better integration into the global economy; social, cultural and human development; and research. Many university faculties adhere to this vision. On the other hand (the real), higher educational institutions are overcrowded, understaffed, poorly equipped and often decrepit, with poor student living and learning conditions. Furthermore, academic freedom is often wanting.11 In other words, there is an incompatibility between the current state of Cameroonian universities and their ability to adopt the Bologna Process. Their crises and dysfunctionalities militate against effective implementation of the LMD system. 26. LMD implementation began in 2007. However, the constraints of the “real world” indicate that implementation is premature and where the universities are ill-prepared. For example, there have been no transitory measures for students who received their licence under the former system and want to do their masters. Latin America12
27. Expansion of higher education in this region has been tremendous: from 1950 to 1985 the number of universities was multiplied by six; the number of students multiplied by about 28 between 1950 and 1990. And, since then, the quantity of higher education
10
Based on Feudjio (2009).
11 Feudjio (2009:147) asks if one can speak about an LMD system in an academic context where
political considerations often impinge upon and dominate research and academic freedom.
12 Based on Ferrer (2010).
13 | P a g e
institutions — defined by a variety of forms — has continued to grow, with a sustained annual growth rate of more than 6% since 1990. Along with this, institutional diversification was taking place in the form of the rise of private higher education and a variety of institutional models. 28. One result of this highly uneven proliferation was the decision to establish mechanisms and systems of quality control for the evaluation and accreditation of higher education institutions and courses. Problems included: lack of flexibility and responsiveness; severe curricula disparity; disinvestment in public higher education; and impoverishment of the teaching profession. 29. It would appear that such a situation would welcome the introduction of the Bologna Process. However, as Ferrer (2010:605) points out
“The conclusion reached by the scholars and academics who have made the most outstanding contributions to the study of the Ibero-American higher education system is that it is of undoubted interest, but would not appear to be applicable as the situation stands today.”
30. The reasons for this include the rigid organization of education and its low effectiveness. The obstacles that impede implementation of the Bologna Process are structural, organizational and operational, as well as the resistance to change. 31. Nonetheless, some 62 institutions — a relatively small number — in 18 countries set up the Turing-Latin American project between 2004-2006 which is designed to “identify and exchange information and improve cooperation between higher education institutions and promote quality, effectiveness and transparency,” as well as to improve the “compatibility, comparability and competitiveness of higher education” (Ferrer 2010:606). This project was based on the European experience. There are other calls for a Latin American movement towards regional accreditation; and national university evaluation and accreditation bodies and strategies have emerged This has contributed to the development of an evaluation culture and the establishment of accreditation processes, especially in Brazil, Argentina and Colombia. 32. In conclusion, even though the Bologna Process is not being implemented in Latin America, it is highly regarded by many Latin Americans concerned with higher education where, we should remember, universities have long had high degrees of autonomy. Nonetheless, some of its components are being put into place in a less-than-systematic fashion at the institutional, national and regional levels. Here, we see the difficulties involved in applying the Bologna Process model to external grounds.
14 | P a g e
Taking stock of the Bologna Process and its implementation13
33. Two stocktaking reports of the Bologna Process have been published along with an independent assessment. Their major conclusions are (Kehm, 2006):14
Considerable progress has been achieved, especially in implementation of the structural elements (LMD and ECTS). Progress in areas of compatibility, comparability and competitiveness is lacking.
The tiered structure of study programs (LMD) is being implemented. The question is not whether, but how full implementation will be achieved.
There is also widespread use of the ECTS credit system. However, this is happening at varying speeds with different emphases.
There is an overall trend towards convergence of higher education systems. However, the extent of structural unity is less than expected.
As it became clear that expectations were not being met, Bologna Process activities increased in order to achieve better convergence in the design of study programs.
Convergence in the areas of quality, institutional profile, pedagogy and learning is less than in the more structural aspects (i.e., implementation of LMD).
Three challenges are key for continued progress: (i) the need to maintain political momentum; (ii) countries that joined the process at a later stage need support to catch up, along with stakeholder involvement; and (iii) student and teacher resistance in some countries indicates that they have not sufficiently accepted the reforms.
34. It appears, therefore, that there is not one single Bologna Process model. Whereas implementation of the structural (LMD) aspects has proceeded smoothly and rapidly, there has been hesitation and variation in the “softer” areas such as quality assurance, qualifications, and adoption at the micro levels. Progress in the Bologna Process has not resulted in a unified logic throughout all the higher education systems and has had little impact on increasing mobility within Europe since many higher education institutions have their own focus and norms.15
13
This section is based largely on articles from the December 2010 issue of the European Journal of Education (45:4): a special issue entitled “Ten Years of the Bologna Process — ‘What Future’?”
14 The references for these two stocktaking studies are: Reichert, S., & Tauch, C. (2003). Trends 2003.
Progress Toward the European Higher Education Area. Brussels: European University Association; and Reichert, S., & Tauch, C. (2005). Trends IV: European Universities Implementing Bologna. Brussels: European University Association.
15 Alesi, B., Bürger, S., Kehm, B. M., & Teichler, U. (2005). Bachelor- und Master-Studiengänge in
ausgewählten Ländern Europas im Vergleich zu Deutschland. Bonn and Berlin: Bundesministerium für Bildung und Forschung.

15 | P a g e
35. One reason for these shortfalls may be related to the broad spectrum of expectations associated with the Bologna Process, which included:
- A tiered structure of study programs and degrees; - A system of easily understandable and comparable degrees; - Transparency; - Mechanisms for quality assurance; - Improved attractiveness and competitiveness of European universities; - Student mobility within Europe; - Labor market relevance; - Greater differentiation and flexibility with short study programs.
36. The Bologna Process has also been characterized as one of “chaotic mutual adjustment” (Lazetic 2010). The European policy processes are based on mutual adjustments where the higher education institutions are in charge of policy formulation. This means that the policy process has become something of a “messy” and complex set of interactions where no actor has full control over the process. “Actors” here include government and institutional authorities. Indeed, an attractive aspect of the whole process is that it allows policy entrepreneurs to test their initiatives and individual countries to pursue their agendas, especially when many of the decisions are not legally binding. It is from this analysis that Lazetic (2010:558) concludes that
“The Bologna Process seems to have contributed not so much to the convergence of higher education across Europe as to the creation of the common higher education language and structures which enable communication between countries, as well as regular communication between state representatives and higher education stakeholder groups.”
37. Another factor that may account for the divergences would be the limits of “zones of mutual trust” which would be necessary to establish equivalence in the absence of full convergence. Given the lack of full convergence and isomorphism between institutions and programs (for example, when there are three and four year bachelor programs within the Bologna Process zone), and the inevitable variations in quality between institutions, establishing equivalence and mobility between institutions can become problematic. This, however, is the case only insofar as one expects “solutions” that are almost mechanically applicable. The example of the United States, where there is a great variety between fully autonomous, accredited institutions (but all of which practice the four year first, bachelor cycle) and where mobility between institutions is decided by the receiving institutions (to where the student is going) on the basis of the reputation of the sending institution (from which s/he is coming). This is also the case when students change universities between cycles (e.g., from undergraduate bachelor programs to graduate masters and doctorate programs). Given this situation, Kehm (2010:281) concludes that the impact of “measures taken in the framework of the Bologna Process are difficult to assess because they are embedded into a wider context of higher education and society.” In any case, the Bologna Process is irreversible.

16 | P a g e
III. TERTIARY EDUCATION IN MADAGASCAR: REVIEW OF PREVIOUS STUDIES
Key findings from previous studies: the current condition
38. Three World Bank studies on tertiary education have been carried out in recent years.16 They cover the areas of: costs and financing; governance and management; internal and external efficiency. Table 2 provides an overview of the key findings that emerged from these studies, organized by topic. Also, the Annex tables and graphs (all taken from the Zaafrane report) illustrate and provide more detailed information on several of the findings in Table 2.
Table 2. Overview of key findings from World Bank studies on tertiary education in Madagascar
Structure & programs
6 Universities, 2 two-year technological institutes; distance teaching; 20 private non-university institutes;
The academic year starts in February. This creates problems for Malagasy students who want to pursue graduate studies in other countries.
Private tertiary education is a fairly recent phenomenon, which began in the mid-1990s;
Most universities based on traditional, French-oriented model;
Heavy course loads;
Mostly large, lecture courses;
Students have few writing assignments;
Light teaching loads, but faculty members do little research;
There is a large number of specialized course programs in some institutions.
Enrollments
Madagascar has one of the lowest participation rates in the world;
80% of enrollments are in the public universities, of which 60% at U. of Antananarivo; enrollments at private schools has been stagnating;
Only Antananarivo and Toamasina have reasonable large enrollments to justify their university status;
Enrollment growth is rooted in demand coming from the increasing number of baccalauréat holders; between 2001 - 2006 the number of baccalaureate candidates increased by 50%;
The Gross Enrollment Rate in tertiary education went from 2% to 3% between 2001 and 2006. This is one of the lowest in Africa where the average is around 8%.
The rate of admissions has declined from 2002-2006 (Annex 4);
Enrollments in academic studies are increasing, as well as short-term, tuition training courses.
16
They are Bashir (2009), Salmi (2006), and Zaafrane (2008). This section is based on these reports. The information in this section will be updated on the basis of ongoing work.
17 | P a g e
Internal efficiency and quality
Internal efficiency is low; there is high wastage. On average, the repetition rate is 18 percent for the entire system and the dropout rate is 24 percent. About 40 percent of all first-year university students fail, and only 27 percent of incoming students end up graduating. Situation is worse in some faculties.
Most teaching is done through complementary hours paid on top of faculty salaries, and the universities have a disproportionate number of administrative staff;
No student flow management implemented;
Great variability between institutions and course programs;
Internal efficiency is inversely proportional to the size of the institution and directly proportional to the institutions’ resource base;
Only 16% of the faculty are full professors;
The number of full-time, tenured faculty is insufficient. The ratio of students per teacher varies from 8 to 941 (
Annex 6).
Costs and financing
Tertiary education has been underfunded for many years;
More than 90% of financing comes from the government budget via the MENRS17;
Few institutions are able to generate additional income;
No tuition fees, but some graduate programs charge higher fees and some faculties have also launched professional programs for which students pay significant fees (
Annex 8);
Tuition programs have increased in recent years;
A large-share of public resources for tertiary education goes to untargeted scholarships, which have become an entitlement. These transfers amount to over 35% of total expenditures
Decline in the number of students housed by the universities: from >40% in 2002 to 31% in 2006.
Few resources for research and development;
Lack of resources to pay for non-salary recurrent expenditures (about 10.7% of all expenditures). This has implications for maintenance, electricity supply and other essential inputs. Frequent delays in paying salaries; back payments on utilities and telephone (Annex 7).
No clear legal framework and regulation on cost-sharing;
There is no consensus on whether public institutions are allowed to undertake revenue generation activities through university-industry linkages. Nonetheless, some institutions or departments are successful in terms of resource generation (e.g., Forestry Department of the School of Agriculture in U. Antananarivo).
Consultancy activities by professors are purely private arrangements, without any sharing with the university;
No clear mechanism for resource allocation within the universities.
Governance and Management
Governance is characterized by a mix of control and autonomy features that make it difficult to undertake meaningful transformation; under the present centralized governance system, there are considerable constraints that prevent public universities from becoming innovative and responsive
17
Currently Ministry of Higher Education and Scientific Research (Ministère de l’Enseignement Supérieur et de la Recherche Scientifique MESupReS)

18 | P a g e
to labor market and societal needs;
Public universities enjoy total academic freedom, full independence in the selection (election) of their leaders and the recruitment of incoming students, and complete management autonomy regarding their daily operation;
University presidents are elected by teaching and administrative staff; as a result the most competent and dynamic candidates are not necessarily elected;
Government centrally controls a number of key parameters, such as budgetary resources, salary conditions, number of faculty positions and regulations concerning scholarships, and the approval of new programs. This last point undermines the ability of university rectors to make their institution more innovative and responsive to labor market needs;
University Governing Boards, established in the 1990s, do not function well: they have a limited mandate; the economic sector is poorly represented; their main functions are to provide budgetary approval and oversight;
Ineffective management practices: poor data management, especially for financial monitoring and performance-related data; lack of dynamic leadership; little long-term vision and proactive strategies; few links with the economic sectors; little flexibility and responsiveness;
The 2 ISTs, on the other hand, have better functioning Governing Boards where the public and private sectors have equal representation; the Boards actively participate in strategic management and promote linkages with the private sector;
IST directors are appointed by the education minister on the basis of merit;
Universities and ISTs have little autonomy over personnel management and salary scales; lack of flexibility in personnel management and the reward/incentive structures; finance ministry controls remuneration and positions are controlled by the civil service;
Inexistence of performance-based budget allocation processes and clear accountability mechanisms in public universities which, therefore, have little incentive to use limited resources effectively;
Average age of teachers is 55 years;
Competitive fund (FADES) was set up in the context of a World Bank project in support of higher education reform. The general consensus is that the sub-projects were relatively successful on the whole. What became of it?
Since teaching staff are too busy running after supplementary income in the public as well as the private sector, complementary teaching hours have become more important than the regular programmed teaching hours;
High ratio of administrative staff to faculty — about four times as many administrative and technical staff as teaching staff;
Rigid governance structure that is not conducive to innovation and responsiveness; this is compounded by weak leadership and ineffective management practices in many tertiary education institutions.
Infrastructure
Poor condition of libraries, laboratories, ITC, etc.;
Buildings in poor condition, with some exceptions;
Number of students has grown faster than the infrastructure.
Labor Market, external efficiency
Poor quality and relevance;
5% of the labor force has higher education, with regional variations;
In 2005, a higher education graduate gained 2.4 times a person with a secondary diploma;
Many diploma holders do not enter into the labor market;
19 | P a g e
Middle-level technical and managerial personnel are lacking and, therefore, these positions are often held by expatriates;
VET graduates account for less than 2% of employees with the same skills;
Baccalauréat holders account for 18% of the workforce with this level of qualifications;
Licence holders account for only 4% of the workforce with this level of qualifications;
Master degree holders account for 7% of the workforce this level of qualifications;
Extensive employee training in industrial firms;
Little relationship between the country’s overall development strategy orientations and the manpower planning implications for the development of higher education programs (
Annex 5);
No reliable statistics on graduates and labor market outcomes;
Useful contrast of two engineering schools in Antsiranana: despite strong foreign financial and technical assistance, the Ecole Supérieure Polytechnique has become understaffed and under-equipped for lack of leadership and persistence, whereas the Institut Supérieur Technologique continues to produce graduates in high demand among employers thanks to its responsiveness resulting from continuous strategic planning and curriculum adjustment efforts.
Key recommendations from previous studies18
39. In any case, a careful, strategic prioritization actions conceived to rehabilitate the universities will be needed. Such a strategy could take into account the demographic and financing scenarios developed by Zaafrane (2008) and would include:
Prioritizing course programs and disciplines known to promote economic development, such as the applied sciences, engineering, technology, teacher training, health studies, communication, economics and management;
More short programs focused on the training of higher-level technicians. This could include creating new ISTs in different regions or letting the universities provide similar course programs.
Accelerating movement towards a well-structured LMD system, with special attention to first cycle (Licence) course programs and with adequate financing for teacher professional development, infrastructure improvements, syllabus revisions, pedagogical improvements and introduction of useful skill training into the syllabi;
Developing partnerships with universities in other countries;
Renewal of the professorial corps that would include: a strategy for distribution of posts, norms for quality, training for non-PhDs and a proportion of contractual faculty members. This would also include increasing the number of researchers with doctorates in high priority fields.
40. In order to improve overall national competiveness, the accent should be put on the development of universities’ research capabilities. This could include encouraging students
18
Also taken from Bashir (2009), Salmi (2008) and Zaafrane (2008).

20 | P a g e
and beginning faculty members to undertake research — especially applied research. Specific measures could include:
Professional development for beginning researchers, which would include prizes for excellence, training, seminars, etc.;
Establishment of competitive research funds;
Attracting research contracts from foreign firms in Madagascar.
41. Four governance reform areas emerge:
The education ministry should be concerned more with strategy than with managerial functions (intermediary agency such as a national council for higher education that is not under direct political control);
Greater managerial autonomy for the public higher education institutions;
Modification of the composition and mandates of the university governing boards, as well as how rectors are appointed. The governing boards should play a more prominent role is all aspects of the institutions.
Move towards an accreditation-based system for all private and public institutions. It should be based on criteria and collegial control should play a prominent role.
42. More specifically, governance and management reforms for higher education could include:
The introduction of performance-based budget allocation mechanisms that provide financial incentives for improved institutional results in relation to national policy goals. Three types of allocations mechanisms could be considered: (i) output-based funding formulas (examples include France, Finland, Spain and Chile); (ii) performance contracts; and (iii) financing projects from competitive funds (such as the FADES).
In order to ensure reasonable economies of scale, the Ministry of Higher Education and Scientific Research should assess, for each of the four under-populated universities, the feasibility of expanding enrollment to at least 5,000 students. It this is not possible, downgrading should be considered so that these small universities operate as institutes. Also, postgraduate programs should be consolidated in one or two universities.
The academic year should be aligned on that of other countries;
A strategy is needed to address the issue of complementary teaching hours.

21 | P a g e
43. Resource mobilization will be an area for reform. This could include a number of measures:
Regulatory and legal clarity in the areas of cost-sharing and other resource mobilization activities (tuition, faculty consulting, contractual arrangements with industry for services rendered, etc.) that would apply to all public institutions;
To encourage development of the private sector, the possibility of giving or leasing land to private tertiary education institutions could be an incentive for them to establish new campuses. Subsidies for teacher salaries could also be envisaged.
44. Reforms aimed at resource mobilization through efficiency gains could include a strategic planning exercise aimed at rationalizing existing course offerings. This should be done at the institutional and national levels with the goal of attaining better economies of scale. National resources, such as a national digital library with internet access at individual universities could be included in such a strategy. Indeed, distance education has high potential for better utilization of available resources. 45. In order to control the costs of providing student services, each tertiary education institution could facilitate, through sub-contracting arrangements with private firms or agreements with the relevant municipalities, the organization of basic social services for the students. 46. Student aid policies could also be reviewed along the following lines:
Assess whether current amounts are sufficient for those students who are entirely dependent on the scholarship as their only source of income, and increase the amounts as needed;
Define stricter, need-related eligibility criteria to ensure proper targeting of the limited financial aid resources;
Consider the possibility of granting scholarships to needy, academically qualified students who want to enroll in an accredited private tertiary education institution;
Link the prospects for keeping a scholarship on a continuous basis to the academic performance of students;
Undertake a feasibility study for the establishment of a student loan system;
Consider the feasibility of replacing scholarships for first-year students with loans that could be forgiven at the end of the year for those students who pass onto second year.

22 | P a g e
IV. RECENT TRENDS 47. This section updates information in previous World Bank reports on higher education. It has two aspects: (i) quantitate trends since 2007 and (ii) developments since then in the areas of policies and Bologna Process/LMD implementation. The year 2007 is used because it is co-terminal with the previous World Bank studies, especially for those with quantitative data.19
Quantitative trends
48. Enrollments. The sharp increases in enrollments after 2002 (see Annex 2 table) did not continue in the period 2007 - 2010. Average annual enrollment increases in public universities and institutes (excluding distance learning) amounted to 12.8% between 2002 and 2006 and declined to 5.5% between 2007 and 2010 (Table 3). In the distance learning centers (CNTEMAD), enrollments declined between 2002 and 2007 by an annual average of -1.5%, whereas they increased by annual average 6.1% between 2008 and 2010. The vast majority of public enrollments is in the universities, varying between 89-92% enrollments in all public institutions since 2007, with no clear trend. 49. Private school (homologues) enrollments have varied between 10% and 14% of enrollments in public higher education, with an average annual rate of enrollment growth of 12.8% between 2007 and 2010. In 2010, about 25% of private school enrollments were at the Madagascar Polytechnic Institute (Institut supérieur polytechnique du Madagascar - Institut supérieur de technologie). In 2010, the number of students enrolled in approved private schools stagnated and those in authorized (non approved) schools increased.
Table 3. Enrollments in higher education: 2007-2010
2007 2008 2009 2010
Universities 36,041 35,181 37,058 40,428
Institutes 3,746 3,865 3,989 4,298
Training courses 2,566 3,012 3,271 3,364
IST, INSTN 915 1,045 1,151 1,305
Total public 43,268 43,103 45,469 49,395
CNTEMAD 6,857 7,530 7,777 7,987 Private schools (approved/”homologué”)
4,361 6,127 6,313 6,292
Private schools (authorized /”non-homologué”)
3,827 5,309 8,901 11,141
Total private 8,188 11,436 15,214 17,433
Total 58,313 62,069 68,460 74,815
Source: Direction of Planning, MESupReS 2011
19
Zaafrane (2008), in particular.

23 | P a g e
50. The demographic pressures on higher education — in the form of graduates from secondary schools — remain strong. For the period up to 2006, this is seen in the Annex 3 table, which shows sharp increases in the number of secondary school graduates (bacheliers, or baccalaureate holders) after 2004. Since 2007, the number of bacheliers has increased by an annual average of 20.4%. The average pass rate for the baccalaureate exam between 2007 and 2010 was 42.8% and the percentage of bacheliers admitted into public higher education has hovered at around 60% between 2007 and 2009 and then increased to 66% in 2010. Between 2007 and 2010 the number of new students in the first year higher education increased by 22% for the public sector and 175% for the private sector. 51. The two graphs in Figure 2 compare the distribution of enrollments over the various types on institutions for 2005/06 and 2009/10. The major change is that the proportion of students in the universities (“faculties”) has declined by 3.4% points with increases in the most of the other forms of higher education (except the “écoles et instituts”).
Figure 2. Enrollments by type of training: two graphs comparing 2005-06 and 2009-10
2005/2006 2009/2010
52. Success rates on the final, diploma-granting examinations in the public higher education institutions vary significantly between the institutions (Figure 3). Looking at success rates between institutions, two observations come to mind: (i) the variability between universities; and (ii) the differences between the two ISTs where a 10 percentage point difference in 2004/05 widened to become a 27 point spread four years later. This merits some investigation. Furthermore, there have been variations within the institutions between the two time periods for which we have data. The most notable changes over time concern:
the distance learning centers (CNTEMAD) where the success rate increased from 36% in 2004/05 to 56% in 2008/09;
the IST Antsiranana, where it has decreased by about 17 percentage points;
Facultés, 63,80%
Ecoles et Instituts, 6,78%
Formation Professionalisante
, 5,31%
IST - INSTN, 2,06%
CNTEMAD, 12,60%
Secteur privé(homologué)
, 9,45%

24 | P a g e
the University of Mahajanga, where it has increased by about 19 points;
the University of Antsiranana where it increased by about 12 points. These changes may give information on what works and what succeeds in higher education in Madagascar.
Figure 3. Success rates by tertiary institution
2004/2005 2008/2009
53. Teachers. The major fact about the teaching corps in higher education is that the average age is 55 years, which is only five years from official retirement age (although they have the option of continuing until the age of 70). Figure 4 shows the age distribution of teachers for 2006/07. Of particular note is the significant number of teachers already past retirement age. This age distribution represents an existential threat to higher education in Madagascar.
Figure 4. Age of University teachers in 2006/2007 (in the 6 public universities)
Source: Gaillard (2008)
56.1%
88.1%
68.0% 94.8%
54.8%
67.7%
80.7%
69.0%
81.4%
60.6%
CNTEMAD
INSTN
IST Antsiranana
IST Antananarivo
U. Toliara
U. Toamasina
U. Mahajanga
U. Fianarantsoa
U. Antsiranana
U. Antananarivo

25 | P a g e
54. Table 4 shows the number of teachers since 2007 in the universities and ISTs. The number of teachers has increased at a greater rate since 2007 than in the previous ten years. The average annual increase in teacher numbers was 1.0% between 1998 and 2001, and 0.8% between 2002 and 2006. From 2007 to 2010 the number of teachers increased at an average of 6.2% annually, with an increase of 10.1% in 2010. This is still far less than the increasing numbers of students (see para. 0, which points out the 22% increases in the numbers of incoming, first year students). Data on the student teacher ratio suggests that the distribution/recruitment of those new teaching forces do not respond to the demand of each field.
Table 4. Full-time (permanent, civil servants) teachers by rank in public higher education: 2007 - 2010
2007 2008 2009 2010
Prof. Titulaire 101 102 99 95
Professeur 74 76 101 123
Maître de conference 504 550 556 614
Assistant 373 394 386 425
Totals 1052 1122 1142 1257
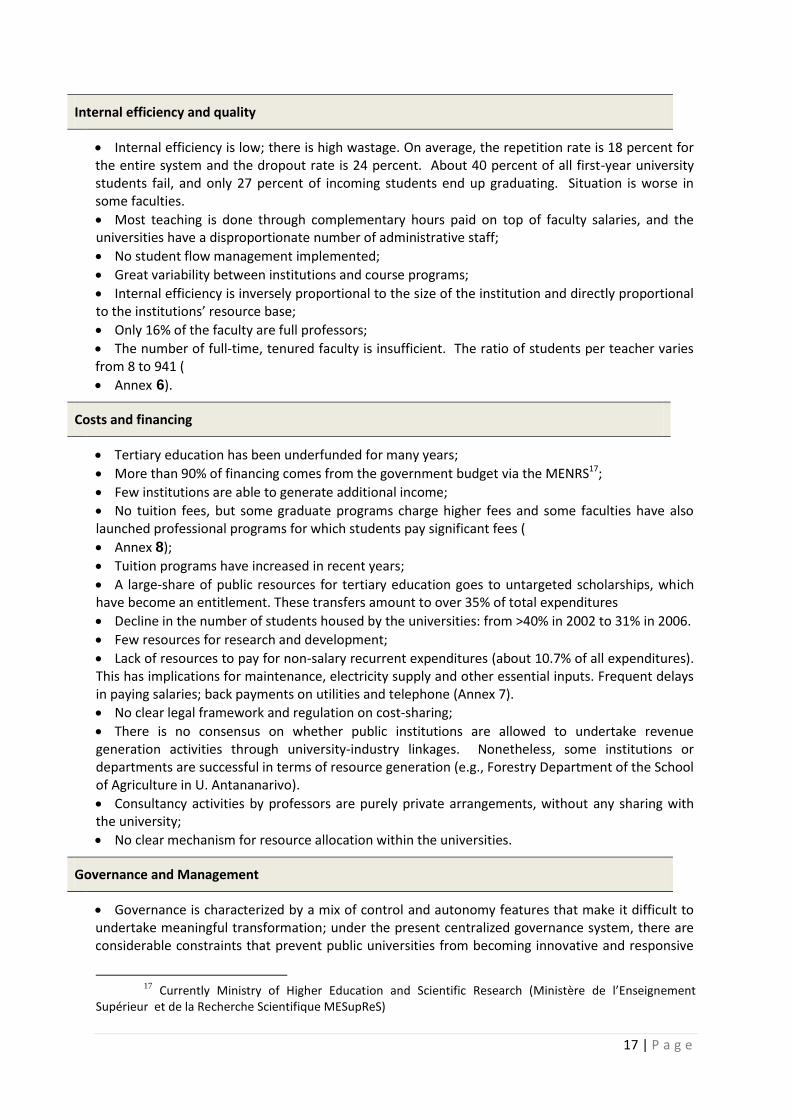
55. A significant proportion of the overall teaching load is ensured by a combination of part-time teachers, with or without contracts, full-time contractual teachers (very few) and, especially, by the permanent teachers working extra hours (“heures complémentaires”) beyond their legally mandated teaching load. Those extra hours would be necessary to ensure the overall teaching load, a source of contention within the universities and, often, a source of inefficiencies and inequities in the allocation of the available resources. It is also be a source of resistance to LMD implementation which calls for a revision and greater transparency in the allocation of teaching loads. 56. Student-teacher ratios vary widely between the universities and technology institutes (

26 | P a g e
57. Figure 5) where it is at 17 for the ISTs and an average of 28 for the six universities, varying from 32 for Antananarivo to 169 for Toamasina.
27 | P a g e
Figure 5. Student-teacher ratios in public higher education, by university
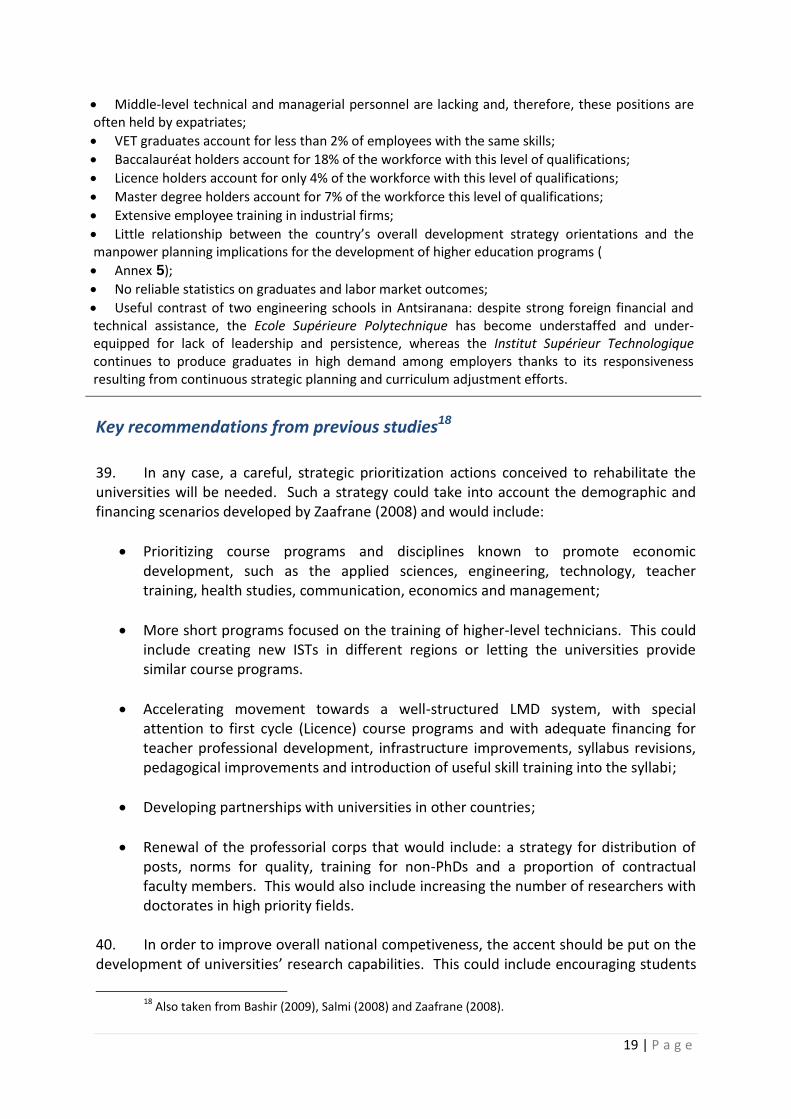
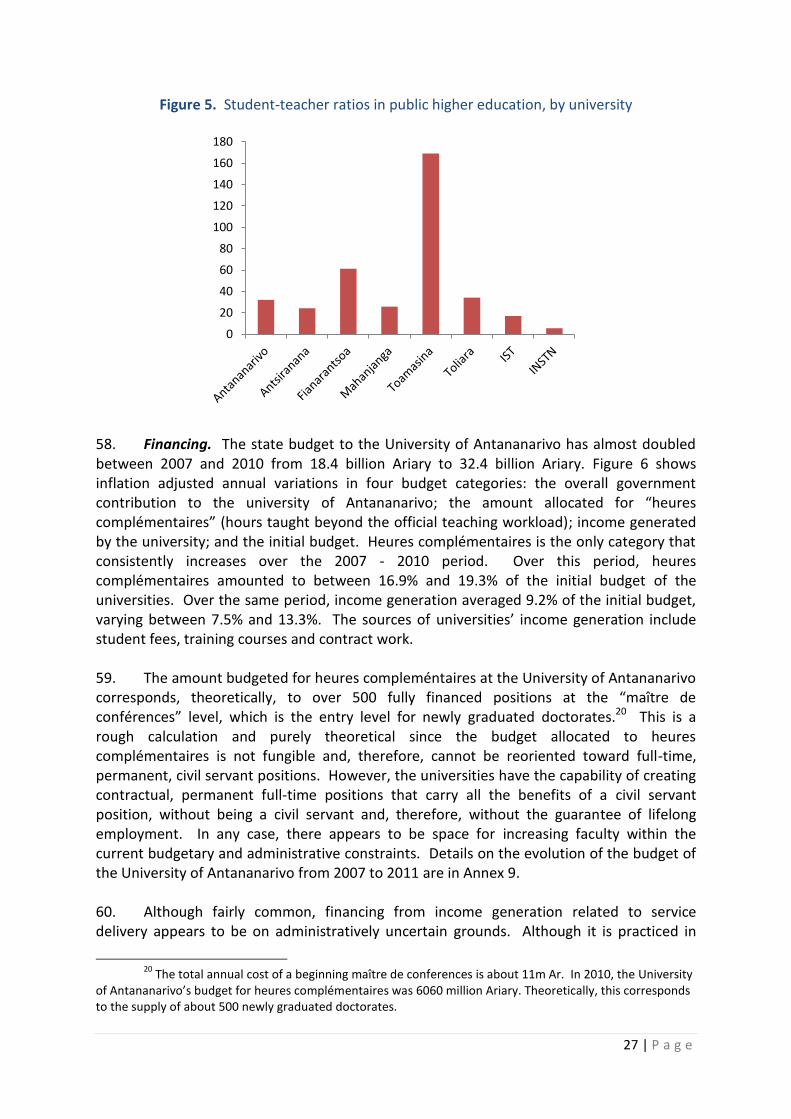
58. Financing. The state budget to the University of Antananarivo has almost doubled between 2007 and 2010 from 18.4 billion Ariary to 32.4 billion Ariary. Figure 6 shows inflation adjusted annual variations in four budget categories: the overall government contribution to the university of Antananarivo; the amount allocated for “heures complémentaires” (hours taught beyond the official teaching workload); income generated by the university; and the initial budget. Heures complémentaires is the only category that consistently increases over the 2007 - 2010 period. Over this period, heures complémentaires amounted to between 16.9% and 19.3% of the initial budget of the universities. Over the same period, income generation averaged 9.2% of the initial budget, varying between 7.5% and 13.3%. The sources of universities’ income generation include student fees, training courses and contract work. 59. The amount budgeted for heures compleméntaires at the University of Antananarivo corresponds, theoretically, to over 500 fully financed positions at the “maître de conférences” level, which is the entry level for newly graduated doctorates.20 This is a rough calculation and purely theoretical since the budget allocated to heures complémentaires is not fungible and, therefore, cannot be reoriented toward full-time, permanent, civil servant positions. However, the universities have the capability of creating contractual, permanent full-time positions that carry all the benefits of a civil servant position, without being a civil servant and, therefore, without the guarantee of lifelong employment. In any case, there appears to be space for increasing faculty within the current budgetary and administrative constraints. Details on the evolution of the budget of the University of Antananarivo from 2007 to 2011 are in Annex 9. 60. Although fairly common, financing from income generation related to service delivery appears to be on administratively uncertain grounds. Although it is practiced in
20
The total annual cost of a beginning maître de conferences is about 11m Ar. In 2010, the University of Antananarivo’s budget for heures complémentaires was 6060 million Ariary. Theoretically, this corresponds to the supply of about 500 newly graduated doctorates.
0
20
40
60
80
100
120
140
160
180
28 | P a g e
several university faculties and institutes, it is not officially authorized. Nonetheless, it appears that the Antananarivo IST finances 55% of its budget (excluding the salaries of teachers who are civil servants) from its own income coming from student fees, training and consulting.
Figure 6. University of Antananarivo: Inflation adjusted annual variations for selected budget categories
Policy and Bologna Process/LMD implementation
61. Bologna Process implementation is a work in progress that has the potential, over time, to impart significant changes on higher education. The major elements of this process are:
Acceleration in the rate of implementation, with a ministerial-determined deadline of 2010;
Several decrees and regulatory texts using basic institutional framework for the implementation of the LMD system have resulted from the decree on the reform of higher education in Madagascar in February 200821.
Reduction of the official course teaching load which should have an impact on the need for heures complémentaires and lead to greater transparency on the management of the overall teaching load. There appears to be some resistance to this among the more senior faculty members;
“Semestrialization” of courses is being implemented in many (but not all) academic departments throughout the system. This means that course offerings will be fit within identifiable semesters. This should contribute to improving the transparency
21
A table showing the details of the related regulatory texts is given in Annex 10.
-20.0%
-10.0%
0.0%
10.0%
20.0%
30.0%
40.0%
50.0%
60.0%
70.0% 2008 2009 2010

29 | P a g e
of the course offerings and the management of teaching loads. Although not formally part of the Bologna Process, this can be seen as a first step towards the introduction of a credit system for courses and diplomas.
Creation in 2007 of a “Comité de Pilotage LMD” (CoPiLMD)22 at the University of Antananarivo which has been working on ensuring readiness for the 2012 ministerial-determined deadline for the universities to have completed their switch to LMD;
Creation of the “Conseil national d’habilitation,” (CNH) tasked with providing ex ante authorization for course programs. A standardized form (“canevas”) has been developed and university departments are in the process of working on it for submission to the CNH.
Initial legal texts have been drafted for the establishment of a national agency for accreditation and assurance quality that would assess the quality of higher education institution programs for accreditation. At present, the approval (“homologation”) private higher education program is ensured by the ministry. The implementation of the accreditation system and assurance quality is a must also because of the increased number of students enrolled in non approved schools.
62. Greater control over student aid policies has recently been introduces through two measures: (i) students who repeat a year will receive only 25% of their student aid (bourse) the following year; and (ii) the introduction of a computerized student flow management system (Scolarix) should enable reasonable enforcement of this policy and prevent the abuses that were so frequent in the recent past. The first measure should create considerable savings if, as in the past, 40% of first-year students fail.
22
Among the role of the CoPiLMD: development of detailed framework, technical assistance in the
methodology for developing models of training and in developing habilitation document. To date, no public
university has submitted any training supply to the CNH.

30 | P a g e
V. STRATEGIC CONSIDERATIONS AND ACTIVITIES 63. First of all, it is important to consider Bologna Process implementation as more of a means than an end. Interviews throughout the higher education community in Antananarivo suggest that there is no one, common understanding of the objectives of the Bologna Process reform and the expected outcomes and benefits. Many do see the goals as greater mobility for students and faculty, the development of equivalencies throughout the system and beyond national boarders, deeper levels of quality assurance and qualifications frameworks (which are the Bologna Process goals in Europe), and greater transparency. But some see only implementation of the LMD diploma structure. 64. From a broad strategic perspective, implementation of the Bologna Process could be a viable and legitimate vehicle for overall rationalization of the system. Outcomes in this respect could include: reforming the allocation of the budget for “heures complémentaires”; development of an institutional capacity for quality assurance and accreditation; and greater autonomy for the universities and institutes. This could imply the following policy moves:
A fully transparent policy for the “heures complémentaires” for each university that would include making available full information on the teaching requirements (and, therefore, the “heures complémentaires” for each course.
A major element of this would be completion of the ongoing work related to the reduction of class contact hours for faculty members in the context of LMD implementation. This contributes to full transparency in that the “heures complémentaires” budget for each course is stated at the beginning of each semester.
Recruitment of permanent, contractual (i.e., non-fonctionnaire) junior faculty financed from the budget for “heures complémentaires.” These contractual faculty members would have all the rights and privileges as their “fonctionnaires” colleagues (including voting rights for university elections). A plan for the use of the “heures complémentaires” budget would be submitted and made public well before the beginning of each academic year.
As full rationalization will require moving toward a credit system where each course and diploma is associated with a credit amount, the development of credit system should be a priority and should go beyond a distribution of allocated hours in the conventional system.
65. The role of the World Bank would be the support of the implementation process, recognizing, however, that progress will be gradual and, at times, chaotic. It should be remembered that, implementation in the Bologna Process heartlands — Europe — has not been as steady and rapid as initially expected. Wariness of deadlines should be in order, all the while recognizing their tactical utility.
31 | P a g e
66. Support for the higher education network “ReNaSup”23 would be in order. This network will be an essential element in realizing Bologna Process implementation, especially in support of the more active role students are expected to play in new pedagogy — which implies fewer large lecture classes and, therefore, reduced teaching loads. Developing the supply of networked information will be a necessary, but not sufficient condition for such a network to be operational. It will be necessary to ensure that students and faculty have full and easy access to the network. One possibility would be a small-scale pilot implementation of the Laforgue proposals. 67. Shifting part of the “heures complémentaires” budget towards the recruitment of permanent junior faculty could be a first step to renewal of the professorial corps with its current average age of around 55. In the context of LMD implementation, which includes the reduction of official course teaching requirements, each university should be requested to develop a clear and detailed plan that states their needs for “heures complémentaires” and the number of new, contractual positions they will open and finance from their “heures complémentaires” budget. The recruitment should be proportional to the need of each faculty and domain. 68. Consideration should be given to the idea of “development universities”, whereby the university is more directly involved with productive forces in the society and the economy.24 This could include working more closely with these productive sectors in the development of course and research programs, as well as undertaking income-generation activities related to training, research and consulting activities. Even though such activities are more likely to occur in the areas of science, engineering, management, economics and the health fields, it would be necessary to ensure that the entire university benefits from such openness. 69. Promotion of the idea, and practice, of the “development university” could include well-targeted study visits to other such universities in Africa and Asia.25 It would be useful for the university community to become better acquainted with other African universities, including those outside of the Francophone realm. 70. Several ideas were developed in the higher education workshop26, including: involving the economic sectors in the elaboration of course programs; creation of pilot units for linking research with development and income generation; and capacities to evaluate such activities.
23
Pierre Laforgue, June 2011
24 This quote by J. M. Yesufu (in Court (1991:335) sums up the underlying idea of the development
university: “What seemed to be required, therefore, was a new working definition of a university, which would signify its commitment, not just to knowledge for its own sake, but to the pursuit of knowledge for the sake of, and for the amelioration of, the conditions of the common man and woman in Africa.”
25 Development universities in Africa would include: Dar-es-Salaam, Makerere, the Universities of
Cape Town, Johannesburg and Kwa-Zulu Natal in South Africa, and Ibadan, Jos and Port Harcourt in Nigeria. Useful references include Mkude et al. (2003), Mususi & Muwanga (2003), Mwiria et al. (2007), Ramphele (2004) and Sawyerr (2004).
26 World Bank, May 31, 2011.
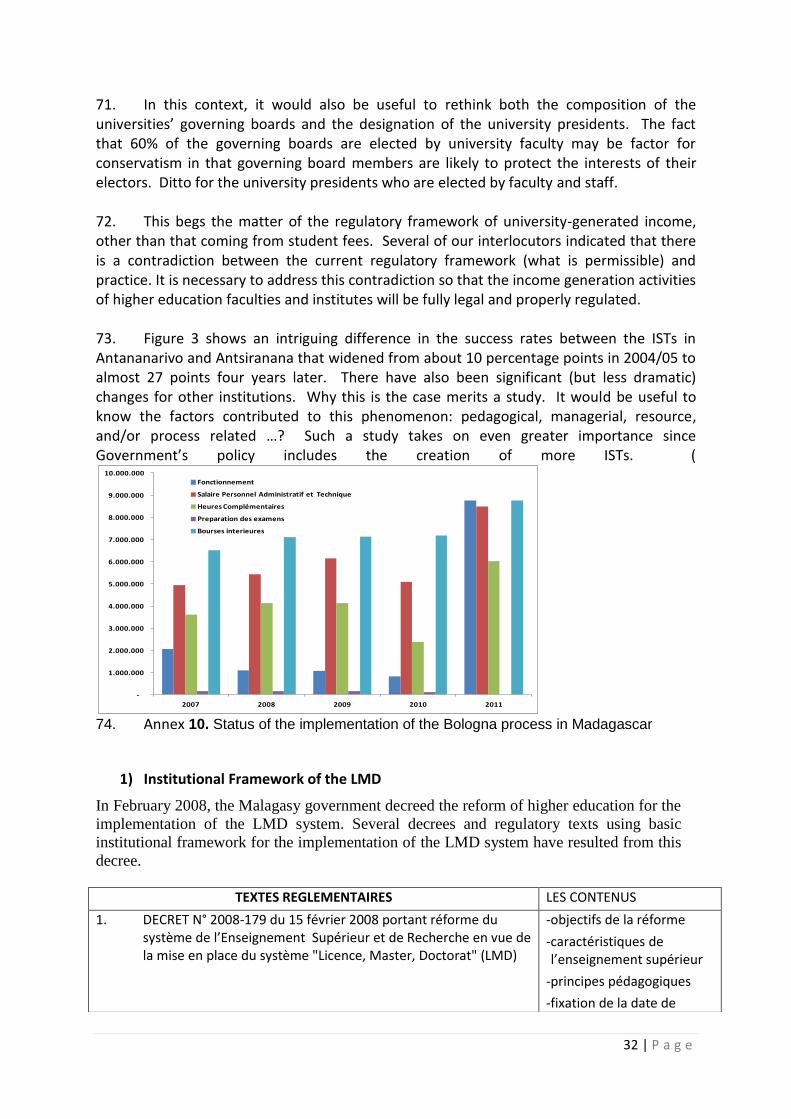
32 | P a g e
71. In this context, it would also be useful to rethink both the composition of the universities’ governing boards and the designation of the university presidents. The fact that 60% of the governing boards are elected by university faculty may be factor for conservatism in that governing board members are likely to protect the interests of their electors. Ditto for the university presidents who are elected by faculty and staff. 72. This begs the matter of the regulatory framework of university-generated income, other than that coming from student fees. Several of our interlocutors indicated that there is a contradiction between the current regulatory framework (what is permissible) and practice. It is necessary to address this contradiction so that the income generation activities of higher education faculties and institutes will be fully legal and properly regulated. 73. Figure 3 shows an intriguing difference in the success rates between the ISTs in Antananarivo and Antsiranana that widened from about 10 percentage points in 2004/05 to almost 27 points four years later. There have also been significant (but less dramatic) changes for other institutions. Why this is the case merits a study. It would be useful to know the factors contributed to this phenomenon: pedagogical, managerial, resource, and/or process related …? Such a study takes on even greater importance since Government’s policy includes the creation of more ISTs. (
74. Annex 10. Status of the implementation of the Bologna process in Madagascar
1) Institutional Framework of the LMD
In February 2008, the Malagasy government decreed the reform of higher education for the
implementation of the LMD system. Several decrees and regulatory texts using basic
institutional framework for the implementation of the LMD system have resulted from this
decree.
-
1.000.000
2.000.000
3.000.000
4.000.000
5.000.000
6.000.000
7.000.000
8.000.000
9.000.000
10.000.000
2007 2008 2009 2010 2011
Fonctionnement
Salaire Personnel Administratif et Technique
Heures Complémentaires
Preparation des examens
Bourses interieures
TEXTES REGLEMENTAIRES LES CONTENUS
1. DECRET N° 2008-179 du 15 février 2008 portant réforme du système de l’Enseignement Supérieur et de Recherche en vue de la mise en place du système "Licence, Master, Doctorat" (LMD)
-objectifs de la réforme
-caractéristiques de l’enseignement supérieur
-principes pédagogiques
-fixation de la date de
33 | P a g e
migration vers le système LMD
2. ARRETE N° 04.149/ 2010 relatif aux grades, titres et diplômes nationaux dans le système LMD.
-fixation des grades
-l’équivalence des diplômes nationaux de même dénomination délivrés par un établissement accrédité
3. ARRETE N° 04.150//2010 fixant la liste des domaines de formation ouverts dans l’enseignement supérieur
-liste arrêtée à 6 domaines
4. ARRETE N° 04.152/2010 portant organisation des études universitaires conduisant au diplôme et grade de Licence
-définitions des conditions
d’organisation des études
permettant l’obtention du
diplôme et grade de licence
-dispositions diverses et
transitoires
5. ARRETE N° 11.049/2010 portant organisation des études universitaires conduisant au diplôme et grade de Master
-définitions des conditions
d’organisation des études
permettant l’obtention du
diplôme et grade de Master
-dispositions diverses et
transitoires
6. ARRETE N° 29.403/2010 relatif à la création à l'organisation et au fonctionnement des écoles doctorales
-fixation de la création, de
l’organisation et du
fonctionnement du
consortium d’écoles
doctorales
-fixation de la création, de l’organisation
7. ARRETE N° 10.848/2010 fixant les éléments informatifs du supplément au diplôme
Définition du document
annexé au diplôme.
Il renseigne sur le cursus et
compétences acquises par
l’étudiant
8. ANNEXE supplément au diplôme Déscription en détail du contenu du document

34 | P a g e
75. Annex 1 provides an outline of Terms of Reference for the study).
35 | P a g e
REFERENCES Bashir, Sajitha (2009). "Mieux former la population active pour préparer l'avenir : La
transformation de l'enseignement post-fondamental à Madagascar." Washington, DC: Banque mondiale.
Court, D. 1991. "The Development of University Education in Sub-Saharan Africa". in P. G. Altbach (Editor) ,International Higher Education: An Encyclopedia. (pp. 329-347).
European Association for Quality Assurance in Higher Education (ENQA) (2009). "Standards and Guidelines for Quality Assurance in the European Higher Education Area." Helsinki: European Association for Quality Assurance in Higher Education. http://www.enqa.eu/files/ESG_3edition%20%282%29.pdf.
Eurydice (2009). "Higher Education in Europe 2009: Developments in the Bologna Process." Brussels: European Commission: Education, Audiovisual and Culture Executive Agency. http://ec.europa.eu/education/higher-education/doc/eurydice09_en.pdf.
Ferrer, A. T. (2010). "The Impact of the Bologna Process in Ibero-America: prospects and challenges." European Journal of Education. 45(4): 601-611.
Feudjio, Yves Bertrand Djouda (2009). "L’adoption du « système LMD » par les universités du Cameroun : enjeux, contraintes et perspectives." Journal of Higher Education in Africa 7(1&2): 141-157. http://www.codesria.org/IMG/pdf/7-Feudjo.pdf.
Gaillard, Jacques (2008). “Le système national de recherche scientifique et technique à Madagascar.” Rapport préparé pour l’UNESCO, Secteur des sciences exactes et naturelles, Division de l'analyse et des politiques scientifiques.
Mkude, Daniel, Brian Cooksey, et al. (2003). Higher Education in Tanzania. Oxford and Dar es Salaam: James Currey and Mkuki na Nyota.
Musisi, Nakanyike B. & Nansozi K. Muwanga (2003). Makerere University in Transition 1993-2000: Opportunities & Challenges. Oxford & Kampala: James Currey & Fountain Publishers.
Mwiria, Kilemi, Njuguna Ng’ethe, et al. (2007). Public & Private Universities in Kenya: New Challenges, Issues & Achievements. Oxford & Nairobi: James Currey & East African Educational Publishers.
Karseth, Berit & Tone Dyrdal Solbrekke (2010). "Qualifications Frameworks: the avenue towards the convergence of European higher education?" European Journal of Education . 45(4): 563-576.
Kehm, Barbara M. & Ulrich Teichler (2006). "Which direction for bachelor and master programmes? A stocktaking of the Bologna process." Tertiary Educcation Management. 12: 269-282.
Lazetic, Predrag (2010). "Managing the Bologna Process at the European Level: institution and actor dynamics." European Journal of Education. 45(4): 549-562.
Ramphele, Mamphela (2004). "The University as an Actor in Development: New Perspectives and Demands." Journal of Higher Education in Africa. 2(1): 15-33.
Salmi, Jamil (2008). “Madagascar: Financing and Governance of Tertiary Education. World Bank unpublished report.
Sawyerr, Akilagpa (2004). "African Universities and the Challenge of Research Capacity Development." Journal of Higher Education in Africa. 2(1): 213-242.
Stensaker, Bjorn, Lee Harvey, et al. (2010). "The Impact of the European Standards and Guidelines in Agency Evaluations." European Journal of Education. 45(4): 577-587.

36 | P a g e
Yagci, Yasemin (2010). "A Different View of the Bologna Process: the case of Turkey." European Journal of Education . 45(4): 588-600.
Zaafrane, Hafedh (2008). "Étude sur les coûts et le financement de l’enseignement supérieur à Madagascar." Antananarivo: Ministere de l’éducation nationale et de la recherche scientifique.
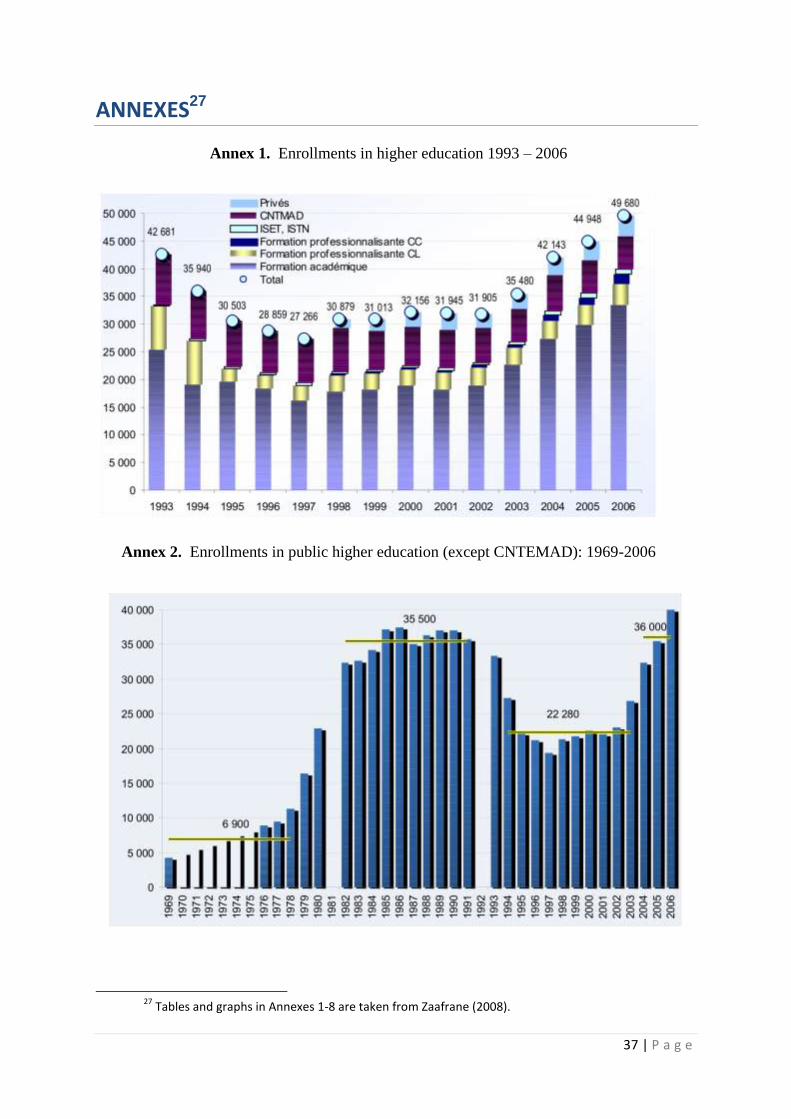
37 | P a g e
ANNEXES27
Annex 1. Enrollments in higher education 1993 – 2006
Annex 2. Enrollments in public higher education (except CNTEMAD): 1969-2006
27
Tables and graphs in Annexes 1-8 are taken from Zaafrane (2008).

38 | P a g e
Annex 3. Baccalauréat graduates from secondary school: 1975-2006
Annex 4. Admission rates into tertiary education

39 | P a g e
Annex 5. Structure of the labor force by sector and level of education
Sans instruction Primaire Secondaire Supérieur Ensemble
Agriculture/primaire 92,3% 86,5% 54,6% 18,4% 81,9%
Industrie alimentaire 0,2% 0,7% 1,1% 0,2%
Textile 0,4% 3,3% 3,3% 0,8%
BTP/HIMO 0,5% 1,1% 2,7% 5,1% 1,2%
Autres industries 0,5% 0,9% 3,0% 7,0% 1,3%
Commerce 2,1% 4,5% 11,7% 8,5% 4,9%
Transport 0,2% 0,6% 2,3% 3,8% 0,8%
Santé privée 0,2% 2,0% 0,1%
Enseignement privé 0,1% 1,5% 7,8% 0,5%
Administrations publiques 0,1% 0,5% 7,6% 28,5% 2,1%
Autres services privés 4,3% 5,2% 12,4% 14,5% 6,2%
Total 100,0% 100,0% 100,0% 100,0% 100,0%

40 | P a g e
Annex 6. Teachers and student-teacher ratios by institution
Grades des enseignants Prof.
titulaire Prof.
Maître de conférences
Assistant Total Effectif
Étudiants
Ratio Étudiants
par enseignant
Université d'Antananarivo 78 53 272 178 581 23 584 41
Faculté DEGS 9 2 24 18 53 10 566 199
Faculté Lettre 5 4 42 43 94 4 442 47
Faculté des sciences 31 22 81 29 163 3 227 20
Faculté de médecine 20 9 2 1 32 2 562 80
École polytechnique 8 8 59 59 134 1 457 11
ESS Agronomique 1 6 23 7 37 510 14
ENS 4 2 41 21 68 820 12
Université d'Antsiranana 1 4 28 29 62 1 225 20
Faculté de lettres 1 1 5 7 287 41
Faculté des sciences 1 2 5 8 16 484 30
École polytechnique 1 16 12 29 291 10
ENSET 6 4 10 163 16
Université de Fianarantsoa 2 4 23 43 72 3 986 55
Faculté DEGS 1 1 7 16 25 2 631 105
Faculté des sciences 1 3 8 10 22 676 31
École nationale d'informatique 3 9 12 178 15
École Normale Supérieure 3 6 9 352 39
ISTE 2 1 3 41 14
CUFP 1 1 108 108
Université de Mahajanga 7 4 32 25 68 1 687 25
Faculté des sciences 1 3 15 17 36 810 23
Faculté de médecine 3 8 2 13 677 52
I.O.S.T.M. 3 1 9 6 19 200 11
Université de Toamasina 1 23 16 40 5 365 134
Faculté DEGS 9 9 18 4 033 224
Faculté des lettres 1 14 7 22 1 332 61
Université de Toliara 3 3 52 38 96 2 768 29
Faculté des lettres 21 11 32 1 193 37
Faculté des sciences 2 1 17 22 42 352 8
École Normale Supérieure 1 3 2 6 85 14
IHSM 1 11 3 15 197 13
Faculté DEGS 1 1 941 941
Instituts Sup. Technologiques 1 13 42 56 838 15
IST Antananarivo 1 10 35 46 627 14
IST Antsiranana 3 7 10 211 21
INSTN 1 1 5 4 11 21 2
Total général 94 69 448 375 986 39 474 40

41 | P a g e
Annex 7. Structure of higher education recurrent expenditures (2006)
Annex 8. Resources generated by tuition programs: 2002-2006
145
206
364
518
776
360 370388
427 433
0
50
100
150
200
250
300
350
400
450
500
0
100
200
300
400
500
600
700
800
900
1 000
2002 2003 2004 2005 2006
Montant généré (M Ar) Coût moyen/an (1000 Ar)
(Millions Ar) (1000 Ar)

42 | P a g e
Annex 9. Evolution the Antananarivo University budget (2007-2009) [x MGA1000]
2007 2008 2009 2010 Budget 2011
Dotation de transfert 11.595.864 12.140.925 12.703.892 10.950.000 33.678.613
Recette propore (EES)* 1.659.326 1.789.289 2.030.648 2.072.485 3.070.369
Autres ressources
Fonctionnement 2.045.605 1.094.375 1.071.542 831.713 8.772.641
Salaire PAT (Personnel Administratif et Technique) 4.939.548 5.433.502 6.158.585 5.077.188 8.497.791
HC (Heures Complémentaires) 3.620.711 4.124.290 4.124.290 2.369.604 6.030.478
Preparation des examens 150.000 150.000 150.000 116.885
Bourses interieures 6.509.175 7.110.189 7.140.982 7.190.715 8.763.778
Bourses exterieures
HC 541.182 612.195 769.282 612.195 1.119.093
Fonctionnement 158.528 108.779 93.679 38.244 154.880
Preparation des examens 20.096 20.096 18.000
Bourses 3.017.672 3.269.870 2.931.955 2.798.108 3.547.667
HC 682.182 876.947 896.267 876.947 986.259
Fonctionnement 172.875 161.654 139.214 97.572 482.044
Preparation des examens 20.950 20.950 20.950
Bourses 920.137 1.121.541 1.247.698 1.110.360 1.357.066
HC 675.747 711.969 716.351 711.969 999.802
Fonctionnement 119.284 109.495 94.295 50.921 1.853.588
Preparation des examens 16.379 16.379 16.379 78.000
Bourses 1.264.190 1.259.888 1.283.809 1.271.735 1.999.285
HC 459.175 533.867 620.401 533.867 650.000
Fonctionnement 215.105 205.218 153.480 33.914 852.967
Preparation des examens 47.613 47.613 23.561
Allocation de stage 27.000 54.000 56.304 110.000
Bourses 571.991 716.273 768.365 796.746 820.000
HC 209.291 252.688 280.658 252.688 475.307
Fonctionnement 64.143 61.158 52.669 40.152 206.540
Preparation des examens 6.665 6.665 4.699 68.200
HC 630.555 714.142 845.700 714.142 1.033.796
Fonctionnement 130.494 113.317 97.587 58.849 970.349
Preparation des examens 23.997 23.997 18.997 49.815
Bourses 486.343 496.702 608.424 658.303 730.631
HC 422.480 422.480 415.407 422.480 766.221
Fonctionnement 74.168 63.706 54.863 22.484 1.683.476
Preparation des examens 14.296 14.296 14.296 39.000
Bourses 248.842 238.968 300.729 344.616 309.129
ENS
Previsions (EES) - Repartition budgetaire/ESS
* Prevision etablissements d'enseignement superieur
Budget de transfert
Emplois
DEGS
Sciences
FLSH
Medecine
ESSA
ESPA
-
1.000.000
2.000.000
3.000.000
4.000.000
5.000.000
6.000.000
7.000.000
8.000.000
9.000.000
10.000.000
2007 2008 2009 2010 2011
Fonctionnement
Salaire Personnel Administratif et Technique
Heures Complémentaires
Preparation des examens
Bourses interieures

43 | P a g e
Annex 10. Status of the implementation of the Bologna process in Madagascar
2) Institutional Framework of the LMD
In February 2008, the Malagasy government decreed the reform of higher education for the
implementation of the LMD system. Several decrees and regulatory texts using basic
institutional framework for the implementation of the LMD system have resulted from this
decree.
TEXTES REGLEMENTAIRES LES CONTENUS
9. DECRET N° 2008-179 du 15 février 2008 portant réforme du système de l’Enseignement Supérieur et de Recherche en vue de la mise en place du système "Licence, Master, Doctorat" (LMD)
-objectifs de la réforme
-caractéristiques de l’enseignement supérieur
-principes pédagogiques
-fixation de la date de migration vers le système LMD
10. ARRETE N° 04.149/ 2010 relatif aux grades, titres et diplômes nationaux dans le système LMD.
-fixation des grades
-l’équivalence des diplômes nationaux de même dénomination délivrés par un établissement accrédité
11. ARRETE N° 04.150//2010 fixant la liste des domaines de formation ouverts dans l’enseignement supérieur
-liste arrêtée à 6 domaines
12. ARRETE N° 04.152/2010 portant organisation des études universitaires conduisant au diplôme et grade de Licence
-définitions des conditions
d’organisation des études
permettant l’obtention du
diplôme et grade de licence
-dispositions diverses et
transitoires
13. ARRETE N° 11.049/2010 portant organisation des études universitaires conduisant au diplôme et grade de Master
-définitions des conditions
d’organisation des études
permettant l’obtention du
diplôme et grade de Master
-dispositions diverses et
transitoires
14. ARRETE N° 29.403/2010 relatif à la création à l'organisation et au fonctionnement des écoles doctorales
-fixation de la création, de
l’organisation et du
fonctionnement du
consortium d’écoles
doctorales
-fixation de la création, de l’organisation
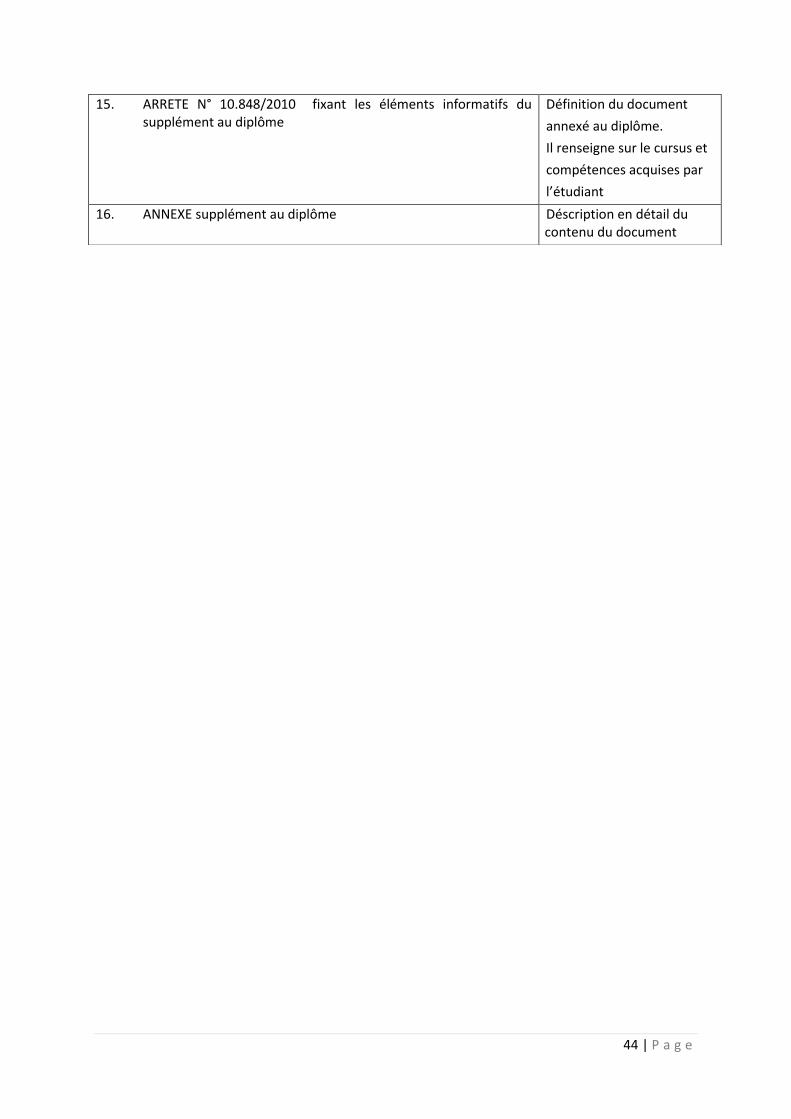
44 | P a g e
15. ARRETE N° 10.848/2010 fixant les éléments informatifs du supplément au diplôme
Définition du document
annexé au diplôme.
Il renseigne sur le cursus et
compétences acquises par
l’étudiant
16. ANNEXE supplément au diplôme Déscription en détail du contenu du document

45 | P a g e
Annex 11. An indicative outline of terms of Reference for a study comparing success rates
of the two ISTs
Starting point: the observation that the difference in the success rates between the ISTs of Antsiranana and Antananarivo almost tripled in four years: increasing from about 10 percentage points in 2004/05 to about 27 points four years later (see Figure 3).
Two questions need to be addressed: o Why has the IST Antananarivo performed so much better than that in
Antsiranana? o Why has the success rate gap between the two widened so much in four years?
In other words, why is the quality of Antananarivo improving and that of Antsiranana declining?
The study should focus on input indicators and processes. It will be exploratory.
Input indicators: o Financing, Budgets: revenues and expenditures disaggregated according to
various pedagogical, administrative and other expenses; self-generated income and how it is used
o Percentage of courses assured by heures complémentaires and “vacataires” o Composition of the teaching staff by age, diploma levels, gender, rank, research
activities, non-academic experience, etc. o Didactic & pedagogical materials: availability of ICT, libraries, internet access,
laboratory materials o Curricula and syllabi: what are the differences between the two ISTs? o Student support: compare the two on scholarships, living conditions, etc. o Research: are there differences between the two on the amount and nature of
research being conducted? o Student-teacher ratio o Student numbers, disaggregated by socio-economic and geographical
background, gender, and previous academic success
Process indicators: o The nature of classroom interactions: the amount of practical, experimental work;
are courses lecture or interactive o The nature of governance and leadership styles
Vision, strategic planning, clarity of goals, participation Accountability
o The extent to which autonomy is exercised How do they deal with the constraints and limitations of existing rules Student selection Faculty selection and incentives
o Relationships with the economic sector