terrain analysis (surface analysis)
DESCRIPTION
------Using GIS--. Introduction to GIS. TOC What is surface? Surface model DEM (lattice of points, grid) Contour TIN Surface Analysis in ArcGIS: Spatial Analyst, 3D Analyst , ArcScene. Terrain Analysis (Surface Analysis). Terrain Analysis. - PowerPoint PPT PresentationTRANSCRIPT
Terrain Analysis (Surface Analysis)
------Using GIS--Introduction to GIS
TOCWhat is surface?Surface model DEM (lattice of points, grid) Contour TINSurface Analysis in ArcGIS: Spatial Analyst, 3D Analyst , ArcScene
Terrain AnalysisUse of three-dimensional data to
perform landscape or terrain evaluation.
Examples: Use of digital elevation models to
generate contour maps and perform slope analysis
Civil engineering calculations to determine cut-and-fill volumes and generate vertical profile drawings
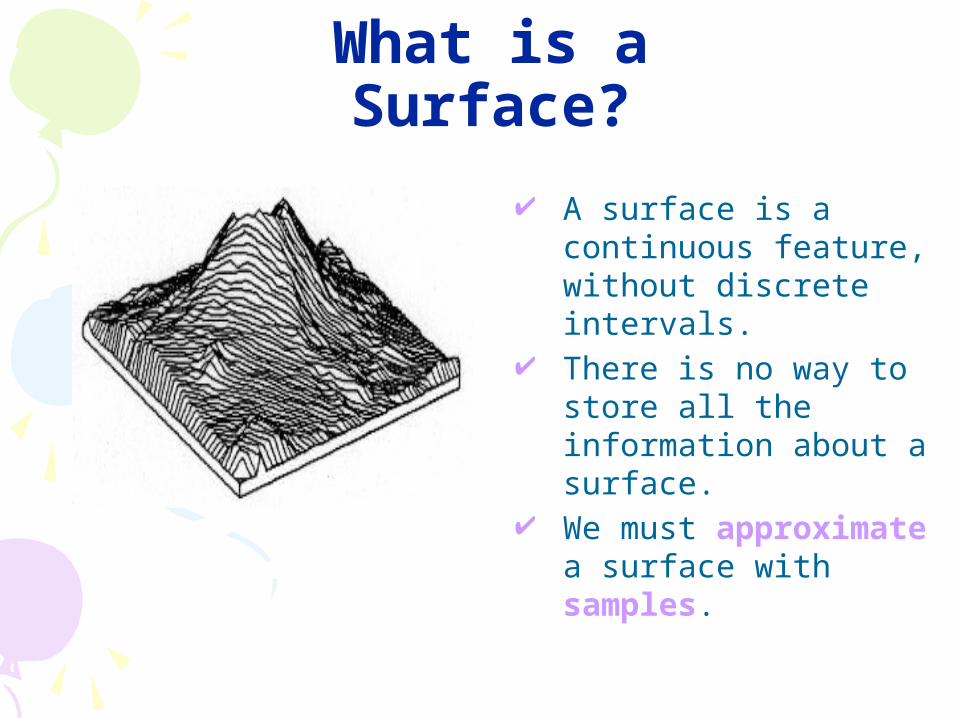
What is a Surface?
A surface is a continuous feature, without discrete intervals.
There is no way to store all the information about a surface.
We must approximate a surface with samples.
Surface Data Surface models are based on point data
which associates a z value item with an x,y location.
The z value usually measures surface elevation and provides the surface model with its third dimension.
These z values can also be used to represent a wide variety of measurements. Common examples are:depth, temperature, rainfall, pollutants, barometric pressure and demographic distribution.
Surfaces which are generated to represent these data points become the model upon which to perform surface analysis.
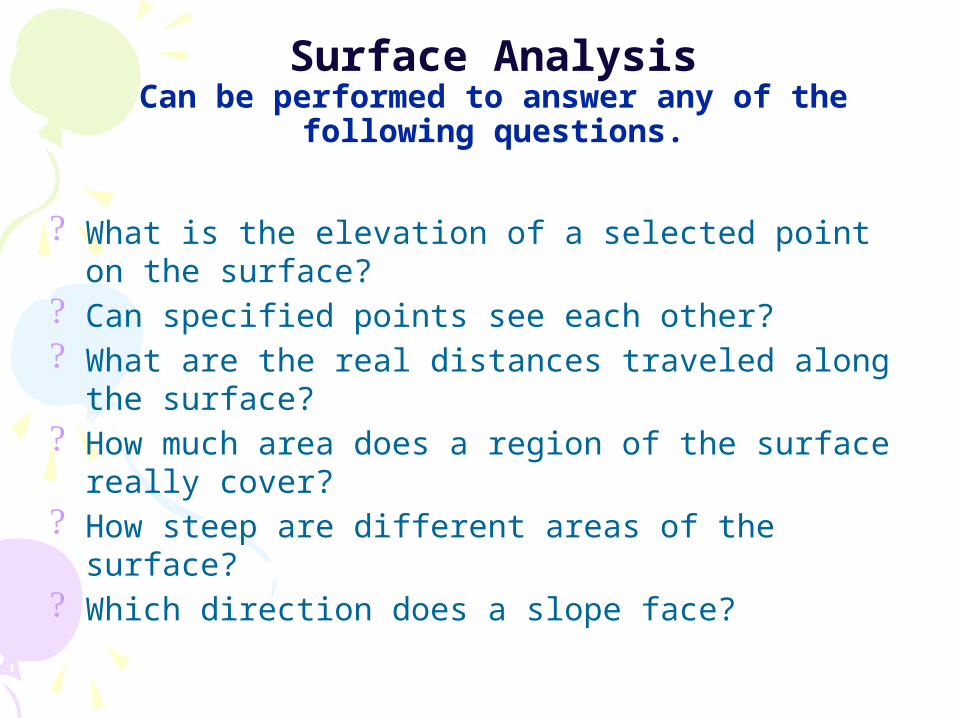
Surface AnalysisCan be performed to answer any of the
following questions.
? What is the elevation of a selected point on the surface?
? Can specified points see each other?? What are the real distances traveled along the
surface?? How much area does a region of the surface really
cover?? How steep are different areas of the surface?? Which direction does a slope face?
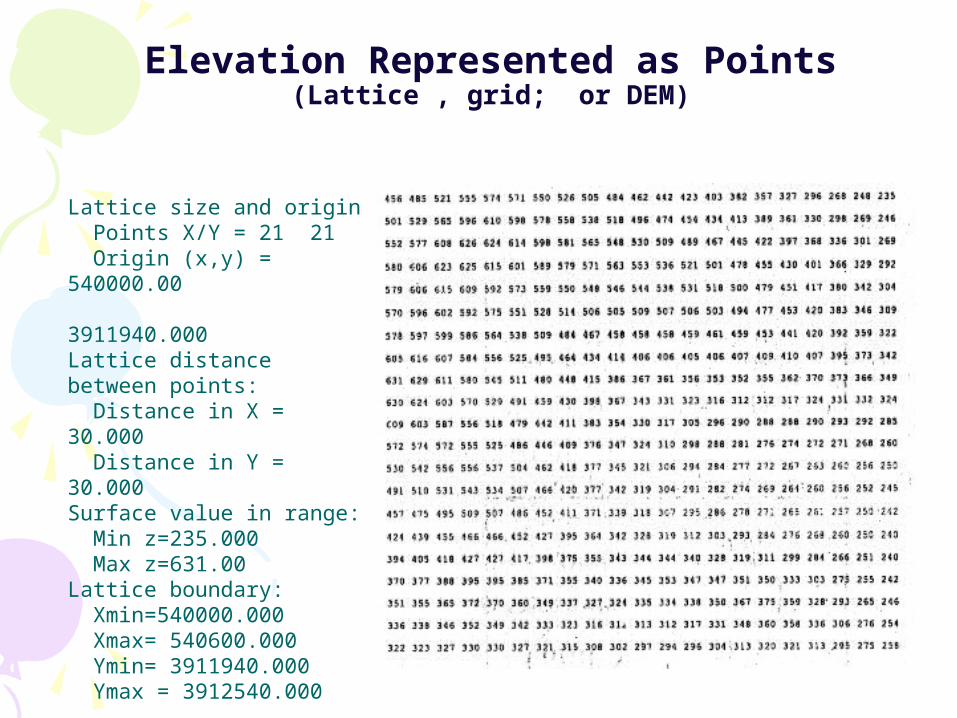
Elevation Represented as Points(Lattice , grid; or DEM)
Lattice size and origin Points X/Y = 21 21 Origin (x,y) = 540000.00 3911940.000Lattice distance between points: Distance in X = 30.000 Distance in Y = 30.000Surface value in range: Min z=235.000 Max z=631.00Lattice boundary: Xmin=540000.000 Xmax= 540600.000 Ymin= 3911940.000 Ymax = 3912540.000
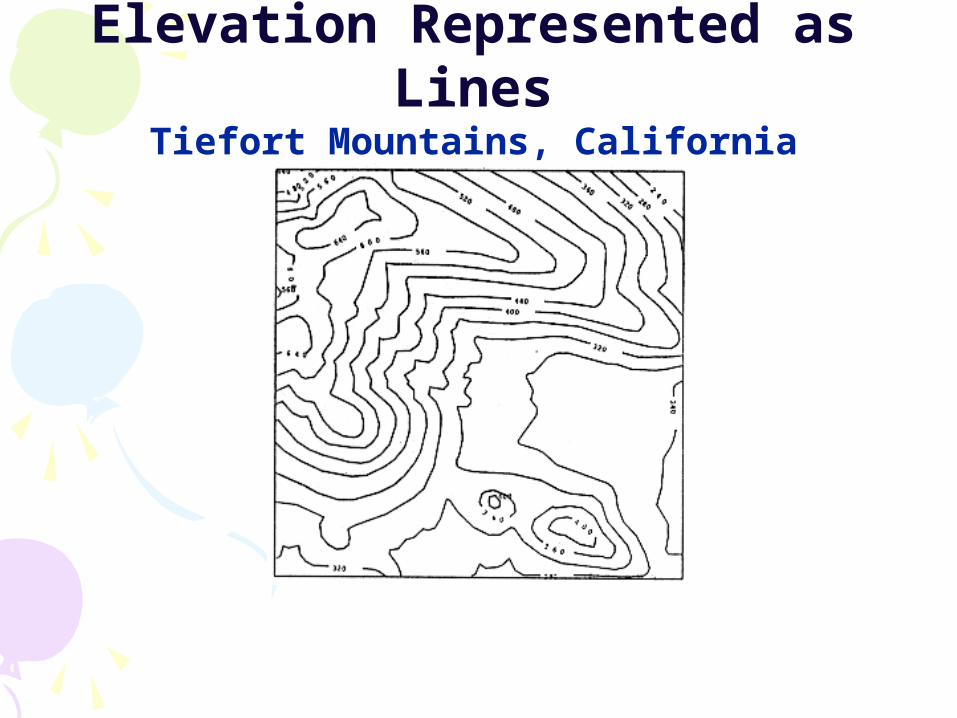
Elevation Represented as LinesTiefort Mountains, California
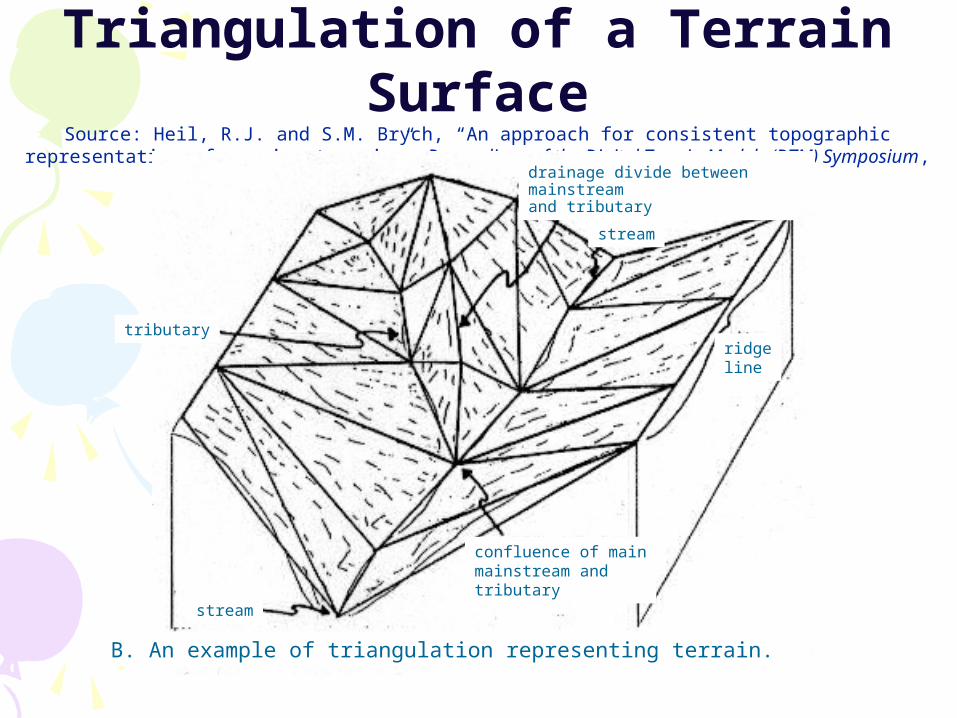
Triangulation of a Terrain SurfaceSource: Heil, R.J. and S.M. Brych, “An approach for consistent topographic representation of varying terrain”, Proceedings
of the Digital Terrain Models (DTM) Symposium, Falls Church, VA: ASP and ACSM, 1978, p. 408, Figure 4b.
drainage divide between mainstreamand tributary
stream
ridgeline
confluence of mainmainstream andtributary
stream
tributary
B. An example of triangulation representing terrain.
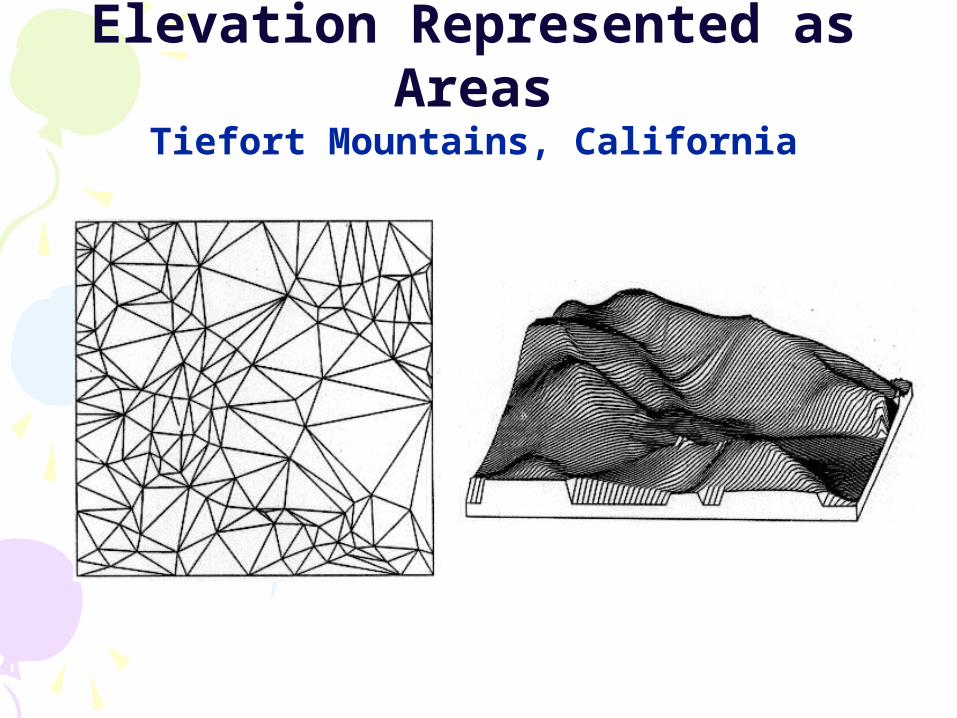
Elevation Represented as AreasTiefort Mountains, California
Functions are scattered between:•Spatial Analyst (in Arc Map)•3D Analyst (in Arc Map)•ArcScene
------Using GIS--Introduction to GIS
Terrain Analysis in Arc GIS
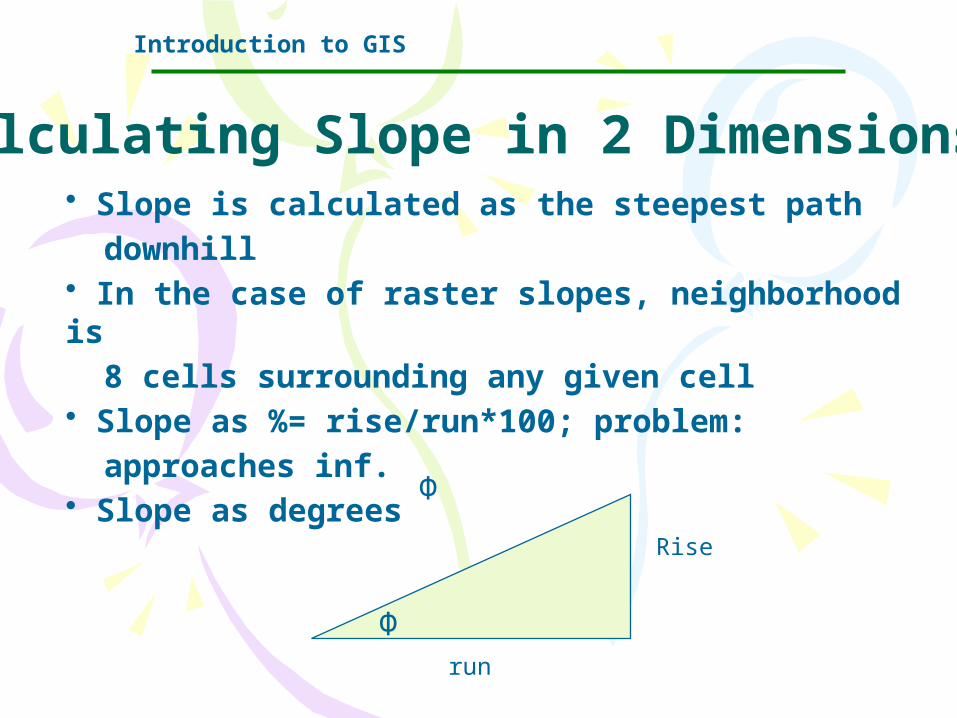
• Slope is calculated as the steepest path downhill• In the case of raster slopes, neighborhood is 8 cells surrounding any given cell• Slope as %= rise/run*100; problem: approaches inf. • Slope as degrees
------Using GIS--Introduction to GIS
Calculating Slope in 2 Dimensions
Φ
Rise
run
Φ
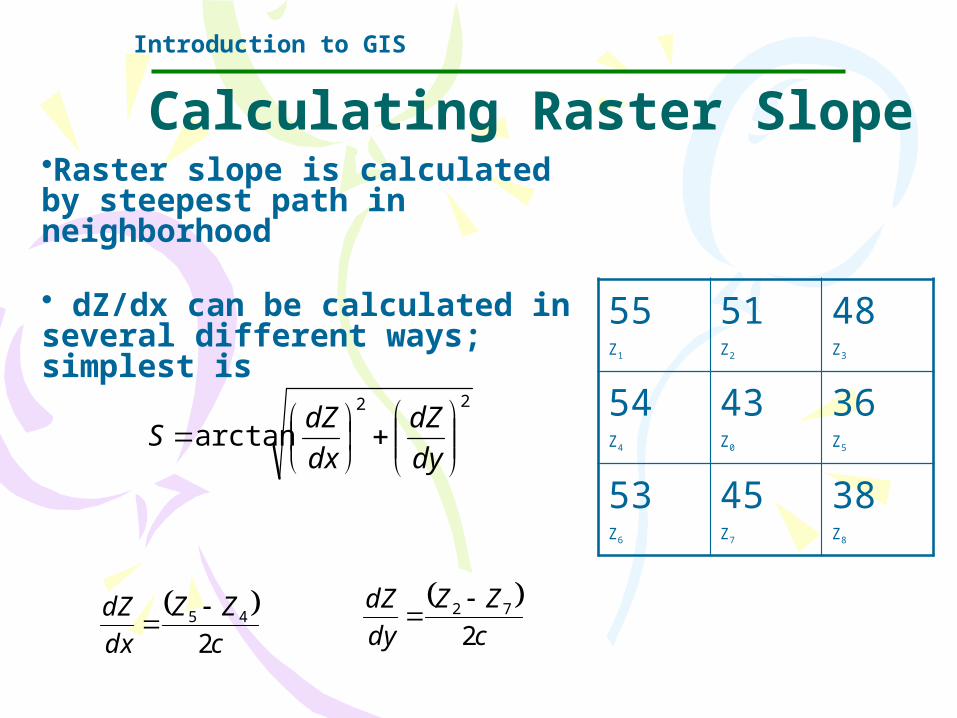
•Raster slope is calculated by steepest path in neighborhood
• dZ/dx can be calculated in several different ways; simplest is
------Using GIS--Introduction to GIS
Calculating Raster Slope
55Z1
51Z2
48Z3
54Z4
43Z0
36Z5
53Z6
45Z7
38Z8
22
arctan
dydZ
dxdZS
cZZ
dxdZ
245
cZZ
dydZ
272
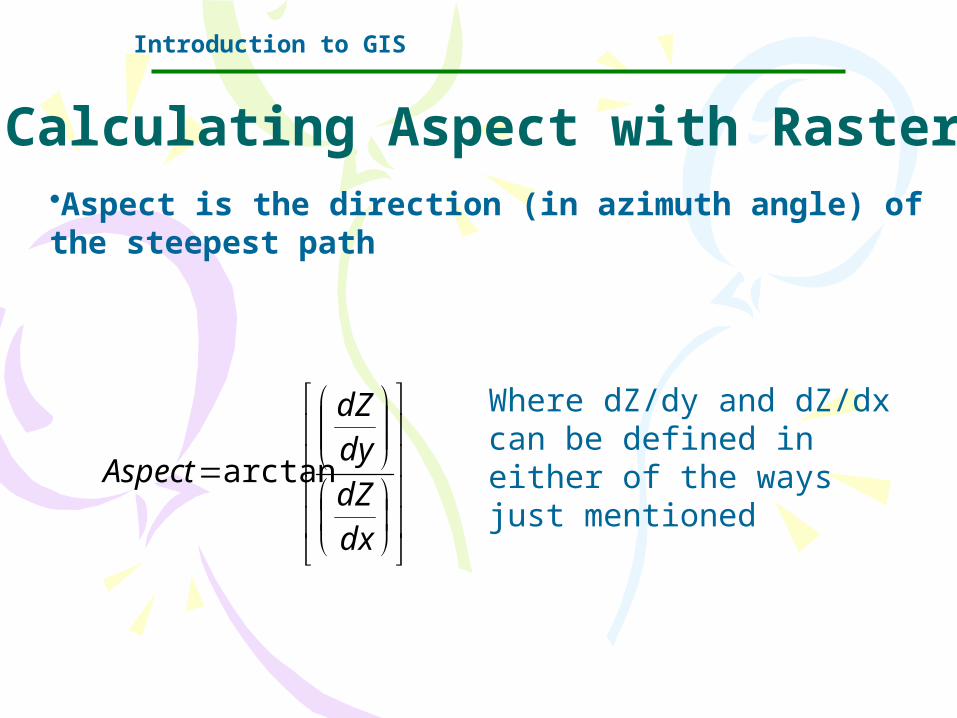
•Aspect is the direction (in azimuth angle) of the steepest path
------Using GIS--Introduction to GIS
Calculating Aspect with Raster
dxdZdydZ
Aspect arctan
Where dZ/dy and dZ/dx can be defined in either of the ways just mentioned
•Can be used for many hydrologic functions such as flow direction analysis, watershed generation and drainage network analysis
•One frequent problem with elevation data are pits or sinks which are cells that are lower than surrounding cells, usually because of random error in DEM
------Using GIS--Introduction to GIS
Uses of Slope and Aspect
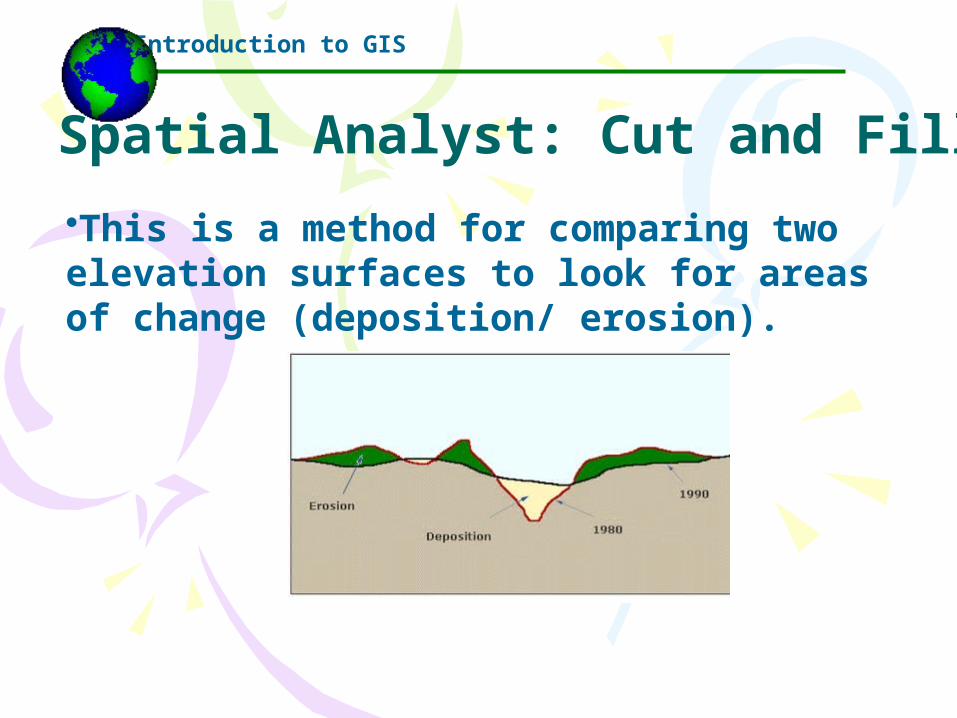
•This is a method for comparing two elevation surfaces to look for areas of change (deposition/ erosion).
------Using GIS--Introduction to GIS
Spatial Analyst: Cut and Fill
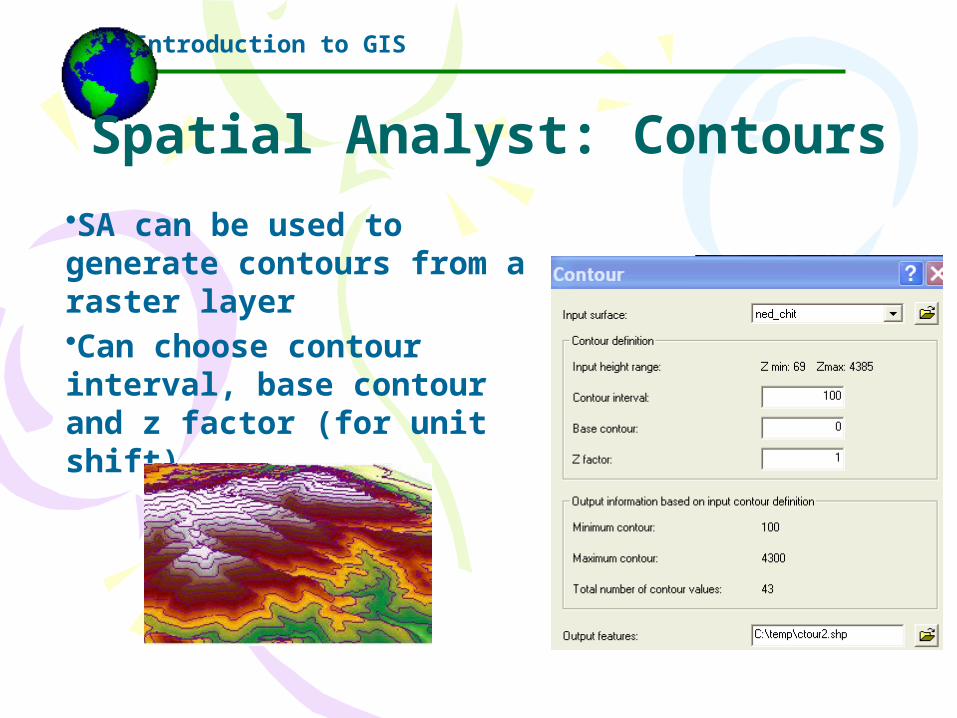
•SA can be used to generate contours from a raster layer •Can choose contour interval, base contour and z factor (for unit shift)
------Using GIS--Introduction to GIS
Spatial Analyst: Contours
•TIN stands for Triangulated Irregular Network•A TIN is a data structure that defines geographic space as a set of contiguous, non-overlapping triangles, which vary in size and angular proportion. •Like grids, TINs are used to represent elevation surfaces, and can be created directly from files of elevation sample points, but with TINs these sample points are irregularly distributed.
------Using GIS--Introduction to GIS
TIN
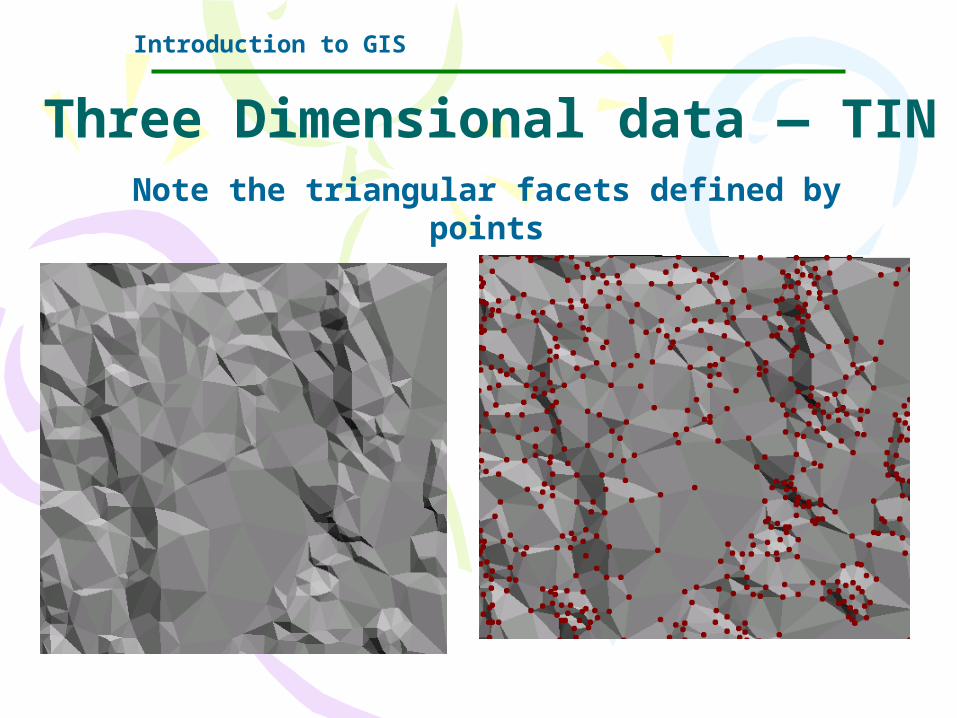
Note the triangular facets defined by
points
------Using GIS--Introduction to GIS
Three Dimensional data — TIN
------Using GIS--Introduction to GIS
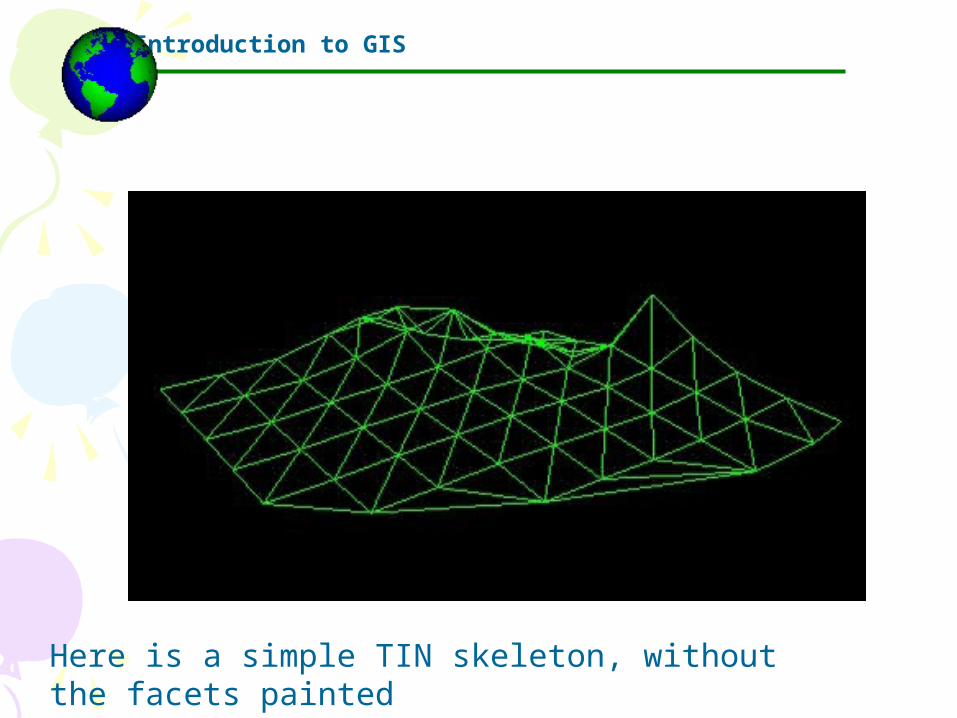
Here is a simple TIN skeleton, without the facets painted
------Using GIS--Introduction to GIS
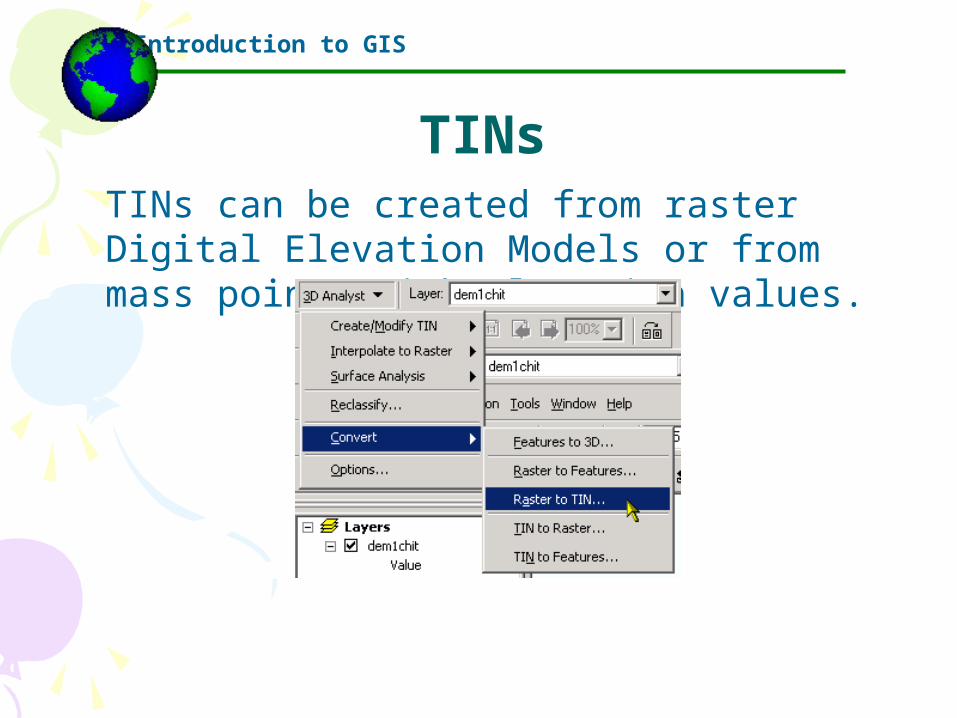
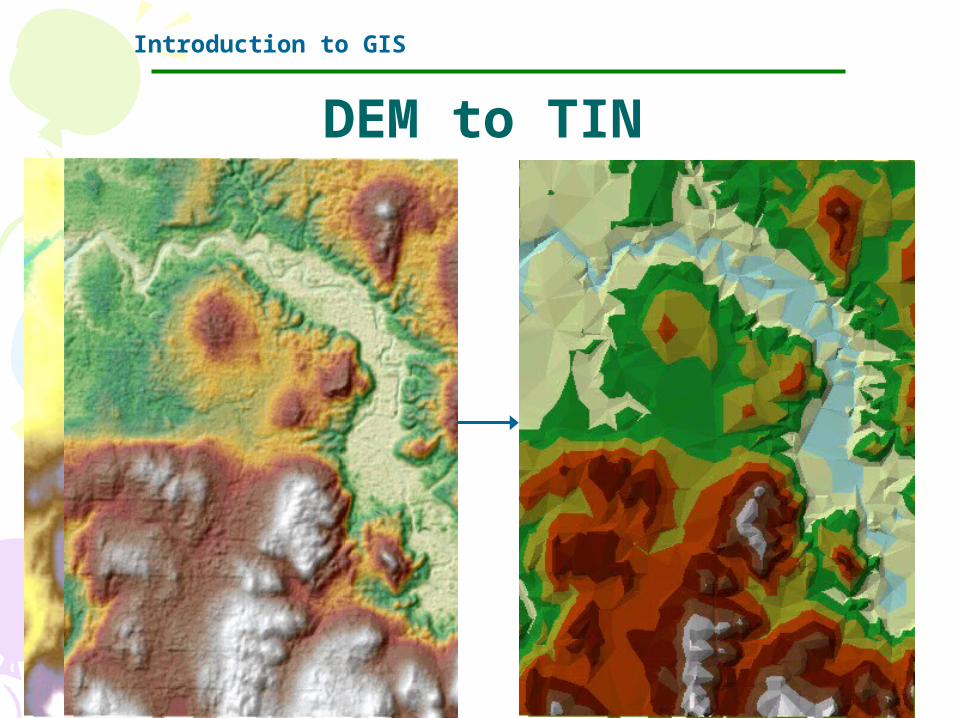
TINs can be created from raster Digital Elevation Models or from mass points with elevation values.
TINs

------Using GIS--Introduction to GIS
• TIN triangles vary in size with the complexity of the terrain; more complex terrain needs more smaller triangles, and hence more points
TINs
------Using GIS--Introduction to GIS
DEM to TIN
------Using GIS--
Introduction to GIS
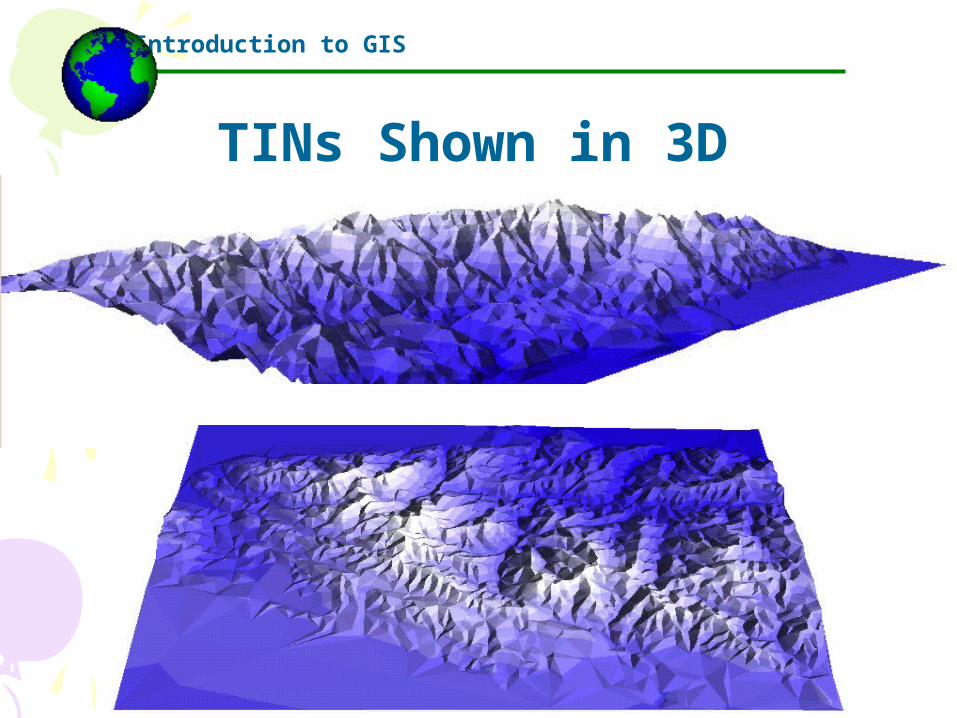
TINs Shown in 3D
------Using GIS--
Introduction to GIS
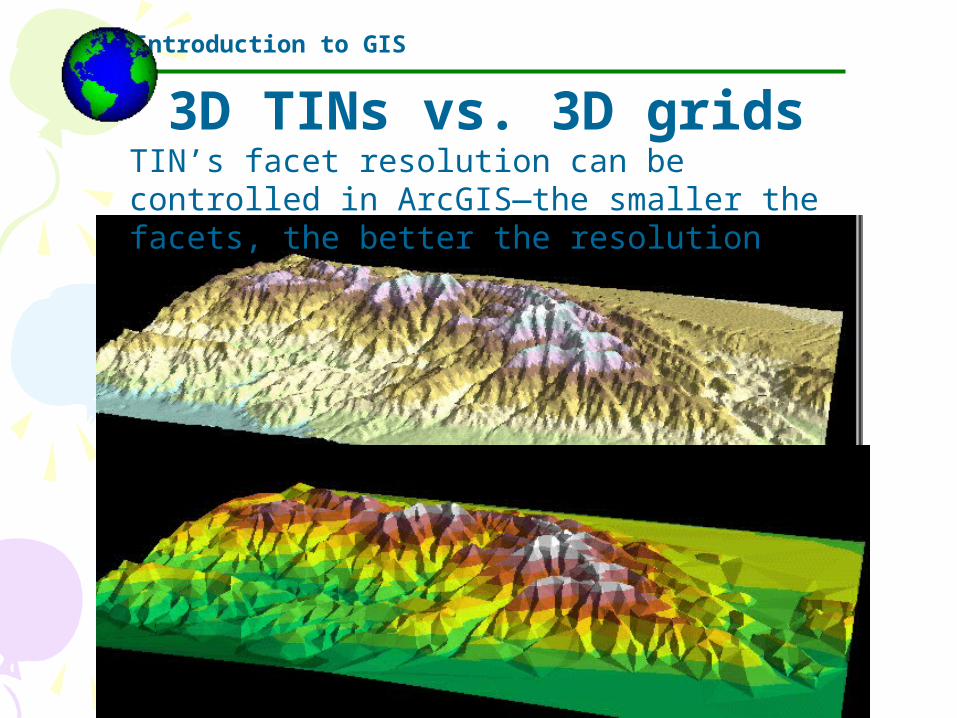
3D TINs vs. 3D gridsTIN’s facet resolution can be controlled in ArcGIS—the smaller the facets, the better the resolution
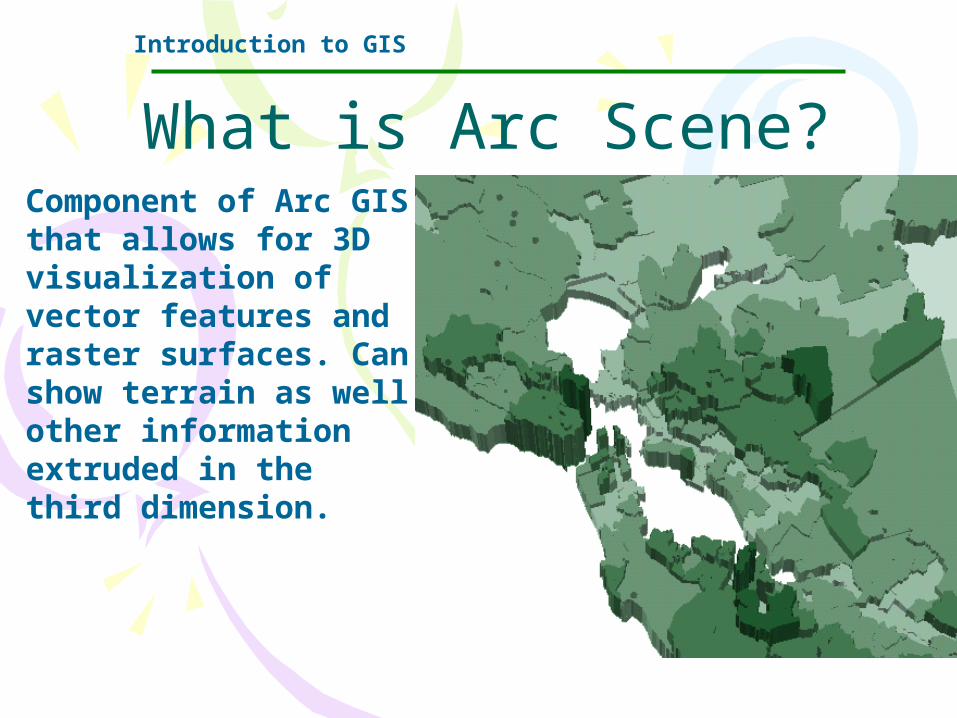
Component of Arc GIS that allows for 3D visualization of vector features and raster surfaces. Can show terrain as well other information extruded in the third dimension.
------Using GIS--Introduction to GIS
What is Arc Scene?
------Using GIS--
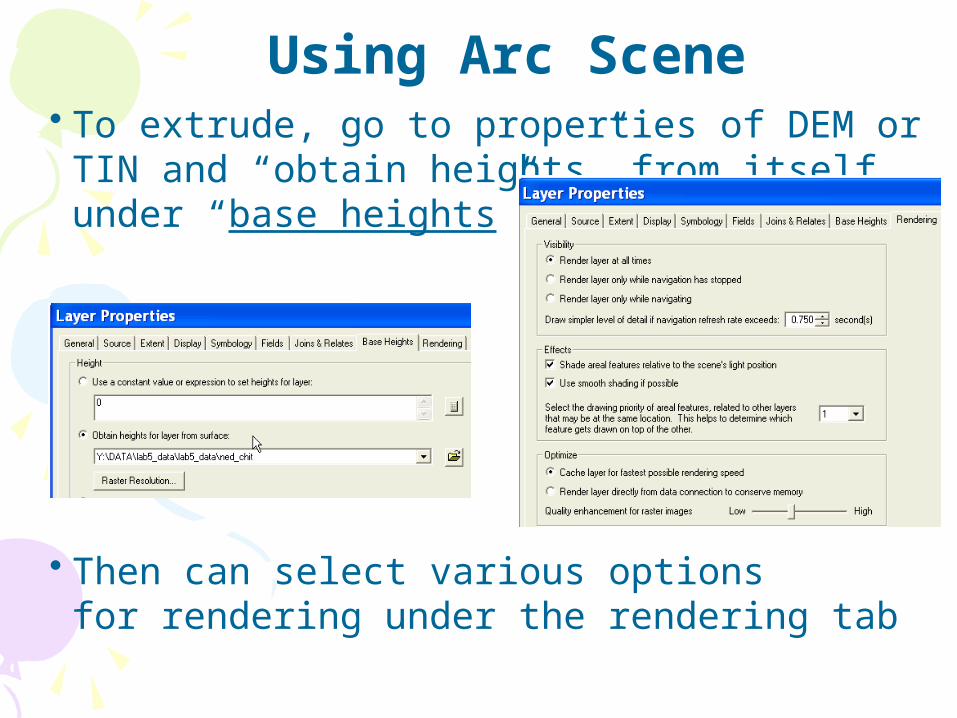
Using Arc Scene• To extrude, go to properties of DEM or TIN and “obtain
heights” from itself under “base heights”
• Then can select various options for rendering under the rendering tab
------Using GIS--
Introduction to GIS
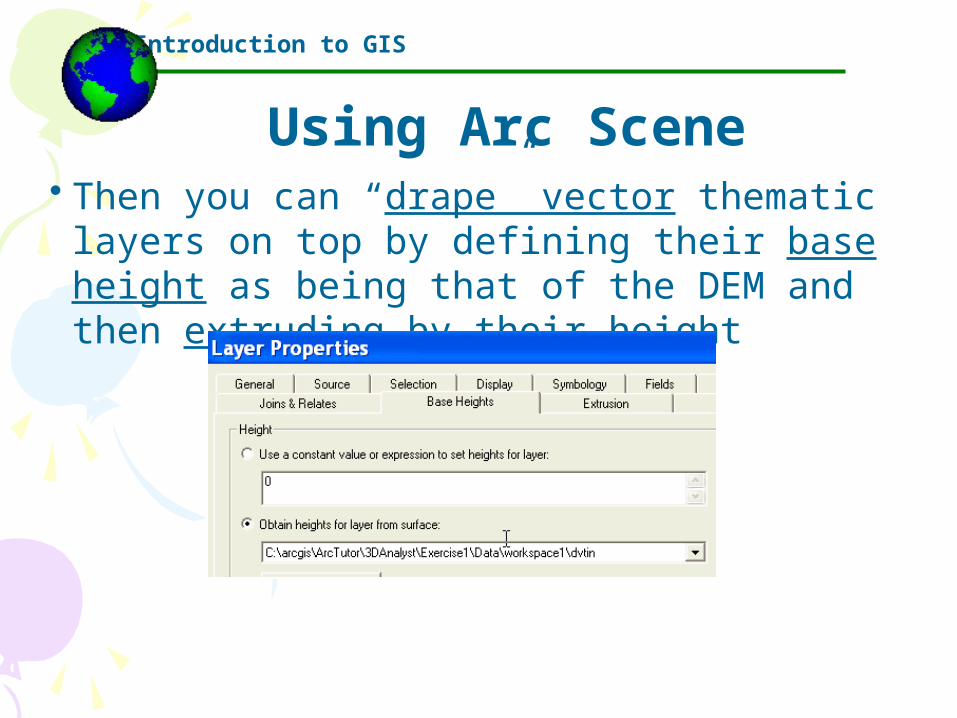
Using Arc Scene• Then you can “drape” vector thematic layers on top by
defining their base height as being that of the DEM and then extruding by their height
------Using GIS--
Introduction to GIS
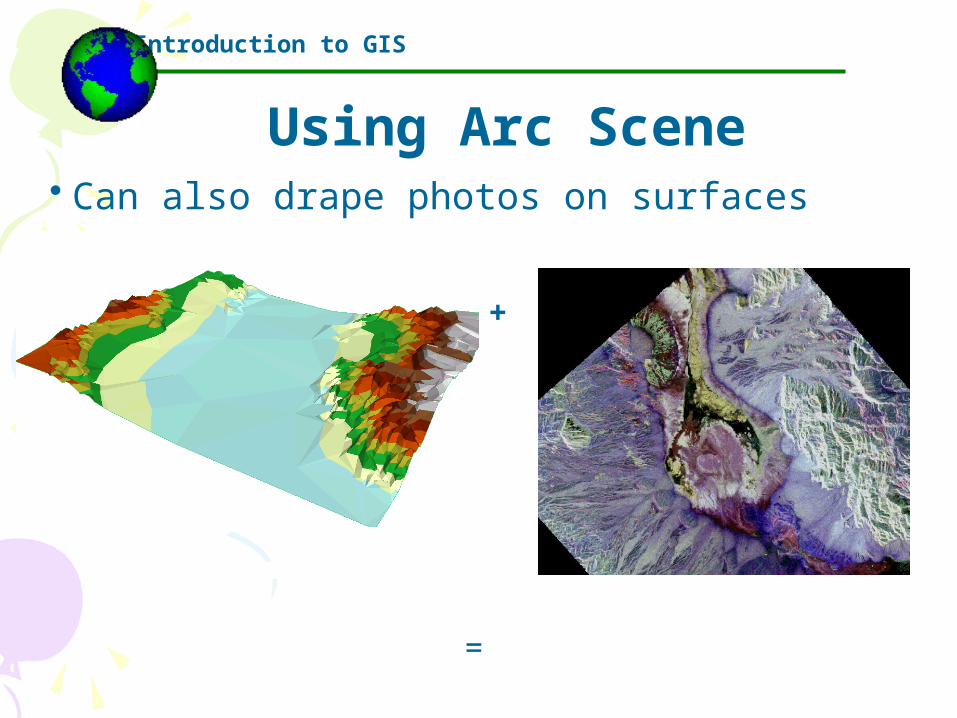
Using Arc Scene• Can also drape photos on surfaces
+
=
------Using GIS--
Introduction to GIS
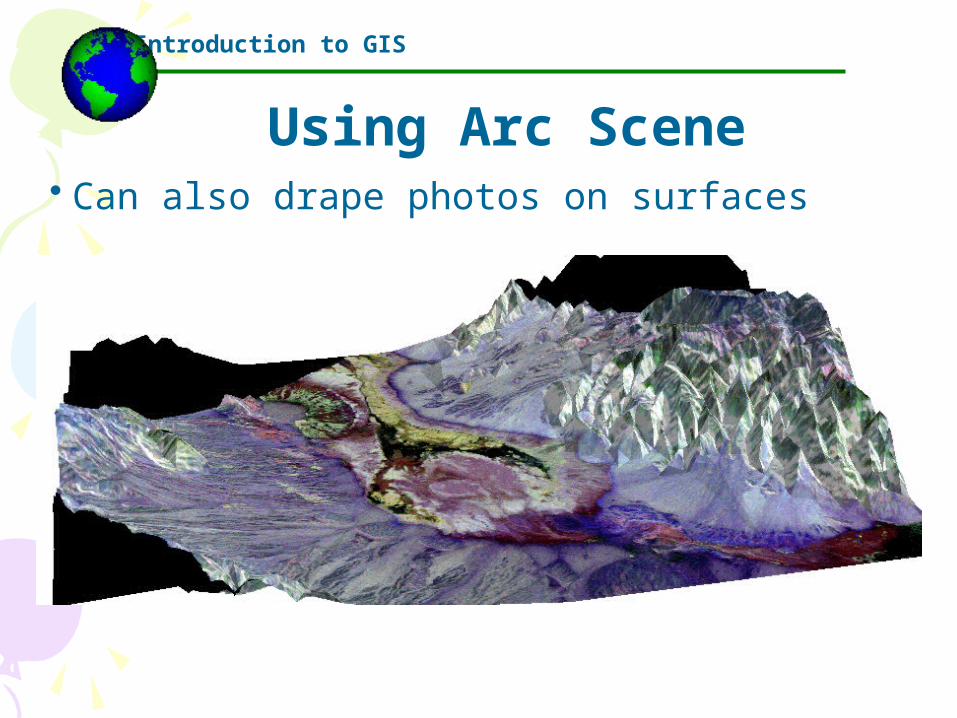
Using Arc Scene• Can also drape photos on surfaces
------Using GIS--
Introduction to GIS
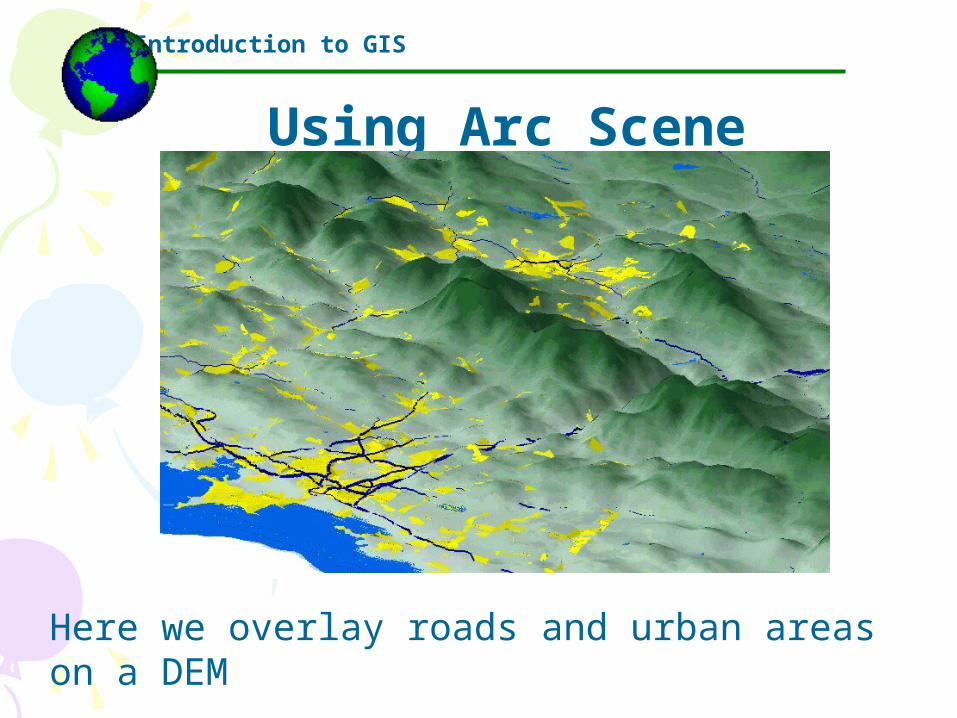
Using Arc Scene
Here we overlay roads and urban areas on a DEM
------Using GIS--
Introduction to GIS
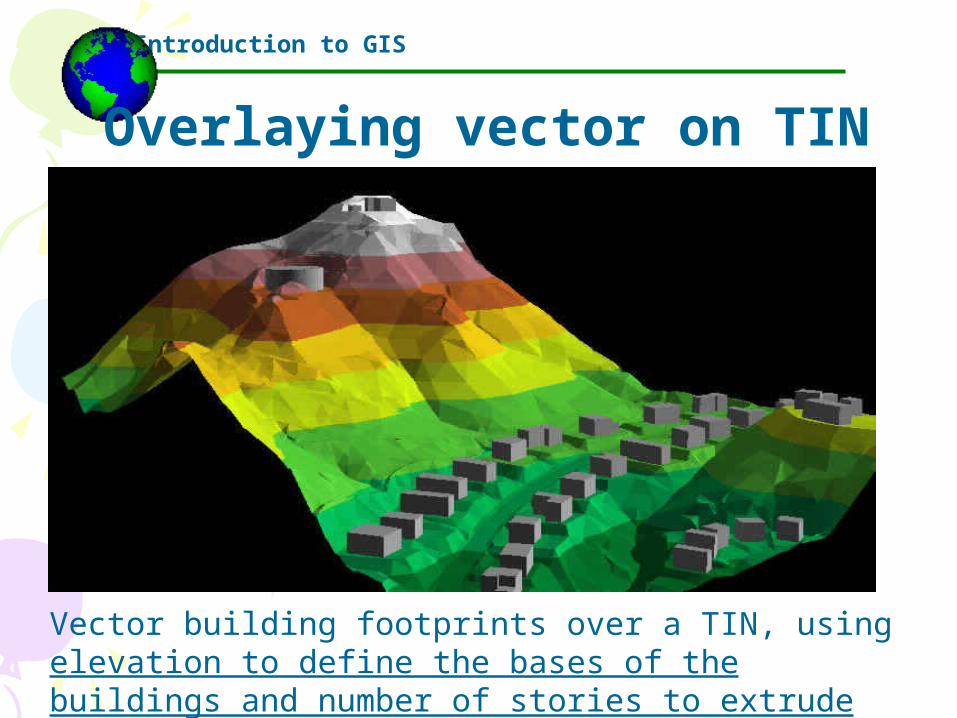
Overlaying vector on TIN
Vector building footprints over a TIN, using elevation to define the bases of the buildings and number of stories to extrude them
------Using GIS--
Introduction to GIS
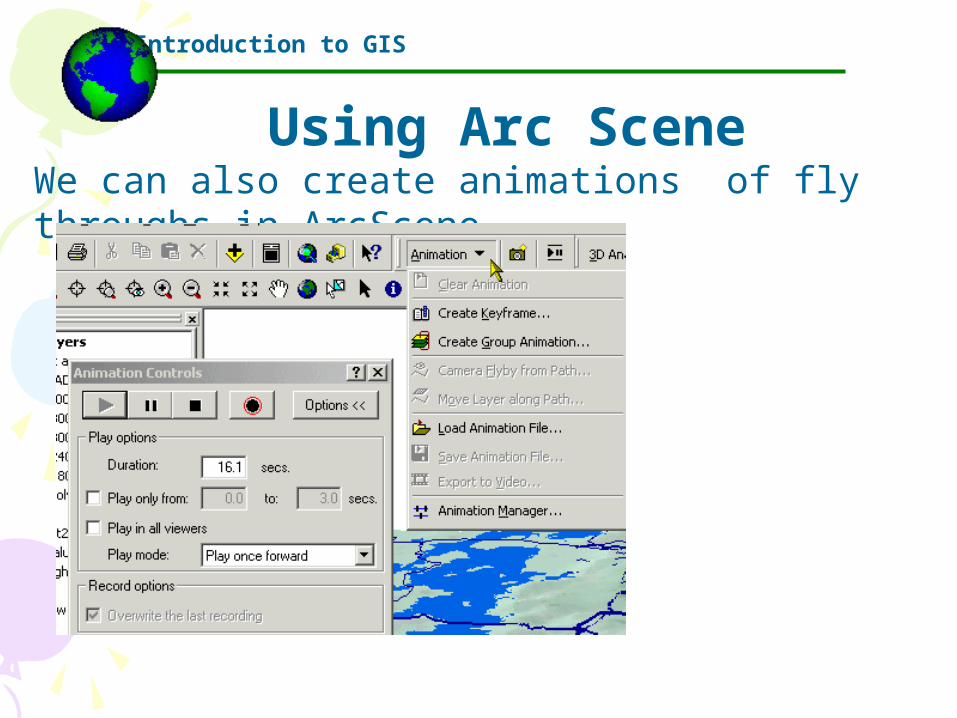
Using Arc SceneWe can also create animations of fly throughs in ArcScene
------Using GIS--Introduction to GIS
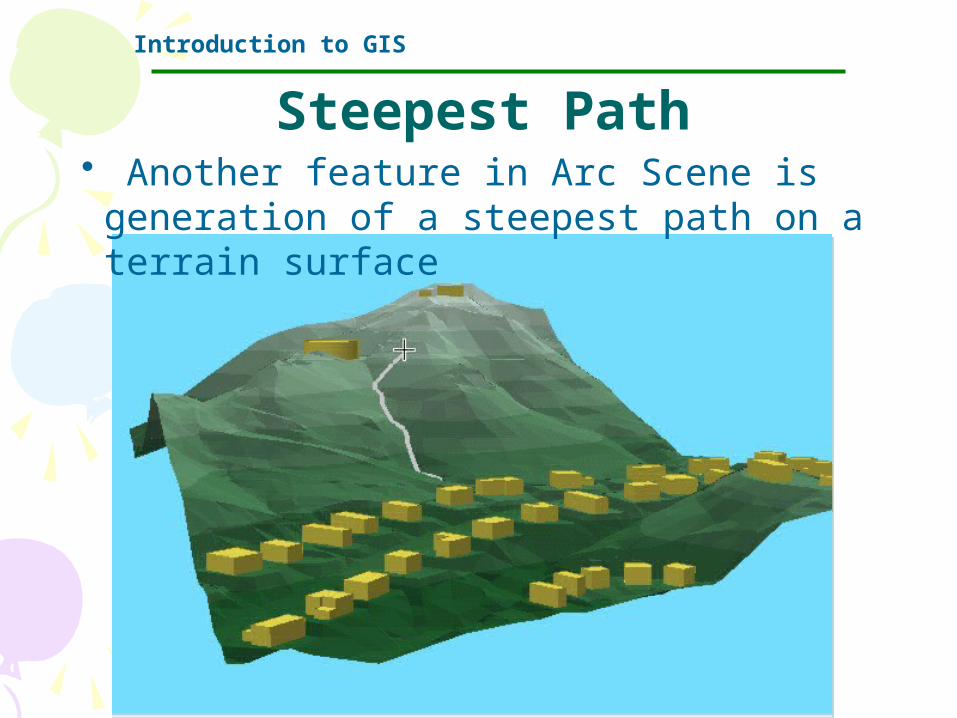
Steepest Path• Another feature in Arc Scene is generation of a
steepest path on a terrain surface
------Using GIS--
Introduction to GIS
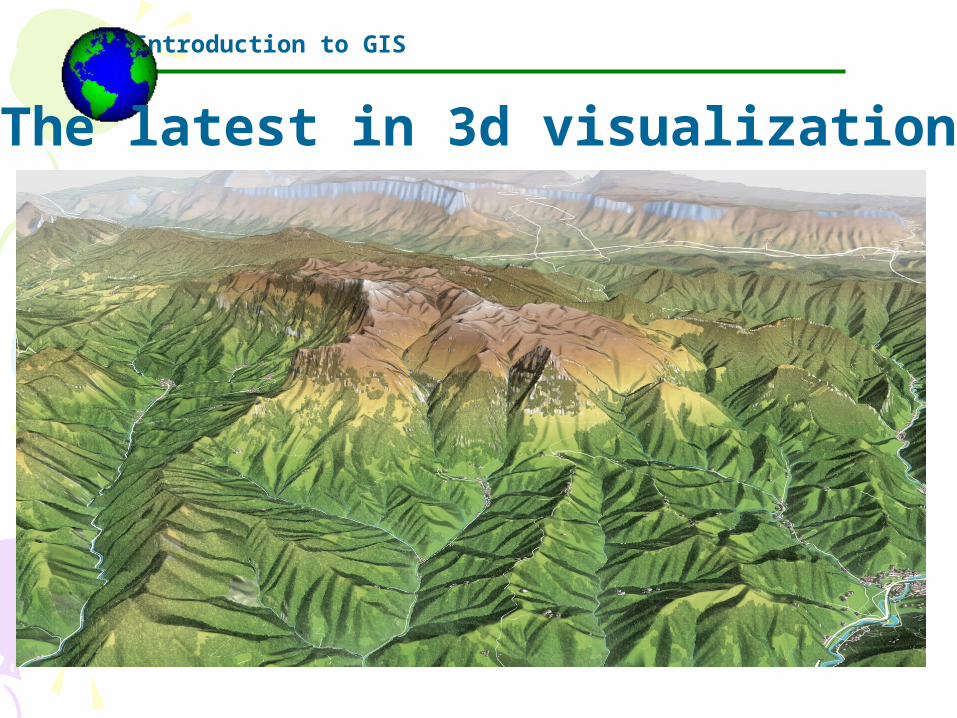
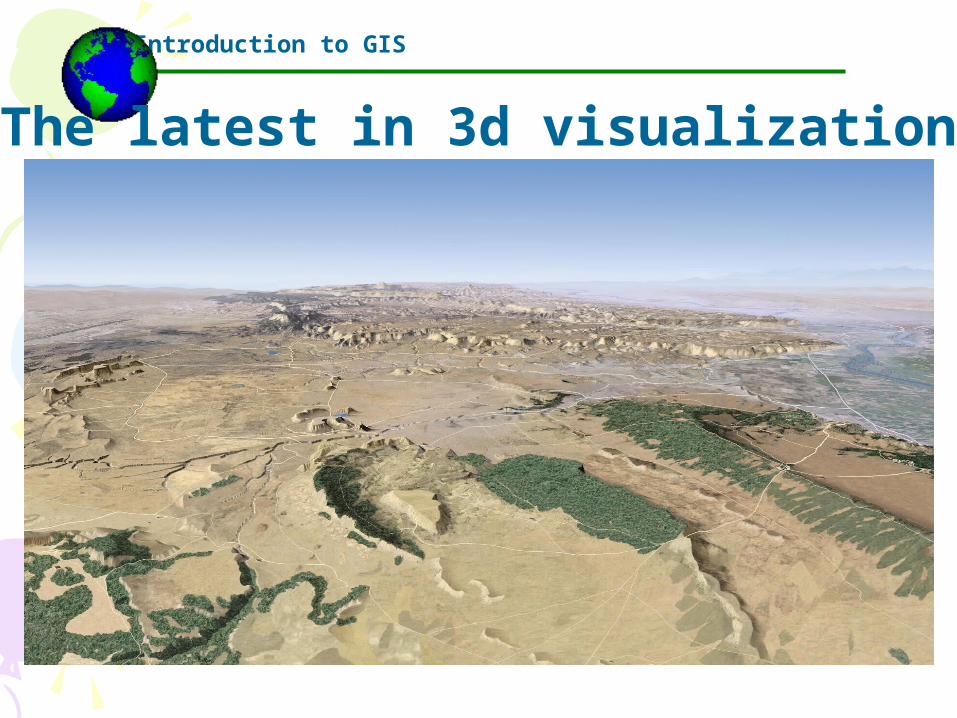
The latest in 3d visualization
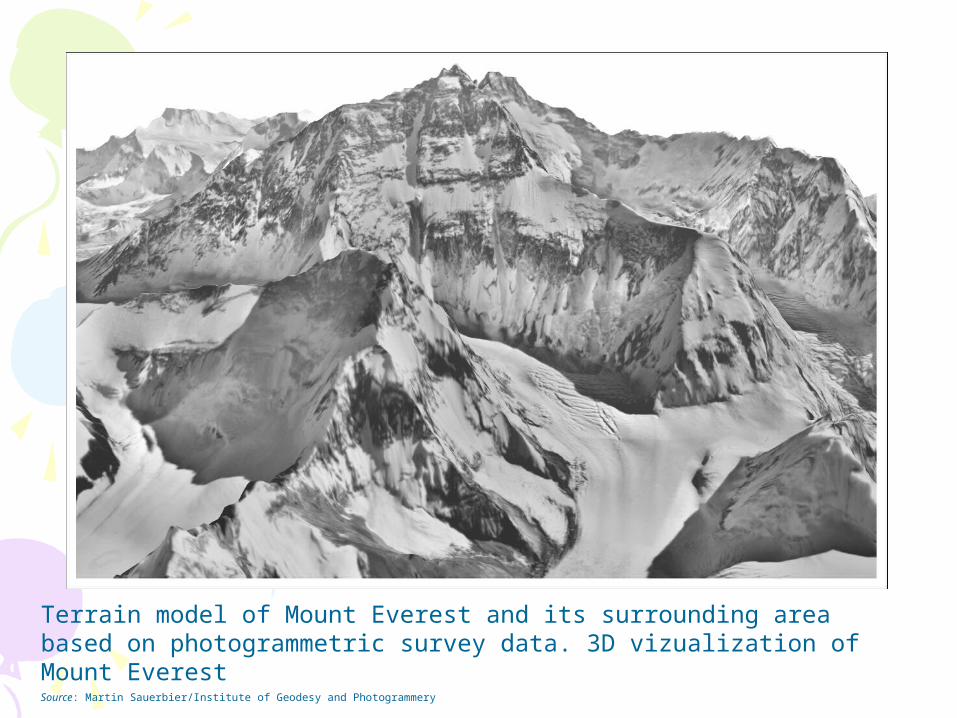
Terrain model of Mount Everest and its surrounding area based on photogrammetric survey data. 3D vizualization of Mount EverestSource: Martin Sauerbier/Institute of Geodesy and Photogrammery
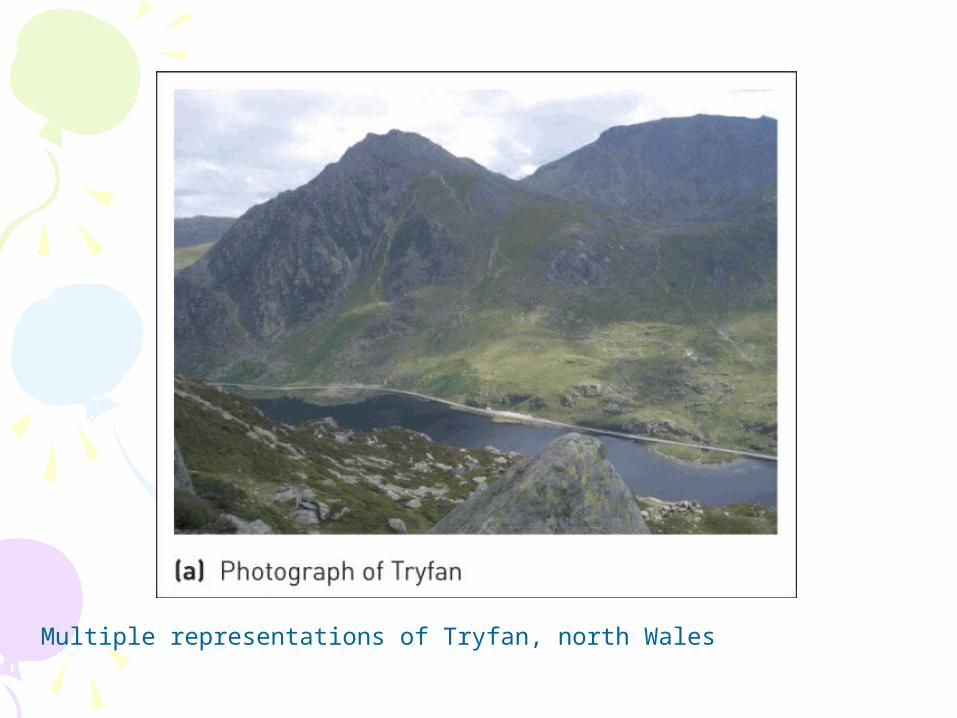
Multiple representations of Tryfan, north Wales

Figure 10.7 Multiple representations of Tryfan, north Wales (Continued)
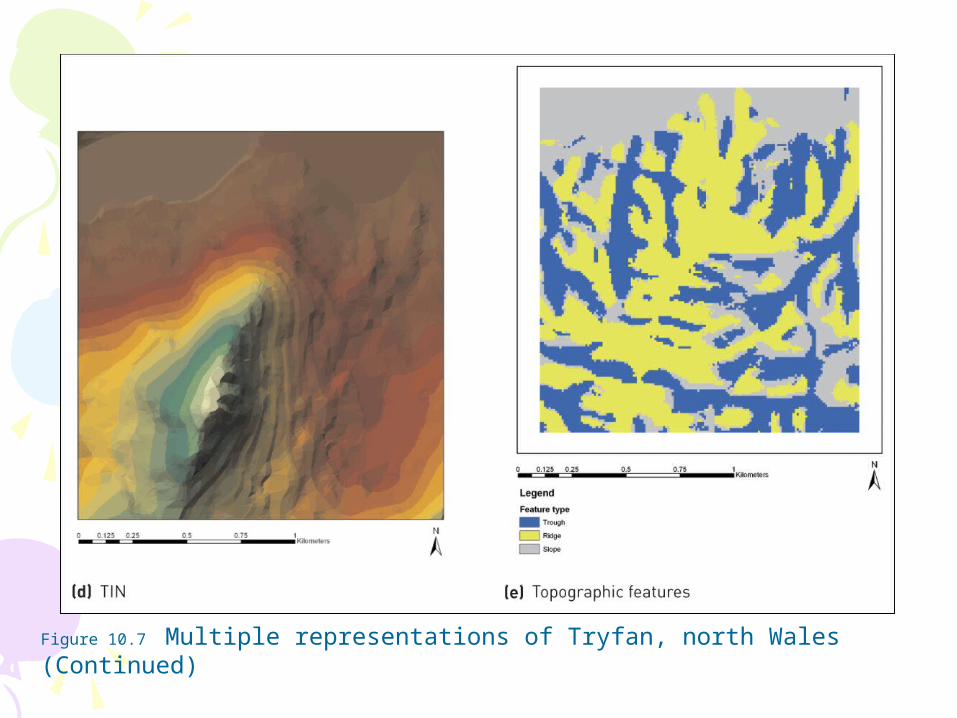
Figure 10.7 Multiple representations of Tryfan, north Wales (Continued)
------Using GIS--
Introduction to GIS
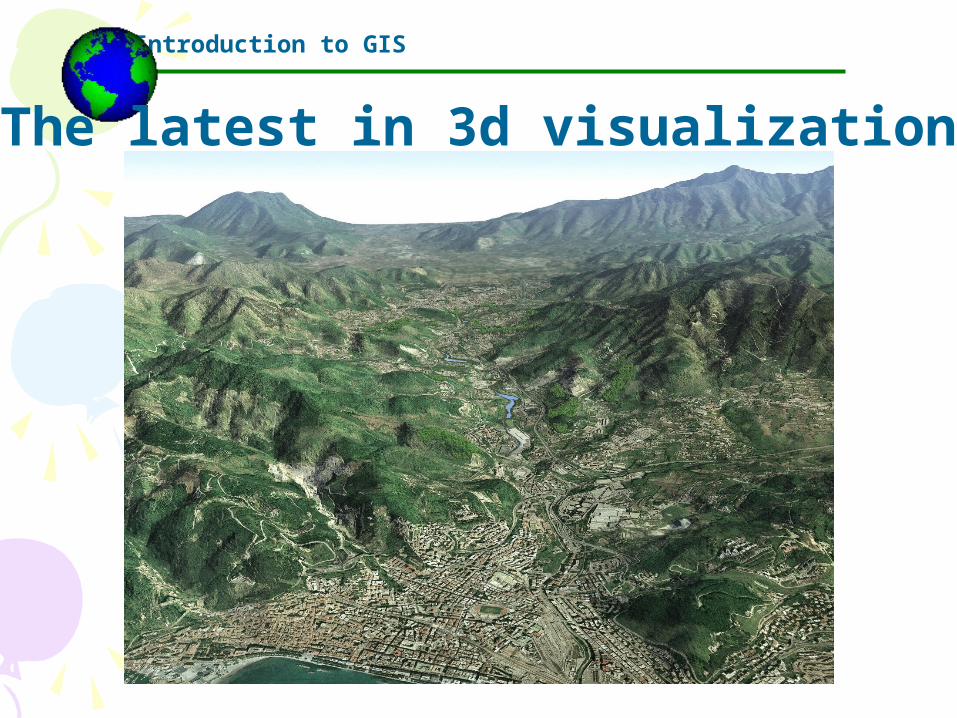
The latest in 3d visualization
------Using GIS--
Introduction to GIS
The latest in 3d visualization
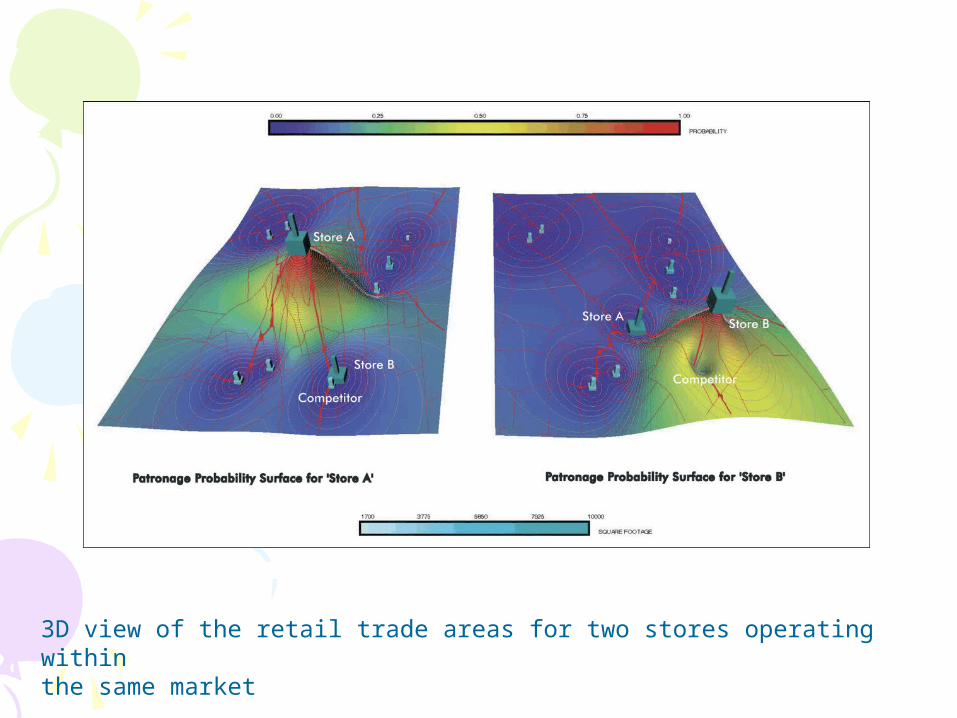
3D view of the retail trade areas for two stores operating withinthe same market
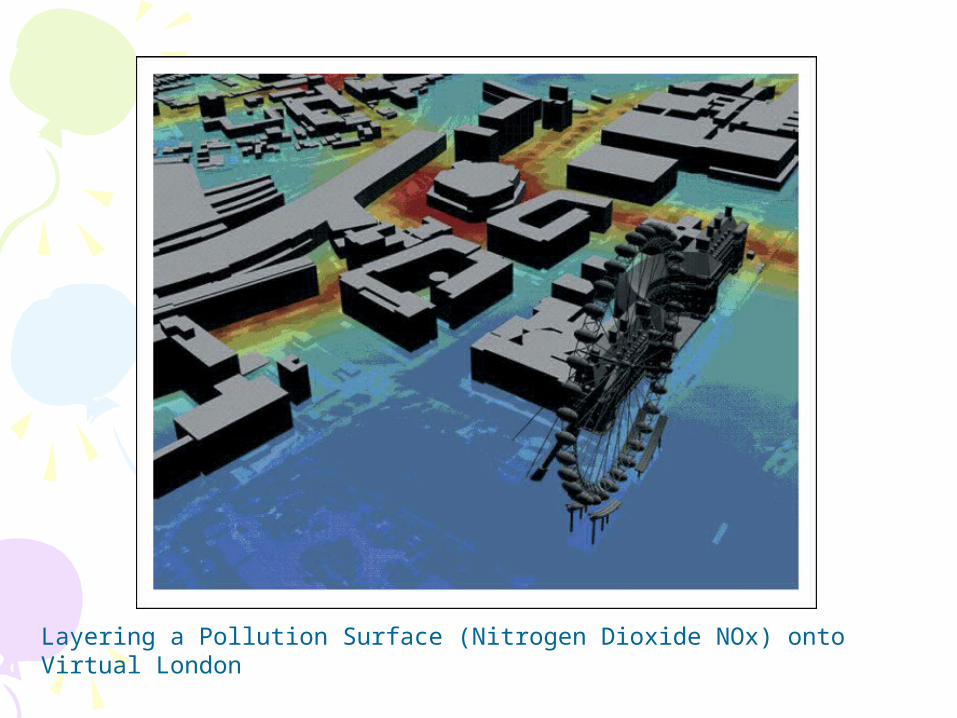
Layering a Pollution Surface (Nitrogen Dioxide NOx) onto Virtual London
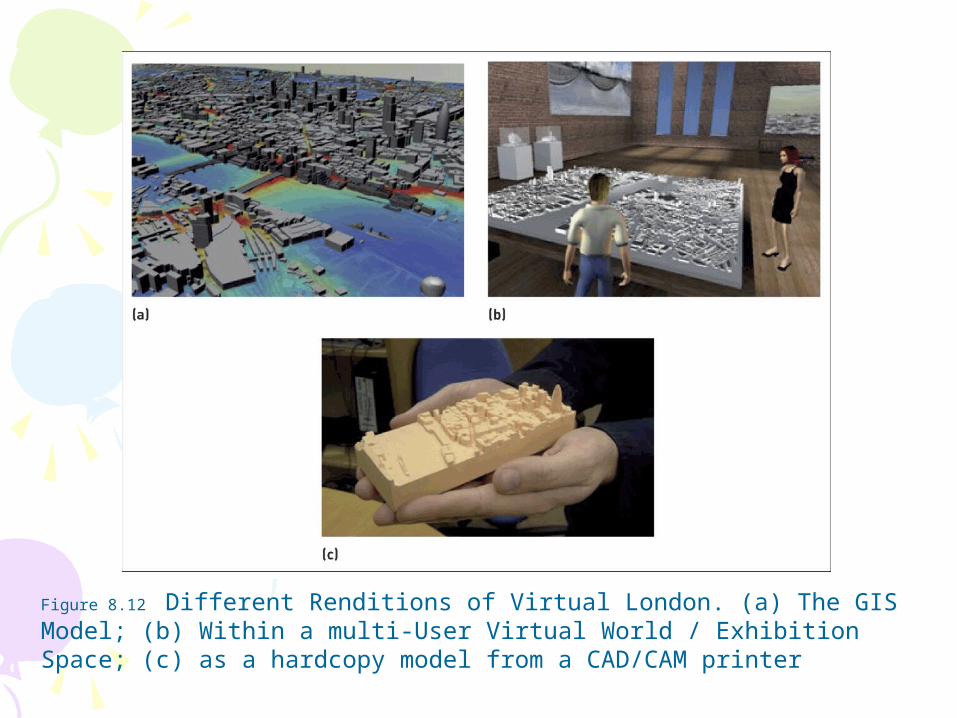
Figure 8.12 Different Renditions of Virtual London. (a) The GIS Model; (b) Within a multi-User Virtual World / Exhibition Space; (c) as a hardcopy model from a CAD/CAM printer
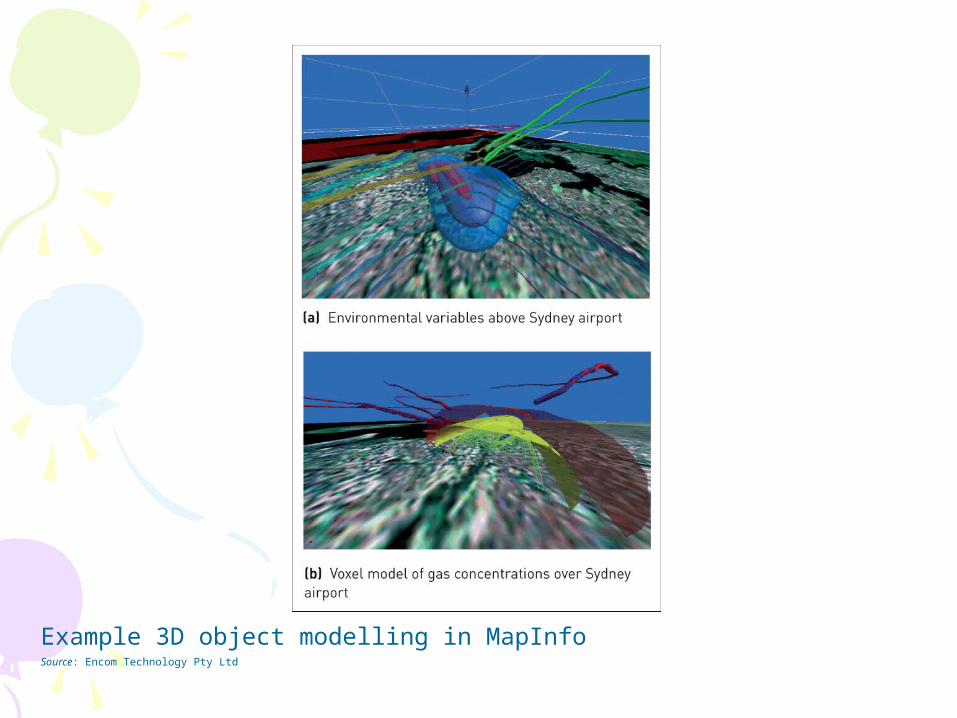
Example 3D object modelling in MapInfoSource: Encom Technology Pty Ltd
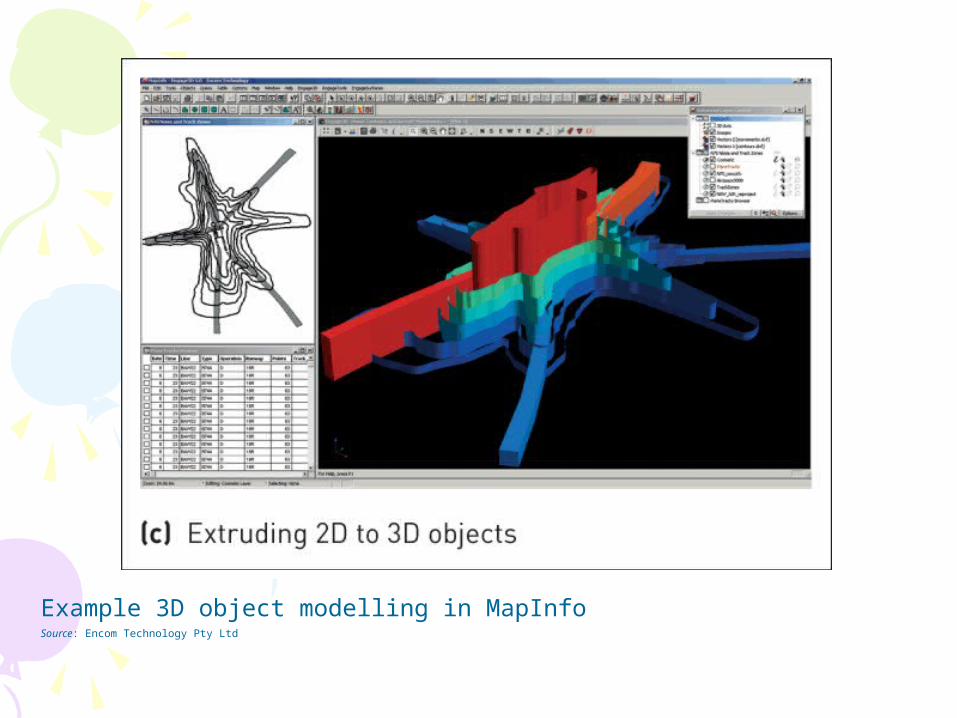
Example 3D object modelling in MapInfoSource: Encom Technology Pty Ltd