tero reunanen leaders’ conscious experience towards …
TRANSCRIPT

TERO REUNANEN
LEADERS’ CONSCIOUS EXPERIENCE TOWARDS TIME
Master of Science Thesis
Prof. Hannu Vanharanta and Prof. Jussi Kantola have been appointed as examiners at the Council Meeting of the Faculty of Business and Build Environment on February 6th, 2013.

i
ABSTRACT
TAMPERE UNIVERSITY OF TECHNOLOGY Master’s Degree Programme in Industrial Management REUNANEN, TERO: Leaders’ conscious experience towards time Master of Science Thesis, 81 pages March 2013 Major: Industrial management and engineering Examiner(s): Professor Hannu Vanharanta, Professor Jussi Kantola Keywords: Leadership, management, time, time management, decision support, organization, development, situationality, personal development, fuzzy logic Time is the key resource in modern business. Every other resource can be added or reduced but time is imperative. Other resources such as personnel, capital or facilities are also crucial, but their usage is always time dependent. People’s productivity is heavily related to their time usage. On the one hand, some people can be very productive in a very short time period, even when work is not very efficient, and on the other hand, a person who is very efficient and works very much may even damage the organization. Therefore, organizations and especially leaders should focus on where they use their time. Time is not an easy concept to handle or even perceive. Time has many different faces towards people. The challenge is that chronological time is not suitable for everybody. Individuals experience time differently to one another and different situations can change the experience. Therefore, it is hard to have schedules to match or plans to actualize within a scheduled time. Business is normally done and agreed in terms of chronological time and the work is divided for specialists into smaller and smaller portions. Consequently, it is crucial for organizations to understand how its members experience their time and how time can be taken into account. This thesis will build an ontology for time in leadership regarding literature research. Literature research reveals the necessity of time in leadership theories and business culture. Features which should be taken into account in personal development are delivered from the time ontology. Propositions are then derived from these features. The thesis will also show how a decision-support system can be made from propositions for leaders’ personal development. The empirical part consists of testing and analyzing the system’s capability and usability. Future research suggestions are also proposed.

ii
TIIVISTELMÄ
TAMPEREEN TEKNILLINEN YLIOPISTO Tuotantotalouden koulutusohjelma REUNANEN, TERO: Johtajien tietoinen aikakokemus Diplomityö, 81 sivua Maaliskuu 2013 Pääaine: Tuotantotalous Tarkastajat): Professori Hannu Vanharanta, Professori Jussi Kantola Avainsanat: Johtajuus, aika, ajanhallinta, johtaminen, päätöksen teon tukijärjestelmät, henkilökohtainen kehitys, kehittäminen, organisaatio, tilannesidonnaisuus Johtajat kohtaavat päivittäisessä työssään jatkuvasti tilanteita, joissa he joutuvat tekemään päätöksiä puutteellisen informaation varassa. Kokenut ja mieleltään avoin johtaja joka ymmärtää sekä omat että organisaation vahvuudet, heikkoudet ja rajoitteet sekä vallitsevan ympäristön pystyy tekemään todennäköisesti enemmän oikeita päätöksiä kuin vääriä. Johtajilla ei kuitenkaan ole aikaa enempää käytettävissään kuin muillakaan henkilöillä, vaikka heidän päätöstensä taustalla pitäisi olla kattavin näkemys koko organisaatiosta, tai siitä osasta jota hän johtaa, sen toiminnasta ja ympäristöstä. Johtamistapoihin sekä johtajuuteen liitetään hyvin paljon odotuksia ja vaatimuksia sekä oletuksia. Mitä johtajien siis pitäisi tehdä jotta kaikki liikenevä aika kulutettaisiin parhaalla mahdollisella tavalla? Aika on erittäin haastava ja abstrakti käsite jonka jokainen tietää mutta kukaan ei koe sitä täysin samalla tavalla kuin toinen. Nykyisessä liiketoimintaympäristössä työtä jaetaan kuitenkin pienempiin osiin jolloin kokonaisuuden synkronointi on tärkeämpää kuin koskaan. Ihmisen aikakäsitys eroaa huomattavasti kronologisesta ajasta ja kokemus on vahvasti tilannesidonnainen. Henkilön aikakäsitys on siis erilainen eri tilanteissa. Miten tämä voidaan ottaa huomioon suunnitelmissa, johtamisessa ja henkilöstön kehittämisessä? Mitkä tekijät muuttavat ihmisten aikakäsitystä ja miten ne voidaan ottaa huomioon? Työssä rakennetaan aikaontologia kirjallisuustutkimuksen perusteella. Ontologiasta johdetaan määreitä, jotka vaikuttavat henkilön aikakäsitykseen. Näistä määreistä johdetaan väittämiä, joiden avulla voidaan arvioida määreen vaikutuksen suuruutta henkilön tilanteessa. Lopuksi kehitetään tutkimus- ja päätöksenteontukityökalu, jonka avulla voidaan arvioida johtajan valmiuksia, puutteita ja näkökulmia itsensä sekä organisaationsa tilanteesta, ajankäytöstä ja aikakokemusta vinouttavista tekijöistä. Työkalun avulla johtajat voivat arvioida omaa aikakäsitystään ja mahdollisuuksiaan parantaa omaa sekä organisaationsa ajanhallintaa. Lisäksi esitetään tulevia tutkimushaasteita ja mahdollisuuksia.

iii
PREFACE
Time has always been a tricky partner for me. I have recognized that somehow time has passed very quickly. The reason might be that I have always been very impatient to see what happens next. In other words, the world has been changing too slowly for me. On the other hand, I graduated as a Bachelor of Engineering when I was 29 years old and am now graduating as a Master of Science at the age of 33 (and I have achieved 443 ECTS points during these degrees). Both ages are much older than the mean ages for graduates and both have been done while working fulltime. I have worked in various different professions during my life, as a construction worker, mechanical and electrical technician, truck driver, mechanical engineer and designer, project manager, leader of an R&D team, consultant and entrepreneur. It is interesting for this thesis that every single one of my jobs has been time-sensitive. Therefore, it has been very rewarding to exploit my quite broad experience in leaders’ time experience research. For me this thesis is a very practical continuum in my life-long development route. The thesis is also very practical in terms of its goals, a theory harnessed to practical business. To quote Kurt Lewin, “There is nothing so practical as a good theory.” I must add “Thank God, I’m familiar with both of them.”
I would like to thank my Professor Hannu Vanharanta for his demanding but very pleasant guidance. He has given me crucial support and a perspective to the most interesting world of science. He also has a special way of building the big picture and is still able to see how details affect that picture. I also want to thank Professor Jussi Kantola, who has been the person helping and guiding me in the technical structuring and implementation of this application. Other professors, lecturers and other personnel from the Pori Unit of Tampere University of Technology deserve my humble thanks too. Their flexibility and professionalism has enabled me to study and work at the same time.
My greatest thanks I would like to give to my wife Aila. She has been keeping our family going during these years when I have been gone most of the time. Without her none of this would have been possible. The biggest commiserations I must give to my children, Julius and Jessica. I’m sorry that I haven’t been with you as much as you or I have wanted. That time we are not able to get back, but let me assure you that the coming time will be better.
Raisio, 3rd March, 2013
Tero Reunanen

iv
TABLE OF CONTENTS
ABSTRACT ..................................................................................... i
TIIVISTELMÄ .................................................................................. ii
PREFACE ...................................................................................... iii
TABLE OF CONTENTS ................................................................. iv
ABBREVIATIONS, TERMS AND NAMES .................................... vii
1. INTRODUCTION ....................................................................... 1
1.1. Background to research ........................................................................ 1
1.2. Research problem and questions ......................................................... 4
1.3. Research strategy ................................................................................ 5
1.4. Inclusions and exclusions of research .................................................. 7
1.5. Execution of research ........................................................................... 8
1.5.1. Data collection and ontology forming ........................................ 9
1.5.2. Features and proposition forming ........................................... 10
1.5.3. Empirical phase ...................................................................... 11
1.6. Ontology ............................................................................................. 12
1.7. Research architecture ......................................................................... 13
2. LEADERS’ CONSCIOUS EXPERIENCE ................................ 15
2.1. Experienced consciousness ............................................................... 15
2.2. Situationality ....................................................................................... 17
2.2.1. Leadership and place ............................................................. 20
2.2.2. Leadership levels and influence ............................................. 20

v
2.3. Leadership approaches ...................................................................... 22
3. TIME ....................................................................................... 27
3.1. Chronological time .............................................................................. 27
3.2. Experienced time ................................................................................ 28
3.2.1. Cultural background ............................................................... 28
3.2.2. Situation ................................................................................. 30
3.2.3. Personal traits ........................................................................ 33
3.3. Time categories .................................................................................. 37
3.4. Recording time ................................................................................... 41
3.5. Managing time .................................................................................... 42
3.5.1. Time management approach .................................................. 44
3.5.2. Managerial time usage ........................................................... 46
3.6. Discretionary time ............................................................................... 50
3.7. Conclusion of time ontology ................................................................ 52
3.8. Structure for demonstrator .................................................................. 54
4. DEMONSTRATOR .................................................................. 56
4.1. Evolute ................................................................................................ 57
4.2. Fuzzy logic .......................................................................................... 57
4.3. Using the demonstrator ...................................................................... 59
4.4. Results from the program ................................................................... 60
4.4.1. Results for test persons .......................................................... 60
4.4.2. Results for researchers .......................................................... 64
5. RESULTS AND DISCUSSION ................................................ 67
5.1. Results ................................................................................................ 67

vi
5.2. Results from the test groups ............................................................... 69
5.3. Validation and verification ................................................................... 72
5.3.1. Feedback from students ......................................................... 72
5.3.2. Feedback from professionals ................................................. 74
5.4. Conclusions ........................................................................................ 75
5.5. Suggestions for future actions ............................................................ 76
BIBLIOGRAPHY ........................................................................... 77

vii
ABBREVIATIONS, TERMS AND NAMES
CEO Chief Executive Officer
C&K Chronos & Kairos
Demonstrator Test application for developing Chronos & Kairos concept to Internet based software application
Discretionary time Time you choose to use however you want
DOCEAR Academic literature suite
EBSCOhost Publishing company and database for scientific literature
Elsevier Publishing company and database for scientific literature
Emerald Publishing company and database for scientific literature
Fuzzy logic Multivalued logic derived from fuzzy-set theory. Reasoning from abstract things.
HCM Holistic Concept of Man
Mind map Diagram used to represent words, ideas, tasks or other items linked together and arranged around central item
PDF Portable Document Format. File format independent from software, hardware or system.
Proposition Content or meaning to which a test person gives weight
Self-time Things you like to do alone such as reading books, watching movies, exercise etc.

1
1. INTRODUCTION
1.1. Background to research
Directors, managers and leaders are persons who make decisions which affect other persons in organizations. This work will use the words director, manager and leader in the meaning of an appointed person who makes such decisions. Even though these words have different meanings, the words are not ranked with regard to each other in this thesis. Nowadays in working life every personnel member makes decisions in organizations and these decisions can affect the whole company to some extent, but when in a managerial position, a person’s decisions affect some personnel group directly. These decisions can e.g. give or reject freedom to make decisions for the target personnel group. As such, managers handle power over the personnel in an organization. Managers should find the most effective way to use this power in order to achieve the best possible solutions, which are most beneficial to the organization in the longer perspective.
Every manager is an individual. There are no two managers who are alike. The number of differences is enormous: they have their own history, level of self-awareness, biases, interests, length of work experience and time frame when they have been building their worldview, i.e. when they were born, to mention just a few. On the one hand, the world is “getting smaller” by globalization; however, there are still big differences between managers who possess a different cultural background and these differences affect their work. All these variables have carved the manager’s personality and working habits. How much these differences change a manager’s behaviour, compared to others, is something that should be studied, as well as how well a manager is able to recognize differences, prevent their possible negative effect or utilize their positive aspects.
Just like managers, every organization is unique. There are no two organizations that are exactly alike. Organizations vary in numerous ways such as size, number of personnel, volume of turnover, number of business units etc. Differences are also to be found in geographical position, value chain position, industry or branch, manufacturing or service type organization, etc. The differences are perceivable when comparing an organization such as a public governmental organization, private capitalist company or non-profit charity organization. The list of possible differences is practically endless. These variables will affect the companies’ capability and possibilities for e.g. change their business arena, industry, size or location. Also, these variables will define and limit the time and scale of changes made. An easy way to visualize the differences is to

2
compare a private shipyard, public daycare unit in a small community and a non-profit Internet page sustenance company. The similarities are harder to find than the differences. According to Gibson (1995), three common tasks for all managers are to be found, regardless of the organization’s field. These activities are: 1) managing work and organizations, 2) managing people, 3) managing production and operations. These activities are not done in isolation. Therefore, it has to be added that activities are done in part of an economic system and environment and they are all bound to physical laws and restricted by a phenomenon called time.
Despite the heterogeneity of the management field, there are still consultants and trainers who argue that there are some miraculous theories or applications which are the cure for any problems in managers’ work. We have all seen adverts which suggest that after one or two sessions, or purchasing this product, your managerial work is moved to a new level and all indicators will show good growth curves. In these cases it must be more a matter of belief and faith than intentional and systematic development. This doesn’t mean that the consultant selling the sessions mentioned above, is necessarily a fraud or charlatan, but it does mean that there are serious dangers when simplifying leadership and management into a single point of view or theory. The consequences of forgetting the impact of trade-offs, situations and a manager or organization’s individual points of development, not to mention biases, can be disastrous.
Most of the managers are well-educated, clever and wise people who can develop themselves when new points of view and ideas are delivered to them. They are the masters of their own work, but often they need some kind of eye-opener and opponents to raise new thoughts and ideas. Managers also need support and tools for their own development work to make it more appropriate and systematic. The knowledge for this development is already out there and it is being enhanced at every moment as research around the world progresses further. The problem for managers is that they have no time for activities such as gathering, composing and keeping updated all the knowledge concerning managerial work. For this purpose a tool should be developed which studies, assesses and clarifies the concept, usage and management of time for managers.
There are also problems lurking on the horizon when talking about managerial development. In spite of the fact that managers are clever and wise many of them are reluctant to change themselves. (Goldsmith 2008; Argyris 1991) This might sound ridiculous, but studies show that even managers who are willing to change their organization are in many cases bad at self-change. Reasons for this attitude are various, but, for example, it can be seen that successful people, which managers quite often are, believe that they don’t have to change because they have succeeded earlier. They also tend to possess unrealistic beliefs about themselves. Goldsmith (2008 p.33) shows that 80 - 85 % of experts estimated that they belonged to the best 20 % of their profession and 70 % estimated that they belonged to the top 10 %. This is just mathematically

3
impossible and proves that there is a lack of self-evaluation. The worst cases were among doctors, investment bankers and airline pilots, of whom 90 % thought that they belonged in the top 10 %. It also seems that managers will not use time for self-development. Tengblad (2002) found that Swedish CEOs used only 0.5 % of their working time for self-development. It is a bad signal for other members of the organization, bearing in mind that leaders should always be examples for the rest of their organization.
Personal attributes and issues can be thought and analysed by a technique called the Johari window. In Figure 1 the Johari window is illustrated in the context of this thesis. The Johari window is an area which is divided into rooms and every room has its own bivalent logic. The logic works so that an attribute is located in a different position in the area according to whether the attribute is known by the subject or known by others or not. (Newstrom & Rubenfield 1983) With this bivalent logic and two variables the Johari window has 22 = 4 windows. Because the total number of rooms is four, they are called quadrants in this thesis.
Originally the Johari window was a technique for studying and assessing a person’s different attributes according to how the subjects see and recognize them themselves and how others see them. There were 56 adjectives which were chosen by the person and by others. Afterwards, an assessment was done by looking at which adjectives were chosen by the subject, which just by others, and which by both. Adjectives which were picked by neither the subjects themselves or others were placed in the unknown quadrant. (Newstrom & Rubenfeld 1983)
Figure 1. Self-consciousness in relation to the Johari window concept. (Applied from Newstrom & Rubenfield 1983)

4
The Johari window is utilized in this thesis for the purpose of visualizing the thesis. The objective of the Chronos & Kairos (C&K) development tool is to enhance managers’ experienced consciousness and enable better self-development. The tool should, if used properly, diminish the Blind spot and Unknown quadrants of a person’s Johari window. The Blind spot quadrant can be diminished by the self-development tool independently, but the unknown quadrant will be tricky even if help and support are at hand. After all, attributes which are placed in the Unknown quadrant are hidden and suppressed and might become visible only in certain situations. This thesis is not going to analyse whether the diminishment of the Blind spot quadrant should be done by enlarging the Open arena or Facade quadrants. The goal is to enlarge consciousness from the self. The decision on openness is left for individual managers. There are studies where openness and honesty are highly recommended, but the situation should be considered first case by case by the persons themselves.
1.2. Research problem and questions
Managers should make the right decision every time they make a decision. This brings with it the need for correct and adequate information. A decision should be based on real knowledge, which is a holistic point of view and not on “educated guesses”, intuitive feelings or limited information that is only looked at from some point of view (Kantola 2005 pp.2-4). Jackson (2004) suggests that solutions will typically fail because of a lack of holism. Solutions are here understood to be decisions.
Despite this, hypothetically, even if an adequate amount of the right information were available and the manager were a holistic type of person, there would still be a possibility to make the wrong decision. One of the failure points might be that the decision maker’s conscious experience is biased. Does the manager understand his/her weaknesses, biases and traits? If s/he does, how intentionally is s/he avoiding their biasing effect in negative cases or how well is s/he utilizing the positive aspects?
Managers need support in analysing their own leadership and management behaviour and styles in different situations. Managers’ attention is to be guided to the right issues and causalities between different issues have to be shown. In order to have the organization reach maximum performance, productivity and results, managers should be able to evaluate their leadership and managerial competencies and biases in different situations. Situationality raises the problem of understanding time and its usage. How do managers use their time? What issues will affect managers’ time usage and experience of time? What kind of biases have to be taken into account when dealing with an individual manager’s relationship towards time? The research problem is how to support managers to understand and enhance decision making in different situations by studying the concept of time in managerial work. Can these issues and approaches be united in to an ontology, where it could be easily understood by managers in a hurry and

5
still be made in scientific ways? The secondary objective is to create a decision support tool for managers and management consultation and coaching.
1.3. Research strategy
Inductive and deductive reasoning is needed in research. An inductive approach for thinking is needed when hypotheses are tested and a deductive approach when hypotheses are created from theories. (Uusitalo 1991; Ghauri & Grønhaug 2010) In this thesis both approaches for reasoning are utilized. The deductive approach prevails in parts where propositions are formed from literature sources. Inductive reasoning is utilized in parts where empirical results are analysed. It might be that in the most orthodox and narrow definition of inductive reasoning this thesis does not include inductive reasoning, because the aim is not to test a hypothesis, at least not in the sense of true or false bivalent logic. This research is also considered exploratory in nature. Structuring an ontology from huge masses of data and information cannot be something which is strictly decided before data collection and analyses. The structure of a time ontology reveals itself part by part when new literature sources are analysed. New information will inevitably give new points of view for the ontology. Therefore this research is also exploratory.
Hermeneutic and positivistic approaches are the two main approaches for data collection styles in research. Positivistic research utilizes quantitative data, which is processed by means of mathematical and statistical methods and techniques. The hermeneutic approach is stated to be “softer” and therefore utilizes more qualitative data. Another difference is that a positivistic researcher is more like an objective observer and a hermeneutic researcher takes part in the actions/events under research. (Gummesson 2000; Ghauri & Grønhaug 2010) From these two main approaches of data collection the hermeneutic way is chosen for the literature parts of this thesis and because the research object is related to humans in the business environment. This thesis is not aimed at a search for the bivalent truth, therefore it must be set in areas where a more holistic point of view prevails and the goal is to increase knowledge on a certain issue and search for tendencies. Some positivistic points of view can be found from analyses of empirical data, but the main point of view is considered to be hermeneutic. Statistical analyses are not included in this thesis.
There are five different methodological approaches in business economics, in which this thesis is to be counted. These methods have been developed to the same construct in Finland and are as follows: conceptual analytical, nomothetical, action-oriented, decision-oriented (Neilimo & Näsi 1980) and constructive (Kasanen et al. 1991). The goal of the conceptual analytical method is to develop new concepts, describe the phenomena researched and is normative (Olkkonen 1994) or theoretical and descriptive (Kasanen et al 1991). This thesis is to be counted as a conceptual analytical thesis since

6
it introduces new concepts and a time ontology for management. It is also constructive because it fulfils core features of the constructive research method (according to Lukka 2000) i.e. 1) real world problem, 2) an innovative construction, 3) a close involvement between the researcher and practitioners, 4) explicit links to former theoretical knowledge and 5) particular attention to reflecting the empirical findings to theory. Kasanen et al. (1991) describes the constructive approach as nomothetical and normative.
Figure 2 illustrates the positioning of the thesis in methodological approaches and which parts utilizes mostly inductive and deductive reasoning. Even though the thesis’ main characteristic is considered to be hermeneutic, there are parts where positivistic features are more used than hermeneutic. Figure 2 also illustrates these parts.
Figure 2. Thesis’ position in research methodological approaches. (Applied from Kasanen et al. 1991)
As shown in Figure 2, this thesis cannot be placed under one research approach. The thesis has separate parts for the literature study and could be considered independent. Hence this part is fairly clearly conceptual and theoretical with deductive reasoning in the spirit of hermeneutic objectives. The latter part of the thesis concentrates on the research tool where the test group tested the demonstrator and their answers are analysed. Also, the test groups were asked for feedback on the research tool’s usability and understandability. The analysing part of the thesis can be thought to be mainly positivistic since the data and results from this part can be processed with mathematical and statistical methods. Statistics are not included in this thesis. These results are also used as feedback to the theoretical part by inductive reasoning. So, to sum up the research strategy, the research in this thesis is a synthesis of all the approaches and methodologies shown in Figure 2 rather than just rigidly bound to one. This might be

7
wise, because quantitative and qualitative research together are more reliable and usable in the fields of management than they are separately.
1.4. Inclusions and exclusions of research
This thesis is limited to building an ontology for managerial time and applying it as a development tool. The purpose of the thesis is to build this ontology so that it could also be used for managerial consultation and research. The thesis is made for the author’s own usage in the author’s partly owned consultation company and thus the author reserves the rights to this work personally. The main interest for the author is to have the possibility to help managers’ work by bringing these issues to the awareness of managers and provide different self-development services for managers.
In general the thesis is not going to take a stance on whether the results on different issues are good or not, because many of the issues are situation-related. This is why the results of this thesis are a scientific basis for a tool in managerial development services. The thesis assumes that managers who will be using the tool independently possess a high professional level and are able to self-develop. Otherwise usage of the tool must be supervised to avoid misunderstandings and wrong assumptions from the results. The demonstrator platform where this tool is going to be created is called Evolute. This thesis will cover the development of the first version of this tool and further development is outside the scope of this thesis. The tool is also going to be used for commercial purposes, so only the main issues regarding the actual tool are published in this thesis. The whole process of self-development services are not handled here either. Figure 3 shows the ingenious management process developed by Jussi Kantola (Kantola 2005). This process is taken as the basis of the development services.
Figure 3. Ingenious management process (Kantola 2005 p.28)
As shown in Figure 3, the process is divided into five different phases: plenary, training, evaluation, analysis and “target” planning. Target planning is followed by

8
implementation (Kantola 2005 p.28), which in this case will be development activities for managers. These activities are not handled in this thesis.
The empirical parts are limited to the test groups available at a certain time and feedback from these sessions. The analysis of the empirical results is handled, but, for example, recommendable actions for the test subjects’ personal development, and what the results may indicate, are not dealt with thoroughly. Neither are issues which may harm the commercial benefits of future use handled here. These restrictions are made partly because of the nature of the concept’s commercial usage and partly because a thesis, like all projects, has to be limited somewhere.
1.5. Execution of research
The research was executed in a similar way as stated in Figure 4. According to Ghauri & Grønhaug (2010 pp.29-32), the research process consists of 10 different phases. These phases are: 1) Choice of the research topic, 2) Research problem derivation, 3) Presentation of problem, 4) Design of research, 5) Measurements, 6) Data collection and usage, 7) Samples, sampling and respondents, 8) Analyses, 9) Writing the report and 10) Actions. Phases 1-4 are presented in chapters 1.1 - 1.4.
Figure 4. Research process (Applied from Ghauri & Grønhaug 2010 p.30)
This thesis is executed in two different cycles. This means that some phases were done twice during the research. The first cycle was done in the literature review and the second in the empirical part where the demonstrator was also developed. Since the literature review part concentrates on the structure of the ontology and defines the propositions for the demonstrator, the measurements were done mostly in the empirical

9
part of thesis. Data collection, on the other hand, was a very large part of the literature review. Phase 2, research topic derivation, was actually executed simultaneously with phase 6, data collection for the literature review. The reason for this was that exact gaps and amounts of knowledge were discovered in phase 6. The sampling and analyses in the literature part are qualitative. In the empirical part, the propositions and demonstrator were tested. No deeper analyses were done regarding the results of the empirical part. Functionality and reliability were analysed via feedback in a qualitative way. Feedback was gathered in such a way that the research could be validated and the demonstrator verified. As a result the process of the thesis is not exactly the same as the process shown in Figure 4. The last phase of the process, actions, will be done in the coaching business where the application will be used in future, and in future research regarding the results of the thesis.
1.5.1. Data collection and ontology forming
The sources of knowledge and information are general literature references and also publications from different journals around the world. The sources for journals were mainly the archives of Elsevier, Emerald and EBSCOhost. These archives were harvested systematically by different combinations of search words concerning leadership, management, time and issues closely related to these. The references also include many articles from the Harvard Business Review and other well-trusted publications and papers from conferences. Altogether some 300 different articles and more than 30 book publications were checked for this thesis. From these about 150 in total were read more carefully and about 90 were taken as references. References of suitable articles were collected in the knowledge structure, where possible, when referring to these sources. This means that more than a dozen books were bought, hundreds of articles were downloaded and tens of articles and books were borrowed. New articles were attached to the structure during the execution of the research.
Literature sources were organized using the Docear program. Docear is an academic literature suite which makes the organizing and handling of pdf files more effective. (Docear 2013) Docear was also used to structure the ontology from literature sources. Picture 1 is a screen shot from the Docear program and time ontology in structuring process.

10
Picture 1. Screen capture from Docear program.
The ontology is formed from the issues and entities in the literature review, in the way shown in Picture 1. It can be seen that time is divided into 7 categories. The main issues in the literature research were 1) the meaning of time in business and leadership, 2) time and ways to understand it, and 3) issues which affect experienced time.
Managing and understanding time categories are open in Picture 1. It can be seen from these opened categories that they consist of several pdf files. Each pdf file is either a book or an article. The markings before the file names, e.g. different smileys, are markings by the thesis writer. The program provides several different marking possibilities. It is also possible to put underlining and other markings made to pdf files on the screen. Thus data collection and the qualitative analysis of the literature data were performed simultaneously. References were also organized for easier use at the same time.
1.5.2. Features and proposition forming
The literature research revealed the features which affect people’s time experience. These features were examined and their nature was revealed, after which propositions were formed. Propositions were made in order to find propositions which describe the attributes that can be attached to the features. This was done in such a way that from the respondent’s point of view it can be identified whether the person wishes to reduce or enhance an attribute in her/his situation.
Features were taken fairly directly from the results of the literature research. Not all the features found were included in this demonstrator, which can be seen as first version of application. There were so many possibilities that the thesis had to be restricted to a

11
suitable size. For example, cultural differences were not taken into account. They could be taken into account in future research and versions of the application.
Proposition forming was much more complicated than finding features. Firstly, propositions were written very freely and a mindmap-style approach was applied. This means that when features were being chosen and the literature research made, propositions were written next to every feature. In the next phase, all the propositions were read and formed in a better way. The propositions were changed so that in they included as few adjectives as possible. Indicators were chosen for every proposition. These phases were performed two times. The propositions were then put in Excel format and guiding professors and other specialists were consulted. The propositions were then adjusted once again. (After feedback from the test groups some typographical errors were also removed.) Altogether the propositions were reformed 5 times. In the end there were 169 propositions in the program. Some of them were the same propositions so that the test subject answers the same proposition a couple of times. Naturally, after the empirical tests, the propositions could be formed again based on the test persons’ opinions, but this phase is excluded from the thesis. The propositions are seen in the text after every feature in this thesis. Thus the reader can find the context for every proposition more easily. Because the result of the thesis is a demonstrator of coaching application for the author’s company and the company has economic benefits from the application, the magnitudes and directions of the propositions will not be shown in the thesis.
1.5.3. Empirical phase
The demonstrator was established for an Internet-based system called Evolute. The propositions were inserted in the system and testing started. Professor Kantola, who set the system up in the Evolute environment, tested the demonstrator first. In his opinion, the system was functioning correctly. Then the author tested the system and also checked that the propositions were functioning correctly. Two groups were asked to test the demonstrator. One was made up of Industrial Engineering students from Tampere University of Technology and the other was experts, project managers and executives from different companies and Turku University of Applied Sciences. Feedback was asked from both groups. The students from Tampere University of Technology gave written feedback as a part of their studies. Author also gave lecture to students regarding thesis´ issues. Trusted persons from the second group were also consulted on the results and feedback was gathered during feedback sessions. Analyses were made from the feedback, the method was validated and the results were verified from suitable sources.

12
1.6. Ontology
Ontology is a definition for common concepts and meanings which describe and represent a knowledge area (Obrst 2003) and gives a formal method for expressing shared understanding of knowledge (Parry 2004). The term ontology belongs to the field of philosophy where basic elements and structures of reality are observed. The question “What is there?” asked by Quine (1948) can be thought of as a basic question of ontology structurization. Quine’s idea is to look to bound variables in connection with ontology in order to know what we or someone else say there is and not to know what there is. This sounds very reasonable from the point of view of this thesis. After all, it is one of the basic foundations of metaphysical thinking. Time is a very abstract issue, so the question “What is real? ” is a good question to keep in mind in this thesis. It is a similar kind of question to the question of whether Pegasus really exists or exists only in the mind. The question is: Is there a difference between these existences? (Quine 1948)
Quine’s point of view on where the importance is of what someone says or we say could be bound to ontology, gives a good opportunity to build an ontology via literature research. This thesis is not going to concentrate deeper on ontology basics, but metaphysical existence is at the very core of the research topic in this thesis. Time is something which does not exist in concrete ways and its existence for each individual is different, as this thesis is going to show. Quine (1948) agrees that the choice of ontology and conceptual scheme are also driven by principles of simplicity and usability. This point of view supports the possibility to achieve the objective stated in the research problem concerning scientific reliability and a simple representation of a time ontology.
An ontology’s structure includes three main parts, which are classes (concepts), relations (associations between the concepts) and instances (elements or individuals in an ontology) (Gomez-Perez, 2004). In this thesis, the concepts are presented in the upper level and in most cases the concepts are also the chapter headlines. The relations between concepts are handled in the chapters and finally the whole ontology is gathered in chapter 3.7 Conclusion of the time ontology. The instances are the building blocks of the concepts and therefore also for the whole ontology. The propositions are then to be taken as instances. Hence it could be stated that the ontology could be a usable representation of the basic structure of this thesis.
Due to the complexity of information and large amounts of information in the business environment, managers are in a position where they are forced to make decisions based on incomplete information (Kantola 2005). This complexity could be reduced by providing ontologies for managers. Various references point in that direction. Ford et al. (1998) according to Kantola (2005) state that personal commitments and beliefs are

13
based on deeper knowledge than available information. Kim (2002) says that the mind’s processing capacity is relatively smaller than problems require and Fox (1981) writes that humans seek techniques for reducing complexity in information, tasks and coordination.
The ontology will also allow for computational information processing and easier ways to reuse, browse, search and structure knowledge (Menzies 1999). Ontologies will need a reasoning tool for ontology quality control and to enable full usability of the ontology (Baader 2004). Ontologies are providing managers with the opportunity to manage in holistic ways. Hence ontologies could be highly serviceable as decision support tools. (Kantola 2005)
1.7. Research architecture
This thesis is part of wider research perspective and approach. Approach is co-evolutionary approach with a specific new management and leadership methodology and modern technology usage. It is started 2002 in Industrial management and engineering department in Tampere University of Technology Pori Campus. It is later supported by several universities and institutions all over the world. Figure 5 is illustrating upper view of this co-evolutionary approach.
Figure 5. Co-Evolute Architecture (With permission of Vanharanta & Kantola 2013)

14
As seen in figure 5 architecture entirety is divided to Human object ontologies and Business object ontologies. This thesis is revealing time´s ontology and also its position in Co-Evolute Architecture. Figure 5 also shows contexts in Co-Evolute approach. It is based on cross discipline point of view where different theories and methods are exploited in order to achieve system level perspective and reveal correlations between theories.
This thesis has starting point in Vanharanta´s article concerning wide perspective to human and business ontologies. Article brings out management windshield metaphor for effective combination of management and leadership. (Vanharanta 2008) This article sparked the idea to reveal time´s significance in leadership and management concepts.

15
2. LEADERS’ CONSCIOUS EXPERIENCE
Leadership is a word that most of us have heard and many of us could easily identify it as concerning leading something. Even so, when talking with people who are involved in leading positions in organizations, it is not always clear that people really understand the word leadership. The word means an abstract issue which cannot be touched physically and cannot be captured in pictures. Leadership is such a broad abstract term that understanding it will need quite a lot of information and knowledge. It has to be approached from different angles and points of view. A true understanding of leadership can only be obtained through careful familiarization of leadership research and literature, being part of an organization where you are either a leader or member (or preferably possess experiences from both positions) and through good examples and stories concerning leadership from other peoples. A person might handle the issue by possessing just one part of mentioned above, but it is guaranteed that a person cannot understand the deeper meaning of leadership without experiences of all three issues.
Leadership has been defined in many different ways. Some include leadership as part of management. Hersey, Blanchard and Johnson define that “..leadership occurs whenever one person attempts to influence the behaviour of an individual or group, regardless of the reason” (Hersey et al. 2001. p.9). Pardey states that “Leadership is something that people see or experience personally. It is above all about the relationship between the leader and those people being led” (Pardey, D. 2007. p.9). Because the same assets and actions do not always make the same changes, we have to pay attention to situationality in leadership. From that point of view, leadership is also situational and dependent on people’s conscious experiences and meaning points. (Vanharanta & Salminen 2007) What is remarkable is that there is no impressive cumulative knowledge created through thousands of leadership studies. Despite an extensive amount of studies, it is still not agreed what leadership is or how it works. (Mackenzie & Barnes 2007)
2.1. Experienced consciousness
“We think in generalities, but we live in details.” –Alfred North Whitehead
In order to avoid the last part and ensure the first part of the aphorism stated above, a holistic point of view needs to be taken into account in this thesis. This is why this thesis is based on the metaphor of the Holistic Concept of Man (HCM), which is first introduced this way by Vanharanta et al. in their article in (Vanharanta et al. 1997). In this metaphor HCM has three dimensions: a body, a mind and a situation. The body

16
represents the human being as an organism that utilizes thinking, senses for observation and limbs etc. for physical actions in different individual situations. These situations have relationships and interrelationships that could be derived from the human’s qualities. This human being, the actor, is not just a physical entirety but also includes three modes of existence, which are needed to make human existence. These modes of existence are 1) corporeality, the body and existence as an organism, 2) consciousness, the mind and experience, 3) situationality, environment in real world situations (Vanharanta et al 1997). The HCM metaphor is illustrated in Figure 6 where the three modes of existence are related to three dimensions.
Figure 6. The Three Modes of Existence (Vanharanta et al. 1997)
As can be observed in Figure 6, the real world situation is filtered through conscious experience and actions are made by decisions made by as a result of this thinking. It must be pointed out that in HCM consciousness is separated from the mind in the sense that consciousness is the totality of the psychic-mental existence of the decision maker (Vanharanta et al. 1997). The mind is taken to have a more functional sense than consciousness and it is in the continuous process of making old meanings and emerging meanings network collectively. All the networks of meanings as a whole are the worldview of the decision maker (Vanharanta et al. 1997) and this view is very subjective (Rauhala 1986 according to Vanharanta et al. 1997).
This thesis will provide arguments for the idea that time is the most essential phenomenon to be understood and handled by managers. As time is closely related to situationality, experienced consciousness and even corporeality and possibilities of benefitting from HCM would be a good starting point for this thesis on the metaphor level. A holistic person cannot really be holistic and experiences cannot be conscious in real world situations without the conscious understanding of time, regarding one’s own and other’s biases and experiences towards it. Not to forget that most of time is hidden in the unconscious part of being. As time elapses, changes will inevitably happen in all three modes of existence. Therefore HCM concept should contain time dimension.
17
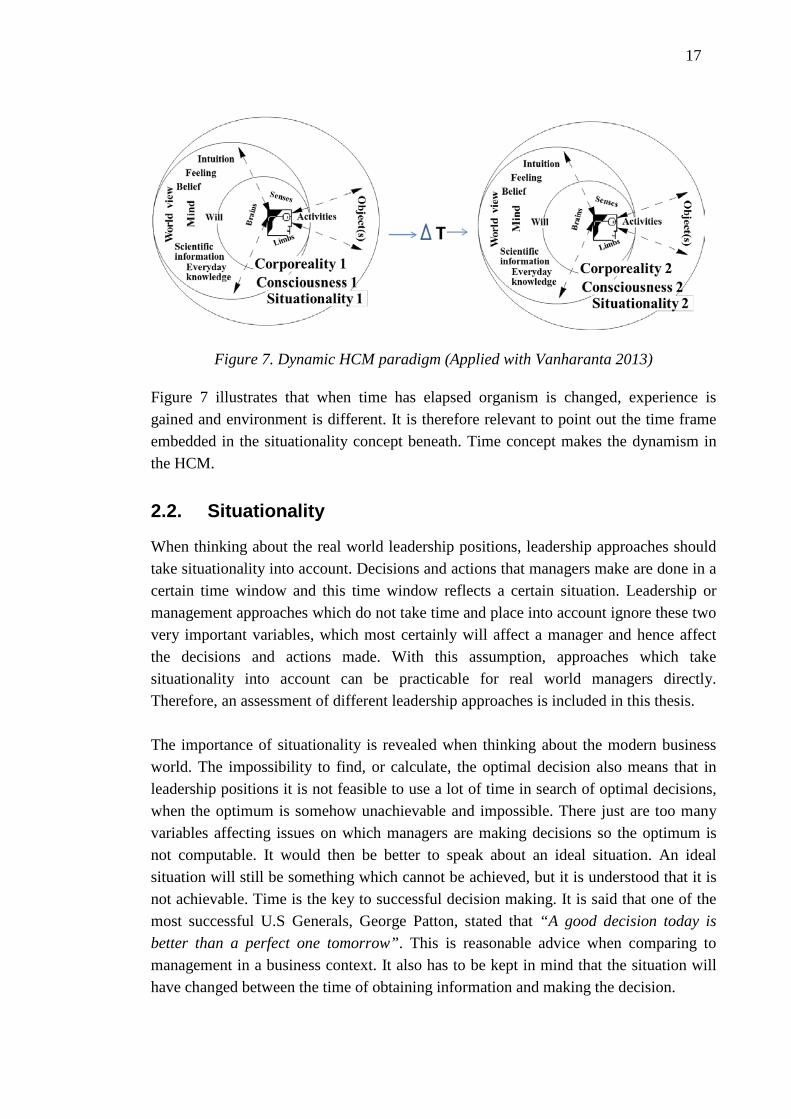
Figure 7. Dynamic HCM paradigm (Applied with Vanharanta 2013)
Figure 7 illustrates that when time has elapsed organism is changed, experience is gained and environment is different. It is therefore relevant to point out the time frame embedded in the situationality concept beneath. Time concept makes the dynamism in the HCM.
2.2. Situationality
When thinking about the real world leadership positions, leadership approaches should take situationality into account. Decisions and actions that managers make are done in a certain time window and this time window reflects a certain situation. Leadership or management approaches which do not take time and place into account ignore these two very important variables, which most certainly will affect a manager and hence affect the decisions and actions made. With this assumption, approaches which take situationality into account can be practicable for real world managers directly. Therefore, an assessment of different leadership approaches is included in this thesis. The importance of situationality is revealed when thinking about the modern business world. The impossibility to find, or calculate, the optimal decision also means that in leadership positions it is not feasible to use a lot of time in search of optimal decisions, when the optimum is somehow unachievable and impossible. There just are too many variables affecting issues on which managers are making decisions so the optimum is not computable. It would then be better to speak about an ideal situation. An ideal situation will still be something which cannot be achieved, but it is understood that it is not achievable. Time is the key to successful decision making. It is said that one of the most successful U.S Generals, George Patton, stated that “A good decision today is better than a perfect one tomorrow”. This is reasonable advice when comparing to management in a business context. It also has to be kept in mind that the situation will have changed between the time of obtaining information and making the decision.

18
Many, if not all, of the decisions which managers make concern issues on how to change something in the present situation. After all, if nothing changes, time does not occur (cf. chapter 3.1 for a deeper description of time). Why change, is a good question. It could be thought that nothing starts as an ideal phase but it would be beneficial to move towards the ideal. Hence, an ideal is something that can never be reached, but it is possible to move towards it all the time. Figure 8 illustrates a simplified example of why change has to be done and why the situation changes. On a never-ending journey towards an ideal, corrections should be made all the time. When one actor changes something (i.e. makes a correction) in order to achieve the advantage (reach the ideal), the situation changes for all actors and their relative position changes towards the actor that made the change. This means that in order to restore their relative position (or to improve it) all other actors have to perform changes in their variables. This leads to continuous changes by all actors in order to achieve a relative advantage. Advantage is to be understood as the way a company differentiates itself (in a good way) from its competitors (Day pp.3-10). A more complicated or even fuzzy situation occurs when taking into account that the position of the ideal also changes place after every change. When thinking this way, it is quite certain that the ideal cannot be reached at any point, but a relative advantage can be achieved for some period of time. All together this makes situationality a very significant issue and hence the concept of time in management is even more important. Management is always time dependent. In the example shown in Figure 8, four companies are making changes to reach an ideal from their own points of view. It has to be mentioned that every company and every executive has a different opinion of which direction the ideal is in. Company A has clearly made the wrong decision, from some reason or another. Company C has made a good decision and has taken a good leap towards the ideal. Companies C and D are relying on making a change in only one variable. After the changes, the ideal has moved and Company C’s decision is not as good as it looked before. Company B, on the other hand, has benefitted from the move of the ideal.
Figure 8. Simplification of changes in business ideal

19
Figure 8 is a very much simplified example. In the example there are only two variables. However, in the real world variables are immensurable, i.e. there are uncountable dimensions in which the ideal could move. Changes are continuous, inevitable, dynamic, irreversible, non-deterministic, non-linear and open-ended. (Reunanen et al. 2012a) The needs for change come either from inside the industry or outside. Changes can also be proactive or reactive. Nevertheless there are several possibilities why the business environment is changing. Markets are changing, laws are changing etc. (Reunanen et al. 2012b) There are tools for analysing the current situation and trying to foresee future situations. One of these tools is the PESTLE analysis, where the political, economic, social, technological, legal and ecological issues are assessed and analysed. The problem there is that changes can be something that had never even been thought of. They can also be so dramatic and happen so fast that they totally change the business in a very short time. In such cases, these factors are called “black swans” by Nassim Taleb (2010). Taleb states that the attributes of a black swan are unpredictability, huge consequences and retrospective explainability. These types of changes are those which really cannot be prepared for any other way than being able to adapt as fast as possible to the new situation after a black swan. Even though this thesis does not concern change management, these issues underline the need for understanding situationality and therefore time when thinking about leadership and management. In the business context, Prahalad & Hamel (1990) have highlighted the ability to respond quickly, or be proactive, in a changing environment by stating that a company’s core competence is the “… management’s ability to consolidate corporate-wide technologies and production skills into competencies that empower individual businesses to adapt quickly to changing opportunities”. The business context raises the need for changes made in a strategic way. When Mackenzie and Barnes (2007) describe the place (cf. chapter 2.2.1), which also includes the industry, it could be seen in a strategic perspective that the company’s arena (Day 1990 pp.3-8) is changing. Besides Day’s (1990) advantage and arena, he has also provided access (to markets) and activities (scale and scope) as part of strategy. He also highlighted a fifth element, which is adaptation to threats and opportunities. This can be connected very directly to Prahalad and Hamel’s definition of core competencies and change management. In other words, change has to be performed all the time in order to keep a company’s competitiveness and relative position in the arena (i.e. markets). As it can be agreed that change is necessary, inevitable, irreversible and continuous, the question arises how to do it and what does it require, from the point of view of the manager/leader? Roger Gill argues that although good management is needed in change, planning, organizing, directing and controlling, effective leadership will make change successful (Gill 2003). According to Kotter (1995), most of the transformations (changes) will fail not because of a plan’s directives and programs (managerial activities), but because of a lack of vision of where the change is leading, i.e. lack of leadership. This is without mentioning

20
failures in other steps in Kotter’s change management model, which are heavily affected by leadership failures (cf. Kotter 1996).
2.2.1. Leadership and place
When considering leadership and management, we also have to take into account place and not just time. Place (like time) is not an easy concept to handle. According to Malpas (1999), a place is an open and interconnected region where other people could be recognized, identified and interacted with. Place is also formed in the past, possesses a present and affects the future as the place changes. When thinking about this from the same point of view where time is a fourth dimension of space (Sorli & Sorli 2004), we could come to the conclusion that leadership includes not only situationality, but also the place and environment which are ever-changing. According to Mackenzie & Barnes (2007), a leader’s place includes the leader himself, the leader’s team, the environment and system itself such as the organization where the leader belongs and the industry where the organization works. So in other words: the leader is a part of the system where s/he acts. Every change made by leaders will also inevitably affect the leaders themselves. Because s/he is part of a system, the leader cannot be a totally independent and objective observer and actor. (This recognition also makes this thesis more hermeneutic than positivistic research.) Being part of a system poses challenges to carry out research into leadership. It is not possible to reproduce the same situations again and change the attributes and test again as in natural sciences. There are just too many attributes changing in irreversible ways. In this respect it is possible to conclude that leader’s conscious experience towards time, i.e. the changes in different situation is very important to realize and harness for better decision making. The problem of leadership research is somewhat similar to the leader’s problem of being part of a system. There are too many variables to find exact answers whether the leader is acting for the better or worse. One good example is that it is still unclear after over 75 years whether Franklin Delano Roosevelt’s efforts during the Great Depression in the 1930’s shortened or prolonged the Depression. Roosevelt’s efforts are highly appreciated and honoured but nobody can say whether what he did was good or bad for the economy. (Mackenzie & Barnes 2007)
2.2.2. Leadership levels and influence
How much managers are able to influence through their decisions is dependent on two different dimensions. One dimension is the managerial position, i.e. how high a position does the manager possess? It is fairly easy or at least gives one better opportunities to influence e.g. the whole company if you are CEO rather than one team leader in some
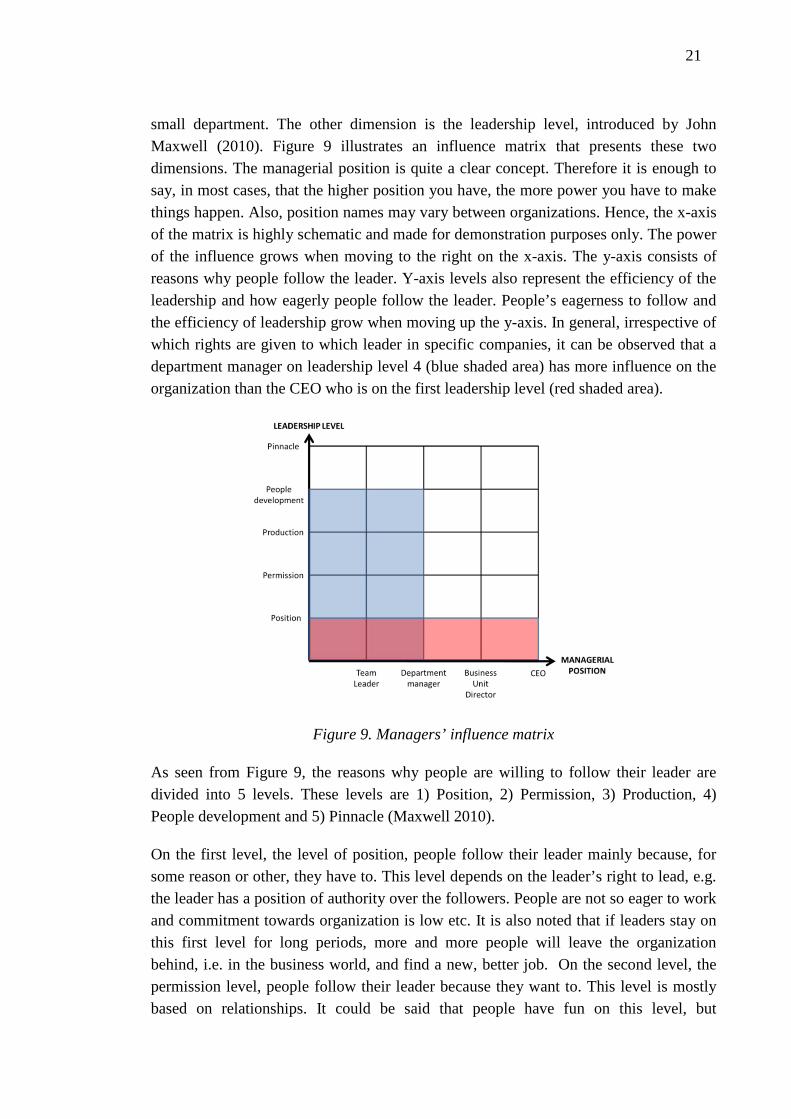
21
small department. The other dimension is the leadership level, introduced by John Maxwell (2010). Figure 9 illustrates an influence matrix that presents these two dimensions. The managerial position is quite a clear concept. Therefore it is enough to say, in most cases, that the higher position you have, the more power you have to make things happen. Also, position names may vary between organizations. Hence, the x-axis of the matrix is highly schematic and made for demonstration purposes only. The power of the influence grows when moving to the right on the x-axis. The y-axis consists of reasons why people follow the leader. Y-axis levels also represent the efficiency of the leadership and how eagerly people follow the leader. People’s eagerness to follow and the efficiency of leadership grow when moving up the y-axis. In general, irrespective of which rights are given to which leader in specific companies, it can be observed that a department manager on leadership level 4 (blue shaded area) has more influence on the organization than the CEO who is on the first leadership level (red shaded area).
Figure 9. Managers’ influence matrix
As seen from Figure 9, the reasons why people are willing to follow their leader are divided into 5 levels. These levels are 1) Position, 2) Permission, 3) Production, 4) People development and 5) Pinnacle (Maxwell 2010).
On the first level, the level of position, people follow their leader mainly because, for some reason or other, they have to. This level depends on the leader’s right to lead, e.g. the leader has a position of authority over the followers. People are not so eager to work and commitment towards organization is low etc. It is also noted that if leaders stay on this first level for long periods, more and more people will leave the organization behind, i.e. in the business world, and find a new, better job. On the second level, the permission level, people follow their leader because they want to. This level is mostly based on relationships. It could be said that people have fun on this level, but

22
productivity is not good and the leader has no power, for instance, to get people to do unpleasant or boring tasks. On the third level, the level of production, people follow their leader because of what the leader has done in the organization. This level is reached by results that the leader has achieved. People will also concentrate more on results at work and productivity will probably rise. The fourth level, the people development level, is the level where people follow the leader because the leader is doing something good for them and for the organization, i.e. the organization can reproduce itself. This is the level where the production of knowledge and professionalism occurs and new capable people emerge. The fourth level relies on people who wish to do their best and develop themselves. The fifth level, the pinnacle level, is the level where people follow the leader because of who the leader is and what the leader represents. This level is based on respect. (Maxwell 2010)
The first four levels are more easily understood than the fifth. Ultimately, leaders such as Mahatma Gandhi, Martin Luther King or Adolf Hitler can be positioned at the fifth level. Fifth level leaders are highly charismatic. They are persons who are able to make people do whatever they want them to do. Often people are willing to do things before even asked just because they are keen to move towards the leader. In such cases there are huge risks of losing the benefits of the level and even spoiling the whole organization. These issues are called the dark side of charisma. If people are willing to follow a leader without any doubts or critical thinking, it can be misused. (Takala 2005) Also, a bad business decision can be made unless somebody critically rethinks and revises the leader’s decisions and opinions. An even worse scenario is created if people in an organization start to work only independently and compete for the leader’s favour. In these cases, followers think that they are doing something that is expected of them, even though it is not and can actually be harmful for the organization from a bigger perspective.
Managers are in different situations and different positions. Activities are therefore different. This thesis not only provides tools for managers on how they might climb up the leadership levels, but for managers, it is useful to understand their possibilities to influence their organization. Then they have better opportunities to analyse where they are using their time in such a way as to make their leadership more effective.
2.3. Leadership approaches
There are several different leadership approaches that can be distinguished from each other. The differences might be very small and incremental or very thorough. In terms of the approaches, there are at least eleven different ones that are widely known and include the dimension of situation. There are also two commonly known approaches that are not handled in this thesis. The model based on leadership traits is one, but it does not have such a clear connection to situationality. The other is called “substitutes

23
for leadership,” which is based on an idea where certain variables neutralize the need for leadership. (Kerr & Jermier 1978 according to Mackenzie & Barnes 2007) The approaches handled in this thesis in alphabetical order are: 1) Adaptive leadership, 2) Change-centred leadership, 3) Contingency theory, 4) LAMPE model, 5) Leader member exchange theory (LMX), 6) Multiple linkage model of leadership, 7) Path goal theory, 8) Situational leadership, 9) Team leadership and 10) Transformational leadership.
One common issue in all the approaches is situationality, i.e. they are connected to time. Other issues covered by the approaches are shown in Table 1. Leadership approaches are explained in the text beneath Table 1. These approaches are ordered by their coverage of different issues so that the approaches that deal with the smallest number of issues are first and the most thorough approaches are at the end.
Table 1. Leadership approaches that recognize situationality. (Applied from Mackenzie & Barnes 2007)
LAMPE model. This model is based on an assumption that if an organization’s Leadership, Authority, Management, Power and External environments are integrated and coherent the organization will prevail. (Mackenzie 2006) The acronym LAMPE is
LEADERSHIP ISSUES AdaptiveChange centered
Contin-gency LAMPE LMX
Multiple linkage
Path goal
Situa-tional
Team leadership
Transfor-mational
ORGANIZATIONAL CONTENT/CONTEXTAssumptions about environment X X X XStrategic direction of the organization X X X XStrategic direction of the leader´s unit X X X XOrganizational means of organization X X XOrganizational means of leader´s unit X X X X X XOrganizational rewards system X XResults produced by organization X X XResults produced by the leader´s unit X X X X X X X XManaging technologies XEMPHASIS AND PURPOSEImproving the organization X X XImproving the leader´s unit X X X X X X X X X XImproving adaptive problem solving X X X X XImplementing sops X X X X X X XIndividual bonding to job and organization X X X X X X XBonding of job to organization X X XTransformational rewards X XTransactional rewards X X X X X X XAnalytical approach - processual X X X XAnalytical approach - variables X X X X XExplicit concern for ethics X XFOLLOWER CONTENT/CONTEXTFollower´s approach to Job X X X X X X XFollower´s means for producing on job X X X X XFollower´s performance X X X X X XResults for the follower X X X X XFollower´s technologies X X
LEADERSHIP APPROACHES

24
made from the first letters of these features. LAMPE emphasizes adaptive problem solving (cf. adaptive leadership), both transformational and transactional rewards and organizational rewarding systems. LAMPE also includes followers to the leadership model in many different points of views, such as the follower’s approach to work and the results for the followers. (Mackenzie 2006).
Transformational leadership. The essence of this theory is to make leaders able to inspire followers to “produce far beyond what is expected of them”. The basic idea of transformational leadership is that leaders are to be change agents who will change their own behaviour whenever old behaviour becomes obsolete or ineffective. The purpose of this change is to be able to drive followers themselves to create new ways to achieve individual, team and organizational goals. This theory emphasizes improvement in various ways in terms of organization, leader, followers and adaptive problem solving. The rewards that are used are both transactional and transformational and theory highlights followers’ approach to work, followers’ performance and results for the followers. (Bass & Avolio 1990)
Multiple linkage model of leadership. This model is Yukl’s model where many models are integrated into one. The model emphasizes the implementation of standard operation procedures and committing followers to the organization and the work. The model looks at the impacts of organizations, environments, and assumptions on effectiveness and uses a transactional style of rewards. It also includes many different points from followers such as the LAMPE model. (Yukl 1981)
Team leadership. As is self-evident from the name of this approach, team leadership focuses on leadership and teams. The model emphasizes the effects that the results from actions made during a task, relationship behaviour or improving environment of the team. The model also focuses on standardized operational procedures (SOP), problem solving through goal, focus, facilitated decision-making, training personnel and keeping the standards high. (Northouse 2007) Team leadership is also used in modern warfare but it is termed decentralized tactical leadership. Wehrmacht used decentralized tactical leadership (auftragstaktik in German) in World War Two. Decentralized leadership derives from Prussian army drill regulations of the infantry from 1888. Regulations emphasized that the commander should say what it is to be done in broader terms, but gives followers the freedom to decide how they would perform the task. (Peck 1990) This, very similar, approach is also utilized in Finnish defence forces but it is called ”mission tactics” (tehtävätaktiikka in Finnish). The approach starts from the idea that at the individual level every person is able to make independent decisions and also take the responsibility for decisions. The most important enablers for decentralized leadership approach are linchpin persons. (Mälkki 2009) Linchpin persons are persons who are bearing and facing the real circumstances of war physically and mentally. (Sunzi 2005)

25
In the business world, this means that leadership team is hence enabled via these linchpin, key, i.e. persons who are “trusted personnel” in the organization.
Leader-member exchange theory (LMX) This approach focuses on interaction between the leader and follower. A special type of approach in LMX is the division of personnel to in-group and out-group personnel. This means that in-group personnel are followers who receive special treatment from the leader and the followers in the out-group do not. The in-group personnel special treatment is not awarded from nothing, but e.g. because of their better commitment to the organization and initiative touch. This is also the reason why they are in the in-group. LMX emphasizes the improvement of the leader’s unit and a better bond between follower, work and organization. (Northouse 2007; Sherony & Green 2002)
Path-goal theory. This theory is focusing on ways how a leader can affect the follower in terms of performance, motivation and satisfaction. The theory emphasizes the leaders’ behaviour in tasks and relations. It also underlines standard operation routines and various paths to commit followers to work and organization. The theory also emphasizes transactional rewards and includes different points of views from followers.
Situational leadership. Hersey and Blanchard (1982) developed this model from various similar kinds of models and added to the model the dimension of readiness and preparedness of followers to accomplish the task at hand. In other words, leaders should take into consideration followers’ ability and willingness when making decisions. Hersey and Blanchard also included in the model suggestions from a different type of leadership styles to be used for in different situations considering the level followers’ readiness. (Hersey et al 2001)
Adaptive leadership. The approach emphasizes adaptive problem solving. This approach was delivered by Heifetz (1994) and defines leadership as activities that commits people to progress in problem solving in difficult circumstances which are close to a survival struggle.
Contingency theory. This theory was created by Fiedler (1964; 1967). Fielder presumes that the leaders’ style will remain fairly unchangeable and therefore, when the need to change occurs, the leader has to change the situation. This will be done by adjusting (changing) three different variables which are leader-member relations, structures of tasks and position power. The main focus in Fiedler’s theory is to improve units’ performance by making changes to these variables and find the good “situational favourableness”.
Change-centred leadership. This model is primarily related to the instrumental points of views and changing adaptively organization to external environment changes. Change-

26
centred leadership emphasizes discussions of future situations as possibilities, bringing new ideas for growth, products and ways to do things. (Skogstad & Einarsen 1998)
.

27
3. TIME
One of the most important skills for everybody is the skill of managing oneself. Peter Drucker (2005) starts his article in Harvard business review with the sentence: ”Success in knowledge economy comes to those who know themselves -their strengths, their values and how they best perform”. In the article, Drucker handles personal management skills and emphasizes consciousness about oneself. Drucker has also observed that “effective executives do not start with their tasks, they start with their time”. This way he underlines that time is a limiting factor. (Drucker 1967 pp.25-26). Because of the nature of knowledge and managerial work, the difference between either wasting time or using it wisely, is a matter of effectiveness and results. (Drucker 1967 p. 35) Hence, the first step to be an effective manager is to learn manage oneself and one of the most crucial issues in it is learn to manage time. A personal feature here is to find out whether the person is time-oriented or task-oriented. The first proposition, in C&K’s demosntrator therefore concerns where a person starts their work planning.
Proposition 1: I start planning my work regarding the time available rather than the tasks.
3.1. Chronological time
Generally, time is not an easy concept to master. Humans have learned different ways to handle time. It is possible to measure time’s duration speed and numerical order with clocks (Sorli 2002), but this is far from really understanding time. There are different points of views to understand in time. Newtonian physics’ point of view towards time is that time is independent of other physical phenomena and absolute. On the other hand, in the general relations theory, it is stated to be as a fourth dimension of space and changes in it are irreversible. For instance, Sorli states that “physical time exists only as a stream of change”. (Sorli & Sorli 2004) There are also different ways to connect time to something what is more easy to realize. Boroditsky (2000) proposes that time can be understood as a spatiotemporal metaphors and this causes relations between space and time. However, she also submits that there is no evidence that these metaphors are necessary when thinking of time. Despite the various definitions or metaphors, what is meaningful for managers is that time is a unique resource that cannot be stored, time is perishable, irreplaceable and has no substitute. Demand does not affect it and it has no price or marginal utility curve. One thing above all, when talking about time in modern working life, it is always short of supply, i.e. we are always lacking it. (Drucker 2005

28
p.226; Turnbull 2004) When keeping in mind the above-mentioned factors, it is crucial for managers to manage their time and use it wisely.
3.2. Experienced time
Experienced time is not same for everybody. Time can be divided into two categories: subjective time and objective time. (Harung 1998) Objective time is same for everybody and it can be understood as chronological time, where the speed of changes is same for everybody. Subjective time is heavily relativistic and the speed of it is dependent on many different factors. These factors are e.g. a person’s way to utilize and sequence time, feeling, (Harung 1998), a person’s cultural background (Lewis 2010), situation, time pressure (Kobbeltvedt et al. 2005), lack of sleep (Kobbeltvedt et al. 2005; Barnes et al. 2011), personal traits (Berglas 2004) or planning personality (Buehler & Griffin 2003) These are all examples of factors which affect a person’s experience of time. There are, most probably, more attributes that affect a persons’ way to experience time, but this thesis takes these points of views into recognition.
A good example for perceiving the difference between chronological time and experienced time is to be found from the ancient Greeks. According to Czarniawska (2004), the Greeks divided time according to gods named Chronos (the god of time) and Kairos (the god of proper time). The difference between these two gods was that when Chronos measured time in mechanical intervals and Kairos “jumped and slowed down, omitted long periods and remained in others”. In fact, the Greek word Kairόs means time, place and circumstances of a subject. The “Kairos” time is something that everybody has experienced. It is the proper time that people are living and feeling. Everybody has experienced, at some point of their life, a feeling of timelessness (Mainemelis 2001), i.e. “time flies”. This, in extreme cases, can cause a phenomenon called flow, where person is completely focused and motivated. (Csikszentmihályi 2000) On the other hand, everybody has experienced feelings when time has nearly stopped when doing something unpleasant or boring.
Before it is possible to manage one’s own time usage, personal biases towards time has to be understood consciously. These can be learned by the C&K application and time recording. Because traits and personal features are many times very strong, some coaching or personal mentoring is to be considered. In this chapter these personal issues are pointed out. These issues should be familiarized in order to improve leadership and management skills.
3.2.1. Cultural background
Cultural background also influences a person’s way to experience time. Although cultural background is not taken into account in this first version of C&K application,

29
the issue is so important in a globalizing world, that is should be noted for further use. The reference for chapter 3.2.1 is to found from Richard Lewis’s book: When cultures collide (Lewis 2010 pp.53-62)
For Americans, time really is money and time is very linear. Americans are dividing their time into the past, which is really over, present, from which you might take advantage and into the immediate future, where you could hopefully benefit your present work. Americans could be also found using words like wasting, spending, budgeting and saving time. A very close similar ideology towards time could be found in other parts of the Anglo-Saxon world, Germany, Netherlands, Switzerland, Austria and Scandinavia, including Finland. Linear time cultures prefer to make one action at time, on time. Actions are set to a line and executed effectively in a concentrated and punctual way. Linear time could be compared quite directly to the concept of chronological time and Chronos, according to Czarniawska (2004).
Southern Europeans are not so much interested in schedules or punctuality. The linear approach towards time is not typical for them. They would rather have a multi-active approach. The difference towards linear time cultures are in the relativeness of importance. Multi-active persons consider that the present reality is more important than future appointments. Accomplishing human transactions is best use for their time. Multi-active cultures are most likely to be found in Southern Europe, Hispanic America and Arabic countries. The core in the perception of multi-active time is to recognize that time is an event and personality-related and it could be reformed if needed, irrespective what the chronological time says. Multi-active time can be compared to the concept of experienced time in this thesis and Kairos according to Czarniawska (2004).
According to Lewis (2010), there is also a third way to understand time. Cyclic time distinguishes itself from linear and multi-active time more than linear distinguishes from multi-active. Cyclic time is not linear or personally-related but something which happens all again. The sun will rise and set, seasons will change and people will be born, grow and die and their children continue this cycle. In cyclic cultures, there is an unlimited supply of time, even if you personally are not in position to experience all of it. In this point of view, time does not fly away even if the decisions are not made, i.e. time cannot be wasted. Decisions can be made after some cycles of days, weeks, months or years, when people are as much wiser. The concept of cyclic time cannot directly be compared to other concepts in this thesis, but it is still an issue that should be studied in future versions of the C&K application.
Cultural background should be taken into account more intentionally nowadays than even a decade ago. There are not many businesses left where managers do not come into a situation where they have to deal with persons from other cultures. Globalized businesses and cross-border activities have guaranteed that almost every corner of the

30
world is covered when working with representatives of other companies. These different cultures are also influencing managers’ work. Furthermore, when considering that the demonstrator developed during this thesis, cannot be utilized around the world if cultural differences towards time are not taken into consideration. This need for different approach to different cultures will add plenty of work to application development and hence is now beyond the scope of this thesis. Nevertheless, orientation differences can be seen between the present and future in these cultural differences. Hence it is to be considered whether a person is future-oriented or present-oriented. The following propositions are taken from this point of view.
Proposition 2: I’m late for meetings. (Every case is counted when you arrive late even if the meeting has not started).
Proposition: 3: I’ll postpone the next meeting if the ongoing meeting is taking longer than supposed.
3.2.2. Situation
People experience the same period of chronological time differently in different kinds of situations. For instance, it depends on whether the situation is enjoyable or not, are you in a hurry or not or what is your position in the organization. Time is a very positive factor when people are happy or feel satisfaction. It is the same situation, if a person possesses a deep intimacy towards the task and is fully concentrated or absorbed to the activity at hand. This makes the time we experience dependent on our level of satisfaction in different situations. (Harung 1998) A very nice dinner with good friends and good food and drink or two will more probably feel much shorter than the same period of time in a dentist’s chair. This difference in time experience is related to the feeling whether the task or situation at hand is enjoyable or not, i.e. is it satisfying? The level of satisfaction is then to be found when trying to understand peoples’ experienced time. Hence the following propositions are to be made.
Proposition 4: My feelings towards my work are positive.
Proposition 5: I get satisfaction from my work.
The hecticness of the situation will also affect a persons’ way of experiencing time. Turnbull (2004) founded that executives appeared to maximize their time utilization in a hectic situation (almost all the time nowadays), by packing every moment of the day with very intensive activities. Turnbull also states that this level of hecticness will imbalance the time spent on organizational duties or with the family. This means that the balance between working time and free time is not at a healthy level. This is a result from attempts to synchronize organizational time and still retain enough interaction time. This synchronization is usually done by suppressing self-time. (Turnbull 2004) By

31
organizational time, Turnbull means time which is used to work or organizational duties, interaction time as interaction e.g. with friends and family, and self-time time dedicated to the person him/herself, e.g. own hobbies etc. Leaders use compression as coping with the acceleration in organizational life, i.e. dealing with the shortening time frames. This means leaving things out and trying to get to the essence of things. Sabelis (2002) founded that this mindset might speed up the acceleration by "implying that rational reduction of information, emotions and alternatives is necessary to reach organizational and individual goals." (Sabelis 2002 p.102, according to Turnbull 2004) This might lead to a situation where attention to activities quality, creativity, open-mindedness, innovations and empathy is reduced. If we compare this kind of compression of time to Drucker’s (1967 p.31) suggestion, where people have to feel that we have all the time in the world, it is easily seen that it might affect decisions. Studies show the balance of personal life and work is the most or second most important attribute of the job and that many would change their job if it will improve the balance between work-time and self-time (Johnson 2004). Hecticness and haste seems to be huge operators when dealing with peoples’ activities at work. The level of haste is then to be assessed in order to understand how a person is feeling the situation at the work place.
Proposition 6: My work is very hectic.
Proposition 7: I work overtime because I have too many tasks to do.
Proposition 8: I can fit my everyday tasks into normal working hours.
Proposition 9: I fill my days with very intensive activities.
Proposition 10: I keep myself very busy.
Proposition 11: I’ll compress my schedule when new tasks are offered.
Proposition 12: The time I use for work suppresses the time reserved for family and/or friends.
Proposition 13: I schedule my free time (not working time) precisely.
Proposition 14: My work takes so much time that I have to use my self-time with family and/or friends, (Self-time = things you like to do all by yourself such as reading books, watching movies, exercise etc.)
Proposition 15: I have enough time with my family and/or friends.
Proposition 16: I have time to clarify my emotions during the working day.

32
Proposition 17: All my working time is going to the core tasks of my job.
Proposition 18: I have time only for very essential information.
Proposition 19: I have time to concentrate on interesting leads and new ideas.
Proposition 20: I have time to rethink my work and tasks and alternative ways to do them.
Proposition 21: I want to slow down my working rhythm.
Proposition 22: I can’t make errors in my work.
Proposition 23: I reserve time in my working schedule for unexpected issues.
A person’s development is also found to be a factor which makes time to be a positive thing. (Harung 1998) This can easily be reasoned by thinking the time which people use to learn new skills. People use plenty of time for their hobbies, e.g. training football, playing violin or playing chess. They are trying to reach a certain skill for a certain level and only time will enable this development (time used to practice naturally). The same analogy can also be found from working life. When people are let to develop themselves in their work, they feel more satisfied towards work and time feels a more positive issue. This is also one reason why leaders should try to reach at least level 4 in Maxwell’s (2011) leadership steps (cf. chapter 2.2.2), where the leader is appreciated by the activities what the leader has done for the followers. Here one of the biggest issues is developing personnel and let them grow, so that the organization can reproduce itself. The alarming factor is that, according to Tengblad (2002), managers use very little time for personal development. Only 0.5 % as a mean and within the range 0-1 % of total working time was used for personal development. Development activities are connected with job satisfaction and whether a person is future- or present-oriented. Development activities are always activities whose pay-offs will come in the future. Development activities might concern long-term or short-term benefits, but nevertheless the benefits will be gained in the future. Concerning development, the following propositions should be made:
Proposition 24: I reserve time for my self-development activities (training, courses, self-study etc.)
Proposition 25: I devote work time to my subordinates for personal development.
Proposition 26: I can develop myself in my work.
Proposition 27: I work in an organization that enables my personal development.

33
Proposition 28: I devote time to my personal development.
There are also huge risks when a manager’s time is stretched too much. The situation where work, or other activities, cause that more time for work is “stolen” from sleeping time, is one alarm bell, at least if this situation is considered to be normal. If a person does not receive enough time for discretionary activities and rest and sleep, it may lower self-control and the possibility to behave unethically will raise (Barnes et al. 2011). Sleep-deprivation can be very harmful in time-pressured activities. Especially in activities where more time cannot be used to overcome effects of sleep-deprivation. It is found that performance is not as good as in well-rested individuals (Kobbeltvedt et al. 2005). Hence, it is useful to know does the person sleep enough. Therefore, the following propositions concerning resting are justified:
Proposition 29: I’m exhausted on my holidays.
Proposition 30: I sleep enough.
Proposition 31: I can rest enough during regular working days.
3.2.3. Personal traits
Berglas (2004) divides the personal traits of time abusers into four main categories: perfectionist, preemptive, people pleaser and procrastinator. In this thesis these main personal traits are handled according to time. One additional trait is supplied in this thesis. A more comprehensive coverage of personal traits would increase the amount of work overwhelmingly for a master’s thesis. More personal traits should be added in future versions of C&K.
Perfectionists are people who are afraid of letting even completed work go. They are trying to reach unrealistic objectives and excellence in their work. These self-made requirements of perfection delay the progress of work or even keep others hostage to the perfectionist’s schedule. Perfectionists need total control of the quality of the work they are involved in. (Berglas 2004) Since perfectionism is considered to be harmful at too high levels, this should be identified.
Proposition 32: I’m satisfied with the quality of my work
Proposition 33: I have time to go through accomplished tasks sufficiently enough.
Proposition 34: I have difficulties finalizing tasks.
Proposition 35: I could do better work when accomplishing tasks.

34
Proposition 36: Before handing out finalized work I check all the details many times, just to be sure.
Proposition 37: I trust my subordinates and colleagues so much that I don’t check the details in finished work.
Preemptives are people who have an obsession about the early completion of tasks and assignments. They are trying to achieve a feeling of control by getting everything ready as fast as possible. They are willing to move to new assignments as quickly as possible. Waiting for and helping their peers is not the best of their features. This means that they are not good team players. From their own point of view they are doing the best work they can. (Berglas 2004) Preemptives are not so harmful in terms of keeping to the schedule, but might be very harmful for the atmosphere of the working environment. Hence the potential to be preemptive should be assessed.
Proposition 38: I hurry tasks even when it is not needed, just to be sure that I’m on time.
Proposition 39: Others slow down my work.
Proposition 40: I’m very quick to accomplish tasks.
Proposition 41: I have too many unfinished tasks.
Proposition 42: I’m faster when working alone than in a team.
People pleasers are persons who cannot say no. They will take more and more responsibility for different issues. The result will be that they are not able to accomplish their work and start delaying everything they are involved in. People pleasers try to buy acceptance by behaving like this, but with too huge a workload they are in danger of burnout. People pleasers also, after some time, nurse deep anger towards others because of this overwhelming situation and feeling of insufficiency. (Berglas 2004) People pleasers can also be seen as people who probably are most willing to take monkeys from other people’s back to their own back, if somebody asks for it. This is how people pleasers will always be persons who have the initiative which everybody are waiting. Delegating skills are something for people pleasers to develop. (cf. Oncken & Wass 1999) Even though people pleasers seem to be very helpful and good members of the working society, being a people pleaser is not good either for the organization or the person him/herself. Hence the following propositions are made for assessing the power of this personal trait.
Proposition 43: I take new tasks only if I have enough time.
Proposition 44: People understand how much I work.

35
Proposition 45: I have to prolong things because I have so many unfinished issues.
Proposition 46: I agree to take new tasks, which my boss asks me to do, even when my schedule is full.
Proposition 47: I agree to take new tasks, which my peers ask me to do, even when my schedule is full.
Proposition 48: I agree to take new tasks, which my subordinates ask me to do, even when my schedule is full.
Proposition 49: My superiors recognize how much work I do.
Proposition 50: I help others, even when it jeopardizes accomplishment of my own work.
Proposition 51: When I’m helping others, I can keep up with schedules.
Proposition 52: I use my free time to helping others in their tasks.
Proposition 53: I take initiative to myself from my subordinates or peers.
Proposition 54: My schedule is filled by tasks that could be easily delegated.
Procrastinators are people who postpone task initiation and, in the worst case, even undermine their own work. In order to delay, procrastinators might use the sentence: “I’ll do that as soon as I get monkey off my back.” By undermining their own work, they might find several reasons why the achievement or result of the work is not better, when the reasons are actually self-made or at least largely exaggerated. The problem in both cases is that monkey never leaves and pretexts never run out. Procrastinators are people who will delay their starting and/or accomplishment to the last possible moment and start panicking in the situation. What is worse, they could also often infect others with this panic. Interruptions by other tasks and unexpected crises also very often influence procrastinators’ work and lower their performance. Actually, procrastinators are in fear of that they will not succeed well enough in their tasks. For this reason there is always a handicap to be found in situations. Even sincere praise after a successful task might sound in the ears of a procrastinator that more and better work is needed from them. Procrastination is probably the worst feature of “time burgling.” (Berglas 2004) Hence, the possibility of being a procrastinator should be identified and pointed out to the person in question. The following propositions are used for that purpose:
Proposition 55: I start to work at the eleventh hour.
Proposition 56: I finish my tasks very near the deadline.

36
Proposition 57: I fear that I don’t manage my work well enough.
Proposition 58: Small incomplete things disturb me when bigger task should be started. E.g. before starting bigger tasks I want to organize my emails or archive shelves.
Proposition 59: I master my work.
Proposition 60: Appraisals are given just to get the appraised person work more and better.
Proposition 61: My working circumstances/environment are so good that I can do my best.
Proposition 62: The situation is so bad that I can’t do my best.
Proposition 63: I can achieve as good quality as I should.
Proposition 64: I start accomplishing tasks too late.
Proposition 65: I can keep up with my scheduled tasks.
Planning personality is also a personal trait which will affect peoples’ way of experiencing time. Because of the nature of managers’ work, planning personality is selected to this first version of C&K application. Managers, lead, manage and plan activities for other peoples and it is the reason why it is very essential for managers to understand their own planning personality.
People seemed to be characteristically optimistic towards schedule predictions and this optimism will be multiplied if there is new technology involved. People tend to concentrate on their own planning forward rather than utilizing already known information and “outsiders’” experiences from past of incorrect predictions and schedules. Optimism in plans is higher if there are political or commercial pressures or there are financial incentives promised for the quick accomplishment of the task. If a person also has the tendency for procrastination, an optimistic prediction is even more likely. Strong goal-orientation might also have its costs in the preciseness of judgment capability. Affinity to details is also found to affect, so that scheduling is made in too optimistic a way. The more details and accuracy in the plan will make more error in the schedule. (Buehler & Griffin 2003) There is, on the other hand, proof that the intense expectation of the early accomplishment of tasks will become an example of Lucas critique. The Lucas critique is a model made by Robert Lucas, a macroeconomist who found that in macroeconomics there is a chance that a forecast will create feedback which will change the situation, i.e. cancel the effect. (Lucas 1976) In this scheduling case it means that, a late accomplishment forecast, could speed up the work. In some

37
cases, where all resources could be dictated, this might be possible. In larger projects all assets just cannot be adjusted and the best prediction might be done by careful looking at the past. (Buehler & Griffin 2003) Because of the robust nature of future optimistic behaviour it cannot be neglected. If a person sees that s/he has the tendency to an over- optimistic future approach, it has to be taken account especially in time management. A person’s way to think in the long perspective or short perspective will also affect the way person is driven by or bound to time. A longer perspective will decrease these effects. (Harung 1998) Hence, this overwhelming future orientation is harmful and affects time experience, it should be examined by the following propositions:
Proposition 66: My projects/tasks are accomplished later than scheduled.
Proposition 67: When I plan an activities schedule, I benchmark similar projects’ schedules.
Proposition 68: I schedule and plan activities to a very detailed level.
Proposition 69: I try to do miraculous things in a short time.
Proposition 70: I use more time for long perspective planning than short perspective planning
Proposition 71: I’m optimistic about the future.
Proposition 72: I’m very result-oriented.
Proposition 73: I concentrate on things where the deadlines are the closest.
Proposition 74: I have time to make long perspective plans with a holistic perspective.
3.3. Time categories
Jönsson (2000) proposes that before people can manage their time, they have to work with the concept of time through a four-step metaphor. The first step is to recognize that time cannot be either accepted or denied. The second step is to find systematic ways to become aware of your time and its use. In the third step you have own thoughts and ideas of time and you in the middle of it, but you are also able to describe them. In the final, fourth step, you can master the concept of time as the possibility to compare and analyse your thinking of time with other methods and thinking processes. The fourth step should be achieved before more demanding processes can be successfully utilized.
Jönsson’s (2000) steps can be compared to the issues which are handled in chapter 3.7. In first step it is seen that, time changes and that changes are irreversible (Sorli & Sorli

38
2004; Reunanen et al. 2012a, 2012b) and these changes happen whether we like it or not. To this first step of Jönsson’s, one could also add Drucker’s (2005 p.226) ideas of lacking time, which is a unique resource that cannot be stored, is perishable, irreplaceable and has no substitute. These attributes of time cannot be either accepted or denied. Jönsson’s second step covers the issues dealt with in chapter 3.2 concerning experienced time, cultural differences and personal traits towards time and the issue of recording it. The third step can be seen when a person could e.g. plan effectively and correctly future operations, by utilizing distributed (outsiders) knowledge and own consciousness predictions and decisions towards time, in such a way that it will be correct when scrutinized afterwards. This means overcoming e.g. one’s own biases, which will constantly make errors in schedules. These errors made in schedules will drive persons to situations where time becomes a negative factor. The fourth step means that people could utilize kairos type (proper) time to their own benefit and still not lose control of the chronos type of synchronization with the environment. Handling kairos also means that a person could easily compare issues such processes and time and widen the conscious understanding and experience of time in such a way as to give an advantage, compared to a person who just uses time as a method of counting minutes and seconds.
After understanding time, comes the problem how to manage it. Drucker divides time management into three different processes: recording time, managing time and consolidating discretionary time into bigger sections. Managers should start by analyzing where their time goes. This requires time to be recorded. In managing a process, managers are cutting unproductive demands away from their time. Discretionary is the time in which a manager does the tasks s/he chooses to do. (Drucker 2005 pp.225-240) This allocation of time is used in this thesis as the top level of time ontology supported by chronological time and experienced time issues.
Managers’ time is categorized by different points of view. Oncken & Wass (1999) also categorizes managers’ time in three categories: interaction between themselves and their superiors, peers and subordinates. Boss-imposed time is used when accomplishing activities that the managers’ superiors require or activities that cannot be disregarded without a rapid penalty response. System-imposed time is time that is used to accommodate peer requests and active support. Neglecting activities in system-imposed time causes a penalty at some point in the future. Self-imposed time is used to managers originate or promised activities. Self-imposed time is divided to two: subordinate-imposed time and discretionary time. Subordinate-imposed time is time what is defined as time where manager takes the tasks and activities (or monkey as Oncken & Wass name it) from the subordinates to themselves. This means that the manager takes subordinates’ responsibilities, problems and work to be accomplished by the manager him/herself. Taking the monkey to the manager’s back could also mean that the manager holds something, e.g. information or a decision that the subordinates need to

39
accomplish the task. This can be understood so that the initiative is transferred to the manager. Discretionary time is the manager’s own time. (Oncken & Wass 1999) Discretionary time can be understood as the time where a person could choose what to do without boundaries (e.g. decide to go play golf alone) or as a time where person is free to choose what to do regarding their job (e.g. play golf with a partner company representative). (cf. also Drucker 2005)
Managers’ time could also be categorized by different activities or by time used with personnel from the manager’s own organizations (insiders) or people outside of own organization (outsiders). The Italian study of CEOs’ time usage (Bandiera et al 2011) divided executives time usage into meetings, working alone, phone calls, public events and business lunches on an activity level. The study also covered the time usage division between insiders only, insiders and outsiders and outsiders only and time usages correlation to companies’ performance. Naturally time usage can be categorized differently. In older studies, the division was made concerning empirical (work sample) studies of managerial time (Oshagbemi 1995). In these studies, which are reviewed in Oshagbemi’s study (1995) other categorizations are made by time used for different managerial activities to deskwork, meetings, giving or receiving information, work done in different locations to one’s own office, home, own organizations other units or other organizations, time worked with different personnel from one’s own organization to alone, subordinates, colleagues or superiors and by the time worked with different amount of persons to alone, with one person, with two or more persons. Tengblad (2002) also delivered an interesting allocation of time spent in travelling, time worked from home and the division between different communications tools, such as the Internet and email. Also the total time used to work and duration of different activities are common issues that were studied and categorized in former studies. Managers time has been also categorized in self-time, interactional time and organizational time (Turnbull 2004), clock time, organic time, strategic time, spasmodic time (Butler 1995 according to Middleton et al 2010), entrepreneurial time and time as cooperation (Middleton et al 2010), just to mention a few.
Noteworthy is that many of these studies divide managers’ time to free time (not working time) and working time. Working time is divided into somehow socially integrated time such as meetings, team work, public representations etc. and independent managerial time such as planning, strategic thinking, analysis etc. i.e. “deskwork”. Because there is no requirement that independent time is done at the work desk, deskwork as a word will not represent nowadays the way to use independent managerial time. Independent time is divided yet again into time used in compulsory activities and time that is used as free-to-choose activity time, i.e. the discretionary time described above. Compulsory activities are also divided into boss-imposed, system-imposed and subordinate-imposed time. In this thesis, the time categories chosen are those gathered in this paragraph. The reason for this division is that it will give an
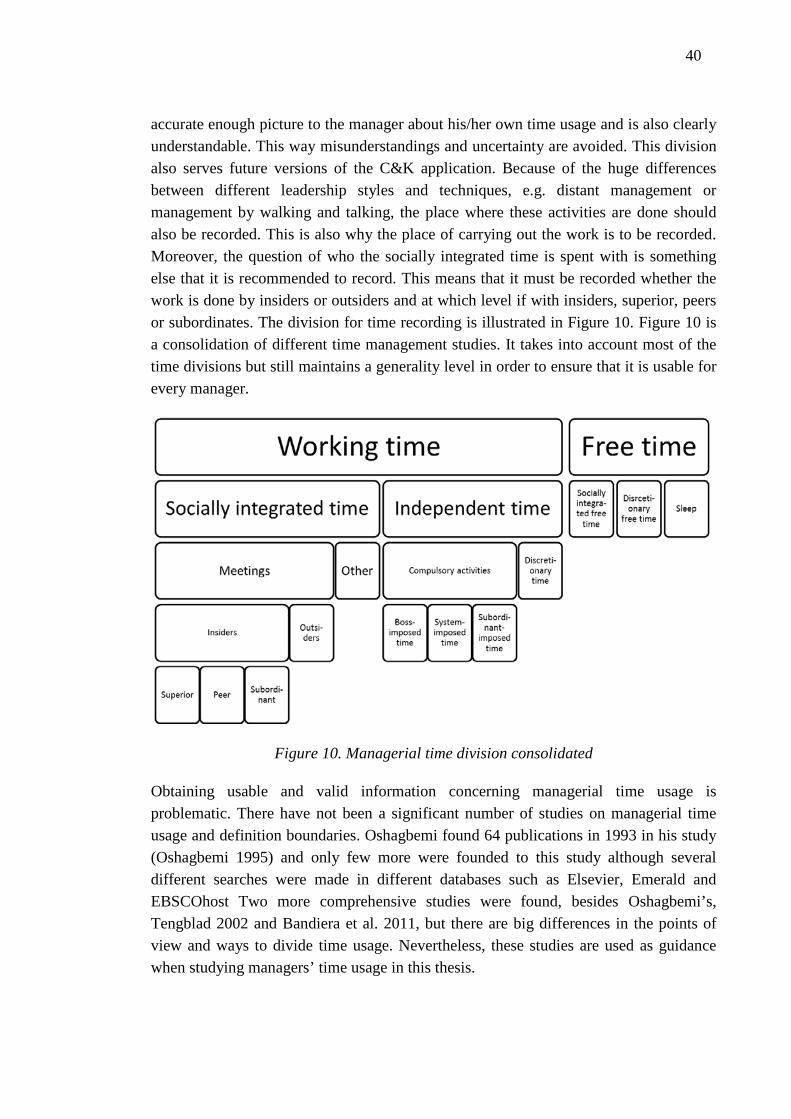
40
accurate enough picture to the manager about his/her own time usage and is also clearly understandable. This way misunderstandings and uncertainty are avoided. This division also serves future versions of the C&K application. Because of the huge differences between different leadership styles and techniques, e.g. distant management or management by walking and talking, the place where these activities are done should also be recorded. This is also why the place of carrying out the work is to be recorded. Moreover, the question of who the socially integrated time is spent with is something else that it is recommended to record. This means that it must be recorded whether the work is done by insiders or outsiders and at which level if with insiders, superior, peers or subordinates. The division for time recording is illustrated in Figure 10. Figure 10 is a consolidation of different time management studies. It takes into account most of the time divisions but still maintains a generality level in order to ensure that it is usable for every manager.
Figure 10. Managerial time division consolidated
Obtaining usable and valid information concerning managerial time usage is problematic. There have not been a significant number of studies on managerial time usage and definition boundaries. Oshagbemi found 64 publications in 1993 in his study (Oshagbemi 1995) and only few more were founded to this study although several different searches were made in different databases such as Elsevier, Emerald and EBSCOhost Two more comprehensive studies were found, besides Oshagbemi’s, Tengblad 2002 and Bandiera et al. 2011, but there are big differences in the points of view and ways to divide time usage. Nevertheless, these studies are used as guidance when studying managers’ time usage in this thesis.

41
3.4. Recording time
As is described in chapters 3.1 and 3.2, it is quite difficult to estimate correctly one’s own usage and utilization of chronological time. Therefore it is reasonable and strongly recommendable to record one’s own time usage. After all, the synchronization of time with others is one of the key issues in business. Synchronized chronological time is the time, which says whether something is done on time or not and when, at least in the present business atmosphere in Finland. Recording can be done in many different ways, but should be done in the way that is used over and over again, so that the results are comparable with each other. Also, a selected approach for time ontology stated that the first step in time managing processes (Drucker 2005 pp.225-240) is to record one’s own time usage.
Recording time should be started by choosing a reasonable accuracy level and record time usage for a period of time. However, before this can be done reliably by the test subject him/herself, managers need to consciously understand their own approach and biases towards time. Therefore, Jönsson’s (2000) four steps must be mastered. Especially a person should made clear to her/himself which way s/he will be affected by the issues in chapter 3.2. Because of these requirements, jumping directly to recording when developing time management is not recommendable.
Studies that have been done before are different in many points of view. The method how information is gathered can be indirect or direct. The direct method means that the researcher will be observing a manager all the time or the manager’s actions are recorded by e.g. video camera. The indirect method usually depends on a persons’ memories or estimations. (Oshagbemi 1995) Either way it is possible to carry out scientific studies, it is a matter of decision. The next decision emerges from different precisions as to what would be counted as activity or change of it. Some studies count only 15 minutes intervals as activity (as in Bandiera et al 2011) and some counted in five minutes intervals. (Oshagbemi 1995) Because of the subjectivity of the indirect method and peoples’ different orientation towards time, the results could be tremendously biased. For instance, Oshagbemi suggests that there may be some guessing involved in the answers (Oshagbemi 1995). C&K is going to be a personal evaluation and training tool and also a tool for managerial consultation and coaching. Therefore, there is no sense to try to make very accurate recordings of time usage. Also, a direct method where the researcher, or coach or consultant records all activities for a longer period will need too many resources in the form of time and money, to accomplish. This why a recommendable interval will be 15 minutes and the method for gathering information will be diary-based. Managers should fill in a template of their time usage after every day, for example for a week, and this is repeated after a while. In a tool like C&K, the test subjects’ honesty and motivation to develop themselves will

42
play a major role in the results. After all, why bother getting a coach or consultant, pay them and then be dishonest?
Hence, the issue of recording time is considered to be important when trying to master time the following propositions are given. These propositions involve measuring the level of a person’s understanding towards time, especially a person’s capability to understand how much time s/he uses for different activities. In other words, the person’s awareness whether time is wasted on secondary issues or used wisely. Also other features, such as hecticness, are partly covered by these propositions.
Proposition 75: I can separate work time and free time.
Proposition 76: I can concentrate on one issue at a time.
Proposition 77: My work is divided into shorter time periods than 15 minutes per time.
Proposition 78: After a working day, I’m aware of where I used my working time.
Proposition 79: I record my time usage.
Proposition 80: I try to benefit from the information of where I use my time.
For a better utilization of time recording, a future application might gather the time usage tables and show the trends and tendencies where the person’s time usage is going. According to this information, the application will assess whether the direction in accordance with the person’s needs and will to develop, is desirable or not. Consequently, this feature in the application will need new approaches and in ICT development this feature is only taken into account in future versions of C&K.
3.5. Managing time
There are different points of view where modern technological solutions have enabled managers to either slow down or accelerate the speed of their actions (Senge 1990, according to Turnbull 2004). The obsessive need for time management comes from the need of handling the overwhelming acceleration of speed (Covey 1992, according to Turnbull 2004). Time could also be fragmented into too small pieces and activities so that the synchronization of timetables can become difficult and even affect a manager’s life quality (Turnbull 2004). This is the reason why it is very important for managers to manage the activities and time usage in bigger portions and especially when talking about discretionary time. Nevertheless, whether it is discretionary time meant by Drucker (2005), free willingly used working time, or Oncken & Wasses (1999) free time. Bigger portions may also enhance the productivity of the time used. Drucker

43
(1967 p.31) states that people should feel that “we have all the time in the world.” What Drucker meant with that statement is that more will be done in bigger portions of time without too much interruption.
Managerial time usage should be as productive as possible. Naturally, every workers time should be so, but managers especially. The Montreal declaration from the World Confederation of Productivity Science (1988) states that productivity has three components. Hence, managerial time usage also has three components to fulfill to be considered as productive time usage, effectiveness, efficiency and occupancy. Effectiveness in time usage means that the time used for an activity that has a genuine need. Efficiency means that the activity is accomplished so that no more time than really is needed is used. Occupancy means that the effective and efficient time has no interruptions. (Harung 1998) Drucker (1967) point out this issue of occupancy when talking about bigger portions of time and especially in discretionary time. But out of these three components, it must be recognized that effectiveness is the primary and driving component. According to Harung (1998), Dahl (1990) has stated that efficiency is irrelevant if the whole activity is something that we should not do at all. Effectiveness of production was pointed out in the automation industry with a memorable phrase “if you automate rubbish, you will get automated rubbish.” Hence effectiveness, efficiency and occupancy are considered to be crucial to productivity so the following propositions are to be delivered.
Proposition 81: My schedule is filled by very short activities.
Proposition 82: I can concentrate on issues that have a real need.
Proposition 83: I have my schedule filled efficiently.
Proposition 84: I divide my schedule into as big parts as possible.
Proposition 85: I work less but in a concentrated way rather than much and efficiently.
Proposition 86: I use multitasking more than concentrating on one issue at a time.
Proposition 87: My work is meaningful.
Proposition 88: I have time for proper concentration towards my tasks.
Proposition 89: My work needs an efficient approach.
Proposition 90: I use my free time very efficiently.
Proposition 91: I can keep my holidays as I like.

44
Proposition 92: I can have my free time in long chunks.
Proposition 93: I can concentrate on tasks I have chosen until they are accomplished or a natural place for a break is found.
However, it can be observed that the productivity of human work and the manufacturing industry can be very different. Humans are not machines and are not best in their productivity if effectiveness is understood in the same way as in e.g. the manufacturing industry. Humans need an idling type of time, which in this thesis is termed discretionary time.
Turnbull (2004) founded that managers had challenges to synchronize the demands of organizational time and still have time for interaction. In many cases managers’ self-time was restricted. These actions will lead to diminished discretionary time, which will lead to a deterioration in effectiveness, efficiency and occupancy of the manager. Hence self-time, discretionary time and free time are all needed, so the following propositions are listed to assess whether a manager has enough free time. The answers to these propositions are also influenced by job satisfaction and level of haste.
Proposition 94: My free time is interrupted because of work issues (phone calls, checking emails etc.).
Proposition 95: I take my vacations in shorter phases, because the needs of work.
Proposition 96: I read my work emails and other messages on free days, weekends and holidays.
3.5.1. Time management approach
Time management has been studied quite a lot in management literature. This thesis is not going to handle all different time management practices and theories, but some kind of upper-level checking might be beneficial to be taken into account in this first version of C&K. For this upper-level checking, a model is used which is introduced in Burt et al. (2010) article concerning their approach called TiME (Time management environment). Figure 11 presents this model.

45
Figure 11. Integrative model of time management (Burt et al. 2010)
As is seen, this model partly handles the same issues as has been handled in this thesis. This model will provide a good starting point when examining issues concerning time management as an intentional activity and attributes which make this activity possible. It is seen from Figure 11 that time management needs skills and knowledge which could be attained from training. This model also reveals one very essential point of view. This is the question regarding the time demands of the job. If the job’s time demands are very low, this issue of time management might become futile or at least not the first on the development list. If the job is not e.g. synchronized with others or shortened execution times do not give any advantage, time management might then not be most important issue to enhance. One big issue is whether the organization’s environment is positive or negative towards time management. A positive environment in a time-demanding job will facilitate time intentional time management behaviour and a negative environment results in stress, dissatisfied people and possible personnel turnover. Burt et al. (2010) states that time management behaviour will have a beneficial effect on positive psychological features such as the perceived control of time. The actual performance will also benefit in the form of punctuality, awareness of time usage, staying on schedule and autonomy in time usage. This autonomy of time usage is especially important for managers and is handled in chapter 3.6 concerning discretionary time. Similar kinds of outcomes have been observed in several empirical studies concerning time management. Studies showed evidence that time management activities enhanced the perceived control of time and job satisfaction. The evidence towards enhanced performance was inconclusive and even negative outcomes were found in forms of job-induced and somatic tensions. (Claessens et al. 2007) Hence to analyse the capability of managing time the following propositions are given:
Proposition 97: I devote organizational time to time usage planning.

46
Proposition 98: I plan my time usage.
Proposition 99: I use my time to intentional planning of my time usage.
Proposition 100: I have had training in time management issues.
Proposition 101: I check afterwards how well I managed to follow my time usage plan.
Proposition 102: I try to benefit from planning of my time usage.
Proposition 103: I have as much time as I need.
Proposition 104: I can control my time.
These propositions are made in order to find out whether a person has had time management training or at least thought about time as an issue which is manageable. The propositions are also used to assess a person’s time orientation.
3.5.2. Managerial time usage
Without knowing a company’s strategies and policies or responsibilities for different managers and executives, it is impossible to say whether they use their time in an effective way, i.e. is there a real need for their work, or not. For this reason, the C&K application should not try to tell or analyse where the best value of used time is to be found. This, probably the most important evaluation, has to be done by managers themselves, someone from their organization or e.g. a consultant that is very familiar with the situation in the company. Efficiency and occupancy on the other hand can be evaluated and development tasks can be appointed for those issues. It still might be useful to review how managers use their time and how it has been changing over the years. Some indications might be done in some kind of extreme cases. If a manager founds that s/he spends time in alarmingly different ways than the other managers have used in these reviewed researches, there might be something to check in time usage. Yet again it is impossible to say is the different usage better or worse, but careful checking is advised to do if the results are tremendously different.
According to studies gathered in Oshagbemi’s (1995) study, managers were working between 40-70 hours per week. Some managers even reported 90 hours weeks. Yet the conclusion of the review study was that the average amount that managers work is approximately 45 hours per week. The variation in the day length was also remarkable. There were reports where some days reached 11 hours and other stayed below 7 hours. One explanation for differences in managers’ amount of working time could be found probably in an individual managers’ motivation, working habits and abilities to manage time. Variations in time management skills explain most of the reasons for a short or

47
long working day. (Oshagbemi 1995) When working days stretch continuously to very long days, it would be wise to check whether all time is used wisely and on right activities. Overwhelmingly long days are hence quite a good indicator that time management is not correct and managers should analyse where the problem is.
In Table 3 it is seen that about half of managers’ time is used in meetings. This time covers all the time used in meetings. These meetings could be periodical, pre-organized or an emergency meeting and they may be meetings with people in different positions from their own organization or another organization. The meeting place could also be anywhere possible. Table 3 shows that roughly 25 – 30 % of the time is used for deskwork. Deskwork in this context means reading, writing, dictating, working with figures and other related activities. Phone calls take 6 % of managers’ time and are categorized as receiving or giving information. (Oshagbemi 1995)
Table 2. Managers’ time usage between independent work, social work and phone calls (Oshagbemi 1995)
Authors
Deskwork
Meetings
Phone calls
Copeman et al., 1963[12]
4
4
5
Brewer and Tomlinson, 1963-64[13] 3
m
6 Hinrichs, 1964[14] 2
5
6 Horne and Lupton, 1965[15] 2
5
9 Thomason, 1966[16] 2
4
NR Mintzberg, 1973[4] 2
6
6 Pitner, 1978[19] 1
5
8 Kaplan, 1979[20] 2
6
9 Kurke and Aldrich, 1979[8] 2
6
8 Duignan, 1980[21] 2
4
11 Willis, 1980[22] 2
6
7 Snyder and Gluek, 1980[23] 2
5
6 Kmetz and Willower, 1981[24] 1
4
8 Sproull, 1981[25] N
6
11 Martin and Willower, 1981[26] 1
5
6 Bussom et al., 1981[27] 2
5
8 Morris et al., 1981[28] 7 7
7
Oshagbemi, 1988[30] 4
4
1 Oshagbemi, 1988[30] 4
3
1 Stewart, 1988[1] 3
4
6 Martinko and Gardner, 1990[2] 2
4
6 Note: NR stands for not reported
Table 3 illustrates how managers’ time is divided between personnel into different positions. According to this, managers use most of their social time with colleagues and subordinates. This could mean that managers minimize time wasted on chatting during office hours. (Oshagbemi 1995) Another suggestion might be that managers could interact with personnel for better leadership and management. If we consider a normal

48
organigram (where a manager has several subordinates and subordinates have one or two leaders) then the difference in managers’ time usage amounts between subordinates and superiors is natural.
Table 3. Managers’ time usage between personnel in different positions (Oshagbemi 1995)
Authors
Alone
Subordinates
Colleagues
Superiors
Mintzberg, 1973[4]
NR
37
NR
5
Cohen and March, 1974[18] 25 29 NR 6 Kurke and Aldrich, 1979[8] NR 37 NR 13 Oshagbemi, 1988[30] 41 7 26 NR Oshagbemi, 1988[30] 39 16 22 NR
Stewart, 1988[1] 34 26 20 8a
Note: a The reported figures do not total 100. This may be due to the exclusion of the figure for outside contacts
NR stands for not reported
Table 4. Managers’s time usage according to different groups of people (Oshagbemi 1995)
Authors
Alone
One person
Two or more people
Perkins et al., 1967[17]
28
25
48
Cohen and March, 1974[18] 25 35 40 Oshagbemi, 1988[30] 41 22 37 Oshagbemi, 1988[30] 39 20 41 Stewart, 1988[1] 34 32 34
Table 4 illustrates managers’ time usage between different groups of people. It is seen that most of the managers’ time is used with two or more people. In quite a present study, (Bandiera et al. 2011) founded that nowadays CEOs used their time a little bit more differently than managers in Oshagbemi’s study discussed above. First of all, their finding was that average CEO uses 47.7 hours to work in a five-day week. (See chart 1.) Hence the study was made so that personal assistants kept a record of the CEO’s time usage; there are only those work hours illustrated which are done so that CEOs’ personal assistants know and it does not include hours worked at home or at the weekend (Bandiera et al. 2011). Tengblad (2002) on the other found in his study that Swedish CEOs worked 12 hours and 22 minutes per day as a median, if all the work was divided into a five-day week, or almost 62 hours per week as a lump sum.

49
Chart 1. Total amount of CEOs working time a 5-day week (Bandiera et al. 2011)
CEOs also spent most of their time with other people in the Bandiera et al. study. Chart 2 shows that when the time used in meetings, phone calls and public events is gathered together, CEOs used 85 % of their working time with different people.
Chart 2. Division of managers’ time into different activities (Bandiera et al. 2011)
It is noticeable that time spent in meetings has not change significantly over the years when comparing Oshagbemi’s study to that of Bandiera et al. What has changed is the time worked alone. It has reduced from the Oshagbemi study from 25 -30 % to 15 % in Bandiera et al.’s study or to 10 % in Tengblad’s study. This thesis does not analyse or state whether it is good or bad, but the change is remarkable.
Chart 3 illustrates how a CEOs’ time spent with people is divided into insiders (people from own organization) and outsiders (people from other organization). From the insiders category group, the top five subcategories (representatives from different functions) with which CEOs are using their time are finance, marketing, business unit

50
directors, strategy personnel and human resources. From the outsiders category, the top five subcategories were clients, suppliers, investors, consultants and banks. (Bandiera et al. 2011)
Chart 3. CEOs time used with people divided into "insiders" and "outsiders" (Bandiera et al. 2011)
Hence benchmarking with previous studies poses more propositions. Propositions were made in order to find out how much people work in different positions. Answers to these propositions give also possibility to find correlations between time used to work and persons’ knowledge level towards time, traits, etc. The level of haste and job satisfaction are also assessed via these propositions.
Proposition 105: I don’t have time to do “paperwork” during office hours. I usually do this kind of work at home (or e.g. hotel if travelling).
Proposition 106: I work more than 45 hours a week, counting all time used for work issues. (Not time used in commuting.)
3.6. Discretionary time
The fragmentation of managerial time is one of the biggest threats to a manager’s productivity. As discussed in chapter 3.5, good productivity needs occupancy and occupancy means interruption-free working time. Naturally occupancy is also needed in meetings (Drucker’s idea of having all the time in the world), but especially when the person is concentrating on something in independent working time, interruptions can be disastrous for productivity. As Drucker (2005) raised discretionary time as one of the top issues in time management and hence the foundation of a good manager, it is vital that discretionary time has as much occupancy as possible.

51
As found in the studies addressed in chapter 3.5.2. on managerial time usage, independent time is rare for managers. And the tendency is that it will become even rarer. When bearing in mind the fact that not all independent time is discretionary time, discretionary time becomes rarer still. The task here for managers is to ensure that these rare moments of discretionary time should be affirmed so that emails, phone calls or random visitors will not interrupt these moments. Even though it is impossible to say, without knowing exactly the nature and purpose of work for each individual manager, the required amount of discretionary time, it might be beneficial to check how large a proportion of independent time has been found in previous studies. Tengblad (2002) studied Swedish CEOs’ time usage and compared that to a similar study done in 1951 by Carlson. The interesting results are shown in Chart 4.
Chart 4. Fragmentation of managerial time (Tengblad 2002)
Tengblad’s findings mean that nowadays CEOs have longer periods of uninterrupted independent time than in former times. Interruption frequency was half compared to Carlson’s study. This is quite a surprising result when considering that the development of communication systems has been tremendous in the 50 years between these studies. The purpose of this thesis is not to study the reasons for this or to find arguments against or in favour of this result, but it seems very strange that communication by email and mobile phone etc. has made it possible to be uninterrupted by them.
Hence the following propositions are to be presented when analysing managers’ discretionary time:
Proposition 107: I reserve discretionary time in my time planning
Proposition 108: I have to use reserved discretionary time for the execution of operative tasks.

52
Proposition 109: I’m available all the time. I can’t shut down my mobile phone or email.
Proposition 110: My working time consists only of working with other people.
Proposition 111: I need independent working time.
Proposition 112: I can work for over half an hour without being interrupted.
Proposition 113: I reserve time for idling in my work time.
3.7. Conclusion of time ontology
The time ontology for C&K is thus concluded. The ontology includes levels and propositions for the manager’s way to experience, understand record and manage time. The thesis will also provide information on managerial time usage, and the effectiveness, efficiency and occupancy of this usage. Managerial situations were also studied and how these situations affect managers’ time experience. Personal traits were also indicated as were factors which probably influence a manager’s way to lead people and manage issues. The ontology could then be positioned between leadership and management, as shown in Figure 12.
Figure 12. Time ontology.
The time ontology consists of six different levels: chronological time, experienced time, understanding time, recording time, managing time and discretionary time. The final level could also be called mastering time. This ontology can be referred to as Bloom’s taxonomy. Bloom’s taxonomy is a classification scheme for educational goals and objectives. This taxonomy was first introduced by Bloom, Engelhart, Furst, Hill &

53
Kratwohl 1956 and later on revised by Anderson & Kratwohl in 2001. The taxonomy also possesses six levels and every following level requires mastering of all the levels before it. These levels are shown in Table 5. (Kratwohl 2002)
Table 5. Comparison between Bloom’s reviewed taxonomy and time ontology
LEVEL NUMBER
ATTRIBUTE DEFINITION COMPARISON TO TIME ONTOLOGY
1 Remember Retrieving relevant knowledge from long-term memory.
Chronological time
2 Understand Determining the meaning of instructional messages, including oral, written, and graphic communication.
Experienced, Understanding time
3 Apply Carrying out or using a procedure in a given situation.
Recording and managing time
4 Analyse Breaking material into its constituent parts and detecting how the parts relate to one another and to an overall structure or purpose.
5 Evaluate Making judgments based on criteria and standards.
6 Create Putting elements together to form a novel, coherent whole or make an original product.
Discretionary time
Bloom’s taxonomy’s levels cannot be compared directly to levels in the time ontology, but some connections are very enlightening. Remembering can be compared to remembering the nature of chronological time. Understanding is comparable to understanding time. Applying on the other hand is comparable to managing time and is possible only after analysing and evaluating time, both of which could be located under recording and managing time. The connection in the latter three is not so obvious. Create is comparable to discretionary time. It can be said that if a person is on the discretionary level, the person is capable of “creating time”, i.e. he/she has mastered time for his/her benefit.
As mentioned above, time is one of the key issues when analysing a manager’s leadership and management. These issues in time ontology should be taken into account in leadership ontologies and management ontologies. Because of the limited size and

54
structure of the Master’s thesis, these ontologies are not handled here. There is a strong suggestion that these ontologies should also be revealed.
3.8. Structure for demonstrator
The ontology itself is hereby presented to be like the one shown in Figure 12. Its six levels are constructed from numerous different structures and issues. This thesis has handled the following issues in the structure, which is also used in the research demonstrator. The world itself is not so hierarchical as the structure pointed out here but the strongest links of the issue seem to be working as indicated in the structure of the list below. The list has been made to ease understanding of the incentives behind the categories and ultimately behind the levels in the ontology.
• Managing time o Understanding time
Awareness of time • Time as a resource: The person is aware of time’s special
character as a resource. The person sees differences compared to other resources such as money or staff.
• Time as an undominated phenomenon: The person understands that time is a phenomenon beyond human control.
• Value for humans: The person sees time as valuable for human beings.
Recording time: The person has recorded time in order to benefit from it. The person sees that recording is a way to understand his/her own time usage correctly.
Productivity Effectiveness: The person is aware of which kind of time usage is effective. The person uses their own time in an effective way.
Productivity Efficiency: The person is aware of which kind of time usage is efficient. The person uses time in an efficient way.
Productivity Occupancy: The person is aware of which kind of time usage occupancy is. The person concentrates on one thing at a time.
o Situation Level of haste
• Workload: Level of haste caused by the workload. Persons need to lessen or increase the workload.
• Scheduling: Level of haste caused by wrongly made scheduling. Need to enhance scheduling skills.
• Experienced Time o Situation
Level of haste

55
• Abstract: Level of haste experienced. Things which are felt but cannot be directly identified.
• Concrete: Concrete things that raise the level of haste. Concrete things which the person can point out.
Level of satisfaction • Motivation: Satisfaction level achieved from the person’s
motivation. • Development: Satisfaction level gained from the person’s
development activities. • Work-life balance: Balance between work and free time.
Rest: Possibility to rest enough and recover from work. o Personal traits
Perfectionist: Level of perfectionism. People pleaser: Level of being a people pleaser. Procrastinator: Level of being a procrastinator. Preemptive: Level of being preemptive. Optimistic planning personality: Level of optimistic planning
personality. o Timo Orientation
Discretionary orientation • Free time: The person’s level of orientation towards their
own discretionary free time. • Working time: The person’s level of orientation towards
their own discretionary working time. • Thinker time: The person’s level of orientation towards
their own thinking time. Future orientation: The person’s level of orientation towards the
future perspective. Present orientation: The person’s level of orientation towards the
“here and now” perspective. As seen above, the ontology and structure for the demonstrator are not exactly the same. The reason for this is that the ontology is an upper-level knowledge model and the structure for the demonstrator is a research structure for coaching and understanding the test subject and his/her situation. The structure serves the application building and coaching process better. The development of this demosntrator is handled in the next chapter, chapter 4.

56
4. DEMONSTRATOR
One of the thesis’ objectives is to create a computer-based self-evaluation and decision- support tool for managers. The tool is supposed to be used either independently or as part of coaching and consultation activities. It could also be used for further research and therefore it has been decided to establish this tool in an existing and tested platform. The programming and technical parts of building the C&K demonstrator in the Evolute environment were done by Dr. (Tech.) Jussi Kantola.
As mentioned in chapter 1.4 where the exclusions were discussed, the demonstrator used in this thesis will not cover the whole process of self-development. Figure 13 illustrates the whole process from the top level and is derived from the idea of the Ingenious management process (Kantola 2005).
Figure 13. Coaching process (applied from Kantola 2005)
The C&K application covers the evaluation, analysis and target planning phases of the whole service concept. The application is the core of the evaluation and computational analysis as well as target planning for the upper level. Figure 13 also illustrates the idea of how the application could be used in coaching, consultation and in an independent self-development tool. The first cycle, (the first time an individual uses the application) should start with a plenary introduction and adaptation to the issue and application. The first cycle should also include training. Depending on how familiar the issue and self-development activities are for the new user, the second and further cycles can be done more independently. Naturally, decisions are made individually and case by case, recognizing personal needs, available resources and the results achieved, etc.

57
4.1. Evolute
The demonstrator is made in the Evolute platform which “provides an intelligent web-based system for managing human competences and organizational objects in the world of business.” It is a platform which provides a place for various research and development activities for academics and other organizations. Evolute process modules visualize organizational and individual senses that could be targeted for management of organizational or individual resources. Applications are based on soft computing and delivered over the Internet. The main services and features in Evolute are (Evolute 2013):
- Focus and target development of key corporate resources, such as employees' competence, knowledge creation and organizational learning activities
- Modular process including the use of the Internet-based Evolute system and workshops
- Coaching and mentoring during the process
- Follow-up of the progress during the process
- Support for entrepreneurs
During the execution of the thesis, Evolute was a platform for 35 different applications (C&K included). All of the applications concern different knowledge-based issues in the world of business. When considering the service possibilities and research opportunities, the demonstrator of this thesis, C&K, has a natural place in the Evolute platform.
4.2. Fuzzy logic
Fuzzy logic is used in the Evolute application in order to process linguistic data in computational, numerical ways. Fuzzy sets are ways to represent vagueness in linguistics. (Lin & Lee 1996) These systems possess powerful reasoning capabilities. Fuzzy logic is used in the application to handle the imprecise information which is the nature of information in the human decision-making processes. There is also natural fuzziness in the evaluation processes of individuals. (Kantola et al. 2004)
Fuzzy logic controllers usually consist of four modules: fuzzification, interface, rulebase and defuzzification. (Klir & Yang 1995) These modules are presented in Figure 14.

58
Figure 14. Evolute architecture (Kantola 2005, p.33)
The Evolute platform contains all four modules presented in Figure 14. The operational logics of the application work in the following four phases:
1. Phase one takes place in the fuzzification module. The propositions describing personal knowledge, feelings, attitudes and opinions towards time are evaluated. Evaluation is done in the manner that the individual uses language without numbers and steps. All aspects of time and different related features are described in linguistic terms on a continuous scale. These inputs are then fuzzified, i.e. converted into fuzzy sets based on propositions. (Kantola et al. 2004; Kantola et al. 2005)
2. Phase two takes place in the Fuzzy inference module. After fuzzification, the inputs are then set in an inference engine. The fuzzy inference module applies the GMP (generalized modus ponens) inference method. In the inference engine, inputs evaluate the dynamical fuzzy rules in the rulebase(s). This phase results in a fuzzy set for each feature of time (inferencing). (Kantola et al. 2004; Kantola et al. 2005)
3. The third phase is a conversion of fuzzy sets into crisp feature values and reports and happens in a fuzzy rulebase. The rulebase contains the general rules of the application and the importance of propositions (Kantola et al. 2004; Kantola et al. 2005) describing time and issues related. Graphical reports consist of statistical information for individuals.
4. The final phase is executed in the defuzzification module. This is the module where the fuzzy sets are converted into crisp meta-classification values, i.e. deconstructed to the perception of feature. Graphical reports are again made for individuals from these values. The defuzzification method used is the “Center-of-Area”. (Kantola et al. 2004; Kantola et al. 2005)
All the data is stored in the system for further use and forthcoming research. Individual users can then compare their present results to their previous results and see the

59
development and proceedings in a graphical way. This also provides a good tool for coaches and consultants to follow their clients’ development. Cumulative data and information will provide opportunities to enhance the tool and make adjustments regarding propositions and feedback from an ever-growing sample group.
4.3. Using the demonstrator
The demonstrator usage is very simple for the target group. For every proposition there are two dimensions to adjust: recent status and future goal. Diagrams 2 and 3 illustrate the kind of view the respondent has regarding the propositions.
Picture 2. Sample proposition of C&K. Respondents’ point of view
Picture 2 is a screen capture from the demonstrator. The particular proposition seen in picture states that “My work is very hectic.” The answering scale in this proposition is from never to always. The scale is analogical, so that the slides can be adjusted freely. Note that the neutral middle point is missing. In this proposition, it is considered to be so that the test person’s situation is hectic nearly always. In the future s/he wants to decrease these types of situations.
Picture 3 is also a screen capture from the demonstrator. This proposition is different from its nature. “I can keep up with my scheduled tasks.” Compared to the former example in picture 2, this is something that people usually want to enhance. Therefore, the target is set higher than the current situation. From these two examples, it is seen that both ways, directly and indirectly proportional, are used when finding a persons’ current status and will for future target status. What should be mentioned is that all the answers and directions in any propositions are right from the respondents’ point of view. There are no right answers or wrong answers.

60
Picture 3. Sample proposition of C&K. Respondents’ point of view.
Picture 3 also shows that in that particular moment the respondent has still 163 propositions to be answered. It can be seen from the box to the left of the word proposition. The box is the same box where respondent continues to the next proposition.
The Evolute program also makes back-ups so that if the Internet connection collapses or the respondent needs a break, answering can be continued from the same place. The program also remembers which applications the person has used and saves the data and results for later use.
4.4. Results from the program
Even though the program is very interesting and it provides opportunities to do research in new and distinguished ways, its usage is not the main cause for using it as platform for the C&K demonstrator. The best part of the program is that results are easily stored and further exploited. The program shows results in two different ways. One is for test persons and the other is for the researcher. The difference is that the test person sees his/her own personal results and the researcher sees the total results or different sub-group results. It is also possible for the researcher to observe personal results from a single test person, but if desired, anonymity can be guaranteed.
4.4.1. Results for test persons
The results are shown regarding the features, categories and main categories. There are many different ways of observing the results. Pictures 4 to 8 present the view from the results part of the program as seen from the respondents’ point of view. The pictures are

61
made for demonstration purposes only. Therefore, the information whose results these are is not shown. Blue columns/lines indicate the current state and red columns/lines indicate the target stage. The different possibilities to show the same information are quite numerous. Therefore, not all possibilities are shown in this chapter. These 6 pictures beneath are enough to clarify the idea.
Picture 4 is a screen capture from the program and the other pictures are result images which can be saved from the program. From picture 4, it is seen that features, categories and main categories can be all observed in three different charts. These charts are histogram, web (radar), and line charts. All the charts can be arranged regarding creative tension, evolute-index, not sorted, current state and target state in such a way that the biggest value is at the top and lowest at the bottom. This makes a total of 45 (three times three times five) ways to examine the results.
Picture 4 shows the features level of the results. This is probably the most useful level for respondent and coach, when working to enhance the respondent’s time management. It is the most concrete level where the developed issues are easiest to figure out.
Picture 4. Screen capture from the program. Respondents’ view of their own results. Histogram.
Creative tension can be considered to be quite a good meter when issues to be developed are considered. As seen from picture 4, creative tension can be found both

62
ways. For instance, working time has the biggest value of creative tension when considering features to be enhanced. On the other hand, the feature “abstract” also possesses a very big value as creative tension, but something is to be lessened according to the respondent.
Picture 5. Result image from the program. Respondents’ view of their own results. Web chart.
The same results that are shown in the histogram in picture 4 are shown in picture 5’s web chart and 6’s line chart. Creative tension is more easily found in the web and line charts. Histograms are more easily used when trying to observe which features set to the biggest or smallest values.

63
Picture 6. Result image from program. Respondents’ view of own results. Line chart.
As seen from picture 6, the same data is more clearly shown than in picture 4. Creative tensions and their order are easily understood from the line chart. The program shows positive tension (need to enhance) coloured as green. Negative tension (need to lessen) is not coloured and may cause misunderstandings.
Picture 7. Result image from the program. Respondents’ view of own results. Categories.
The features are gathered in categories which are shown in Picture 7. These categories bind features into bigger issues which should be analysed in the coaching process. For instance, the situation of MT (managing time) is something to be enhanced. Also, the test subject is not satisfied with aspects of his/her time orientation.

64
Picture 8. Result image from the program. Respondents’ view of own results. Main categories.
Picture 8 shows the test person’s situation at the top level of time categories. As seen in picture, the whole issue of chronos and kairos, or time, is simplified into managing time and experienced time.
4.4.2. Results for researchers
The results for the researcher are naturally more detailed and sophisticated than for the test persons. The biggest difference is that researchers can see results from the whole database and could divide data into different samples and groups. Also statistical measures are shown to researchers. The researcher can also handle raw data of inputs and outputs and this data can be transferred to other programs such as different statistical programs.
Researchers can have all similar charts as the test persons in pictures 4 to 8. Picture 9 shows the researchers’ view of the results. As seen from the list in the picture, they can see inputs, outputs, statistics, rankings and demographics of a sample group. Researchers also have the opportunity to add standard deviations (Friedman test) to the result charts.

65
Picture 9. Screen capture from program. Researchers’ view of results. Histogram with standard deviation.
Picture 9 shows the results as applied histograms where the standard deviation is shown. Blue and red columns show the mean of values ± standard deviation. The black line shows the mean. Similar statistical features are shown in chart 5.

66
Picture 10. Screen capture from the program.
Picture 10 shows the same results but in a line chart. Now there are no mean values, but a standard deviation downwards from the current state and upwards from the target state. This is a useful feature when the current state is lower than the target state. However, if the situation is vice versa (the target level is lower than the current level) it is not so clear.
In conclusion, it can be said that the program gives the possibility for a very fast and visual analysis of the results and therefore it can easily be applied in coaching and consulting services. After these visual analyses, and naturally not so accurate, are done, accurate and more positivistic analyses can be done afterwards by scientific methods. Hence, there is something to deliver to the customer right away and more after a while. In that sense, the program qualifies itself as a service tool.

67
5. RESULTS AND DISCUSSION
The results of this thesis were three-dimensional. The prominence of time for managers was handled, a time ontology in leadership was formed and a demonstrator for personal time coaching was developed. Therefore it can be said that the thesis crafted something new for both sides, theoretical and practical. This chapter deals with the results, discusses their reliability and suggests topics for future research.
5.1. Results
The research questions stated at the beginning of the thesis were: How do managers use their time? What issues will affect managers’ time usage and experience of time? What kind of biases have to be taken into account when dealing with an individual manager’s relationship towards time? The research problem is how to support managers to understand and enhance decision making in different situations by studying the concept of time in managerial work. Can these issues and approaches be united in an ontology, which could be easily understood by managers in a hurry and nevertheless be made in a scientific way? The secondary objective was to create a decision support tool for managers and management consultation and coaching.
Literature research revealed that managers use most of their time in socially integrated situations. Also, there is a trend towards reduced independent working time. In just 10 – 15 years independent working time has lessened from 25-30 % to 10-15 % of the total working time. No trend was clear on the number of hours that managers use for their work. It can be stated that managers work time can be almost anything between 40 and 90 hours per week. The median seems to be stationed around 45 – 47 hours per week. Chapter 3.5.1 concentrated on managerial time usage and its analysis.
Issues that affect managers’ time usage and experience towards time were put into different categories in chapters 3.1, 3.2, 3.4, 3.5 and 3.6. An upper level division was made between chronos and kairos, chronological and experienced or objective and subjective time, which all mean more or less the same with the exception that a deeper explanation of chronos and kairos takes into account more than just time. In the demonstrator this upper level division was called managing time and experienced time. This is the main level, where both are needed in order to manage time. Sub-categories were put into categories all of which are somewhat independent entireties that can be developed independently. These sub-categories consist of features that make the
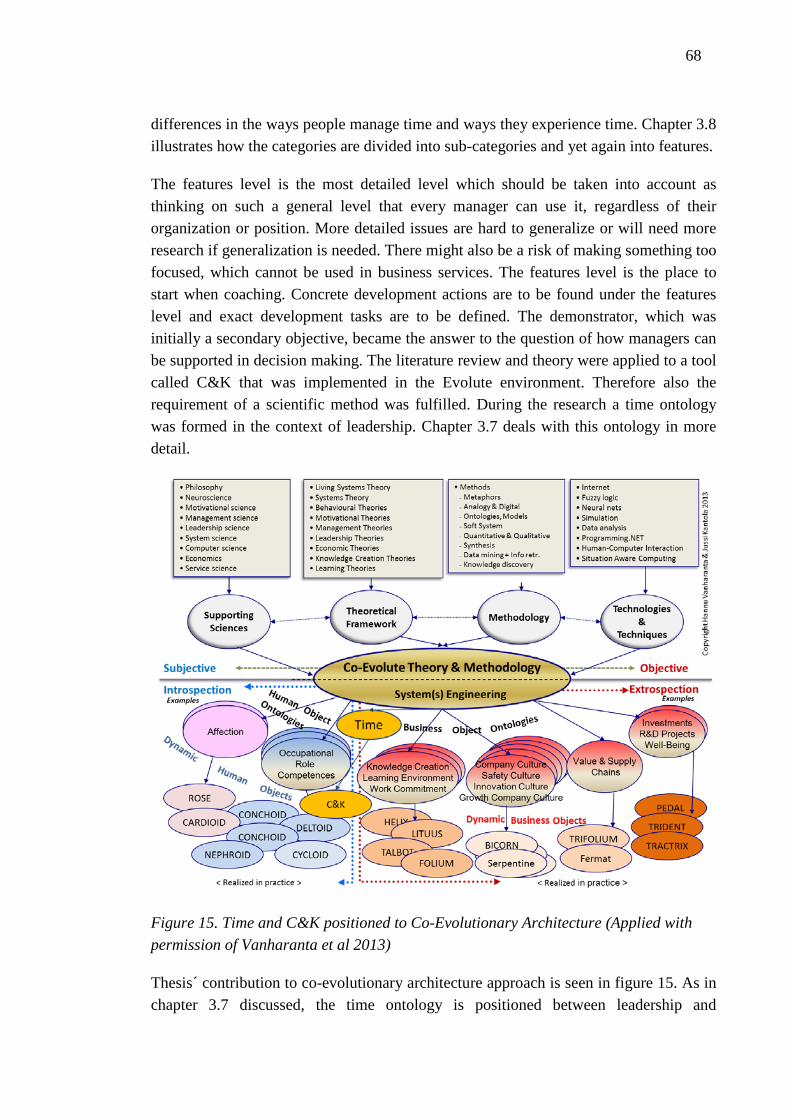
68
differences in the ways people manage time and ways they experience time. Chapter 3.8 illustrates how the categories are divided into sub-categories and yet again into features.
The features level is the most detailed level which should be taken into account as thinking on such a general level that every manager can use it, regardless of their organization or position. More detailed issues are hard to generalize or will need more research if generalization is needed. There might also be a risk of making something too focused, which cannot be used in business services. The features level is the place to start when coaching. Concrete development actions are to be found under the features level and exact development tasks are to be defined. The demonstrator, which was initially a secondary objective, became the answer to the question of how managers can be supported in decision making. The literature review and theory were applied to a tool called C&K that was implemented in the Evolute environment. Therefore also the requirement of a scientific method was fulfilled. During the research a time ontology was formed in the context of leadership. Chapter 3.7 deals with this ontology in more detail.
Figure 15. Time and C&K positioned to Co-Evolutionary Architecture (Applied with permission of Vanharanta et al 2013)
Thesis´ contribution to co-evolutionary architecture approach is seen in figure 15. As in chapter 3.7 discussed, the time ontology is positioned between leadership and
69
management. Hence time is positioned so that it is both, Human object ontology and Business object ontology. C&K is also positioned so that it is included in both ontology perspectives. Because time possesses this two sided nature in Co-Evolutionary Architecture, it can be stated that time is very important issue taken in to consideration when researching leadership and management issues.
5.2. Results from the test groups
The results from the test groups are interesting when comparing individual results to the average results. The C&K demonstrator is made for personal development purposes but the possibility to handle large masses of data provides a good opportunity to further develop the application to be more user-friendly and precise. Charts 5, 6 and 7 show the results from both test groups. The test groups were not so heterogeneous that they should be handled individually, i.e. the results from all 35 respondents are handled as one. Some differences are pointed out and explained regarding the feedback gathered from the test groups if possible. The most interesting differences and results were found between individuals. In both test groups there were larger differences within the group than between the groups. This came up in interviews and in tests made for single results. There were such huge differences that almost completely opposite results were found. These individual results are not discussed in this thesis.
Chart 5 shows a histogram where the features are set in order where the greatest need for positive (add this feature) enhancement is at the top and the biggest need to lessen the feature is at the bottom. The histogram also shows Friedman’s test where the standard deviation is shown upwards and downwards. The mean is shown by black dots.

70
Chart 5. Test group results. Proactive vision.
As seen from Chart 5, the feature which needs most enhancing was balance in life. The feature requiring most reduction was the experienced level of haste. Most of the features were in similar positions in both test groups. The results were not so similar that the positions of the features were exactly the same but there were no clear differences. Considerable differences were found in working time orientation and understanding the nature of time as a resource. The professionals wanted to lessen their working orientation and enhance their understanding of time as a resource and the students wanted the reverse. The magnitudes of development needs were certainly bigger in the student test group than in the professional test group. There were bigger differences found between test group individuals than between test groups.
Chart 6 shows the features in order where the biggest value for the current state is placed at the top of the chart and the lowest value at the bottom of the chart.

71
Chart 6. Test group results. Order by current state.
Optimistic planning personality is given the biggest value. This was the case in both test groups. The current state results differed more between groups than the proactive vision results. For instance, the students valued efficiency much higher than the professionals and working orientation much lower. Free time orientation was also significantly higher in the students group than in the professionals group. Procrastination seems to be the most common personal trait. Students possess a greater tendency to be people pleasers than professionals do. This is the case because as a student you do not have so much opportunity to choose your tasks or negotiate when you will do it. Test group individuals exhibited bigger differences than the test groups as a whole.
Chart 7 shows the results from the target state point of view. This chart is put in the order where the biggest target state value is at the top and the lowest at the bottom.

72
Chart 7. Test group results. Order by target state.
Development and balance in life are the features valued the most. This was similar in both target groups but their positions were vice versa, so that the professionals placed development highest and the students balance in life. Both groups very clearly wished to lessen their feeling of haste. The target state positions of the features did not vary so much between the test groups as the current state. Yet again there were more differences between test group individuals than between the test groups.
5.3. Validation and verification
The demonstrator was tested by 35 persons. Test groups were formed from Industrial management students from Tampere University of Technology, project managers, leaders and other professionals from different companies and Turku University of Applied Sciences. The students gave their answers as a written report and some professionals were interviewed briefly in an open discussion. The professionals also gave written feedback. Interviews were done during the sessions where the results were personally analysed for the interviewees.
5.3.1. Feedback from students
The student group consisted of 13 persons. Their background varied quite a lot. The ages varied from 50 to 25 years and roughly half of them were female. Some of them

73
had just graduated as Bachelors of Engineering and some of them had decades-long careers behind them. Students gave feedback on both the Evolute environment as a platform and the C&K demonstrator. This chapter concentrates on the feedback towards C&K. Feedback regarding Evolute was forwarded to the people concerned and outside the scope of this thesis.
Many of the students found spelling mistakes in the propositions. These mistakes have been corrected in the thesis after the feedback. One systematic error was that apostrophes had been changed into question marks at some point of uploading into the environment. Students were also very accurate and effective in finding typographical errors. Students were attentive towards the clarity of the propositions. The proposition which caused the most confusion was “I slow down my working rhythm.” This was very understandable because the real proposition was meant to be “I want to slow down my working rhythm.” Students also suggested many small enhancements for propositions in order to make them more easily understandable. Most of the uncertainties came from the fact that neither the researcher’s nor the students’ mother tongue is English. Many of the challenges in understanding the propositions would probably have been avoided if the testing had been done in Finnish.
A wider perspective was also taken in the students’ feedback. All but two students recognized themselves well from the results. Even these two recognized themselves from most of the results. Some said that they were totally recognizable from the results. Many gave the feedback that the results were surprising but after a short period of self-reflection they understood why and agreed with these surprising results too. Nearly all of the respondents gave feedback that the propositions really made them stop to think about these issues and learn something new about themselves.
The students criticized a number of propositions. Many thought that 169 propositions was too many. The ability of the demonstrator to pause the questionnaire if the respondent becomes tired was criticized by some respondents. The argument was that the mood could change and answers would not be consistent. Criticism was also levelled at the method of asking some questions many times. “It feels as if the researcher wants to exhaust the respondent in order to get the right answer.” was one of the comments. Good new propositions and ways to express the propositions were also suggested. “My family/friends tell me that I work too much.” is a good example of these suggestions.
Altogether the feedback was very useful and most of the students took this opportunity to give feedback very seriously and concentrated on this assignment totally. This feedback will be used when C&K is developed further.

74
5.3.2. Feedback from professionals
Feedback was also gathered from the professionals in written form. Most concentration was used for the feedback interviews which were held for different professionals. In the interview sessions, the author first explained the interviewee’s personal results and then the interviewee commented on whether they interpreted the results in the same way. The nature of the session was open, so that a lively discussion was maintained all the time. The author made notes during the discussion and read them back to the test person at the end of the session. Thus, it was ensured that the test person’s feedback was correctly gathered. Altogether 22 professionals took part in the research as a test group. This test group consisted of professors, principal lecturers, project managers and coordinators from Turku University of Applied Sciences as well as CEOs, marketing managers and entrepreneurs from private companies.
Professionals also gave some criticism towards a number of propositions but it was seen as far less of a problem than with the students. Personal development was seen to be so important that a small investment in the form of time was considered to be a really fair exchange. The difference between the students and professionals was that the latter were not so confused by any of the propositions or at least they did not admit it in the discussion session. Only a couple of comments were received in this connection. One of them was the same as that raised by the students many times “I slow down my working rhythm.”
The most significant finding from the professionals’ feedback was that every single person said that their results revealed them and their situation very well. They agreed on all features and their positions. After a small discussion of possible reasons why the results were as they were, results which were a bit uncertain were also seen to be correct. Beneath are some statements gathered from the interviews.
“I recognize myself absolutely from the results. If I estimate first that some job will take approximately 2 hours. I have to reserve at least 3.5 hours.” - Interviewee who had Optimistic planning personality very high.
“My motivation is not so high now because of some incidents in my workplace” - Interviewee whose motivation was low and who had one of the biggest needs for enhancement in development.
“My hectic working situation is clearly seen in the results. My attention is on efficiency and short-term benefits.” - Interviewee who had a big gap in the balance of life and abstract feeling of haste.-
“I thought that my thinker time and my need for scheduling skills would have been higher. I don’t know whether it is the results or me that are wrong.” - Interviewee

75
“These results reveal my situation and personality clearly. I spent loads of time afterwards thinking why I have not done anything about these things, even though somehow I have always known that they are there.” - Interviewee
Altogether 10 professionals were interviewed. The results from the interviews were encouraging and answers to the question of the author “Should I start to do coaching with this demonstrator and concept?” was absolutely yes. The productization of the concept and application was seen as feasible and fulfilled the requirements of a commercial service product. On the other hand, nobody estimated the possible price of the product. Some thought that it would be interesting to invest a couple of hours every fortnight in time management development.
5.4. Conclusions
There is nothing so practical as a good theory – Kurt Lewin Thank God I’m familiar with both of them – Tero Reunanen
Time is an abstract and hard issue to understand but it is something that everybody recognizes. In many cases it is overlooked too easily and its fundamental basics are forgotten. Time is the most important resource for managers. It is something that cannot be dominated but can be exploited well if one’s own experienced time is understood correctly. It could be said that in this thesis the bonds between time and leadership were revealed together more deeply than had been seen before. Time can be handled in such a way that it is more easily understood and its meaning for the manager is revealed. The time ontology and demonstrator structure provided a clearer way for managers to benefit from time and see where to start in order to develop themselves in time management. It could be stated that this thesis has added simplicity to the complex world of leadership. This simplicity is not so overdone that the dangers discussed in chapter 1 will emerge.
The demonstrator developed during the thesis is functioning well and its benefits in research and business have been seen by the researcher and by the test groups. The method for development was validated and the structure for application was verified during the empirical test. 100 % of the test persons consulted were sure that this demonstrator functions as it should. 85 % of the test persons who were not consulted but who gave written feedback were sure that the demonstrator functions as it should. The remaining 15 % verified most of the features.
The thesis managed to answer all the research questions and in fact revealed more about time than was expected. The accuracy of the demonstrator exceeded the expected results. The level of encouragement from the test groups towards the commercialization of the concept was surprisingly high.

76
5.5. Suggestions for future actions
This application should be further developed towards better user-friendliness and more precise results. Data logging is to be started in order to obtain more answers and more data mass. The structure is not yet ideal and the missing links should be added in future. For example, cultural differences should be included in future versions.
Commercial usage of the application and concept can be started and the whole coaching process is to be designed in order to achieve the best possible customer experience, in support of self-development regarding both experience of time and time management.
The time ontology, which is now positioned between leadership and management, should be linked in a more precise and detailed way to leadership and management theories. Questions to be answered might include: which features of leadership theories are connected via time to features of management theories? Can leadership or management be defined in such a way that it takes into account better this most important resource? What are the actions, purposes or styles of leadership and management and how is time considered from those points of view?

77
BIBLIOGRAPHY
Argyris, C. 1991. Teaching smart people how to learn. Harvard Business Review. Reflections Vol. 4. No 2. pp. 4-15
Baader, F., Horrocks, I., Sattler, U. 2004. Description Logics. Handbook on Ontologies. S. Staab, Studer, R. Berlin, Springer-Verlag pp. 3-28.
Bandiera, O., Guiso, L., Prat, A. & Sadun, R. 2011. What do CEOs do? EUI Working paper ECO2011/06. European University Institute. Florence. 23 p.
Barnes, C., M., Schaubroek, J., Huth, M. & Ghumman, S. 2011. Lack of sleep and unethical conduct. Organizational Behavior and Human Decision Processes. Vol. 115. pp. 169-180.
Bass, B., M. & Avolio, B., J. 1990. The implications of transactional and transformation leadership for individual, team, and organizational development. Research in Organizational Change and Development. Vol.4. pp. 231-72.
Berglas, S. 2004. Chronic time abuse. Harvard Business Review. June 2004. pp. 90-97 Boroditsky, L. 2000. Metaphoric structuring: understanding time through spatial
metaphors. Cognition. Vol.75. pp. 1-28 Buehler, R. & Griffin, D. 2003. Planning, personality, and prediction: The role of future
focus in optimistic time predictions. Organizational Behavior and Human Decision Processes. Vol. 92. pp. 80-90
Burt, C., D., P, Weststrate, A., Brown, C. & Champion, F. 2010. Development of the time management environment (TiME) scale. Journal of Managerial Psychology. Vol. 25. No. 6. pp. 649-668
Butler, R. (1995). Time in organizations: Its experience, explanations and effects. Organization Studies, Vol.16. No.6 pp. 925–950.
Claessens, B., J., C., Van Eerde, W. & Rutte, C., G. 2007. Personnel review. Vol.36. No.2. pp. 255-276.
Covey, S. 1992. Principle-centered leadership. London: Simon and Schuster Csikszentmihalyi, M. 2000. Beyond boredom and anxiety. San Francisco: Jossey-Bass.
231 p. Czarniawska, B. 2004. On time, space and actions nets. Organization. Vol. 11. pp. 773-
791. Dahl, T. (1990), “Creating lasting change, a presidential address,” 7th World
Productivity Congress, Kuala Lumpur, Malaysia, 19 November. Day, G. 1990. Market driven strategy. New York: The Free Press. 405 p. Docear. 2013. Program web page. Available: [http://www.docear.org/] Date of access.
1.1.2013. Drucker, P. F. 1967. The effective executive. New York: Harper & Row. 178 p. Drucker, P. F. 2004. Managing oneself. Harvard Business Review. January 2005. Drucker, P. F. 2005. The essential Drucker. New York: Harper Collins. 358 p. Evolute.2013. Program web page. [http://www.evolutellc.com/EvoluteHome.aspx] Date
of access. 1.3.2013 Fiedler, R., E. 1964. A contingency model of leadership effectiveness. Advances in
Experimental Social Psychology. New York: Academic Press pp. 149-90.

78
Fiedler, R., E. 1967. A Theory of Leadership Effectiveness. New York: McGraw-Hill. 310 p.
Ford, D., Gadde, L-E., Håkansson, H., Lundgren, A., Snehota, I., Turnbull, P., Wilson, D. 1998. Managing Business relationships. Chichester, John Wiley & Sons, Ltd.
Fox, M. S. 1981. An organizational view of distributed systems. IEEE Transactions on Systems, Man, and Cybernetics Vol.11 pp.70-80.
Ghauri, P., Grønhaug, K. 2010. Research methods in business studies. 4th edit. Dorchester: Henry Ling Ltd 288 p.
Gibson, J. L., Ivancevich, J.M & Donnelly, J.H. 1995. Fundamentals of Management, McGraw-Hill Book Co Ltd.
Gill, R. 2003. Change management – or change leadership? Journal of Change Management. Vol.3. No.4. pp. 307-318.
Goldsmith, M. 2008. Tästä eteenpäin. tarvitaan vielä enemmän (What got you here won’t get you there). Hämeenlinna: Karisto Oy. 300 p.
Gomez-Perez, A. 2004. Ontology Evaluation. Handbook on Ontologies. S. Staab, Studer, R. Edit. Berlin, Springer-Verlag. pp. 251-273.
Gummesson, E. 2000. Qualitative Methods in Management Research. Thousand Oaks, California, Sage Publications Inc. 250 p.
Harung, H., S. 1998. Reflections. Improved time management through human development: achieving most with least expenditure of time. Journal of Managerial Psychology. Vol. 13. No. 5/6. pp. 406-428
Heifetz, R. 1994. Leadership without easy answers. Cambridge: Press of Harvard University Press.
Hersey, P. and Blanchard, K.H. 1982. Management of Organizational Behavior: Utilizing Human Resources. 4th ed. New Jersey. Prentice-Hall.
Hersey, P., Blanchard, K., H., Johnsson, D., E. 2001. Management of organizational behaviour. Leading human resources. New Jersey: Prentice-Hall Inc.
Jackson, C. M. 2004. Systems Thinking: Creative Holism for Managers. West Sussex, England, John Wiley & Sons Ltd.
Johnson, J. 2004. Flexible working: changing the manager’s role. Management Decision. Vol 24. No.6. pp. 721-737.
Jönsson, B. 2000. 10 Ajatusta ajasta. Hämeenlinna: Karisto Oy Kantola, J., Nurminen, K., Piirto, A. and Vanharanta, H. (2004). The Deltoid
Application for Competence Analysis and Development of Control Room Operators. IASTED International Conference on Neural Networks and Computational Intelligence, Grindelwald, Switzerland.
Kantola, J., Karwowski, W, Vanharanta, H. (2005). Creative Tension in Occupational Work Roles - Dualistic View, Ergonomia Journal. Ergonomia.
Kantola, J. 2005. Ingenious management. Doctoral thesis. Tampere University of Technology. Publication 568.
Kasanen, E., Lukka, K., Siitonen, A. 1991. Konstruktiivinen tutkimusote liiketaloustieteessä (Constructive research approach in business studies). The Finnish Journal of Business Economics Vol.40 No.3 pp. 301-327.
Kerr, S., J. & Jermier, J., M. 1978. Substitutes for leadership: their meaning and measurement, Organizational Behavior and Human Performance. Vol. 27. pp. 375-403.
Kim, H. 2002. Predicting How Ontologies for the Semantic Web will Evolve. Communications of the ACM Vol.45 No.2. pp. 48-54.

79
Klir, J. G., Yuan, B. (1995). Fuzzy Sets and Fuzzy Logic, Theory and applications, Prentice-Hall, Inc.
Kobbeltvedt, T., Brun, W. & Laberg, J., C. 2005. Cognitive processes in planning and judgements under sleep deprivation and time pressure. Organizational Behavior and Human Decision Processes. Vol. 98. pp. 1-14
Kotter, J., P. 1995 Leading Change: Why transformation efforts fail. Harvard Business Review. March-April, 1995.
Kotter, J., P. 1996. Leading change. United States: Harvard Business Review Press. Kratwohl, D. 2002. A revision of Bloom’s taxonomy: An overview. Theory into
practice. Vol. 46. No.4 pp. 212-218 Lewis, R. 2010. When cultures collide. 3rd. edition. Finland: WS Bookwell. Lin, C. T., Lee, C.S.G. (1996). Neural Fuzzy Systems - A Neuro-Fuzzy Synergism to
Intelligent Systems, Prentice-Hall, Inc. Lucas, R. 1976. Econometric Policy Evaluation: A Critique. Brunner, K., Meltzer, A..
(edits.) The Phillips Curve and Labor Markets, Carnegie-Rochester Conference Series on Public Policy. New York: American Elsevier. pp. 19–46,
Lukka, K. 2000. The Key Issues of Applying the Constructive Research Approach to Field Research. Management expertise for the new millennium - In commemoration of the 50th anniversary of the Turku School of Economics and Business Administration. Publications of the Turku School of Economics and Business Administration. T. Reponen. Turku, Turku School of Economics and Business Administration.
Mackenzie, K., D. 2006. The LAMPE theory of organizational leadership. Yammarino, F.J. and Dansereau, F. (Ed.). Research in Multi-Level Issues: Multi-Level Issues in Social Systems. Vol.5. Oxford: Elsevier. pp. 345-428.
Mackenzie, K., D., Barnes, F., B. 2007. The unstated consensus of leadership approaches. International Journal of Organizational Analysis. Vol. 15. No.2. pp. 92-118.
Mainemelis, C. 2001. When the muse takes it all: a model for the experience timelessness in organizations. Academy of Organizational Review. Vol.26 No.4 pp. 548-565
Malpas, J., E. 1999. Place and Experience: A Philosophical Inquiry. Cambridge: Cambridge University Press.
Maxwell, J. C. 2011. 5 levels of leadership: Proven steps to maximize your potential. Center Street.
Menzies, T. 1999. Cost Benefits of Ontologies. Intelligence Vol.10 No.3 pp. 26-32. Middleton, S., Liesch, P. W. & Steen, J. 2010. Organizing time: Internationalization
narratives of executive managers. International Business Review. Vol. 20. pp. 136-150.
Montreal Declaration of the World Confederation of Productivity Science. 1988. Montreal. Canada.
Mälkki J. 2009. Herrat, jätkät ja sotataito –mutta mikä sai armeijan taistelemaan? Minne kuljet suomalainen sotilasjohtaja? Siren T. (Edit.) Maanpuolustuskorkeakoulun Johtamisen ja sotilaspedagogiikan laitoksen Julkaisusarja 2 – Artikkelikokoelmat 4/2010
Neilimo, K., Näsi, J. 1980. Nomoteettinen tutkimusote ja suomalaisen yrityksen taloustiede - Tutkimus positivismin soveltamisesta (Nomothetic research approach and economics in Finland - a study of applications of positivism).

80
Yrityksen taloustieteen ja yksityisoikeuden laitoksen julkaisuja. Tampere, University of Tampere. Sarja A 2: Tutkielmia ja raportteja 12.
Newstrom, J., Rubenfeld, S. 1983. The Johari Window: A reconceptualization. Developments in Business Simulation & Experiential Exercises. Vol. 10. pp. 117-120
Northouse, P., G. 2007. Leadership: Theory and Practice. Sage: Thousand Oaks. Obrst, L. 2003. Ontologies for Semantically Interoperable Systems. Proceedings of the
12th International Conference on Information and Knowledge Management. Olkkonen, T. 1994. Johdatus Teollisuustalouden Tutkimustyöhön. Otaniemi,
Teknillinen korkeakoulu. Oncken, W. Jr. & Wass D. L. 2007. Management time: Who’s got the monkey? Harvard
Business Review. November-December 1999. Reprinted 2007. Oshagbemi, T. 1995. Management development and managers’ use of their time.
Journal of Management Development. Vol. 14 No. 8. 1995. pp. 19-34 Pardey, D. 2007. Introducing leadership. Elsevier Ltd. UK. Parry, D. 2004. A fuzzy ontology for medical document retrieval. Proceedings of the
second workshop on Australasian information security, Data Mining and Web Intelligence, and Software Internationalisation, Dunedin, New Zealand, Australian Computer Society, Inc.
Peck T. 1990. Leadership –a doctrine lost and found. School of Advanced Military Studies United States Army Command and General Staff College Fort Leavenworth, Kansas
Prahalad, C., K. & Hamel, G. 1990. The core competence of the corporation. Harvard Business Review. Vol. 68 No. 3 pp. 79–91.
Quine, W. 1948. On what there is. Review of Metaphysics. Vol 2. pp. 21-38 Rauhala, L. 1986. Ihmiskäsitys ihmistyössä (The human concept in human work).
Helsinki, Gaudeamus. Reunanen, T., Valtanen, J. & Windahl, R. 2012a. Evolutionary Approach to Modern
Creative Engineering Studies at Turku University of Applied Sciences. International Conference on Engineering Education. 30 July - 3 August 2012, Turku, Finland 2012 – Proceedings
Reunanen, T., Valtanen, J. & Windahl, R. 2012b. Evolutionary Approach to product development projects. Proceedings of the METNET Seminar 2012 in Izmir : Metnet Annual Seminar in Izmir, Turkey, on 10 – 11 October 2012. –Proceedings
Sabelis, I. 2002. Hidden causes for unknown losses: time compression management. Whipp, R., Adam, B. Sabelis, I. (Edit.) Making time. Oxford: Oxford University Press.
Senge, P., M. 1990. The Fifth Discipline: The Art & Practice of Learning Organization. New York, Currency Doubleday.
Sherony, K., M. and Green, S., G. 2002. Relationships between co-workers, leader-member exchange, and work attitudes. Journal of Applied Psychology. Vol.87. pp. 542-558.
Skogstad, A. & Einarsen, S. 1998. The importance of a change-centered leadership style in four organizational cultures. Scandinavian Journal of Management. Vol.15. pp. 289-306.
Sorli, A. 2002. Time as a stream of change. Journal of Theoretics. Vol. 4-6 Sorli, A & Sorli, K. 2004. Does time really exist as a fourth dimension of space?
Journal of Theoretics. Vol. 6-3

81
Sunzi. 2005. Sodankäynnin taito (The Art of war). Tampere: Tammer-paino. Takala, T. 2005. Charismatic leadership and power. Journal Problems and Perspectives
in Management. Vol. 3. No.3, pp. 45-57 Taleb, N., N. 2010. The Black Swan. The impact of highly improbable. 2nd edition.
United States: Random House Tengblad, S. 2002. Time and space in managerial work. Scandinavian Journal of
Management. Vol.18 pp. 543-565 Turnbull, S. 2004. Perceptions and experience of time-space compression and
acceleration. Journal of Managerial Psychology. Vol 19. No.8 pp. 809-824 Uusitalo, H. 1991. Tiede, tutkimus ja tutkielma (Science, research and thesis). Helsinki,
WSOY. Vanharanta, H. 2008 The management windshield: An effective metaphor for
management and leadership in Karwowski W., Salvendy, G. Eds. 2008. AHFE International Conference 14-17 July 2008. Las Vegas USA.
Vanharanta, H., Pihlanto, P. & Chang, A., M. 1997. Decision Support for Strategic Management in a Hyper-knowledge Environment and the Holistic Concept of Man. Proceedings 30th Annual International Conference on Systems Sciences. Hawaii. pp. 243-258
Vanharanta, H., Salminen, T. 2007. Holistic Interaction Between the Computer and the Active Human Being. Human-Computer Interaction. Interaction Design and Usability Lecture Notes in Computer Science Volume 4550. pp. 252-261
Yukl, G., A. 1981. Leadership in Organizations. Englewood Cliffs: Prentice-Hall.