terefe jima
TRANSCRIPT

1
Addis AbAbA institute of technology
school of grAduAte studies
energy center
Simulation and Optimization of Wind Turbine, Solar PV, Storage
Battery and Diesel Generator Hybrid Power System for a Cluster of
Micro and Small Enterprises Working on Wood and Metal
Products at Welenchity Site
A Thesis submitted to the School of Graduate Studies of Addis Ababa Institute of
Technology in partial fulfillment of the Degree of Masters of Science in Energy
Technology
By: Terefe Jima
Advisor: Dr.-Ing. Abebayehu Assefa
February 2013
ii
Simulation and Optimization of Wind Turbine, Solar PV, Storage Battery and
Diesel Generator Hybrid Power System for a Cluster of Micro and Small
Enterprises Working on Wood and Metal Products at Welenchity Site
By: Terefe Jima Eshete
APPROVED BY BOARD OF EXAMINERS
Dr.-Ing. Abebayehu Assefa _____________________
Head, Energy Center Signature
Dr.-Ing. Abebayehu Assefa _____________________
Advisor Signature
Dr.-Ing. Demiss Alemu ____________________
Internal Examiner Signature
Dr. Tesfaye Dama _________________
External Examiner Signature

Simulation and Optimization of Wind Turbine, Solar PV, Storage Battery and Diesel Generator Hybrid Power System for a Cluster of Micro and Small Enterprises Working on Wood and Metal Products at Welenchity Site
iii MSc Thesis, AAiT-Energy Center, By Terefe Jima, 2013
DECLARATION
I, the undersigned, declare that this thesis is my original work, has not been presented for a
degree in this or other universities, all sources of materials used for this thesis work have been
fully acknowledged.
Name: Terefe Jima Signature: ___________________
Place: Addis Ababa Institute of Technology, Addis Ababa University, Addis Ababa
Date of Submission: ___________________________________
This thesis has been submitted for examination with my approval as a university advisor.
Dr.-Ing. Abebayehu Assefa Signature_____________________
Advisor’s Name

Simulation and Optimization of Wind Turbine, Solar PV, Storage Battery and Diesel Generator Hybrid Power System for a Cluster of Micro and Small Enterprises Working on Wood and Metal Products at Welenchity Site
iv MSc Thesis, AAiT-Energy Center, By Terefe Jima, 2013
ACKNOWLEDGEMENT
First and foremost, I take this opportunity to give glory to the almighty God without whom the
completion of this work would have been impossible.
Next, I would like to express my sincere gratitude to my advisor Dr.-Ing. Abebayehu Assefa for
his expert guidance, constructive comments, suggestions and encouragement without which this
work could have not been completed. He has been a constant source of inspiration throughout
lifespan of my study.
I owe my greatest gratitude to my parents especially to my beloved grandmother and wife, who
have been the inspirations of my life; your passion for education has contributed immensely to
the completion of this study; this is for you.
Lastly but certainly not the least important, I would like to thank all the people who stood by my
side.
Simulation and Optimization of Wind Turbine, Solar PV, Storage Battery and Diesel Generator Hybrid Power System for a Cluster of Micro and Small Enterprises Working on Wood and Metal Products at Welenchity Site
v MSc Thesis, AAiT-Energy Center, By Terefe Jima, 2013
TABLE OF CONTENT
ACKNOWLEDGEMENT ...................................................................................................................... iv
TABLE OF CONTENT ........................................................................................................................... v
LIST OF TABLES ................................................................................................................................viii
LIST OF FIGURES ................................................................................................................................ ix
ABSTRACT ........................................................................................................................................... xi
INTRODUCTION ................................................................................................................................... 1
1.1 Background ................................................................................................................................... 1
1.2 Objective of the study .................................................................................................................... 3
1.2.1 General Objectives ................................................................................................................ 3
1.2.2 Specific Objectives ................................................................................................................ 3
1.3 Methodology ................................................................................................................................. 3
1.4 Introduction of System .................................................................................................................. 4
1.5 Outline of the Thesis...................................................................................................................... 6
CHAPTER TWO .................................................................................................................................... 7
HYBRID POWER GENERATION SYSTEM ......................................................................................... 7
2.1 Benefits of a Hybrid System .......................................................................................................... 8
2.2 Block Diagram of a Hybrid System................................................................................................ 9
CHAPTER THREE ............................................................................................................................... 11
WIND AND SOLAR ENERGY RESOURCES AND THEIR ANALYSIS ............................................ 11
3.1 Wind Energy Resources and Analysis .......................................................................................... 11
3.1.1 Wind Power Generation ...................................................................................................... 11
3.1 .2 the Earth's Wind Systems ................................................................................................... 12
3.1.3 Wind Turbine Velocities, Distribution, Power, and Energy .................................................. 14
3.1.4 Wind speed data of the site .................................................................................................. 16
3.1.5 Power and energy produced by a wind turbine ................................................................... 17
3.1.6 Effect of height on wind speed ........................................................................................... 18
3.1.7 Effect of the Average atmospheric pressure ........................................................................ 19
3.1.8 Effect of annual average temperature ................................................................................. 20
Simulation and Optimization of Wind Turbine, Solar PV, Storage Battery and Diesel Generator Hybrid Power System for a Cluster of Micro and Small Enterprises Working on Wood and Metal Products at Welenchity Site
vi MSc Thesis, AAiT-Energy Center, By Terefe Jima, 2013
3.1.9 Wind Speed Distribution .................................................................................................... 20
3.2 Solar Energy Resources and Analysis .......................................................................................... 24
3.2.1 Solar Energy Resources ....................................................................................................... 24
3.2.2 Analysis of Photovoltaic (PV) Power for the Selected Site ................................................... 25
3.2.3 Solar Data of the site used in HOMER ................................................................................. 27
CHAPTER FOUR ................................................................................................................................. 29
HYBRID SYSTEM COMPONENTS MODELING AND SIZING ........................................................ 29
4.1 Load Profile................................................................................................................................. 29
4.2 Wind Turbine Modeling and Sizing ............................................................................................. 30
4.3 PV Panel Modeling and Sizing .................................................................................................... 31
4.4 Battery Bank Modeling and Sizing .............................................................................................. 31
4.4.1 Lead acid battery construction and performance .................................................................. 32
4.4.2 Lead acid battery rating and model ...................................................................................... 32
4.4.3 Battery bank sizing .............................................................................................................. 34
4.5 Diesel Generator Ratings and sizing............................................................................................. 34
4.5.1 Diesel generator rating......................................................................................................... 34
4.5.2 Diesel generator sizing ........................................................................................................ 35
4.6 Charge Controller (Regulator) Modeling and Sizing .................................................................... 35
4.7 Bidirectional Inverter Modeling and Sizing .................................................................................. 36
CHAPTER FIVE ................................................................................................................................... 38
HYBRID SYSTEM SIMULATION SOFTWARE AND COMPONENTS............................................. 38
5.1 Simulation Software .................................................................................................................... 38
5.1.1 Simulation ......................................................................................................................... 40
5.1.2 Optimization ...................................................................................................................... 41
5.1.3 Sensitivity Analysis ........................................................................................................... 42
5.1.4 Hybrid System Modeling ................................................................................................... 42
5.2 Simulation Approach ................................................................................................................... 51
5.3 Software Inputs and Outputs ........................................................................................................ 54
CHAPTER SIX ..................................................................................................................................... 56
RESULTS AND DISCUSSION ............................................................................................................ 56
6.1 Optimization results ..................................................................................................................... 56
Simulation and Optimization of Wind Turbine, Solar PV, Storage Battery and Diesel Generator Hybrid Power System for a Cluster of Micro and Small Enterprises Working on Wood and Metal Products at Welenchity Site
vii MSc Thesis, AAiT-Energy Center, By Terefe Jima, 2013
6.2 Sensitivity Analysis ..................................................................................................................... 62
6.2.1 Net present cost sensitive to diesel price............................................................................. 62
CHAPTER SEVEN ............................................................................................................................... 67
CONCLUSIONS AND RECOMMENDATIONS .................................................................................. 67
7.1 Conclusion .................................................................................................................................. 67
7.2 Recommendations ....................................................................................................................... 69
REFERENCES...................................................................................................................................... 71
APPENDIXES ...................................................................................................................................... 73

Simulation and Optimization of Wind Turbine, Solar PV, Storage Battery and Diesel Generator Hybrid Power System for a Cluster of Micro and Small Enterprises Working on Wood and Metal Products at Welenchity Site
viii MSc Thesis, AAiT-Energy Center, By Terefe Jima, 2013
LIST OF TABLES
Table 3.1: Power curve data of the selected wind turbine
Table 3.2: Monthly Average Wind Speed of the site, 10m
Table 3.3: The probability density function for the welenchity wind site
Table 3.4: Cumulative distribution functions of Welenchity wind system
Table 3.6: Wind Energy Potential Based on Rayleigh Analysis
Table 3.5: Monthly average of daily sunshine hour for Welenchity site (Adama)
Table 3.6: Monthly average of daily solar radiation for Welenchity site (Adama)
Table 4.1: Daily Load profile of the site
Table 5.1: Inputs to the HOMER software
Table 6.1: Categorized optimization results
Table 6:2 System report for the 91 % renewable resource contribution
Table 6.3: Net Present Costs
Table 6.4: Comparison of net present cost, energy cost and green house gas emission diesel-
only option with hybrid system
Table 6.5: Sensitivity of net present cost to diesel price
Table 6.6: Sensitivity of net present cost to solar radiation
Table 6.7: Sensitivity of net present cost to wind speed
Simulation and Optimization of Wind Turbine, Solar PV, Storage Battery and Diesel Generator Hybrid Power System for a Cluster of Micro and Small Enterprises Working on Wood and Metal Products at Welenchity Site
ix MSc Thesis, AAiT-Energy Center, By Terefe Jima, 2013
LIST OF FIGURES
Figure 2.1: Block diagram of the hybrid system
Figure 3.1: Power curve of selected wind turbine
Figure 3.2: Monthly Average Wind Speed of the site at, 10m
Figure 3.3: The probability density functions of Welenchity wind system
Figure 3.4: The cumulative distribution functions of Welenchity wind system
Figure 4.1: Daily load curve for the specified site
Figure 5.1: HOMER diagram for the hybrid system
Figure 5.2: Sufficient energy to supply load & charge batteries case.
Figure 5.3: Sufficient energy to supply load & charge batteries but the extra energy is
consumed by the dump load case.
Figure 5.4: Not sufficient energy to supply load, batteries are also used to supply load case
Figure 5.5: Not sufficient energy to supply load & charge batteries, diesel generator is
switched on and do this case.
Figure 6.1: Monthly average solar resources
Figure 6.2: Monthly Average Electric Production of the selected hybrid system
Figure 6.3: Cash flow summary of the selected hybrid system
Figure 6.4: Monthly Average Electric Production of this setup
Figure 6.5: Net present cost (NPC) of optimized hybrid vs. diesel scenarios only under
different diesel price
Figure 6.6: Net present cost (NPC) of optimized hybrid vs. diesel scenarios only under
different solar radiation
Figure 6.7: Net present cost (NPC) of optimized hybrid vs. diesel scenarios only under
different wind speed

Simulation and Optimization of Wind Turbine, Solar PV, Storage Battery and Diesel Generator Hybrid Power System for a Cluster of Micro and Small Enterprises Working on Wood and Metal Products at Welenchity Site
x MSc Thesis, AAiT-Energy Center, By Terefe Jima, 2013
ABEREVATIONS
a-Si: Amorphous-Silicon
COE: Cost of Energy
HAWT: Horizontal Axis Wind Turbine
ISC: Short Circuit Current
kWh: Kilo Watt Hour
LCC: Life Cycle Cost
MSEs: Micro and Small Enterprises
MPPT: Maximum Power Point
NOCT: Normal Operating Cell Temperature
NPC: Net Present Cost
PV: Photovoltaic
rpm: Revolution per minute
SC-Si: Single Crystalline-Silicon
TSR: Speed Ratio
VAWT: Vertical Axis Wind Turbine
VOC: Open Circuit Voltage
Wp: Watt peak
COE: Cost of Energy
Simulation and Optimization of Wind Turbine, Solar PV, Storage Battery and Diesel Generator Hybrid Power System for a Cluster of Micro and Small Enterprises Working on Wood and Metal Products at Welenchity Site
xi MSc Thesis, AAiT-Energy Center, By Terefe Jima, 2013
ABSTRACT This thesis presents the design of a hybrid electric power generation system utilizing both wind
and solar energy for supplying a cluster of three micro and small enterprises (MSEs) working on
wood and metal products at the Welenchity site. The work was begun by investigating wind and
solar energy potentials of the desired site, compiling data from different sources and analyzing
them using software.
The wind speed and solar irradiation data for the site understudy are collected from the National
Metrological Agency (NMA) and analyzed using the software tool HOMER. The results related
to wind energy potential are given in terms of the monthly average wind speed, the wind speed
PDF, the wind speed CDF, the wind speed DC, and power density plot for the site. Whereas the
solar energy potential, has been given in the form of solar radiation plots for the site. According
to the results obtained through the analysis, the site has abundant solar energy potential and the
wind energy potential is unquestionably high enough to be exploited for generating electric
energy using wind turbines with low cut-in wind speed.
The design of a standalone PV-wind hybrid power generating system has proceeded based on the
promising findings of these two renewable energy resource potentials, wind and solar. The
simulations and design has been carried out using the HOMER software.
By running the software the simulation results which are lists of power supply systems have been
generated and arranged in ascending order according to their net present cost (NPC). Sensitivity
variables, such as range of wind speed, solar radiation and diesel price have been defined as
inputs into the software and the optimization process has been carried out repeatedly for the
sensitivity variables and the results have been refined accordingly.
The model developed is fairly general and may be adequate for preliminary results for energy
consumption cost for MSEs willing to adopt renewable energy sources. Therefore the most
economical scenario is using wind-PV –Diesel Generator-Battery hybrid system as stated before.
Keywords: hybrid renewable energy system, wind energy, photovoltaic, HOMER, PV-wind
hybrid, cluster of micro and small enterprises
1
CHAPTER ONE`
INTRODUCTION
1.1 Background
It is a well known fact that in many developing countries and less developed countries, a
significant proportion of the population lives without usable electrical power. Ethiopia is one of
developing countries with more than 80% of its population live without usable electricity [CIA,
2010]. The more noticeable benefits of usable electric power include: improved health care,
improved education, better transportation systems, improved communication systems, a higher
standard of living, and economic stability. Unfortunately, many of the rural areas of Ethiopia
have not benefited from these uses of electricity in the same proportion as the more populated
urban areas of the country. A major limitation to the development of many rural communities has
been the lack of this usable electricity. Due to the remote location and the low population
densities of the rural communities the traditional means of providing power has proven too
expensive, undependable, difficult to maintain, and economically unjustifiable. Consequently,
many of these communities remain without electricity and may never receive grid power from
the utility. The small town of Welenchity and surrounding communities are one of those rural
areas which have no access to electricity. The remote location and the small size of this town
made it impractical to electrify with traditional diesel power plants. The system of sole central
diesel power plants have shown to require high maintenance, use large quantities of fuel, pollute
the environment, and have a low level dependability. Consequently, a central diesel plant was
not considered for micro and small enterprises working on wood and metal products in
Welenchity and surrounding area.
The Hybrid Renewable Power Generation System (HRPGS) is a system aimed at the production
and utilization of the electrical energy coming from more than one source, provided that at least
one of them is renewable [Gupta et. al., 2008]. Such a system often includes some kind of
storage in order to satisfy the demand during the periods in which the renewable sources are not
available and to decrease the time shift between the peak load and the maximum power produced
and power conditioning unit and controller to convert and control one form of energy to other.

Simulation and Optimization of Wind Turbine, Solar PV, Storage Battery and Diesel Generator Hybrid Power System for a Cluster of Micro and Small Enterprises Working on Wood and Metal Products at Welenchity Site
2 MSc Thesis, AAiT-Energy Center, By Terefe Jima, 2013
As the current international trend in rural electrification is to utilize renewable energy resources;
solar, wind, biomass, and micro hydro power systems can be seen as alternatives. Among these,
wind and solar energy systems in stand-alone or hybrid forms are thought to be ideal solution for
rural electrification due to abundant solar radiation and significant wind distribution availability
nearby the rural community in Ethiopia .Ethiopia lies in the sunny belt between northern
latitudes of 3o and 15o, and thus the potential benefits of renewable energy resources such as
solar and wind energy can be considerable. As mentioned in [Mulugeta, 1999] the total annual
solar radiation reaching the territory is of the order of over 200 million tone oil equivalent (toe)
per year, over thirteen fold the total annual energy consumption in the country. In terms of
geographical distribution, solar radiation that reaches the surface increases as one travels from
west to east: the isolation period is approximately 2200 hours of bright sunshine per year in the
west increasing to over 3300 hours per year in the eastern semi-arid regions.
The same author mentioned in [Mulugeta, 1999] that the total wind resource potential across
Ethiopia amounts to 42 million toe per year, which also exceeds gross energy consumption by
about three fold. Temporal and spatial variations in wind resource distribution over Ethiopia are
significant, with the most attractive sites located toward the eastern and northern regions where
average annual wind speed typically exceeds 3.5 m/s.
So far, these vast renewable energy resources are not exploited sufficiently in the country,
primarily due to the lack of scientific and methodological know-how as regards planning, site
selection, and technical implementation. A further constraint prohibiting their utilization is that
the real potential of these resources is not well-known, partly because of the lack of research
emphasis in developing these technologies, and partly because of the insufficient resource data
base.
Thus, in this thesis a hybrid renewable power generation system integrating these vast solar and
wind resources is designed and modeled, to electrify for cluster of micro and small enterprises
working on wood and metal products in Welenchity and area surrounding it.

Simulation and Optimization of Wind Turbine, Solar PV, Storage Battery and Diesel Generator Hybrid Power System for a Cluster of Micro and Small Enterprises Working on Wood and Metal Products at Welenchity Site
3 MSc Thesis, AAiT-Energy Center, By Terefe Jima, 2013
1.2 Objective of the study
1.2.1 General Objectives
The basic objective of the thesis is to design, and model a stand-alone wind turbine, solar PV,
storage battery and diesel generator hybrid Power generation system to investigate alternative
power supply options for micro and small enterprises working on wood and metal products
around Welenchity villages detached from the main electricity grid and to search for the system
which improve the sustainable power supply by replacing existing conventional diesel powered
electric supply.
1.2.2 Specific Objectives
While trying to achieve this main objective, the following goals going to be fulfilled:
• Develop a data base of published data on wind speed and solar radiation of the site
• Select a set of photovoltaic modules and wind turbines suitable to generate electricity
using the wind and solar resource available in the selected site
• Propose an optimization procedure to determine the amount and type of PV modules,
storage battery and wind turbines needed, under standalone conditions, to satisfy a
predetermined demand at minimum cost.
• Perform an economic analysis to compute the net present value of the renewable energy
systems proposed
• Conducting an economic evaluation of the systems and compare different option.
1.3 Methodology
The methods to be used for the research are:
• Literature review: includes reading books, articles, simulation tools and other
resources related to the topic.
• collecting and analyzing the data and information of the site
• examining and selecting the most suitable Power Generation and Supply
Systems,
Simulation and Optimization of Wind Turbine, Solar PV, Storage Battery and Diesel Generator Hybrid Power System for a Cluster of Micro and Small Enterprises Working on Wood and Metal Products at Welenchity Site
4 MSc Thesis, AAiT-Energy Center, By Terefe Jima, 2013
• System modeling and simulation: includes mathematical modeling of the system
and simulating the modeled system using the available optimization software
(HOMER).
• Comparing the cost of electricity produced from renewable energy and the
Present cost of fossil fuel (diesel) based electricity generated of site.
• Analysis and interpretation of the result
The wind data used in this study were obtained from the Ethiopian Meteorological Agency,
Ministry of water and energy, Ethiopian Electric Power Corporation (EEPCO) and local MSE
working on wood and metal products. The mean of both wind speeds and solar are computed for
each month. It should be noted that using monthly wind speed has some limitations such as
loosing extremely low or high wind speeds within the month as well as inability to observe
diurnal variations in the wind speed. However, using monthly mean wind speed, which is mostly
available for most locations, can be used to study the seasonal changes in wind speed and
facilitates wind data analysis. Simulation software (HOMER) is developed to analyze the
operation of the hybrid system
1.4 Introduction of System
Hybrid power systems, which combine conventional and renewable power conversion systems,
are the best solution for feeding the mini-grids and isolated loads in remote areas. Properly
chosen renewable power sources will considerably reduce the need for fossil fuel leading to an
increase in the sustainability of the power supply. At the same time, conventional power source
said the renewable sources in hard environmental conditions, which improve the reliability of the
electrical system.
Over the present year’s hybrid technology has been developed and upgraded its role in renewable
energy sources while the benefits it produces for power production can't be ignored and have to
be considered. Nowadays many applications in rural and urban areas use hybrid systems. Many
isolated loads try to adopt this kind of technology because of the benefits which can be received
in comparison with a single renewable system.

Simulation and Optimization of Wind Turbine, Solar PV, Storage Battery and Diesel Generator Hybrid Power System for a Cluster of Micro and Small Enterprises Working on Wood and Metal Products at Welenchity Site
5 MSc Thesis, AAiT-Energy Center, By Terefe Jima, 2013
For the Welenchity case, the daily average of solar radiation intensity on horizontal surface is
about 6.135 kWh/m2 and day, while the total annual sunshine hours amounts to about 3000 [1].
These figures are relatively high and very encouraging to use PV generators for electrification of
certain loads as it has been worldwide successfully used.
The annual average of wind velocity at different places in Ethiopia is about 3 m/s which make
the utilization of wind energy converters surely infeasible in such places. In other places it
exceeds this number and reaches up to 10.2 m/s (Welenchity is an example and it is the case
under study in the thesis) which makes it feasible to be used to operate a wind turbine.
Technically a system which is entirely dependent only on renewable energy sources cannot be a
reliable electricity supply, especially for isolated loads in remote areas. This is because the
availability of the renewable energy sources cannot be ensured. Therefore, winds, solar PV
hybrid systems, which combine conventional and renewable sources of energies, are a better
choice for isolated loads.
A hybrid system using wind, solar PV, diesel generator as a backup system, and a battery as a
storage system is expected to: satisfy the load demands, minimize the costs, maximize the
utilization of renewable sources, optimize the operation of battery bank, which is used as back up
unit, ensure efficient operation of the diesel generator, and reduce the environment pollution
emissions from diesel generator if it is used as a standalone power supply.
The high capital cost of hybrid systems is affected by technical factors such as efficiency,
technology, reliability, location, as well as some nontechnical factors, so the effect of each of
these factors shall be considered in the performance study of the hybrid system.
One of the important factors, which directly affect the electricity cost, is correct system-sizing
mechanism of the system’s components. Over-sizing of components in hybrid system makes the
system, which is already expensive, more expensive, while under-sizing makes the system less
reliable. Thus optimum sizing for different components gives economical and reliable benefits to
the system.

Simulation and Optimization of Wind Turbine, Solar PV, Storage Battery and Diesel Generator Hybrid Power System for a Cluster of Micro and Small Enterprises Working on Wood and Metal Products at Welenchity Site
6 MSc Thesis, AAiT-Energy Center, By Terefe Jima, 2013
The software package developed in this thesis is used to simulate the operation of a system by
making energy balance calculations for each of the 8760 hours in a year and then to choose the
appropriate sizes of the different components in the system.
1.5 Outline of the Thesis
The first step in analyzing any hybrid system is to specify the configuration of the system.
Chapter 2 in this thesis introduces a general description of the hybrid system: construction
features, and benefits and the block diagram adopted for the hybrid system.
To completely study and analyze any hybrid system, different components constructing the
hybrid system shall be studied, identified, specified, chosen and analyzed appropriately.
Different issues concerning operation, technology, types, specifications and data analysis of both
wind and solar radiation measurements are reviewed and studied through chapters 3 in this
thesis. Microsoft Excel software programming package is used to make the wind and solar data
analysis required.
Simulation software (HOMER) is developed to analyze the operation of the hybrid system. The
first step in developing the software program is to appropriately mathematically model different
components constructing the hybrid system. Chapter 4 in this thesis introduces mathematical
modeling and appropriate sizing of all components constructing this hybrid system.
An initial step in developing the software simulation program is to identify the models upon
which the operation of the hybrid system under different modes and the decision of the energy
flow depend. Different diagrams determining the operation of the hybrid system are presented in
chapter 5.
To appropriately analyze different scenarios of the hybrid system, and then to choose the optimal
one, an evaluation based on economical analysis shall be done. Chapter 6 in this thesis
introduces different economic figures and system reports used to compare the different scenarios.
Tables and figures present and illustrate different results of the simulation program for the
different scenarios and comparison between results are introduced for sensitivity analysis
.General conclusions and recommendations concerning results of the simulation are introduced
and presented in chapter 7 in this thesis.

Simulation and Optimization of Wind Turbine, Solar PV, Storage Battery and Diesel Generator Hybrid Power System for a Cluster of Micro and Small Enterprises Working on Wood and Metal Products at Welenchity Site
7 MSc Thesis, AAiT-Energy Center, By Terefe Jima, 2013
CHAPTER TWO
HYBRID POWER GENERATION SYSTEM
A hybrid renewable energy system is a system in which two or more supplies from different
renewable energy sources (solar-thermal, solar photovoltaic, wind, biomass, hydropower, etc.)
with other technologies such as batteries and diesel generator are integrated to supply electricity
or heat, or both, to the same demand. The most frequently used hybrid system is the hybrid
which consists of Photovoltaic (PV) modules and wind turbines.
Combining renewable hybrid system with batteries as a storage system, to increase duration of
energy autonomy, will make optimal use of the available renewable energy resource and this in
turn can guarantee high supply reliability. To deal with different weather conditions and to make
the system supplies load demand at the worst conditions, this strategy requires large storage
capacity and therefore it is very expensive. It is cheaper to supply peaks or to supply demand
during periods of cloudy weather or poor wind days with another back up supply ( usually diesel
generator ), although this lowers the proportion of renewable energy used. Selecting appropriate
size of the storage system is such that to minimize diesel running time and to maximize fuel
savings.
As an off-grid power generation, the hybrid system offers clean and efficient power that will in
many cases be more cost-effective than sole diesel systems. As a result, renewable energy
options have increasingly become the preferred solution for off-grid power generation [Ali B. et
al, 2010].
The hybrid system studied in this thesis is one combining solar PV and wind turbine with diesel
generator(s) and bank of batteries, which are included for backup purposes. Power conditioning
units, such as inverters, are also part of the supply system. Hybrid wind turbine and PV modules,
offer greater reliability than any one of them alone because the energy supply does not depend
Simulation and Optimization of Wind Turbine, Solar PV, Storage Battery and Diesel Generator Hybrid Power System for a Cluster of Micro and Small Enterprises Working on Wood and Metal Products at Welenchity Site
8 MSc Thesis, AAiT-Energy Center, By Terefe Jima, 2013
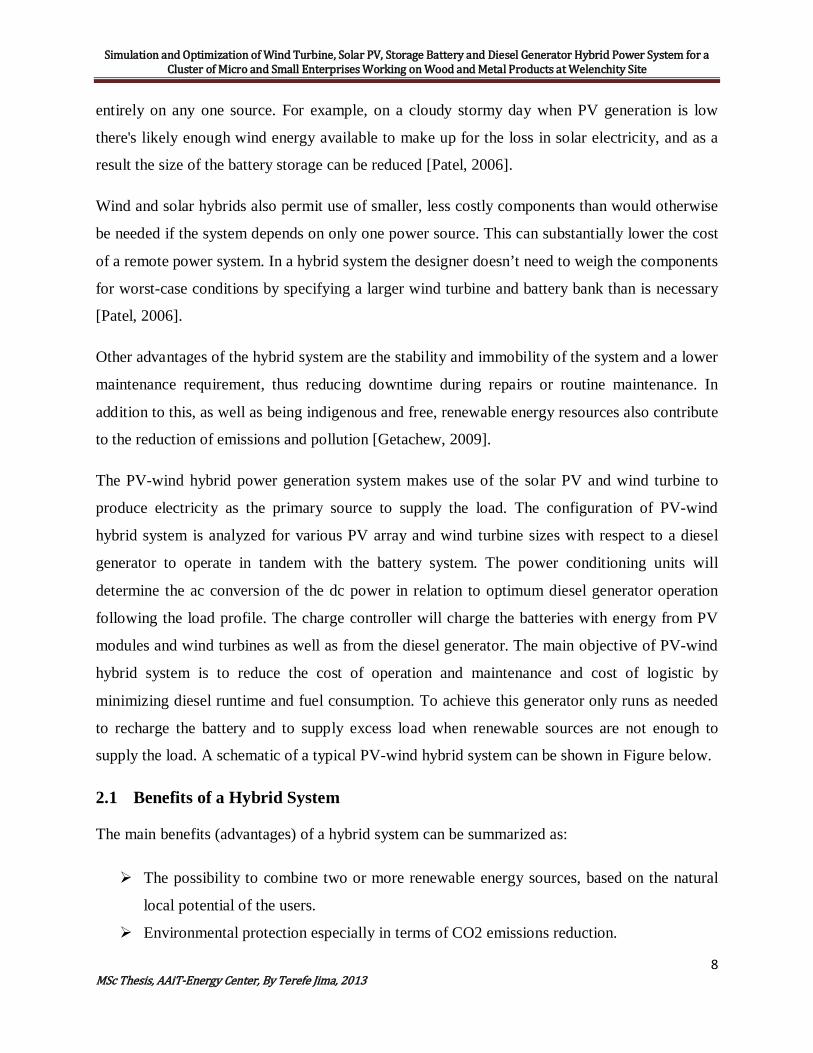
entirely on any one source. For example, on a cloudy stormy day when PV generation is low
there's likely enough wind energy available to make up for the loss in solar electricity, and as a
result the size of the battery storage can be reduced [Patel, 2006].
Wind and solar hybrids also permit use of smaller, less costly components than would otherwise
be needed if the system depends on only one power source. This can substantially lower the cost
of a remote power system. In a hybrid system the designer doesn’t need to weigh the components
for worst-case conditions by specifying a larger wind turbine and battery bank than is necessary
[Patel, 2006].
Other advantages of the hybrid system are the stability and immobility of the system and a lower
maintenance requirement, thus reducing downtime during repairs or routine maintenance. In
addition to this, as well as being indigenous and free, renewable energy resources also contribute
to the reduction of emissions and pollution [Getachew, 2009].
The PV-wind hybrid power generation system makes use of the solar PV and wind turbine to
produce electricity as the primary source to supply the load. The configuration of PV-wind
hybrid system is analyzed for various PV array and wind turbine sizes with respect to a diesel
generator to operate in tandem with the battery system. The power conditioning units will
determine the ac conversion of the dc power in relation to optimum diesel generator operation
following the load profile. The charge controller will charge the batteries with energy from PV
modules and wind turbines as well as from the diesel generator. The main objective of PV-wind
hybrid system is to reduce the cost of operation and maintenance and cost of logistic by
minimizing diesel runtime and fuel consumption. To achieve this generator only runs as needed
to recharge the battery and to supply excess load when renewable sources are not enough to
supply the load. A schematic of a typical PV-wind hybrid system can be shown in Figure below.
2.1 Benefits of a Hybrid System
The main benefits (advantages) of a hybrid system can be summarized as:
The possibility to combine two or more renewable energy sources, based on the natural
local potential of the users.
Environmental protection especially in terms of CO2 emissions reduction.

Simulation and Optimization of Wind Turbine, Solar PV, Storage Battery and Diesel Generator Hybrid Power System for a Cluster of Micro and Small Enterprises Working on Wood and Metal Products at Welenchity Site
9 MSc Thesis, AAiT-Energy Center, By Terefe Jima, 2013
Low cost – wind energy, and also solar energy can be competitive with nuclear, coal and
gas especially considering possible future cost trends for fossil and nuclear energy.
Diversity and security of supply.
Rapid deployment - modular and quick to install.
Fuel is abundant, free and inexhaustible.
Costs are predictable and not influenced by fuel price fluctuations although fluctuations
in the price of batteries will be an influence where these are incorporated.
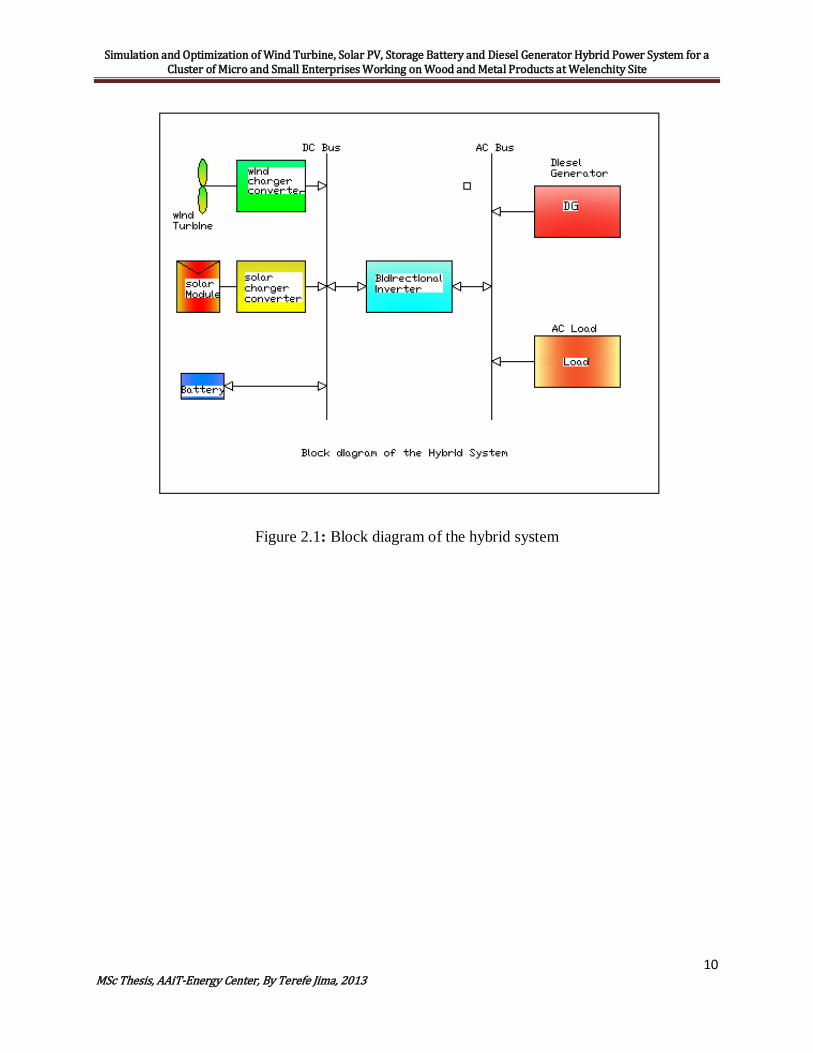
2.2 Block Diagram of a Hybrid System
There are many possible configurations of hybrid power systems. One way to classify systems
architectures is to distinguish between AC and DC bus systems. DC bus systems are those where
the renewable energy components and sometimes even the backup diesel generator feed their
power to a DC bus, to which is connected an inverter that supplies the loads. This is for small
hybrid systems. Large power hybrid systems use an AC bus architecture where wind turbines are
connected to the AC distribution bus and can serve the loads directly.
The configuration used to be evaluated in this thesis has a DC bus which combines the DC
output of the PV module, the DC output of the wind turbine, and the battery bank. The AC bus of
this configuration combines the output of the bidirectional inverter, the output of the back-up
diesel generator and the load. This parallel configuration requires no switching of the AC load
supply while maintaining flexibility of energy source, but the bidirectional power inverter shall
be chosen to deal with this mode of operation. Figure 2.1 illustrates the block diagram of this
configuration.
Simulation and Optimization of Wind Turbine, Solar PV, Storage Battery and Diesel Generator Hybrid Power System for a Cluster of Micro and Small Enterprises Working on Wood and Metal Products at Welenchity Site
10 MSc Thesis, AAiT-Energy Center, By Terefe Jima, 2013
Figure 2.1: Block diagram of the hybrid system

Simulation and Optimization of Wind Turbine, Solar PV, Storage Battery and Diesel Generator Hybrid Power System for a Cluster of Micro and Small Enterprises Working on Wood and Metal Products at Welenchity Site
11 MSc Thesis, AAiT-Energy Center, By Terefe Jima, 2013
CHAPTER THREE
WIND AND SOLAR ENERGY RESOURCES AND THEIR ANALYSIS
3.1 Wind Energy Resources and Analysis
All renewable energy (except tidal and geothermal power), and even the energy in fossil fuels,
ultimately comes from the sun. The sun radiates 174,423,000,000,000 kilowatt hours of energy
to the earth per hour. In other words, the earth receives 1.74 x 10 17 W of power [4].
3.1.1 Wind Power Generation
Wind power, like most sources of energy on earth, originates from the sun. As the earth orbits
the sun daily, it receives light and heat. Across the earth there are areas with different
temperatures, so that heat transfers from one area to another. These heat differences help to
create wind: in warmer regions of the earth, the air is hot and is therefore at a high pressure,
compared with the air in colder regions, where it is at a low pressure. Wind is the movement of
the air from high pressure to low pressure.
The idea of creating something to capture the power from the wind is not a new idea. Wind
turbines have been used for thousands of years for milling grain, pumping water, and other
mechanical power applications. Today, there are over one million wind turbines in operation
around the world. Most of them are used for water pumping and for generating electricity. Wind
energy offers the potential to generate substantial amounts of electricity without the pollution
problems of most conventional forms of electricity generation [18, 11].
Wind energy has been used for thousands of years for milling grains, pumping water and other
mechanical power applications. But the use of wind energy as an electrical supply with free
pollution what makes it attractive and takes more interest and used on a significant scale.
Attempts to generate electricity from wind energy have been made since the end of nineteenth
century. Small wind machines for charging batteries have been manufactured since the 1930s.
Wind now is one of the most cost-effective methods of electricity generation available in spite of
the relatively low current cost of fossil fuels. The technology is continuously being improved

Simulation and Optimization of Wind Turbine, Solar PV, Storage Battery and Diesel Generator Hybrid Power System for a Cluster of Micro and Small Enterprises Working on Wood and Metal Products at Welenchity Site
12 MSc Thesis, AAiT-Energy Center, By Terefe Jima, 2013
both cheaper and more reliable, so it can be expected that wind energy will become even more
economically competitive over the coming decades [5].
3.1 .2 the Earth's Wind Systems
The earth's wind systems are due to the movement of atmospheric air masses as a result of
variations in atmospheric pressure, which in turn are the result of differences in the solar heating
of different parts of the earth’s surface. One square meter of the earth’s surface on or near the
equator receives more solar radiation per year than one square meter at higher latitudes. As a
result, the tropics are considerably warmer than the high latitude regions. Atmospheric pressure
is the pressure resulting from the weight of the column of the air that is above a specified surface
area.
Like all gases, air expands when heated, and contracts when cooled. In the atmosphere, warm air
is lighter and less dense than cold air and will rise to high altitudes when strongly heated by solar
radiation. A low pressure belt is created at the equator due to warm humid air rising in the
atmosphere until it reaches the top of the troposphere (approximately 10 km) and will spread to
the North and the South. This air gradually cools until it reaches latitudes of about 30 degrees,
where it sinks back to the surface, creating a belt of high pressure at these latitudes. The majority
of the world's deserts are found in these high pressure regions.
Power production from a wind turbine is a function of wind speed. The relationship between
wind speed and power is defined by a power curve, which is unique to each turbine model and,
in some cases, unique to site-specific settings. In general, most wind turbines begin to produce
power at wind speeds of about 4 m/s (9 mph), achieve rated power at approximately 13 m/s (29
mph), and stop power production at 25 m/s (56 mph). Variability in the wind resource results in
the turbine operating at continually changing power levels. At good wind energy sites, this
variability results in the turbine operating at approximately 35% of its total possible capacity
when averaged over a year.

Simulation and Optimization of Wind Turbine, Solar PV, Storage Battery and Diesel Generator Hybrid Power System for a Cluster of Micro and Small Enterprises Working on Wood and Metal Products at Welenchity Site
13 MSc Thesis, AAiT-Energy Center, By Terefe Jima, 2013
Table 3.1: Power curve data of the selected wind turbine
Wind Speed Power Output
(m/s) (kW)
1 0.00 0.000
2 3.00 0.000
3 4.00 0.060
4 5.00 0.110
5 6.00 0.280
6 7.00 0.560
7 8.00 1.000
8 9.00 1.560
9 10.00 2.110
10 11.00 2.560
11 12.00 2.830
12 13.00 2.940
13 14.00 3.000
14 15.00 3.000
15 16.00 2.890
16 17.00 2.670
17 18.00 2.390
18 19.00 2.170
19 20.00 2.060
20 24.00 2.000

Simulation and Optimization of Wind Turbine, Solar PV, Storage Battery and Diesel Generator Hybrid Power System for a Cluster of Micro and Small Enterprises Working on Wood and Metal Products at Welenchity Site
14 MSc Thesis, AAiT-Energy Center, By Terefe Jima, 2013
Figure 3.1: Power curve of selected wind turbine
3.1.3 Wind Turbine Velocities, Distribution, Power, and Energy
3.1.3.1 Velocities, power, and energy available in wind
The speed of rotation of a wind turbine is usually measured in either rotation speed in revolutions
per minute (N in rpm) or angular velocity in radians per second (in rad/s). The relationship
between the two is given by:
𝜔𝜔 = 2∗𝜋𝜋∗𝑅𝑅60
… … … … … … … … … … … … … … … … … … … … … … … … … … . . … … … … 3.1
Another measure of a wind turbines speed is its tip speed which is the tangential velocity of the
rotor at the tip of the blades measured in meter per second and it equals to:
𝑣𝑣 = 𝜔𝜔 ∗ 𝑟𝑟… … … … … … … … … … … … … … … … … … … … … … … … … … … … … … … … .3.2
where r is the tip radius in meters.
A non dimensional ratio known as the tip speed ratio (TSR) is obtained by dividing the tip speed
by the undisturbed wind speed, Vo. This ratio which provides a useful measure can be used to
compare wind turbines of different characteristics.

Simulation and Optimization of Wind Turbine, Solar PV, Storage Battery and Diesel Generator Hybrid Power System for a Cluster of Micro and Small Enterprises Working on Wood and Metal Products at Welenchity Site
15 MSc Thesis, AAiT-Energy Center, By Terefe Jima, 2013
𝑇𝑇𝑇𝑇𝑅𝑅 =𝑣𝑣𝑣𝑣𝑜𝑜
=𝜔𝜔 ∗ 𝑟𝑟𝑣𝑣𝑜𝑜
… … … … … … … … … … … … … … … … … … … … … … … … … … 3.3
A wind turbine of a particular design can operate over a range of tip speed ratios, but will usually
operate with its best efficiency at a particular tip speed ratio. The optimum tip speed ratio for a
given wind turbine rotor will depend upon both the number of blades and the width of each blade
[5].
A term describes the percentage of the area of the rotor, which contains material rather than air is
known as solidity. Wind turbines with large number of blades have high solidity, but wind
turbines with small number of narrow blades have low solidity. Multi blade wind pumps have
high solidity rotors and modern electricity generating wind turbines (with one, two or three
blades) have low solidity rotors. The turbines with low solidity have to turn much faster than the
high solidity turbines in order to interact with all the wind passing through. Optimum tip speed
ratios for modern low solidity wind turbines range between about 6 and 20 [5].
The energy contained in the wind is its kinetic energy (𝐸𝐸𝑘𝑘𝑘𝑘𝑘𝑘 ) and it is equal to [5]:
𝐸𝐸𝑘𝑘𝑘𝑘𝑘𝑘 =12 ∗ 𝑚𝑚 ∗ 𝑣𝑣2 … … … … … … … … … … … … … … … … … … … … … … … … … … … … 3.4
Where (m) is the mass of air in kilograms and (V) is speed of air in meters per second. Mass of
air flowing through a certain area (A) per second (m.) is:
𝑚𝑚∙ = 𝜌𝜌 ∗ 𝐴𝐴 ∗ 𝑣𝑣… … … … … … … … … … … … … … … … … … … … … … … … … … … … … … . .3.5
Where 𝜌𝜌 : is the density of air in kilograms per cubic meter.
So, kinetic energy in the wind per second which is equal to power (P) in the wind in watts is
equal to:
𝑃𝑃 =12 ∗ 𝜌𝜌 ∗ 𝐴𝐴 ∗ 𝑣𝑣
3 … … … … … … … … … … … … … … … … … … … … … … … … … … … … . .3.6
As it is appeared from the power relation above, wind speed (cubic) has a strong influence on
power output.

Simulation and Optimization of Wind Turbine, Solar PV, Storage Battery and Diesel Generator Hybrid Power System for a Cluster of Micro and Small Enterprises Working on Wood and Metal Products at Welenchity Site
16 MSc Thesis, AAiT-Energy Center, By Terefe Jima, 2013
The power contained in the wind is not in practice the amount of power that can be extracted by
a wind turbine. This is because losses are incurred in the energy conversion process, also because
some of the air is pushed aside by the rotor and by passing it without generating power.
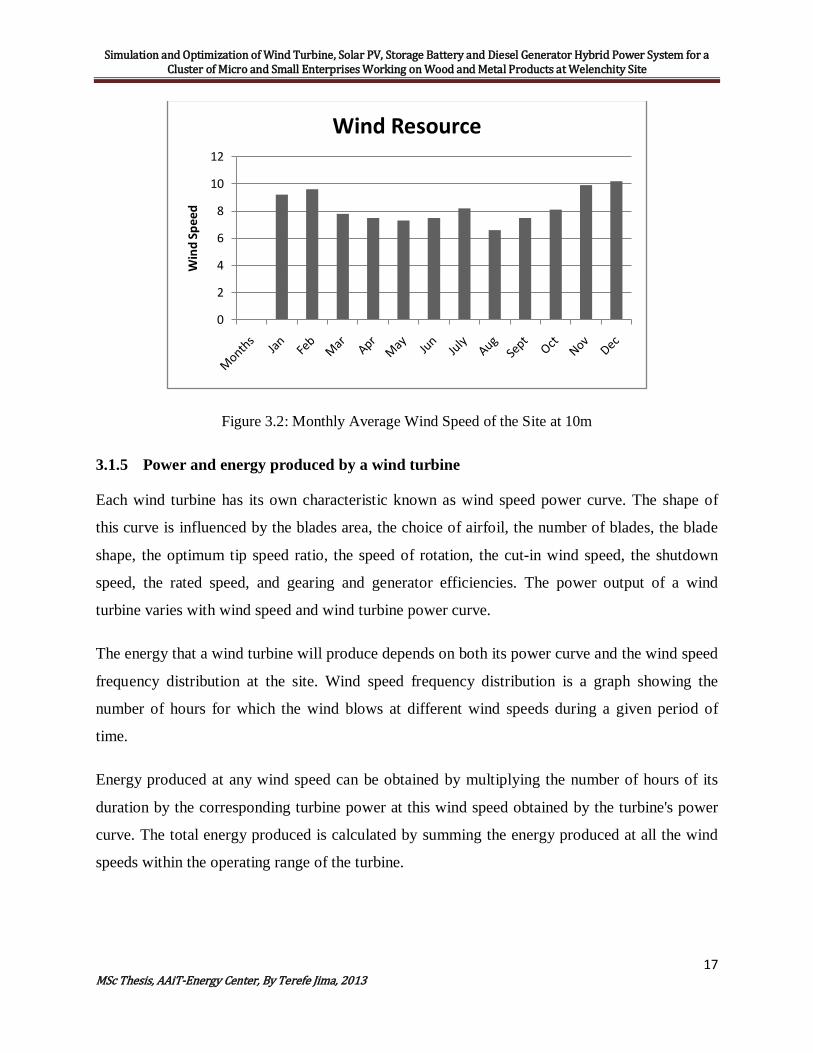
3.1.4 Wind speed data of the site
The available wind speed measured at Adama (EEPCO’s 10 meters station) indicates that wind
with minimum speed occurs during August (6.61m/s), while the wind with high velocity occurs
during November, December, January and February; 9.95, 10.29, 9.27 and 9.65 m/s respectively.
The values calculated over 3 years (2006 to 2008) indicate that mean wind speed is 8.33 m/s. Wind
speed at Adama (National Meteorological Service Agency 2 meters station) illustrates that wind
with minimum speed occurs during August (1.76), while months which receive high wind speed
are November, December and January (2.65, 2.74, and 2.47 m/s respectively). The wind speed at
Adama (EEPCO’s 40 meters station) shows that a month which gets minimum wind speed is
August (6.04) and months of high wind speed are November, December, and January (11.15,
11.05, and 10.56 m/s respectively). Generally, data from all stations show that the wind speed at
Adama is high throughout the year but there is decreasing trend during summer months. The wind
direction recorded every ten minutes a day in the past three years (2006-2008) indicates that there
is seasonal variation of wind direction. However, the prevailing wind direction is Northeasterly.
Table 3.2: Monthly Average Wind Speed of the Site at 10m
Month Jan Feb Mar Apr May Jun July Aug Sept Oct Nov Dec Aver
age
10meters
(2006-2008) 9.2 9.6 7.8 7.5 7.3 7.5 8.2 6.6 7.5 8.1 9.9 10.2 8.3
Simulation and Optimization of Wind Turbine, Solar PV, Storage Battery and Diesel Generator Hybrid Power System for a Cluster of Micro and Small Enterprises Working on Wood and Metal Products at Welenchity Site
17 MSc Thesis, AAiT-Energy Center, By Terefe Jima, 2013
Figure 3.2: Monthly Average Wind Speed of the Site at 10m
3.1.5 Power and energy produced by a wind turbine
Each wind turbine has its own characteristic known as wind speed power curve. The shape of
this curve is influenced by the blades area, the choice of airfoil, the number of blades, the blade
shape, the optimum tip speed ratio, the speed of rotation, the cut-in wind speed, the shutdown
speed, the rated speed, and gearing and generator efficiencies. The power output of a wind
turbine varies with wind speed and wind turbine power curve.
The energy that a wind turbine will produce depends on both its power curve and the wind speed
frequency distribution at the site. Wind speed frequency distribution is a graph showing the
number of hours for which the wind blows at different wind speeds during a given period of
time.
Energy produced at any wind speed can be obtained by multiplying the number of hours of its
duration by the corresponding turbine power at this wind speed obtained by the turbine's power
curve. The total energy produced is calculated by summing the energy produced at all the wind
speeds within the operating range of the turbine.
0
2
4
6
8
10
12
Win
d Sp
eed
Wind Resource
Simulation and Optimization of Wind Turbine, Solar PV, Storage Battery and Diesel Generator Hybrid Power System for a Cluster of Micro and Small Enterprises Working on Wood and Metal Products at Welenchity Site
18 MSc Thesis, AAiT-Energy Center, By Terefe Jima, 2013
The best way to determine the wind speed distribution at a sight is to carry out wind speed
measurements including record of duration for which the wind speed lies within each wind speed
band.
Availability of the turbine is one of the factors that affect the total energy generation.
Availability is an indication of the reliability of the turbine installation and is the fraction of a
given period of time for which a wind turbine is available to generate, when the wind is blowing
within the turbine's operating range. Typical values of annual availabilities exceed 90% [5].
A rough initial estimate of electricity production (in kWh / m²/year) at a certain site is [5]:
𝐸𝐸𝑔𝑔𝑔𝑔𝑘𝑘 = 𝐾𝐾𝑊𝑊𝑇𝑇 ∗ (𝑣𝑣𝑎𝑎𝑣𝑣 )3 … … … … … … … … … … … … … … … … … … … … … … … … … … … … .3.7
Where: Egen is the annual electrical energy generated by a wind turbine (kWh), KWT= 3.2
(kg/m/s) is a factor based on typical turbine performance, and vav is the site average annual wind
speed in m/s.
3.1.6 Effect of height on wind speed
The height at which the speed of wind is measured affects the value of the wind speed. As height
increases the speed of wind increases, so it is more valuable to increase the height of wind
turbine in respect of power that can be captured, but as height increases the initial capital cost of
the tower increases and also the maintenance and operation costs increases, so it is a compromise
issue.
So when calculating the output of wind generator, the measured data of average hourly wind
speed must be converted to the corresponding values at the hub height.
Knowledge of wind speeds at heights of 20 to 120 m above ground is very desirable in any
decision about location and type of wind turbine to be installed. Many times, these data are not
available and some estimate must be made from wind speeds measured at about 10 m. This
requires an equation which predicts the wind speed at one height in terms of the measured speed
at another, lower, height. One possible form for the variation of wind speed u (z) with height z is
[3]:

Simulation and Optimization of Wind Turbine, Solar PV, Storage Battery and Diesel Generator Hybrid Power System for a Cluster of Micro and Small Enterprises Working on Wood and Metal Products at Welenchity Site
19 MSc Thesis, AAiT-Energy Center, By Terefe Jima, 2013
𝑉𝑉 = 𝑉𝑉𝑟𝑟𝑔𝑔𝑟𝑟
⎣⎢⎢⎢⎢⎡
ln�𝑧𝑧 𝑧𝑧0� �
ln�𝑧𝑧𝑟𝑟𝑔𝑔𝑟𝑟 𝑧𝑧0� �⎦⎥⎥⎥⎥⎤
… … … … … … … … … … … … … … … … … … … … … . … . .3.8
where: V=wind velocity at height z above ground level
Vref= reference velocity, i.e., a wind velocity at height zref
Z= height above ground level for the desired velocity V
Z0= surface roughness length of the site, 0.12 in our case
Zref = reference height, i.e., the height where the exact wind velocity
Vref= is known as reference velocity
The annual average wind speed at 10m for welenchity site is already known before which is
8.3m/s and the average wind speed at the hub height of 40m with the wind shear exponent of
0.12 is calculated as follows:`
z=40m, zref=10m, zo=0.12,Vref=8.3m/s
Hence, the wind speed at the hub height is:
𝑉𝑉 = 8.3𝑚𝑚 𝑠𝑠⁄ �ln�40𝑚𝑚
0.12� �
ln�10𝑚𝑚0.12� �
� = 10.904 𝑚𝑚/𝑠𝑠
3.1.7 Effect of the Average atmospheric pressure
The average atmospheric is used on the annual basis, because the power available from the wind
depends upon this value. This value s used to calculate the pressure coefficient adjustment. The
average atmospheric pressure is inversely proportional to the altitude. The average atmospheric
pressure typically ranges from 60 to 103 KPa. The lower end the range corresponds to a site at an
elevation of approximately 4,000 m where as the higher end of the range corresponds to sea
level. The atmospheric pressure at standard condition is 101.3 KPa [Elliot, 1986].
Note that the atmospheric pressure falls with increasing altitude. Up to about 5,000 m altitude,
the mean atmospheric pressure, P (KPa), at altitude of Z meters above sea level can be estimated
by:
𝑃𝑃 = 𝑃𝑃𝑠𝑠𝑔𝑔𝑎𝑎𝑠𝑠𝑔𝑔𝑣𝑣𝑔𝑔𝑠𝑠 × 𝑔𝑔(−𝑍𝑍 8200� ) … … … … … … … … … … … … … … … … … … … … … … … … 3.9
Where
Psealevel is the atmospheric pressure at sea level of site (i.e., 86.4 KPa)
Simulation and Optimization of Wind Turbine, Solar PV, Storage Battery and Diesel Generator Hybrid Power System for a Cluster of Micro and Small Enterprises Working on Wood and Metal Products at Welenchity Site
20 MSc Thesis, AAiT-Energy Center, By Terefe Jima, 2013
𝑃𝑃 = 86.4 ∗ е(−60/8200)
𝑃𝑃 = 85.8𝐾𝐾𝑃𝑃𝑎𝑎
3.1.8 Effect of annual average temperature
The power available from the wind depends on the annual average temperature. This value is
used to calculate the temperature coefficient adjustment. The Greater the temperature, the lower
the air density and therefore, the lower the power available from the wind and this relation is
shown above on effect of temperature and altitude on air density. Accordingly the mean annual
temperature (𝑇𝑇𝑚𝑚 ) of the site is 22.4℃.
3.1.9 Wind Speed Distribution
3.1.9.1 Wind Speed Frequency with Rayleigh distribution
The measured wind speed variation for a typical site throughout a year indicates that the strong
gale force winds are rare, while moderate and fresh winds are quite common, and this is
applicable for most areas.
Sometimes there are very high wind speeds, but they are very rare. The statistical distribution of wind speeds varies from place to place around the globe, depending upon local climate conditions, the landscape, and its surface.
The reliability of Weibull distribution in wind system analysis depends on the accuracy in
estimating k and c. For the precise calculation of k and c, adequate wind data, collected over
shorter time intervals are essential. In many cases, such information may not be readily available.
The existing data may be in the form of the mean wind velocity over a given time period. Under
such situations, a simplified case of the Weibull model can be derived; by approximating k as
2.This is known as the Rayleigh distribution.
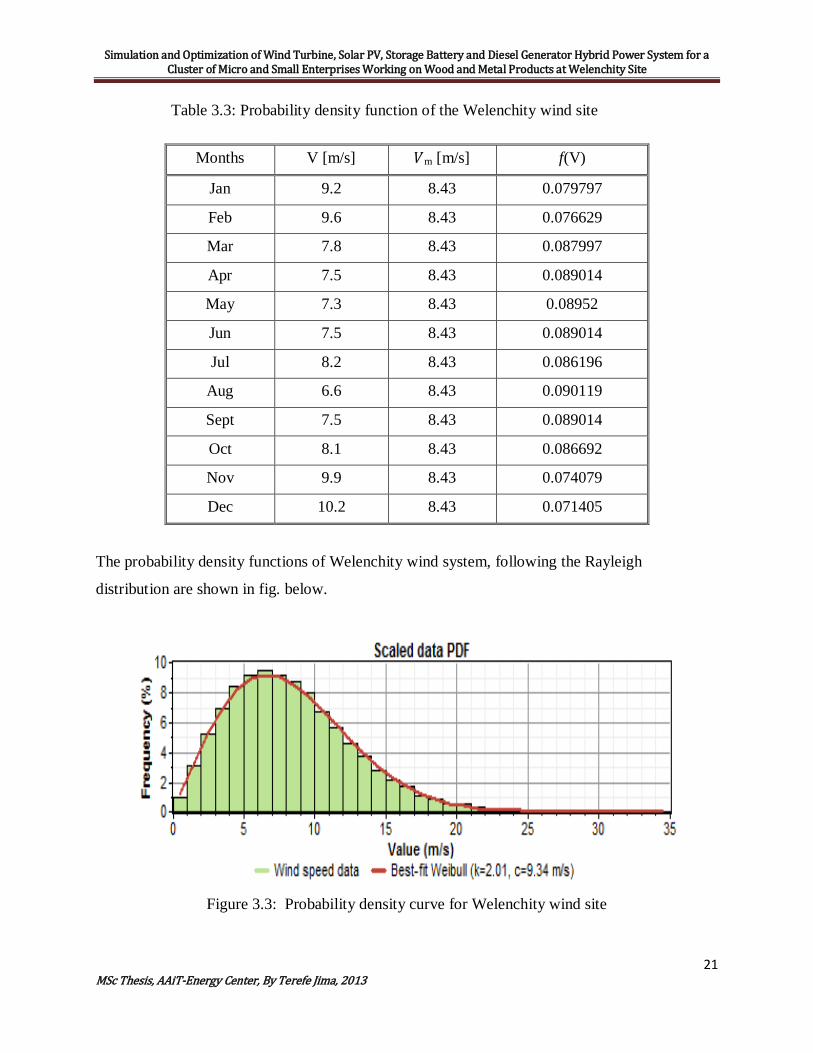
The probability density function of the Welenchity wind site is calculated as follows using the
Rayleigh wind distribution:
Simulation and Optimization of Wind Turbine, Solar PV, Storage Battery and Diesel Generator Hybrid Power System for a Cluster of Micro and Small Enterprises Working on Wood and Metal Products at Welenchity Site
21 MSc Thesis, AAiT-Energy Center, By Terefe Jima, 2013
Table 3.3: Probability density function of the Welenchity wind site
The probability density functions of Welenchity wind system, following the Rayleigh
distribution are shown in fig. below.
Figure 3.3: Probability density curve for Welenchity wind site
Months V [m/s] 𝑉𝑉m [m/s] f(V)
Jan 9.2 8.43 0.079797
Feb 9.6 8.43 0.076629
Mar 7.8 8.43 0.087997
Apr 7.5 8.43 0.089014
May 7.3 8.43 0.08952
Jun 7.5 8.43 0.089014
Jul 8.2 8.43 0.086196
Aug 6.6 8.43 0.090119
Sept 7.5 8.43 0.089014
Oct 8.1 8.43 0.086692
Nov 9.9 8.43 0.074079
Dec 10.2 8.43 0.071405
Simulation and Optimization of Wind Turbine, Solar PV, Storage Battery and Diesel Generator Hybrid Power System for a Cluster of Micro and Small Enterprises Working on Wood and Metal Products at Welenchity Site
22 MSc Thesis, AAiT-Energy Center, By Terefe Jima, 2013
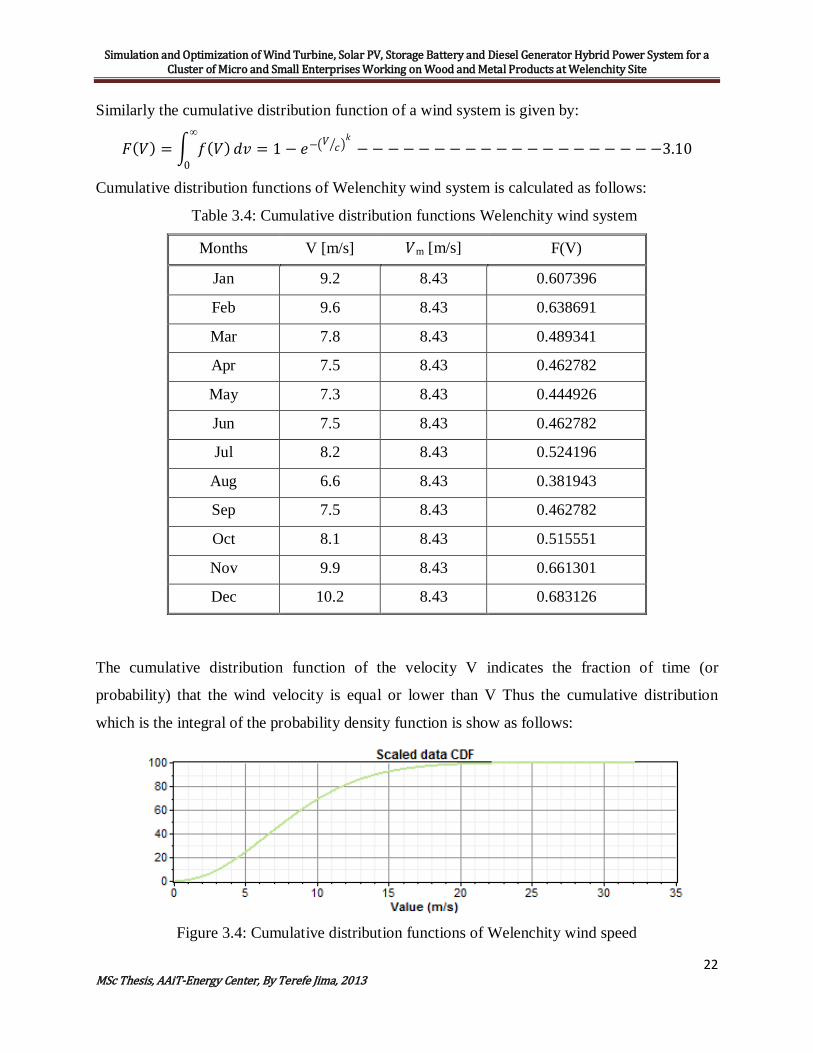
Similarly the cumulative distribution function of a wind system is given by:
𝐹𝐹(𝑉𝑉) = � 𝑟𝑟(𝑉𝑉)∞
0𝑑𝑑𝑣𝑣 = 1 − 𝑔𝑔−�𝑉𝑉 𝑐𝑐� �
𝑘𝑘− − −−− −− −− −− −− −− −− −−−3.10
Cumulative distribution functions of Welenchity wind system is calculated as follows:
Table 3.4: Cumulative distribution functions Welenchity wind system
Months V [m/s] 𝑉𝑉m [m/s] F(V)
Jan 9.2 8.43 0.607396
Feb 9.6 8.43 0.638691
Mar 7.8 8.43 0.489341
Apr 7.5 8.43 0.462782
May 7.3 8.43 0.444926
Jun 7.5 8.43 0.462782
Jul 8.2 8.43 0.524196
Aug 6.6 8.43 0.381943
Sep 7.5 8.43 0.462782
Oct 8.1 8.43 0.515551
Nov 9.9 8.43 0.661301
Dec 10.2 8.43 0.683126
The cumulative distribution function of the velocity V indicates the fraction of time (or
probability) that the wind velocity is equal or lower than V Thus the cumulative distribution
which is the integral of the probability density function is show as follows:
Figure 3.4: Cumulative distribution functions of Welenchity wind speed

Simulation and Optimization of Wind Turbine, Solar PV, Storage Battery and Diesel Generator Hybrid Power System for a Cluster of Micro and Small Enterprises Working on Wood and Metal Products at Welenchity Site
23 MSc Thesis, AAiT-Energy Center, By Terefe Jima, 2013
3.1.9.2 Rayleigh Approach for Energy Estimation of wind systems
In addition to the mean wind speed, the other two significant wind speeds for wind energy
estimation are the most probable wind speed (VF) and the wind speed carrying maximum energy
(VE) [6,12]:
The most probable wind speed corresponds to the peak of the probability density function, while
the wind speed carrying maximum energy can be used to estimate the wind turbine design or
rated wind speed. Prior studies have shown that wind turbine system operates most efficiently at
its rated wind speed. Therefore, it is required that the rated wind speed and the wind speed
carrying maximum energy should be as close as possible [16].
Considering Rayleigh distribution, wind energy density at Welenchity site is given by the
expression:
𝐸𝐸𝐷𝐷 = �3∏� �𝜌𝜌𝑎𝑎𝑉𝑉𝑚𝑚3 … … … … … … … … … … … … … … … … … … … … … … … … . . … … . … .3.11
Energy available at Welenchity wind power system site for the unit area of the rotor, over a time
period, can be estimated using the expression:
𝐸𝐸𝑡𝑡 = 𝑇𝑇𝐸𝐸𝐷𝐷 = �3∏� �𝑇𝑇𝜌𝜌𝑎𝑎𝑉𝑉𝑚𝑚3 … … … … … … … … … … … … … … … … … … … … … … … … … … 3.12
The most frequent wind velocity at the Welenchity wind power system site VFmax is given by:
𝑉𝑉𝐹𝐹𝐹𝐹𝑎𝑎𝐹𝐹 = ��2∏� �2 𝑉𝑉𝑚𝑚 … … … … … … … … … … … … … … … … … … … … … … … … … … … … .3.13
The velocity contributing maximum energy to Welenchity wind energy system is determined
from:
𝑉𝑉𝐸𝐸𝐹𝐹𝑎𝑎𝐹𝐹 = 2 × ��2∏� �2 𝑉𝑉𝑚𝑚 … … … … … … … … … … … … … … … … … … … … … … … … … … 3.14
From the monthly average velocity given in table 3.2 the wind energy density, monthly energy
availability, most frequent wind velocity and the velocity corresponding to the maximum energy
Welenchity site wind energy are calculated by using the above Rayleigh approach for energy
estimation formulas and shown in the table below.

Simulation and Optimization of Wind Turbine, Solar PV, Storage Battery and Diesel Generator Hybrid Power System for a Cluster of Micro and Small Enterprises Working on Wood and Metal Products at Welenchity Site
24 MSc Thesis, AAiT-Energy Center, By Terefe Jima, 2013
Table 3.5: Wind Energy Potential Based on Rayleigh Analysis
Month Vm [m/s] ED [kW/m2] Et
[kW/m2/month]
VFmax
[m/s] VE [m/s]
Jan 9.2 0.908 675.29 7.3 14.7
Feb 9.6 1.031 717.76 7.7 15.3
Mar 7.8 0.553 411.54 6.2 12.5
Apr 7.5 0.492 354.06 6.0 12.0
May 7.3 0.455 337.36 5.8 11.7
Jun 7.5 0.492 354.06 6.0 12.0
Jul 8.2 0.643 478.16 6.5 13.1
Aug 6.6 0.335 249.32 5.3 10.5
Sept 7.5 0.492 354.06 6.0 12.0
Oct 8.1 0.620 460.87 6.5 12.9
Nov 9.9 1.131 814.31 7.9 15.8
Dec 10.2 1.237 920.29 8.1 16.3
From this it can be concluded that there is potential wind energy from the site to supply parts of
the demanded electric load.
3.2 Solar Energy Resources and Analysis
3.2.1 Solar Energy Resources
The sun is the largest energy source of life while at the same time it is the ultimate source of
most of renewable energy sources. Solar energy can be used to generate electricity in a direct
way with the use of photovoltaic modules. Photovoltaic is defined as the generation of electricity
from light where the term photovoltaic is a compound word and comes from the Greek word for
light, photo, with, volt, which is the unit of electromotive power.

Simulation and Optimization of Wind Turbine, Solar PV, Storage Battery and Diesel Generator Hybrid Power System for a Cluster of Micro and Small Enterprises Working on Wood and Metal Products at Welenchity Site
25 MSc Thesis, AAiT-Energy Center, By Terefe Jima, 2013
Solar radiation provides a huge amount of energy to the earth. The total amount of energy, which
is irradiated from the sun to the earth's surface, equals approximately 10,000 times the annual
global energy consumption [Patel, 2006].
The light of the sun, which reaches the surface of the earth, consists mainly of two components:
direct sunlight and indirect or diffuse sunlight, which is the light that has been scattered by dust
and water particles in the atmosphere. Photovoltaic cells not only use the direct component of the
light, but also produce electricity when the sky is cloudy.
3.2.2 Analysis of Photovoltaic (PV) Power for the Selected Site
To determine the PV electricity generation potential for a particular site, it is important to assess
the average total solar radiation received over the year. Unfortunately in most developing
countries there is no properly recorded radiation data. What usually available is sunshine
duration data.
Ethiopia is one of the developing countries which have no properly recorded solar radiation data
and, like many other countries, what is available is sunshine duration data. However, given a
knowledge of the number of sunshine hours and local atmospheric conditions, sunshine duration
data can be used to estimate monthly average solar radiation, with the help of empirical equation
3.15 [Duffie and Beckman, 2006].
𝐻𝐻 = 𝐻𝐻�𝑂𝑂 �𝑎𝑎 + 𝑏𝑏 �𝑘𝑘�𝑁𝑁��… … … … … … … … … … … … . . … … … … … … … … … … … … … . .3.15
where H is the monthly average daily radiation on a horizontal surface (MJ/m2), 𝐻𝐻�𝑂𝑂 is the
monthly average daily extraterrestrial radiation on a horizontal surface (MJ/m2), 𝑘𝑘� is the
monthly average daily number of hours of bright sunshine, N is the monthly average of the
maximum possible daily hours of bright sunshine, a and b are regression coefficients Solar
radiation, known as extraterrestrial radiation, 𝐻𝐻�𝑂𝑂, on a horizontal plane outside the atmosphere,
is given by equation 3.2.
Simulation and Optimization of Wind Turbine, Solar PV, Storage Battery and Diesel Generator Hybrid Power System for a Cluster of Micro and Small Enterprises Working on Wood and Metal Products at Welenchity Site
26 MSc Thesis, AAiT-Energy Center, By Terefe Jima, 2013
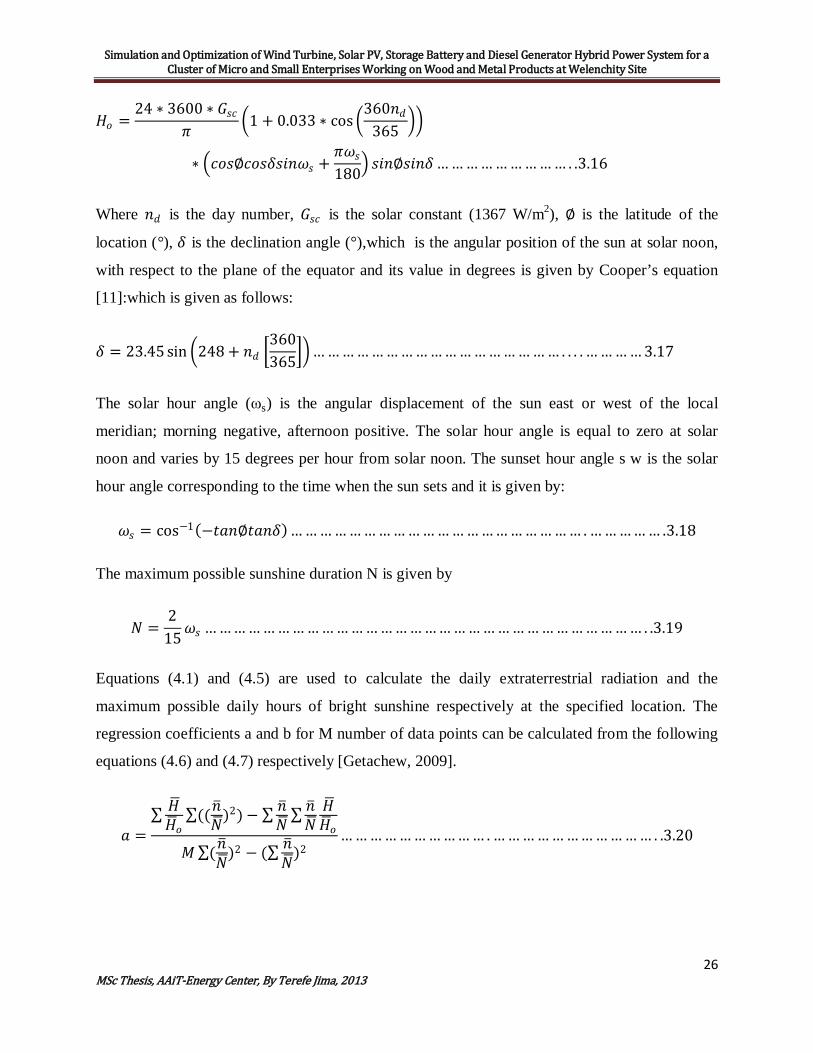
𝐻𝐻𝑜𝑜 =24 ∗ 3600 ∗ 𝐺𝐺𝑠𝑠𝑐𝑐
𝜋𝜋 �1 + 0.033 ∗ cos �360𝑘𝑘𝑑𝑑
365 ��
∗ �𝑐𝑐𝑜𝑜𝑠𝑠∅𝑐𝑐𝑜𝑜𝑠𝑠𝑐𝑐𝑠𝑠𝑘𝑘𝑘𝑘𝜔𝜔𝑠𝑠 +𝜋𝜋𝜔𝜔𝑠𝑠180� 𝑠𝑠𝑘𝑘𝑘𝑘∅𝑠𝑠𝑘𝑘𝑘𝑘𝑐𝑐… … … … … … … … … . .3.16
Where 𝑘𝑘𝑑𝑑 is the day number, 𝐺𝐺𝑠𝑠𝑐𝑐 is the solar constant (1367 W/m2), ∅ is the latitude of the
location (°), 𝑐𝑐 is the declination angle (°),which is the angular position of the sun at solar noon,
with respect to the plane of the equator and its value in degrees is given by Cooper’s equation
[11]:which is given as follows:
𝑐𝑐 = 23.45 sin �248 + 𝑘𝑘𝑑𝑑 �360365��… … … … … … … … … … … … … … … … … . . . . … … … … 3.17
The solar hour angle (ωs) is the angular displacement of the sun east or west of the local
meridian; morning negative, afternoon positive. The solar hour angle is equal to zero at solar
noon and varies by 15 degrees per hour from solar noon. The sunset hour angle s w is the solar
hour angle corresponding to the time when the sun sets and it is given by:
𝜔𝜔𝑠𝑠 = cos−1(−𝑡𝑡𝑎𝑎𝑘𝑘∅𝑡𝑡𝑎𝑎𝑘𝑘𝑐𝑐) … … … … … … … … … … … … … … … … … … … … . … … … … … .3.18
The maximum possible sunshine duration N is given by
𝑁𝑁 =2
15𝜔𝜔𝑠𝑠 … … … … … … … … … … … … … … … … … … … … … … … … … … … … … … . .3.19
Equations (4.1) and (4.5) are used to calculate the daily extraterrestrial radiation and the
maximum possible daily hours of bright sunshine respectively at the specified location. The
regression coefficients a and b for M number of data points can be calculated from the following
equations (4.6) and (4.7) respectively [Getachew, 2009].
𝑎𝑎 =∑ 𝐻𝐻�𝐻𝐻�𝑜𝑜
∑((𝑘𝑘�𝑁𝑁�)2)− ∑ 𝑘𝑘�𝑁𝑁�∑ 𝑘𝑘�𝑁𝑁�𝐻𝐻�𝐻𝐻�𝑜𝑜
𝐹𝐹∑(𝑘𝑘�𝑁𝑁�)2 − (∑ 𝑘𝑘�𝑁𝑁�)2
… … … … … … … … … … . … … … … … … … … … … … . .3.20
Simulation and Optimization of Wind Turbine, Solar PV, Storage Battery and Diesel Generator Hybrid Power System for a Cluster of Micro and Small Enterprises Working on Wood and Metal Products at Welenchity Site
27 MSc Thesis, AAiT-Energy Center, By Terefe Jima, 2013
𝑏𝑏 =𝐹𝐹∑ 𝑘𝑘�
𝑁𝑁�𝐻𝐻�𝐻𝐻�𝑜𝑜
− ∑ 𝑘𝑘�𝑁𝑁�∑ 𝐻𝐻�𝐻𝐻�𝑜𝑜
𝐹𝐹 ∑(𝑘𝑘�𝑁𝑁�)2 − (∑ 𝑘𝑘�𝑁𝑁�)2
… … … … … … … … … … … … … … … … … . . … … … … … … … … 3.21
Results estimated in this way are compared with the data which are obtained from sources such
as NASA's surface solar energy data set or the SWERA global meteorological database. Drake
and Mulugetta developed sets of constants a and b for various locations in Ethiopian [Drake and
Mulugetta, 1996]. In this thesis, regression coefficients developed in their work was used.
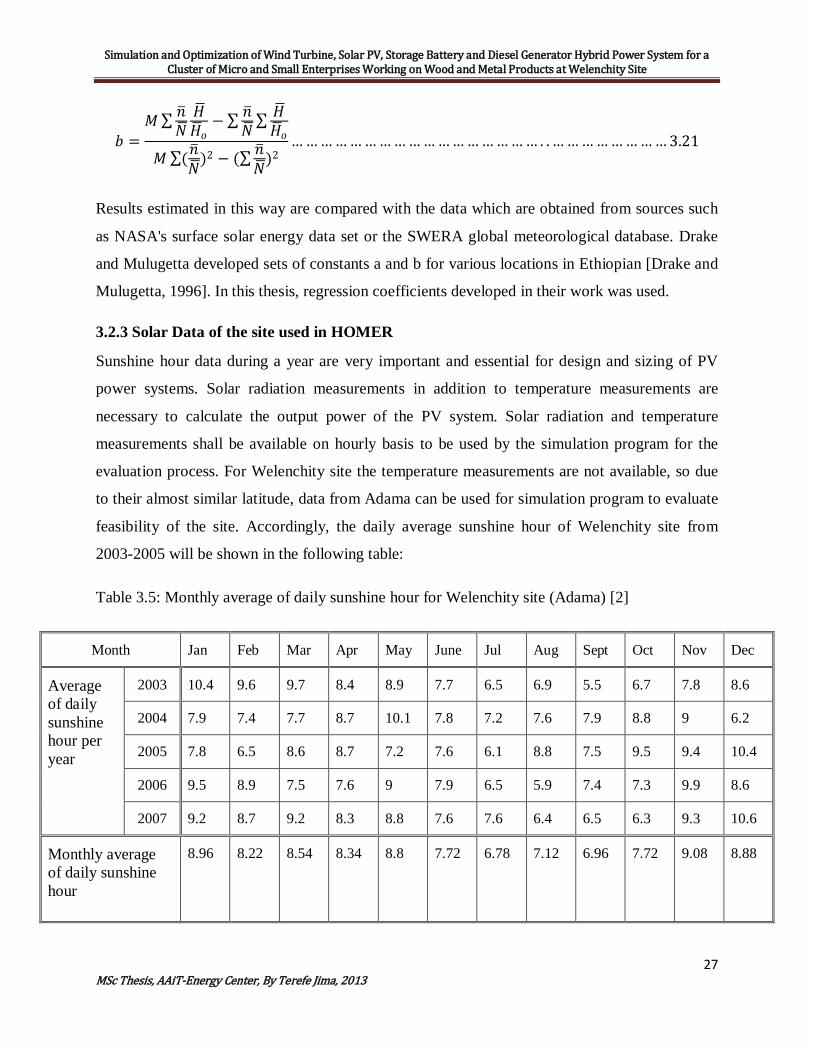
3.2.3 Solar Data of the site used in HOMER
Sunshine hour data during a year are very important and essential for design and sizing of PV
power systems. Solar radiation measurements in addition to temperature measurements are
necessary to calculate the output power of the PV system. Solar radiation and temperature
measurements shall be available on hourly basis to be used by the simulation program for the
evaluation process. For Welenchity site the temperature measurements are not available, so due
to their almost similar latitude, data from Adama can be used for simulation program to evaluate
feasibility of the site. Accordingly, the daily average sunshine hour of Welenchity site from
2003-2005 will be shown in the following table:
Table 3.5: Monthly average of daily sunshine hour for Welenchity site (Adama) [2]
Month Jan Feb Mar Apr May June Jul Aug Sept Oct Nov Dec
Average of daily sunshine hour per year
2003 10.4 9.6 9.7 8.4 8.9 7.7 6.5 6.9 5.5 6.7 7.8 8.6
2004 7.9 7.4 7.7 8.7 10.1 7.8 7.2 7.6 7.9 8.8 9 6.2
2005 7.8 6.5 8.6 8.7 7.2 7.6 6.1 8.8 7.5 9.5 9.4 10.4
2006 9.5 8.9 7.5 7.6 9 7.9 6.5 5.9 7.4 7.3 9.9 8.6
2007 9.2 8.7 9.2 8.3 8.8 7.6 7.6 6.4 6.5 6.3 9.3 10.6
Monthly average of daily sunshine hour
8.96 8.22 8.54 8.34 8.8 7.72 6.78 7.12 6.96 7.72 9.08 8.88

Simulation and Optimization of Wind Turbine, Solar PV, Storage Battery and Diesel Generator Hybrid Power System for a Cluster of Micro and Small Enterprises Working on Wood and Metal Products at Welenchity Site
28 MSc Thesis, AAiT-Energy Center, By Terefe Jima, 2013
Table 3.6: Monthly average of daily solar radiation for Welenchity site (Adama) [2]
Month Jan Feb Mar Apr May Jun Jul Aug Sept Oct Nov Dec
Monthly average of
daily sunshine hour 8.96 8.22 8.54 8.34 8.8 7.72 6.78 7.12 6.96 7.72 9.08 8.88
Daily Solar radiation
@Lat = 8.468O N
and Lon = 39.159O E
6.24 6.50 6.66 6.56 6.51 5.88 5.30 5.31 5.90 6.41 6.28 6.07
These figures which are the main inputs for the software are relatively high and very
encouraging to use PV generators for electrification of certain loads as it has been worldwide
successfully used.
Simulation and Optimization of Wind Turbine, Solar PV, Storage Battery and Diesel Generator Hybrid Power System for a Cluster of Micro and Small Enterprises Working on Wood and Metal Products at Welenchity Site
29 MSc Thesis, AAiT-Energy Center, By Terefe Jima, 2013
CHAPTER FOUR
HYBRID SYSTEM COMPONENTS MODELING AND SIZING
The most frequent combination of renewable energy sources for electric power supply is wind
and solar photovoltaic. The components and subsystems of a standalone power supply system
based on renewable sources are interconnected to optimize the whole system. The design of a
hybrid system will depend on the requirements of the load (isolated or not isolated, rural or
urban, DC or AC) and on the power supply system.
Off-grid hybrid systems can also incorporate energy storage in batteries to increase duration of
energy autonomy. If a permanent electric power supply is required, a backup diesel generator can
be connected to the system to provide electric energy for peak loads which can't be covered by
the hybrid system.
It is so important to determine the appropriate size of hybrid system components. The system
shall not be oversized (expensive without increasing performance) or undersized (not capable to
operate load).
4.1 Load Profile
Load profile study and determination are the first steps for the design of any electric power
system. Nature of operation of loads and behavior of consumers are the parameters that
determine the load profile. In Welenchity case, most of loads are lighting fixtures, radio/TV and
work appliances (for welding, spraying, varnishing and machines, etc.). Natures of operation of
these loads, ON and OFF between day and night which make the load profile as shown in Table
4.1 and Figure 4.1, respectively. The hybrid system is designed to supply this daily load curve.

Simulation and Optimization of Wind Turbine, Solar PV, Storage Battery and Diesel Generator Hybrid Power System for a Cluster of Micro and Small Enterprises Working on Wood and Metal Products at Welenchity Site
30 MSc Thesis, AAiT-Energy Center, By Terefe Jima, 2013
Table 4.1: Daily load profile of the site
Hour of operation
00:00 - 01:00
01:00 - 02:00
02:00 - 03:00
03:00 - 04:00
04:00 - 05:00
05:00 - 06:00
06:00 - 07:00
07:00 - 08:00
08:00 - 09:00
09:00 - 10:00
10:00 - 11:00
11:00 - 12:00
Load demanded (kW)
15.500 15.000 15.500 14.500 15.000 14.000 14.500 19.000 18.000 15.000 15.000 15.000
Hour of operation
12:00 - 13:00
13:00 - 14:00
14:00 - 15:00
15:00 - 16:00
16:00 - 17:00
17:00 - 18:00
18:00 - 19:00
19:00 - 20:00
20:00 - 21:00
21:00 - 22:00
22:00 - 23:00
23:00 - 00:00
Load demanded (kW)
15.000 6.000 6.000 6.000 6.000 6.000 6.000 6.000 6.000 6.000 12.500 14.000
Figure 4.1: Daily load curve for the specified site
4.2 Wind Turbine Modeling and Sizing
The power output of a wind turbine is determined by its power curve and the instantaneous wind speed at the sight of installing this wind turbine. A mathematical model for the power curve of a wind turbine taking into account these parameters is as follows [19]:
Simulation and Optimization of Wind Turbine, Solar PV, Storage Battery and Diesel Generator Hybrid Power System for a Cluster of Micro and Small Enterprises Working on Wood and Metal Products at Welenchity Site
31 MSc Thesis, AAiT-Energy Center, By Terefe Jima, 2013
𝑃𝑃𝑊𝑊 = �0
𝑎𝑎 ∗ 𝑣𝑣3 − 𝑏𝑏 ∗ 𝑃𝑃𝑟𝑟𝑃𝑃𝑟𝑟
� �𝑉𝑉 < 𝑉𝑉𝑐𝑐𝑘𝑘
𝑉𝑉𝑐𝑐𝑘𝑘 < 𝑉𝑉 < 𝑉𝑉𝑟𝑟𝑉𝑉𝑟𝑟 < 𝑉𝑉 < 𝑉𝑉𝑐𝑐𝑜𝑜
� 𝑎𝑎𝑘𝑘𝑑𝑑 0 𝑟𝑟𝑜𝑜𝑟𝑟 𝑉𝑉 > 𝑉𝑉𝑐𝑐𝑜𝑜 . 4.1
Where, 𝑃𝑃𝑊𝑊 (in W/m2): is the output power density generated by a wind turbine,
a=Pr
Vr3-Vci
3 …………………….…………….……………………………4.2
b=Vci
3
Vr3-Vco
3 ……………………………………………………….…………4.3
and , Pr,V,Vci,Vr,Vco,are rated power (w) , instantaneous , cut-in , rated and cut-out wind speeds in (m /s) respectively.
The real electrical power delivered is calculated as
𝑃𝑃𝑤𝑤𝑜𝑜𝑤𝑤𝑡𝑡 =𝑃𝑃𝑤𝑤 ∗ 𝐴𝐴𝑤𝑤 ∗ 𝜂𝜂𝑤𝑤………………………………………………………………….……….4.4)
where Aw is the total swept area of the wind turbine in m2and ηw is the electrical efficiency of the wind generator and any other electrical components connected to the generator.
4.3 PV Panel Modeling and Sizing
The total peak power of the PV generator required to supply certain load depends on load, solar radiation, ambient temperature, power temperature coefficient, efficiencies of solar charger regulator and inverter and on the safety factor taken into account to compensate for losses and temperature effect. This total peak power is obtained as follows:
𝑃𝑃(𝑟𝑟 − 𝑝𝑝𝑣𝑣) =𝐸𝐸𝐸𝐸
(𝜂𝜂𝑃𝑃𝑉𝑉𝑅𝑅 ∗ 𝜂𝜂𝑉𝑉 ∗ 𝑃𝑃𝑇𝑇𝐻𝐻) ∗ 𝑇𝑇𝐹𝐹 … … … … … … … … … … … … . .4.5
Where 𝐸𝐸𝐸𝐸 is the daily energy consumption in kWh, PSH is the peak sun hours (in Welenchity case PSH = 9.08) and as a figure it represents the yearly average of daily solar radiation intensity on horizontal surface in (kWh/m2 / day),ηPVR,ηV are efficiencies of solar charger regulator and inverter and SF is the safety factor.
4.4 Battery Bank Modeling and Sizing
The output power from the wind turbine varies with wind speed variations through the day. Also the maximum power output of the PV generator varies according to variations in solar radiation and temperature. So the PV generator and the wind turbine may not be able to meet the load demands at all times. A battery between the DC bus of the hybrid system and the load will compensate and act as a power supply during these times.

Simulation and Optimization of Wind Turbine, Solar PV, Storage Battery and Diesel Generator Hybrid Power System for a Cluster of Micro and Small Enterprises Working on Wood and Metal Products at Welenchity Site
32 MSc Thesis, AAiT-Energy Center, By Terefe Jima, 2013
Excess energy during times when the output power from the wind turbine and the PV generator exceed the load requirement is stored in the battery to supply load at times when the wind turbine and the PV generator are not able to supply load.
The two main types of batteries used in hybrid systems are nickel-cadmium and lead-acid. Nickel-cadmium batteries are restricted in use for few systems due to higher cost, lower energy efficiency and limited upper operating temperature. A lead-acid battery is still the most common type for the hybrid systems [20].
4.4.1 Lead acid battery construction and performance
A lead acid battery in its basic construction is made of more than one electrochemical cells interconnected in such a way to provide the required voltage and current. Lead acid battery is constructed of two electrodes, the positive one consists of lead dioxide PbO2 and the negative consists of pure lead. The empty space between the two electrodes is filled with diluted sulphuric acid. The voltage of the battery depends on cell temperature and the density of the acid solution, also its density changes with temperature and charge state. A battery with a 12V nominal voltage is constructed of 6*2V lead acid cells. The upper and lower limits of charging and discharging open circuit voltage at 25 Co are 14.4V and 10.5V respectively [20].
The depth of discharge (DOD) is the state of charge of the battery. The relation between battery voltage and its depth of discharge is almost linear until a cut-off-voltage point is reached. Operating battery beyond this point will result in increasing the internal resistance of the battery and may result in damaging of it. A charge controller (regulator) is used to control operation of battery within its design limits so that not to exceed its cut-off point, also not to exceed overcharge limit.
A lead acid battery loses some of its capacity due to internal chemical reaction. This phenomenon is called self of discharge (SOD) of the battery and it increases with increasing in battery temperature. Providing batteries with lead grid or lead-calcium grid will minimize its SOD [20].
Long life-time, cycling stability rate and capability of standing very deep discharge are the main design points shall be taken into account when choose a battery for certain application.
4.4.2 Lead acid battery rating and model
Battery rating is commonly specified in terms of its Ampere-hour (Ah) or Watt-hour (Wh) capacity. The ampere-hour capacity of a battery is the quantity of discharge current available for a specified length of time at a certain temperature and discharge rate. High discharge current would result in reduction of the battery capacity and will decrease its life time.
Simulation and Optimization of Wind Turbine, Solar PV, Storage Battery and Diesel Generator Hybrid Power System for a Cluster of Micro and Small Enterprises Working on Wood and Metal Products at Welenchity Site
33 MSc Thesis, AAiT-Energy Center, By Terefe Jima, 2013
The ampere-hour efficiency of a battery (ηAh) is the ratio of amount of total Ampere-hours the battery provides during discharge to that required to charge it back to its original condition. The battery efficiency can be specified as Watt-hour efficiency (ηwh), its definition is in the same manner as ηAh*ηwh has values lower than ηAh because the variation in voltage is taken into account [20].
When the power generated from the renewable system (wind and PV in the case under study) exceeds the load requirement, energy is stored in the battery. A minimum storage level is specified for a battery so that should not be exceeded it. This level is a function of battery DOD so that
𝐸𝐸𝑚𝑚𝑘𝑘𝑘𝑘 = EBN ∗ (1 −𝐷𝐷𝑂𝑂𝐷𝐷) … … … … … … … … … … … … … … … … … … 4.6
where
Emin : minimum allowable capacity of the battery bank,
EBN: is the nominal capacity of battery bank,
DOD: is the depth of discharge.
Energy stored in the battery at any time during charging mode can be expressed as [3]:
𝐸𝐸𝑏𝑏(𝑡𝑡) = 𝐸𝐸𝑏𝑏(𝑡𝑡 − 1) ∗ (1 − 𝛼𝛼) + �𝐸𝐸𝑤𝑤 (𝑡𝑡) + 𝐸𝐸𝑃𝑃𝑉𝑉 (𝑡𝑡)−𝐸𝐸𝐸𝐸(𝑡𝑡)𝜂𝜂𝑣𝑣
� ∗ 𝜂𝜂𝑤𝑤ℎ … 4.7
Energy stored in the battery at any time during discharging mode can be expressed also as [3]:
𝐸𝐸𝑏𝑏(𝑡𝑡) = 𝐸𝐸𝑏𝑏(𝑡𝑡 − 1) ∗ (1 − 𝛼𝛼) − �𝐸𝐸𝐸𝐸(𝑡𝑡)𝜂𝜂𝑣𝑣
〖−(𝐸𝐸〗𝑤𝑤(𝑡𝑡) + 𝐸𝐸𝑃𝑃𝑉𝑉 (𝑡𝑡)��… … 4.8
where
α : is hourly self discharge rate,
Ew(t) : is the energy from wind turbine during the time interval,
Epv(t): is the energy from PV system during the time interval,
EL(t: )is the load requirement during the time interval
Eb(t) and Eb(t-1): are the charge capacity of battery bank at the time t and (t-1) respectively,
𝜂𝜂𝑣𝑣 and 𝜂𝜂𝑤𝑤ℎ : are the efficiency of inverter and battery bank respectively as stated before.

Simulation and Optimization of Wind Turbine, Solar PV, Storage Battery and Diesel Generator Hybrid Power System for a Cluster of Micro and Small Enterprises Working on Wood and Metal Products at Welenchity Site
34 MSc Thesis, AAiT-Energy Center, By Terefe Jima, 2013
4.4.3 Battery bank sizing
The two types of lead-acid batteries available at high capacities are the regular and the block types. The block type has long life time (>10 years), high cycling stability-rate (> 1000 times) and capability of standing very deep discharge, but has higher price than regular batteries [1].
The ampere-hour capacity (CAh) and watt-hour capacity (CWh) of a battery bank required to supply a load for a certain period ( day) when an energy from renewable resources is not available can be specified as follows [1] :
𝐶𝐶𝑊𝑊ℎ =𝐸𝐸𝐸𝐸 ∗ 𝐴𝐴𝐷𝐷
𝜂𝜂𝑣𝑣 ∗ 𝜂𝜂𝑤𝑤ℎ ∗ 𝐷𝐷𝑂𝑂𝐷𝐷… … … … … … … . … … … … … … … … … … … 4.9
where AD: is the daily autonomy.
It is obvious from relation (4.9) that total capacity of the battery depends on daily autonomy which represents number of days that battery will be capable to supply the load in case of shortage of the renewable sources.
4.5 Diesel Generator Ratings and sizing
A back up Diesel generator can be connected to the hybrid system to provide electric energy for peak loads which can't be covered by this hybrid system if a permanent electric power supply is required or in case of incapability of the renewable sources to supply the load .
4.5.1 Diesel generator rating
Diesel generator is used in the system for following tasks: To supply load when the output power from wind and PV is not enough to operate this load, as well as to bring the SOC of batteries to an acceptable level. The Diesel generator rating shall be large enough to achieve these tasks. Optimal unit sizing of a Diesel generator requires careful consideration of several factors including detailed analysis of daily and seasonal load fluctuations, annual load growth, and incorporation of practical constraints for feasible and reliable Diesel operation. If Diesel units are only sized based on peak and/or average load values, on an annual base, with some safety margins and additional capacity for future expansion, the Diesel plant will generally be very oversized. The reason is that remote community loads are normally characterized as being highly variable, with the peak load as high as many times the average load.
Number of hours of operation depends on the size of wind turbine and PV system, size of Diesel generator and the climate conditions.
Type of Diesel generator - according to its number of poles - shall be selected considering the expected number of hours of operation per year. For applications require less than about 400

Simulation and Optimization of Wind Turbine, Solar PV, Storage Battery and Diesel Generator Hybrid Power System for a Cluster of Micro and Small Enterprises Working on Wood and Metal Products at Welenchity Site
35 MSc Thesis, AAiT-Energy Center, By Terefe Jima, 2013
hours of operation per year, 2-pole generators are recommended since these generators have higher rpm. Otherwise 4-pole generators are selected [9].
4.5.2 Diesel generator sizing
The Diesel generator should be selected to cover the load so its ratings are determined according to load specifications. The optimum selection of the generator rating is such that the generator with other sources shall provide load with power it needs at all cases. A practical approach for large loads is to employ multiple units, e.g. a set of two or three Diesels, with various sizes and apply a Diesel cycling and dispatch strategy to optimize the loading of each unit to achieve maximum fuel efficiency.
4.6 Charge Controller (Regulator) Modeling and Sizing
Charge controller is an essential component in hybrid systems where a storage system is required. It protects battery against both excessive overcharge and deep discharge. Charge controller shall switch off the load when a certain state of discharge is reached, also shall switch off battery from the DC bus when it is fully charged. Charge controller can be adjusted to deal with different charge and discharge conditions. Charge controller act as interface between each of wind turbine and PV panel and the DC bus where the battery is connected. So charge controller is modeled by its efficiency where its output is
𝑃𝑃𝑊𝑊𝑅𝑅 = 𝑃𝑃𝑊𝑊𝑜𝑜𝑤𝑤𝑡𝑡 ∗ 𝜂𝜂𝑊𝑊𝑅𝑅 … … … … … … … … … … … … … … … … … … … … .4.10
And
PPVR=PPV out*ηPVR…………………………………………………..….4.11
where
PWR: is the output power of the wind charge controller,
PWout: is the wind turbine output power,
ΗWR: is the efficiency of the wind charge controller,
PPVR: is the output power of the PV charge controller,
Ppvout: is the PV panel output power, and
ηPVR: is efficiency of the PV charge controller.
The charge controller ratings are chosen according to the battery voltage and the output power from each of wind turbine and PV panel.

Simulation and Optimization of Wind Turbine, Solar PV, Storage Battery and Diesel Generator Hybrid Power System for a Cluster of Micro and Small Enterprises Working on Wood and Metal Products at Welenchity Site
36 MSc Thesis, AAiT-Energy Center, By Terefe Jima, 2013
4.7 Bidirectional Inverter Modeling and Sizing
A bidirectional inverter is essential in the hybrid system where a storage system and a backup Diesel generator are involved in the system. It can transfer power simultaneously in both directions. The inverter can supply DC and charge the batteries so it provides a path from the AC bus to the DC bus, in this case it acts as rectifier circuit which changes AC Diesel generator voltage to DC voltage. In the other way, it provides path from DC bus to the AC load so it acts as an inverter
ηdicm: is the efficiency of bidirectional inverter in its charge mode.
In this mode of operation (charger mode) the charger is characterized by its nominal AC voltage and voltage range, nominal DC output voltage that shall matched with DC bus voltage and it’s charging current.
In an inverter mode a bidirectional inverter can be modeled as follows:
𝑃𝑃𝑘𝑘𝑘𝑘𝑣𝑣𝑚𝑚 = 𝑃𝑃𝐷𝐷𝐶𝐶𝐷𝐷 ∗ 𝜂𝜂𝑘𝑘𝑘𝑘𝑣𝑣𝑚𝑚 … … … … … … … … … … … … … … … … … … … 4.13
where
Pinvm: is output power of directional inverter in its inverter mode,
PDCB: is the DC bus power
which changes DC voltage to AC voltage needed by the load.
Shape of the output waveform, power rating and efficiency are the parameters that shall be considered to choose a certain bi-directional inverter for certain application.
In a charger (rectifier) mode a bidirectional inverter can be modeled as follows:
𝑃𝑃𝑑𝑑𝑘𝑘𝑐𝑐𝑚𝑚 = 𝑃𝑃𝐺𝐺𝑜𝑜𝑤𝑤𝑡𝑡 ∗ 𝜂𝜂𝑑𝑑𝑘𝑘𝑐𝑐𝑚𝑚 … … … … … … … … … … … … … … … … . … … . .4.12
where
Pdicm: is output power of bidirectional inverter in its charge mode,
PGout: is Diesel generator output power, and
ηinvm: is efficiency of bidirectional inverter in its inverter mode (usually equals the efficiency of bidirectional inverter in its rectifier mode (ηdicm) and thus called ηV.
In this mode of operation (inverter mode) an inverter is characterized by its nominal voltage and voltage range that shall be matched with the DC bus voltage, nominal output voltage and its output power that shall fulfill the load power.

Simulation and Optimization of Wind Turbine, Solar PV, Storage Battery and Diesel Generator Hybrid Power System for a Cluster of Micro and Small Enterprises Working on Wood and Metal Products at Welenchity Site
37 MSc Thesis, AAiT-Energy Center, By Terefe Jima, 2013
The efficiency of converting the direct current to alternative current of most inverters today is 90% or more [Rivera, 2008]. Many inverters claim to have higher efficiencies but for this thesis the efficiency that was used is 90%.

Simulation and Optimization of Wind Turbine, Solar PV, Storage Battery and Diesel Generator Hybrid Power System for a Cluster of Micro and Small Enterprises Working on Wood and Metal Products at Welenchity Site
38 MSc Thesis, AAiT-Energy Center, By Terefe Jima, 2013
CHAPTER FIVE
HYBRID SYSTEM SIMULATION SOFTWARE AND COMPONENTS
5.1 Simulation Software
A software program using HOMER was developed to simulate the hybrid system behavior. An
hourly time step is used through this simulation. By using computer simulation, the optimum
system configuration can be found by comparing the performances and energy production costs
of different system configurations.
The Hybrid Optimization Model for Electric Renewable (HOMER), which is copyrighted by
Midwest Research Institute (MRI) is a computer model developed by the U.S. National
Renewable Energy Laboratory (NREL) to assist the design of power systems and facilitate the
comparison of power generation technologies across a wide range of applications [HOMER, ver.
2.68 Beta]. HOMER is used to model a power system physical behavior and its life-cycle cost,
which is the total cost of installing and operating the system over its life time. HOMER allows
the modeler to compare many different design options based on their technical and economic
merits. It also assists in understanding and quantifying the effects of uncertainty or changes in
the inputs.
The design of a stand-alone PV-wind hybrid power supply system to a model ca cluster of
MSEs, with average of daily demand of 281 kWh/day was carried out based on the theoretical
background discussed so far. HOMER software is used as a tool to accomplish the research. As
mentioned earlier, the main objective of the study is to design and model hybrid PV–Wind–
diesel–battery based standalone power generation systems to meet the load requirements of the
community specified earlier.
A schematic diagram of the standalone hybrid power supply system required is shown in figure
2.1 and its representation by HOMER is shown in figure 5.1. The power conditioning units are
dc-dc and ac-dc converters, with the sole purpose of matching the PV, batteries and wind turbine
voltages to that of the bus voltage at the dc bus. The ac load is of primary type and it is an
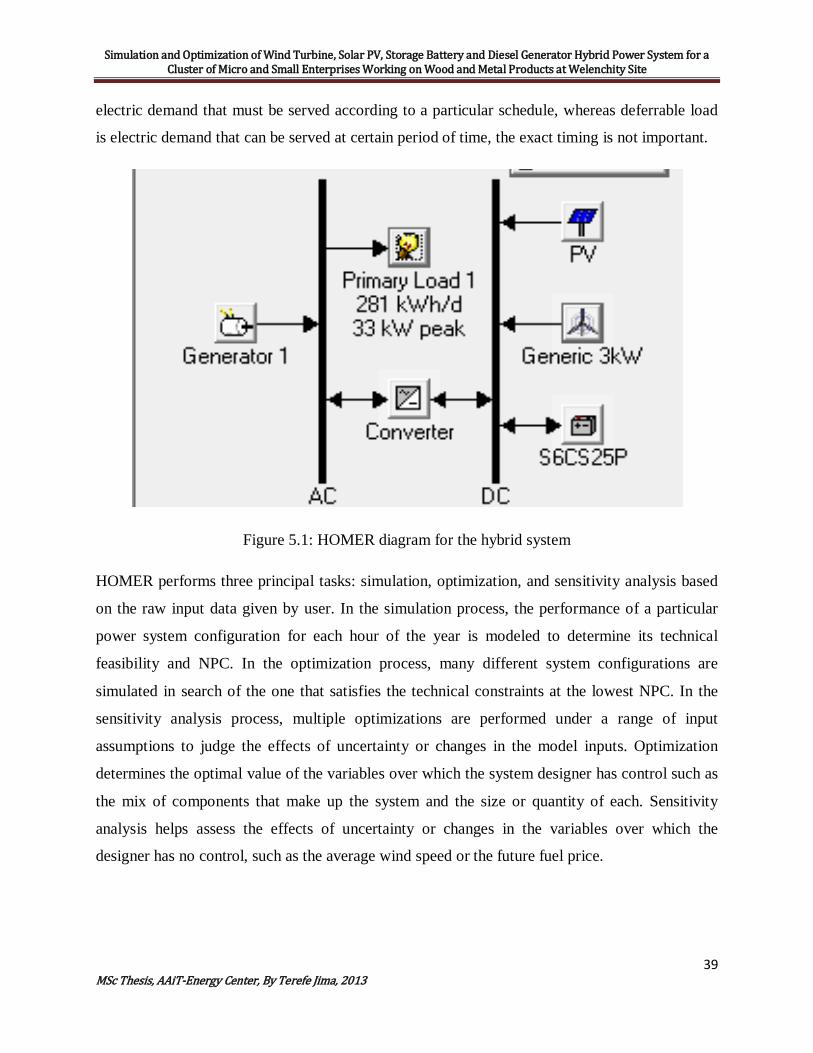
Simulation and Optimization of Wind Turbine, Solar PV, Storage Battery and Diesel Generator Hybrid Power System for a Cluster of Micro and Small Enterprises Working on Wood and Metal Products at Welenchity Site
39 MSc Thesis, AAiT-Energy Center, By Terefe Jima, 2013
electric demand that must be served according to a particular schedule, whereas deferrable load
is electric demand that can be served at certain period of time, the exact timing is not important.
Figure 5.1: HOMER diagram for the hybrid system
HOMER performs three principal tasks: simulation, optimization, and sensitivity analysis based
on the raw input data given by user. In the simulation process, the performance of a particular
power system configuration for each hour of the year is modeled to determine its technical
feasibility and NPC. In the optimization process, many different system configurations are
simulated in search of the one that satisfies the technical constraints at the lowest NPC. In the
sensitivity analysis process, multiple optimizations are performed under a range of input
assumptions to judge the effects of uncertainty or changes in the model inputs. Optimization
determines the optimal value of the variables over which the system designer has control such as
the mix of components that make up the system and the size or quantity of each. Sensitivity
analysis helps assess the effects of uncertainty or changes in the variables over which the
designer has no control, such as the average wind speed or the future fuel price.
Simulation and Optimization of Wind Turbine, Solar PV, Storage Battery and Diesel Generator Hybrid Power System for a Cluster of Micro and Small Enterprises Working on Wood and Metal Products at Welenchity Site
40 MSc Thesis, AAiT-Energy Center, By Terefe Jima, 2013
5.1.1 Simulation
The simulation process determines how a particular system configuration, a combination of
system components of specific sizes, and an operating strategy that defines how those
components work together, would behave in a given setting over a long period of time.
HOMER can simulate a wide variety of micro power system configurations, comprising any
combination of a PV array, one or two wind turbines, a run-of-river hydro-turbine, and up to
three generators, a battery bank, a dc-ac converter, an electrolyzer, and a hydrogen storage tank.
The system can be grid-connected or autonomous and can serve ac and dc electric loads and a
thermal load.
Systems that contain a battery bank and one or more generators require a dispatch strategy,
which is a set of rules governing how the system charges the battery bank. Dispatch strategy is
thoroughly discussed in section 6.1.4.
The simulation process serves two purposes. First, it determines whether the system is feasible.
The feasible system is one which can adequately serve the loads and satisfy any other constraints
imposed by the user. Second, it estimates the life-cycle cost of the system, which is the total cost
of installing and operating the system over its lifetime. The life-cycle cost is a convenient metric
for comparing the economics of various system configurations.
A particular system configuration is modeled by performing an hourly time series simulation of
its operation over one year. Simulation steps through the year one hour at a time, calculating the
available renewable power, comparing it to the electric load, and deciding what to do with
surplus renewable power in times of excess, or how best to generate additional power in times of
deficit. When one year’s worth of calculations is completed, it is determined whether the system
satisfies the constraints imposed by the user on such quantities as the fraction of the total
electrical demand served, the proportion of power generated by renewable sources, or the
emissions of certain pollutants, etc. The quantities required to calculate the system’s life-cycle
cost, such as the annual fuel consumption, annual generator operating hours, expected battery life
are also computed.

Simulation and Optimization of Wind Turbine, Solar PV, Storage Battery and Diesel Generator Hybrid Power System for a Cluster of Micro and Small Enterprises Working on Wood and Metal Products at Welenchity Site
41 MSc Thesis, AAiT-Energy Center, By Terefe Jima, 2013
The quantity used to represent the life-cycle cost of the system is the total net present cost
(NPC). This single value includes all costs and revenues that occur within the project lifetime,
with future cash flows discounted to the present. The total net present cost includes the initial
capital cost of the system components, the cost of any component replacements that occur within
the project lifetime, the cost of maintenance and fuel.
5.1.2 Optimization
The simulation process models a particular system configuration, whereas the optimization
process determines the best possible system configuration. The best possible, or optimal, system
configuration is the one that satisfies the user-specified constraints at the lowest total net present
cost. Finding the optimal system configuration may involve deciding on the mix of components
that the system should contain, the size or quantity of each component, and the dispatch strategy
the system should use. In the optimization process, many different system configurations are
simulated; the infeasible ones are discarded, the feasible ones are ranked according to total net
present cost, and the feasible one is presented with the lowest total net present cost as the optimal
system configuration.
The goal of the optimization process is to determine the optimal value of each decision variable
that interests the modeler. A decision variable is a variable over which the system designer has
control and for which multiple possible values can be considered in the optimization process.
Possible decision variables include:
a) The size of the PV array
b) The number of wind turbines
c) The size of each generator
d) The number of batteries
e) The size of the dc-ac converter
Here optimization can help the modeler find the optimal system configuration out of many
possibilities. Multiple values for each decision variable can be entered in search space, which is
the table that contains the set of all possible system configurations over which HOMER can
search for optimal system configuration. In the optimization process, every system configuration
Simulation and Optimization of Wind Turbine, Solar PV, Storage Battery and Diesel Generator Hybrid Power System for a Cluster of Micro and Small Enterprises Working on Wood and Metal Products at Welenchity Site
42 MSc Thesis, AAiT-Energy Center, By Terefe Jima, 2013
in the search space is simulated and the feasible ones are displayed in a table, sorted by total net
present cost.
5.1.3 Sensitivity Analysis
In the sensitivity analysis process multiple optimizations are performed, each using a different
set of input assumptions. A sensitivity analysis reveals how sensitive the outputs are to changes
in the inputs.
In a sensitivity analysis, a range of values for a single input variable are fed to HOMER. A
variable for which the user has entered multiple values is called a sensitivity variable. Almost
every numerical input variable that is not a decision variable can be a sensitivity variable.
Examples include the PV module price, the fuel price, etc.
A sensitivity analysis can be performed with any number of sensitivity variables. Each
combination of sensitivity variable values defines a distinct sensitivity case. A separate
optimization process for each sensitivity case is performed and the results are presented in
various tabular and graphic formats.
One of the primary uses of sensitivity analysis is in dealing with uncertainty. If a system designer
is unsure of the value of a particular variable, he/she can enter several values covering the likely
range and see how the results vary across that range. But sensitivity analysis has applications
beyond coping with uncertainty. A system designer can use also sensitivity analysis to evaluate
trade-offs between different options.
5.1.4 Hybrid System Modeling
In this section how HOMER models the physical operation of a system is provided in greater
detail. A power system must comprise at least one source of electrical or thermal energy (such as
a wind turbine, a diesel generator, or the grid), and at least one destination for that energy
(electrical or thermal load). It may also comprise conversion devices such as a dc-ac converter or
an electrolyzer, and energy storage devices such as a battery bank or a hydrogen storage tank.
The following subsections devoted to how to model the loads that the system must serve, the
components of the system and their associated resources, and how that collection of components
operates together to serve the loads.
Simulation and Optimization of Wind Turbine, Solar PV, Storage Battery and Diesel Generator Hybrid Power System for a Cluster of Micro and Small Enterprises Working on Wood and Metal Products at Welenchity Site
43 MSc Thesis, AAiT-Energy Center, By Terefe Jima, 2013
5.1.4.1 Electric Loads
The electric loads are usually the largest single influence on the size and cost of hybrid
system components. So, deciding on the loads is one of the most important steps in the
design of the hybrid system.
The term loads refers to a demand for electric or thermal energy, if any. Three types of
loads can be modeled using HOMER: primary load which is electric demand that must be
served according to a particular schedule, deferrable load which is electric demand that
can be served at certain period of time, the exact timing is not important and thermal load
which is demand for heat.
Primary Load: Primary load is electrical demand that the power system must meet at a
specific time. Electrical demand associated with lights, radio, TV, household appliances,
computers, and industrial processes is typically modeled as primary load. If electrical
demand exceeds supply, there is a deficit that is recorded as unmet load.
The user specifies an amount of primary load in kW for each hour of the year, either by
importing a file containing hourly data or by allowing HOMER to synthesize hourly data
from average daily load profiles. When synthesizing load data, HOMER creates hourly
load values based on user-specified daily load profiles. Different profiles for different
months and different profiles for weekdays and weekends are specified. A specified
amount of randomness can be added to synthesize load data so that every day’s load
pattern is unique. In this thesis 5% hourly and daily load noise is defined to account for
variability of load demand.
Among the three types of loads, primary load receives special treatment in that it requires
a user-specified amount of operating reserve [HOMER, ver. 2.68 Beta].
Deferrable Load: Deferrable load is electrical demand that can be met anytime within a
certain time span, which exact timing is not important. Water pumping and battery-
charging are examples of deferrable loads because the storage inherent to each of those
loads allows some flexibility as to when the system can serve them. The ability to defer
serving a load is often advantageous for systems comprising intermittent renewable
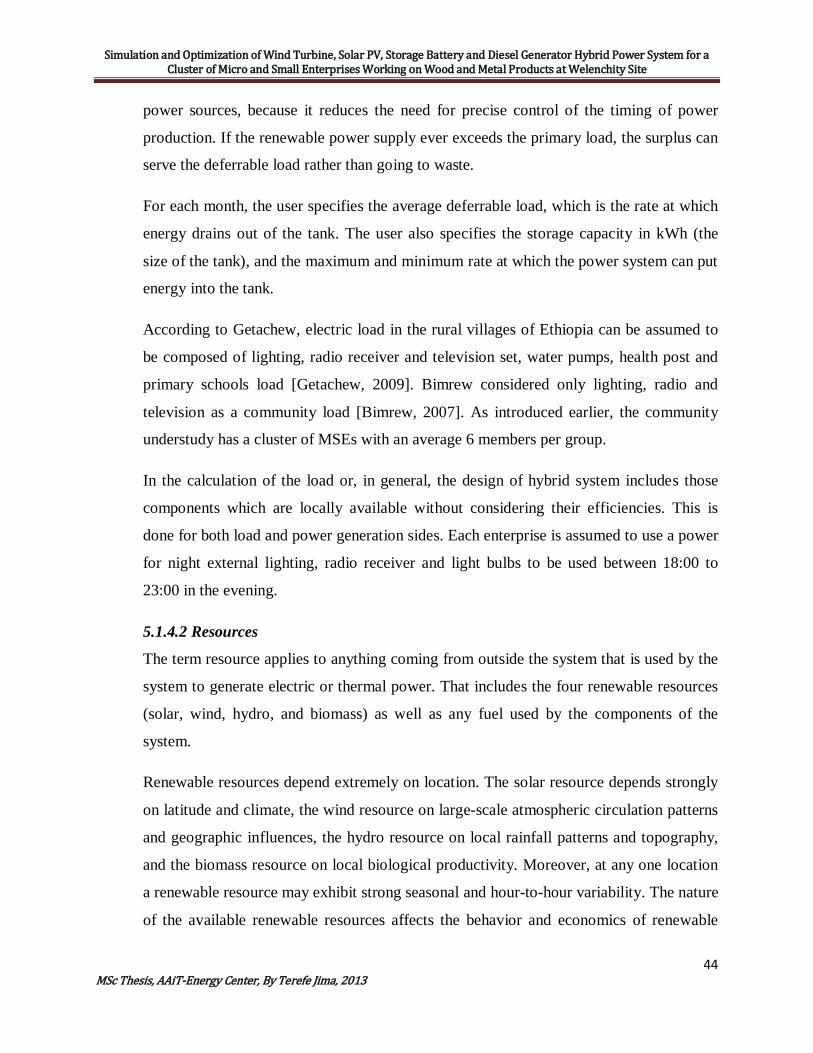
Simulation and Optimization of Wind Turbine, Solar PV, Storage Battery and Diesel Generator Hybrid Power System for a Cluster of Micro and Small Enterprises Working on Wood and Metal Products at Welenchity Site
44 MSc Thesis, AAiT-Energy Center, By Terefe Jima, 2013
power sources, because it reduces the need for precise control of the timing of power
production. If the renewable power supply ever exceeds the primary load, the surplus can
serve the deferrable load rather than going to waste.
For each month, the user specifies the average deferrable load, which is the rate at which
energy drains out of the tank. The user also specifies the storage capacity in kWh (the
size of the tank), and the maximum and minimum rate at which the power system can put
energy into the tank.
According to Getachew, electric load in the rural villages of Ethiopia can be assumed to
be composed of lighting, radio receiver and television set, water pumps, health post and
primary schools load [Getachew, 2009]. Bimrew considered only lighting, radio and
television as a community load [Bimrew, 2007]. As introduced earlier, the community
understudy has a cluster of MSEs with an average 6 members per group.
In the calculation of the load or, in general, the design of hybrid system includes those
components which are locally available without considering their efficiencies. This is
done for both load and power generation sides. Each enterprise is assumed to use a power
for night external lighting, radio receiver and light bulbs to be used between 18:00 to
23:00 in the evening.
5.1.4.2 Resources
The term resource applies to anything coming from outside the system that is used by the
system to generate electric or thermal power. That includes the four renewable resources
(solar, wind, hydro, and biomass) as well as any fuel used by the components of the
system.
Renewable resources depend extremely on location. The solar resource depends strongly
on latitude and climate, the wind resource on large-scale atmospheric circulation patterns
and geographic influences, the hydro resource on local rainfall patterns and topography,
and the biomass resource on local biological productivity. Moreover, at any one location
a renewable resource may exhibit strong seasonal and hour-to-hour variability. The nature
of the available renewable resources affects the behavior and economics of renewable
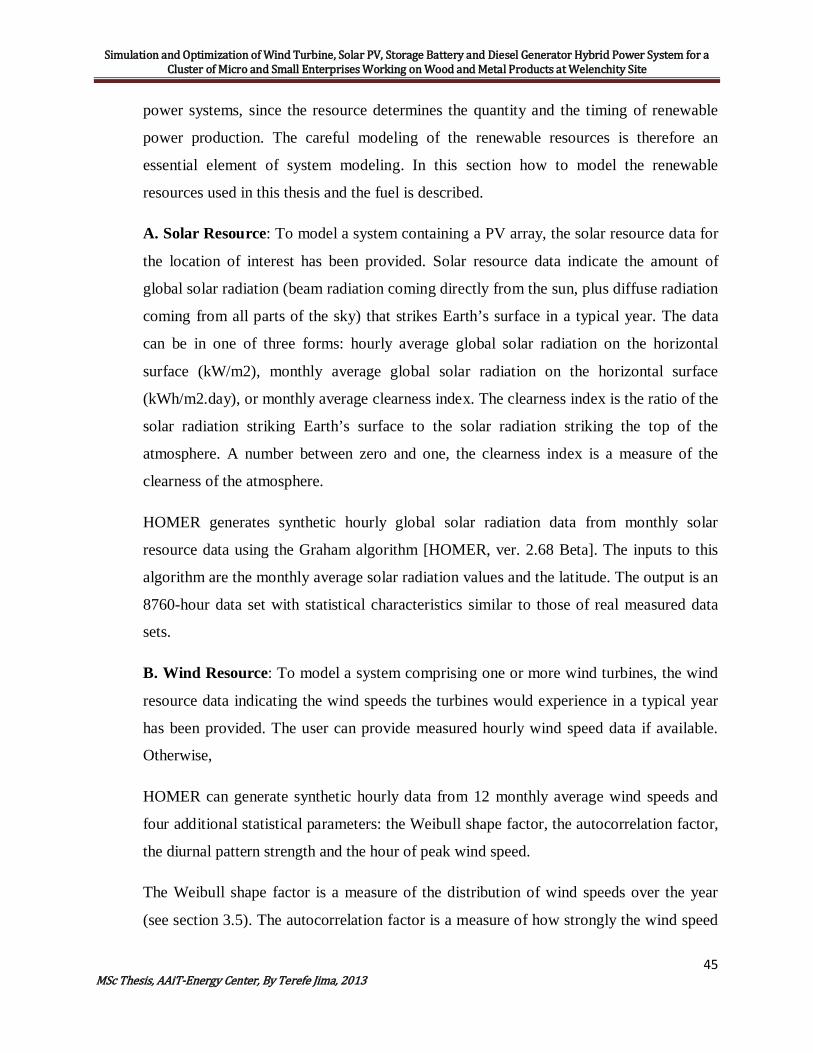
Simulation and Optimization of Wind Turbine, Solar PV, Storage Battery and Diesel Generator Hybrid Power System for a Cluster of Micro and Small Enterprises Working on Wood and Metal Products at Welenchity Site
45 MSc Thesis, AAiT-Energy Center, By Terefe Jima, 2013
power systems, since the resource determines the quantity and the timing of renewable
power production. The careful modeling of the renewable resources is therefore an
essential element of system modeling. In this section how to model the renewable
resources used in this thesis and the fuel is described.
A. Solar Resource: To model a system containing a PV array, the solar resource data for
the location of interest has been provided. Solar resource data indicate the amount of
global solar radiation (beam radiation coming directly from the sun, plus diffuse radiation
coming from all parts of the sky) that strikes Earth’s surface in a typical year. The data
can be in one of three forms: hourly average global solar radiation on the horizontal
surface (kW/m2), monthly average global solar radiation on the horizontal surface
(kWh/m2.day), or monthly average clearness index. The clearness index is the ratio of the
solar radiation striking Earth’s surface to the solar radiation striking the top of the
atmosphere. A number between zero and one, the clearness index is a measure of the
clearness of the atmosphere.
HOMER generates synthetic hourly global solar radiation data from monthly solar
resource data using the Graham algorithm [HOMER, ver. 2.68 Beta]. The inputs to this
algorithm are the monthly average solar radiation values and the latitude. The output is an
8760-hour data set with statistical characteristics similar to those of real measured data
sets.
B. Wind Resource: To model a system comprising one or more wind turbines, the wind
resource data indicating the wind speeds the turbines would experience in a typical year
has been provided. The user can provide measured hourly wind speed data if available.
Otherwise,
HOMER can generate synthetic hourly data from 12 monthly average wind speeds and
four additional statistical parameters: the Weibull shape factor, the autocorrelation factor,
the diurnal pattern strength and the hour of peak wind speed.
The Weibull shape factor is a measure of the distribution of wind speeds over the year
(see section 3.5). The autocorrelation factor is a measure of how strongly the wind speed

Simulation and Optimization of Wind Turbine, Solar PV, Storage Battery and Diesel Generator Hybrid Power System for a Cluster of Micro and Small Enterprises Working on Wood and Metal Products at Welenchity Site
46 MSc Thesis, AAiT-Energy Center, By Terefe Jima, 2013
in one hour tends to depend on the wind speed in the preceding hour [HOMER, ver. 2.68
Beta]. For complex topography the autocorrelation factor is (0.70 -0.80) while for a
uniform topography the range is higher, (0.90 -0.97). A typical range for the
autocorrelation factor is 0.8 – 0.95 [HOMER, ver. 2.68 Beta]. An average value of 0.85 is
used here because the selected areas are of averagely uniform topography. The diurnal
pattern strength is a measure of how strongly the wind speed tends to depend on the time
of day [HOMER, ver. 2.68 Beta]. Typical values for diurnal pattern strength range from 0
to 0.4. A value of 0.25 has been selected for calculations.
The hour of peak wind speed is the hour of the day that tends, on average, to be the
windiest throughout the year. The typical range for the time of peak wind speed is 14:00-
16:00 [HOMER ver. 2.68 Beta]. This has also been observed in the available raw data for
some of the months. In addition to this, the software has been run for different times
between 14:00 and 18:00, the results have been checked against the measured data and
the time of 15:00 has been chosen for the calculations.
The anemometer height, which is the height above ground at which the wind speed data
were measured, has been defined. The elevation of the site above sea level, which is used
to calculate the air density, is also defined.
5.1.4.3 Components /Equipments considered in HOMER Software
A component is any part of a power system that either generates, delivers, converts, or
stores energy. HOMER models 10 types of components. Three of components generate
electricity from intermittent renewable sources: photovoltaic modules, wind turbines, and
hydro turbines. Another two types of components, generators and the grid are
dispatchable energy sources, meaning that the system can control them as needed. Two
types of components, converters and electrolyzers, convert electrical energy into another
form. Converters convert electricity from ac to dc or from dc to ac. Electrolyzers convert
surplus ac or dc electricity into hydrogen via the electrolysis of water. Other component a
reformer generates hydrogen by reforming a hydrocarbon, typically natural gas. The
system can store the hydrogen produced by electrolyzer and reformer and use it as fuel

Simulation and Optimization of Wind Turbine, Solar PV, Storage Battery and Diesel Generator Hybrid Power System for a Cluster of Micro and Small Enterprises Working on Wood and Metal Products at Welenchity Site
47 MSc Thesis, AAiT-Energy Center, By Terefe Jima, 2013
for one or more generators. Finally, two types of components store energy: batteries and
hydrogen storage tanks.
Cost minimization is the primary criterion considered when selecting the components. .
One of the main criteria for the selection of the wind turbine is the cost. The wind
turbines have been selected from different sources; the various wind turbine websites
To describe the cost of the PV array, its initial capital cost in dollars, replacement cost in
dollars, and operating and maintenance (O&M) cost in dollars per year has been
specified. The replacement cost is the cost of replacing the PV array at the end of its
useful lifetime, which is specified in years. By default, the replacement cost is equal to
the capital cost, but the two can differ for several reasons. For example the user may want
to account for a reduction over time in the purchase cost of a particular technology.
A. Wind Turbine: A wind turbine is a device that converts the kinetic energy of the
wind into ac or dc electricity according to a particular power curve, which is a graph
of power output versus wind speed at hub height.
Each hour, the power output of the wind turbine is calculated in a four-step process. First,
the average wind speed for the hour at the anemometer height is determined by referring
to the wind resource data. Second, the corresponding wind speed at the turbine’s hub
height is calculated using either the logarithmic law or power law. Third, the power
output of wind turbine is calculated at that wind speed referring to its power curve
assuming standard air density. Fourth, that power output value is multiplied by the air
density ratio, which is the ratio of the actual air density to the standard air density.
In addition to the turbine’s power curve and hub height, the expected lifetime of the
turbine in years, its initial capital cost in dollars, its replacement cost in dollars, and its
annual O&M cost in dollars per year has been specified.
In case of wind turbine some of selection criteria used is: the type of current they generate
(AC or DC), how low the cut-in wind speed is, how expensive the wind turbine is and for
what application the wind turbine be used for. The cut-in wind speed is one of the main
criteria, as the wind resource at the sites is not very high. As the turbine price would also

Simulation and Optimization of Wind Turbine, Solar PV, Storage Battery and Diesel Generator Hybrid Power System for a Cluster of Micro and Small Enterprises Working on Wood and Metal Products at Welenchity Site
48 MSc Thesis, AAiT-Energy Center, By Terefe Jima, 2013
affect the total net present cost, this has been checked with the respective vendors the
type of current they generate, whether AC or DC, is also considered as this would have
effect on the size of the inverter. A wind turbine that generates AC current has been
chosen, as the load assumed for the households is of an AC type. As the aim of the
research is to supply electric energy to remotely located communities, the wind turbines
selected should be those which are applicable for home or off-grid use.
Based on the selection criteria mentioned above, different wind turbines have been tested
by running the simulation several times. From those wind turbines which were candidates
for this application, the Generic 3kw type has been found to be the best in terms of the
cut-in wind speed and also in respect to other criteria mentioned earlier. This wind
turbine was selected from those suggested by HOMER.
B. Generators: A generator consumes fuel to produce electricity, and possibly heat as a
by-product. The generator module is flexible enough to model a wide variety of
generators, including internal combustion engine generators, micro-turbines, fuel cells,
etc.
The principal physical properties of the generator are its maximum and minimum
electrical power output, its expected lifetime in operating hours, the type of fuel it
consumes, and its fuel curve, which relates the quantity of fuel consumed to the electrical
power produced.
C. Battery Bank: The battery bank is a collection of one or more individual batteries. A
battery is a device capable of storing a certain amount of DC electricity at fixed round-
trip energy efficiency, with limits as to how quickly it can be charged or discharged, how
deeply it can be discharged without causing damage, and how much energy can cycle
through it before it needs replacement.
The key physical properties of the battery are its nominal voltage, capacity curve, lifetime
curve, minimum state of charge, and round-trip efficiency. The capacity curve shows the
discharge capacity of the battery in ampere-hours versus the discharge current in
amperes.

Simulation and Optimization of Wind Turbine, Solar PV, Storage Battery and Diesel Generator Hybrid Power System for a Cluster of Micro and Small Enterprises Working on Wood and Metal Products at Welenchity Site
49 MSc Thesis, AAiT-Energy Center, By Terefe Jima, 2013
Manufacturers determine each point on this curve by measuring the ampere-hours that
can be discharged at a constant current out of a fully charged battery. Capacity typically
decreases with increasing discharge current. The lifetime curve shows the number of
discharge–charge cycles the battery can withstand versus the cycle depth. The number of
cycles to failure typically decreases with increasing cycle depth. The minimum state of
charge is the state of charge below which the battery must not be discharged to avoid
permanent damage. The round-trip efficiency indicates the percentage of the energy
going into the battery that can be drawn back out.
To calculate the battery’s maximum allowable rate of charge or discharge, the kinetic
battery model is used, which treats the battery as a two-tank system [HOMER, ver. 2.68
Beta].
Three parameters describe the battery: The maximum capacity of the battery which is the
combined size of the available and bound tanks; the capacity ratio which is the ratio of
the size of the available tank to the combined size of the two tanks and the rate constant
which is analogous to the size of the pipe between the tanks. It is assumed that lifetime
throughput is independent of cycle depth and estimate the life of the battery bank simply
by monitoring the amount of energy cycling through it [HOMER, ver. 2.68 Beta].
D. Converter: A converter is a device that converts electric power from dc to ac in a
process called inversion, and/or from ac to dc in a process called rectification. The
converter size, which is a decision variable, refers to the inverter capacity, meaning the
maximum amount of ac power that the device can produce by inverting dc power. The
rectifier capacity, which is the maximum amount of dc power that the device can produce
by rectifying ac power, as a percentage of the inverter capacity has been specified.
The final physical properties of the converter are its inversion and rectification
efficiencies, which are assumed to be constant. The economic properties of the converter
are its capital and replacement cost in dollars, its annual O&M cost in dollars per year,
and its expected lifetime in years.

Simulation and Optimization of Wind Turbine, Solar PV, Storage Battery and Diesel Generator Hybrid Power System for a Cluster of Micro and Small Enterprises Working on Wood and Metal Products at Welenchity Site
50 MSc Thesis, AAiT-Energy Center, By Terefe Jima, 2013
Additional information input into HOMER is summarized in Table 6.2. The values given
in this table are primarily chosen according to the size of the load for the assumed
hypothetical enterprises. The monthly average daily electrical energy consumption is
given in Table 6.1. As mentioned previously the components are chosen by considering
the local availability of the components without giving attention to their efficiencies.
The costs are estimated according to the current local and global price of the components.
Other inputs into the software, such as the range of sizes for the PV, wind turbines and
the converter and the number of batteries, are given so as to give flexibility to the
software and optimize the output results.
Table 5.1: Inputs to the HOMER software
PV Wind
Turbine
Diesel
Generator
Battery Converter
Size(kW) 12 kW 12 Generic
3kW 20kW 32 Surrette
6CS25P
20 kW
Capital($) 30000 72000 18000 28800 16000
O&M cost($/yr) 0 100 0.5 20 0
Size considered
(kW)
1 1 1 1 1
Quantities
considered
0,3,6,9,12 0,1,3,6,9,12 0,5,10,15,20,25 0,1,4,8,16,24,32
0,10,15,20
Life time 25yrs 25yrs 20000hrs 308646 hrs 15yrs
For the analysis, diesel is considered for the generator fuels with prices used are 1, 1.1, 1.2 and
1.3 US dollars per liter. The current diesel price considered is 1.1 USD per liter. Inverter and
rectifier efficiencies are assumed as 90%. The project life time is 25 years, and the interest rate is
assumed to be the present rate, 6%.

Simulation and Optimization of Wind Turbine, Solar PV, Storage Battery and Diesel Generator Hybrid Power System for a Cluster of Micro and Small Enterprises Working on Wood and Metal Products at Welenchity Site
51 MSc Thesis, AAiT-Energy Center, By Terefe Jima, 2013
The software generates the results which are a list of feasible power supply system sorted
according to their net present cost. Furthermore, sensitivity variables, such as the range of wind
speeds, solar radiation, PV panel price, and diesel price are supplied, and then the software is
tuned for optimum results.
5.2 Simulation Approach
The system simulation is performed by considering the system reliability as 100%, so no
interruption is assumed during operation of the system.
The developed optimization software enables to change the variables of the hybrid system model
in terms of sizing and operation. In such a way the life cycle cost of the hybrid systems
respecting the demand requirements are minimized.
In this approach the renewable energy sources (wind & PV) plus the energy stored in the battery
are used to cover the demand. The diesel generator is switched on as a back-up source when the
battery is discharged to a certain level. For each hour step the simulation program compares the
required energy demand and the supplied energy, and according to the difference a decision to
operate the diesel generator or to charge the battery or discharge it will be taken.
The following cases will be considered with the illustrated priority while developing the
simulation software:
Case1: Sufficient generated energy by renewable sources (wind & PV).The use of this energy to
supply load has priority over using batteries or diesel generator. The extra energy is used to
charge batteries, figure 6.1.
Case 2: As case 1 but surplus energy is generated by the system greater than the need to supply
the load and the batteries. In this case the surplus energy is consumed by the dump load, figure
6.2.
Case 3: The generated energy by the renewable sources is not sufficient to supply the load. The
priority here is to use the stored energy in the batteries in addition to the generated energy by the
renewable sources rather than operating the diesel generator, figure 6.3.

Simulation and Optimization of Wind Turbine, Solar PV, Storage Battery and Diesel Generator Hybrid Power System for a Cluster of Micro and Small Enterprises Working on Wood and Metal Products at Welenchity Site
52 MSc Thesis, AAiT-Energy Center, By Terefe Jima, 2013
Case 4: The generated energy by the renewable sources is not sufficient to cover the load
demands and the battery is also discharged to its minimum value. In this case the diesel generator
is switched on, and in addition to the generated energy by the renewable sources, it supplies the
load and charge the batteries. The hybrid systems still in this mode of operation until the
batteries are recharged to their full capacity, figure 6.4.
Figure 5.2: Sufficient energy to supply load & charge batteries case.
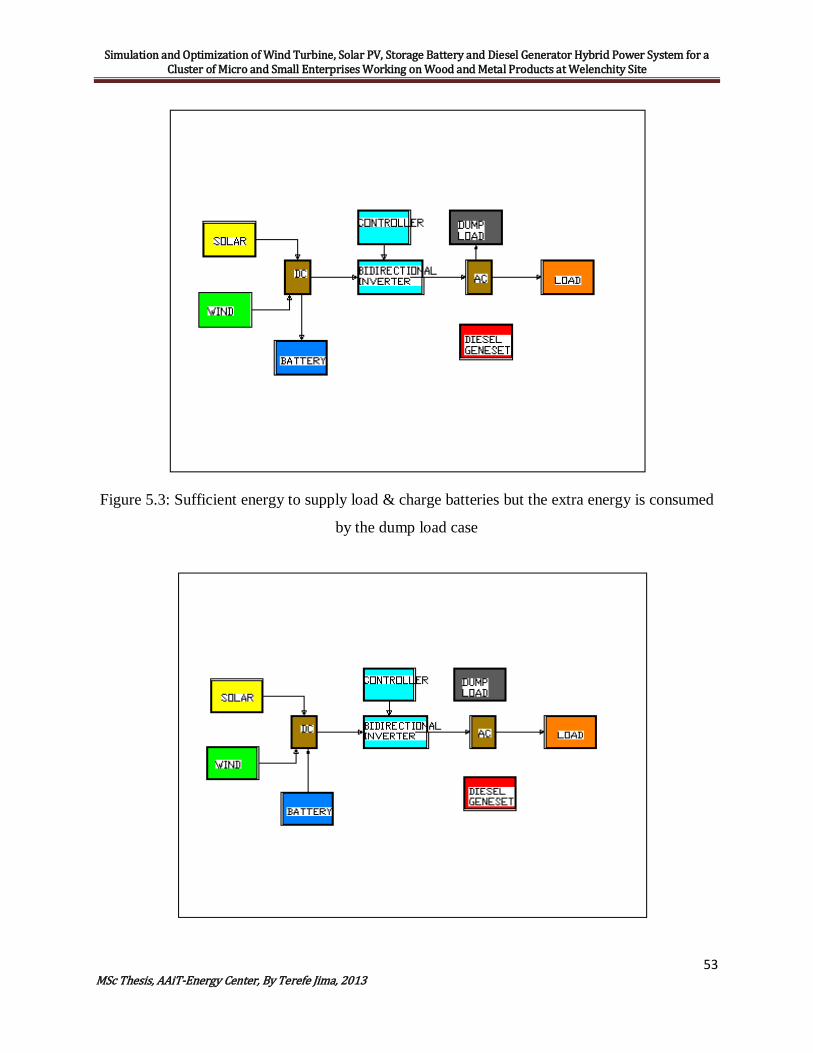
Simulation and Optimization of Wind Turbine, Solar PV, Storage Battery and Diesel Generator Hybrid Power System for a Cluster of Micro and Small Enterprises Working on Wood and Metal Products at Welenchity Site
53 MSc Thesis, AAiT-Energy Center, By Terefe Jima, 2013
Figure 5.3: Sufficient energy to supply load & charge batteries but the extra energy is consumed
by the dump load case
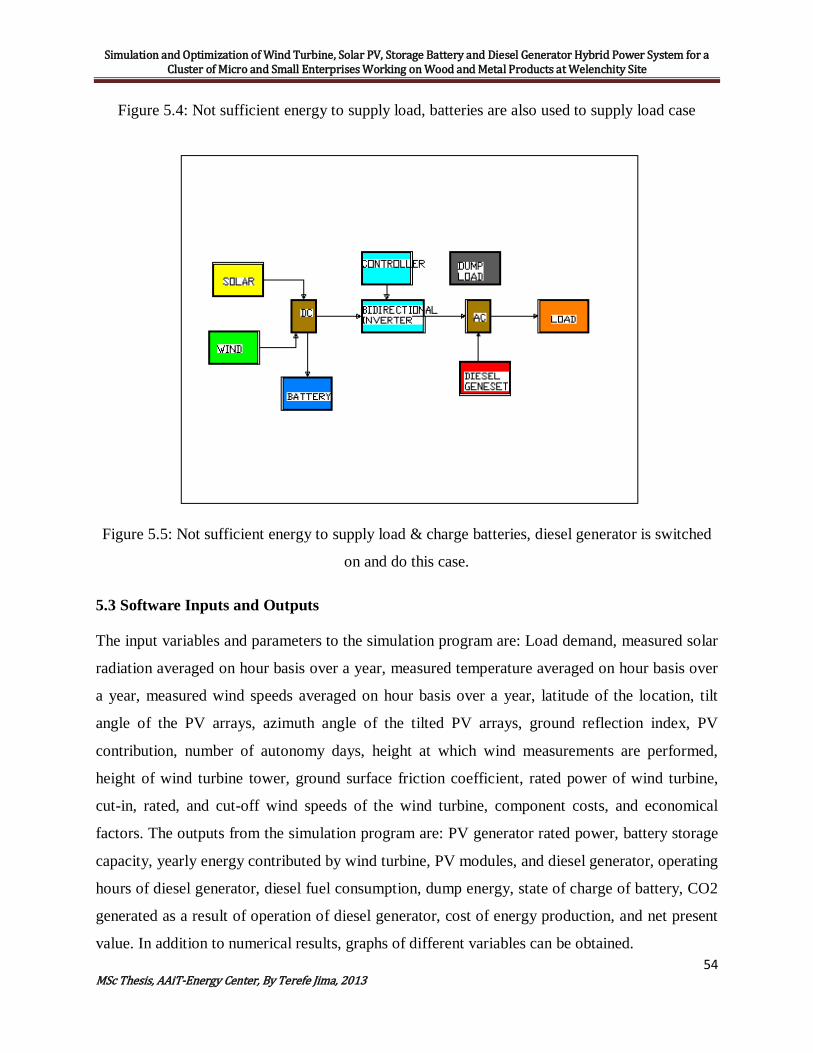
Simulation and Optimization of Wind Turbine, Solar PV, Storage Battery and Diesel Generator Hybrid Power System for a Cluster of Micro and Small Enterprises Working on Wood and Metal Products at Welenchity Site
54 MSc Thesis, AAiT-Energy Center, By Terefe Jima, 2013
Figure 5.4: Not sufficient energy to supply load, batteries are also used to supply load case
Figure 5.5: Not sufficient energy to supply load & charge batteries, diesel generator is switched
on and do this case.
5.3 Software Inputs and Outputs
The input variables and parameters to the simulation program are: Load demand, measured solar
radiation averaged on hour basis over a year, measured temperature averaged on hour basis over
a year, measured wind speeds averaged on hour basis over a year, latitude of the location, tilt
angle of the PV arrays, azimuth angle of the tilted PV arrays, ground reflection index, PV
contribution, number of autonomy days, height at which wind measurements are performed,
height of wind turbine tower, ground surface friction coefficient, rated power of wind turbine,
cut-in, rated, and cut-off wind speeds of the wind turbine, component costs, and economical
factors. The outputs from the simulation program are: PV generator rated power, battery storage
capacity, yearly energy contributed by wind turbine, PV modules, and diesel generator, operating
hours of diesel generator, diesel fuel consumption, dump energy, state of charge of battery, CO2
generated as a result of operation of diesel generator, cost of energy production, and net present
value. In addition to numerical results, graphs of different variables can be obtained.

Simulation and Optimization of Wind Turbine, Solar PV, Storage Battery and Diesel Generator Hybrid Power System for a Cluster of Micro and Small Enterprises Working on Wood and Metal Products at Welenchity Site
55 MSc Thesis, AAiT-Energy Center, By Terefe Jima, 2013
Wind speeds input to the program shall be corrected to take into account the height of the wind
turbine tower. In addition to this, solar radiation input to the simulation program is measured on
a horizontal plane and shall be corrected to take into account the tilted and azimuth angles of the
tilted modules. Simulation program shall do that.

Simulation and Optimization of Wind Turbine, Solar PV, Storage Battery and Diesel Generator Hybrid Power System for a Cluster of Micro and Small Enterprises Working on Wood and Metal Products at Welenchity Site
56 MSc Thesis, AAiT-Energy Center, By Terefe Jima, 2013
CHAPTER SIX
RESULTS AND DISCUSSION
In this chapter the results of the design of a PV-wind hybrid power generation system is
presented, discussion about the findings will done and at the end decision for selecting the best
scenario among the simulation results shall be made. The design of hybrid system, which
supplies electricity to model for a cluster of MSEs, was introduced previously. As mentioned in
the earlier sections in the design the system components that are locally available have been
included without much concern to the efficiency. The results of the investigation will be
presented in the following paragraphs.
6.1 Optimization results
The monthly average wind speed of the site together with other related data, such as values of
Weibull parameter k, diurnal pattern, autocorrelation, etc, was fed into HOMER.
Similarly, the solar energy potential of the site was fed into HOMER and this is depicted in
Figure 5.2. This figure also shows the clearness index, the ratio of the solar radiation striking
Earth’s surface to the solar radiation striking the top of the atmosphere, which HOMER
generated from global solar radiation for the analysis. Typical values for the monthly average
clearness index range from 0.25 (a very cloudy month) to 0.75 (a very sunny month).
Figure 6.1: Monthly average solar resources
0.0
0.2
0.4
0.6
0.8
1.0
Jan Feb Mar Apr May Jun Jul Aug Sep Oct Nov Dec0
1
2
3
4
5
6
7
Dai
ly R
adia
tion
(kW
h/m
²/d)
Global Horizontal Radiation
Cle
arne
ss In
dex
Daily Radiation Clearness Index
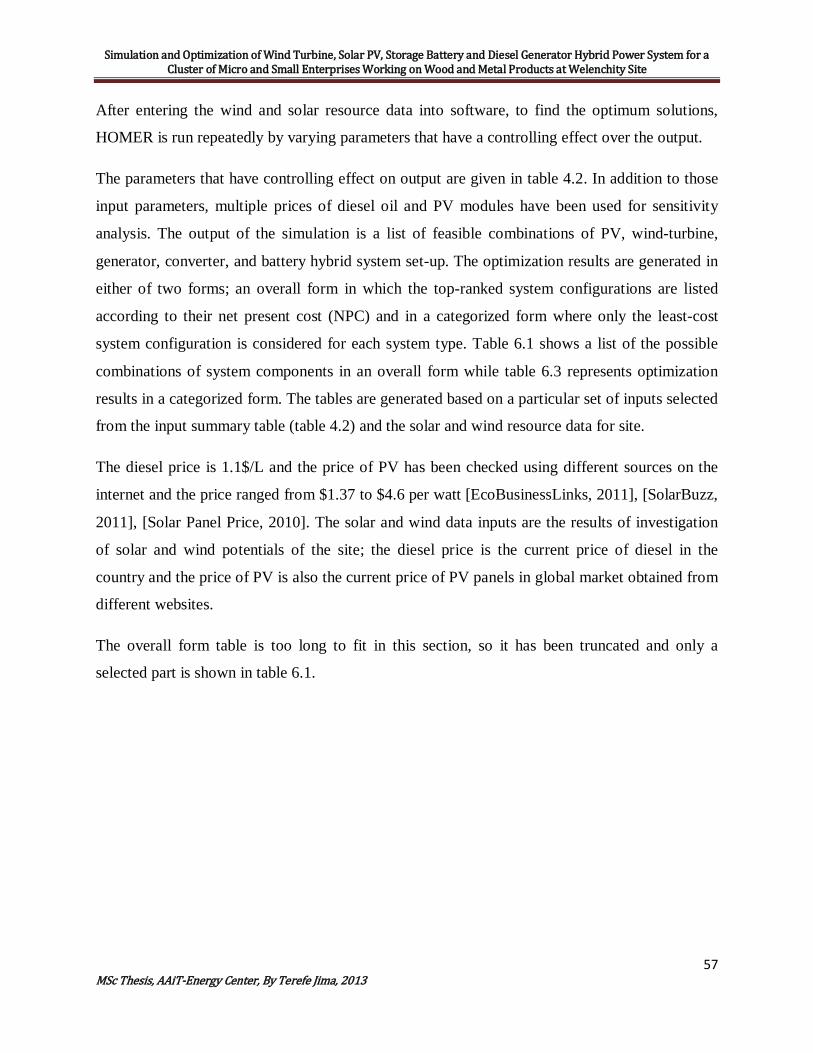
Simulation and Optimization of Wind Turbine, Solar PV, Storage Battery and Diesel Generator Hybrid Power System for a Cluster of Micro and Small Enterprises Working on Wood and Metal Products at Welenchity Site
57 MSc Thesis, AAiT-Energy Center, By Terefe Jima, 2013
After entering the wind and solar resource data into software, to find the optimum solutions,
HOMER is run repeatedly by varying parameters that have a controlling effect over the output.
The parameters that have controlling effect on output are given in table 4.2. In addition to those
input parameters, multiple prices of diesel oil and PV modules have been used for sensitivity
analysis. The output of the simulation is a list of feasible combinations of PV, wind-turbine,
generator, converter, and battery hybrid system set-up. The optimization results are generated in
either of two forms; an overall form in which the top-ranked system configurations are listed
according to their net present cost (NPC) and in a categorized form where only the least-cost
system configuration is considered for each system type. Table 6.1 shows a list of the possible
combinations of system components in an overall form while table 6.3 represents optimization
results in a categorized form. The tables are generated based on a particular set of inputs selected
from the input summary table (table 4.2) and the solar and wind resource data for site.
The diesel price is 1.1$/L and the price of PV has been checked using different sources on the
internet and the price ranged from $1.37 to $4.6 per watt [EcoBusinessLinks, 2011], [SolarBuzz,
2011], [Solar Panel Price, 2010]. The solar and wind data inputs are the results of investigation
of solar and wind potentials of the site; the diesel price is the current price of diesel in the
country and the price of PV is also the current price of PV panels in global market obtained from
different websites.
The overall form table is too long to fit in this section, so it has been truncated and only a
selected part is shown in table 6.1.
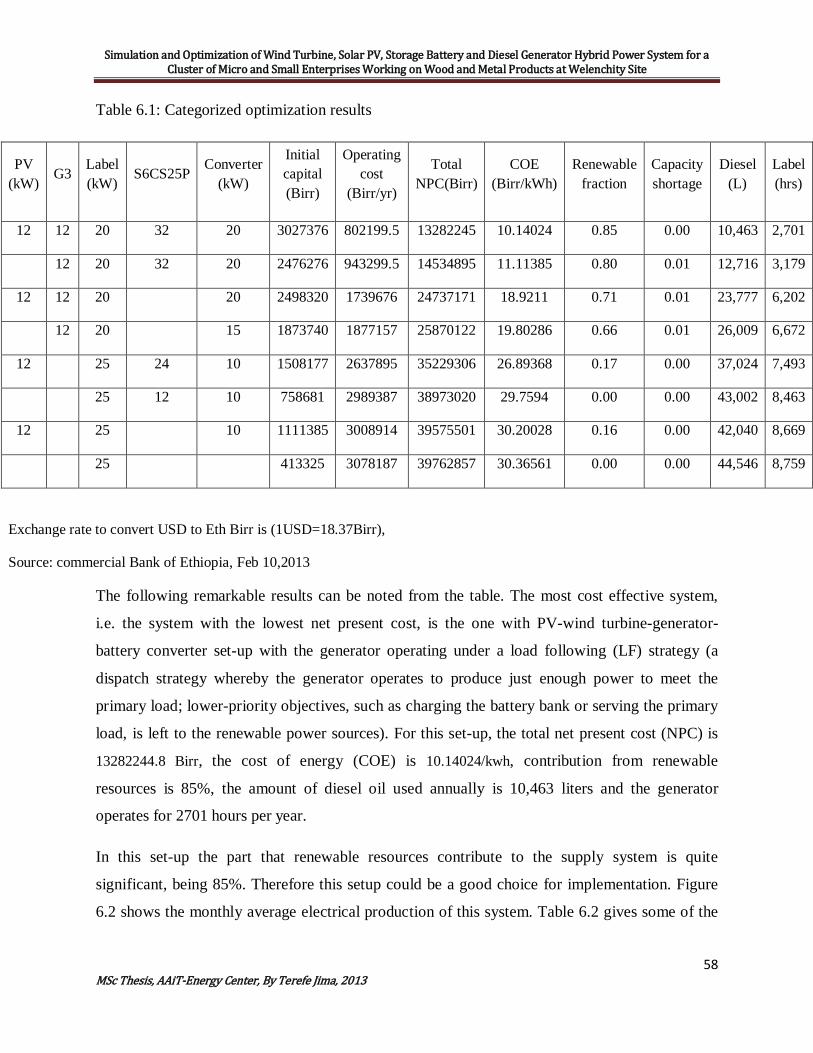
Simulation and Optimization of Wind Turbine, Solar PV, Storage Battery and Diesel Generator Hybrid Power System for a Cluster of Micro and Small Enterprises Working on Wood and Metal Products at Welenchity Site
58 MSc Thesis, AAiT-Energy Center, By Terefe Jima, 2013
Table 6.1: Categorized optimization results
PV (kW)
G3 Label (kW)
S6CS25P Converter (kW)
Initial capital (Birr)
Operating cost
(Birr/yr)
Total NPC(Birr)
COE (Birr/kWh)
Renewable fraction
Capacity shortage
Diesel (L)
Label (hrs)
12 12 20 32 20 3027376 802199.5 13282245 10.14024 0.85 0.00 10,463 2,701
12 20 32 20 2476276 943299.5 14534895 11.11385 0.80 0.01 12,716 3,179
12 12 20 20 2498320 1739676 24737171 18.9211 0.71 0.01 23,777 6,202
12 20 15 1873740 1877157 25870122 19.80286 0.66 0.01 26,009 6,672
12 25 24 10 1508177 2637895 35229306 26.89368 0.17 0.00 37,024 7,493
25 12 10 758681 2989387 38973020 29.7594 0.00 0.00 43,002 8,463
12 25 10 1111385 3008914 39575501 30.20028 0.16 0.00 42,040 8,669
25 413325 3078187 39762857 30.36561 0.00 0.00 44,546 8,759
Exchange rate to convert USD to Eth Birr is (1USD=18.37Birr),
Source: commercial Bank of Ethiopia, Feb 10,2013
The following remarkable results can be noted from the table. The most cost effective system,
i.e. the system with the lowest net present cost, is the one with PV-wind turbine-generator-
battery converter set-up with the generator operating under a load following (LF) strategy (a
dispatch strategy whereby the generator operates to produce just enough power to meet the
primary load; lower-priority objectives, such as charging the battery bank or serving the primary
load, is left to the renewable power sources). For this set-up, the total net present cost (NPC) is
13282244.8 Birr, the cost of energy (COE) is 10.14024/kwh, contribution from renewable
resources is 85%, the amount of diesel oil used annually is 10,463 liters and the generator
operates for 2701 hours per year.
In this set-up the part that renewable resources contribute to the supply system is quite
significant, being 85%. Therefore this setup could be a good choice for implementation. Figure
6.2 shows the monthly average electrical production of this system. Table 6.2 gives some of the

Simulation and Optimization of Wind Turbine, Solar PV, Storage Battery and Diesel Generator Hybrid Power System for a Cluster of Micro and Small Enterprises Working on Wood and Metal Products at Welenchity Site
59 MSc Thesis, AAiT-Energy Center, By Terefe Jima, 2013
main information about the system and the corresponding sizes and quantities of each component
shall be indicated accordingly.
Figure 6.2: Monthly Average Electric Production of the selected hybrid system
Table 6:2 System report for the 91 % renewable resource contribution
System
architecture
Sensitivity case
Annual Electric
Production(kwh/yr)
Annual Electric
consumption (kWh/yr)
Emissions
PV Array
12 kW
PV Array
18,199
11% AC
primary
load 101,804 100% Carbon
dioxide 27,553
Wind
turbine
12 Generic 3kW
Wind
turbine 119,775 74% Coast summary Carbon
monoxide 68
Gen1
20 kW
Solar
data-
average
5.13 Gen1 24,566 15% Total net
present cost 13282244.8
Birr Unburned hydrocarbons 7.53
Battery 32 Surrette 6CS25P
Wind
data
average
7.275 Total 162,540 100% Levelized
cost of
energy
10.14024/kwh Particulate matter 5.13
Converter 20 kW Diesel $1.1 Excess 46,233 kWh/yr Operating 802199.53/yr Sulfur dioxide 55.3

Simulation and Optimization of Wind Turbine, Solar PV, Storage Battery and Diesel Generator Hybrid Power System for a Cluster of Micro and Small Enterprises Working on Wood and Metal Products at Welenchity Site
60 MSc Thesis, AAiT-Energy Center, By Terefe Jima, 2013
price- Electricity Cost
Inverter 20kw
Unmet
load 135 kWh/yr
Nitrogen oxides
607
Rectifier 20kw Capacity
shortage 508 kWh/yr
Dispatch
strategy
Load
Following
Renewable
fraction 0.849
Exchange rate to convert USD to Eth Birr is (1USD=18.37Birr),
Source: commercial Bank Of Ethiopia, Feb 10,2013
Table 6.3: Net Present Costs
Component Capital (Birr)
Replacement (Birr)
O&M (Birr) Fuel (Birr) Salvage (Birr)
Total (Birr)
PV 551100 0 0 0 0 551100
Generic 3kW 1322640 0 281795.8 0 0 1604436
Generator 1 330660 444921.4 6342775 2702741.4 -48055.9 9773024
Surrette 6CS25P 529056 393595.6 150285 0 -112994 959942.7
Converter 293920 122638.1 0 0 -22833.9 393742.6
System 3027376 961155.1 6774856 2702741.4 -183884 13282245

Simulation and Optimization of Wind Turbine, Solar PV, Storage Battery and Diesel Generator Hybrid Power System for a Cluster of Micro and Small Enterprises Working on Wood and Metal Products at Welenchity Site
61 MSc Thesis, AAiT-Energy Center, By Terefe Jima, 2013
Figure 6.3: Cash flow summary of the selected hybrid system
The second most cost effective system which comprises Wind-Gen-Battery-Converter set-up is
the system in the 2rd row. For this set-up the contribution made by renewable resources is 80 %,
which is less than the earlier set-up by 5 %. Nonetheless, the NPC has increased to $ 791,230
and the COE to 0.605 $/kWh. This could also be a good choice if there is a motive for utilizing
the available wind energy, which would, however, be at the cost of a 26.3 % increase in the total
NPC. Once again the monthly average electric production for this set-up is shown in figure 21
and table 6.4 gives the most important information about this set-up.
Figure 6.4: Monthly Average Electric Production of this setup
Simulation and Optimization of Wind Turbine, Solar PV, Storage Battery and Diesel Generator Hybrid Power System for a Cluster of Micro and Small Enterprises Working on Wood and Metal Products at Welenchity Site
62 MSc Thesis, AAiT-Energy Center, By Terefe Jima, 2013
In general we can see in the list numerous feasible setups with different levels of penetration into
the renewable resources; the selection, however, depends on whether the initial cost is the
principal concern or the benefits gained from utilizing the renewable resources.
As in the previous case for optimum solution the model was run repeatedly using different types,
sizes, capacities and numbers of wind turbines, PV panels, diesel generators, batteries and
converters; etc. The sensitivity analysis has been also done by varying important parameters such
as: diesel oil price and cost of PV panels.
6.2 Sensitivity Analysis
Sensitivity analysis was also carried out and for a fixed average wind speed of 8.24 m/s
(measured at 10 meters) and average solar radiation of 6.13 kWh/m2/day an increase in diesel
price will increase the Net present cost of the system. In the figure, the net present cost of the
most cost-effective set-up for a particular set of diesel and PV prices is also included.
In the above figures it can be seen that the wind plays big role in supplying energy to the
concerned enterprises. At this point, it must be known that this is not only due to more
availability of wind potential than solar energy potential, but also it is because of wind turbine
used. The wind turbine used in the design of the system is one with small cut-in wind speed,
2m/s, and also have small capital cost when compared to majority of turbines in the market. Let’s
see effects of varying diesel prices as follows:
6.2.1 Net present cost sensitive to diesel price The sensitivity of net present cost to different diesel price scenario is shown below in
figure 6.4 and shows a considerable range of diesel price. The following table indicates
simulation results for different cases:

Simulation and Optimization of Wind Turbine, Solar PV, Storage Battery and Diesel Generator Hybrid Power System for a Cluster of Micro and Small Enterprises Working on Wood and Metal Products at Welenchity Site
63 MSc Thesis, AAiT-Energy Center, By Terefe Jima, 2013
Table 6.4: Comparison of net present cost, energy cost and green house gas emission diesel-only option with hybrid system
Components Net present cost(Birr)
Cost of energy(Birr/kWh)
Diesel consumed per year(L)
CO2 emission per year
Diesel only 39762857 30.36561 44,546 117,304
Wind/PV/Diesel/Battery 13282245 10.14024 10,463 27,553
Wind/Diesel/Battery 14534895 11.11385 12,716 33,486
PV/Diesel/Battery 35229306 30.20028 42,040 110,706
From the above table we can plot a graph showing the effect of increasing diesel price on net
present cost of each scenario:
Table 6.5: sensitivity of net present cost to diesel price
Diesel prices Net present cost (Birr)
Diesel only Hybrid system
$1.1 39762857 13282245
$1.2 40808937 13527944
$1.3 41854998 13773642
The corresponding figure representation will be shown below:

Simulation and Optimization of Wind Turbine, Solar PV, Storage Battery and Diesel Generator Hybrid Power System for a Cluster of Micro and Small Enterprises Working on Wood and Metal Products at Welenchity Site
64 MSc Thesis, AAiT-Energy Center, By Terefe Jima, 2013
Figure 6.5: Net present cost (NPC) of optimized hybrid vs. diesel scenarios only under different
diesel price
From the graph above we can understand that the hybrid NPC is almost constant since the diesel
price is not totally meaningful change on the system throughout project life time.
Though the optimum system configuration changes under different diesel price assumptions, the
hybrid system remains most economically feasible solution than the existing arrangements
(diesel-only), under all scenarios considered.
From sensitivity analysis, it is observed that for a diesel price of less than $1.1/L
Wind/Generator/Battery/Converter systems is favorable while for diesel price higher than $1.1/L
Wind/PV/Generator/Battery/Converter system is favorable .
0
5000000
10000000
15000000
20000000
25000000
30000000
35000000
40000000
45000000
20.21 22.04 23.8
Net
pre
sent
cost
Diesel price (Birr)
Diesel only
Hybrid system
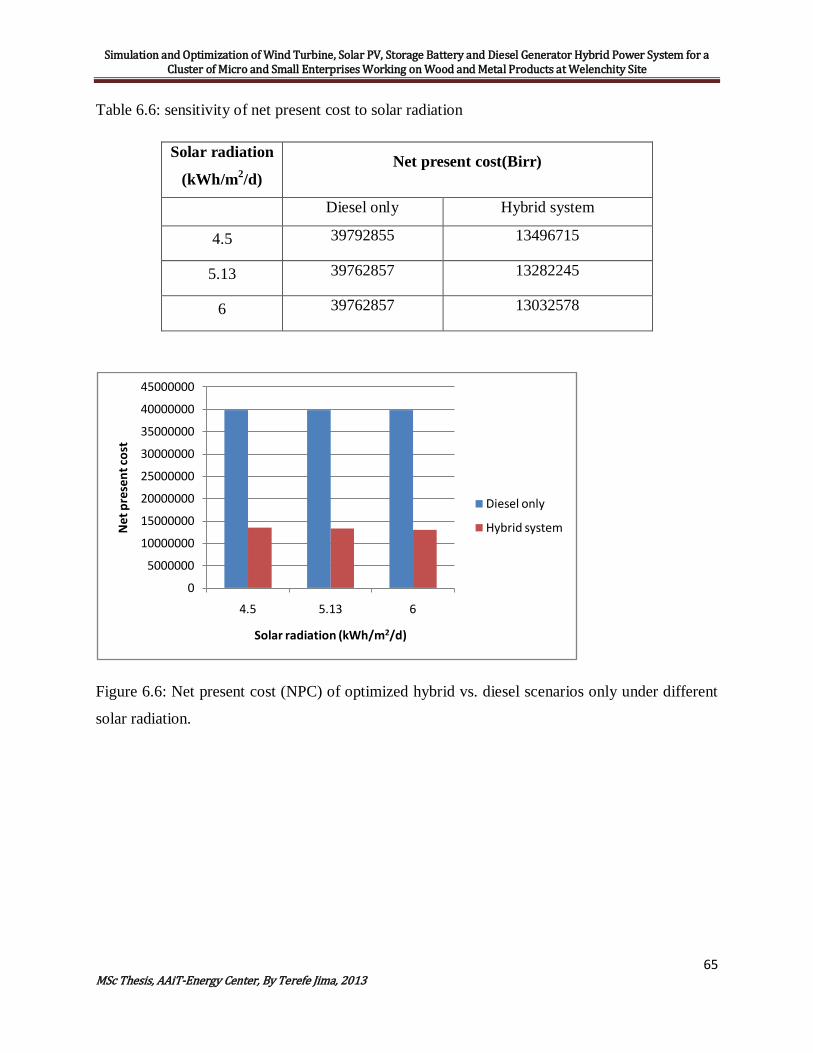
Simulation and Optimization of Wind Turbine, Solar PV, Storage Battery and Diesel Generator Hybrid Power System for a Cluster of Micro and Small Enterprises Working on Wood and Metal Products at Welenchity Site
65 MSc Thesis, AAiT-Energy Center, By Terefe Jima, 2013
Table 6.6: sensitivity of net present cost to solar radiation
Solar radiation
(kWh/m2/d) Net present cost(Birr)
Diesel only Hybrid system
4.5 39792855 13496715
5.13 39762857 13282245
6 39762857 13032578
Figure 6.6: Net present cost (NPC) of optimized hybrid vs. diesel scenarios only under different
solar radiation.
0
5000000
10000000
15000000
20000000
25000000
30000000
35000000
40000000
45000000
4.5 5.13 6
Net
pre
sent
cost
Solar radiation (kWh/m2/d)
Diesel only
Hybrid system

Simulation and Optimization of Wind Turbine, Solar PV, Storage Battery and Diesel Generator Hybrid Power System for a Cluster of Micro and Small Enterprises Working on Wood and Metal Products at Welenchity Site
66 MSc Thesis, AAiT-Energy Center, By Terefe Jima, 2013
Table 6.7: Sensitivity of net present cost to wind speed
Figure 6.7: Net present cost (NPC) of optimized hybrid vs. diesel scenarios only under different
wind speed
From the Figure 6.6 and Figure 6.7 above we can understand that as the wind speed and solar
radiation increases the net present cost of the hybrid system will become decreases.
0
5000000
10000000
15000000
20000000
25000000
30000000
35000000
40000000
45000000
6 7.28 8
Net
pre
sent
ccos
t
Wind Speed (m/s)
Diesel only
Hybrid system
Wind speed
(m/s) Net present cost (Birr)
Wind Speed Diesel only Hybrid system
6 39762857 17157635
7.28 39762857 13282245
8 39762857 9008170
Simulation and Optimization of Wind Turbine, Solar PV, Storage Battery and Diesel Generator Hybrid Power System for a Cluster of Micro and Small Enterprises Working on Wood and Metal Products at Welenchity Site
67 MSc Thesis, AAiT-Energy Center, By Terefe Jima, 2013
CHAPTER SEVEN
CONCLUSIONS AND RECOMMENDATIONS
7.1 Conclusion
A hybrid power generation system which comprises of PV arrays, wind turbines and diesel
generator with battery banks and power conditioning units has been discussed in this thesis to
achieve a cost effective system configuration which is supposed to supply electricity to model
MSEs working on wood and metal products where electricity from the main grid has not reached
yet. Before the design of the hybrid system was started, the wind energy and solar energy
potentials of the area under study had been studied. Then, based on these potentials, a design of a
standalone electric power supply system for a model community has been conducted.
The study of the renewable potentials of the site is based on the recently recorded data (2003-
2008) obtained from the Ethiopian Meteorological Agency.
Regarding solar energy potential there is no accurately recorded solar radiation database in the
country, instead only sunshine hour data was available. Therefore, empirical formulas which are
able to incorporate the available sunshine hour data and provide the required solar radiation data
were used to determine the potential of the site. The results obtained from empirical formulas
were also cross-checked against satellite data obtained from other sources such as NASA and
SWERA [NASA, 2010], [SWERA, 2011]. The analysis of the renewable energy resources data
has been carried out by HOMER software. From the results, the wind energy potential of the site
is found to be considerable, although it may not be sufficient for a large independent wind farm;
it is viable option if incorporated into other energy conversion systems such as PV, diesel
generator and battery. The results also confirmed the availability of huge utilizable wind energy
at the site.
The results obtained from the software give numerous alternatives of feasible hybrid systems
with different levels of renewable resources penetration which their choice is restricted by
changing the net present cost of each set up. The COE of the feasible setups in this study is high
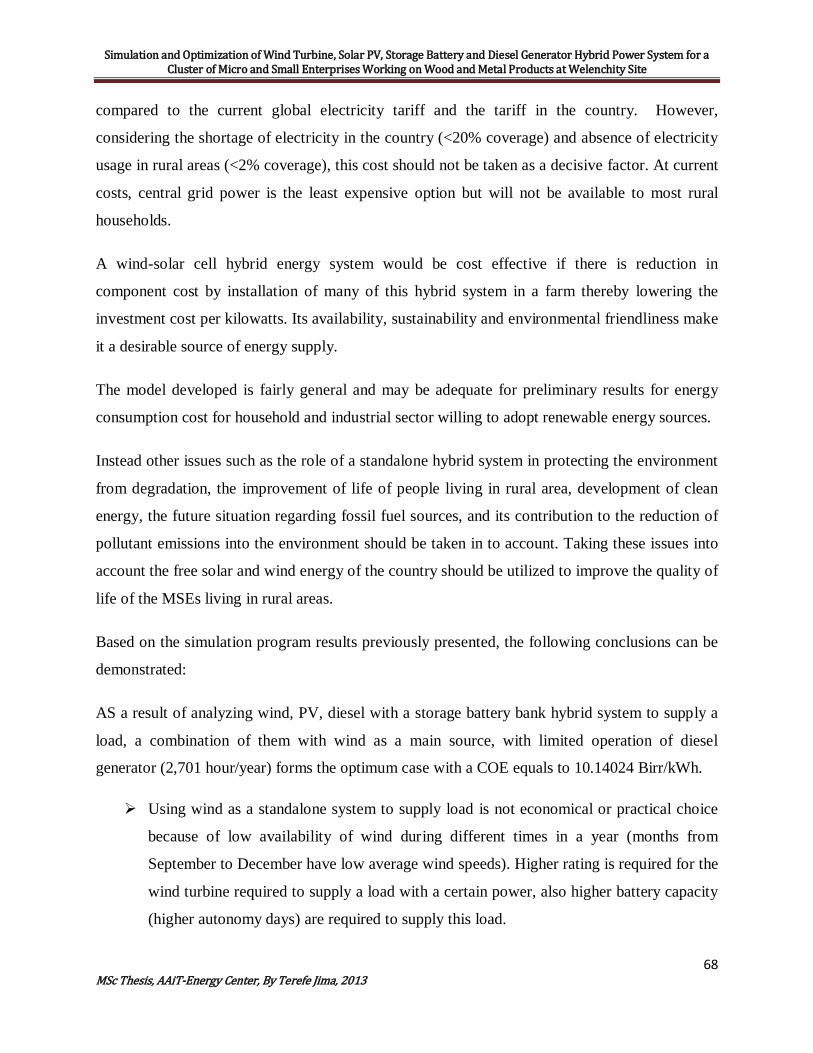
Simulation and Optimization of Wind Turbine, Solar PV, Storage Battery and Diesel Generator Hybrid Power System for a Cluster of Micro and Small Enterprises Working on Wood and Metal Products at Welenchity Site
68 MSc Thesis, AAiT-Energy Center, By Terefe Jima, 2013
compared to the current global electricity tariff and the tariff in the country. However,
considering the shortage of electricity in the country (<20% coverage) and absence of electricity
usage in rural areas (<2% coverage), this cost should not be taken as a decisive factor. At current
costs, central grid power is the least expensive option but will not be available to most rural
households.
A wind-solar cell hybrid energy system would be cost effective if there is reduction in
component cost by installation of many of this hybrid system in a farm thereby lowering the
investment cost per kilowatts. Its availability, sustainability and environmental friendliness make
it a desirable source of energy supply.
The model developed is fairly general and may be adequate for preliminary results for energy
consumption cost for household and industrial sector willing to adopt renewable energy sources.
Instead other issues such as the role of a standalone hybrid system in protecting the environment
from degradation, the improvement of life of people living in rural area, development of clean
energy, the future situation regarding fossil fuel sources, and its contribution to the reduction of
pollutant emissions into the environment should be taken in to account. Taking these issues into
account the free solar and wind energy of the country should be utilized to improve the quality of
life of the MSEs living in rural areas.
Based on the simulation program results previously presented, the following conclusions can be
demonstrated:
AS a result of analyzing wind, PV, diesel with a storage battery bank hybrid system to supply a
load, a combination of them with wind as a main source, with limited operation of diesel
generator (2,701 hour/year) forms the optimum case with a COE equals to 10.14024 Birr/kWh.
Using wind as a standalone system to supply load is not economical or practical choice
because of low availability of wind during different times in a year (months from
September to December have low average wind speeds). Higher rating is required for the
wind turbine required to supply a load with a certain power, also higher battery capacity
(higher autonomy days) are required to supply this load.

Simulation and Optimization of Wind Turbine, Solar PV, Storage Battery and Diesel Generator Hybrid Power System for a Cluster of Micro and Small Enterprises Working on Wood and Metal Products at Welenchity Site
69 MSc Thesis, AAiT-Energy Center, By Terefe Jima, 2013
Using PV as a standalone system to supply the load isn't also economical or practical
one. Different times through a year have low solar isolation especially during winter
months (Months December, January, and February).
Using diesel generator only to supply the load requires many units to supply this load,
more fuel, so more CO2 is produced, also more maintenance and operational costs is
needed. The COE is high; it is 30.36561 Birr/kWh. Amount of CO2 produced is about
117,304/year, it is too high compared with the hybrid (27,553/yr).
A wind-solar cell hybrid energy system would be cost effective if there is reduction in
component cost by installation of many of this hybrid system in a farm thereby lowering
the investment cost per kilowatts. Its availability, sustainability and environmental
friendliness make it a desirable source of energy supply.
Though the optimum system configuration changes under different diesel price
assumptions, the hybrid system remains most economically feasible solution than the
existing arrangements (diesel-only), under all scenarios considered.
The model developed is fairly general and may be adequate for preliminary results for
energy consumption cost for MSEs willing to adopt renewable energy sources. Therefore
the most economical scenario is using wind-PV –Diesel Generator-Battery hybrid
system as stated before.
7.2 Recommendations
The following recommendations are made out of this research; some of them are directed to the
researchers while the others are directed to decision makers.
• Ethiopia has a huge potential of renewable energy resources which can be used for rural
electrification through the off-grid system. There are, however, many challenges like low
purchasing power of the rural community, unfavorable conditions towards the utilization
of renewable energies, absence of awareness how to use these resources, etc.
Thus, the author of this work recommends that the government, non-governmental organizations
and the private sectors should make combined efforts to overcome these challenges by using
more flexible approaches to improve the current poor status of rural electrification in Ethiopia.

Simulation and Optimization of Wind Turbine, Solar PV, Storage Battery and Diesel Generator Hybrid Power System for a Cluster of Micro and Small Enterprises Working on Wood and Metal Products at Welenchity Site
70 MSc Thesis, AAiT-Energy Center, By Terefe Jima, 2013
• The implementation for this hybrid system as a pilot system in country can be done if a
subsidy is available for this project, this will make it possible for more research, study
and analysis.
• As far as the environmental aspects are concerned, this kind of hybrid systems have to be
wide spread in order to cover the energy demands of rural MSEs, and in that way to help
reduce the green house gases and the pollution of the environment. This is an important
point to be taken into consideration
• Similar solar and wind energy potentials assessment can be conducted for other sites in
the country (as Adama).

Simulation and Optimization of Wind Turbine, Solar PV, Storage Battery and Diesel Generator Hybrid Power System for a Cluster of Micro and Small Enterprises Working on Wood and Metal Products at Welenchity Site
71 MSc Thesis, AAiT-Energy Center, By Terefe Jima, 2013
REFERENCES [1] Ali, B. et al, (2010) “Hybrid Photovoltaic Diesel System in a Cable Car Resort Facility”.
European Journal of Scientific Research, Vol.26 No.1.
[2] Basic Wind Turbine Configurations. Available at: http:// www.awea. org/ faq/
basiccf.html [access date 7 December 2007]
[3] Bimrew, T., (2007) Comparative Analysis of Feasibility of Solar PV, Wind and Micro
Hydropower Generation for Rural Electrification in the Selected Sites of Ethiopia. MSc.
[4] Boyle G., 2004, Renewable Energy, OXFORD university press.
[5] Danish Wind Industry Association, (Jan., 2011), http://www.windpower.org/en/tour
Drake, F. and Mulugetta,Y., (1996), “Assessment of solar and wind energy resources in
Ethiopia: Part 2. Wind energy”. Solar Energy, Vol. 51, pp 205-217.
[6] Duffie, J.A. and Beckman, W.A., (2006) Solar Engineering of Thermal Processes. 3rd ed.
New Jersey: John Wiley and Sons, Inc.
[7] Gelma.B. (2011) Design of a PV-Wind Hybrid Power Generation System for Ethiopian
Remote area. MSc. Thesis, University of Addis Ababa.
[8] Getachew, B., (2009) Study into the Potential and Feasibility of a Standalone Solar-wind
Hybrid Electric Energy Supply System: For Application in Ethiopia. Ph.D Dissertation,
Royal Institute of Technology, KTH.
[9] Kanase-Patil A.B., Saini R.P., Sharma M.P., 2010 “Integrated Renewable Energy
Systems for Off Grid Rural Electrification of Remote Area”, Renewable Energy, Vol. 35,
pp. 1342– 1349
[10] Leake, E.W. (2010) Genset-Solar-Wind Hybrid Power System of Off-Grid Power Station
for Rural Applications: Sustainable off-grid power station for rural applications. MSc
Thesis, Technical University of Delft.
[11] Mahmoud M.M., Ibrik H.I.Techno-economic feasibility of energy supply of remote
villages in Palestine by PVsystems, diesel generators and electric grid. Renewable &
Sustainable Energy Reviews. 10(2006) 128-138.
[12] Mahmoud.S (2008) .Simulation of a hybrid power system consisting of Wind turbine, PV,
storage battery and diesel Generator with compensation network: design, Optimization
and economical evaluation. MSc.

Simulation and Optimization of Wind Turbine, Solar PV, Storage Battery and Diesel Generator Hybrid Power System for a Cluster of Micro and Small Enterprises Working on Wood and Metal Products at Welenchity Site
72 MSc Thesis, AAiT-Energy Center, By Terefe Jima, 2013
[13] Mulugeta Y., (1999) “Energy in Rural Ethiopia: Consumption Patterns, Associated
Problems, and Prospects for a Sustainable Energy Strategy”, Energy Sources, Part A:
Recovery, Utilization, and Environmental Effects,
[14] NASA Science News, (Jan., 2011), http://science.nasa.gov/science-news
[15] Nfah, E., Ngundam, J., and Tchinda, R. (2007) “Modelling of solar/diesel/battery hybrid
power systems for far-north Cameroon”. Renewable Energy, Vol.32, p 832–844
[16] Nfah, E.M. et al. (2008). “Simulation of off-grid generation options for remote villages in
Cameroon”. Renewable Energy, Vol. 33, p 1064–1072
[17] Optimization of Hybrid Energy Systems. Sizing and Operation control. Available at:
http:// www.upress.uni-kassel. de/ online/inhalt / 978-3-933146-19-9.[ access date 4 may
2008]
[18] Renewable Energy World, (Nov., 2010), http://renewableenergyworld.com Solarbuzz,
(March, 2011), http://www.solarbuzz.com/industry-news
[19] Research and markets Brochure. Available at: http:// www .research
andmarkets.com/reports/328418/ [access date 4 February 2008]
[20] Rivera, M.R., (2008) Small Wind / Photovoltaic Hybrid Renewable Energy System
Optimization. MSc. Thesis, University of Puerto Rico.
[21] Solar Panel Price, (Jan, 2010), http://solarpanelprices.org
[22] SWERA-Data for Solar and Wind Renewable Energy, (Jan., 2011): http://swera.unep.net/
[23] Wagner, H. and Mathur, J., (2009) Introduction to Wind Energy Systems: Basics,
Technology and Operation. Berlin Heidelberg: Springer-Verlag.
[24] Wolde-Ghiorgis, W., (1988) “Wind energy survey in Ethiopia”. Solar Wind Technology;
Vol. 5, pp341-351.

Simulation and Optimization of Wind Turbine, Solar PV, Storage Battery and Diesel Generator Hybrid Power System for a Cluster of Micro and Small Enterprises Working on Wood and Metal Products at Welenchity Site
73 MSc Thesis, AAiT-Energy Center, By Terefe Jima, 2013
APPENDIXES
Appendix A: Friction Coefficient α of Various Terrains [Patel, 2006]
Terrain Type Friction Coefficient 𝜶𝜶
Lake, ocean, and smooth, hard ground 0.10
Foot-high grass on level ground 0.15
Tall crops, hedges, and shrubs 0.20
Wooded country with many trees 0.25
Small town with some trees and shrubs 0.30
City area with tall buildings 0.40
Appendix B: Various value of shape factor:
Types of wind Shape factor
Inland winds 1.5 to 2.5
Coastal winds 2.5 to 3.5
Trade winds 3 to 4
Appendix C: Adama wind speed at different height (m/s)
Month 2 meters (2003 -2007)
10 meters (2006-2008)
40 meters (2007) Power generated at 10 m (kWh)
January 2.4 9.2 10.5 351.0
February 2.5 9.6 9.5 435.2

Simulation and Optimization of Wind Turbine, Solar PV, Storage Battery and Diesel Generator Hybrid Power System for a Cluster of Micro and Small Enterprises Working on Wood and Metal Products at Welenchity Site
74 MSc Thesis, AAiT-Energy Center, By Terefe Jima, 2013
March 2.0 7.8 10.8 300.4
April 2.0 7.5 7.0 271.1
May 1.9 7.3 7.7 178.6
June 2.0 7.5 7.8 216.2
July 2.2 8.2 7.1 290.4
August 1.7 6.6 6.0 257.3
September 2.0 7.5 7.9 216.7
October 2.1 8.1 10.4 296.1
November 2.6 9.9 11.1 309.9
December 2.7 10.2 11.0 393.8
Average 2.2 8.3 8.9 293
Appendix D: System Report - HOMER
Sensitivity case
Solar Data Scaled Average: 5.13 kWh/m²/d Wind Data Scaled Average: 7.28 m/s Diesel Price: 1.1(18.37) $(birr)/L System architecture
PV Array 12 kW Wind turbine 12 Generic 3kW Generator 1 20 kW Battery 32 Surrette 6CS25P Inverter 20 kW Rectifier 20 kW Dispatch strategy Load Following Cost summary
Total net present cost $ 723,040 ( 13282245 birr) Levelized cost of energy $ 0.552 (10.14024birr) /kWh Operating cost $ 43,669 (802199.5 birr)/yr
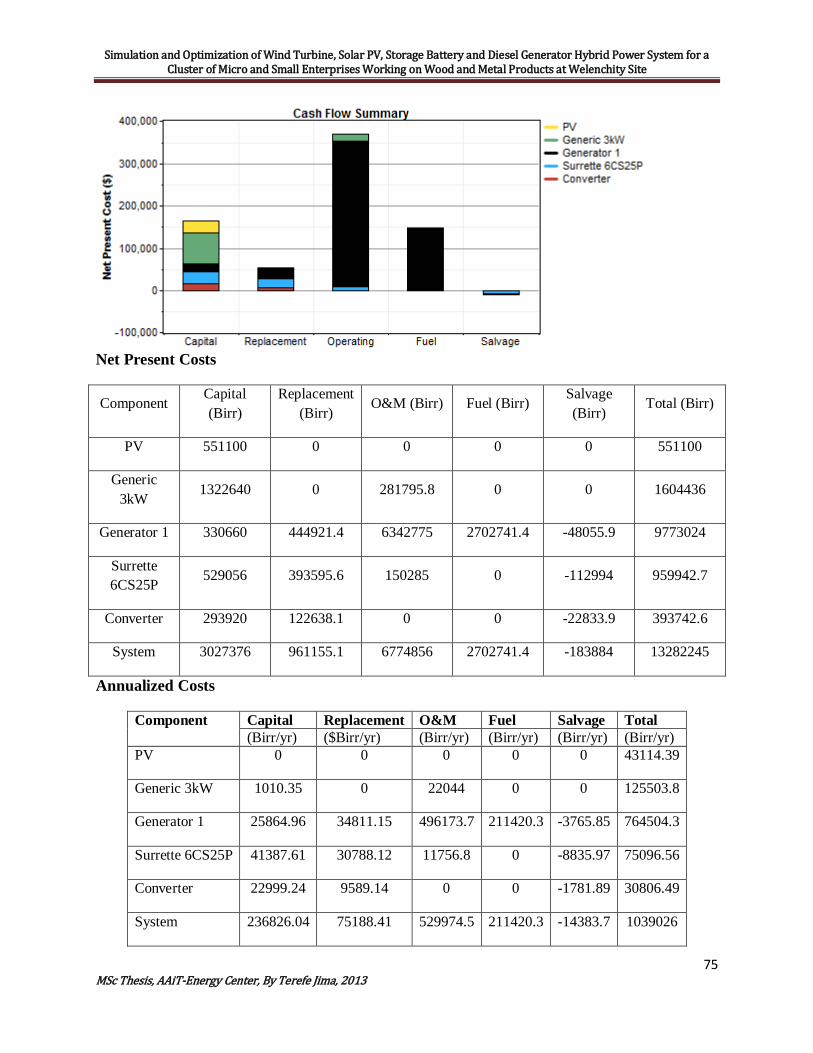
Simulation and Optimization of Wind Turbine, Solar PV, Storage Battery and Diesel Generator Hybrid Power System for a Cluster of Micro and Small Enterprises Working on Wood and Metal Products at Welenchity Site
75 MSc Thesis, AAiT-Energy Center, By Terefe Jima, 2013
Net Present Costs
Component Capital (Birr)
Replacement (Birr)
O&M (Birr) Fuel (Birr) Salvage (Birr)
Total (Birr)
PV 551100 0 0 0 0 551100
Generic 3kW 1322640 0 281795.8 0 0 1604436
Generator 1 330660 444921.4 6342775 2702741.4 -48055.9 9773024
Surrette 6CS25P 529056 393595.6 150285 0 -112994 959942.7
Converter 293920 122638.1 0 0 -22833.9 393742.6
System 3027376 961155.1 6774856 2702741.4 -183884 13282245
Annualized Costs
Component Capital Replacement O&M Fuel Salvage Total (Birr/yr) ($Birr/yr) (Birr/yr) (Birr/yr) (Birr/yr) (Birr/yr)
PV 0 0 0 0 0 43114.39
Generic 3kW 1010.35 0 22044 0 0 125503.8
Generator 1 25864.96 34811.15 496173.7 211420.3 -3765.85 764504.3
Surrette 6CS25P 41387.61 30788.12 11756.8 0 -8835.97 75096.56
Converter 22999.24 9589.14 0 0 -1781.89 30806.49
System 236826.04 75188.41 529974.5 211420.3 -14383.7 1039026

Simulation and Optimization of Wind Turbine, Solar PV, Storage Battery and Diesel Generator Hybrid Power System for a Cluster of Micro and Small Enterprises Working on Wood and Metal Products at Welenchity Site
76 MSc Thesis, AAiT-Energy Center, By Terefe Jima, 2013
Electrical
Component Production Fraction (kWh/yr)
PV array 18,199 11% Wind turbines 119,775 74% Generator 1 24,566 15% Total 162,540 100%
Load Consumption Fraction
(kWh/yr) AC primary load 102,429 100% Total 102,429 100% Quantity Value Units Excess electricity 46,233 kWh/yr Unmet load 135 kWh/yr Capacity shortage 508 kWh/yr Renewable fraction 0.849 PV
Quantity Value Units Rated capacity 12.0 kW Mean output 2.08 kW Mean output 49.9 kWh/d Capacity factor 17.3 %

Simulation and Optimization of Wind Turbine, Solar PV, Storage Battery and Diesel Generator Hybrid Power System for a Cluster of Micro and Small Enterprises Working on Wood and Metal Products at Welenchity Site
77 MSc Thesis, AAiT-Energy Center, By Terefe Jima, 2013
Total production 18,199 kWh/yr Quantity Value Units Minimum output 0.00 kW Maximum output 9.62 kW PV penetration 17.7 % Hours of operation 4,456 hr/yr Levelized cost 0.129(2.36973) $(birr)/kWh
DC Wind Turbine: Generic 3kW
Variable Value Units Total rated capacity 36.0 kW Mean output 13.7 kW Capacity factor 38.0 % Total production 119,775 kWh/yr Variable Value Units Minimum output 0.00 kW Maximum output 31.2 kW Wind penetration 117 % Hours of operation 7,998 hr/yr Levelized cost 0.0570 $/kWh
Generator 1
Quantity Value Units Hours of operation 2,701 hr/yr Number of starts 683 starts/yr Operational life 7.40 yr Capacity factor 14.0 % Fixed generation cost 12.7 $/hr Marginal generation cost 0.275 $/kWhyr Quantity Value Units

Simulation and Optimization of Wind Turbine, Solar PV, Storage Battery and Diesel Generator Hybrid Power System for a Cluster of Micro and Small Enterprises Working on Wood and Metal Products at Welenchity Site
78 MSc Thesis, AAiT-Energy Center, By Terefe Jima, 2013
Electrical production 24,566 kWh/yr Mean electrical output 9.10 kW Min. electrical output 6.00 kW Max. electrical output 20.0 kW Quantity Value Units Fuel consumption 10,463 L/yr Specific fuel consumption 0.426 L/kWh Fuel energy input 102,956 kWh/yr Mean electrical efficiency 23.9 %
Battery
Quantity Value String size 1 Strings in parallel 32 Batteries 32 Bus voltage (V) 6 Quantity Value Units Nominal capacity 222 kWh Usable nominal capacity 133 kWh Autonomy 11.4 hr Lifetime throughput 308,646 kWh Battery wear cost 0.104(1.91048) $(birr)/kWh Average energy cost 0.000 $(birr)/kWh Quantity Value Units Energy in 26,151 kWh/yr Energy out 20,938 kWh/yr Storage depletion 18.2 kWh/yr Losses 5,195 kWh/yr Annual throughput 23,409 kWh/yr Expected life 12.0 yr
Simulation and Optimization of Wind Turbine, Solar PV, Storage Battery and Diesel Generator Hybrid Power System for a Cluster of Micro and Small Enterprises Working on Wood and Metal Products at Welenchity Site
79 MSc Thesis, AAiT-Energy Center, By Terefe Jima, 2013
Converter
Quantity Inverter Rectifier Units Capacity 20.0 20.0 kW Mean output 8.9 0.0 kW Minimum output 0.0 0.0 kW Maximum output 20.0 2.3 kW Capacity factor 44.5 0.0 % Quantity Inverter Rectifier Units Hours of operation 8,575 45 hrs/yr Energy in 86,566 43 kWh/yr Energy out 77,910 36 kWh/yr Losses 8,656 6 kWh/yr

Simulation and Optimization of Wind Turbine, Solar PV, Storage Battery and Diesel Generator Hybrid Power System for a Cluster of Micro and Small Enterprises Working on Wood and Metal Products at Welenchity Site
80 MSc Thesis, AAiT-Energy Center, By Terefe Jima, 2013
Emissions
Pollutant Emissions (kg/yr) Carbon dioxide 27,553 Carbon monoxide 68 Unburned hydocarbons 7.53 Particulate matter 5.13 Sulfur dioxide 55.3 Nitrogen oxides 607