tepal projecttepal project preliminary economic ......srk consulting tepal pea technical report page...
TRANSCRIPT

Tepal ProjectTepal Project Preliminary Economic Assessment
Technical Report
MexicoMexico
Prepared for:
Geologix Explorations Inc..Suite 1753, Three Bentall Centre, 595 Burrars Street
Vancouver, BC V7X 1K8
P d bPrepared by:
Project No. 2CG020.000
Effective Date: October 8, 2010,Submitted to Geologix: November 1, 2010

Tepal Project Preliminary Economic Assessment
Technical Report
Project Location: Michoacán, Mexico Approximate UTM Coordinates: 2,117,000N, 717,000E
Geologix Explorations Inc. Suite 1753 Three Bentall Centre
595 Burrard Street Vancouver, B.C. V7X 1K8
SRK Consulting (Canada) Inc. Suite 2200, 1066 West Hastings Street
Vancouver, B.C. V6E 3X2 Tel: 604.681.4196 Fax: 604.687.5532
E-mail: [email protected] Web site: www.srk.com
SRK Project Number 2CG020.000
Effective Date: October 8, 2010 Submitted to Geologix: November 1, 2010
Authors
Bruce Murphy, FSAIMM Dino Pilotto, P. Eng
Epitacio Robelo, P.Eng. Galen White, P.Geo.
Gordon Doerksen, P.Eng. W. Joseph Schlitt, P.Eng
Reviewed by
Gilles Arseneau

SRK Consulting Tepal PEA Technical Report Page i
GED/HA Tepal PEA Technical Report_2CG020 000_GD_20101101.docx, Nov. 1, 10, 6:24 PM Effective Date: October 8, 2010
Executive Summary This Technical Report was compiled by SRK Consulting (Canada) Inc. (“SRK”) for Geologix Explorations Inc. (“Geologix”). In addition to SRK , Qualified Persons (“QP”) W. Joseph Schlitt of Hydrometal, Inc. and Galen White of CSA Global (UK) Ltd. and Epitacio Robledo of Clifton Associates Ltd. are QP contributors for metallurgy/processing, geology/resources and environmental considerations respectively.
The purpose of the Technical Report is to describe the results of a Preliminary Economic Assessment (“PEA”) conducted on the Geologix Tepal gold-copper project in the State of Michoacán, Mexico.
The reader is advised that the preliminary economic assessment summarized in this technical report is only intended to provide an initial, high-level review of the project potential. The PEA mine plan and economic model include the use of a significant portion of inferred resources which are considered to be too speculative to be used in an economic analysis except as allowed for in PEA’s. There is no guarantee that inferred resources can be converted to indicated or measured resources and, as such, there is no guarantee that the project economics described herein will be achieved.
The project is located in the State of Michoacán, Mexico near the town of Tepalcatepec. The property is 170 km south of Guadalajara, one of the largest cities in Mexico. The centre of the property is located at approximately 2,117,000N and 716,600E (UTM grid coordinates) at an average elevation of 550 metres. The climate is generally hot and arid with about 500 mm of precipitation per annum. The property consists of six contiguous concessions totaling 13,843.2 hectares (“ha”) (Priesmeyer, 2007).
The property has been explored intermittently by various companies for almost thirty years starting with INCO in 1972 and followed by Teck, Hecla and Arian.
The property is located within the Coastal Ranges of south-western Mexico south of the Neogene Trans-Mexican Volcanic Belt. Basement rocks consist of Cretaceous to early Tertiary (?) intermediate plutons, stocks and plugs intruding weakly metamorphosed sedimentary and volcanic rocks of probable Jurassic to Cretaceous age. The Jurassic to Cretaceous sedimentary and volcanic rocks are part of an accreted Mesozoic island arc volcanosedimentary assemblage. At least some of the intrusive rocks are probably coeval with the volcanic units. Neogene basalts locally overly basement rocks and represent outliers of the Trans- Mexican Volcanic Belt (Priesmeyer 2007).
Mineralization on the property is characteristic of a porphyry copper-gold deposit and mineralization consists of structurally controlled zones of stockwork and disseminated copper sulphides with elevated gold values. Mineralization occurs along a line of three small tonalite stocks just west of the north-northwest-trending fault that trends through the centre of the property.

SRK Consulting Tepal PEA Technical Report Page ii
GED/HA Tepal PEA Technical Report_2CG020 000_GD_20101101.docx, Nov. 1, 10, 6:24 PM Effective Date: October 8, 2010
All three stocks are composed of multiple intrusive phases with tonalite porphyry and tonalite porphyry intrusion breccia phases hosting the highest grade mineralization. Most of the historic resource is hosted by these lithologies in the northern and southernmost stocks (North Zone and South Zone, respectively). Both the North and South zone are crudely zoned from a gold-rich core with the highest gold and copper values and highest Au:Cu ratios to a copper dominant periphery with lower Au:Cu ratio to a barren pyritic halo (Shonk, 1994).
The Tepal deposit is dominantly a copper-gold (Cu-Au) resource. The bulk of the resource (85 to 90%) is sulphidic, but is overlain by a distinct oxide zone. The sulphide responds well to conventional milling, with production of a good quality Cu-Au flotation concentrate. The oxide material is a candidate for cyanide leaching, either in crushed ore heaps or coarse ore dumps. This would produce gold and some cyanide soluble copper. The latter would be removed from the gold circuit as a sulphide and combined with the concentrate using SART (sulphidation-acidification-recycling-thickening) technology. This SART process has been successfully used commercially at other operations in the world, including the Telfer deposit in Australia and the Maricunga deposit in Chile.
Metallurgical recovers are estimated to be 87.4% and 60.7% respectively for copper and gold recovery in the sulphide flotation circuit. Heap leach/SART recoveries are estimated to be 14.3% and 78.4% for copper and gold, respectively for a crushed product which was the option selected for this study.
The September 2008 classified CIM compliant resource estimate for gold and copper at Tepal is detailed in Table 1.

SRK Consulting Tepal PEA Technical Report Page iii
GED/HA Tepal PEA Technical Report_2CG020 000_GD_20101101.docx, Nov. 1, 10, 6:24 PM Effective Date: October 8, 2010
Table 1: September 2008 Mineral Resource Estimate (ACA Howe) CIM Indicated Resources CIM Inferred Resources
Material Density Tonnes Au (g/t) Cu (%) Density Tonnes Au (g/t) Cu (%) Domain All* 2.78 24,995,000 0.544 0.267 2.78 54,964,000 0.405 0.219
North 2.81 13,261,000 0.574 0.302 2.81 31,361,000 0.406 0.233
South 2.74 11,734,000 0.510 0.228 2.74 23,582,000 0.403 0.200
N1 2.81 8,373,000 0.639 0.325 2.81 23,457,000 0.400 0.225
N2 2.81 3,630,000 0.480 0.263 2.81 4,643,000 0.435 0.255
N3 2.81 458,000 0.410 0.309 2.81 334,000 0.484 0.230
N4 2.81 151,000 0.231 0.203 2.81 293,000 0.241 0.227
N5 2.81 610,000 0.417 0.246 2.81 2,089,000 0.412 0.255
N6 2.81 38,000 0.412 0.262 2.81 546,000 0.462 0.284
S1 2.74 11,717,000 0.510 0.228 2.74 22,067,000 0.399 0.199
S2 2.74 17,000 0.458 0.073 2.74 18,000 0.418 0.083
S3 0 2.74 1,327,000 0.477 0.231 Note: *domains constrained by a .18ppm Au envelope honour the geological model tonnage figures have been rounded up or down to the nearest 1000t Au ounces have been calculated using 31.1035g=1oz Cu pounds have been calculated using 1 tonne = 2204.622lbs
The Tepal deposit is proposed to be developed as an open pit. Mining of the deposit will produce a total of 10.0 million tonnes (“Mt”) of oxide heap leach feed, 58.7 Mt of mill sulphide feed and 51.6 Mt of waste (0.75:1 strip ratio) over an 8.3 year mine operating life. The current life of mine (“LOM”) plan focuses on achieving the required heap leach and mill feed production rates, mining of higher grade material early in schedule, and balancing grade and strip ratios.
Mine design for the Tepal open pits was initiated with the development of a Net Smelter Return (“NSR”) model. The model included estimates of metal prices, exchange rate, mining dilution, mill and heap leach recovery, concentrate grade, smelting and refining payables and costs, freight and marketing costs and royalties. The NSR model was based on a 25 m x 25 m x 20 m block size. Gemcom Whittle™ - Strategic Mine Planning™ (“Whittle™”) software was then used to determine the optimal mining shell. Mine planning and scheduling was then conducted on the optimal pit shell with the use of MineSight™ software. The mineral resources within the pit shell are summarized by category and type, in Table 2 below using an internal NSR cut-off grade of $5.23/t at 5% dilution.
The Tepal deposit is divided into a North and South Pit. The mining sequence was further divided into a number of pit phases designed to maximize grade; reduce pre-stripping requirements in the early years; provide required oxide production for the heap leach process; and keep and maintain the process plant at full production capacity. The LOM mine production schedule is shown in Table 3.
Waste rock from the Tepal pits is planned to be deposited in engineered waste rock facilities (“WRF”) adjacent to both the North and South Pits. Due to the pit and deposit geometry, as well as the pit sequencing, the potential for backfilling waste rock into previously mined out areas is limited.

SRK Consulting Tepal PEA Technical Report Page iv
GED/HA Tepal PEA Technical Report_2CG020 000_GD_20101101.docx, Nov. 1, 10, 6:24 PM Effective Date: October 8, 2010
The North WRF, planned to be located immediately north of the North Pit is designed to contain 40 Mt of waste, while the West WRF, planned for the west side of the South Pit has a design capacity of 12 Mt.
The tailings management facility (“TMF”) is envisioned to be about 2 km east of the plant and will be a side-slope construction built using cycloned tailings. The TMF was designed to hold 60 Mt of tailings or 40 Mm3.

SRK Consulting Tepal PEA Technical Report Page v
GED/HA Tepal PEA Technical Report_2CG020 000_GD_20101101.docx, Nov. 1, 10, 6:24 PM Effective Date: October 8, 2010
Table 2: PEA Tepal Project LOM Resource (@ $5.23/t NSR cut-off)
Category Oxide Sulphide Total
Mtonnes Au (g/t) Cu %
Contained Au (oz)
Contained Cu (Mlbs) Mtonnes Au (g/t) Cu
% Contained
Au (oz) Contained Cu (Mlbs) Mtonnes Au (g/t) Cu
% Contained
Au (oz) Contained Cu (Mlbs)
Indicated 2.7 0.58 0.31 50,852 18.5 21.6 0.52 0.25 361,150 119.5 24.3 0.53 0.26 412,002 138.0
Inferred 7.3 0.41 0.22 95,179 34.6 37.0 0.40 0.22 481,363 178.2 44.3 0.40 0.22 576,542 212.7
Table 3: LOM Mine Production Schedule – Tepal Project
Parameter Unit Total YEAR
1 2 3 4 5 6 7 8 9 O/P MINING ALL DEPOSITS OP oxide waste Mt 3.5 0.6 0.9 1.2 0.6 0.2 0.0 0.0 0.0 0.0
OP sulphide waste Mt 48.1 7.8 3.3 6.9 11.1 6.5 6.5 3.0 2.7 0.4
OP total Waste Mt 51.6 8.3 4.2 8.1 11.6 6.7 6.5 3.0 2.7 0.4 ROM oxide ore Mt 10.0 2.5 3.0 3.0 1.2 0.3 0.0 0.0 0.0 0.0
Gold Grade oxide ore g/t Au 0.45 0.62 0.42 0.41 0.33 0.29 0.00 0.00 0.00 0.00
Copper Grade oxide ore % Cu 0.24 0.30 0.26 0.19 0.20 0.20 0.00 0.00 0.00 0.00
ROM sulphide ore Mt 58.7 0.0 7.5 8.0 8.0 8.0 8.0 8.0 8.0 3.1
Gold Grade sulphide ore g/t Au 0.45 0.00 0.57 0.47 0.44 0.49 0.42 0.39 0.37 0.39
Copper Grade sulphide ore % Cu 0.23 0.00 0.32 0.23 0.24 0.23 0.20 0.21 0.19 0.20
Total ore mined O/P Mt 68.7 2.5 10.5 11.0 9.2 8.3 8.0 8.0 8.0 3.1 Total Mined ounces O/P oz Au 988,632 49,953 179,601 161,302 125,611 129,706 107,937 100,293 95,061 39,168 Total Mined lbs O/P Mlbs Cu 351.0 16.3 70.5 53.0 47.9 42.2 36.0 37.2 33.7 14.1 Strip Ratio t:t 0.75 3.33 0.40 0.73 1.26 0.81 0.82 0.38 0.34 0.14
Avg O/P mining rate t/day 41,206 29,667 40,386 52,257 57,126 41,123 39,803 30,204 29,297 25,149

SRK Consulting Tepal PEA Technical Report Page vi
GED/HA Tepal PEA Technical Report_2CG020 000_GD_20101101.docx, Nov. 1, 10, 6:24 PM Effective Date: October 8, 2010
Operating costs for the project are summarized in Table 4. All costs are in $US currency.
Table 4: Operating Cost Estimate
Area Cost Estimate
Open pit mining $1.35/t mined
$2.37/t to HL and Flotation
Heap Leach/SART Processing $4.31/t to the HL
Flotation $4.30/t processed
General and Administrative $0.68/t to HL and Flotation
Capital costs for the project were developed from a mix of first principles, reference projects, and experience. The annual capital costs by major category are shown in Table 5.
Table 5: Capital Cost Estimate Summary
Category Unit Total Yr 0 2012
Yr 1 2013
Yr 2 2014
Yr 3 2015
Yr 4-82016-2020
Yr 9 2021
Mining Equipment M$ 44.3 16.0 27.1 3.3 1.7 - 3.8 Roads and General Infrastructure M$ 14.7 14.7 Electrical Power Line and Generators M$ 14.2 14.2 Flotation Process Plant M$ 124.0 24.0 100.0 Heap Leach Pad and Facility M$ 16.8 16.8 Tailings Management Facility M$ 20.0 5.0 15.0 Owners Costs M$ 8.8 2.3 6.5 EPCM M$ 26.3 6.9 19.5 Closure M$ 4.8 4.8 Contingency (10%) M$ 19.2 5.3 13.4 0.5 Total Capital Cost M$ 293.0 105.1 181.5 3.3 1.7 - 1.5
A simplified earning before interest, taxation, depreciation and amortization (“EBITDA”) analyses were compiled based on varying gold and copper prices in order to assess sensitivity of the project to metal prices. For each case, the mill feed tonnes were held constant and the metal prices were varied only in the economic model. The base case metal prices were $900/oz Au and $2.75/lb Cu. The range of metal prices used was:
• Gold (US$/oz): 800, 900, 1000, 1100, 1200;
• Copper (US$/lb): 2.50, 2.75, 3.00, 3.25, 3.50;
Common assumptions to all cases included:
• 5% discount rate (“DR”) for net present value (“NPV”) calculation as per guidance by Geologix;
• 100% equity financing as per guidance by Geologix;
• Exclusion of all pre-development costs as per guidance by Geologix;
• Exclusion of all duties and taxes;

SRK Consulting Tepal PEA Technical Report Page vii
GED/HA Tepal PEA Technical Report_2CG020 000_GD_20101101.docx, Nov. 1, 10, 6:24 PM Effective Date: October 8, 2010
• 2.5% royalty on net smelter return;
• All 2011 costs were assumed to be sunk costs with analysis beginning in 2012 (Year 0).
The results of the economic analysis indicate that the project is economic for the assumptions made as shown in Table 6.
Table 6: Base Case LOM Key Economic Results
Parameter Unit Base Case Results
Royalty Payments M$ 30.2
EBITDA NPV0% M$ 382
EBITDA NPV5% M$ 258
EBITDA IRR % 28
EBITDA payback period Production years 2.8
Table 7 shows some ranges of gold and copper prices that, when combined, result in a break-even situation or an NPV5% of $0. For example, with a gold price of $1,000/oz the project requires a copper price of $1.22/lb to break even.
Table 7: Combined Copper and Gold Prices that Yield a $0 NPV5% (Break Even Economics)
Copper Price ($/lb) Gold Price ($/oz) 1.22 1,000 1.46 900 1.70 800 1.95 700 2.00 680 2.25 575 2.50 470 2.75 370 3.00 265
Currently an environmental baseline study is underway on the project and is considered as a reference inventory appropriate for the 2,872 Ha of study area and covers the terrains of the Tepal mining concessions 1,406 Ha, deriving into the following general conclusions:
• The project is located in the vicinity of land routes suitable for the operation of a mining project, however, locally; the road system is rudimentary and requires an important work of access in the event of major mining related activities
• The Tepal concession are located on surface land belonging to the Tepalcuatita Ranch, private land and ejido lands, implying potential displacement of productive activities (cattle ranching and seasonal agriculture) and closing rural roads recently used by the local community (travel to and from the highway and La Estanzuela)
• The Environmental Baseline (LBA) covers 200% more surface area than the polygon of the project (2,872 studied versus 1,406 ha of the current Tepal mining concession), this allows for a

SRK Consulting Tepal PEA Technical Report Page viii
GED/HA Tepal PEA Technical Report_2CG020 000_GD_20101101.docx, Nov. 1, 10, 6:24 PM Effective Date: October 8, 2010
better understanding of the local environmental system and future consideration for the preliminary mine development plan
• Once a conceptual mining development plan is prepared, new areas for the expansion of environmental inventories should be contemplated in order to include potential new sites of interest (mining infrastructure)
• The main components that have been considered for the establishment of this area of study correspond to the area of geological interest (mining concessions), the possible development of open pit mining, areas suitable for the establishment of a process plant, associated infrastructure and the construction of an access road dedicated to the mining unit, that connects the project to the East (towards the state highway).
Geologix is required to prepare and submit to SEMARNAT different environmental reports (MIA, ETJ, ER) for environmental impact authorizations prior to site preparation and construction for operation permits, land use modification, risk assessment, among others. Overall environmental permitting in Michoacán can take from 6 month to 1 year with land tenure usually being the most sensitive issue in delaying the permitting process.
The current environmental baseline information indicates that there are no environmental “fatal flaws” identified for the proposed Tepal Project. The extent of habitat degradation in the area as well as the surrounding conservation status (heterogeneous mosaic), current land use and local trends do suggest the need for an integrated and careful environmental management policy and program in order to ensure that the mine site activities can coexist with the local communities.
Conclusions
Industry standard mining, process design, construction methods and economic evaluation practices have been used to assess the Tepal Project. The conclusion reached is that there is adequate geological and other pertinent data available to generate a PEA.
Based on current knowledge and assumptions, the results of this study show that the project is economic (within the very preliminary parameters of a PEA) and should be advanced to the next level of study by conducting the work indicated in the recommendations section.
As with almost all mining ventures, there are a large number of risks and opportunities that can affect the outcome of the Tepal project. Most of these risks and opportunities are based on a lack of scientific information (test results, drill results, etc.) or the lack of control over external drivers (metal price, exchange rates, etc.)..
Subsequent higher-level engineering studies will need to further refine these risks and opportunities, identify new ones and define mitigation or opportunity implementation plans.
While a significant amount of information is still required to do a complete assessment, at this point there do not appear to be any fatal flaws for the project.

SRK Consulting Tepal PEA Technical Report Page ix
GED/HA Tepal PEA Technical Report_2CG020 000_GD_20101101.docx, Nov. 1, 10, 6:24 PM Effective Date: October 8, 2010
The study met it its original objective of providing a preliminary review of the potential economic viability of the Tepal project.
Recommendations
It is recommended that the project be advanced to the preliminary feasibility study stage after a definition drilling program is conducted to attempt to convert inferred resources into indicated or measured resources. The cost of the definition drilling program, pre-feasibility study and associated field and lab work is estimated to be $6M.

SRK Consulting Tepal PEA Technical Report Page x
GED/HA Tepal PEA Technical Report_2CG020 000_GD_20101101.docx, Nov. 1, 10, 6:24 PM Effective Date: October 8, 2010
Table of Contents
Executive Summary ...................................................................................................................... i
1 Introduction .................................................................................................................. 1
2 Reliance on Other Experts .......................................................................................... 3
3 Property Description and Location ............................................................................ 4 3.1 Property Description and Location ...................................................................................... 4 3.2 Mineral Rights ..................................................................................................................... 4
4 Accessibility, Climate, Local Resources, Infrastructure and Physiography ........ 10
5 History ......................................................................................................................... 12
6 Geological Setting ...................................................................................................... 14 6.1 Regional Geology .............................................................................................................. 14 6.2 Property Geology .............................................................................................................. 14
7 Deposit Types ............................................................................................................ 17 7.1 Deposit Type ..................................................................................................................... 17
8 Mineralization ............................................................................................................. 19 8.1 Mineralization .................................................................................................................... 19 8.2 Alteration ........................................................................................................................... 20
9 Exploration ................................................................................................................. 22 9.1 INCO.. ............................................................................................................................... 22 9.2 Teck… ............................................................................................................................... 22
9.2.1 Hecla ..................................................................................................................................... 23 9.3 Exploration by Arian .......................................................................................................... 24 9.4 Exploration by Geologix .................................................................................................... 24
10 Drilling ......................................................................................................................... 26 10.1.1 INCO Drilling.......................................................................................................................... 26 10.1.2 Teck Drilling ........................................................................................................................... 28
10.2 Hecla Drilling ..................................................................................................................... 31 10.3 Arian Drilling ...................................................................................................................... 33 10.4 Drill Hole Summary ........................................................................................................... 36 10.5 Geologix Drilling ................................................................................................................ 37
11 Sampling Method and Approach .............................................................................. 38 11.1 INCO Program .................................................................................................................. 38 11.2 Teck Program .................................................................................................................... 38 11.3 Hecla Program .................................................................................................................. 38 11.4 Arian Program ................................................................................................................... 40 11.5 Geological Core Logging ................................................................................................... 41 11.6 Survey ............................................................................................................................... 42 11.7 Core Recovery .................................................................................................................. 42
11.7.1 Specific Gravity ..................................................................................................................... 43

SRK Consulting Tepal PEA Technical Report Page xi
GED/HA Tepal PEA Technical Report_2CG020 000_GD_20101101.docx, Nov. 1, 10, 6:24 PM Effective Date: October 8, 2010
11.8 Geologix ............................................................................................................................ 45
12 Sample Preparation, Analyses and Security ........................................................... 46 12.1 INCO Program .................................................................................................................. 46 12.2 Teck Program .................................................................................................................... 46 12.3 Hecla Program .................................................................................................................. 46 12.4 Arian Program ................................................................................................................... 47
12.4.1 Previous Analytical Techniques ............................................................................................ 47 12.4.2 Sample Preparation ............................................................................................................... 48 12.4.3 Sample Analysis .................................................................................................................... 48
12.5 Geologix Program ............................................................................................................. 50
13 Historical Data Verification ....................................................................................... 52 13.1 QA/QC ............................................................................................................................... 52
13.1.1 Blanks .................................................................................................................................... 53 13.1.2 Standard Samples ................................................................................................................. 54 13.1.3 Duplicates .............................................................................................................................. 58 13.1.4 QA/QC Conclusions .............................................................................................................. 60 13.1.5 Analytical Laboratories .......................................................................................................... 60
13.2 Previous Howe Verification Sampling ............................................................................... 61
14 Data Verification ......................................................................................................... 64
15 Mineral Processing and Metallurgical Testing ........................................................ 66 15.1 Introduction ....................................................................................................................... 66 15.2 Historical Background ....................................................................................................... 66
15.2.1 The International Nickel Company of Canada, Limited (INCO) ............................................ 67 15.2.2 Teck Corporation (Teck) ........................................................................................................ 67
15.3 Current Metallurgical Program .......................................................................................... 68 15.3.1 Sample Selection .................................................................................................................. 68 15.3.2 Metallurgical Testing at G&T Metallurgical Services, Ltd. (G&T) .......................................... 74 15.3.3 Leach Testwork at McClelland Laboratories, Inc. (MLI) ........................................................ 81
15.4 Metallurgical QA/QC ......................................................................................................... 95 15.4.1 G&T ....................................................................................................................................... 96 15.4.2 MLI ......................................................................................................................................... 96
15.5 Conclusions ....................................................................................................................... 97 15.5.1 Sulphide Ore Processing ....................................................................................................... 97 15.5.2 Oxide Ore Processing ........................................................................................................... 98
16 Mineral Resource and Mineral Reserve Estimates ................................................ 100 16.1 Historical Mineral Resource and Mineral Reserve Estimates ......................................... 100
16.1.1 INCO Historical Resource Estimate .................................................................................... 100 16.1.2 Teck Historical Resource Estimate ..................................................................................... 101 16.1.3 Hecla Historical Resource Estimate .................................................................................... 103 16.1.4 1Howe Mineral Resource Estimates (April 2008) ............................................................... 103
16.2 Howe Mineral Resource Update (September 2008) ....................................................... 104 16.2.1 Data Summary .................................................................................................................... 104 16.2.2 Data Validation .................................................................................................................... 104 16.2.3 Input Data ............................................................................................................................ 105 16.2.4 Classical Statistical Analysis ............................................................................................... 107 16.2.5 Domain Interpretation .......................................................................................................... 108 16.2.6 Geostatistics ........................................................................................................................ 111 16.2.7 Block Modelling ................................................................................................................... 113 16.2.8 Resource Classification ....................................................................................................... 116 16.2.9 Model Validation .................................................................................................................. 118

SRK Consulting Tepal PEA Technical Report Page xii
GED/HA Tepal PEA Technical Report_2CG020 000_GD_20101101.docx, Nov. 1, 10, 6:24 PM Effective Date: October 8, 2010
16.2.10 Resource Estimate Reporting ......................................................................................... 120
17 Other Relevant Data and Information ..................................................................... 124 17.1 Geotechnical Information ................................................................................................ 124
17.1.1 Slope Design Review .......................................................................................................... 124
18 Additional Requirements for Technical Reports on Development Properties and Production Properties ............................................................................................. 127 18.1 Mining Operations ........................................................................................................... 127
18.1.1 Whittle™ Pit Optimization .................................................................................................... 127 18.1.2 Economic Pit Limit ............................................................................................................... 129 18.1.3 Cut-off Grade ....................................................................................................................... 129 18.1.4 Optimization Parameters and Results ................................................................................. 129 18.1.5 Mine Design......................................................................................................................... 138 18.1.6 Production Schedule ........................................................................................................... 142
18.2 Waste Management Facilities ......................................................................................... 161 18.2.1 Waste Rock Facilities (“WRF”) ............................................................................................ 161
18.3 Recoverability .................................................................................................................. 166 18.4 Markets ........................................................................................................................... 166 18.5 Contracts ......................................................................................................................... 168 18.6 Environmental Considerations ........................................................................................ 168
18.6.1 Physical Environment .......................................................................................................... 168 18.6.2 Biological Environment ........................................................................................................ 171 18.6.3 Socio-Economic Context ..................................................................................................... 173 18.6.4 Permitting ............................................................................................................................ 175 18.6.5 Summary Conclusions ........................................................................................................ 175
18.7 Taxes. ............................................................................................................................. 176 18.8 Capital and Operating Cost Estimates ............................................................................ 176
18.8.1 Operating Cost Estimate ..................................................................................................... 176 18.8.2 Capital Cost Estimate .......................................................................................................... 178
Owner’s Costs ......................................................................................................................... 183 EPCM and Contingency .......................................................................................................... 184 18.9 Economic Analysis .......................................................................................................... 184
18.9.1 Assumptions ........................................................................................................................ 184 18.9.2 Results ................................................................................................................................. 185 18.9.3 Break-even Metal Prices ..................................................................................................... 185 18.9.4 Sensitivity Analysis .............................................................................................................. 190
18.10 Payback ................................................................................................................ 192 18.11 Mine Life ............................................................................................................... 192
19 Interpretation and Conclusions .............................................................................. 193 19.1 Risks.. .................................................................................................................. ……….193 19.2 Opportunities ................................................................................................................... 196
20 Recommendations ................................................................................................... 197 20.1 General Recommendations ............................................................................................ 197 20.2 Recommendations for Further Metallurgical Testing....................................................... 198
20.2.1 Sulphide Ore Processing ..................................................................................................... 198 20.2.2 Oxide Ore Processing ......................................................................................................... 198
21 Illustrations ............................................................................................................... 200
22 Acronyms, Abbreviations and Definitions ............................................................. 201

SRK Consulting Tepal PEA Technical Report Page xiii
GED/HA Tepal PEA Technical Report_2CG020 000_GD_20101101.docx, Nov. 1, 10, 6:24 PM Effective Date: October 8, 2010
23 References ................................................................................................................ 202
24 Date and Signature Page ......................................................................................... 204

SRK Consulting Tepal PEA Technical Report Page xiv
GED/HA Tepal PEA Technical Report_2CG020 000_GD_20101101.docx, Nov. 1, 10, 6:24 PM Effective Date: October 8, 2010
List of Tables Table 1: Table 1: September 2008 Mineral Resource Estimate (ACA Howe) ................................... iv Table 2: PEA Table Project LOM Resource (@$5.23/t NSR Cut-off ................................................. vi Table 3: LOM Mine Production Schedule – Tepal Project ................................................................ vi Table 4: Operating Cost Estimate .................................................................................................... vii Table 5: Capital Cost Estimate Summary ....................................................................................... viii Table 6: Base Case LOM Key Economic Results ........................................................................... viii Table 7: Combined Copper and Gold Prices that Yield a $0 NPV5%............................................... viii Table 1.1: Qualified Persons and Site Visit Information .................................................................... 2 Table 3.1: Concession Titles for Tepal .............................................................................................. 4 Table 3.2: Staged Payment Requirements ....................................................................................... 5 Table 3.3: Payment Schedule for Tepal Property ............................................................................. 6 Table 10.1: Summary of INCO Diamond Drilling Results ................................................................ 27 Table 10.2: Summary of Teck Reverse Circulation Drilling Results ................................................ 30 Table 10.3: Summary of Hecla Reverse Circulation Drilling Results .............................................. 32 Table 10.4: Arian Tepal Drillhole Summary ..................................................................................... 36 Table 11.1: Tepal Bulk Density Data ............................................................................................... 44 Table 11.2: Domain Bulk Densities ................................................................................................. 44 Table 12.1: Tepal Sample Types .................................................................................................... 47 Table 12.2: Tepal Sample Analysis Methodology ........................................................................... 49 Table 13.1: Assay QA/QC details .................................................................................................... 53 Table 13.2: Tepal CRM Assessment List ........................................................................................ 54 Table 13.3: Summary of Arian Twin Drill Holes ............................................................................... 61 Table 13.4: Howe’s previous data verification sampling ................................................................. 63 Table 15.1: INCO Flotation Recoveries and Grade ......................................................................... 67 Table 15.2: Drill Core Identification for Initial Set of G&T Samples ................................................. 69 Table 15.3: Drill Core Identification for Composite NSX-2 .............................................................. 70 Table 15.4: Drill Core Identification for Composites NSX-3 and SSX-2 .......................................... 71 Table 15.5: Drill Core Identification for MLI Bottle Roll Tests .......................................................... 72 Table 15.6: Drill Core Identification for MLI Oxide Column Test Composites ................................. 73 Table 15.7: Comparison of Composite Sample Grades and Resource Grades .............................. 74 Table 15.8: Chemical and Mineralogical Makeup of the Tepal Composites ................................... 76 Table 15.9: Comparison of Head Assays for the G&T Composites ................................................ 79 Table 15.10: Comparison of Composite Mineralogy ....................................................................... 79 Table 15.11: Comparison of North and South Zone Concentrate Quality ....................................... 81 Table 15.12: Summary of Bottle Roll Results for All Tests .............................................................. 83 Table 15.13: Comparison of Gold Head Assays for Column Composites ....................................... 86 Table 15.14: Comparison of Copper Head Assays for Column Composites .................................. 87 Table 15.15: Summary of Column Leach Results ........................................................................... 87 Table 15.16: Comparison of Key Column and Bottle Roll Results .................................................. 88 Table 15.17: Leach Cycle Time to Reach Various Extraction Levels .............................................. 89 Table 15.18: Size Distribution and Gold Recovery for NOXCL01 (P1) ........................................... 90 Table 15.19: Size Distribution and Gold Recovery for NOXCL02 (P2) ........................................... 91 Table 15.20: Size Distribution and Gold Recovery for SOXCL01 (P3) ........................................... 91 Table 15.21: Comparison of Copper Assays in the Column Heads and Residues ......................... 92 Table 15.22: Parameters Related to Copper Build-up in the Leach Circuit ..................................... 93 Table 15.23: Summary of results from static acid/base accounting tests ....................................... 94 Table 15.24: Summary of Concentrate Leach Results .................................................................... 95 Table 16.1: DDH Intercepts Used in INCO Estimates .................................................................. 101 Table 16.2: Summary of Historic Teck Estimates ......................................................................... 102 Table 16.3: Tepal MicroMine Input Data Files ............................................................................... 106

SRK Consulting Tepal PEA Technical Report Page xv
GED/HA Tepal PEA Technical Report_2CG020 000_GD_20101101.docx, Nov. 1, 10, 6:24 PM Effective Date: October 8, 2010
Table 16.4: Tepal Descriptive Statistics ........................................................................................ 107 Table 16.5: Tepal Domain Wireframes (September 2008) ............................................................ 109 Table 16.6: Tepal Top Cut Analysis Summary .............................................................................. 111 Table 16.7: Tepal Mineralised Domain Statistics – Au .................................................................. 111 Table 16.8: Tepal Mineralised Domain Statistics – Cu .................................................................. 112 Table 16.9: Tepal Block Model Extents ......................................................................................... 113 Table 16.10: Domain Geometries and Search Parameters .......................................................... 113 Table 16.11: Tepal Block Model Interpolation Parameters ........................................................... 115 Table 16.12: Block Model Attributes .............................................................................................. 115 Table 16.13: Interpolation Run Details .......................................................................................... 116 Table 16.14: Au Composite Mean versus Block Mean ................................................................. 119 Table 16.15: Block Model Volumes versus Wireframe Volumes ................................................... 119 Table 16.16: Tepal Deposit - Total Resource Estimate Figures .................................................... 120 Table 17.1: Slope Angle Recommendations ................................................................................. 125 Table 18.1: NSR Parameters Used in the Whittle™ Optimization Model ...................................... 128 Table 18.2: Operating Costs Used for Pit Optimization ................................................................. 129 Table 18.3: Whittle™ Pit Optimization Results .............................................................................. 131 Table 18.4: Resources Extracted in LOM Plan by Classification .................................................. 136 Table 18.5: Material by Type ......................................................................................................... 136 Table 18.6: Mining Equipment ....................................................................................................... 141 Table 18.7: Phase Tonnages and Grades .................................................................................... 143 Table 18.8: Proposed Production Schedule .................................................................................. 148 Table 18.9: End of Period Bench Elevations (masl) ...................................................................... 151 Table 18.10: Specifications of TMF Options ................................................................................. 163 Table 18.11: Estimated Copper and Gold Recovery by Process .................................................. 166 Table 18.12: Planned Annual Concentrate Production ................................................................. 167 Table 18.13: Annual Estimated Doré Production .......................................................................... 168 Table 18.14: Mine Operating Cost Estimate by Function .............................................................. 177 Table 18.15: Summary of Operating Costs for the Mill Circuit ...................................................... 177 Table 18.16: Summary of Operating Costs for the Leach Circuit .................................................. 178 Table 18.17: Capital Cost Estimate Summary .............................................................................. 179 Table 18.18: Mine Capital Cost Estimate ...................................................................................... 180 Table 18.19: Infrastructure and Electrical Power Capital Estimate ............................................... 181 Table 18.20: Flotation Capital Cost Estimate ................................................................................ 182 Table 18.21: Heap Leach – SART Facility Cost Estimate ............................................................. 182 Table 18.22: Tailing Management Facility Cost Estimate ............................................................. 183 Table 18.23: Reclamation Closure Cost Estimate ......................................................................... 183 Table 18.24: Base Case LOM Key Economic Results .................................................................. 185 Table 18.25: Combined Copper and Gold Prices that Yield a $0 NPV5% (Break Even Economics)186 Table 18.26: EBITDA Economic Analysis ..................................................................................... 187 Table 18.27: EBITDA Economic Analysis (continued) .................................................................. 188 Table 18.28: EBITDA Economic Analysis (continued) .................................................................. 189 Table 18.29: Sensitivity Analysis Results ...................................................................................... 190 Table 18.30: NPV5% and IRR Results for Varying Metal Prices .................................................... 191 Table 19.1: Internal Project Risks ................................................................................................. 194 Table 19.2: External Project Risks ................................................................................................ 195 Table 19.3: Project Opportunities .................................................................................................. 196

SRK Consulting Tepal PEA Technical Report Page xvi
GED/HA Tepal PEA Technical Report_2CG020 000_GD_20101101.docx, Nov. 1, 10, 6:24 PM Effective Date: October 8, 2010
List of Figures
Figure 3.1: Location Map of the Tepal Property (taken from Priesmeyer, 2007) .............................. 7 Figure 3.2: Tepal Regional View of Planned Facilities (SRK 2010) .................................................. 8 Figure 3.3: Planned Facilities Layout (SRK, 2010) ........................................................................... 9 Figure 6.1: Geological Map of the Tepal Property Including Major Concession Boundaries (adapted
from Priesmeyer, 2007) ................................................................................................. 16 Figure 10.1: Tepal Historical Drill Plan ............................................................................................ 28 Figure 10.2: Location Plan – All Arian Phase 1 Drill Holes and Mineralised Domains .................... 33 Figure 10.3: Location Plan – All Northern Domain Drill Holes ......................................................... 34 Figure 10.4: Hole Location Plan – All Southern Domain Drill Holes ................................................ 35 Figure 11.1: Hecla Rock Chip Cu Geochemistry Map for Tepal North Zone .................................. 39 Figure 11.2: Hecla Rock Chip Au Geochemistry Map for Tepal North Zone ................................... 40 Figure 11.3: Arian Phase 1 Core Recovery Data ............................................................................ 43 Figure 13.1: Control Plot for CRM CU 139-Gold ............................................................................. 55 Figure 13.2: Control Plot for CRM CU150-Gold .............................................................................. 55 Figure 13.3: Control Plot for CRM OX14-Gold ................................................................................ 56 Figure 13.4: Control Plot for CRM CU139-Copper .......................................................................... 56 Figure 13.5: Control Plot for CRM CU150-Copper .......................................................................... 57 Figure 13.6: Inspectorate Coarse and Pulp Duplicates - Gold ........................................................ 59 Figure 13.7: ALS Chemex Coarse and Pulp Duplicates - Copper .................................................. 59 Figure 15.1: Typical Leach Curve for Fast Leaching Sample (MEX5601 or CY-1) ......................... 84 Figure 15.2: Atypical Leach Curve with Pseudo-Parabolic Form (MEX5605 or CY-2) ................... 85 Figure 15.3: Column Leach Curve for Gold and Copper in Composite NOXCL02 (P2) .................. 89 Figure 15.4: Leach Curves for NOXCL01 Showing the Slow Initial Leach Rate ............................. 89 Figure 16.1: Domain Wireframes (looking southwest from above) ............................................... 110 Figure 16.2: Domain Wireframes (looking southwest from below) ................................................ 110 Figure 16.3: Block Model – Northern Domain - Au (looking oblique NE) ...................................... 121 Figure 16.4 : Block Model – Southern Domain - Au (looking oblique NE) ..................................... 121 Figure 16.5: Block Model – Northern Domain - Cu (looking oblique NE) ...................................... 122 Figure 16.6: Block Model – Southern Domain - Cu (looking oblique NE) ..................................... 122 Figure 16.7: Block Model – Southern Domain – Resource Category (looking oblique NE) .......... 123 Figure 16.8: Block Model – Southern Domain – resource category (looking oblique NE) ............ 123 Figure 17.1: Down-hole RQD Data – North Zone (left) South Zone (right) ................................... 125 Figure 17.2: Summary of Slope Angle Recommendations ........................................................... 126 Figure 18.1: Whittle™ Pit Optimization Results ............................................................................ 132 Figure 18.2: Incremental Whittle™ Value Results ......................................................................... 133 Figure 18.3: Incremental Whittle™ Tonnage Results .................................................................... 134 Figure 18.4: Typical Longitudinal Section (looking west) .............................................................. 137 Figure 18.5: Preliminary Pit Designs - Tepal Deposit .................................................................... 139 Figure 18.6: Cross Section of Tepal North Pit ............................................................................... 140 Figure 18.7: Cross Section of Tepal South Pit .............................................................................. 140 Figure 18.8: Open Pit Phase Summary ......................................................................................... 144 Figure 18.9: Phase Design in Isometric View (looking NW) .......................................................... 145 Figure 18.10: Tepal Overall Site Plan ........................................................................................... 146 Figure 18.11: Period Tonnages and Strip Ratio ............................................................................ 149 Figure 18.12: Material Tonnages and Strip Ratio .......................................................................... 150 Figure 18.13: Period Tonnages and Strip Ratio ............................................................................ 151 Figure 18.14: End of Year 1 .......................................................................................................... 152 Figure 18.15: End of Year 2 .......................................................................................................... 153 Figure 18.16: End of Year 3 .......................................................................................................... 154

SRK Consulting Tepal PEA Technical Report Page xvii
GED/HA Tepal PEA Technical Report_2CG020 000_GD_20101101.docx, Nov. 1, 10, 6:24 PM Effective Date: October 8, 2010
Figure 18.17: End of Year 4 .......................................................................................................... 155 Figure 18.18: End of Year 5 .......................................................................................................... 156 Figure 18.19: End of Year 6 .......................................................................................................... 157 Figure 18.20: End of Year 7 .......................................................................................................... 158 Figure 18.21: End of Year 8 .......................................................................................................... 159 Figure 18.22: Final Pit Configuration ............................................................................................. 160 Figure 18.23: TMF Site Alternatives .............................................................................................. 164 Figure 18.24: Tailings Dam Design Alternatives ........................................................................... 165 Figure 18.25: Sensitivity Analysis Results ..................................................................................... 191
List of Appendices
Appendix 1: Geotechnical Slope Design Review Appendix 2: Tailings Management Facility Options

SRK Consulting Tepal PEA Technical Report Page 1
GD/ha Tepal PEA Technical Report_2CG020 000_GD_20101101.docx Effective Date: October 8, 2010
1 Introduction This Technical Report was compiled by SRK Consulting (Canada) Inc. for Geologix Explorations Inc.
The purpose of the Technical Report is to describe the results of a preliminary economic assessment (“PEA”) conducted on the Geologix’s Tepal gold-copper project located in Michoacán, Mexico.
The reader is advised that the preliminary economic assessment summarized in this technical report is only intended to provide an initial, high-level review of the project potential. The PEA mine plan and economic model include the use of a significant portion of inferred resources which are considered to be too speculative to be used in an economic analysis except as allowed for in PEA studies. There is no guarantee that inferred resources can be converted to indicated or measured resources and, as such, there is no guarantee that the project economics described herein will be achieved.
Several sections of this report are taken from the two preceding technical reports written by ACA Howe International Ltd. titled “Resource Estimation Update for the Tepal Gold-Copper Prospect, Michoacán, Mexico” dated Sept. 24, 2008 for Arian Silver Corporation and “Resource Estimation Update Revised for the Tepal Gold-Copper Prospect, Michoacán, Mexico” by dated November 4, 2009 for Geologix. The previous ACA Howe report information is referenced as appropriate. Galen White, formerly of ACA Howe and now Principal Geologist – CSA global (UK) Ltd., has reviewed ACA Howe sections and provide Qualified Person (“QP”) sign-off. Other references can be found in Section 23.
The qualified persons (“QPs”) responsible for this report are shown in Table 1.1 along with their responsibilities and site visit dates and descriptions. Each QP in this report takes sole responsibility for their work as outlined in their QP Certificates.
All units in this report are based on the International System of Units (“SI”), except industry standard units, such as troy ounces for the mass of precious metals. All currency values are United States Dollars (“US$” or “$”) unless otherwise stated.
This report uses abbreviations and acronyms common within the minerals industry. Explanations are located in Section 23.

SRK Consulting Tepal PEA Technical Report Page 2
GD/ha Tepal PEA Technical Report_2CG020 000_GD_20101101.docx Effective Date: October 8, 2010
Table 1.1: Qualified Persons and Site Visit Information
Qualified Person Responsibility Site Visit Date Scope of Site Visit
Dino Pilotto, P.Eng. SRK
Mining, Infrastructure and Waste Management
July 8-11, 2010
Drive from Guadalajara (the largest city in the region) to the project site. Tour of the project area to inspect potential locations for the open pit, tailings management facility, waste dump and plant site. Review of representative diamond drill for geologic and geotechnical characteristics. Visited the adjacent town, Tepalcatepec, to view the local infrastructure including the regional electrical substation. Traveled to Ixtapa to inspect road conditions and view the facilities at the port of Lázaro Cárdenas.
Bruce Murphy, FSAIMM SRK
Geotechnical Considerations
July 8-11, 2010
W. Joseph Schlitt, P.Eng. Hydrometal
Metallurgy and Mineral Processing
July 8-11, 2010
Galen White CSA (former ACA Howe)
Geology and Mineral Resource Estimation
June 18-20, 2008
Tour of the project site and review of drill program. Review of data collection methodologies Review of sampling techniques and assay QA/QC protocols. Review and verify project data.
Epitacio Robelo, P.E. Clifton Associates
Environmental Considerations
3 times in 2010 General reconnaissance of the project area
Gordon Doerksen, P.Eng. SRK
Economic model, report compilation n/a
Mr. Doerksen is only responsible for the economic aspects and compilation of this report and relied on the site inspection done by Dino Pilotto, P.Eng. and Bruce Murphy, M.Sc., of SRK.
Mr. Galen White, visited the project between the 18th and 20th June 2008 as an ACA Howe Senior Geologist, in order to see the project first hand, review data collection methodologies, review sampling techniques and assay QA/QC protocols, and to review and verify project data. In addition time was spent discussing the recommendations to come out of the initial resource estimation study by Howe and reviewing the Phase 2 resource development and exploration strategy.

SRK Consulting Tepal PEA Technical Report Page 3
GD/ha Tepal PEA Technical Report_2CG020 000_GD_20101101.docx Effective Date: October 8, 2010
2 Reliance on Other Experts Preparation of this report is based upon public and private information provided by Geologix and information provided in various previous Technical Reports listed in Section 23 of this report.
This report also relies upon the work and opinions of and data from some non-QP experts. The following list outlines the information provided by other experts, who are independent to the authors:
• Flotation and comminution test work by G&T Metallurgical Services Ltd.
• Heap leaching test work completed by McClelland Laboratories, Inc.
The authors have carried out due diligence reviews of the information provided to them by Geologix and others for preparation of this report and are satisfied that the information was accurate at the time of the report and that the interpretations and opinions expressed in them were reasonable and based on current understanding of mining and processing techniques and costs, economics, mineralization processes and the host geologic setting. The authors have made reasonable efforts to verify the accuracy of the data relied on in this report.
The results and opinions expressed in this report are conditional upon the aforementioned information being current, accurate, and complete as of the date of this report, and the understanding that no information has been withheld that would affect the conclusions made herein the authors reserve the right, but will not be obliged, to revise this report and conclusions if additional information becomes known to the authors subsequent to the date of this report.
Neither SRK nor the authors of this technical report are qualified to provide extensive comment on legal issues associated with the Tepal property. As such, portions of Section 3 dealing with the types and numbers of mineral tenures and licenses, the nature and extent of Geologix’s title and interest in the Tepal property, the terms of any royalties, back-in rights, payments or other agreements and encumbrances to which the property is subject are descriptive in nature and are provided exclusive of a legal opinion.

SRK Consulting Tepal PEA Technical Report Page 4
GD/ha Tepal PEA Technical Report_2CG020 000_GD_20101101.docx Effective Date: October 8, 2010
3 Property Description and Location The following sections are taken from Priesmeyer, 2007.
3.1 Property Description and Location
The Tepal Property is located in the municipality of Tepalcatepec, Michoacán state in southwestern Mexico near the town of Tepalcatepec (Figure 3.1). The property is 70 km west of Apatzingán and 170 km south of Guadalajara, one of the largest cities in Mexico. The property is centered at the approximate UTM grid coordinates of 2,116,995N and 716,594 E at an average elevation of 550 metres (“m”).
The property consists of six contiguous concessions totaling 13,843.2 hectares (“ha”) (Figure 3.3, Table 3.1). Arian recently acquired a concession called Tepal 2, which was permitted over free ground and completely surrounded the five smaller concessions. The area of the Tepal 2 concession is 12,437.2 ha.
Table 3.1: Concession Titles for Tepal Name of Concession
Title number
Area(ha)
Date of Title
Expiration Date Owner
La Esperanza Fracción 1 216873 120.00 5 June 2002 4 June 2052 Minera Tepal S.A. de C.V.
Tepal 219924 986.00 7 May 2003 6 May 2053 Minera Tepal S.A. de C.V. Tepal Fracción 1 216874 140.00 5 June 2002 4 June 2052 Minera Tepal S.A. de C.V. Tepal Fracción 2 216875 70.00 5 June 2002 4 June 2052 Minera Tepal S.A. de C.V. Tepal Fracción 3 216876 90.00 5 June 2002 4 June 2052 Minera Tepal S.A. de C.V.
Tepal 2 229354 12,437.2 12 Apr 2007 12 Apr 2057 Arian Silver de Mexico S.A. de C.V
Total 13,843.2
The six concessions listed in Table 3.1 would have been surveyed in order for the titles to be issued as this is a requirement under Mexican law. Arian has not surveyed the concessions independently.
3.2 Mineral Rights
Arian signed an agreement with Minera Tepal S.A. de C.V. (“Minera Tepal”) for the rights to the concessions described in Table 3.2. Under the agreement, Arian must pay a total of US $5,000,000 over a five year period for a 100% interest in the property. Arian can exercise the option or terminate the agreement at any time. The payment schedule is outlined in Table 3.2.

SRK Consulting Tepal PEA Technical Report Page 5
GD/ha Tepal PEA Technical Report_2CG020 000_GD_20101101.docx Effective Date: October 8, 2010
On September 24, 2009 the Company signed an agreement (the “Arian Letter Agreement”) with Arian Silver Corp. (“Arian”) whereby the Company was granted the exclusive rights to purchase Arian’s 100% interest in the Tepal Gold-Copper Project in the state of Michoacán, Mexico. Under the terms of the agreement, the Company has the option to complete the purchase of 100% of the property, subject to a 2.5% net smelter return (“NSR”) royalty, by delivering to Arian US$3.0 million in staged payments before February 23, 2011 and assuming the balance of Arian’s obligations under the terms of the underlying property option agreement.
The principal terms of the Arian Letter Agreement are as follows:
The Company advanced to Arian the sum of US$517,500 which was used by Arian to complete an outstanding underlying option payment due to Minera Tepal S.A. de C.V. (“Minera Tepal”) (US$450,000 plus the applicable 15% value-added tax of US$67,500). The advance was made by the Company to Arian as an interest free loan and was due for repayment on April 23, 2010 unless the Company elected to proceed with the option to purchase the Tepal Property, in which case the sum of the loan would be applied against the eventual purchase price.
In consideration for the loan, Arian granted the Company a five month exclusivity period to permit the Company to undertake due diligence of the Tepal Property. Following completion of the due diligence review of the property, the Company had the option to elect, at any time within the five-month exclusivity period, to acquire the Tepal Property from Arian on an option basis for a total consideration of US$3.0 million, payable to Arian in two installments:
• An initial payment of US$1.0 million, plus forgiveness of the interest free loan of US$450,000, for a total of US$1.45 million on or before February 23, 2010 (paid); and
• A payment of US$1.55 million on or before February 23, 2011.
At the Company’s election, each such payment may be made in cash, or up to 50% in the Company’s Common Shares valued at the 10-day average closing price of the Common Shares immediately prior to the time of each payment.
The Company also assumed the balance of Arian’s obligations under the terms of an underlying property option agreement subject to a 2.5% NSR and is responsible for completing staged payments to the underlying property vendor as follows:
Table 3.2: Staged Payment Requirements
Date Payment amount
6-Jun-10 US$ 900,000 (paid)
6-Jun-11 US$ 2,300,000
Total US$ 3,200,000
SRK Consulting Tepal PEA Technical Report Page 6
GD/ha Tepal PEA Technical Report_2CG020 000_GD_20101101.docx Effective Date: October 8, 2010
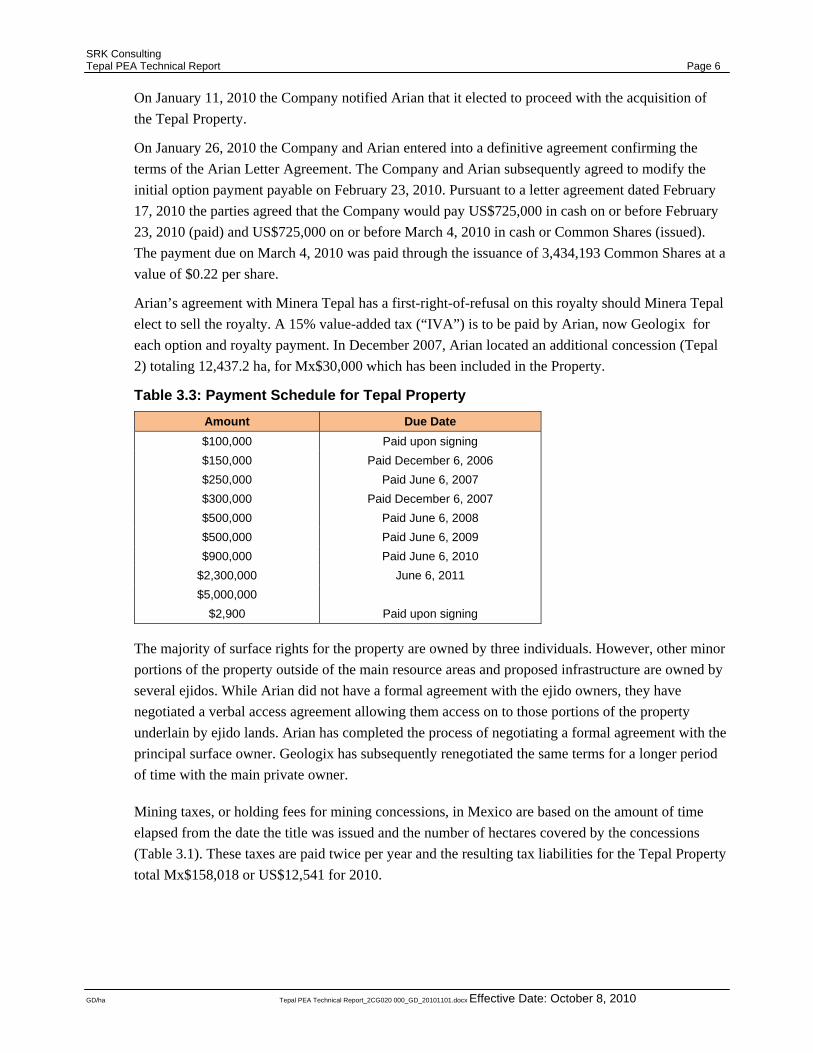
On January 11, 2010 the Company notified Arian that it elected to proceed with the acquisition of the Tepal Property.
On January 26, 2010 the Company and Arian entered into a definitive agreement confirming the terms of the Arian Letter Agreement. The Company and Arian subsequently agreed to modify the initial option payment payable on February 23, 2010. Pursuant to a letter agreement dated February 17, 2010 the parties agreed that the Company would pay US$725,000 in cash on or before February 23, 2010 (paid) and US$725,000 on or before March 4, 2010 in cash or Common Shares (issued). The payment due on March 4, 2010 was paid through the issuance of 3,434,193 Common Shares at a value of $0.22 per share.
Arian’s agreement with Minera Tepal has a first-right-of-refusal on this royalty should Minera Tepal elect to sell the royalty. A 15% value-added tax (“IVA”) is to be paid by Arian, now Geologix for each option and royalty payment. In December 2007, Arian located an additional concession (Tepal 2) totaling 12,437.2 ha, for Mx$30,000 which has been included in the Property.
Table 3.3: Payment Schedule for Tepal Property
Amount Due Date $100,000 Paid upon signing $150,000 Paid December 6, 2006 $250,000 Paid June 6, 2007 $300,000 Paid December 6, 2007 $500,000 Paid June 6, 2008 $500,000 Paid June 6, 2009 $900,000 Paid June 6, 2010
$2,300,000 June 6, 2011 $5,000,000
$2,900 Paid upon signing
The majority of surface rights for the property are owned by three individuals. However, other minor portions of the property outside of the main resource areas and proposed infrastructure are owned by several ejidos. While Arian did not have a formal agreement with the ejido owners, they have negotiated a verbal access agreement allowing them access on to those portions of the property underlain by ejido lands. Arian has completed the process of negotiating a formal agreement with the principal surface owner. Geologix has subsequently renegotiated the same terms for a longer period of time with the main private owner.
Mining taxes, or holding fees for mining concessions, in Mexico are based on the amount of time elapsed from the date the title was issued and the number of hectares covered by the concessions (Table 3.1). These taxes are paid twice per year and the resulting tax liabilities for the Tepal Property total Mx$158,018 or US$12,541 for 2010.

SRK Consulting Tepal PEA Technical Report Page 7
GD/ha Tepal PEA Technical Report_2CG020 000_GD_20101101.docx Effective Date: October 8, 2010
Assessment work is calculated on the same basis as property taxes. The assessment work commitment for the property for 2009 is estimated to be Mx$1,505,927 or US$119,518. It should be noted that these amounts are estimated and will change when new rate schedules are issued by the Mexican government.
Clifton Associates is not aware of any environmental issues currently relating to the property.”
Figure 3.1: Location Map of the Tepal Property (taken from Priesmeyer, 2007)

SRK Consulting Tepal PEA Technical Report Page 8
GD/ha Tepal PEA Technical Report_2CG020 000_GD_20101101.docx Effective Date: October 8, 2010
Figure 3.2: Tepal Regional View of Planned Facilities (SRK 2010)

SRK Consulting Tepal PEA Technical Report Page 9
GD/ha Tepal PEA Technical Report_2CG020 000_GD_20101101.docx Effective Date: October 8, 2010
Figure 3.3: Planned Facilities Layout (SRK, 2010)

SRK Consulting Tepal PEA Technical Report Page 10
GD/ha Tepal PEA Technical Report_2CG020 000_GD_20101101.docx Effective Date: October 8, 2010
4 Accessibility, Climate, Local Resources, Infrastructure and Physiography The following section is modified from Priesmeyer, 2007.
“Access to the property is good. The nearest town is Tepalcatepec, located 15.5 km to the northeast of the property. Tepalcatepec is reached by paved highway from Morelia, en-route from Mexico City. The final 7.5 km of access to the property are over unimproved dirt roads. Total driving time to Tepalcatepec from Morelia is about 31/2 hours. Total driving time to the property from Tepalcatepec is about 30 minutes.
The climate of the region consists of a rainy season extending from June into October and a dry season extending from late November to May. Heavy rains during the rainy season can turn the dirt access roads to deep mud and produce wash outs making access difficult at times.
Average annual precipitation ranges from 500 mm to 700 mm. Daytime high temperatures range from 27°C in the December to February period to 38oC or 40oC in May and June. Average annual temperature is 28ºC to 30ºC.
The property lies in the steep hills on the northeast side of the Mexican Coastal Range at elevations between 500 to 700 m. The elevation of the primary area of mineralization on the property ranges from around 550 m to around 650 m. Vegetation consists of thorny brush, small trees and occasional cactus.
The property is large enough but some topographically suitable locations for the development of facilities such as waste dumps and tailings disposal areas may be limited by the presence of mineralization, whose extent is presently unknown. Further study will be required to determine the suitability of the present land position for the development of all the mining-related facilities but at the present level of knowledge, the site appears to be adequate.
Tepalcatepec is the town nearest the property. It has a population of approximately 30,000. Services available in Tepalcatepec include lodging, a number of small restaurants, gasoline stations, a variety of small hardware, grocery, and retail stores, and an open air market, making it a suitable base for operations.
Apatzingán, located approximately 55 km east of Tepalcatepec, has a population of around 90,000. It is the closest town with scheduled air service and can be reached via daily commuter flights from Guadalajara.
Morelia is the capital of Michoacán State and has a population of around 550,000. There are daily air connections with Mexico City and the United States. Morelia is connected to the nation’s motorway, or highway system, with Guadalajara and Mexico City within half a day’s drive.

SRK Consulting Tepal PEA Technical Report Page 11
GD/ha Tepal PEA Technical Report_2CG020 000_GD_20101101.docx Effective Date: October 8, 2010
There is a three phase power line of unknown capacity located seven km east of the main mineralised area. There is also a power line of unknown capacity located 3 km north of the property. There is no power on the property.
There is, however, a major power substation located 2 km east of the town of Tepalcatepec and 14 km from the area of the mineral resources on the property. The Comisión Federal de Electricidad (CFE), the federal power authority in Mexico indicates that sufficient power is available to meet the needs of the project and a power line between the substation and the project could be constructed and power provided from the local electrical grid.
There are numerous reservoirs in the region. The water feeds a system of canals and is used primarily for irrigation purposes. Water may be available to the property from this reservoir system. If not, water appears to be shallow since it was encountered during both previous reverse-circulation programs (Personal Communication, Luis Gonzáles Barragán). There are a number of wells in the area of the project and the water table is generally located approximately 3 m below the surface.
The dominant land use on the property consists of cattle and goat grazing but sorghum and corn are raised in areas suitable for arable farming.”

SRK Consulting Tepal PEA Technical Report Page 12
GD/ha Tepal PEA Technical Report_2CG020 000_GD_20101101.docx Effective Date: October 8, 2010
5 History The following section is modified from Priesmeyer, 2007.
The presence of a few small surface workings and several old generations of punto de partido, or concession survey monuments (beacons) in the area of the North and South Zones provide evidence of past exploration on the property. However, there is no anecdotal or written evidence of any production and nothing is known of this early period.
In 1972, the International Nickel Company of Canada, Ltd (“INCO”) recognized the Tepal and the Tizate gossans (Tizate is located approximately 1,400 m east of the North Zone) and associated copper mineralization (Copper Cliff, 1974). INCO worked through its Mexican subsidiary DRACO although the sole surviving report from this time period was prepared by Copper Cliff. Limited data remains from the INCO period.
INCO explored the property during the period 1972-1974 by means of surface geochemistry, IP geophysics and drilling. INCO developed a small non NI 43-101 compliant resource of 27 Mt averaging 0.33 % Cu and 0.65g/t Au but ultimately abandoned the property. INCO stressed that more drilling was required to further define the width of the mineralised zone.
Teck Resources Inc. (“Teck”) acquired the property in late 1992. Work completed by Teck include geologic mapping, the collection of over 200 rock samples for multi-element analysis, the construction of more than 60 km of grid line, the collection of 1,268 soil samples and 50 rock chip samples from the grid, the construction of 15 km of access road and the completion of 50 reverse-circulation holes totaling 8,168 m in four phases of work. Teck also undertook some metallurgical testing, which is described in Section 12.2 of the Priesmeyer report.
In 1994, Teck completed a non-NI 43-101 compliant resource estimate for the property. Results of the resource calculations are presented in Section 13.2 of the Priesmeyer report. The resource estimate is a polygonal block estimate based on the manual definition of polygonal blocks on computer drafted drill sections using manual composited intercept intervals. The total for all categories is 78.82 Mt grading 0.4 g/t Au and 0.249 % Cu with drill indicated resources totaling 55.84 million tonnes grading 0.514 g/t Au and 0.261% Cu. Of the 55.84 million tonnes drill indicated resource, 24.28 Mt averaging 0.545 g/t Au and 0.251 % Cu are in the South Zone and 31.56 Mt averaging 0.489 g/t Au and 0.269 % Cu are in the North Zone. It should be noted that the resource categories defined by Teck were drill indicated, drill inferred and projected do not directly correspond to the categories of mineral resources prescribed in NI43-101 but are broadly correlative with, measured, indicated and inferred resource categories as defined in CIM Definition Standards on Mineral Resources and Reserves (Canadian Institute of Mining, Metallurgy and Petroleum, 2004).

SRK Consulting Tepal PEA Technical Report Page 13
GD/ha Tepal PEA Technical Report_2CG020 000_GD_20101101.docx Effective Date: October 8, 2010
The historical estimate is believed reliable and a good approximation of the amount and grade of mineralization found on the property at the time the estimate was prepared. The historical estimate is no longer relevant as it precedes the estimates presented in this report.
In late 1996, Minera Hecla S.A. de C.V. (”Hecla”) visited the property and initiated a work program in the spring of 1997. Work by Hecla included the creation of a 1:2,000 scale topographic map from aerial photographs, a geologic mapping program, the collection of nearly 900 rock ship samples on a 50 m by 50 m grid, the re-analysis of 298 pulps from the Teck reverse-circulation drilling program, the completion of 17 reverse-circulation drill holes totaling 1,506 m and the completion of a resource estimate (Gómez-Tagle, 1997 and 1998).
Hecla’s expenditures on the property are unknown. Hecla’s primary focus on the property was as a large tonnage, low-grade gold target. Although all samples were analyzed for copper and gold, Hecla did not include copper in its resource estimate.
The work completed by Hecla is the best documented of all previous work and is described in Section 8.3.1 of the Priesmeyer report.
In 1997, Hecla completed a non-CIM compliant resource estimate for the property. The resource estimate is a polygonal block estimate based on manual definition of polygonal blocks on computer drafted drill sections using manual composited intercept intervals.
The results of the resource calculation for the North and South zones are detailed in Section 13.3 of the Priesmeyer report. The total resource for oxide and sulphide material is 9.063 Mt averaging 0.90 g/t Au and containing 262,359 ounces of gold. In addition to the resource for the North and South Zones, Hecla estimated a combined resource for the East and West Zones of 5.055 Mt averaging 0.36 g/t gold and containing 58,512 ounces of gold.”

SRK Consulting Tepal PEA Technical Report Page 14
GD/ha Tepal PEA Technical Report_2CG020 000_GD_20101101.docx Effective Date: October 8, 2010
6 Geological Setting The following section is taken from Priesmeyer, 2007.
6.1 Regional Geology
“The property is located within the Costal Ranges of south-western Mexico south of the Neogene Trans-Mexican Volcanic Belt. Basement rocks consist of Cretaceous to early Tertiary (?) intermediate intrusions (plutons, stocks and plugs) intruding weakly metamorphosed sedimentary and volcanic rocks of probable Jurassic to Cretaceous age. The Jurassic to Cretaceous sedimentary and volcanic rocks are part of an accreted Mesozoic island arc volcanosedimentary assemblage. At least some of the intrusive rocks are probably coeval with the volcanic units. Neogene basalts locally overly basement rocks and represent outliers of the Trans- Mexican Volcanic Belt.
The property lies just south of the Huacana Batholith (Figure 6.1), a Cretaceous to early-Tertiary batholith that ranges from quartz diorite to tonalite and granodiorite in composition.
The mineralised hyp-abyssal intrusions at the Tepal prospect are thought to be marginal phases of this batholith (Shonk, 1994).
6.2 Property Geology
Little is known of the INCO geologic interpretation of the property. Teck geologists identified three layered units and ten distinct intrusive rocks, some with multiple variations.
The layered units include a mixed unit of andesitic volcanics and interlayered volcanoclastic sediments, an andesitic to dacitic volcanic unit with minor interlayered volcanoclastic sediments (greywackes and siltstones) and a predominantly sedimentary unit of greywacke, shale, minor limestone and subordinate flows, tuffs and lahars.
Intrusive rocks on the property are only known north of a major east-northeast-trending fault on the southern part of the property. Nearly all fall in the tonalite/low-K dacite compositional range with the exception of post-mineralization and post-alteration andesite dikes. Intrusive rocks also display a wide variation in texture and phenocrysts abundance indicating diverse cooling histories and suggest multiple intrusive events and relatively high levels of emplacement. A detailed discussion of these lithologic units is presented in Shonk (1994).
Several inferred north-northwest-trending and east-northeast-trending faults cut the property dividing it into several parallelogram-like blocks. The southernmost east-northeast-trending fault separates two different domains of pre-intrusive rocks.

SRK Consulting Tepal PEA Technical Report Page 15
GD/ha Tepal PEA Technical Report_2CG020 000_GD_20101101.docx Effective Date: October 8, 2010
The rocks to the south form a homoclinal, south-dipping sequence which displays only weak thermal metamorphism, no alteration, and includes no intrusive rocks. North of the fault, the units are folded, faulted, more strongly thermally metamorphosed, and extensively intruded. The central north northwest-trending fault appears to juxtapose two different erosional levels and is parallel to a prominent structural grain seen in Landsat TM images of the property. The evidence for different erosional levels lies in the characteristics of the intrusive rocks. Intrusions east of the fault are typically large, equigranular, and medium-grained while porphyritic tonalite porphyry is virtually restricted to the western block south of the northern east-northeast-trending fault.
All of the defined resources are also located within this block. The deeper drilling in this area also shows a transition in the three small stocks in this area from tonalite porphyry and intrusion breccia near the surface to equigranular, medium grained tonalite at depth similar to those to the east of the fault. The presence of coarsely crystalline sericite north of the northern east-northeast-trending fault also supports the interpretation that deeper structural levels are exposed to the north and east.
Thermal metamorphism has converted andesitic volcanics to gray biotite hornfels and limestones to marbles and skarn peripheral to the intrusive rocks. Development of chlorite, clay, and carbonate in the volcanics and volcaniclastics may be due to weak regional metamorphism.”

SRK Consulting Tepal PEA Technical Report Page 16
GD/ha Tepal PEA Technical Report_2CG020 000_GD_20101101.docx Effective Date: October 8, 2010
Figure 6.1: Geological Map of the Tepal Property Including Major Concession Boundaries (adapted from Priesmeyer, 2007)

SRK Consulting Tepal PEA Technical Report Page 17
GD/ha Tepal PEA Technical Report_2CG020 000_GD_20101101.docx Effective Date October 8, 2010
7 Deposit Types The following section is taken from Priesmeyer, 2007.
7.1 Deposit Type
“Mineralization on the property is characteristic of porphyry copper-gold mineralization. Panteleyev (1995) characterizes porphyries as large masses of hydrothermally altered rock containing quartz veins and stockworks, including sulphide-bearing veinlets and dissemination, covering areas up to 10 km2 in size. These altered zones are commonly coincident with shallow intrusives and/or dike swarms and hydrothermal or intrusion breccias. Deposit boundaries are determined by economic factors, which outline ore zones within larger areas of low-grade concentrically zoned mineralization.
Important geological controls on porphyry mineralization include igneous contacts, cupolas and the uppermost, bifurcating parts of stocks and dike swarms. Intrusive and hydrothermal breccias and zones of intensely developed fracturing due to coincident or intersecting multiple mineralised fracture sets commonly coincide with the highest metal concentrations.
Surface oxidation commonly modifies the distribution of mineralization in weathered environments.
Acidic meteoric waters generated by the oxidation of pyrite leach copper from soluble copper minerals and re-deposit it as secondary chalcocite and covellite immediately below the water table in tabular zones of supergene enrichment. The process results in a copper-poor leached cap lying above a relatively thin higher-grade zone of supergene enrichment that in turn overlies a thicker zone of lower grade primary hypogene mineralization at depth.
Porphyry systems may also exhibit hypogene enrichment. The process of hypogene enrichment may relate to the introduction of late hydrothermal copper-enriched fluids along structurally prepared pathways or the leaching and re-deposition of hypogene copper, or a combination of the two. Such enrichment processes result in elevated hypogene grades.
Copper-gold porphyries differ slightly from copper ±molybdenum porphyries in the following ways:
• They can be associated with alkaline intrusive suites;
• Copper-gold porphyries do not typically contain economically recoverable Mo (< 100 ppm) but do contain elevated gold (> 0.3 g/t) and silver (>2 g/t);
• They are commonly associated with abundant hydrothermal magnetite, which is commonly associated with higher gold grades;
• Copper and gold may or may not be associated with zones of quartz veining (depending on degree of silica saturation), in contrast to most “normal” porphyry systems where quartz veining is the norm, and;

SRK Consulting Tepal PEA Technical Report Page 18
GD/ha Tepal PEA Technical Report_2CG020 000_GD_20101101.docx Effective Date October 8, 2010
• Supergene enrichment can be restricted due to the general sulphide-poor nature of the alteration and they often lack an extensive peripheral hypogene alteration “footprint”.
Porphyry copper-gold deposits range from very large low-grade deposits such as Bingham Canyon in the United States which contains 3,228 Mt averaging 0.88 % Cu and 0.50 g/t Au (Cooke and others, 2004) to small high-grade deposits such as Ridgeway in Australia which contains 54 Mt averaging 0.77 % Cu and 2.5 g/t Au (Wilson and others, 2003). The average of 112 deposits from around the world is 200 Mt averaging 0.44 % Cu, 0.4 g/t Au, 0.002 % Mo and 1.4 g/t Ag (Singer and others, 2005).
It should be noted that mineralization on these or any other properties in this class of deposit around the world is not necessarily indicative of the mineralization on the Tepal Property.
SRK Consulting Tepal PEA Technical Report Page 19
GD/ha Tepal PEA Technical Report_2CG020 000_GD_20101101.docx Effective Date October 8, 2010
8 Mineralization The following section is modified from Priesmeyer, 2007.
8.1 Mineralization
“Mineralization on the property consists of structurally controlled zones of stockwork and disseminated copper sulphide with elevated gold values. Mineralization occurs along a line of three small tonalite stocks just west of the north-northwest-trending fault that trends through the centre of the property. All three stocks are composed of multiple intrusive phases with tonalite porphyry and tonalite porphyry intrusion breccia phases hosting the highest grade mineralization. Most of the historic resource is hosted by these lithologies in the northern and southernmost stocks (North Zone and South Zone respectively). Both the North and South zone are crudely zoned from a gold-rich core with the highest gold and copper values and highest Au:Cu ratios to a copper dominant periphery with lower Au:Cu ratio to a barren pyritic halo (Shonk, 1994).
Primary sulphide mineralization within the historic resource area consists dominantly of disseminated and stockwork-controlled chalcopyrite and pyrite with minor, locally significant pyrrhotite, bornite, sphalerite, molybdenite and galena. The highest grade mineralization is associated with low total sulphide contents and low pyrite:chalcopyrite ratios. Micron-sized native gold is usually associated with the chalcopyrite either as grains attached to the surface or fracture fillings within copper sulphides (Duesing, 1973) although free grains can also occur. Hypogene sulphide mineralization typically occurs as irregular individual sulphide grains or interstitial patches of pyrite-chalcopyrite-bornite within the granular, altered tonalite porphyry groundmass, often associated with growth of granular quartz in the groundmass, as chalcopyrite-pyrite veinlets and as quartz-hydrobiotite/Fe-chlorite-pyrite-chalcopyrite veinlets associated with sericite-hydrobiotite/Fe-chlorite-pyrite-quartz alteration (Shonk, 1994).
The depth of oxidation ranges from 20 m to 40 m on the hilltops and 0 to 20 m in the drainages. Minerals in the oxidized zone include malachite, chalcocite, minor azurite, tenorite and minor chrysocolla. Thin supergene-enriched zones do exist locally at the base of the oxide zone and consist of chalcocite and covellite coatings on sulphide grains and local areas of poddy, massive chalcocite (Shonk, 1994).
Several different generations of quartz veining, quartz replacement, and silicification are prominently associated with copper-gold mineralization. Quartz vein types include early granular quartz veins with no alteration envelope consisting of quartz-sulphide-biotite of probable late magmatic age. Locally late magmatic veining is so closely spaced that vein material comprises the majority of the rock. Chlorite-quartz-sulphide-calcite and prismatic to comb quartz-sulphide veins are later. Veins of all generations display a prominent 325o-350o
orientation parallel to the central fault zone. Dips are generally vertical to steep either east or west. Other orientations are also present with a near east-west orientation and moderate south dip of secondary prominence.

SRK Consulting Tepal PEA Technical Report Page 20
GD/ha Tepal PEA Technical Report_2CG020 000_GD_20101101.docx Effective Date October 8, 2010
Granoblastic growth of granular subhedral to euhedral quartz in the groundmass and "patchy, finer grained, blue-gray quartz flooding of the groundmass (colour due to very fine grained disseminated sulphides) are often associated with granular quartz veins and are also inferred to be of late magmatic age. This quartz is typically associated with disseminated chalcopyrite and bornite (Shonk, 1994).
Mineralization on the property is consistently hosted by tonalite porphyry intrusions with at least the local presence of tonalite intrusion breccia showing chilled porphyritic to glassy porphyritic textures indicative of a near-surface environment. Intensity of mineralization is strongly related to the presence of late magmatic quartz and the density of late magmatic veining. The strong preferred orientation of these veins and evidence of shearing suggests development of a late magmatic age structure is required to focus mineralizing fluids.
Fracturing of the carapaces of the intrusive tonalite porphyritic units is likely related to continued movement on the north-northwest-trending structure controlling emplacement rather than volatile release (Shonk, 1994).
Mineralization on the property is characterized by strongly anomalous Cu, Au, Ag, Zn, and Mo and more erratic and weakly anomalous Pb, Mn, Bi, and As. Inter-element relationships and zoning have not been systematically analyzed because all soil samples and most drill samples were only analyzed for Cu and Au. Cu and Au are strongly correlated with the highest Au:Cu ratios present in core of the North and South Zone resource areas. Au:Cu ratios appear to decline toward the periphery of these zones. Mo, Zn, and Ag are also elevated within the cores of the resource areas but the highest Zn and Ag values appear to occur on the periphery. The highest Pb and As values tend to occur in veins and mineralised structural zones outside of the resource areas. Sporadic high As values are most common in altered sediments (Shonk, 1994).
8.2 Alteration
Tonalities hosting the mineralised zones display alteration features typically associated with immature island arc-type porphyry systems. Potassic alteration is poorly developed and represented dominantly by secondary biotite when present. It is restricted to the core of the system in both the North and South Zones where it occurs as late magmatic biotite replacement of hornblende phenocrysts and in hydrothermal quartz-biotite-sulphide-magnetite veins. It is closely associated with copper-gold mineralization and the best grades.
Hydrothermal potassium feldspar is locally present but uncommon to rare. It occurs in quartz veins and after plagioclase. Hydrothermal amphibole has also been recognized. Both secondary biotite and amphibole are almost always strongly to completely chloritized.
The most visible and conspicuous alteration assemblage consists of sericite-pyrite-clay-silica/ quartz±tourmaline in veins and veinlets. This alteration assemblage is best developed in dacite volcanic rocks and domes adjacent to the mineralised zones and locally overprints mineralization.
SRK Consulting Tepal PEA Technical Report Page 21
GD/ha Tepal PEA Technical Report_2CG020 000_GD_20101101.docx Effective Date October 8, 2010
Associated sericite-clay-pyrite alteration also affects post-mineralization dacite dikes which cut the North Zone, reflecting overprinting of this alteration on earlier alteration types. Anomalous gold and copper values are often associated with this type of alteration but higher grade mineralization is absent. Associated quartz veins are generally uncommon but when present are typically pale gray and chalcedonic to cherty in appearance.
In the dacite unit, this alteration type is characterized by sparsely vegetated, red-brown to red colour outcrops of argillized rock as a consequence of supergene argillization due to oxidation of the 3-15 % disseminated pyrite. Supergene minerals include kaolinite, illite, diaspore, pyrophyllite, and silica. Structurally controlled quartz-sericite-pyrite alteration is present locally elsewhere on the property.
Coincident chlorite-sericite-pyrite-quartz alteration, granular quartz flooding of the groundmass, and quartz-Fe-chlorite-sulphide veining are also closely associated with coppergold mineralization. The Fe-rich chlorites have been interpreted as indicating formation temperatures just below the stability limit of biotite, so that Fe-rich chlorites form contemporaneously with the hydrothermal biotite. Other alteration minerals sporadically associated with these assemblages include albite, calcite, epidote, clinozoisite, leucoxene, hematite, tourmaline, apatite, rutile and gypsum after anhydrite.
Whole rock analyses of altered and unaltered rocks available in the INCO data demonstrate significant addition of potassium associated with mineralization and alteration in spite of the scarcity of potassic alteration phases such as potassium feldspar or biotite. Potassium addition is probably reflected by the abundance of sericite.
Veinlets and replacements of quartz-chlorite-pyrite-epidote-calcite were noted in several drill holes peripheral to the South Zone and interpreted as peripheral to mineralization in location and post-mineralization in timing. This alteration type is associated with only very weakly anomalous gold and copper values. It often overprints assemblages more closely related to mineralization.
Chlorite-calcite-epidote with calcite and/or epidote veining or fracture coatings is the main alteration type in the post-mineralization andesite and diorite dikes. Propylitic alteration of this type is also pervasive in the andesitic volcanic rocks. It is probably related to regional, low grade metamorphism (Shonk, 1994).”
SRK Consulting Tepal PEA Technical Report Page 22
GD/ha Tepal PEA Technical Report_2CG020 000_GD_20101101.docx Effective Date October 8, 2010
9 Exploration The following section is modified from Priesmeyer, 2007.
9.1 INCO
In 1972 the International Nickel Company of Canada, Ltd (“INCO”) recognized the Tepal and the Tizate gossans (Tizate is located approximately 1,400 m east of the North Zone) and associated copper mineralization (Copper Cliff, 1974).
The Tepal and Tizate gossans were originally considered as separate entities but were eventually evaluated by a single soil grid. Soil samples were analyzed for Cu, Mo, Zn and Au and anomalous copper zones were identified. In early 1973 six diamond drill holes (57001 –57006) were drilled in the Tepal gossan. Geologic mapping and an Induced Polarization (“IP”) survey were completed during the winter of 1973-74. IP anomalies were found to be generally confined to geochemically anomalous copper zones. According to Shonk (1994) both a summary map showing extent and strength of interpreted anomalous IP response along each line in conjunction with molybdenum in soil anomalies and drill hole locations and photocopies of contoured IP sections were available. The summary map indicated a strong to moderate IP response over and peripheral to the North Zone, a moderate IP response just South of the South Zone, and a number of lines with weak to strong IP anomalies coinciding with the broad zone of soil geochemical anomalies on the east side of the property. At the time Shonk (1994) prepared his report, many of the IP anomalies had not been drilled.
9.2 Teck
Teck Resources Inc. (“Teck”) acquired the property in late 1992. Work completed by Teck includes geologic mapping, the collection of over 200 rock samples for multi-element analysis, the construction of more than 60 km of grid line, the collection of 1,268 soil samples and 50 rock chip samples from the grid, the construction of 15 km of access road and the completion of 50 reverse-circulation holes totaling 8,168 m in four phases. Total expenditure by Teck was approximately $875,000 (Shonk, 1994). Teck also completed metallurgical testing, which will be described in Section 12.2 of the Priesmeyer report.
Only very limited data remains from the Teck period on the property. There is one report, a variety of hand-drafted maps, drill logs and sample pulps from the drilling program. No duplicate samples or coarse rejects are available for review or analysis and there are no original assay certificates for data verification purposes.

SRK Consulting Tepal PEA Technical Report Page 23
GD/ha Tepal PEA Technical Report_2CG020 000_GD_20101101.docx Effective Date October 8, 2010
Initial mapping on the property was conducted by Richard L. Nielsen, a Denver-based consultant. Nielsen mapped the property at a scale of 1:5,000 and collected 165 samples for multi-element analysis. The west side and portions of the east side of the property we subsequently remapped by another consultant at scales of 1:2,000 and 1:1,000 on a grid base.
The early grid covered the western part of the mineralised area and part of the eastern half with a line spacing of 100 m and a station spacing of 50 m over areas of known mineralization and alteration and a station spacing of 100 m outside areas of known mineralization and alteration.
In late 1993 and early 1994 Tech completed a soil sampling program. Grid lines were spaced 200 m apart and sample spacing was 100 m and over anomalous areas, line spacing was reduced to 100 m and sample spacing to 50 m. A total of 1,268 soil samples and 50 rock chip samples were collected from all phases of soil sampling. Soil samples were analyzed for Cu and Au and most rock chip samples were analyzed using multi-element Inductively-Coupled Plasma (“ICP”). According to Shonk (1994), values from both soil and rock samples showed a strong positive correlation.
While the North Zone was known from previous INCO drilling, soil geochemistry as well as geologic mapping by Teck delineated the South Zone as a new target. Both the North and South Zones occurs as well defined coherent anomalies. A broad zone of less coherent anomalous Cu values covers a 1.5 x 2.0 km area on the east side of the property with three poorly defined highs. Au values show the same general pattern though anomalies are more subdued on the east side of the sampling grid.
There is no surviving contoured soil geochemistry maps of the property based on the Teck data. There is a map prepared by Hecla showing the Teck soil sample locations and values in conjunction with their own but the Teck data had not been contoured.
9.2.1 Hecla
In late 1996 Minera Hecla S.A. de C.V. (”Hecla”) visited the property and initiated a work program in the spring of 1997. Work by Hecla included the creation of a 1:2,000 scale topographic map from aerial photographs, a geologic mapping program, the collection of nearly 900 rock ship samples on a 50 m by 50 m grid, the re-analysis of 298 pulps from the Teck reverse-circulation drilling program, the completion of 17 reverse-circulation drill holes totaling 1,506 m and the completion of a resource estimate (Gómez-Tagle, 1997 and 1998).
Hecla’s expenditures on the property are unknown.
The work completed by Hecla is the best documented of all the previous work. There are two reports prepared by the project geologist, assay data in digital form and limited documentation for the resource estimate. Hand-written drill logs are also available. Most of the maps generated by Hecla remain, at least in electronic form. Sample splits and chip tray remain from the Hecla drilling. Four of the sample splits were resampled by Howe for grade verification purposes for the Report.

SRK Consulting Tepal PEA Technical Report Page 24
GD/ha Tepal PEA Technical Report_2CG020 000_GD_20101101.docx Effective Date October 8, 2010
Hecla mapped the property at a scale of 1:2,000. Mapping was intended to define lithologic units and the type, intensity and extent of mineralization and hydrothermal alteration. There is no mention in the Hecla reports as to whether geologic mapping was done on the rock chip sampling grid. Roads were located using a compass and tape.
In 1997 Hecla collected 895 rock chip samples from trenches, road cuts and a north-south grid on the property. The grid covered an area measuring approximately 1,000 m in a north-south direction and 750 m in an east-west direction. Grid lines were spaced 50 m apart.
Hecla defined a large actuate copper anomaly with the concave portion of the anomaly open to the southwest. The anomaly is defined by copper values in excess of 301 ppm copper in rock.
This anomaly measures approximately 1,100 m in length and 125 m in width and is open to the northeast and the south. Within this large anomaly are three strongly anomalous areas defined by copper values exceeding 1,000 ppm. The largest of these strong anomalies measures approximately 300 m by 230 m and generally defines the North Zone.
The gold anomaly defined by Hecla is more restricted in aerial extent. The anomaly is defined by gold values in excess of 200 ppb or 0.2 g/t Au in rock and is open to the south and southeast. The anomaly trends 320o and measures approximately 700 m by 215 m.
Within this anomaly is a smaller, very strong anomaly in which all values exceed 910 ppb or 0.91 g/t Au. This anomaly measures approximately 230 m by 80 m and generally corresponds to the North Zone.
In order to confirm the analytical results from the Teck drilling, Hecla reanalyzed 298 pulps from Teck diamond drill holes T-9, T-13, T-23, T-24, T-25 and T-30. Results of the Hecla reanalysis indicated that the values obtained by Hecla were 7% higher than those obtained by Teck. Since Hecla’s primary focus was gold, Howe presumes that this difference is for gold values only.
9.3 Exploration by Arian
Exploration by Arian was initiated in April 2007. Exploration to date has consisted of the Tepal Phase 1 diamond drill program highlighted in the Section 10 Drilling.
9.4 Exploration by Geologix
During the due diligence period commencing in the 4th quarter of 2009 and continuing into the 1st quarter of 2010 the Company initiated additional metallurgical test work utilizing core from historical drill core, an induced polarization (IP) survey over the core mineral concessions covering 1,526 hectares, geological test work including geology, mineralization and alteration studies and preliminary economic studies as they pertain to the viability of the Tepal project.

SRK Consulting Tepal PEA Technical Report Page 25
GD/ha Tepal PEA Technical Report_2CG020 000_GD_20101101.docx Effective Date October 8, 2010
By the end of the 1st quarter of 2010 the geophysical survey had been completed with a total of 78.4 line-kilometres of surveying.
On June 16, 2010, an extensive diamond drill testing program was initiated on the Tepal project. The drill program is geared to evaluate the “near resource” potential of additional mineralization being located near the current resource outlines and test for additional mineralization on the remainder of the property. Targets being evaluated in the latter areas are defined by geological, geochemical and geophysical anomalies as outlined in historic surveys as well as the geophysical survey completed by the Company in the 1st quarter of 2010.
A total of 1,596 m of diamond drill testing had been completed as of the reporting date. A minimum drill program of 5,000 m has been scheduled to be completed by the end of 2010 with two diamond drilling machines being active on the property by the end of the reporting period.

SRK Consulting Tepal PEA Technical Report Page 26
GD/ha Tepal PEA Technical Report_2CG020 000_GD_20101101.docx Effective Date October 8, 2010
10 Drilling 10.1.1 INCO Drilling
In early 1973 INCO drilled six diamond drill holes (57001 – 57006). Drilling continued through the winter of 1973-74 with seven widely spaced holes (57007 – 57013) on what was formerly known as the Tizate portion of the property and another seven holes (57014 – 57020 and 57026) were drilled on the Tepal gossan (Table 10.1). There is some discrepancy as to the number of holes drilled by INCO as collar details and assays are available for only 21 holes but according to Shonk (1994) it is possible that 26 diamond drill holes were actually completed. Howe has found nothing to support Shonk’s contention that 26 holes were drilled by INCO.
Diamond drilling was conducted by Boyles Brothers drilling using a Longyear 38 core rig. Core was NX-sized (diameter = 54.7 mm) to 50 m and BX-sized (diameter = 42.0 mm) below 50 m. Sample interval for the INCO diamond drilling program ranged from 0.2 to 3.0 m but averaged about 2.0 m. This sampling length is acceptable when exploring for disseminated mineralization which, in this case, can reach thicknesses of over 50 m. The orientation of the mineralization is unknown as core was un-orientated.
INCO’s drilling was confined to the North Zone and the Tizate area (Figure 10.1). The South Zone was unknown at the time. A summary of INCO drill hole results is presented below.

SRK Consulting Tepal PEA Technical Report Page 27
GD/ha Tepal PEA Technical Report_2CG020 000_GD_20101101.docx Effective Date October 8, 2010
Table 10.1: Summary of INCO Diamond Drilling Results DD Hole Number Area From (m) To (m) Thickness
(m) Au (g/t) Cu (%)
57001 Tepal 0.0 11.4 11.4 0.19 0.51
55.5 60.2 4.7 0.13 0.41
57002 Tepal 0.0 180.0 180.0 0.80 0.34
57003 Tepal 10.2 17.0 6.8 1.23 0.34
57004 Tepal None
57005 Tepal 20.0 40.4 20.4 0.47 0.41
57006 Tepal None
57007 Tepal 0.0 6.0 6.0 0.42 0.37
24.0 36.0 12.0 0.45 0.14
146.0 160.0 14.0 0.57 0.05
57008 Tezate 0.0 30.0 30.0 0.23 0.18
57009 Tezate 30.0 40.0 10.0 0.11 0.24
57010 Tezate 36.0 74.6 38.6 0.11 0.17
57011 Tezate 43.0 49.0 6.0 0.09 0.26
57012 Tezate 100.0 128.0 28.0 0.23 0.11
57013 Tezate 0.0 11.0 11.0 0.06 0.38
20.2 32.0 11.8 0.43 2.30
57014 Tepal 0.0 12.0 12.0 0.23 0.24
57015 Tepal 0.0 112.0 112.0 0.68 0.38
122.0 142.0 20.0 0.27 0.12
57016 Tepal 0.0 17.7 17.7 0.48 0.16
57017 Tepal 0.0 50.0 50.0 0.68 0.24
96.0 108.0 12.0 0.25 0.18
57018 Tepal None
57019 Tepal 0.0 68.2 68.2 0.17 0.27
57020 Tepal 21.0 150.0 129.0 0.55 0.30
57026 Tepal 194.0 200.1 6.1 0.47 0.40

SRK Consulting Tepal PEA Technical Report Page 28
GD/ha Tepal PEA Technical Report_2CG020 000_GD_20101101.docx Effective Date October 8, 2010
Figure 10.1: Tepal Historical Drill Plan
10.1.2 Teck Drilling
In 1994 Teck drilled 50 reverse-circulation (RC) drill holes totaling 8,168.8 m. The drilling contractor employed by Teck is unknown as are the drilling procedures.
The majority of Teck’s drill holes were drilled in the North and South Zones although a few holes were drilled in the Tizate area (Figure 10.1). A differential GPS survey was conducted in late January, 1994 to locate the INCO holes and the first 24 Teck holes as well as roads, key grid points, concession monuments and planned drill holes. Compass and tape surveys were used to establish coordinates of later drill holes and map access roads constructed after the survey.
Samples were collected every 2.03 metres (3 per 20-foot drill rod) for the first 24 holes and every 1.52 metres (5' intervals) for holes T-25 through T-50. This is acceptable when exploring for disseminated mineralization which, in this case, can reach thicknesses of over 50 m. The orientation of the mineralization is unknown due to the nature of the drilling.

SRK Consulting Tepal PEA Technical Report Page 29
GD/ha Tepal PEA Technical Report_2CG020 000_GD_20101101.docx Effective Date October 8, 2010
A duplicate analytical sample was collected every tenth sample interval. All drill samples were analyzed for Cu and Au at Chemex (now ALS Chemex). An additional 123 samples from selected intervals were analyzed for Ag, Co, Cu, Fe, Mn, Mo, Ni, Pb, and Zn using a multi-element ICP procedure. Given the fact that mineralization is disseminated or stockwork-controlled, this sample interval is adequate. Results are summarized in Table 10.2.
Drilling at Tepal generally indicates that the best values are present within 150 m of the surface. Significant intercepts at greater depths are confined to the cores of the North and South Zone resource areas.
Preliminary metallurgical tests were also conducted on a few selected intervals of mineralised intercepts from hole 57002.

SRK Consulting Tepal PEA Technical Report Page 30
GD/ha Tepal PEA Technical Report_2CG020 000_GD_20101101.docx Effective Date October 8, 2010
Table 10.2: Summary of Teck Reverse Circulation Drilling Results
RC Hole Number Area From (m) To (m) Thickness
(m) Au (g/t) Cu (%)
T-1 North 20 80 60 0.2 0.15 184 190 6 0.19 0.27
T-2 West 6 68 62 0.17 0.46 88 106 18 0.33 0.23
T-3 North 0 156 156 0.83 0.33 188 194 6 1.46 0.17
T-4 North 0 116 116 0.56 0.28 incl. 42 98 56 0.95 0.37 T-5 East 6 26 20 0.18 0.47 T-6 North 0 36 36 0.36 0.22
80 112 32 0.57 0.22 T-7 Between
north and
south
117 198 86 0.32 0.14 T-8 0 26 26 0.44 0.15
54 70 16 0.46 0.14 T-9 44 154 110 0.4 0.16 T-10 None 6 26 20 0.46 0.22
82 130 46 0.65 0.25 T-11 Between
north and
south
16 42 26 0.41 0.25 T-12 42 96 54 0.47 0.2 T-13 24 78 54 0.47 0.18 T-14 NIL T-15 South 0 28 28 0.4 0.26 T-16 South 44 166 120 0.44 0.2 T-17 South 0 116 116 0.69 0.3 T-18 South 0 164 164 0.76 0.27 T-19 East NIL T-20 East NIL T-21 North NIL T-22 NIL T-23 North 0 44 44 0.67 0.53
56 122 66 0.28 0.22 T-24 North 0 188 188 1.04 0.4 T-25 South 4.6 199.6 195 0.82 0.3 T-26 South 7.6 86.9 79.3 0.34 0.15
100.6 161.5 60.9 0.42 0.2 172.2 201.2 29 0.66 0.32
T-27 South 0 32 32 0.24 0.18 T-28 South 0 36.6 36.6 0.67 0.21
61 70.1 9.1 0.28 0.19 T-29 None 1.5 9.1 7.6 0.35 0.03 T-30 North 0 182.8 182.8 0.79 0.25 incl. 25.9 65.5 35.6 1.35 0.31 T-31 North 30.5 39.6 9.1 0.22 0.44
96 112.8 16.8 0.25 0.24 143.3 153.9 10.6 0.26 0.48
T-32 North 59.4 83.8 24.4 0.2 0.24 108.2 112.8 4.6 0.23 0.45 155.5 170.7 15.2 0.23 0.2
T-33 Between north
NIL T-34 54.9 112.8 57.9 0.29 0.44
SRK Consulting Tepal PEA Technical Report Page 31
GD/ha Tepal PEA Technical Report_2CG020 000_GD_20101101.docx Effective Date October 8, 2010
10.2 Hecla Drilling
In late 1997 Hecla conducted a 17-hole reverse-circulation drilling program totaling 1,506 m.
All but three of the Hecla holes were drilled in the North Zone. The remaining three were drilled in the South Zone. Results are presented in Table 10.3, which was taken from Gómez-Tagle (1998).
Sample interval for the Hecla reverse-circulation drilling program was 1.0 m. This is acceptable when exploring for disseminated mineralization which, in this case, can reach thicknesses of over 50 m. The orientation of the mineralization is unknown.

SRK Consulting Tepal PEA Technical Report Page 32
GD/ha Tepal PEA Technical Report_2CG020 000_GD_20101101.docx Effective Date October 8, 2010
Table 10.3: Summary of Hecla Reverse Circulation Drilling Results Grade Grade Grade Grade
From To Au (g/t) Cu (%) From To Au (g/t) Cu (%)67 71 4 1.4 0.3975 97 22 1.39 0.39
128 150 S 0.09 0.04
1 27 O 1.24 0.47 17 25 8 2.05 0.5627 30 M 1.1 1.02
30 44 14 1.04 0.5253 61 8 1.56 0.9676 81 5 1.04 0.51
98 108 10 0.88 0.39108 150 S 0.17 0.12
1 42 O 0.67 0.2 15 23 8 0.96 0.2342 59 M 0.26 0.37 46 53 7 0.51 0.5859 150 S 0.23 0.14 80 114 34 0.44 0.16
1 14 O 0.19 0.48 1 4 3 0.44 0.1814 16 O 0.18 0.48 1 4 3 0.44 0.18
16 38 S 0.27 0.1538 51 S 0.18 0.120 13 O 0.41 0.09
13 16 M 0.37 0.8216 51 S 0.24 0.23 16 23 7 0.33 0.44
0 14 O 0.45 0.0714 15 M 0.3 0.6415 50 S 0.21 0.22 15 27 12 0.33 0.37
0 10 M 0.03 0.0310 51 S 0.03 0.02
0 12 O 0.05 0.0112 31 M 0.04 0.0131 51 S 0.03 0.03
51 81 S 0.4 0.2 77 81 4 0.67 0.280 30 O 0.13 0.17
30 32 M 2 0.1932 80 S 0.21 0.23 41 54 13 0.41 0.250 29 O 0.35 0.12 14 29 15 0.48 0.12
29 35 M 0.56 0.3135 50 S 0.45 0.51 38 50 12 0.49 0.38
0 24 O 0.18 0.224 26 M 0.1 0.3426 50 S 0.13 0.08
6 11 5 0.44 0.3913 18 5 0.52 0.5928 32 4 0.29 2.75
33 41 M 0.11 1.0541 51 S 0.07 0.21
0 4 4 0.54 0.066 17 11 0.49 0.11
19 20 M 0.54 0.43
26 36 10 0.64 0.3245 50 5 0.43 0.24
8 19 O 0.02 0.1119 21 M 0.01 0.721 50 S 0 0.05
50 S 0.43 0.23
MHT-17
O = oxide, M = mixed oxide/sulphide, S = sulphide
O 0.31 0.93
MHT-16
0 19 O 0.45 0.1
20
MHT-12
MHT-13
MHT-14
MHT-15
0 33
MHT-6
MHT-7
MHT-8
MHT-9
MHT-10
MHT-11
0.32
30 108 S 0.78 0.44
RC Hole NumberInterval (m)
Type of MineralSubinterval (m)
Thickness (m)
MHT-5
67 182 S 0.88

SRK Consulting Tepal PEA Technical Report Page 33
GD/ha Tepal PEA Technical Report_2CG020 000_GD_20101101.docx Effective Date October 8, 2010
10.3 Arian Drilling
The Phase 1 diamond drilling (DD) campaign was completed in June 2008, consisting of 42 holes totaling 7,180 metres. See Figures 10.2-10.4.
Drilling has been carried out using two Boart Longyear 38 drill rigs owned and operated by GICSA (Geotechnica, Igenieria y Construction, S.A. de C.V.), of Paseos de Taxquena, Mexico, D.F.
The majority of the initial diamond drilling was carried out using HQ sized drill rods (core diameter = 63.5 mm) except where, due to technical problems, the rod size was reduced to NQ (core diameter = 47.6 mm). Drill core was not oriented for the Phase 1 program.
Figure 10.2: Location Plan – All Arian Phase 1 Drill Holes and Mineralised Domains

SRK Consulting Tepal PEA Technical Report Page 34
GD/ha Tepal PEA Technical Report_2CG020 000_GD_20101101.docx Effective Date October 8, 2010
Figure 10.3: Location Plan – All Northern Domain Drill Holes

SRK Consulting Tepal PEA Technical Report Page 35
GD/ha Tepal PEA Technical Report_2CG020 000_GD_20101101.docx Effective Date October 8, 2010
Figure 10.4: Hole Location Plan – All Southern Domain Drill Holes

SRK Consulting Tepal PEA Technical Report Page 36
GD/ha Tepal PEA Technical Report_2CG020 000_GD_20101101.docx Effective Date October 8, 2010
10.4 Drill Hole Summary
Summary details of Arian drill hole data for the Tepal project are contained in Table 10.4 below.
Table 10.4: Arian Tepal Drillhole Summary Database Name Micromine Tepal Drill Hole DH Database
Date Created February 2008 Number of Holes 42 Average Hole Spacing 150-170m x 50-100m within mineralised zones
DD Hole ID Depth (m) Hole Azimuth Hole Dip
(Collar) AS-07-001 200.1 045 -45 AS-07-002 151.45 000 -90 AS-07-003 101.65 000 -90 AS-07-004 200.4 000 -90 AS-07-005 150.9 045 -45 AS-07-006 200.85 000 -90 AS-07-007 250.05 000 -90 AS-07-008 152.75 000 -90 AS-07-009 150.7 000 -90 AS-07-010 100.3 000 -90 AS-07-011 151.3 000 -90 AS-07-012 60.1 000 -90 AS-07-012a 165.85 000 -50 AS-07-013 185.8 000 -50 AS-07-014 201.65 000 -90 AS-07-015 180.65 270 -80 AS-07-016 151.4 000 -90 AS-07-017 201.4 000 -90 AS-07-018 75.9 270 -45 AS-07-019 75.4 000 -90 AS-07-020 75.35 000 -90 AS-07-021 101 000 -90 AS-07-022 150.25 000 -90 AS-07-023 200.6 000 -90 AS-07-024 150.35 000 -90 AS-07-025 161 000 -90 AS-07-026 250.1 270 -80 AS-07-027 172.95 090 -80 AS-07-028 201.1 000 -90 AS-07-029 201 000 -90 AS-07-030 151.3 140 -45 AS-07-031 200.55 090 -50 AS-07-032 200.1 220 -45 AS-07-033 240.5 090 -60 AS-07-034 171.3 000 -90 AS-07-035 200.5 000 -90 AS-07-036 250.4 000 -90 AS-07-037 200.4 090 -70 AS-07-038 151.1 000 -90 AS-07-039 220.5 000 -90 AS-07-040 220.65 270 -50 AS-07-041 200.65 270 -80

SRK Consulting Tepal PEA Technical Report Page 37
GD/ha Tepal PEA Technical Report_2CG020 000_GD_20101101.docx Effective Date October 8, 2010
10.5 Geologix Drilling
On June 16, 2010, a Phase I diamond drill testing program, consisting of a minimum of 5,000 m was initiated by Geologix on the Tepal project using two diamond drilling machines. The purpose of the drill program is to evaluate the “near resource” potential of additional mineralization being located near the current resource outlines and test for additional mineralization on the remainder of the property. No drilling has been completed within the resource limits. Targets that are being evaluated in the latter areas are defined by geological, geochemical and geophysical anomalies as outlined in historic surveys as well as the geophysical survey completed by Geologix in the 1st quarter of 2010.
A total of 5,650 m of diamond drill testing had been completed as of the reporting date. At the time of the report, no drilling results had been reported and therefore the results are not considered further as part of the work required in the PEA and is only mentioned for informational purposes only.

SRK Consulting Tepal PEA Technical Report Page 38
GD/ha Tepal PEA Technical Report_2CG020 000_GD_20101101.docx Effective Date October 8, 2010
11 Sampling Method and Approach The following section is taken from Priesmeyer, 2007.
11.1 INCO Program
Little is known of the sampling method and approach employed by INCO for their soil and rock sampling programs. Soil samples were collected on a grid. Sampling methodologies are not discussed in the Copper Cliff report (Copper Cliff, 1973).
Sample interval for the INCO diamond drilling program ranged from 0.2 to 3.0 m but averaged about 2.0 m. Diamond drill core was NX size (diameter = 54.7 mm) to 50 m and BX size (diameter = 42.0 mm) below 50 m. It is not known whether drill core was split, and if so how it was split, or whether whole core was analyzed. Core recoveries ranged from over 90 % in un-weathered rock to between 40 to 90 % in fractured rock. Without a detailed study it is difficult to determine the impact of low recovery on the validity of assay results although, in theory, the results could be affected. No core, duplicate samples, coarse rejects or sample pulps from the INCO drilling remain.
11.2 Teck Program
Little is known of the sampling method and approach employed by Teck for their soil and rock sampling programs. Rock samples were collected as part of Teck’s property-wide mapping program. Presumably these samples were rock chip samples, rather than channel samples, collected from outcrops of interest around the property.
Soil samples were collected on a grid as discussed in Section 8.2 of the Priesmeyer Report. The grid covered most of the property. Sampling methodology is not discussed in the Teck report (Shonk, 1994).
Samples from the reverse-circulation program were collected every 2.03 metres (3 per 20" drill rod) for the first 24 holes and every 1.52 metres (5-foot intervals) for holes T-25 through T-50. A duplicate analytical sample was collected every tenth sample. Recovery was not recorded on Teck drill logs. Property owner Luis Gonzáles Barragán (personal communication, 2006) indicated that Teck encountered problems when trying to drill below the water table with reverse-circulation drilling. This may have affected the recovery of drill cuttings and the results. Sample pulps from Teck’s reverse-circulation drilling program have been preserved and are in Tepalcatepec.
11.3 Hecla Program
Little is known of the sampling method and approach employed by Hecla. A rock chip sampling program was completed by Hecla but Hecla did not collect soil samples. A total of 885 rock chip samples were collected from road cuts, trenches and the aforementioned grid.

SRK Consulting Tepal PEA Technical Report Page 39
GD/ha Tepal PEA Technical Report_2CG020 000_GD_20101101.docx Effective Date October 8, 2010
In order to collect representative samples from the grid, samples were collected from outcrops within an area of five or ten metres surrounding each samples point. See Figures 11.1 and 11.2.
Samples from reverse-circulation drilling were collected every meter down the hole. A duplicate analytical sample, or a split of the main sample, was collected from every sample interval. These duplicate samples have been preserved and are in Tepalcatepec. Recoveries were not recorded. Property owner Luis Gonzáles Barragán (personal communication, 2006) indicated the Hecla encountered problems when trying to drill below the water table with reverse-circulation drilling. This may have affected the recovery of drill cuttings and the results. Chip trays containing representative lithological samples for logging purposes are have also been preserved and are in Tepalcatepec.
Figure 11.1: Hecla Rock Chip Cu Geochemistry Map for Tepal North Zone

SRK Consulting Tepal PEA Technical Report Page 40
GD/ha Tepal PEA Technical Report_2CG020 000_GD_20101101.docx Effective Date October 8, 2010
Figure 11.2: Hecla Rock Chip Au Geochemistry Map for Tepal North Zone
11.4 Arian Program
Procedures for the Tepal drillhole sampling method and approach are similar to those employed at Arian’s San Jose property near Zacatecas, and taken from discussions with Arian staff geologists Mr. M. Booth and Mr. H. Parker and from internal documents ‘San Jose –Sampling Methodology and QA/QC.doc’ and ‘San Jose Exploration by Arian.doc’ provided to Howe for review. Arian’s QA/QC and sampling methodology and procedures were developed following Howe’s recommendations in the previous technical study for the project reported in Priesmeyer, 2007.
HQ drill core is retrieved in approximate 2.4 m runs where possible and 3.05m runs for NQ core. Run length is less where broken ground is encountered.
All drill-core was stored in plastic core boxes (with lids) that were able to hold 3m of core. The plastic core boxes were transported (by Arian personnel) with a large elastic band wrapped around them so to prevent the lids from blowing away when they were being transported (Booth, 2007a).
Drill-core was collected from the drill-rig(s) at the end of each day. The core was transported by Arian to the logging shed for storage, where it was cleaned and marked up (highlighting lithological
SRK Consulting Tepal PEA Technical Report Page 41
GD/ha Tepal PEA Technical Report_2CG020 000_GD_20101101.docx Effective Date October 8, 2010
and structural features), and then it was photographed. The photographs were saved, every day onto a computer at the property.
Once the core was photographed, it was logged, with geology, recovery, and RQD information noted on the logs and entered into an Access database on a daily basis (Booth, 2007b).
Where applicable, samples were marked on the core box, with a red mark, and the sample number recorded on the logs and inside the core boxes next to the relevant sample point. An aluminum ticket, on which the sample number was written, was also placed into the core box at the relevant position. The sample information was also entered in the access database.
Once a week, the Access databases are saved on the company’s network in the Zacatecas office. The network is backed-up monthly on DVD which is stored in a safe location (Booth, 2007b).
11.5 Geological Core Logging
Discussion with site personnel and a review of geological logging procedures and log sheets indicates that detailed geological logging was routinely undertaken during drilling.
Observations are recorded on hardcopy graphical logging sheets and capture pertinent geological information for each deposit including lithology, weathering, facies, texture, structure, mineralogy, colour, and grain size as well as presenting a graphic log. Site specific information such as relevant ore types and alteration assemblage characteristics are being recorded. Based upon review of the logs Howe is satisfied the logging is consistent and conducted to a satisfactory standard.
Geological information recorded as hand written sheets is then transferred to Access database on a daily basis, cross checked with the original sheets and validated by the Project Geologist.
Basic geotechnical core recovery and RQD information was captured for all drill holes, including weathering state and oxidation boundaries. These are entered on to the hand written sheets and then entered into an Access database.

SRK Consulting Tepal PEA Technical Report Page 42
GD/ha Tepal PEA Technical Report_2CG020 000_GD_20101101.docx Effective Date October 8, 2010
The geological logs do capture basic geotechnical and structural information but discussion indicates that the core is not orientated and as such the orientations of potentially important fault and fracture sets remain unknown. No core orientation line referenced structural measurements have been taken. Verification of recorded RQD measurements has not been undertaken by Howe.
11.6 Survey
Topographical survey data was acquired in February 2007 from PhotoSat of Vancouver, Canada, taken from IKONOS satellite images dated February 15 2007, and is accurate to 2 metres.
Digital scaled contour topographic maps were produced from this data for the Tepal property. These were subsequently used to generate topographical DTMs in Micromine for use in resource modelling.
Diamond drill holes were positioned using hand held GPS (UTM NAD83), providing +/- 5m accuracy. Once a drill-hole was completed, it was surveyed again with a hand-held GPS (UTM NAD83). The collar was capped and marked with a concrete monument that displayed the drill-hole name, azimuth, angle of dip and length. It is planned to survey drill holes by total station on completion of the Phase 1 program.
Drill hole surveys were routinely taken every 50 m down the hole using a Reflex instrument. Downhole survey results are provided by the drilling company in digital format. Drillhole survey measurements taken by this method can be considered reliable.
11.7 Core Recovery
At Tepal, 4,375 recovery measurements have been taken for the “Phase 1” Arian drill core.
The average recovery value for all drillhole intervals is 96 % and interval recovery values range from 0 % to 200 % recovery (See Figure 11.4).
32 spurious recovery readings of greater than 100 % (inc. 1 reading of 200 % recovery) occur within the database and require follow up. These discrepancies were found to be input errors: these were corrected and the core recovery database file was reviewed and validated prior to the resource estimation update.
975 core recovery measurements occur within the Tepal North mineralised domain. The mean core recovery within the mineralised zones is 93 % with a range of 24 % to 171 %.
With spurious values excluded to remove bias from these error values, recovery remains at 93 % which Howe considers satisfactory.

SRK Consulting Tepal PEA Technical Report Page 43
GD/ha Tepal PEA Technical Report_2CG020 000_GD_20101101.docx Effective Date October 8, 2010
620 core recovery measurements occur within the Tepal South mineralised domain. The mean core recovery within the mineralised zones is 96 % with a range of 24 % to 200 %.
Again spurious results require follow up. With spurious values excluded to remove bias from these error values, recovery remains at 95 % which Howe considers satisfactory.
The core recovery through the mineralised zones is considered acceptable so as to be confident that core samples, and the assay values derived from them are representative of the material drilled and suitable for inclusion in resource estimation studies.
Figure 11.3: Arian Phase 1 Core Recovery Data
Core recovery should continue to be monitored as part of the proposed Phase 2 drilling campaign to ensure acceptable levels of core recovery are maintained, particularly through the mineralised zones.
11.7.1 Specific Gravity
During 2007, a total of 19 samples of core were collected from 13 DD drill holes at the Tepal property to facilitate specific gravity determination for use in the resource estimate and future mine planning. A review of samples taken, indicate a reasonable spatial distribution, variety of ore and litho types and oxidation zones from the North and South Tepal mineralised zones.

SRK Consulting Tepal PEA Technical Report Page 44
GD/ha Tepal PEA Technical Report_2CG020 000_GD_20101101.docx Effective Date October 8, 2010
Specific gravity determination for each sample was performed by ALS Chemex, Vancouver, BC. Specific gravity readings were calculated by gravimetric methods whereby two techniques are employed depending upon the material type.
• For a bulk sample the rock or core section (up to 6 kg) is weighed dry or is covered in a paraffin wax coat and weighed. The sample is then weighed while it is suspended in water and SG determined by measuring the volumetric displacement of the rock in water and dividing the weight of rock by the volume.
• For a pulverized sample (3.0 g) is weighed into an empty pyncometer. The pyncometer is filled with a solvent (either methanol or acetone) and then weighed. From the weight of the sample and the weight of the solvent displaced by the sample, the specific gravity is calculated by the weight of sample divided by the weight of solvent displaced multiplied by the SG of solvent.
Specific gravity data is tabulated for Tepal core in Table 11.1. Weighted average bulk density values were calculated for fresh (sulphide) and weathered (oxide) material types for use in the resource tonnage estimations. Bulk densities for transitional zone (mixed) were determined as an average of fresh and weathered.
Table 11.1: Tepal Bulk Density Data
Rock Type Oxidation No of Samples DD Drill Holes Average Specific gravity
Andesite Oxide 2 AS-07-011 2.745
Andesite dyke Oxide 2 AS-07-011 2.695
Rhyolite tuff Fresh 2 AS-07-011 2.805
Quartz vein Oxide 1 AS-07-011 2.8
Tonalite (North Zone) Oxide 3 AS-07-008, 010, 012 2.783
Fresh 3 AS-07-006, 012A, 019 2.827
Tonalite (North Zone) Oxide 3 AS-007-007, 009, 022 2.807
Fresh 3 AS-07-001, 005, 017 2.727
Table 11.2: Domain Bulk Densities
Domain Weighted S.G. Value All 2.74
Tepal North 2.81
Tepal South 2.74

SRK Consulting Tepal PEA Technical Report Page 45
GD/ha Tepal PEA Technical Report_2CG020 000_GD_20101101.docx Effective Date October 8, 2010
11.8 Geologix
Procedures for the Tepal drillhole sampling method and approach are similar to those employed at all of Geologix projects.
Drill core is retrieved in approximate 1.52 m for HQ runs where possible and 3.05 m runs for NQ core. Run length is less where broken ground is encountered or the core tube blocks.
All drill-core is stored in plastic core boxes (with lids) that are able to hold 3 m of core. The plastic core boxes are transported (by Geologix personnel) with a large elastic band wrapped around them so to prevent core loss when being transported.
Drill-core was collected from each of the drill-rigs at the end of each shift. The core was transported by Geologix personnel to the core logging area, where it was cleaned and marked up (highlighting lithological, structural, alteration, etc. features), and then photographed. The photographs are saved, every day onto a computer at the property and a periodic back-up is made. Access to the core logging and storage facility is restricted to Geologix personnel and locked during periods of non-use. The core logging and storage facility is located within an office/building complex which is also secured and locked during non-peak hours.

SRK Consulting Tepal PEA Technical Report Page 46
GD/ha Tepal PEA Technical Report_2CG020 000_GD_20101101.docx Effective Date October 8, 2010
12 Sample Preparation, Analyses and Security The following section is taken from Howe 2009.
12.1 INCO Program
Nothing is known of the sample preparation, analysis and security methods employed by INCO nor is it known whether INCO employed a quality control/quality assurance program.
12.2 Teck Program
Nothing is known of the sample preparation, analysis and security methods employed by Teck nor is it known whether Teck employed a full quality control/quality assurance program. Shonk (1994) indicates that every tenth sample submitted for analysis by Teck was a duplicate.
The analytical method utilized is unknown but all samples were analyzed for gold and copper while a small subset (approximately 300 samples) were analyzed using multi-element ICP, a common technique.
Howe does not know what certification Chemex had in the mid-1990’s but current ALS Chemex laboratories in North America are registered to ISO 9001:2000 for the “provision of assay and geochemical analytical services” by QMI Quality Registrars. In addition to ISO 9001:2000 registration, the ALS-Chemex Vancouver laboratory has received ISO 17025 accreditation from the Standards Council of Canada under CAN-P-1579 “Guidelines for Accreditation of Mineral Analysis Testing Laboratories”. CAN-P-1579 is the Amplification and Interpretation of CAN-P-4D “General Requirements for the Accreditation of Calibration and Testing Laboratories” (Standards Council of Canada ISO/IEC 17025).
12.3 Hecla Program
Nothing is known of the sample preparation, analysis and security methods employed by Hecla nor is it known whether Hecla employed a quality control/quality assurance program.
All samples were analyzed by Chemex. Gold content was determined by fire assay with an atomic adsorption finish while copper and 30 other elements were determined by ICP.
Howe does not know what certification Chemex had in the mid-1990’s but current ALS Chemex certification is given above.

SRK Consulting Tepal PEA Technical Report Page 47
GD/ha Tepal PEA Technical Report_2CG020 000_GD_20101101.docx Effective Date October 8, 2010
12.4 Arian Program
“Samples have been prepared in accordance with NI 43-101 requirements and similar to those employed at Arian’s San Jose property. In January 2007, Mr. S. Priesmeyer of ACA Howe reviewed Arian’s sampling and QA/QC procedures and recommended a number of modifications that were implemented for the exploration programs.
Arian geologists typically use 2 metre sample intervals within the mineralised zones apart from where broken ground and/or specific geological conditions determine otherwise.
Sampling intervals ranged from 0.25 m to 5.95 m (which represents an inter zone waste composite sample), with most intervals in the 1.5 to 2 m range.
Core is transported from site to the processing facility, housed in the grounds of the house that the company currently occupies in Tepalcatapec, 15kms northeast of the Tepal Project. In the warehouse, the areas of core that had been marked for sampling were cut in half using a diamond-bladed core-saw. One half of the core was replaced into the core-box, and the other half was bagged. Inside the bags were placed sample tickets (with a unique sample ID), and the same sample number was written the same number. The bag was then sealed on site.
After the core has been logged and photographed, all information was entered into an Access Database (Booth, 2007b).
The samples (in groups of 10 samples) are placed inside nylon rice-bags and sealed with a cable-tie to prevent access (Booth, 2007b).
Details of sample type for the Tepal drilling are contained in Table 12.1 below.
Table 12.1: Tepal Sample Types
Prospect Sample Type Number of Samples Sample Length
Tepal HQ (NQ) half core 3,532 Non-uniform (commonly 2m)*
*sample lengths vary between 0.25m and 5.95m, contained to mineralised and/or geological and geotechnical boundaries
12.4.1 Previous Analytical Techniques
Following QA/QC issues identified in the April 2008 ACA Howe International Tepal Resource Estimation Study, the initial sample Assay methodology was changed as copper CRMs assayed at Inspectorate using the 3 acid digestion and ICP finish method returned results that were generally erratic and higher than expected.

SRK Consulting Tepal PEA Technical Report Page 48
GD/ha Tepal PEA Technical Report_2CG020 000_GD_20101101.docx Effective Date October 8, 2010
To remedy this, a full review of Inspectorate analytical techniques was undertaken. It was recognized through this study that sample preparation for the 3 acid digestion and ICP finish method was inadequate. Based on these findings it was agreed that re-analysis for copper and gold for all Phase 1 holes must be undertaken, using the more reliable method of Aqua Regia digest with Atomic Adsorption finish.
Once re-analysis was complete the CRM and duplicate results were greatly improved for gold and are presented in the April 2008 report. It was found that the gold re-assay results undertaken at Inspectorate were sufficient to be, on the whole, suitable for confident use in resource estimation.
Copper control results remained poor and it was agreed that all Phase 1 assays would have to be re-analyzed by ALS Chemex Laboratories Canada. To ensure an adequate level of confidence in assay results for use in resource estimation the majority of samples beyond Sample 143422, hole AS-07-023, were sent to ALS Chemex for gold and copper analysis in place of Inspectorate Labs. The sampling preparation methods and the final methods of analysis employed by each lab are presented in the following sections.
12.4.2 Sample Preparation
Inspectorate Labs
Initially samples sent to Inspectorate Labs for analysis, were collected from Arian’s warehouse on a fortnightly basis by Inspectorate, who transported the samples to their preparation facility in Durango, Durango, Mexico.
The entire half-core is crushed to 75 % passing 2 mm followed by the pulverization of a 150g split in chromium steel crusher to 85 % passing 75 microns. The pulp samples are then air freighted to Inspectorate's analytical laboratories in Reno, Nevada, for analysis.
ALS Chemex
Samples analyzed by ALS Chemex were collected from Arian’s warehouse and transported the samples to the sent to ALS Chemex’s sample preparation facility in Guadalajara, Mexico.
Once the sample is received by ALS Chemex the entire half-core is crushed and pulverized to 85 % passing 75 micron mesh. The pulp samples are then air freighted to the ALS Chemex analytical laboratories in Vancouver, Canada, for analysis.
At no time after the sample bags are sealed, are the samples handled by Arian personnel or contractors working for Arian.
12.4.3 Sample Analysis
A summary of samples analyzed and methodologies used is contained in Table 12.2.

SRK Consulting Tepal PEA Technical Report Page 49
GD/ha Tepal PEA Technical Report_2CG020 000_GD_20101101.docx Effective Date October 8, 2010
Table 12.2: Tepal Sample Analysis Methodology
Analyte Sample Range Lab # of Samples Assaying Methodology Limits of Detection*
Au
142001-143419, 145501-146000 Inspectorate 1,700
<3ppm: Aqua Regia digest with AAS finish; LLD:<0.005ppm
ULD:>10ppm
>3ppm: Fire Assay with Gravimetric finish LLD:<0.005ppm
ULD:>100ppm
143420-145500, 212251-217350 Chemex 1,829
<3ppm: Aqua Regia digest with AAS finish; LLD:<0.005ppm
ULD:>10ppm
>3ppm: Fire Assay with Gravimetric finish LLD:<0.005ppm
ULD:>100ppm
Cu
142441-142445, 142465-142473, 142480-142485, 143032-143050, 143306-143335, 143344-143419
Inspectorate 142 Aqua Regia digest with AAS finish; LLD:<0.2ppm
ULD:>10,000PPM
142001-142440, 142447-142464, 142474-142479, 142487-143031, 143051-143304, 143336-143342, 143420-144350, 144401-146000,
212251-217350
Chemex 3,342
<10,000: 3 Acid digestion with ICP LLD:<0.2ppm
ULD:>10,000PPM
>10,000 Aqua regia Digest with AAS LLD:<0.01%
ULD:>3%

SRK Consulting Tepal PEA Technical Report Page 50
GD/ha Tepal PEA Technical Report_2CG020 000_GD_20101101.docx Effective Date October 8, 2010
Results are received from the labs via email and hardcopy certificate. For each laboratory used, the sample dispatch routines, security, preparation and analysis are considered consistent with satisfactory working practices for this type of deposit and type of exploration work.
Inspectorate Labs
Samples were assayed for gold by Aqua Regia digest with AAS finish in a 30 g sample. High grade gold (>3 ppm) samples were re-analyzed using fire assay with a gravimetric finish.
Copper was analyzed using an Aqua Regia digestion and an AAS finish.
ALS Chemex
Samples were assayed for gold by Aqua Regia digest with AAS finish in a 30 g sample. High grade gold (>3 ppm) samples were re-analyzed using fire assay with a gravimetric finish. The majority of copper assays were undertaken at ALS Chemex using a 3 Acid digestion with ICP finish. High grade (>10,000 ppm) copper samples were re analyzed using an Aqua Regia Digest with AAS finish.
12.5 Geologix Program
Samples analyzed by ALS Chemex were collected from Geologix’s warehouse and transported to ALS Chemex’s sample preparation facility in Guadalajara, Jalisco with the analytical work being completed at their laboratory facilities in North Vancouver, B.C. A QA/QC program has been implemented to ensure all core and sample handling procedures are in accordance with the best possible practices. The assay protocol includes the insertion of standards, blanks and duplicates into the sample stream on an average basis of one standard, one blank, and one duplicate sample within every 30 samples. At no time after the sample bags are sealed and placed inside nylon rice-bags and sealed with a cable-tie to prevent access, are the samples handled by Geologix personnel or contractors working for Geologix.
Once the sample is received by ALS Chemex the entire half-core is crushed and pulverized to 85 % passing 75 micron mesh and the pulp samples being then air freighted to the analytical laboratories for analysis.

SRK Consulting Tepal PEA Technical Report Page 51
GD/ha Tepal PEA Technical Report_2CG020 000_GD_20101101.docx Effective Date October 8, 2010
All samples were assayed for gold by Aqua Regia digest with AAS finish on a 30 g sample and by ICP-AES for 33 elements, including copper, using a 4 acid “near total” digestion. High grade gold (>10.0 g/t) samples were re-analyzed using fire assay with a gravimetric finish. High grade (>10,000 ppm) copper samples were re-analyzed on a single element basis using an ore grade 4 acid digestion with ICP-AES finish.
Results are received from the lab via email and hardcopy certificate. For the laboratory used, the sample dispatch routines, security, preparation and analysis are considered consistent with satisfactory working practices for this type of deposit and type of exploration work.

SRK Consulting Tepal PEA Technical Report Page 52
GD/ha Tepal PEA Technical Report_2CG020 000_GD_20101101.docx Effective Date October 8, 2010
13 Historical Data Verification The following section is taken from Howe 2009
“During the recent Howe site visit, the author selected 25 representative pulp samples from the Phase 1 drilling which were to be submitted to ALS Chemex Laboratories for check assay.
At the time of reporting these assay results are pending. Although Howe has been unable to verify drill hole samples grades from the Phase 1 drilling via verification sample assays, Howe have reviewed raw and certified QA/QC data and verified sample grades returned from the laboratory.
13.1 QA/QC
A quality assurance and quality control program was implemented during the 2007 and 2008 drilling campaign at Tepal, in an attempt to provide adequate confidence that sample and assay data could be used in resource estimation. Procedural documentation pertaining to sample collection, field preparation, sample dispatch, assay lab sample preparation, sample analysis and collation of assay results was presented and reviewed prior to resource estimation.
An assessment of QA/QC samples submitted to Inspectorate laboratories was completed in the report 2008 ACA Howe International Resource Estimation Study on the Tepal, Gold-Copper Prospect, Michoacán, Mexico. Inspectorate gold results were sufficient to be, on the whole, confident in assay precision and accuracy. This QA/QC report will seek to assess ALS Chemex assays completed since that report, and the copper re-assays.
The review of sampling and assaying procedures indicates that an adequate system is in place to maximize the quality of drill hole samples and to assess the reliability, accuracy and precision of subsequent assay data for use in resource estimation.
The QA/QC program consisted of:
• The inclusion of Certified Reference Material standards (CRM’s) in sample batches sent to both Inspectorate and Chemex laboratories, to assess analytical accuracy. (4 per 100 samples).
• The inclusion of field blanks and pulp blanks to assess laboratory sample preparation and analytical accuracy (3 per 100 samples).
• The inclusion of field duplicates and externally assayed pulp duplicates to asses sample preparation and precision (3 per 100 samples).
• Details of the QA/QC program are contained in the table below:

SRK Consulting Tepal PEA Technical Report Page 53
GD/ha Tepal PEA Technical Report_2CG020 000_GD_20101101.docx Effective Date October 8, 2010
Table 13.1: Assay QA/QC details
QA/QC Sample/Assay Type # of Samples % of Total Samples* Ratio Standard Samples 60 2% 1:60
Field Blank Samples 33 1% 1:107
Pulp Blank Samples 33 1% 1;107
Coarse Reject Duplicates 35 1% 1:104
Pulp Duplicates 34 1% 1:101
*total number of samples submitted = 3532
Approximately 6 % of all samples submitted to the laboratory were quality control samples.
13.1.1 Blanks
Field blanks were prepared from samples of un-mineralised Tonalite taken from a quarry near Arian’s San Jose property and submitted along with the core samples. All Pulp Blanks were prepared from the un-mineralised Tonalite at the Inspectorate Laboratories sample preparation facility.
Blanks were typically inserted at the end of an expected high grade run, after vein intersections that contained significant sulphides. Blanks will monitor the calibration of analytical equipment and potential sample contamination during sample handling and preparation. Blanks were inserted with core samples at a ratio of 1:54 and totalled 2 % of all samples. A total of 144 Blanks were submitted including 33 Field Blanks and 33 Pulp Blanks.
Gold grades in Field Blanks submitted to ALS Chemex showed that only 3 results returned values marginally greater than the lower limit of detection 0.5ppm Au and were well within tolerance limits, returning values of up to 0.009 ppm Au. Copper grades in Field Blanks were on the whole acceptable with 67 % returning values below 1 standard deviation of 0.002 % Cu based on all samples. There are two outliers of 0.007 % and 0.008 % however these are considered insignificant and within tolerance limits.
As part of the Phase 1 quality control sample resubmission 33 pulp blanks, prepared by Inspectorate, were submitted for reanalysis. Gold grades for Pulp Blanks show that 67 % of returned grades are below the limit of detection. Of the remaining samples 8 returned values greater than 0.01 ppm Au, including one outlier, sample 145521 at 0.08 ppm Au. Copper values were much more variable with only 52 % returning values below 1 standard deviation of 0.007 % Cu based on all samples, with the majority of samples returning grades of 0.009 % Cu. There is one outlier, again sample 145521, which returned a grade of 0.04 % which is considered beyond acceptable limits.

SRK Consulting Tepal PEA Technical Report Page 54
GD/ha Tepal PEA Technical Report_2CG020 000_GD_20101101.docx Effective Date October 8, 2010
On the whole the results of Blank Sample Analysis are acceptable; however there are some anomalous assays for both field and pulp Blanks. Field Blanks are acceptable indicating that is no significant contamination issues in field sample preparation. Pulp samples demonstrate limited but significant values over acceptable limits for gold and copper, indicating a potential error in the numbering of sample 145521 or contamination during sample preparation. This anomalous value should be investigated.
13.1.2 Standard Samples
Certified Reference Material samples were prepared from mineral matrices that contain Gold and Copper values similar to the grade of the Tepal deposit, which are uniformly distributed throughout the pulverized rock. Standard statistical techniques are used to assign a recommended assay value with associated 95 % confidence interval (see Table 13.2). CRM’s were prepared by WCM Minerals, Burnaby, British Columbia and Rock Labs, New Zealand.
CRM samples were routinely submitted for assaying with core at a ratio of up to 1:60, totaling 2 % of all samples. Three CRM samples were used CU139, to assess lower grades, CU150 and OX14 for higher grades. A total of 60 CRM check samples were undertaken to check lab accuracy. Error plots for each CRM for gold and copper are presented in the following pages.
Table 13.2: Tepal CRM Assessment List
CRM ID Recommended Values Standard Deviation No of CRM's
submitted Au ppm Cu % Au ppm Cu%
CU139 0.55 0.43 0.031 0.007 34
CU150 0.79 0.59 0.033 0.012 11
Ox14 1.22 NA 0.057 NA 15

SRK Consulting Tepal PEA Technical Report Page 55
GD/ha Tepal PEA Technical Report_2CG020 000_GD_20101101.docx Effective Date October 8, 2010
Figure 13.1: Control Plot for CRM CU 139-Gold
Figure 13.2: Control Plot for CRM CU150-Gold

SRK Consulting Tepal PEA Technical Report Page 56
GD/ha Tepal PEA Technical Report_2CG020 000_GD_20101101.docx Effective Date October 8, 2010
Figure 13.3: Control Plot for CRM OX14-Gold
Figure 13.4: Control Plot for CRM CU139-Copper

SRK Consulting Tepal PEA Technical Report Page 57
GD/ha Tepal PEA Technical Report_2CG020 000_GD_20101101.docx Effective Date October 8, 2010
Figure 13.5: Control Plot for CRM CU150-Copper
The error plots for gold CRM assays show that 96.4 % are within +/- 2SD of the expected value. All samples fall within +/- 10% of the expected grade aside from CRM CU150 sample 144892 assayed at 0.900 ppm, 13.924 % higher than the expected CRM value of 0.790 g/t.
For copper 77.3 % of samples were within +/- 2SD of the expected CRM grade. All samples were within +/-10 % excluding CRM CU139 sample 142897 which returned an assay of 0.384 % Cu, 10.7% lower than the CRM expected value of 0.430 %.
In general, submitted standard samples showed good repeatability for both copper and gold at both low and high grades. There are only few significant outliers, however those identified should be investigated. Gold results for CRM CU139 are over reported by a mean value of 7.5 % however on the whole there appears to be no evidence of a strong systematic bias to either over or under reporting for either copper or gold, with results being generally well distributed around the expected grade.
It should be noted that the sample number on the (x) axis of the control plots also represent a time axis and analysis of the control plots suggests some analytical drift, resulting in cyclic peaks and troughs. This is acceptable given that the majority of assays fall within acceptable limits, but erroneous outliers may be caused by re-calibration of analytical equipment.

SRK Consulting Tepal PEA Technical Report Page 58
GD/ha Tepal PEA Technical Report_2CG020 000_GD_20101101.docx Effective Date October 8, 2010
The use of only one medium and one higher grade CRM type limits this assessment to one specific grade range for each analyte. It is highly recommended that a broader range of CRM’s are used for any further work to identify bias in analysis, particularly for lower grade ranges for gold. It is also considered that an insufficient number of CRM samples have been taken to ensure a reliable determination of analytical bias. It is recommended that a minimum of 2% CRM samples are inserted for any further work.
13.1.3 Duplicates
69 duplicate samples were re-analyzed and compared, accounting for 2 % of all samples.
Duplicates were either obtained from a Coarse Reject sample comprising a 1kg or 25 % split taken from a randomly selected coarse reject sample that had been returned from Inspectorate or from a Pulp Reject sample comprising a 100 gram sample taken from a randomly selected pulp reject sample that had been returned from Inspectorate after analysis.
There is a good correlation for pulp and coarse reject duplicates for gold, indicated by the correlation coefficients of 0.9319 and 0.9717 respectively. There is good level of precision between original assays and duplicate assays. 44 % of gold duplicate assays were within +/-10% of the original assay value.
A lesser level of precision between original and duplicate assays is shown for copper analysis. There appears to be some significant overestimating of coarse duplicates particularly at higher grades with one anomaly indicating a 102 % difference in copper grade. The sample has been flagged for reassessment. Correlation coefficients of 0.8112 and 0.867 indicate a reasonable level of precision.

SRK Consulting Tepal PEA Technical Report Page 59
GD/ha Tepal PEA Technical Report_2CG020 000_GD_20101101.docx Effective Date October 8, 2010
Figure 13.6: Inspectorate Coarse and Pulp Duplicates - Gold
Figure 13.7: ALS Chemex Coarse and Pulp Duplicates - Copper
Arian undertook a program of historical pulp duplicate re-analysis on available pulp samples to verify historical drill sample assay results. Pulps were available for a number of Teck and Hecla drillholes.
Pulp duplicate assessment shows repeatability of historical Au assay data is reasonable with correlation coefficients of 0.94 and 0.91 for Teck and Hecla samples respectively. Pulp duplicate assessment of Cu values returned equally satisfactory correlation coefficient values of 0.93 and 0.98 respectively.
As part of the Phase 1 diamond drill program Arian also twinned a number of historical drill holes for data verification purposes. Identification of twin holes by Arian was done by reference to historical collar co-ordinates in the historical database. See Table 13.3.
Arian was unable to locate evidence on the ground to confirm the accurate location of all but one of the INCO drill holes (IN-57002). Lack of evidence for the INCO drilling on the ground suggests co-ordinates for the INCO drilling listed in the historical database are incorrect. Due to the inability to accurately locate and verify the INCO hole data, these have been removed from the data verification assessment and subsequent resource study.

SRK Consulting Tepal PEA Technical Report Page 60
GD/ha Tepal PEA Technical Report_2CG020 000_GD_20101101.docx Effective Date October 8, 2010
Duplicate analysis shows a good level of precision for both gold and copper. However it is noted that there have been no field duplicates submitted for reanalysis during the analysis of holes beyond borehole AS-07-23. For future drilling operations it is essential that duplicates are continuously submitted throughout the drilling campaign. It is recommended that a minimum of 2 % of samples should be duplicates.
13.1.4 QA/QC Conclusions
On the whole, it is considered that QA/QC results do not demonstrate a systematic sample bias. Results of this work indicate that the analytical techniques employed by Inspectorate and Chemex are generally reliable in producing assay data that demonstrates a good level of accuracy and precision. However the occurrence of significant errors in a limited number blank samples show that there has been a potential miss-numbering or contamination of samples. CRM and duplicate analysis indicate that there is no significant bias to over or underreporting of assay results, although the presence of some erratic results indicates that there has been a limited potential for inaccuracies, this must be investigated.
The use of only three CRM types limits the assessment of bias in analysis. It is considered that a greater number of CRM samples and blanks should be submitted in any future work to ensure a more robust determination of analytical bias. It is recommended that CRM and blank samples are inserted at a minimum ratio of 1:40, concurrent with industry best practice.
Assay results from drilling and sampling programs implemented during 2006-2007 may be regarded as representative of the samples collected.
13.1.5 Analytical Laboratories
Inspectorate Laboratories are accredited to relevant national and international standards and ISO 9001:2000 registration ISO 17025 quality assurance accreditation.
ALS Chemex laboratories in North America are registered to ISO 9001:2000 for the “provision of assay and geochemical analytical services” by QMI Quality Registrars. In addition to ISO 9001:2000 registration, ALS Chemex’s North Vancouver laboratory has received ISO 17025 accreditation from the Standards Council of Canada under CAN-P-1579 “Guidelines for Accreditation of Mineral Analysis Testing Laboratories”. CAN-P-1579 is the Amplification and Interpretation of CAN-P-4D “General Requirements for the Accreditation of Calibration and Testing Laboratories” (Standards Council of Canada ISO/IEC 17025).

SRK Consulting Tepal PEA Technical Report Page 61
GD/ha Tepal PEA Technical Report_2CG020 000_GD_20101101.docx Effective Date October 8, 2010
Table 13.3: Summary of Arian Twin Drill Holes
Arian Drill Hole Original Drill Hole Comment AS-07-001 MHT-2 Hecla drillhole
AS-07-004 T-24 Teck Drillhole
AS-07-005 MHT-3 Hecla drillhole
AS-07-006 IN-57002 INCO drillhole - retained
AS-07-007 T-25 Teck Drillhole
AS-07-008 T-10 Teck Drillhole
AS-07-012 T-9 Teck Drillhole
AS-07-013 T-16 Teck Drillhole
AS-07-014 IN-57020 INCO drillhole - removed
AS-07-015 T-18 Teck Drillhole
AS-07-016 IN-57015 INCO drillhole - removed
AS-07-018 MHT-15 Hecla drillhole
AS-07-019 IN-57017 INCO drillhole - removed
AS-07-020 IN-57013 INCO drillhole - removed
A verification study of twin drill hole data conducted by Arian geologists indicated poor correlation between Arian diamond drill hole results and historical Hecla (MHT prefix) RC drill grades.
The ‘average’ difference for Au was 19 % and 16 % for copper (with maximums of 72 % and 142 % respectively). Due to the fact that the variance is so high and irregular indicate a systematic problem with the sampling techniques employed by Hecla. QA-QC work conducted by Arian, which included samples of pulp material from the Hecla samples has showed that their data to be unreliable.
To Arian’s knowledge, Hecla didn’t have a QA-QC procedure, and therefore it is impossible to know if the problems identified by Arian are a result of poor drilling practices, or by poor sample preparation and analysis of the samples by ALS Chemex. As Arian twinned 6 out of 17 of Hecla’s RC holes (or 35 %). Following discussion with Arian, Howe has decided that the historic assay results provided by Hecla are inaccurate and has removed all Hecla assay data from the Tepal database.
A review of geology in the Hecla drill-holes does indicate a good correlation with Arian’s drill-holes, and this data has been included to aid Arian with their modeling of geology in the North and South Resource areas (M. Booth pers. comm.).
13.2 Previous Howe Verification Sampling
During previous studies on the Tepal project by Priesmeyer in 2007, Howe collected a total of eleven samples from the property (Table 13.4). All samples were collected under Howe’s direct supervision and were placed in appropriately numbered sample bags and sealed at the project site. These samples were sealed in sacks and transported by Howe to the ALS-Chemex sample preparation facility in Guadalajara, Mexico.

SRK Consulting Tepal PEA Technical Report Page 62
GD/ha Tepal PEA Technical Report_2CG020 000_GD_20101101.docx Effective Date October 8, 2010
The Howe samples were crushed to 75 % passing 2 mm followed by the pulverization of a 250 gm split in chromium steel to 85 % passing 75 microns. The gold content of these samples was determined by means of atomic adsorption on a 50 gm sub-sample. Each sample was also analyzed for 32 other elements by inductively coupled plasma preceded by an aqua regia digestion.
Seven rock chip samples were collected from the property for the purpose of data verification. Due to the fact that samples collected by previous operators were all collected nearly 10 years ago or more, it was difficult to identify sample locations from previous operators. Howe collected five samples from areas in which the metal content was unknown and two from locations that had been previously samples by Arian. For the two locations sampled by both Arian and Howe, Howe’s copper values were slightly higher. For one of the samples Howe obtained a significantly higher gold grade and for the other a significantly lower gold grade.
The inconsistency probably results from discontinuous chip samples being collected from slightly different areas than the originals. In addition, in Howe’s experience it is common to have a high degree of variability in the reproducibility of gold assays. Howe is satisfied that its check samples have confirmed the presence of copper and gold in the selected samples.
There are no known coarse rejects or pulps that remain to be sampled for the purpose of verifying the data from the Hecla drilling, however core duplicates and sample splits from the Hecla drilling program have been preserved by the property owner in Tepalcatepec. The samples are stored in the original sample bags and for the most part are clearly marked. In some cases, the sample bags are stacked by drill hole and in others they are grouped by hole number and sample number in large sacks. Chip trays are also present and available for review.
Howe selected a further four samples from three drill holes to verify the original drill assays based on electronic files of analytical results from the Hecla drilling. Results from all four samples are very close to the original results, with two copper assays from the Howe sampling being higher and two being lower. Three of Howe’s samples returned higher gold values that the Hecla results.
On the basis of Howe’s data verification sampling, Howe is satisfied that its check samples have confirmed the presence of gold in the selected samples (Priesmeyer, 2007). However, the study highlights significant discrepancy in assay grades between original analyses and verification analyses.

SRK Consulting Tepal PEA Technical Report Page 63
GD/ha Tepal PEA Technical Report_2CG020 000_GD_20101101.docx Effective Date October 8, 2010
Table 13.4: Howe’s previous data verification sampling
Sample Number
Arian Sample Number or Drill Hole
Sample Width/Length
(m) UTM coordinates or From - To
(m) Original
Copper Value (%)
Howe Copper Value (%) Original Gold
Value (g/t) Howe Gold Value (g/t)
70258 37902 4.2 2116945 716547 0.25 0.52 1.24 3.33 70259 NA 4.3 2116992 716644 NA 0.24 NA 0.97 70260 NA 4.0 2117040 716624 NA 0.47 NA 1.32 70261 NA 3.0 2117002 716326 NA 0.11 NA 0.5 70262 NA 3.0 2116994 716594 NA 0.44 NA 1.17 70263 NA 3.8 2116847 716695 NA 0.11 NA 0.32 70264 37904 3.0 2115643 716760 0.04 0.06 0.41 0.13 70265 MHT-12 1.0 33 34 0.99 0.94 0.14 0.17 70266 MHT-3 1.0 39 40 0.85 0.91 3 3.37 70267 MHT-12 1.0 6 7 0.34 0.32 0.33 0.4 70268 MHT-6 1.0 109 110 0.18 0.19 0.67 0.66
SRK Consulting Tepal PEA Technical Report Page 64
GD/ha Tepal PEA Technical Report_2CG020 000_GD_20101101.docx Effective Date October 8, 2010
14 Data Verification 14.1 Metallurgical Data Verification
Geologix has prepared metallurgical composites from both the oxide and sulphide portion of the Arian drill core material and the head assays reported from all the composites, from both the analyses completed by G & T Metallurgical Services Ltd. and McClelland Laboratories Inc., described in more detail in Section 16 of this report, showed a strong agreement between the assay grades reported by Arian and those reported from the metallurgical testwork. Supervision of the metallurgical testwork was completed by William Joseph Schlitt, QP to the metallurgical program.
14.2 SRK Verification
As part of the PEA, SRK carried out a validation of the bock model resource estimate prepared by ACA Howe. SRK reviewed the estimation parameters for the block model, reviewed the resource classification parameters and carried out a visual validation of the model to verify that no fatal flaws existed in the estimation. As a final check, average composite grades and average block estimates were compared along different directions. This involved calculating de-clustered average composite grades and comparison with average block estimates along east-west, north-south, and horizontal swaths. The average composite grades and the average estimated block grades are quite similar in all directions. Overall, the validation shows that current resource estimates are very good reflection of drill hole assay data. The block model validation did not identify any significant errors in the estimated resource model. In addition, SRK carried out a site visit in July 2010, to verify the geological characteristics of the deposit and to evaluate to possible slope angles and stability for possible pit designs. QPs Dino Pilotto and Bruce Murphy visited the site. During their site visit they inspected the area of the potential pit, waste dump, tailings facility and mill areas and verified that the sites were appropriate to support the designed infrastructures. They also viewed drill core to verify general geotechnical characteristics and rock type. The tour included a visit to local towns to view existing roads and electrical power infrastructure. General site conditions and geotechnical characteristics were verified. No restrictions were placed on the SRK QPs during the site visit.

SRK Consulting Tepal PEA Technical Report Page 65
GD/ha Tepal PEA Technical Report_2CG020 000_GD_20101101.docx Effective Date October 8, 2010
15 Adjacent Properties This report does not rely upon, nor is affected by, information from adjacent properties.

SRK Consulting Tepal PEA Technical Report Page 66
GD/ha Tepal PEA Technical Report_2CG020 000_GD_20101101.docx Effective Date October 8, 2010
16 Mineral Processing and Metallurgical Testing 16.1 Introduction
The Tepal deposit is dominantly a copper-gold (Cu-Au) resource. The bulk of the resource (85 to 90%) is sulphidic, but is overlain by a distinct oxide zone. The sulphide responds well to milling, with production of a Cu-Au flotation concentrate. However, based on the current mine schedule, most of the oxide would be mined first. This material is a candidate for cyanide leaching, either in crushed ore heaps or coarse ore dumps. This would produce gold and some cyanide soluble copper. The latter would be removed from the gold circuit as a sulphide and combined with the concentrate using SART (sulphidation-acidification-recycling-thickening) technology.
To ensure that all process options were considered, milling and flotation of the oxide was also briefly investigated. This did produce a Cu-Au concentrate that could be leached. However, this option did not appear to offer any advantages over the more conventional heap leach approach in terms of recovery or cost.
Very little oxide-to-sulphide transition material has been encountered. Where it exists, most of the copper is still sulphidic and it responds well to flotation. Thus, any transition material will be mined and processed through the mill, along with the primary sulphide ore.
The balance of this section addresses the metallurgical testing that has been done on samples from the deposit. It starts with a brief review of the limited testwork programs conducted by previous owners. Then the focus shifts to the current program being conducted by Geologix. This portion contains material on sample selection, the three phases of the milling and flotation program on the sulphide ores, and the bottle roll and column leach testing done on the oxide ore. G&T Metallurgical Services, Limited (“G&T”) of Kamloops, British Columbia conducted the milling and flotation studies. McClelland Laboratories, Inc. (“MLI”) of Sparks, Nevada conducted the majority of the leaching testwork. The quality assurance/quality control (“QA/QC”) practices at both laboratories are discussed in a separate subsection. The final portion covers the conclusions.
Metric units are used throughout this section. Where English units are widely used, they are given in parentheses.
16.2 Historical Background
Apparently, neither Arian nor Hecla pursued a metallurgical testwork program on the property. Work done by two other previous owners is summarized below.

SRK Consulting Tepal PEA Technical Report Page 67
GD/ha Tepal PEA Technical Report_2CG020 000_GD_20101101.docx Effective Date October 8, 2010
16.2.1 The International Nickel Company of Canada, Limited (INCO)
The earliest testwork done on the property was conducted by INCO at their J. Roy Gordon Research Laboratory in mid-1973. INCO viewed the property as a Cu-Au porphyry and focused on production of a co-product concentrate. The composite tested was from the first 88 metres of drill hole 57002. The head grade assay for this composite was 0.43% Cu, 1.3 ppm Au and 1.25 ppm Ag.
Following some preliminary grinding and flotation trials, two locked cycle tests were performed. The primary grind size was a P86 of 325 mesh (44 µm). The ore charge was conditioned for 10 min at 20% solids and a pH of 11 using lime, xanthate (0.1 g/kg) and a frother. Then rougher flotation was run for 10 min. This was followed by three stages of cleaning, apparently without regrinding, using the same pH and xanthate concentration. Flotation times were too long in the first locked cycle test and were shortened to 5, 4 and 3 min., for the three cleaner stages respectively. Results for the second test are summarized in Table 16.1.
Table 16.1: INCO Flotation Recoveries and Grade
Constituent Final Cleaner Assay, % Or Ppm Distribution In Concentrate, %
Cu 12.7 74.2 Au 41 ~76 Ag 39 ~75 Mo 260 ~62
As can be seen, the INCO recoveries are reasonable, especially for the precious metals. However, the grade would be unacceptable and probably reflects the lack of a regrind step on the rougher concentrate. The tailings assayed 0.11% Cu, mostly as non-floating oxides. The gold content of the tailings was 0.25 ppm. The mode of occurrence of the gold in the tailings was not indicated.
16.2.2 Teck Corporation (Teck)
Unlike INCO, Teck viewed Tepal as a gold project and focused on cyanide leaching. The metallurgical work was done under contract at Lakefield Research, Peterborough, Ontario in mid-1993. Lakefield received six samples identified as T-101, 102, 103, 104, 110 and 114 and weighing about 5.5 kg each. Since the sample numbers do not match the Teck drill hole numbers, the origin of the samples is uncertain. Only samples T-103, 104, 110 and 114 were used to prepared composites to be tested. These had the highest gold grades, ranging from 1.07 to 1.36 g/t. Each of the four samples was blended and split in half. The halves were then blended to produce two composites. Composite 1 was crushed to minus 10 mesh (-2 mm). Composite 2 was retained in as-received condition with a ½-in. (12.5 mm) top size. The expected composite grade was 1.21 g/t Au and 4,775 g/t copper, of which 3,775 g/t (79%) was acid soluble. This composite appears to be similar in nature to the oxide ores currently being tested.

SRK Consulting Tepal PEA Technical Report Page 68
GD/ha Tepal PEA Technical Report_2CG020 000_GD_20101101.docx Effective Date October 8, 2010
Composite 1 was further ground to a P100 of 65 mesh (~225 µm) and then subjected to cyanide bottle roll leach tests. The tests were run for 48 h on 500 g charges at 40% solids and pH 11. Three cyanide levels were tested: 5, 10 and 20 kg/t NaCN. The latter represented 100% stoichiometry for complete gold extraction. The best results were obtained at 5 kg/t, with 90% gold extraction in 24 h; increasing to 95% after 48 h. Corresponding levels of copper extraction were 4.5% and 5.3%. Cyanide consumption was 0.91 kg/t, similar to that in the current tests.
Composite 2 was split into three size fractions and leached for seven days at pH 11 and 1.5 kg/t NaCN, with cyanide added as needed to maintain 0.5 g/L NaCN. After just three days, the gold extraction was essentially compete and was the same for all three splits. This extraction level averaged 84%, with 0.75 kg/t cyanide consumption. The copper extraction was slower (5.5% after three days), so stopping the leach after just three days minimized cyanide consumption.
Because the bulk of the copper was present in oxide form, an acid leach test was also performed on the coarse ore sample. This was run at 40% solids for seven days using a sulphuric acid solution at pH 1.5. Copper extraction was fast, with 60% recovery in two days. At this point acid consumption was 20 kg/t. Extending the leach to seven days only increased extraction to 63%, but caused a 50% increase in acid consumption.
16.3 Current Metallurgical Program
16.3.1 Sample Selection
None of the material that has been tested came from core or reverse circulation (RC) cuttings drilled by Geologix. This is because the metallurgical work began before Geologix undertook its first drilling campaign. Therefore, all samples were taken from core drilled by Arian. Details are shown in the following tables. The samples include material from the North Sulphide Zone (NSX), the North Oxide Zone (NOX) and the South Sulphide Zone (SSX). For some tests, the North Zone was divided into a northern section and a southern section. Later, samples from the South Oxide Zone (SOX) were included in the leach program at MLI.
All source-of-sample tables follow the same format. Each gives the composite or laboratory sample number, the drill hole number, the beginning and ending depth for the interval, and the Arian gold and copper assays for the interval.
Table 16.2 identifies the source of the samples used in the initial testwork at G&T. A 2-m interval from each drill hole was selected for preparation of the composites for the testwork. These composites were identified as NSX-1, NOX-1, and SSX-1. These samples were also used in the second program conducted at G&T. An additional sulphide composite from the North Zone, NSX-2, was included in the second G&T program. This was prepared the same way as the others, with source details given in Table 16.3.

SRK Consulting Tepal PEA Technical Report Page 69
GD/ha Tepal PEA Technical Report_2CG020 000_GD_20101101.docx Effective Date October 8, 2010
The third phase of the testwork at G&T utilized two new sulphide composites, one from each zone. These were identified as NSX-3 and SSX-2. Preparation of these composites followed the same procedures as the earlier ones. The source details are given in Table 16.4.
All testwork conducted by MLI was performed on material from the oxide, rather than the sulphide zones. The oxide composites were drawn from both the South and North zones, with the latter further divided into north and south areas. Bottle roll leach tests were run on 11 samples taken from all areas of the resource, thus representing a variability study. Source information on these samples is presented in Table 16.5. As discussed later, bottle roll tests were also performed on pulverized splits from the oxide column composites. The sources for these composites are shown in Table 16.6. The column composites are NOXCL01 (north end of North Oxide Zone), NOXCL2 (south end of North Oxide Zone), and SOXCL1 (South Oxide Zone).
Table 16.2: Drill Core Identification for Initial Set of G&T Samples
Composite Drill Hole Drill Hole Interval, m
Au ppm Cu ppm From To
SSX-1 AS-07-013 96 130 0.302 1,440 SSX-1 AS-07-038 48 100 0.227 1,560 SSX-1 AS-07-015 40 90 1.196 6,500 SSX-1 AS-07-007 174 216 0.632 2,620 SSX-1 AS-07-009 16 56 0.127 670
Average of five selected sample 0.497 2,558 NSX-1 AS-07-004 62 106 1.273 6,600 NSX-1 AS-07-037 50 96 0.143 1,640 NSX-1 AS-07-014 134 180 0.528 2,650 NSX-1 AS-07-012A 122 152 0.358 1,970 NSX-1 AS-07-008 90 132 0.365 2,200
Average of five selected samples 0.533 3,012 NOX-1 AS-07-006 6 50 1.439 4,900 NOX-1 AS-07-014 10 40 0.112 2,580 NOX-1 AS-07-010 0 24 0.357 2,160 NOX-1 AS-07-030 16 46 0.463 3,010 NOX-1 AS-07-012A 36 64 0.387 1,970
Average of five selected samples 0.552 2,924 Note: From and To give the interval from which a 2-m section was selected. Five 2-m intervals comprise each composite.

SRK Consulting Tepal PEA Technical Report Page 70
GD/ha Tepal PEA Technical Report_2CG020 000_GD_20101101.docx Effective Date October 8, 2010
Table 16.3: Drill Core Identification for Composite NSX-2
Composite Drill Hole Drill Hole Interval, m
Au ppm Cu ppm From To
NSX-2 AS-07-004 62 106 1.328 5,500 NSX-2 AS-07-012A 122 152 0.358 2,150 NSX-2 AS-07-008 90 132 0.32 2,190 NSX-2 AS-07-037 50 96 0.215 2,550 NSX-2 AS-07-014 134 180 0.546 2,770
Average of five selected samples 0.553 3,032 Note: From and To give the interval from which a 2-m section was selected. Five 2-m intervals comprise each composite.

SRK Consulting Tepal PEA Technical Report Page 71
GD/ha Tepal PEA Technical Report_2CG020 000_GD_20101101.docx Effective Date October 8, 2010
Table 16.4: Drill Core Identification for Composites NSX-3 and SSX-2
Composite Drill Hole Drill Hole Interval, m
Au ppm Cu ppm From To
NSX-3 AS-07-012A 144 146 0.447 2,040 NSX-3 AS-07-006 164 166 0.519 2,930 NSX-3 AS-07-006 76 78 1.066 6,100 NSX-3 AS-07-030 58 60 0.427 2,380 NSX-3 AS-07-008 120 122 0.385 1,830 NSX-3 AS-07-004 110 112 0.505 2,180 NSX-3 AS-07-014 164 166 1.41 6,800 NSX-3 AS-07-014 52 54 0.115 2,270 NSX-3 AS-07-016 46 48 1.005 6,500 NSX-3 AS-07-037 70 72 0.204 2,340 NSX-3 AS-07-037 162 164 0.12 2,030 NSX-3 AS-07-038 120 122 0.234 2,170 NSX-3 AS-07-006 182 184 0.231 2,060 NSX-3 AS-07-010 78 80 0.305 2,630
Average of five selected samples 0.498 3,161
SSX-2 AS-07-039 94 96 0.409 1,240 SSX-2 AS-07-009 92 94 0.473 2,300 SSX-2 AS-07-007 48 50 0.339 2,890 SSX-2 AS-07-007 196 198 0.641 2,280 SSX-2 AS-07-038 104 106 0.476 2,570 SSX-2 AS-07-001 160 162 0.714 3,860 SSX-2 AS-07-001 174 176 0.87 5,300 SSX-2 AS-07-015 34 36 0.37 1,190 SSX-2 AS-07-033 34 36 0.119 1,180 SSX-2 AS-07-033 58 60 0.316 2,460 SSX-2 AS-07-013 76 78 0.418 1,940 SSX-2 AS-07-005 50 52 0.57 1,660 SSX-2 AS-07-005 68 70 0.64 1,810 SSX-2 AS-07-005 98 100 1.017 6,800
Average of five selected samples 0.527 2,677
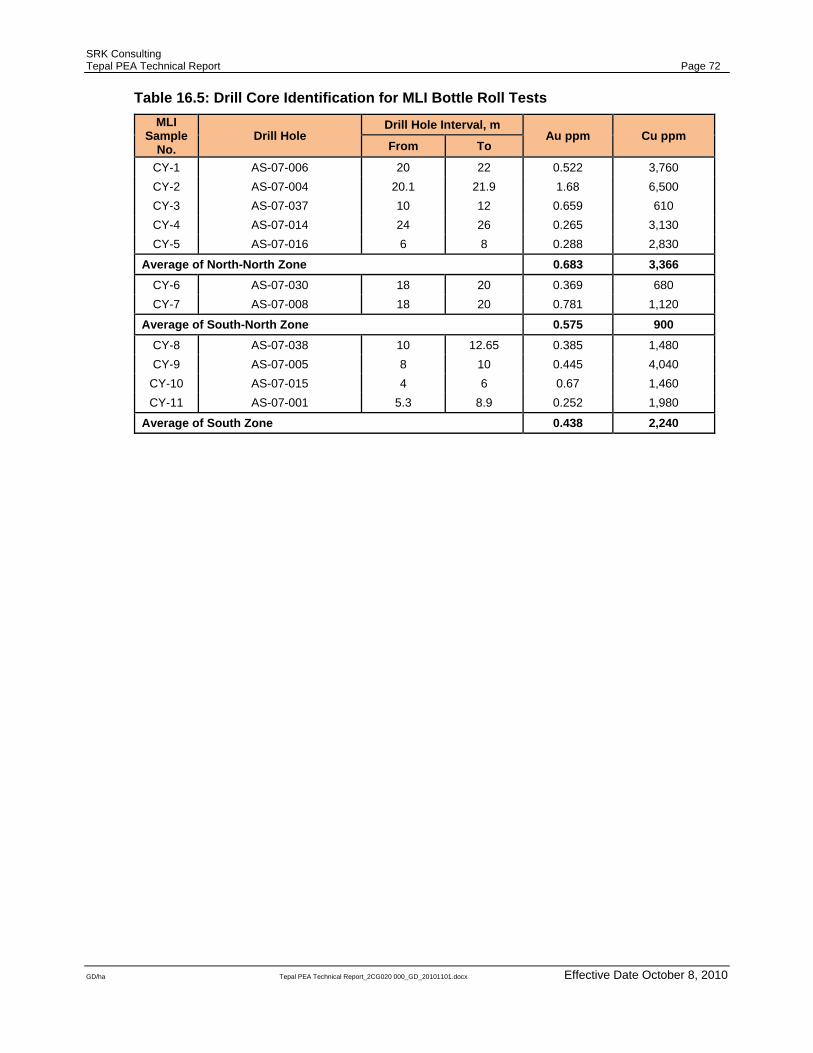
SRK Consulting Tepal PEA Technical Report Page 72
GD/ha Tepal PEA Technical Report_2CG020 000_GD_20101101.docx Effective Date October 8, 2010
Table 16.5: Drill Core Identification for MLI Bottle Roll Tests MLI
Sample No.
Drill Hole Drill Hole Interval, m
Au ppm Cu ppm From To
CY-1 AS-07-006 20 22 0.522 3,760 CY-2 AS-07-004 20.1 21.9 1.68 6,500 CY-3 AS-07-037 10 12 0.659 610 CY-4 AS-07-014 24 26 0.265 3,130 CY-5 AS-07-016 6 8 0.288 2,830
Average of North-North Zone 0.683 3,366 CY-6 AS-07-030 18 20 0.369 680 CY-7 AS-07-008 18 20 0.781 1,120
Average of South-North Zone 0.575 900 CY-8 AS-07-038 10 12.65 0.385 1,480 CY-9 AS-07-005 8 10 0.445 4,040
CY-10 AS-07-015 4 6 0.67 1,460 CY-11 AS-07-001 5.3 8.9 0.252 1,980
Average of South Zone 0.438 2,240

SRK Consulting Tepal PEA Technical Report Page 73
GD/ha Tepal PEA Technical Report_2CG020 000_GD_20101101.docx Effective Date October 8, 2010
Table 16.6: Drill Core Identification for MLI Oxide Column Test Composites
Composite Drill Hole Drill Hole Interval, m
Au ppm Cu ppm From To
NOXCL01 AS-07-006 6 8 1.533 3,850
22 24 0.414 3,940
NOXCL01 AS-07-004 11.1 12.4 0.733 5,100 16.5 18.55 1.022 8,300
NOXCL01 AS-07-037 14 16 0.459 610
20.25 22.05 0.241 8,080
NOXCL01 AS-07-010 2 4 0.565 2,860
12 13.66 0.22 1,530
NOXCL01 AS-07-014 20 22 0.102 1,690 30 32 0.139 1,850
NOXCL01 AS-07-016 2.2 4 0.321 3,270 14 16.35 0.345 3,100
Average of selected samples 0.523 3,735
NOXCL02 AS-07-030 8 10 0.268 1,400
22 24 0.451 1,940 30 32 0.714 1,800
NOXCL02 AS-07-018 5.95 8.1 0.28 2,480 12.1 14.2 0.271 1,210 16 18 0.198 2,080
NOXCL02 AS-07-019 4 6 0.526 1,430
10 12 0.225 700 12 14 0.339 1,160
NOXCL02 AS-07-008 6.01 8 0.361 2,050 10 12 0.398 1,430 14 16 0.427 1,390
Average of selected samples 0.372 1,589
SOXCL01 AS-07-038 4 6 0.228 1,800
15.5 17.5 0.406 2,570
SOXCL01 AS-07-005 6 8 0.803 4,020
10 12 0.93 3,600
SOXCL01 AS-07-015 2 4 0.668 1,340 6 8 0.644 5,600
SOXCL01 AS-07-001 8.9 10.5 0.231 2,400 10.5 12 0.258 2,520
SOXCL01 AS-07-009 6 8 0.514 5,300 4 6 0.549 4,500
SOXCL01 AS-07-007 0 2 0.5 2,630 4 6 0.445 2,530
Average of selected samples 0.52 3,239

SRK Consulting Tepal PEA Technical Report Page 74
GD/ha Tepal PEA Technical Report_2CG020 000_GD_20101101.docx Effective Date October 8, 2010
The single most important factor in a metallurgical testwork program is how well the samples being tested represent the ore type or portion of the resource being studied. The samples for the program were selected by the Geologix geologist in an effort to provide representative material. Best efforts were made in selecting samples that met the following criteria:
• Collect samples that were spatially representative of each zone.
• Collect samples that were representative of all grade ranges within each zone.
• Ensure that the weighted average grade for each zone was a close as possible to average deposit grade.
The spatial representation of the samples can be seen in Figure 11.1, which shows the location of the Arian drill holes. Material available for selection of the oxide composites was more limited than the sulphides. A as a result, preparing a representative composite was more difficult and the variation from the average grade of the deposit was greater than it was for the sulphides.
Table 16.7 shows a comparison between the composite grades and the grades given in the resource report. The overall average gold and copper composite grades are slightly higher than resource grades. However, most gold grades are less than 0.1 g/t higher and most copper grades differ by 0.1% Cu, or less. The only significant difference is in the low values for NOXCL02. However, this reflects reality, as the southern portion of the north zone has lower gold and copper grades than the northern portion.
Table 16.7: Comparison of Composite Sample Grades and Resource Grades
Composite Weighted Sample Grades Resource grades
Au, g/t Cu, % Au, g/t Cu, % NSX-1 0.533 0.3 0.45 0.25 NSX-2 0.553 0.32 0.45 0.25 NSX-3 0.498 0.32 0.45 0.25 SSX-1 0.497 0.26 0.44 0.21 SSX-2 0.527 0.27 0.44 0.21 NOX-1 0.552 0.29 0.5 0.27
NOXCL01 0.523 0.37 0.5 0.27 NOXCL02 0.372 0.16 0.5 0.27 SOXCL01 0.52 0.32 0.44 0.22
16.3.2 Metallurgical Testing at G&T Metallurgical Services, Ltd. (G&T)
Three separate metallurgical testwork programs have been conducted at G&T. All have focused primarily on standard milling and flotation of the sulphidic portion of the Tepal deposit. The first was a broad scoping study undertaken in November 2009. Testing was completed in December 2009 and the final report on that work was issued in January 2010. The second program addressed gold recovery from the North and South Zones. This work began in January 2010 and was completed in February 2010, with the final report released in March 2010.

SRK Consulting Tepal PEA Technical Report Page 75
GD/ha Tepal PEA Technical Report_2CG020 000_GD_20101101.docx Effective Date October 8, 2010
The third program once again focused on recovery of copper and gold using milling and flotation. The work began in late May 2010 and was concluded in July 2010. The final report was issued in August 2010. Each G&T program is discussed in more detail in the following sections.
G&T Scoping Study
This G&T program was intended to be a broad initial study on the metallurgy of the Tepal deposit. The composites tested included NSX-1, NOX-1 and SSX-1. There were four objectives in this part of the program:
1. Characterize the chemical and mineralogical makeup of the ore based on the composites from the North Zone sulphide and oxide material and from the South Zone sulphide.
2. Determine the grinding power requirements for the North Zone sulphide, which is the most important part of the resource.
3. Begin development of a conventional milling and flotation process to recover the copper and gold in a salable concentrate.
4. Asses the potential for cyanide leaching of the North Zone oxide to recover the gold.
The chemical analyses and mineralogical nature of the three composites are summarized in Table 16.8. The chemical and mineral contents were determined by using standard analytical techniques and QEMSCAN particle mineral analysis. As can be seen, the copper and gold head grades of all three composites are nearly the same. The sulphide zones are dominated by hypogene mineralization, while the oxide zone is nearly devoid of any copper sulphides. In the oxide, the copper is largely embedded in the chlorite or limonite.

SRK Consulting Tepal PEA Technical Report Page 76
GD/ha Tepal PEA Technical Report_2CG020 000_GD_20101101.docx Effective Date October 8, 2010
Table 16.8: Chemical and Mineralogical Makeup of the Tepal Composites
Name Symbol Units NSX-1 SSX-1 NOX-1 Elements Copper Cu % 0.25 0.21 0.26 Iron Fe % 4.3 4.7 6.3 Sulphur S % 2.11 2.16 0.08 Gold Au % 0.46 0.46 0.48 Silver Ag % 2 1 1 Acid Sol. Cu CuOx % 0.01 0.01 0.08 Cyanide Sol. Cu CuCN % 0.01 0.01 0.05
Minerals Chalcopyrite & Bornite Cp & Bn % 0.72 0.61 0.04 Covellite Cv % 0.003 0.02 0.02 Cuprite Cup % 0.01 - - - 0.01 Cu-Chlorite Chl % - - - - - - 0.18 Limonite Lim % - - - - - - 1.45 Pyrite Py % 2.59 4.08 0.09 Gangue Gn % 96.7 95.3 98.1
The Bond grinding work index (“Wi”) was determined at a sieve size of 106 µm. The P80 of the feed was 1949 µm and the P80 of the final product was 78 µm. The resulting value of Wi for NSX-1 was 19.8 kWh/metric tonne (“mt”). Such an ore would be classified as “hard”. No other comminution parameters were determined for any of the sulphide composites.
Most of the flotation testing was done on the North Zone composite. In the first test, the copper rougher float was followed by a pyrite float in an effort to maximize gold recovery. The intent was to determine whether or not a pyrite concentrate could be produced that was suitable for further processing to improve overall gold recovery.
With an initial grind of 150 µm, the first rougher concentrate contained 12% Cu and 19.4 g/t Au, for recoveries of 60% and 46.5%, respectively. The first pyrite concentrate contained 0.54% Cu and 2.20 g/t Au, giving recoveries of only 4% and 8%, respectively. Due to the high gold recovery in the copper concentrate, the pyrite option was not pursued further during this part of the program.
The test was repeated without the pyrite circuit. The first rougher concentrate graded 16.0% Cu and 21.9 g/t Au, with recoveries of 74.5% and 46.4% respectively. Overall rougher recovery was 87% and gold recovery was 63% at a mass pull of 3%. When the rougher concentrate was reground to 47 µm and floated in the cleaner circuit, the concentrate assayed 25.7% Cu and 25.8 g/t Au, with recoveries of 72.8% and 36.1% respectively. A second cleaner test at a finer regrind (31 µm) gave better results. The final concentrate graded 26.9% Cu and 33.9 g/t Au, giving recoveries of 82.1% and 46.9%, respectively. The silver content was 53 g/t, for a recovery of about 25%.

SRK Consulting Tepal PEA Technical Report Page 77
GD/ha Tepal PEA Technical Report_2CG020 000_GD_20101101.docx Effective Date October 8, 2010
The concentrate quality was quite satisfactory. No minor elements were present at levels that would incur penalties. On the other hand, the gold and silver contents were both high enough to warrant payment for by-product credits.
An effort was then made to float the North Zone oxide composite without using any type of sulfidizer to improve oxide flotation. Only a rougher test was run. The combined concentrate assayed 0.92% Cu and 9.4 g/t Au, with a mass pull of 2.8%. Copper recovery was only 10.2%, but gold recovery was 56.2%.
A single flotation test was then run on the South Zone sulphide composite. Metallurgical performance was not as good as it had been with the North Zone material. At a nominal P80 of 150 µm, the first south sulphide rougher concentrate graded 7.2% Cu and 10.0 g/t Au, giving recoveries of 59.4% and 39.4%, respectively. Overall recovery at the rougher stage was 78.8% for copper and 59.0% for gold, but at a 12% mass pull. When reground to 27 µm and cleaned, the final concentrate assayed 26.8% Cu and 28.8 g/t Au, with respective recoveries of 62.3% and 27.9%. The latter is significantly lower that the gold recovery from the oxide composite.
Following the flotation tests, a standard 48-h bottle roll test was run on a 0.5-kg sample of the north oxide composite ground to a P80 of 162 µm. Cyanide additions totalled 2 g/kg at a pH of 11. Results were encouraging, with maximum gold recovery (79.8%) achieved in 24 h. Silver recovery was about 25%, the same as in flotation. Cyanide consumption was 1.4 kg/t and lime consumption was 2.9 kg/t. Extraction of copper by cyanide was not reported, but based on the cyanide consumption, it was likely significant.
The final part of the scoping study was to assess the potential for recovering gold from the rougher tailings using gravity techniques. This was a two-step process. A Knelson concentrator was first used to recover the gold. Then the gold was further concentrated by panning. The Knelson concentrator recovered about 60% of the gold in the tailings. The pan concentrate assayed just under 8 g/t, representing 39 % of the gold in the tailing. This grade is relatively low, indicating that more work would be needed to optimize any tailings recovery process. Much of this gold is associated with pyrite, which may warrant further processing.
G&T Gold Recovery Study The second study conducted by G&T focused primarily on gold recovery from the two sulphide zones. The South Zone composite was SSX-1, as used in the first study. The North Zone composite was a new one designated NSX-2. The objectives of the study were as follows:
1. Compare the characteristics of NSX-2 with those of the sulphide composites used in the first study.
2. Perform four bench scale cleaner tests to assess the metallurgical response of the samples at a targeted P80 87μm grind size for SSX-1 and a P80 158 μm grind size for NSX-2, using a conventional copper-gold flowsheet with sequential pyrite flotation.

SRK Consulting Tepal PEA Technical Report Page 78
GD/ha Tepal PEA Technical Report_2CG020 000_GD_20101101.docx Effective Date October 8, 2010
3. Assess the quality of the pyrite concentrates for gold recovery through cyanide leaching using standard bottle roll tests.
4. Assess the quality of the final pyrite rougher tailings for gold recovery using the Knelson gravity concentration unit, followed by hand panning of the Knelson concentrate.
5. Evaluate the gold occurrence in the pan concentrates, using an Automated Digital Imaging System (ADIS).
The South Zone composite was tested first. Flotation parameters were those established in the first program. At the P80 87 μm primary grind, flotation performance was much better than it had been with the P80 150 µm grind. With a 7% mass pull, the rougher concentrate contained 2.39% Cu and 3.63 g/t Au, giving recoveries of 82.8% and 57.6%, respectively. The cleaner concentrate graded 28.5% Cu and 37.6 g/t Au, with corresponding recoveries of 76.3% and 46.3%. The copper recovery was 20% better than it had been at the coarser grind and the gold recovery was nearly 50% better. Silver recovery was 23.6%. Even at the finer grind the pyrite rougher concentrate was low grade. It contained 0.19% Cu (6.0% recovery) and 1.38 g/t Au (19.7% recovery) while the rougher tails carried 22% of the gold.
The pyrite concentrates from the South Zone tests were combined and subjected to a standard 48-h bottle roll cyanide leach test. This extracted 8% of the feed gold. The bottle roll leach residue was the reground to 14 µm and given another 48-h bottle roll leach test. This extracted an additional 5.5% of the feed gold. Cyanide consumption was 1.2 kg/t and lime consumption was also 1.2 kg/t in the first test. In the test at the finer size, cyanide consumption rose to 2.4 kg/t, with lime consumption at1.9 kg/t. Again, copper extraction was not reported.
An effort was made to produce a gravity concentrate from the pyrite rougher tailings using the Knelson concentrator. The Knelson concentrate was then upgraded by hand panning. The final pan concentrate contained only 2.8% of the feed gold at a grade of 10.8 g/t.
The new North Zone sulphide composite was similar to NSX-1, having the same copper grade but a higher gold content (0.63 g/t vs. 0.46 g/t). Flotation performance was also similar. With a 5% mass pull the rougher concentrate assayed 4.92% Cu and 7.73 g/t Au, with recoveries of 87.3% and 64.5%, respectively. Silver recovery was 26%. The cleaner concentrate graded 26.0% Cu and 35.6 g/t Au, corresponding to respective recoveries of 78.3% and 50.5%. The pyrite concentrate was very similar to the South Zone product. The North concentrate ran 0.22% Cu (6.3% recovery) and 1.44 g/t Au (18.9% recovery). Leaching of this product extracted 51.4 % of the gold in the concentrate, or about 10% of the gold in the feed. Cyanide consumption was 0.6 kg/t and lime consumption was 1.1 kg/t. The low gold grades of these tailings products, combined with the low recoveries, suggests that these approaches to increased gold recovery may not be economic.

SRK Consulting Tepal PEA Technical Report Page 79
GD/ha Tepal PEA Technical Report_2CG020 000_GD_20101101.docx Effective Date October 8, 2010
G&T Flotation Optimization Study The third program at G&T focused on optimizing the copper-gold flowsheet for flotation. Two new sulphide composites were used in this study, one from each zone (composites NSX-3 and SSX-2). The objectives of this program were as follows:
1. Compare the characteristics of the new composites with those of the previous ones.
2. Optimize the metallurgical response of each composite in rougher, cleaner and locked cycle testing.
3. Analyze the concentrates from the best locked cycle tests to determine concentrate quality and the concentration of any impurities that might be above the threshold penalty levels.
Table 16.9 compares the chemical composition of all five sulphide composites used by G&T. As can be seen, all five had about the same copper, iron and silver contents. Gold grades ranged from 0.46 to 0.63 g/t. SSX-2 had a slightly lower sulphur level than the others.
Table 16.9: Comparison of Head Assays for the G&T Composites
Composite Assays, % or g/t
Cu Fe S Au Ag
SSX-1 0.21 4.7 2.16 0.46 1
SSX-2 0.26 4.1 1.69 0.6 2
NSX-1 0.25 4.3 2.11 0.46 2
NSX-2 0.26 4.1 2.49 0.63 2
NSX-3 0.27 4 2.23 0.47 2
Table 16.10 compares the major mineral content of four of the five composites. SSX-1 had a higher pyrite content than the others, while NSX-1 had a lower quartz content. However, all are high in silica and have similar compositions and mineralogies. The main difference is in the calcite, which is lower in the North Zone than in the South Zone.
Table 16.10: Comparison of Composite Mineralogy
Mineral Mineral Content, %
SSX-1 SSX-2 NSX-1 NSX-3 Cu Sulphides 0.73 0.85 0.85 0.73 Pyrite 4.7 2.25 2.87 2.73 Hematite 1.64 1.67 1.73 1.8 Quartz 32.4 38.5 26.9 32.7 Chlorites 10.9 10.2 14.8 10.2 Feldspars 19.8 17.9 33.5 27.6 Micas 19 18.1 9.6 17.9 Calcite 5.25 4.77 3.39 1.11 9 Others 5.6 5.8 6.4 5.2

SRK Consulting Tepal PEA Technical Report Page 80
GD/ha Tepal PEA Technical Report_2CG020 000_GD_20101101.docx Effective Date October 8, 2010
Three types of laboratory tests were conducted to optimize copper-gold flotation. These started with rougher tests where the grind size was varied from 150 µm down to 100 µm. Five different collectors were also screened, including PAX to boost gold recovery. Various pH levels were tried, as well. These tests were followed by cleaner optimization tests. Variables included regrinding to a range of 49 µm down to 13 µm. Various collectors and dosages were also screened, along with different pH levels. The third type of tests involved locked cycle runs to simulate continuous operations. These were conducted utilizing the optimal conditions obtained in the rougher and cleaner tests.
Nine rougher tests were conducted at three nominal grind sizes (150, 125 and 100 µm) and three pH levels (9.5. 10.5 and 11.0), plus the reagent screening. There was little difference at the two finer sizes, but recovery did drop off at 150 µm. The pH level had only a minor effect on copper recovery. However, for both composites, gold recovery improved at pH 9.5. However, this was due to the increased mass pull, with more gold-bearing pyrite reporting to the rougher concentrate.
Five collectors were investigated: 208, 3418A, SEX, 5100 and PAX. The choice of collector had little effect on copper recovery from either composite. However, 3418A gave the best gold recovery with NSX-3 while SEX gave the best recovery with SSX-2. PAX also improved gold recovery for both composites, but this was due mainly to pulling more pyrite into the concentrates.
Six cleaner tests were run by varying the regrind size (nominal 15, 25, 35 and 50 µm), the pH (10.5 and 11.0) and the collectors (3418A and PAX). The regrind size did not have a major impact on either copper or gold recovery from either composite. The 25 µm regrind was selected as the best choice. The pH had no effect on the North Zone composite, but a pH of 11 gave the best copper and gold recovery from the South Zone composite. There was no difference in copper or gold recovery from SSX-2 with the two collectors. Copper recovery from NSX-3 was unaffected by the choice of collector, but PAX boosted gold recovery. However, this was simply due to the stronger collecting capabilities of the PAX reagent, which pulled considerable gold-bearing pyrite into the north concentrate. On this basis, 3418A was selected as the preferred collector.
Three locked cycle tests were run. The first test was conducted on the South Zone composite. Recoveries were good at 85% for copper and 58% for gold, with silver in the mid-20% range. However, the copper grade was below 20%, which could make it difficult to market. Therefore a second test was run with a lower reagent dosage in an effort to reject more pyrite to tailings. The resulting concentrate grade was much improved, at 26.1% Cu and 32.7 g/t Au. Metal recoveries dropped only slightly, to 84% for copper and 52% for gold.
Only a single locked cycle test was run on NSX-3. As in previous work, the North Zone composite out performed the South Zone sample. The North Zone cleaner concentrate ran 27% Cu at 90% recovery and 33.8 g/t Au at 65% recovery.

SRK Consulting Tepal PEA Technical Report Page 81
GD/ha Tepal PEA Technical Report_2CG020 000_GD_20101101.docx Effective Date October 8, 2010
Complete assays from the two final concentrates are shown in Table 16.11. It does not appear that any of the impurities exceed threshold levels for smelter penalties. The high gold values should make these concentrates highly desirable for toll smelters.
Table 16.11: Comparison of North and South Zone Concentrate Quality
Elements Units SSX-2 (Test 32) NSX-3 (Test 34) Aluminum % 0.8 0.62 Antimony g/t 129 33 Arsenic g/t 238 55 Bismuth g/t 54 25 Cadmium g/t 12 <10 Calcium % 0.34 0.29 Cobalt g/t 132 80 Copper % 19.6 27 Fluorine g/t 125 141 Gold g/t 28.1 33.8 Iron % 33.7 32.4 Lead % 0 0 Magnesium % 0.23 0.19 Manganese % 0.01 0.01 Mercury g/t <1 <1 Molybdenum % 0.09 0.06 Nickel g/t 172 172 Phosphorus g/t 110 99 Selenium g/t 89 123 Silicon % 2 1 Silver g/t 28 47 Sulphur % 38.3 34.8 Zinc % 0.02 0.02
16.3.3 Leach Testwork at McClelland Laboratories, Inc. (MLI)
Two types of cyanide leach tests were conducted; standard bottle roll testing and column leach testing, with each type further discussed below. Samples are those described in Tables 16.5 and 16.6. Acid-base-accounting tests were also performed on the column leach residues. Ancillary comminution tests and oxide flotation tests were conducted by third party vendors. The latter included cyanide leaching of the reground concentrate and tailings in an effort to increase gold recovery.

SRK Consulting Tepal PEA Technical Report Page 82
GD/ha Tepal PEA Technical Report_2CG020 000_GD_20101101.docx Effective Date October 8, 2010
Bottle Roll Testing
A total of 14 bottle roll tests were performed; 11 on samples from throughout the deposit (CY-1 through 11) and three on splits from the three column composites (NOXCL01, NOXCL02 and SOXCL03). Thus, the samples represent a small-scale variability study. The three tests on column composites were done primarily to begin establishing a correlation between the gold and copper extractions from the fine bottle roll charges (minus 10 mesh or -2 mm) and the coarser column charges (+12.5 mm or + ½ in. top size).
All tests were run using a standard set of conditions. The samples were split from the blended composites, and then pulverized to a P80 of 1.7 mm. A nominal 0.5-kg sample was split out from the composite for a triplicate head assay and a1-kg sample was split out for leaching and the exact dry weight was recorded. Head assays were limited to gold, copper and silver. The natural pH was determined and the bottle roll charge was then loaded and leached at a nominal 40% solids. The exact volume of leach solution was recorded and the bottle was agitated on rollers for a total of 96 h. Agitation was interrupted after 2, 6, 24, 48, 72 and 96 h. A 100-ml aliquot of solution was withdrawn at each of these times. These solution samples were checked for pH and cyanide concentration and were assayed for copper and gold. Silver assays were attempted, but the silver content was generally at or below the level of detection. Cyanide concentration was maintained at 1 g/L by additions of sodium cyanide (NaCN) and the pH was held between 10.5 and 11.0 with additions of lime (CaO).
Results from the bottle roll tests are summarized in Table 16.12. In general, the results are positive. Gold extraction averaged just over 80%, with a fairly narrow range of 70 to 90%. There was little difference between the variability and composite samples, with the former giving slightly better recoveries on average. However, the variability samples exhibited a much lower average copper extraction than the composites (6 vs. 17%), even though there was little difference in the average head grades (2,195 vs. 2,385 g/t). The wide variation in copper extraction suggests that the copper mineralogy may vary across the deposit, being more soluble in some places than others. As a result of the higher copper extraction, cyanide consumption was also higher for the column composites than the variability samples (1.41 vs. 0.57 kg/t NaCN). Average lime consumption was much closer, 4.2 vs. 3.9 kg/t. Here lime consumption is based on the CaO content of the hydrated lime used as reagent.

SRK Consulting Tepal PEA Technical Report Page 83
GD/ha Tepal PEA Technical Report_2CG020 000_GD_20101101.docx Effective Date October 8, 2010
Table 16.12: Summary of Bottle Roll Results for All Tests
Composite MLI No
Au Head Grade (g/t) Au
Recovery (%)
Cu Head Grade (g/t) Cu
Extraction (%)
Ag Recovery
(%)
Reagent Requirements Natural
pH (Drill Hole or Composite) Calc’d. Assay Calc’d Assay NaCN (kg/t)
Lime (kg/t)1
MEX5601 CY-1 0.53 0.49 90.6 2797 2773 4.4 10.5 0.45 1.7 7.4 (AS-07-006) MEX5602 CY-3 0.53 0.49 83 602 647 4.2 16.7 0.43 6.8 4.3 (AS-07-037) MEX5603 CY-5 0.16 0.16 81.3 2248 2227 3.9 10.5 0.38 4.2 6.8 (AS-07-016) MEX5604 CY-4 0.2 0.19 70 2335 2327 4.2 50 0.4 2.6 7.2 (AS-07-014) MEX5605 CY-2 1.34 1.18 80.6 5052 5033 15.5 55 2.08 2.1 5.9 (AS-07-004) MEX5606 CY-6 0.37 0.34 78.4 710 700 6.6 18.2 0.22 4.6 5.4 (AS-07-030) MEX5607 CY-9 0.9 0.83 83.3 1080 1070 4.6 16.7 0.52 9.2 3.9 (AS-07-008) MEX5608 CY-7 0.41 0.38 85.4 1467 1450 13.2 10 0.67 2.2 7.1 (AS-07-038) MEX5609 CY-10 0.47 0.44 78.7 4181 4093 3.1 14.8 0.45 3.4 6.2 (AS-07-005) MEX5610 CY-11 0.38 0.37 76.3 2368 2320 5.4 18.8 0.53 2.6 7.7 (AS-07-001) MEX5611 CY-8 0.58 0.56 84.5 1307 1287 0.5 9.1 0.15 3.8 7.8 (AS-07-015) Variability Average 81.1 6 20.9 0.57 3.9 6.3 N-N end Oxide CY-14 0.48 0.47 77.1 2966 2943 25.7 15.8 2.35 4.9 4.3 (NOXCL01) N-S end Oxide CY-12 0.38 0.39 84.2 1469 1457 10.3 16.7 0.68 4.9 5.7 (NOXCL02) S Oxide CY-13 0.53 0.56 73.6 2717 2833 14.9 68.8 1.2 2.9 7.2 (SOXCL01) Composite Average 78.3 17 33.8 1.41 4.2 5.7 Overall Average 0.52 0.49 80.5 2236 2226 8.3 23.7 0.75 4 6.2
Note 1. The lime requirement is based on the CaO content of the hydrated lime used as reagent.

SRK Consulting Tepal PEA Technical Report Page 84
GD/ha Tepal PEA Technical Report_2CG020 000_GD_20101101.docx Effective Date October 8, 2010
In most samples, the extraction of gold was very rapid, with at least 60% of the gold solubilized in six hours, or less. In a few cases extraction exceeded 80% in six hours. A typical leach curve is shown in Figure 16.1. About a third of the samples were leached to exhaustion in 24 h, while another third were still leaching, albeit quite slowly, when the tests were terminated after 96 h. The remaining tests reached their extraction limit in 48 to 72 h. One sample, MEX5605 (CY-2) had an atypical leach curve (see Figure 16.2) that was pseudo-parabolic. This sample was the highest grade of any tested, with 1.18 g/t Au. The large amount of gold was more than twice the average head grade. Thus, the sample may have simply required more time to leach that much metal. Copper leaching was somewhat slower than gold, with most copper leached to exhaustion between 48 and 72 h. In three samples, copper extraction was continuing slowly when the test was terminated.
Other results showed that the natural pH of the samples varied from acidic to neutral (pH 3.9 to 7.8). The average was near neutral at 6.2. Although not a major consideration due to its low value, silver recovery varied widely, from 68.8 to 9.1 %. The average was about 25%. The average back calculated head grades agreed closely with the average head assays. This indicates that there were no significant assay accountability issues. For gold the average back calculated grade was 0.52 g/t vs. 0.49 g/t for the head assay. For copper the respective averages were 2,236 vs. 2,226 g/t.
Figure 16.1: Typical Leach Curve for Fast Leaching Sample (MEX5601 or CY-1)

SRK Consulting Tepal PEA Technical Report Page 85
GD/ha Tepal PEA Technical Report_2CG020 000_GD_20101101.docx Effective Date October 8, 2010
Figure 16.2: Atypical Leach Curve with Pseudo-Parabolic Form (MEX5605 or CY-2)
Column Leach Tests
Column Test Procedures. Three column tests were run on Tepal oxide composites, one each from the north end of the North Zone (P1), the south end of the North Zone (P2) and the South Zone (P3). These followed the earlier bottle roll tests. Prior to testing, a split from each composite was screened into size fractions, which were then weighed and assayed for gold and copper. Another split was taken for triplicate heads assays covering gold, copper and silver.
The results from the composite bottle roll tests were used to estimate the lime additions for the columns. These were 3.9 kg/t for the North composites and 2.3 kg/t for the South based on 80% of the corresponding bottle roll requirements. The columns were 100 mm (4-in.) in diameter by 3 m tall. Each column was charged with about 30 kg of ore (exact weight recorded) with a nominal P80
crush size of 12.5 mm. This size meets the requirement that the column diameter be at least eight times the particle top size in order to avoid wall effects during leaching, i.e. the short circuiting of solution along the column walls. The material did not require agglomeration prior to charging into the columns.
After charging with the ore and lime mix, each column was leached with 2.40 L/day of solution containing 0.5 g/L NaCN. This leach rate was 0.2 L/min/m2 or 0.005 gpm/ft2. On a daily basis, the volume of pregnant leach solution (PLS) draining from each column was recorded and a 30 ml aliquot of solution was taken. This was checked for pH and analyzed for gold, copper and cyanide contents. Silver concentrations were found to be below the level of detection. The coarse composites proved to be more acidic than expected, especially the north-north column (P1). Thus, the initial pH levels were lower than desired, initially in the pH range of 6 to 7.

SRK Consulting Tepal PEA Technical Report Page 86
GD/ha Tepal PEA Technical Report_2CG020 000_GD_20101101.docx Effective Date October 8, 2010
In order to get to the pH range of 10.5 to 11, caustic soda (NaOH) was added to the feed solution to each column, along with any cyanide additions needed to maintain the 0.5 g/L concentration. Total caustic additions to P1, P2 and P3 were 3.85, 3.32 and 2.84, kg/t, respectively.
All columns were run for 88 days, followed by a 5-day drain down period. The 88-day period included two 14-day rest cycles (only one for P1) and a rinse cycle to remove soluble gold and residual cyanide prior to drain down. The drainage volume was recorded to determine the solution holdup when under active leach. The results showed that the columns contained about 19% water under active leach and 8 to 10% when fully drained.
The rest cycles were run when the gold content of the PLS dropped down to values near the detection limit. During the rest cycle, the cyanide in the residual solution within the column was able to solubilize more metal values, maximizing extraction.
During leaching, the PLS was run through three carbon columns operating in series (four for P1). This was done to remove the gold and silver, producing a barren solution for recycling to the columns. At the end of the tests the carbon was also checked for copper loading.
Following each drain down, the leach residue was removed and a split was immediately removed for final moisture determination. The balance was then dried and reweighed. After drying, the residue was rescreened and each size fraction was assayed to determine the final gold and copper extractions as a function of particle size.
Column Test Results. The predicted, back calculated and average triplicate head assays all agreed closely for gold. For copper the predicted values were slightly higher than the direct or calculated head assays. However, precision was still excellent. Results are summarized in Table 16.13 and 16.14. The small standard deviation and high level of precision indicate that there were no significant assay accountability issues that might affect the results.
Table 16.13: Comparison of Gold Head Assays for Column Composites
Determination Composite Gold Head Grade, gAu/t
North-North Oxide North-South Oxide South Oxide (NOXCL01) (NOXCL02) (SOXCL03)
Predicted Assay 0.51 0.37 0.53 Average Direct Assay1 0.47 0.39 0.56 Calc’d. Bottle Roll 1.7 mm 0.48 0.38 0.53 Calc’d. Head Screen 12.5 mm 0.49 0.37 0.51 Cacl’d. Column, 12.5 mm 0.45 0.36 0.51 Weighted Average 0.47 0.38 0.54 Standard Deviation 0.02 0.02 0.03 Precision, % 95.7 94.7 94.4
Note 1. Average of triplicate assays.

SRK Consulting Tepal PEA Technical Report Page 87
GD/ha Tepal PEA Technical Report_2CG020 000_GD_20101101.docx Effective Date October 8, 2010
Table 16.14: Comparison of Copper Head Assays for Column Composites
Determination Composite Copper Head Grade, ppm Cu
North-North Oxide North-South Oxide South Oxide (NOXCL01) (NOXCL02) (SOXCL03)
Predicted Assay 3640 1592 3266 Average Direct Assay1 2943 1457 2833 Calc’d. Bottle Roll 1.7 mm 2966 1457 2717 Calc’d. Head Screen 12.5 mm 2917 1463 2728 Calc’d. Column, 12.5 mm 3060 1470 2717 Weighted Average 2962 1460 2777 Standard Deviation 118 26 63 Precision, % 96 98.2 97.7
Note 1. Average of triplicate assays.
Recoveries and reagent consumptions for the three columns are shown in Table 16.15. Silver values were not reported by MLI for the columns due to the low silver head grades. The values shown are based the cumulative extraction in the columns, with head grades from the bottle roll composites. Key values for the column and bottle roll tests are compared in Table 16.16. Silver recovery is not shown, but averaged 23.6% in the columns and 17.0% in the bottle rolls. The much longer exposure period in the columns may explain the higher column extractions.
Care should be exercised when using the column test lime consumptions. These were based on the column composite bottle roll lime demand. The coarse ore proved to be more acidic than expected, so that the amount of lime added was insufficient to maintain the desired pH level. Thus, the reported lime additions are biased low. Additional alkalinity had to be provided during the test, in order to hold the pH level between 10.5 and 11. This was done by adding caustic (NaOH) to the barren solution being returned to the columns. Because the hydrated lime and the caustic solution may not react with the ore in the same manner, estimating the lime equivalent of the caustic is uncertain. One approach would be to base the estimate on the molecular weights of CaO and NaOH required. When this is done the equivalent lime requirements are 5.2 kg/t for P1, 4.8 kg/t for P2 and 3.5 kg/t for P3. However, further tests are required to confirm the lime demand. The lower lime consumption in the South Zone composite is likely due to the higher calcite content in this part of the deposit.
Table 16.15: Summary of Column Leach Results
Composite Metal Recovery, % Reagent Consumption, kg/t
Gold Copper Silver1 NaCN Lime2 NaOH
NOXCL01 75.6 21.8 10 1.99 3.9 3.86
NOXCL02 86.1 11.2 31 1.38 3.9 3.32
SOXCL03 72.5 8.9 30 1.39 2.3 2.84 Note 1. Silver recovery was not reported by the columns by MLI. Approximate values are based on the reported cumulative silver extraction in the columns and the head grades reported by MLI for the bottle roll samples of each column composite. Note 2. Lime consumption is based on the CaO content of the hydrated lime used as reagent.

SRK Consulting Tepal PEA Technical Report Page 88
GD/ha Tepal PEA Technical Report_2CG020 000_GD_20101101.docx Effective Date October 8, 2010
Table 16.16: Comparison of Key Column and Bottle Roll Results
Composite
Metal Recovery, % Cyanide Consumption, kg/t Gold Copper
Column BR Column BR Column BR
NOXCL01 75.6 77.1 21.8 25.7 1.99 2.35
NOXCL02 86.1 84.2 11.2 10.3 1.38 0.68
SOXCL03 72.5 73.6 8.9 14.9 1.39 1.2
Average 78.1 78.3 14 17 1.59 1.41
The close agreement between the column and bottle roll gold extractions is encouraging, albeit with significantly different cycle times. These results show that a significant portion of the gold is cyanide soluble and can be extracted from coarse as well as fine material. Although confirmatory testwork would be required, similar extraction levels may be achievable from even coarser ore, given enough time. At this point, no diagnostic work has been done on the column residues to determine the nature of the gold that was not extracted.
The copper extraction was actually lower in the columns than in the bottle rolls, in spite of the longer leach cycles. This may be related to the lower surface area per unit weight in the columns. The high cyanide consumptions undoubtedly reflect the high levels of copper extraction.
Although the total column cycle time was 88 days, this included both rest and rinse cycles that produced little additional gold but increased copper extraction. Most of the gold extraction occurred much faster. Table 16.17 shows how quickly each column achieved 80, 90 and 98% of the final gold extraction. As can be seen, nearly complete gold extraction was achieved in less than two months. Less than 2% of the gold was extracted during the third month of the leach cycle. All three columns exhibited leach curves with a pseudo-parabolic shape, similar to Figure 16.3. An example for NOXCL02 (P2) is shown in Figure 16.3. This figure also shows the “bump” in copper extraction due to the rest and rinse cycle.
The initial leach rate for the north-north composite (Figure 16.4) may be biased to the low side. This column operated for some time at an excessively low pH, which would have been detrimental to gold extraction. As shown in Table 16.17, it reached 80 and 90% extraction more slowly than the others. However, once the pH finally reached the range of 10 to 11, the extraction rate increased and it reached 98% extraction more quickly than the south zone column (P3). The leach rate in Column P1 may also have been affected by the limited availability of the cyanide reagent due to the high soluble copper content. Unfortunately, there was not enough material remaining to repeat the test,

SRK Consulting Tepal PEA Technical Report Page 89
GD/ha Tepal PEA Technical Report_2CG020 000_GD_20101101.docx Effective Date October 8, 2010
Table 16.17: Leach Cycle Time to Reach Various Extraction Levels
% of Total Gold Extraction Leach Time, days
NOXCL01 (P1) NOXCL02 (P2) SOXCL03 (P3) 80 28 10 15 90 38 16 23 98 53 34 59
Figure 16.3: Column Leach Curve for Gold and Copper in Composite NOXCL02 (P2)
Figure 16.4: Leach Curves for NOXCL01 Showing the Slow Initial Leach Rate

SRK Consulting Tepal PEA Technical Report Page 90
GD/ha Tepal PEA Technical Report_2CG020 000_GD_20101101.docx Effective Date October 8, 2010
In addition to whole ore assays and recoveries, screen size distributions were run on the heads and leach residues from all three composites. Each screen fraction was then weighed and assayed for gold and copper. The results provide information on recovery as a function of particle size, plus data on enrichment and the possible degradation of the ore during leaching.
Tables 16.18 to 16.20 give the size distributions, head and residue gold assays and the gold extraction by size fraction for each composite. Table 16.18 compares the copper assays in the heads and residues. As can be seen from the first three tables, there was no tendency for the particle size to decrease during leaching. In some cases the percentages of the coarsest sizes actually increased while the finest decreased. Apparently there was some chemical precipitation and particle adhesion taking place during the leach cycle. However, there was no evidence that this adversely impacted gold recovery or solution percolation. Table 16.21 shows that copper extraction increased as the particle size decreased.
All three composites had similar size distributions, with about 80% of the material in the plus 1.7 mm (plus 10 mesh) sizes and about 8% below 150 µm. There was little upgrading of gold with decreasing particle size, except in the finest size range. The fines represented 7% to 10% of the material, but carried 15 to 21% of the gold. Gold recovery from the fines averaged over 90%, while recovery from the coarser material was much lower and largely independent of the size. Gold recoveries from all but the finest fraction were below the average recovery. This demonstrates the importance of the fines to leach recovery. If coarser ore is heap leached, it is uncertain how the recovery will respond if the fines content is significantly decreased. This will have to be tested in future metallurgical programs.
Table 16.18: Size Distribution and Gold Recovery for NOXCL01 (P1)
Size Fraction Weight Percent Gold Content, g/t Gold Recovery,
% Head Residue Head Residue +12.5 mm 23.0 25.8 0.36 0.1 72.2 12.5 x 6.3 mm 33.7 32.8 0.46 0.13 71.7 6.3 x 1.7 mm 22.2 21.3 0.46 0.11 76.1 1.7 mm x 850 µm 5.3 4.9 0.39 0.1 74.4 850 x 420 µm 2.7 3 0.39 0.11 71.8 420 x 212 µm 1.7 1.8 0.52 0.18 65.4 212 x 150 µm 1 0.6 0.65 0.18 72.3 -150 µm 10.4 9.8 0.98 0.1 89.8
Composite 100 10 0.49 0.11 77.6

SRK Consulting Tepal PEA Technical Report Page 91
GD/ha Tepal PEA Technical Report_2CG020 000_GD_20101101.docx Effective Date October 8, 2010
Table 16.19: Size Distribution and Gold Recovery for NOXCL02 (P2)
Size Fraction Weight Percent Gold Content, g/t Gold Recovery,
% Head Residue Head Residue +12.5 mm 21.3 21.4 0.36 0.07 80.6 12.5 x 6.3 mm 37.2 35.8 0.33 0.05 84.8 6.3 x 1.7 mm 23.1 22.9 0.33 0.05 84.8 1.7 mm x 850 µm 5.4 6.2 0.27 0.04 85.2 850 x 420 µm 3.2 3.6 0.26 0.04 84.6 420 x 212 µm 2.1 2.3 0.33 0.07 78.8 212 x 150 µm 0.9 0.9 0.33 0.08 75.8 -150 µm 6.8 6.9 0.88 0.05 94.3
Composite 100 100 0.37 0.05 86.5
Table 16.20: Size Distribution and Gold Recovery for SOXCL01 (P3)
Size Fraction Weight Percent Gold Content, g/t Gold Recovery,
% Head Residue Head Residue +12.5 mm 19.4 21.8 0.51 0.16 68.6 12.5 x 6.3 mm 40.5 41.2 0.46 0.13 71.7 6.3 x 1.7 mm 21 19.5 0.46 0.16 65.2 1.7 mm x 850 µm 5.3 4.7 0.46 0.13 71.7 850 x 420 µm 2.6 2.8 0.47 0.14 70.2 420 x 212 µm 1.9 2.5 0.5 0.14 72 212 x 150 µm 0.9 0.7 0.64 0.14 78.1 -150 µm 8.4 6.8 0.9 0.09 90
Composite 100 100 0.51 0.14 72.5

SRK Consulting Tepal PEA Technical Report Page 92
GD/ha Tepal PEA Technical Report_2CG020 000_GD_20101101.docx Effective Date October 8, 2010
Table 16.21: Comparison of Copper Assays in the Column Heads and Residues
Size Fraction Copper Assays, g/t
NOXCL01 (P1) NOXCL02 (P2) SOXCL01 (P3) Head Residue Head Residue Head Residue
+12.5 mm 1,925 1.9 1,250 1,230 2,390 2,200 12.5 x 6.3 mm 2,750 2,490 1,470 1,240 2,670 2,470 6.3 x 1.7 mm 2,830 2,380 1,370 1,250 2,610 2,490 1.7 mm x 850 µm 3,170 2,420 1,465 1,320 2,750 2,500 850 x 420 µm 3,310 2,570 1,600 1,470 2,800 2,600 420 x 212 µm 3,700 2,850 1,875 1,660 3,190 2,760 212 x 150 µm 4,060 2,940 1,905 1,660 3,150 2,730 -150 µm 5,370 3,210 2,160 1,790 3,900 3,090
Composite 2,917 2,393 1,463 1,305 2,728 2,476
One area that requires further investigation is how to deal with the high concentration of cyanide soluble copper that builds up in the leach circuit. Table 16.22 summarizes the parameters related to the copper buildup in the leach circuit. As shown, on a mass basis there is far more copper being extracted than gold. As a result, the copper built up in solution, reaching levels as high as 2.1 g/L after a single leach cycle. The copper also tied up cyanide and loaded on the carbon, where it would end up contaminating the gold doré. Therefore, future work will be undertaken to study the removal of copper from the circuit, along with the recovery of the cyanide. One possibility is the SART (sulfidation-acidification-recycling-thickening) technology. This would remove the copper as a sulphide, which could be combined with the copper concentrate.
The columns displayed excellent stability during entire leach cycle. The column heights were unchanged, indicating that there was no “slumping” of the charge during leaching. In addition, there was no change in bulk density reported for the columns, showing that there was no decrease in the void space for solution flow. Finally, no standing solution was seen on top of the columns and there was no dry material in the residue when the columns were unloaded. This provides solid evidence that percolation through the ore was reasonably uniform and that no permeability problems developed during leaching.
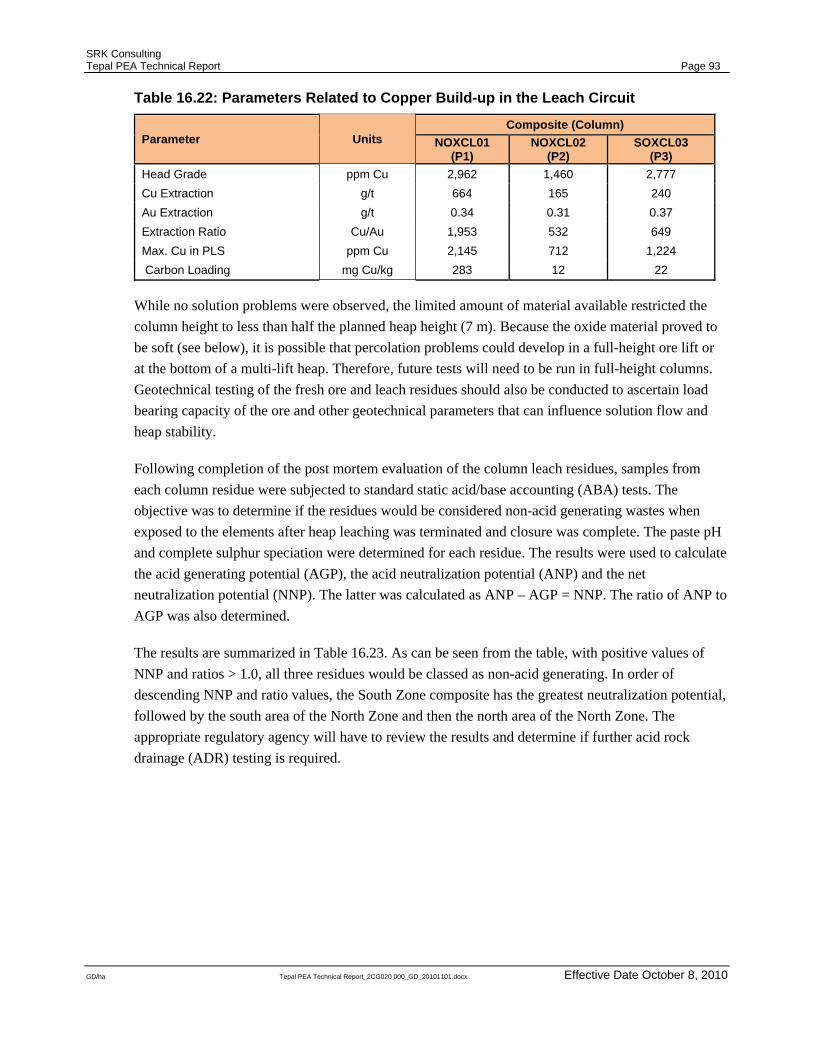
SRK Consulting Tepal PEA Technical Report Page 93
GD/ha Tepal PEA Technical Report_2CG020 000_GD_20101101.docx Effective Date October 8, 2010
Table 16.22: Parameters Related to Copper Build-up in the Leach Circuit
Parameter Units Composite (Column)
NOXCL01 (P1)
NOXCL02 (P2)
SOXCL03(P3)
Head Grade ppm Cu 2,962 1,460 2,777 Cu Extraction g/t 664 165 240 Au Extraction g/t 0.34 0.31 0.37 Extraction Ratio Cu/Au 1,953 532 649 Max. Cu in PLS ppm Cu 2,145 712 1,224 Carbon Loading mg Cu/kg 283 12 22
While no solution problems were observed, the limited amount of material available restricted the column height to less than half the planned heap height (7 m). Because the oxide material proved to be soft (see below), it is possible that percolation problems could develop in a full-height ore lift or at the bottom of a multi-lift heap. Therefore, future tests will need to be run in full-height columns. Geotechnical testing of the fresh ore and leach residues should also be conducted to ascertain load bearing capacity of the ore and other geotechnical parameters that can influence solution flow and heap stability.
Following completion of the post mortem evaluation of the column leach residues, samples from each column residue were subjected to standard static acid/base accounting (ABA) tests. The objective was to determine if the residues would be considered non-acid generating wastes when exposed to the elements after heap leaching was terminated and closure was complete. The paste pH and complete sulphur speciation were determined for each residue. The results were used to calculate the acid generating potential (AGP), the acid neutralization potential (ANP) and the net neutralization potential (NNP). The latter was calculated as ANP – AGP = NNP. The ratio of ANP to AGP was also determined.
The results are summarized in Table 16.23. As can be seen from the table, with positive values of NNP and ratios > 1.0, all three residues would be classed as non-acid generating. In order of descending NNP and ratio values, the South Zone composite has the greatest neutralization potential, followed by the south area of the North Zone and then the north area of the North Zone. The appropriate regulatory agency will have to review the results and determine if further acid rock drainage (ADR) testing is required.

SRK Consulting Tepal PEA Technical Report Page 94
GD/ha Tepal PEA Technical Report_2CG020 000_GD_20101101.docx Effective Date October 8, 2010
Following preparation of the column charges, there were about 8 kg of surplus North-South Zone composite (NOXCL02) remaining. This material was shipped to Phillips Enterprises L.L.C. in Golden, Colorado for comminution testing. Due to the limited amount of material and the relatively fine top size (~12.5 mm) only a Ball Mill Grindability Index (“Wi”) and an Abrasion Index (“Ai”) could be determined. The testing gave a Wi of 9 kW-h/mt, less than half the value exhibited by the North Zone sulphide ore. A value of 9 kW-h/t would be classed as moderately soft. Since the crushing work index is typically 1 to 2 kW-h/t lower than the grinding work index, the Tepal oxide should use much less power for crushing than the sulphide.
The comminution testing also gave an Ai of just 0.0245. Materials with values of Ai below 0.1 are considered to be only mildly abrasive. Thus, the value of 0.0245 indicates that the Tepal oxide is virtually non-abrasive. More comprehensive comminution testing to determine the crushing work index and other parameters requires whole core, preferably PQ. Such tests should be included in the next phase of the metallurgical program.
Table 16.23: Summary of results from static acid/base accounting tests
Sample ID Paste pH Sulphur Content, wt% as S
AGP ANP NNP Ratio
Sulphate Pyritic S (ANP – AGP) (ANP:AGP)P1 9.38 0.14 0.11 3.4 8.6 5.2 2.53 P2 9.77 0.09 0.09 2.8 11.6 8.8 4.14 P3 9.81 0.03 0.07 2.2 21.7 19.5 9.86
Material used for comminution testing retains its integrity. Therefore, following completion of the comminution program, the remaining north-south oxide composite was shipped to G&T for some additional flotation testing. This was prompted by results obtained during the first G&T program where rougher flotation of the oxide gave poor copper recovery but recovered almost 60% of the contained gold, more than was recovered from the South Zone sulphide.
At G&T, the NOXCL02 composite (6.3 kg) was blended with the remaining 20.9 kg of material from G&T composite NOX1. The blend was designated NOX3 and assayed 0.23% Cu, 5.3% Fe and 0.20% S, with 0.43 g/t Au. The copper included 0.08% in acid soluble form and 0.04% in cyanide soluble form. This composite was similar to NOX1, except for a higher sulphide content (0.20% vs. 0.08%).
After several rougher tests were run to optimize conditions, six tests were run to produce enough rougher concentrate for subsequent cyanidation tests. Flotation conditions included a 146 µm primary grind size at pH 9.0 and 50 to 60 g/t PAX as collector. With an average mass pull of 5.3%, the rougher concentrate graded 4.3g/t Au (52% recovery) and 0.61% Cu (14% recovery).
The rougher concentrate was then leached in cyanide, with and without regrinding to 13 µm. In both tests, a 48-h leach cycle was used with lime additions to pH 11 and a sodium cyanide concentration of 1,000 ppm. Results are summarized in Table 16.24. As shown, with a regrind, gold extraction

SRK Consulting Tepal PEA Technical Report Page 95
GD/ha Tepal PEA Technical Report_2CG020 000_GD_20101101.docx Effective Date October 8, 2010
approached 100%. However, even at 98% the recovery of gold from the ore drops from 52 to 50%. On the other hand, the cyanide consumptions appear high, but only apply to 5% of the ore mass.
As a result, the total quantity of cyanide consumed is only about one third of that consumed at 1.59 kg/t when applied to 100% of the ore.
Table 16.24: Summary of Concentrate Leach Results
Concentrate Regrind Metal Recovery, % Reagent Consumption, kg/t
Gold Copper NaCN Lime No 84 50 8 2.7 Yes 98 46 10.6 3.2
In addition to leaching the rougher concentrate, G&T also ran exploratory tests on leaching of the tails. Since 48% of the gold remained in the rougher tailings and the material was already finely ground, a tailings leach might be viable. Two tests were conducted under the same conditions as the concentrate leach tests. The head grade was 0.23 g/t Au and 0.21% Cu. In one test 78% of the gold was extracted, in the other, only 51%. Unfortunately, there were unresolved assay accountability issues and the results are questionable.
A third test was run after regrinding to 47 µm. In this trial, gold extraction was 89% and copper extraction was 13%. Cyanide consumption was 1.2 kg/t and lime consumption was 1.5 kg/t. This was better than the average bottle roll results on whole ore, but required fine grinding of the entire ore mass. However, the extraction was not as good as the average extraction from the -150 µm fraction in the column tests (91.4%).
From a process standpoint, one should note that the flotation recovery of gold from the oxide was significantly lower than the leach extractions in either the column or bottle roll leach tests. In addition, the entire oxide ore mass had to be crushed and coarse ground in order to achieve the particle size needed for flotation feed. Finally, there will be some further loss in recovery during concentrate leaching. Thus, in spite of the much smaller volume of material to leach, this route may be less attractive than heap leaching
16.4 Metallurgical QA/QC
At the moment, there are no specific guide lines on metallurgical testing for NI 43-101 reports. However, QA/QC programs are just as critical to the success of the metallurgical program as they are in the drilling program and modeling of the resource. The QA/QC programs in place at both laboratories are addressed in the following sections.

SRK Consulting Tepal PEA Technical Report Page 96
GD/ha Tepal PEA Technical Report_2CG020 000_GD_20101101.docx Effective Date October 8, 2010
16.4.1 G&T
G&T is an ISO 9001 certified laboratory. The ISO requirements cover equipment calibrations and operating protocols. G&T’s QA/QC practices include the following:
• For each test, the mass of test products must equal the mass of the initial feed, within 2 percent.
• For each project, a comparative head assay table is prepared. This table compares the recalculated feed value for each test (based on individual stream assays and weights) with the initially measured head assay values. The recalculated values need to be within 5 to 15 percent of the measured value depending on the element being assayed. If they are outside this accepted error range, re-assays are conducted until results are within that range.
• Commercially prepared standards are purchased with certified known concentrations. These standards are run with every set of samples to ensure the QC of the samples being assayed. The number of pulp standards applied for each element varies. For Tepal, they were as follows: Cu: 4 standards, Fe: 5 standards, S: 4 standards, Au: 3 standards.
16.4.2 MLI
MLI has an in-house QA/QC plan that encompasses four elements: a) Personnel training, b) Instrument calibration and maintenance, c) Instrument operation and d) Titrimetric testing.
• Personnel selected for performing laboratory activities are given the instructions or training commensurate with the scope, complexity, or special nature of the activities.
• All instruments including atomic absorption, pH metres, and probes (pH, ORP, etc) are calibrated and maintained using appropriate methods and standards to calibrate and verify satisfactory operations.
• There are specific operating protocols for all instruments including atomic absorption equipment and all types of metres and probes.
• Various titrimetric analytical procedures are performed at MLI in order to support the metallurgical tests. These QA/QC procedures apply to any of those methods, including free acid titrations. Prior to any analytical run, the procedures and reagents used are checked by titrating a selected standard. QC duplicate samples are titrated at a frequency of 5 samples per shift or 5% of the number of samples analyzed during a shift, whichever is greater. If results vary by greater than 5 percent, all samples analyzed during that shift are re-analyzed.
Specific to Tepal, all head and residue assays were run in triplicate. Either five samples or 5% of the solution analyses that were run in-house were also check assayed at an outside third-party laboratory. All sets of pulp assays run by outside laboratories included at least one standard, one blank and one replicate. If any of these had failed to check within specified limits, the entire set of samples would have been reassayed. Fortunately this did not occur with any of the Tepal samples.

SRK Consulting Tepal PEA Technical Report Page 97
GD/ha Tepal PEA Technical Report_2CG020 000_GD_20101101.docx Effective Date October 8, 2010
Back calculated compositions were compared to head assays. If agreement had differed by more than 10%, assays would have been rerun. If this failed to resolve the discrepancy, then the test would have been repeated. Fortunately, such measures were not required, as assay agreement was excellent.
16.5 Conclusions
The results obtained from the metallurgical testwork programs undertaken at G&T and MLI lead to the conclusions enumerated below.
16.5.1 Sulphide Ore Processing • The QA/QC procedures in place at G&T are more than adequate to assure the accuracy of the
metallurgical results.
• With one exception, back calculated and assays heads agreed closely, showing that there were no significant assaying problems affecting the flotation program.
• Based on a single Bond ball mill grindability test conducted on NSX-1, the North Zone grinding work index was 19.8 kW-h/mt, which would rank the material as “hard”.
• Following optimization studies on various parameters, including grind size, collectors and dosages, and pH levels, locked cycle testing showed that the sulphide ore responded well to conventional copper-gold technology. Material from the North Zone responded somewhat better than material from the South Zone. The optimum primary grind was 125 µm, regrinding to 25 µm for cleaning. The collector 3418A gave the best overall performance. The ore from the North Zone was little impacted by pH, but the South Zone material performed better at pH 11.
• The North Zone locked cycle cleaner concentrate graded 27% Cu at 90% recovery and 33.8 g/t Au at 65% recovery. The South Zone cleaner concentrate assayed 26.1% Cu and 32.7 g/t Au. Metal recoveries dropped to 84% for copper and 52% for gold.
• Final concentrate quality was excellent, with payable gold and silver and no impurities present at concentrations above threshold penalty levels. Silver recovery to concentrate was typically around 25%
• Evaluation of the tailings showed that most of the unrecovered gold was associated with pyrite. However, a few particles of free gold were observed. Installation of a gravity trap on the tailings line should recover most of the free particles, marginally increasing overall gold recovery
• Because most of the unrecovered gold was associated with pyrite, a pyrite concentrate was produced and a gravity concentrate was produced from the pyrite tailings. Gold grades were low in both products and cyanide leaching did not do a good job extracting the gold. As a result, further gold recovery from the rougher tailings does not appear to be economically viable.

SRK Consulting Tepal PEA Technical Report Page 98
GD/ha Tepal PEA Technical Report_2CG020 000_GD_20101101.docx Effective Date October 8, 2010
16.5.2 Oxide Ore Processing • The QA/QC procedures in place at MLI are more than adequate to assure the accuracy of the
metallurgical results.
• In all cases the back calculated and assay head grades agreed closely, indicating that no significant assay accountability issues affected the results. For the gold assays, the standard deviation was 0.02 g/t and the precision averaged 95%. For copper the results were even better, with an average precision of more than 97%.
• Based on a single Bond ball mill grindability test conducted on N0XCL02, the grinding work index was 9.0 kW-h/mt, which would rank the material as “moderately soft”. Thus, crushing the oxide should require about half the power needed for crushing the sulphide ore.
• Based on a single test conducted on NOXCL02, the abrasion index for the oxide was measured as 0.0245. Such a value would class the oxide as being nearly non-abrasive.
• Eleven -1.7 mm samples spatially distributed across the deposit and covering the expected range of head grades were subjected to bottle roll cyanide leaching. On average, 81% of the gold, 21% of the silver and 6% of the copper were extracted in this small-scale variability test program. Gold recovery ranged from 70 to 91%, while copper extraction varied from 0.5 to 15.5%.
• In the bottle roll program, cyanide consumption averaged 0.57 kg NaCN per tonne. The range was 0.15 to 2.08 kg/t and generally increased as copper extraction increased. Lime consumption averaged 3.9 kg/t, with a range of 1.7 to 9.2 kg/t.
• Gold extraction was rapid in the bottle roll program, with most tests reaching 60% recovery in six hours, or less. One third of the samples were leached to exhaustion in less than 24 h and another third were leached to exhaustion in less than 72 h.
• Both bottle roll and column leach tests were conducted on three composites of - 12.5 mm material taken from the north end of the North Zone, the south end of the North Zone and the South Zone. The composites were leached to exhaustion in all tests and the average gold extraction was 78% for both types of testing. The gold recovery range for the column tests was 72.5 to 86%. Average copper extractions were also similar, with 14% in the columns and 17% in the bottle rolls.
• Average cyanide consumption was 1.59 kg/t in the columns vs. 1.41 kg/t in the bottle rolls.
• Lime consumption in the columns was uncertain, as lime additions to the columns were too low and caustic additions were required to provide the alkalinity needed to achieve the desired pH levels.
• In spite of the lime addition problems, the gold extraction rate in the column tests was rapid. In 10 to 28 days, the gold extractions reached 80% of the final values. In 16 to 38 days, extractions reached 90% of the final values. In less than 60 days, all three columns reached 98% of the final extractions. Never the less, these rates may be biased to the low side. Additional tests should be run with proper lime additions in order to confirm the gold leach kinetics.

SRK Consulting Tepal PEA Technical Report Page 99
GD/ha Tepal PEA Technical Report_2CG020 000_GD_20101101.docx Effective Date October 8, 2010
• Size distributions were determined on the column feed and residue for each composite. All three composites had similar size distributions, with about 80% of the material in the +1.7 mm fractions and 7 to 10% in the -150 µm fractions. The only significant upgrading was in the latter fractions, which contained 14 to 21% of the gold.
• The -150 µm fines tended to skew the column results. Not only were the gold grades higher, but the gold recoveries averaged 91%. Virtually all coarser fractions had both head grades and recoveries that were below the average for their respective composite. It is not clear how the behaviour of the fines will affect the recovery when leaching a coarser crush size or ROM material.
• On a mass basis (g/t), anywhere from 500 to 2,000 times as much copper was extracted as gold in the column tests. In addition, copper concentration in the leach solution reached as much as 2 g/L in a single 90-day leach cycle. Therefore, technology such as SART will be needed to remove copper from the leach solution and recover the cyanide for recycle.
• Results of static acid/base accounting (ABA) tests showed that all three column residues would be classed as non-acid generating. As a result, no special measures should be required to control acidic drainage from the gold heaps following closure.
• A split from composite NOXCL02 was subjected to rougher flotation after grinding to 146 µm. The flotation recovered only 52% of the gold and 14% of the copper. After regrinding to 13 µm, the concentrate was given a cyanide leach, which recovered 98% of the contained gold, giving an overall recovery of 50%. This is far less than the 78% average recovery in the column leach tests. In addition, cyanide consumption was high at 10.6 kg/t. Based on the added cost of grinding, the low recovery and the high cyanide consumption in flotation-plus-concentrate leaching, heap leaching the oxide ore appears to be the more attractive processing route.

SRK Consulting Tepal PEA Technical Report Page 100
GD/ha Tepal PEA Technical Report_2CG020 000_GD_20101101.docx Effective Date October 8, 2010
17 Mineral Resource and Mineral Reserve Estimates The Tepal project has no 43-101-compliant mineral reserves. A mineral reserve, as defined in the CIM Standards and referenced in NI 43-101, means “the economically mineable part of a Measured or Indicated Mineral Resource demonstrated by at least a Preliminary Feasibility Study. This study must include adequate information on mining, processing, metallurgical, economic, and other relevant factors that demonstrate, at the time of reporting, that economic extraction can be justified. A Mineral Reserve includes diluting materials and allowances for losses that may occur when the material is mined”.
17.1 Historical Mineral Resource and Mineral Reserve Estimates
To the best of Howe’s knowledge historical NI43-101 estimates do not exist for the property.
Previous explorers did undertake a number of non-CIM compliant resource estimations for the property. (A note of caution NI-2A was the 43-101 precursor and could be acceptable).
The following sections are taken from Priesmeyer (2007).
17.1.1 INCO Historical Resource Estimate
In 1974, INCO completed a resource estimate for the property. This resource is not NI 43-101-compliant, primarily since it does not use resource categories as defined in the CIM Definition Standards on Mineral Resources and Reserves (Canadian Institute of Mining, Metallurgy and Petroleum, 2004) and is therefore reported as an historic resource. This resource should not be treated as a current resource as defined in Section 1.2 of NI 43-101 and should not be relied upon as such. Furthermore, INCO did not define resource categories as required by NI 43-101 but rather estimated a global resource, which is not acceptable under NI 43-101.
Of the thirteen diamond drill holes drilled in and around the Tepal gossan, seven were used in the INCO resource estimate (Table 17.1). These holes defined a northwest-trending zone approximately 500 m long and 250 m wide.
INCO estimated the Tepal resource using polygonal methods. The outer limit of the mineralization was drawn using the limit of the copper soil anomaly and drilling results.
Polygon volumes were calculated assuming no topographic relief (Copper Cliff, 1974). Although the topographic relief is not great, integrating topographic relief into the estimate would likely have reduced the volume of the blocks to some degree.

SRK Consulting Tepal PEA Technical Report Page 101
GD/ha Tepal PEA Technical Report_2CG020 000_GD_20101101.docx Effective Date October 8, 2010
Table 17.1: DDH Intercepts Used in INCO Estimates
DD Hole Number Thickness of Mineralised Interval (m) Cu Grade (%) Au grade (g/t) 57001 60.20 0.21 0.14
57002 180.00 0.35 0.8
51005 20.40 0.41 0.53
570015 112.00 0.385 0.83
57017 50.00 0.25 0.7
57019 57.50 0.32 0.2
57020 131.00 0.29 0.54
INCO estimated a resource of 27 Mt averaging 0.33 % Cu and 0.65 g/t Au. INCO stressed that more drilling was required to further define the width of the mineralised zone.
INCO observed that mineralised sections are confined to the upper parts of each drill hole (apparently this is not a supergene effect but rather primary sulphide mineralization) creating a low stripping ratio with the bottom of the deepest intersection used in their estimate occurring only 180 m below the surface or 115 m below the adjacent valley.
INCO concluded that “in spite of an economic grade, lack of waste stripping and simple open pit mining, the low tonnage will probably render this deposit to be uneconomic to mine”.
However INCO also indicated that deep mineralised intersections warranted further drilling on 100 m centres to test the depth potential and potentially increase the tonnage of the resource (Copper Cliff, 1974).
17.1.2 Teck Historical Resource Estimate
In 1994, Teck completed a resource estimate for the property. This resource is not NI 43- 101-compliant, primarily since it does not use resource categories as defined in the CIM Definition Standards on Mineral Resources and Reserves (Canadian Institute of Mining, Metallurgy and Petroleum, 2004) and is therefore reported as an historic resource. This resource should not be treated as a current resource as defined in Section 1.2 of NI 43-101 and should not be relied upon as such.
The resource estimate is a polygonal block estimate based on the manual definition of polygonal blocks on computer drafted drill sections using manual composited intercept intervals. Intercept intervals were based on combined Au and Cu values calculated to a dollar value equivalent using Au at $375/oz and Cu at $0.80/lb. Two cut-off values, > $4/ton and = $8/ton over a minimum of 6.0 m were used. These values were chosen as approximations of internal and external waste cut-offs respectively, although no pit design assumptions were Incorporated into the resource calculation.

SRK Consulting Tepal PEA Technical Report Page 102
GD/ha Tepal PEA Technical Report_2CG020 000_GD_20101101.docx Effective Date October 8, 2010
Composite intervals were chosen to isolate intervals with a = $8/ton and to maximize the intercept grade and intercept interval while contained intervals of less than cut-off grade were required to be less than 6 m.
Drill sections were constructed at intervals ranging from 100 m to 75 m. Polygonal blocks enclosing dollar values of = $4 and < $8 and = $8 were interpreted from the composited intercepts on each section. For the drill indicated category, intercept intervals were projected along section halfway to the next hole or 50 m whichever was less. The drill inferred category includes interpreted mineralised blocks between two drill holes more than 100 m and less than 200 m apart in situations where continuity is apparent and geologically likely. The projected/geologically inferred/possible category includes blocks projected from the section to the north and/or south where available information on the section indicates mineralization is permissively present. Emphasis was placed on holes closest to the projection distance boundary for the section. Area, volume, and tonnage were calculated for each digitized polygonal block using a specific gravity of 2.6 g/cm3. The grade for the block was the average of all drill hole assays within the block. Grades of drill inferred blocks are averages of grades of the laterally adjacent blocks.
Results of the resource calculations are summarized in Table 17.2. The total for all categories is 78.82 million tonnes grading 0.48 g/t Au and 0.249 % Cu with drill indicated resources totaling 55.84 million tonnes grading 0.514 g/t Au and 0.261 % Cu.
Of the 55.84 million tonnes drill indicated resource, 24.28 Mt averaging 0.545 g/t Au and 0.251 % Cu are in the South Zone and 31.56 Mt averaging 0.489 g/t Au and 0.269 % Cu are in the North Zone. It should be noted that the resource categories defined by Teck were drill indicated, drill inferred and projected which are broadly correlative with, but not the same as, measured, indicated and inferred resource categories as defined in CIM Definition Standards on Mineral Resources and Reserves (Canadian Institute of Mining, Metallurgy and Petroleum, 2005).
Table 17.2: Summary of Historic Teck Estimates
Zone Category KTonnes Au grade (g/t) Cu (%) South Drill Indicated 24,275 0.546 0.251
Drill Inferred 1,911 0.575 0.219
Projected 4,366 0.430 0.209
Sub-total 30,552 0.532 0.242 North Drill indicated 31,566 0.489 0.269
Drill Inferred 1,871 0.468 0.212
Projected 14,833 0.377 0.224
Sub-total 48,270 0.456 0.254 South and North Drill Indicated 55,841 0.514 0.261
Drill Inferred 3,782 0.522 0.216
Projected 19,199 0.389 0.220
TOTAL 78,822 0.484 0.249

SRK Consulting Tepal PEA Technical Report Page 103
GD/ha Tepal PEA Technical Report_2CG020 000_GD_20101101.docx Effective Date October 8, 2010
Table 17.3 summarizes the estimate for oxide, mixed oxide/sulphide, and sulphide resources (all categories combined) for North and South Zones. The oxide resource totals 14.40 Mt averaging 0.414 g/t Au and 0.247 % Cu. Most of the oxide ore is in the North Zone.
Sulphide ore has the highest average Au grade while mixed oxide/sulphide ore has the highest Cu grade, possibly due to local zones of supergene enrichment since drill logs locally noted the presence of chalcocite within mixed oxide/sulphide intercepts.
No work such as variogram analysis was conducted to define the area of influence of the drill holes. Shonk (1994) concluded that additional drilling on more closely spaced centres was required to upgrade the resource.
17.1.3 Hecla Historical Resource Estimate
In 1997, Hecla completed a resource estimate for the property. This resource is also not NI 43-101-compliant, primarily since it does not use resource categories as defined in the CIM Definition Standards on Mineral Resources and Reserves (Canadian Institute of Mining, Metallurgy and Petroleum, 2004) and is therefore reported as an historic resource. This resource should not be treated as a current resource as defined in Sections 1.2 of NI 43-101 and should not be relied upon as such.
The resource estimate is a polygonal block estimate based on manual definition of polygonal blocks on computer drafted drill sections using manual composited intercept intervals. Drill sections were constructed at intervals ranging from 50 m to 90 m. Cut-off grades of 0.5 g/t Au and 0.30 % Cu were used in the estimate although there is no resource for copper in the Hecla material in Arian’s possession. Hecla used a specific gravity of 2.2 g/cm3, which is substantially lower than the 2.6 g/cm3 used by INCO and Teck.
The results of the resource calculation for the North and South zones are presented in Table 17.4 below. The total resource for oxide and sulphide material is 9.063 Mt averaging 0.90 g/t Au containing 262,359 ounces of gold.
In addition to the resource for the North and South Zones, Hecla estimated a combined resource for the East and West Zones of 5.055 Mt averaging 0.36 g/t gold containing 58,512 ounces of gold.
17.1.4 1Howe Mineral Resource Estimates (April 2008)
In April 2008, Howe were employed by Arian to complete an initial independent CIM compliant resource estimate for the project which is detailed in the Howe report of April 25th 2008 and filed on SEDAR pursuant to NI 43-101, and to which the reader is referred for details relating to the resource study.

SRK Consulting Tepal PEA Technical Report Page 104
GD/ha Tepal PEA Technical Report_2CG020 000_GD_20101101.docx Effective Date October 8, 2010
Micromine software was used to generate a wireframe restricted, linear block model resource estimate of contained gold and copper over the project using the inverse distance weighting method of grade interpolation, raised to the third power (IDW³).
For the defined and modeled +0.18 g/t Au mineralised zones at Tepal, total inferred resources at a zero cut off are estimated at 78.8Mt @ 0.47g/t Au and 0.24 % Cu for approximately 1.18Moz Au and 421.5Mlbs Cu.
There are no Mineral Reserves reported for the project.
17.2 Howe Mineral Resource Update (September 2008)
17.2.1 Data Summary
Raw data incorporated in to this resource update study consists of all diamond drilling data collected by Arian during 2007 and 2008, Teck historical diamond drill data, Hecla drill geology data, and data from one INCO drill hole.
Arian have also collected weathering data and interpreted geological wireframe solids for the Tepal porphyry system delineated by drilling. This data has been forwarded to Howe, reviewed and modified where appropriate and used in the resource update study.
Howe has reviewed and discussed the sample collection methodologies adopted by Arian and are satisfied that data collection methodologies are of a satisfactory standard.
A review of findings pertaining to input data are presented in the report sections below and issues regarding the suitability of this data for inclusion in current and future resource estimates discussed in the Interpretation, Conclusions and Recommendations section of this report.
17.2.2 Data Validation
Drill hole collar, assay, survey, geology, recovery and weathering data were presented as Micromine .dat data files. This file data was checked and imported into Micromine software and interrogated via Micromine validation functions prior to constructing a Micromine drill hole database for the deposit. Key fields within these critical drill hole database data files was validated for potential numeric and alpha-numeric errors. Data validation cross referencing Collar, Survey, assay and geology files was performed in Micromine to confirm drill hole depths, Inconsistent or missing sample/logging intervals and survey data.
No fatal errors were detected during data validation. Errors contained within the Assay, Geology, and Geotechnical files submitted to ACA Howe were limited and resolved prior to use in resource estimation. Any missing intervals were accounted for by the selective sampling methodology adopted for the sampling of drillholes.

SRK Consulting Tepal PEA Technical Report Page 105
GD/ha Tepal PEA Technical Report_2CG020 000_GD_20101101.docx Effective Date October 8, 2010
17.2.3 Input Data
Data selected for use in resource estimation is contained in the drill hole database Tepal Micromine Drill Hole Database using the data generated as part of the Tepal “Phase 1”exploration program. Input data for estimation are outlined in the Table 17.3.

SRK Consulting Tepal PEA Technical Report Page 106
GD/ha Tepal PEA Technical Report_2CG020 000_GD_20101101.docx Effective Date October 8, 2010
Table 17.3: Tepal MicroMine Input Data Files
MM Data Type No of Records
No of Holes
Arian Holes
Arian Records
Teck Holes
Teck Records
INCO Holes
INCO Records Comment
MM Database
DH Collar 92 92 42 42 49 49 1 1
DH Geology 3,577 70 42 578 49 632 1 202
DH Assay 8,229 92 42 3,532 49 4,505 1 192
DH Survey 249 70 42 202 49 49 1 1
DH Recovery 4,375 42 42 4,375 0 0 0 0 No geotechnical data for Teck and INCO
Specific Gravity 19 13 13 19 0 0 0 0 No specific gravity data for Teck and INCO
Weathering 174 87 38 76 49 98 0 0 Weathering boundary point data
Sample Type
DH Au Assays 8,217 ppm
DH Cu Assays 8,214 ppm
Additional Input Data Arian Geology Wireframes 2007 Topo DTM

SRK Consulting Tepal PEA Technical Report Page 107
GD/ha Tepal PEA Technical Report_2CG020 000_GD_20101101.docx Effective Date October 8, 2010
Input data files, along with relevant strings and wireframes are provided in the data CD which accompanies this report.
17.2.4 Classical Statistical Analysis
Descriptive statistical analysis of Tepal assay data was undertaken in order to understand the characteristics of the assay population. Specifically this analysis was undertaken to estimate the natural gold cut-off grade that defines the mineralised envelopes, to determine the distribution parameters for gold and copper.
Descriptive statistics (unrestricted) were generated for the all gold and copper assays and are presented in Table 17.4.
Table 17.4: Tepal Descriptive Statistics
Descriptive Statistics All DH Au (ppm) All DH Cu (%)
Mean 0.25 0.014
Standard Deviation 0.4 0.01628
Number 8,217 8,214
Max 8.73 0.216
Min 0 0
Variance 0.16 0.00026
As in April 2008, Log Histograms generated for unrestricted gold data show sample grades populations to have a boundary at about 0.18ppm Au. This can be considered as a natural boundary to gold mineralization and is generally supported by a visual review of grade and geological relationships undertaken during 3D modelling. The natural boundary for gold only is being used to model mineralization as part of this study as it is considered the primary economic mineral.
A review of geological interpretations, previous Howe studies and discussion with staff geologists suggests that the local geology and spatial features associated with the mineralization are well understood in a general sense, and controls on mineralization and the extent of structural controls at the deposit are also understood. In a general sense, elevated gold grade is accompanied by elevated copper grades however this is not always the case, and so with additional data collected as part of the Phase 2 program, Howe recommends that the geological controls of gold and copper distribution be reviewed and interpreted such that these elements might be modeled separately.

SRK Consulting Tepal PEA Technical Report Page 108
GD/ha Tepal PEA Technical Report_2CG020 000_GD_20101101.docx Effective Date October 8, 2010
17.2.5 Domain Interpretation
Mineralization and Geology
As in the April 2008 report the Au sample assay histogram were generated from the assay database and indicate the presence of two main mixed sample populations separated at a grade of approximately 0.18 g/t Au. This lower cut-off was used to constrain the Tepal mineralised domains.
It is understood from data review and discussions with the Arian geologists that the deposit geology is relatively simple and studies have determined that mineralization is intimately associated with Tonalite host rocks, quartz stockwork and brecciation, all easily identified and logged in core.
For the Tepal property two mineralised zones have been interpreted:
• The Tepal North Zone;
• The Tepal South Zone.
Within these defined zones, a total of 9 separate domains have been interpreted. The six domains in the Northern Zone and three domains in the Southern Zone are constrained by a +0.18 g/t Au envelope and are delimited by individual porphyry zones and alteration haloes which have been defined by Arian drilling, on the basis of any of the following; characteristic geological features, grade population, strike orientation, spatial location and fault or breccia association. Domain details are given in Table 17.5 and are shown in Figures 17.1 and 17.2.
Mineralised domains are interpreted fairly conservatively based upon extents of drill hole assay data which constrains the mineralization reasonably well. Where unconstrained along strike, and in some places perpendicular to strike, extrapolation of mineralised domains equals approximately 50 m beyond mineralised interval. Where constrained by un-mineralised drill holes zones are extended for half the drill spacing distance.
Strike and dip orientations of domains have been determined by drill hole assay and geological data, interpreted as string polygons on perpendicular cross section, and combined to form a 3 dimensional mineralised wireframe. Strings were snapped to drill hole intervals for greatest accuracy.
The overall strike lengths of the +0.18 g/t Au modelled domains which make up the Tepal North and Tepal South mineralised zones are approximately 1,000 m and 400 m respectively, and extend to a depth of approximately 200 m and 250 m below surface based upon a 50 m extension from deepest drill intercept and the extents of a robust geological model.
At this time interpreted mineralised wireframes for preliminary resource estimation include stockwork, breccias, alteration and rock type mineralization.

SRK Consulting Tepal PEA Technical Report Page 109
GD/ha Tepal PEA Technical Report_2CG020 000_GD_20101101.docx Effective Date October 8, 2010
Weathering Boundaries
Drill hole weathering data was use in interpreting the base of oxidation and base of transitional zone (mixed). The base of the oxide interval, usually corresponding with the base of hematite mineralization, was used to create a base of oxidization Digital Terrain Model.
The top of the fresh interval was used to determine the top of sulphide depth, from which a sulphide DTM created.
These weathering zones were then used to flag the block model. Blocks above the base of oxidization were flagged as oxide the blocks below the sulphide DTM were flagged as sulphide. The interval between the two DTMs when applied to the Block Model corresponded to the transitional zone (mixed). Strings and weathering surface DTM was extended to cover the extents of 0.18g/t Au mineralised domains.
On the whole, these DTMs constrain weathering boundaries well, however there are some deviations between historic Teck and Arian boundary depths leading to significant variations in weathering boundaries over relatively short distances. Teck weathering data often includes a transitional zone which is not in included in the Arian database.
An improved interpretation of alteration zones and delineation of the weathering profile over the deposit is required in order to more reliably domain the geological model into zones of oxide, mixed and sulphide material for geostatistical analysis and wireframe restricted grade interpolation. As such figures are not provided for each weathering zone within the resource estimation statement.
Table 17.5: Tepal Domain Wireframes (September 2008)
Zone Modeled Domain Description Strike
(m) Vertical Extent
(m)
Drill Sample Density
(m) No. of Holes
Volume (m3)
North N1 Main North Body 2 25-200 50x50 to 150x150 36 12,249,652
N2 Lower Main North Body 345 5-170 50x50 to 100x100 19 2,945,233
N3 Mid Northern Segment 345 5-30 50x50 to 50x80 19 282,406
N4 Lower Northern Segment 345 5-20 50x50 4 157,344
N5 Mid Central Segment 345 40-50 80x100 3 959,083
N6 Mid Central Segment 345 20 50x50 1 210,802
South S1 Main South Body 330 30-260 50x50 - 100x150 21 12,909,974
S2 Lower South Segment 345 66 100x100 2 75,779
S3 Eastern South Segment 345 50 1 490,975

SRK Consulting Tepal PEA Technical Report Page 110
GD/ha Tepal PEA Technical Report_2CG020 000_GD_20101101.docx Effective Date October 8, 2010
Figure 17.1: Domain Wireframes (looking southwest from above)
Figure 17.2: Domain Wireframes (looking southwest from below)
Top Cuts

SRK Consulting Tepal PEA Technical Report Page 111
GD/ha Tepal PEA Technical Report_2CG020 000_GD_20101101.docx Effective Date October 8, 2010
Top cut analysis was performed on mineralised domain raw gold and copper data prior to final block model grade interpolation. Top cut analysis is undertaken to assess the influence extreme grade outliers has on the sample population of each domain. Whilst extreme grades are real, their influence in interpolation may overstate the block grades in some parts of the deposits. Excel spreadsheets were prepared to examine the effects of a range of top cuts applied to raw data and the effect these have on the co-efficient of variation (COV) and loss of data from the domain. Tepal North and South mineralised domain assay data were considered together for the purpose of top cut assessment.
After a review of domained gold and copper data, only minimal assay top cuts have been applied. Top cut limits were identified from inflection points on the cumulative frequency plots for both copper and gold in the North and South domains, which denoted outlying high grade samples considered unrepresentative of the population. The limiting of anomalous high grades will ensure a more representative block model. Descriptive statistics were then generated for the topcut. Summary details are contained in the following Table 17.6.
Table 17.6: Tepal Top Cut Analysis Summary
Domain Element No of Samples COV Top Cut COV (Cut) % Data Cut
North Au 1,692 1.02 4ppm 0.98 0.2
Cu 1,692 0.78 1.75% 0.77 0.16
South Au 1,479 0.89 3ppm 0.75 0.27
Cu 1,480 0.56 0.80% 55 0.20
Composites
Prior to estimation, samples within the mineralised wireframes contained in the Tepal drill hole assay files were composited to a standard length to reduce bias for geostatistical analysis and interpolation. The composite length was determined by considering the histogram for raw drill hole sample intervals. The histogram of drill hole sampling length shows the dominant sample interval length is 2m and has been chosen as the optimum composite length.
A composite assay file was created for samples within the domain wireframes for use as input data for block model interpolation.
Descriptive statistics were then generated for the composited data, and the mean values for each domain compared with the mean raw assay grade and top-cut assay grade for each domain.
17.2.6 Geostatistics
Domain Statistics
Descriptive statistics was run for raw uncut data, top cut data and composite data within all the mineralised domains. Mean element values are contained in Table 17.7.
Table 17.7: Tepal Mineralised Domain Statistics – Au

SRK Consulting Tepal PEA Technical Report Page 112
GD/ha Tepal PEA Technical Report_2CG020 000_GD_20101101.docx Effective Date October 8, 2010
Domain No of Au
Domained Samples
No of Au COMP
Samples Au ppm
Domain Mean Au ppm
Topcut Mean Au ppm
COMP Mean
All Domains 3,171 3,009 0.54 0.54 0.54 North 1,692 1,641 0.57 0.56 0.56 South 1,479 1,368 0.50 0.50 0.50
Table 17.8: Tepal Mineralised Domain Statistics – Cu
Domain No Cu
Domained Samples
No Cu COMP Samples
Cu% Domained
Mean Cu% Topcut
Mean Cu% COMP
Mean
All Domains 3,169 3,008 0.026 0.026 0.026
North 1,691 1,640 0.028 0.28 0.028
South 1,478 1,368 0.023 0.023 0.023
Variography
Spatial data analysis was considered prior to block model grade estimation in an attempt to generate a series of semivariograms that would define the directions of grade anisotropy and spatial continuity of gold grades such that these variogram parameters could be used as input parameters for grade estimation.
At the current drill spacing over the deposit there is insufficient sample data density within all domains to be able to reliably generate directional semivariograms. Nevertheless, variographic analysis was undertaken on drilling data from the two largest modelled domains by sample density (N1 and S1). However the resulting semivariograms are not considered robust enough for the purposes of reliable resource estimation.
Therefore, search range and orientation parameters used in grade interpolation of each domain were interpreted by considering the data spacing within each domain (Table 17.8), and the strike orientation and dip orientation of the domain wireframes.
Howe recommends that following Phase 2 drilling activities, variographic analysis be undertaken on the expanded sample database in an attempt to generate meaningful semivariograms that may be used as input parameters to Kriging. Reliable grade estimation via more advanced techniques (OK, MIK etc) cannot be undertaken until more data is generated from additional drilling and sampling over the project.

SRK Consulting Tepal PEA Technical Report Page 113
GD/ha Tepal PEA Technical Report_2CG020 000_GD_20101101.docx Effective Date October 8, 2010
17.2.7 Block Modelling
Empty Cell Block Model
An empty block model was created to cover the extents of mineralised wireframes at Tepal.
A parent block size of 25 m ×25 m × 20 m was selected. The increase in block size relative to the April 2008 report is due to a reconsideration of the geological model, composite size, and potential SMU and mining methods. It was decided that an increased block size would be more suitable for a porphyry deposit of this nature.
Table 17.9: Tepal Block Model Extents
Dimension
(m) Origin Block
Centre Spacing
(m) # of Blocks End Block Centre
Tepal North Easting 716,600 25 29 717,300
Northing 2,115,500 25 25 2,116,100
RL 200,716,200 20 19 560
Tepal South Easting 2,116,150 25 29 716,900
Northing 350 25 25 2,117,200
RL 20 19 650
The domain wireframes were then assigned to the block model file such that blocks falling inside any given domain were assigned to that domain. All blocks outside the wireframe model were then deleted. During the assigning of wireframes block sub-celling down to a minimum of 5 x 5 x 5 was undertaken to maintain the resolution of the mineralised bodies; however in the interpolation process all sub-blocks receive the interpolated grade of their parent (25 m x 25 m x 20 m) block. The latest topographic DTM provided to Howe in Micromine format (ARIAN_TEPAL_DTM_2M) was used to constrain the block model at the surface along with a DTM surface of logged overburden material. Blocks situated above the overburden surface were then deleted.
Grade Interpolation
Gold and copper grade was interpolated into the block models on a domain basis. For interpolation both the block model and composite assay file was filtered by domain and blocks within each domain assigned an interpolated grade using only composite data falling within each domain (i.e. wireframe restricted or closed interpolation). For each domain, the parent block IDW³ interpolation technique was used and interpolation performed at different search radii, until all blocks within each domain had received an interpolated grade. The search distances were determined by means of the evaluation of the, geological model and deposit geometries, exploration data spacing and interpreted grade continuity. Interpreted geometries and search ellipse orientations for each modelled domain are tabulated below.
Table 17.10: Domain Geometries and Search Parameters

SRK Consulting Tepal PEA Technical Report Page 114
GD/ha Tepal PEA Technical Report_2CG020 000_GD_20101101.docx Effective Date October 8, 2010
Modelled Domain Azimuth° Dip° Dir 1 (m) Dir2 (m) Dir3 (m)
North N1 345 -90 100 50 100
N2 345 -90 100 50 100
N3 345 -90 100 50 100
N4 345 -90 100 50 100
N5 345 -90 100 50 100
N6 345 -90 100 50 100
South S1 345 -90 100 50 100
S2 345 -90 100 50 100
S3 345 -90 100 50 100
Inverse Distance Weighting (IDW³) method of interpolation was used, which is a linear, geostatistical method which uses the inverse of the distance to the value of the selected power as the mechanism to preferentially weight the samples to varying extents in the three defining directions within the deposit. As the power is increased then the weighting on the nearest sample to the point of estimation also increases, the higher the power then the greater the weighting to the nearest samples. A power of 3 was selected for interpolation, which is commonly used for precious and base metals. In addition, the third power is used here to ensure that individual sample grades are not given undue weighting in areas of the resource away from this clustered data. Interpolation weights are only applied to samples found within the block’s search neighbourhood.
Model cells were estimated using data from drill hole sampling, the first search radii were selected to be equal to half the range in the strike, dip and across dip directions. Model blocks that did not receive a grade estimate from the first interpolation run were used in the next interpolation run, equal to two thirds of the range in all directions. Subsequent search radii were equal to the range in all directions followed by multiples of the range until all blocks were assigned an interpolated grade.
Where search radii do not exceed the full ranges (i.e. half and equal to the ranges), a restriction of at least three samples from at least two drill holes to estimate the grade of any given block was applied to increase the reliability of the estimates at distances less than or equal to the range.
Data used to interpolate grade into the Tepal block model contains varying sample spatial densities. To ensure that clustered sample groups did not preferentially inform block grades, interpolations included a restriction on the maximum number of samples used in block grade estimation. The search ellipse is divided into four sectors and a constraint of 10 samples per sector applied, essentially de-clustering the data, while allowing an interval of 10 x 2 m samples to fully inform a proximal 20 m high block.
Detailed definition of the interpolation parameters used in the Tepal resource estimation update is contained in Table 17.11 and details of resource volume captured in each interpolation run is contained below in Table 17.12.

SRK Consulting Tepal PEA Technical Report Page 115
GD/ha Tepal PEA Technical Report_2CG020 000_GD_20101101.docx Effective Date October 8, 2010
Table 17.11: Tepal Block Model Interpolation Parameters
Interpolated Method IDW3 Interpolation run# 1 2 >2
Search Radii 1/2 range in main directions
equal to the range in main directions
greater than the range in main directions
Min No of Samples 3 3 1
Max Number of Samples 10 10 10
Min No of Drill Holes 2 2 1
Discretisation 5*5*5 5*5*5 5*5*5
Block Model Attributes
Once the interpolation process for the block model was complete, the resultant block model file was validated to ensure no blocks were empty. Specific values and weathering domains were then assigned to the block model file prior to reporting estimated resources. The final block model file (0_TEPAL_IDW3_TOPCUT_BM_100908.DAT) contains a series of block attributes as detailed in the following table;
Table 17.12: Block Model Attributes
Attribute Field Tepal Wireframe Restricted IDW3 Block Model (September 2008)
Description East Block Centre EAST Coordinate
East Block EAST Dimension
North Block Centre NORTH Coordinate
North Block NORTH Dimension
RL Block Centre RL Coordinate
RL Block RL Dimension
Domain Assigned Wireframe Modelling Domain
Topo Blocks Flagged as Situated Above (o) or Below (1) the Topography
Density Assigned Domain Density
Weathering Blocks flagged as being Above (OXIDE) or Below (MIXED) the BOX
Au ppm cut Interpolated Mean Block Gold Grade using Top Cut Composite Data
Cu % cut Interpolated Mean Block Copper Grade using Top Cut Composite Data
RUN Interpolation Run Number (RUN1-RUN6)
CLASS CIM Compliant Block Classification (IND or INF)
Points Number of Data Points used to Estimate Block Grade
SD Block Standard Deviation
Count Number of Holes used to Estimate Block Grade
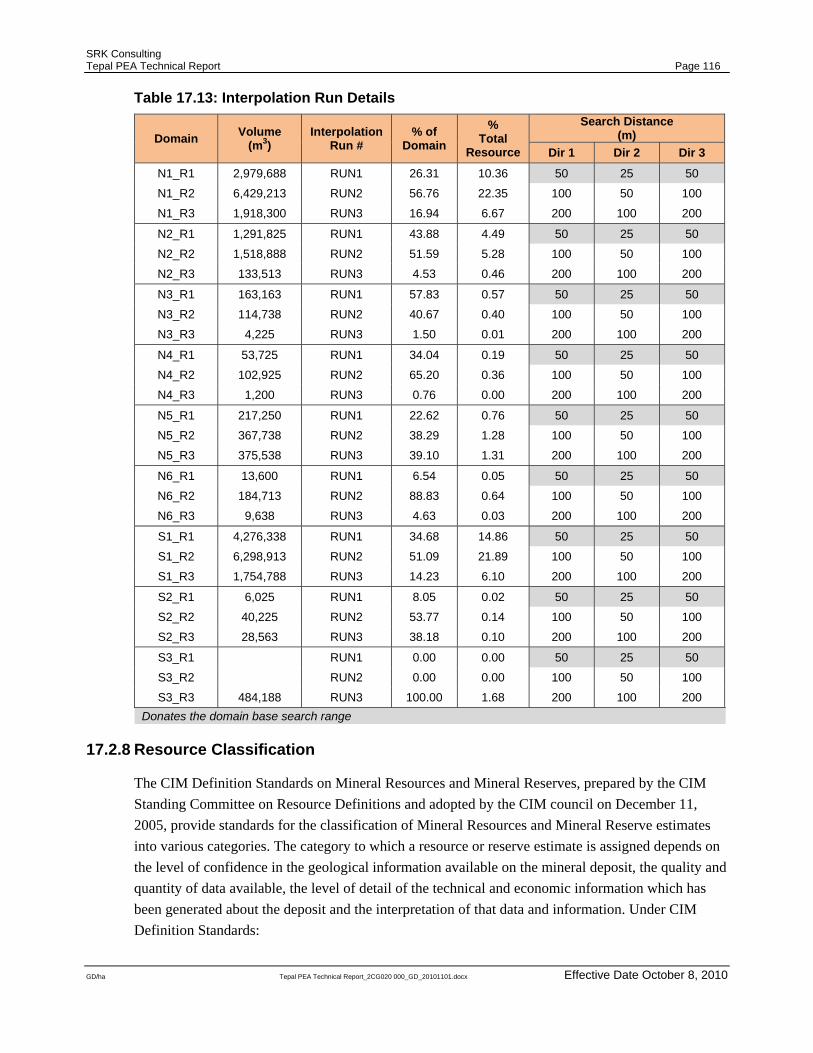
SRK Consulting Tepal PEA Technical Report Page 116
GD/ha Tepal PEA Technical Report_2CG020 000_GD_20101101.docx Effective Date October 8, 2010
Table 17.13: Interpolation Run Details
Domain Volume (m3)
Interpolation Run #
% of Domain
% Total
Resource
Search Distance (m)
Dir 1 Dir 2 Dir 3
N1_R1 2,979,688 RUN1 26.31 10.36 50 25 50
N1_R2 6,429,213 RUN2 56.76 22.35 100 50 100
N1_R3 1,918,300 RUN3 16.94 6.67 200 100 200
N2_R1 1,291,825 RUN1 43.88 4.49 50 25 50
N2_R2 1,518,888 RUN2 51.59 5.28 100 50 100
N2_R3 133,513 RUN3 4.53 0.46 200 100 200
N3_R1 163,163 RUN1 57.83 0.57 50 25 50
N3_R2 114,738 RUN2 40.67 0.40 100 50 100
N3_R3 4,225 RUN3 1.50 0.01 200 100 200
N4_R1 53,725 RUN1 34.04 0.19 50 25 50
N4_R2 102,925 RUN2 65.20 0.36 100 50 100
N4_R3 1,200 RUN3 0.76 0.00 200 100 200
N5_R1 217,250 RUN1 22.62 0.76 50 25 50
N5_R2 367,738 RUN2 38.29 1.28 100 50 100
N5_R3 375,538 RUN3 39.10 1.31 200 100 200
N6_R1 13,600 RUN1 6.54 0.05 50 25 50
N6_R2 184,713 RUN2 88.83 0.64 100 50 100
N6_R3 9,638 RUN3 4.63 0.03 200 100 200
S1_R1 4,276,338 RUN1 34.68 14.86 50 25 50
S1_R2 6,298,913 RUN2 51.09 21.89 100 50 100
S1_R3 1,754,788 RUN3 14.23 6.10 200 100 200
S2_R1 6,025 RUN1 8.05 0.02 50 25 50
S2_R2 40,225 RUN2 53.77 0.14 100 50 100
S2_R3 28,563 RUN3 38.18 0.10 200 100 200
S3_R1 RUN1 0.00 0.00 50 25 50
S3_R2 RUN2 0.00 0.00 100 50 100
S3_R3 484,188 RUN3 100.00 1.68 200 100 200 Donates the domain base search range
17.2.8 Resource Classification
The CIM Definition Standards on Mineral Resources and Mineral Reserves, prepared by the CIM Standing Committee on Resource Definitions and adopted by the CIM council on December 11, 2005, provide standards for the classification of Mineral Resources and Mineral Reserve estimates into various categories. The category to which a resource or reserve estimate is assigned depends on the level of confidence in the geological information available on the mineral deposit, the quality and quantity of data available, the level of detail of the technical and economic information which has been generated about the deposit and the interpretation of that data and information. Under CIM Definition Standards:

SRK Consulting Tepal PEA Technical Report Page 117
GD/ha Tepal PEA Technical Report_2CG020 000_GD_20101101.docx Effective Date October 8, 2010
• An “inferred Mineral Resource” is that part of a Mineral Resource for which quantity and grade or quality can be estimated on the basis of geological evidence and limited sampling and reasonably assumed, but not verified, geological or grade continuity. The estimate is based on limited information and sampling gathered through appropriate techniques from locations such as outcrops, trenches, pits, workings and drill holes.
An “Indicated Mineral Resource” is that part of a Mineral Resource for which quantity, grade or quality, densities, shape and physical characteristics can be estimated with a level of confidence sufficient to allow appropriate application of technical and economic parameters, to support mine planning and evaluation of the economic viability of the deposit. The estimate is based on detailed and reliable exploration and testing information gathered through appropriate techniques from locations such as outcrops, trenches, pits, workings and drill holes that are spaced closely enough for geological and grade continuity to be reasonably assumed.
In addition, classification methodology follows the Micromine Consulting Resource Modelling Standard Procedures (2001) and ACA Howe Resource Modelling Standard Procedures (2006). Classification of interpolated blocks is undertaken considering the following criteria:
• Interpolation criteria based on sample density, search and interpolation parameters;
• Assessment of the reliability of geological, sample, survey and bulk density data;
• Robustness of the geological model;
• Drilling and sample density;
• Grade continuity confidence.
During the preliminary resource estimate undertaken by Howe in April 2008, several issues were highlighted that influenced the confidence that could be applied to the resource estimate, such that blocks did not meet the criteria defining indicated and measured resources and so were classified only as inferred resources. This information is detailed in the Howe April 2008 report and discussed in earlier sections of this report.
Prior to this resource estimation update, most these issues were addressed by Arian which resulted in more reliable input data to estimation such that the classification of indicated resources as well as inferred resources can now be considered.
The current drill data spacing over the project is still not adequate to define measured resources since grade continuity in three dimensions at current data spacings cannot be demonstrated with the required level of confidence to define measured resources.
The following has been taken into account when classifying resources at Tepal:
• The number of samples within each zone over the deposit has increased since April 2008 as a result of additional drill hole data enabling domain extents to be better defined and resource

SRK Consulting Tepal PEA Technical Report Page 118
GD/ha Tepal PEA Technical Report_2CG020 000_GD_20101101.docx Effective Date October 8, 2010
volumes better informed. However, sample numbers remain relatively low in some domain parts and the sample spacing relatively wide in places. For this reason no meaningful semivariogram have been generated. The average drill hole sample spacing for over half of the defined resource is estimated at between 50m and 100m and warrants closer spaced infill drilling to better establish grade continuity. An arithmetic average SG for all material types has been used.
• Geological domain modelling has been undertaken which has been utilised when defining grade domains. This has improved the geometry of grade domains and ensured interpreted grade domains honour the geological characteristics of the deposit. However there is much more geological interpretation which must be undertaken to identify stratigraphic and structural controls to mineralization, which can be used to further define geological domains.
• A review of all assay QA/QC for the phase 1 drilling suggests assay data used in resource estimation is robust for this purpose.
• Density values applied to blocks in the model have been more accurately calculated using the weighted average of logged lithological intervals within the mineralised zones. Assigning density on a domain basis has increased the overall confidence in the tonnage estimate.
• Weathering zones over the deposit have been defined, based on the observed base of oxidation boundaries identified in boreholes. These boundary points were used to create a weathering DTM which was applied to the block model. The deposit has been subdivided into fresh (sulphide), mixed and weathered (oxides) zones. Additional weathering data should be captured during Phase 2 drilling activities in order to build up a picture of the weathering profile across the deposit. All blocks captured in runs that are less than or equal to the range in all directions, have been classified as “Indicated” resources. All other blocks have been classified as “Inferred” resources.
17.2.9 Model Validation
Global and local model validation was undertaken on the Tepal block model prior to resource reporting.
Global Validation
The development of modelling domains has been influenced by using a ‘natural’ cut-off of 18 ppm Au to define mineralised envelopes. Composite grade data has then been used to calculate block grades within each domain. A comparison of the mean domain composite grade and mean domain block grade has been undertaken to assess potential over/under estimating during interpolation. This validation is contained in the following tables.

SRK Consulting Tepal PEA Technical Report Page 119
GD/ha Tepal PEA Technical Report_2CG020 000_GD_20101101.docx Effective Date October 8, 2010
Table 17.14: Au Composite Mean versus Block Mean
Domain Comp Mean Au (ppm)
Block MeanAu (ppm) Diff % Comp Mean
Cu (%) Block Mean
Cu (%) N1 0.627 0.463 -26.22 0.295 -26.22
N2 0.419 0.455 8.52 0.244 8.52
N3 0.446 0.441 -1.04 0.27 -1.04
N4 0.224 0.238 6.13 0.196 6.13
N5 0.417 0.425 -9.78 0.258 -9.78
N6 0.4 0.459 14.74 0.256 14.74
North All 0.56 0.41 -26.79 0.28 -11.43 S1 0.503 0.437 -13.08 0.228 -13.08
S2 0.409 0.421 2.92 0.086 2.92
S3 0.438 0.477 8.84 0.222 8.84
South All 0.5 0.38 -24 0.227 -14.54 All Domains 0.53 0.4 -24.53 0.256 -8.59
A degree of smoothing of grade is inevitable when estimating block grades at the current data spacing of the deposit. However the mean of domain grades compare favourably to the mean of input composite grades used to estimate blocks.
The N1 and S1 domains show a marked decrease in mean grade relative to the input mean composite grade. The decrease in mean grade during interpolation can be attributed to the greater density of holes within mineralised zones relative to the fewer holes, at spacings of 50 m to 100 m informing the majority of domain blocks, resulting in a degree of over-smoothing of higher grade into extrapolated areas with fewer sample points (based on the geological continuity). This is particularly apparent in the Southern tail of the N1 Domain and at the peripheries of the S1 domain.
Model validation also involved the cross reference of block model volume against wireframe volume. Comparison is made between the volume of the entire Tepal block model and the total volume of all domain wireframes. This is undertaken to check that the block model extents honour the wireframe model. Results are presented in the table below. The difference in volumes is considered insignificant.
Table 17.15: Block Model Volumes versus Wireframe Volumes
Domain Block Model Volume (m3)
Wireframe Volume (m3) % Difference*
All 30,271,987 30,281,248 -0.03
*Block Model and Wireframe Volumes are uncut by the Topo DTM

SRK Consulting Tepal PEA Technical Report Page 120
GD/ha Tepal PEA Technical Report_2CG020 000_GD_20101101.docx Effective Date October 8, 2010
Local Validation
Once modelling was completed, the block model was displayed in 2-D Slices along with composite drill hole data in order to assess whether block grades honour the general sense of composite drill hole grades, that is to say that high grade blocks are located around high sample grades, and vice versa.
A degree of smoothing is apparent in all linear block model estimations and is to be expected but on the whole block grades correlate very well with input composite sample grades.
17.2.10 Resource Estimate Reporting
The September 2008 classified CIM compliant resource estimate for gold and copper at Tepal is detailed in the following table.
Screenshots of the final block model, coloured by gold and copper grade is shown in Figures 17.3 to 17.6. The final block model, coloured by resource classification is contained in Figures 17.7 to 17.8.
Table 17.16: Tepal Deposit - Total Resource Estimate Figures
CIM Indicated Resources CIM Inferred Resources Material Density Tonnes Au (g/t) Cu (%) Density Tonnes Au (g/t) Cu (%) Domain
All* 2.78 24,995,000 0.544 0.267 2.78 54,964,000 0.405 0.219
North 2.81 13,261,000 0.574 0.302 2.81 31,361,000 0.406 0.233
South 2.74 11,734,000 0.510 0.228 2.74 23,582,000 0.403 0.200
N1 2.81 8,373,000 0.639 0.325 2.81 23,457,000 0.400 0.225
N2 2.81 3,630,000 0.480 0.263 2.81 4,643,000 0.435 0.255
N3 2.81 458,000 0.410 0.309 2.81 334,000 0.484 0.230
N4 2.81 151,000 0.231 0.203 2.81 293,000 0.241 0.227
N5 2.81 610,000 0.417 0.246 2.81 2,089,000 0.412 0.255
N6 2.81 38,000 0.412 0.262 2.81 546,000 0.462 0.284
S1 2.74 11,717,000 0.510 0.228 2.74 22,067,000 0.399 0.199
S2 2.74 17,000 0.458 0.073 2.74 18,000 0.418 0.083
S3 0 2.74 1,327,000 0.477 0.231 Note: *domains constrained by a .18ppm Au envelope honour the geological model tonnage figures have been rounded up or down to the nearest 1000t Au ounces have been calculated using 31.1035g=1oz Cu pounds have been calculated using 1 tonne = 2204.622lbs
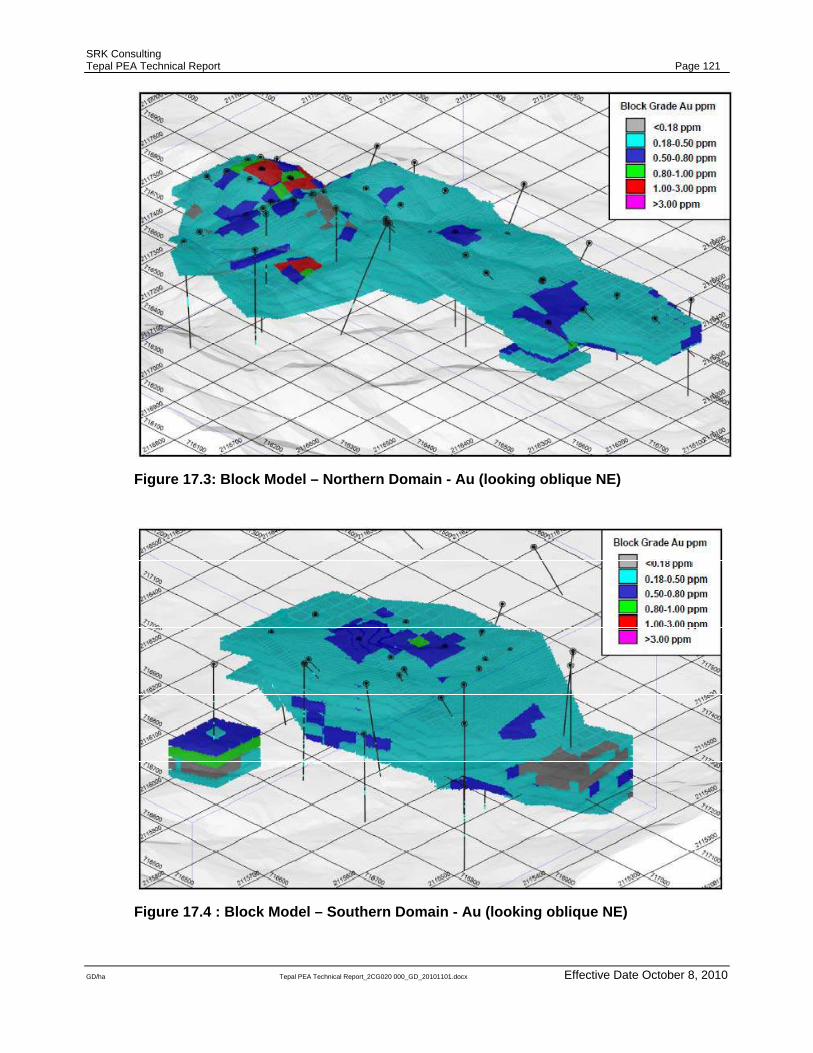
SRK Consulting Tepal PEA Technical Report Page 121
GD/ha Tepal PEA Technical Report_2CG020 000_GD_20101101.docx Effective Date October 8, 2010
Figure 17.3: Block Model – Northern Domain - Au (looking oblique NE)
Figure 17.4 : Block Model – Southern Domain - Au (looking oblique NE)

SRK Consulting Tepal PEA Technical Report Page 122
GD/ha Tepal PEA Technical Report_2CG020 000_GD_20101101.docx Effective Date October 8, 2010
Figure 17.5: Block Model – Northern Domain - Cu (looking oblique NE)
Figure 17.6: Block Model – Southern Domain - Cu (looking oblique NE)

SRK Consulting Tepal PEA Technical Report Page 123
GD/ha Tepal PEA Technical Report_2CG020 000_GD_20101101.docx Effective Date October 8, 2010
Figure 17.7: Block Model – Southern Domain – Resource Category (looking oblique
NE)
Figure 17.8: Block Model – Southern Domain – resource category (looking oblique
NE)

SRK Consulting Tepal PEA Technical Report Page 124
GD/ha Tepal PEA Technical Report_2CG020 000_GD_20101101.docx Effective Date October 8, 2010
18 Other Relevant Data and Information 18.1 Geotechnical Information
18.1.1 Slope Design Review
SRK completed a scoping level review of available geotechnical and structural data for the purposes of open pit slope design. This review was based on available diamond drill core (onsite core review, core photo review, and core recovery and Rock Quality Designation (“RQD”) data), and 3D surfaces and solids. All data has been provided to SRK by Geologix. More details of the slope design review are presented in Appendix 1.
Structural Information
Fault structures within the planned Tepal open pits have been provided as 3D surfaces for the North and South Zones. Currently these are interpreted as largely sub-vertical structures and are not likely to have a major impact on slope stability.
The currently modelled structures are considered to be at a PEA/scoping level assessment, and would need to be evaluated in more detail for a pre-feasibility design.
Seismicity Potential
The Tepal property is located in a high seismic hazard zone. Within this zone the peak ground acceleration is more significant at the coast and reduces somewhat as you move inland towards the Tepal site. Based on available seismogenic data, peak ground accelerations, with a 500 year return period is in the range 4.6 to 5.6 m/s2. This should be considered during planning and costing for the various facilities for open pit operations (waste dumps, tailings dams etc.).
Drill Core Review
North and South Zone Oxide Surface
A 3D surface representing the base of the oxide zone has been reviewed by SRK. Drill core photos show generally weak ground conditions throughout the oxide zone. In places this weak zone is interpreted to extend to 110m depth and beneath the currently modelled surface down into what may be termed the ‘mixed zone’. This needs to be verified in the core or through additional drilling.

SRK Consulting Tepal PEA Technical Report Page 125
GD/ha Tepal PEA Technical Report_2CG020 000_GD_20101101.docx Effective Date October 8, 2010
Drill Hole RQD
Down hole RQD has been collected for most recent diamond drill holes at the Tepal project. The RQD for both the North and South Zones beneath the oxide zone shows improving rock mass quality with depth. Figure 18.1 shows down hole RQD data in relation to the planned North and South Zone open pit shells (left and right respectively). Slope recommendations have been made based on RQD data and core photo reviews, separated into oxide and fresh rock (beneath oxide zone) lithologies.
Figure 18.1: Down-hole RQD Data – North Zone (left) South Zone (right)
Slope Angle Recommendations
Table 18.1 and Figure 18.2 present the slope angle recommendations for the North and South Zone open pits.
Table 18.1: Slope Angle Recommendations
Open Pit Sector Oxide Zone Fresh
Rock Comments Height Overall Angle (°)
North Zone
North East 60 40 50 Assumes oxidation reduces in thickness towards the slope areas
North West 90 40 50 North of 2116600N
South 20 40 50 South of 2116600N
South Zone North 40 Possibility to increase IRA to 45° for a 50m
height to accommodate a ramp
South 50 Possibility to increase IRA to 55° for a 50m height to accommodate a ramp

SRK Consulting Tepal PEA Technical Report Page 126
GD/ha Tepal PEA Technical Report_2CG020 000_GD_20101101.docx Effective Date October 8, 2010
Figure 18.2: Summary of Slope Angle Recommendations
90m upper weak zone: 40°
Below this: 50°
40 overall slopes for North sector
50 overall slopes for south sector
60m upper weak zone: 40°
Below this: 50°
20m upper weak zone: 40°
Below this: 50°
NW Sector NE Sector
South Sector
South Sector
North Sector

SRK Consulting Tepal PEA Technical Report Page 127
GD/ha Tepal PEA Technical Report_2CG020 000_GD_20101101.docx Effective Date October 8, 2010
19 Additional Requirements for Technical Reports on Development Properties and Production Properties
19.1 Mining Operations
19.1.1 Whittle™ Pit Optimization
Net Smelter Return Model
The 3D mineral resource block model as provided by ACA Howe was used as the basis for deriving the economic pit limit for the Tepal deposit. A number of calculations were performed on the model in order to determine the net smelter return (NSR) of each individual block. These parameters are summarized in Table 19.1.
The NSR calculations took into account the following factors:
• Mineralised Zone grades (Cu, Au), thus taking into account the variability in the precious metal content of the deposit (on a whole block basis);
• Ore type (oxide or sulphide);
• Process recoveries for both flotation and heap leach;
• Operating costs;
• Contained metal in concentrate;
• Deductions and Payable Metal Value;
• Metal prices;
• Freight costs (trucking, rail, shipping, insurance);
• Smelting and refining charges (TC/RC); and
• Royalty charges.
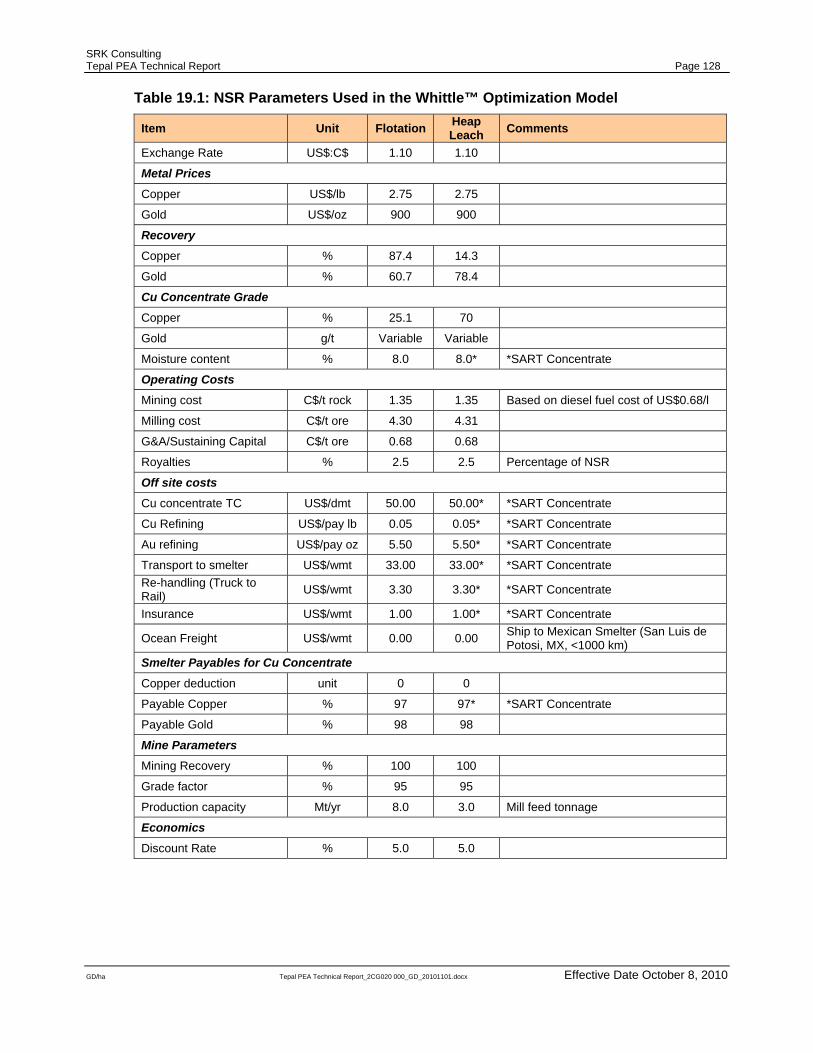
SRK Consulting Tepal PEA Technical Report Page 128
GD/ha Tepal PEA Technical Report_2CG020 000_GD_20101101.docx Effective Date October 8, 2010
Table 19.1: NSR Parameters Used in the Whittle™ Optimization Model
Item Unit Flotation Heap Leach Comments
Exchange Rate US$:C$ 1.10 1.10
Metal Prices Copper US$/lb 2.75 2.75
Gold US$/oz 900 900
Recovery Copper % 87.4 14.3
Gold % 60.7 78.4
Cu Concentrate Grade Copper % 25.1 70
Gold g/t Variable Variable
Moisture content % 8.0 8.0* *SART Concentrate
Operating Costs
Mining cost C$/t rock 1.35 1.35 Based on diesel fuel cost of US$0.68/l
Milling cost C$/t ore 4.30 4.31
G&A/Sustaining Capital C$/t ore 0.68 0.68
Royalties % 2.5 2.5 Percentage of NSR
Off site costs
Cu concentrate TC US$/dmt 50.00 50.00* *SART Concentrate
Cu Refining US$/pay lb 0.05 0.05* *SART Concentrate
Au refining US$/pay oz 5.50 5.50* *SART Concentrate
Transport to smelter US$/wmt 33.00 33.00* *SART Concentrate Re-handling (Truck to Rail) US$/wmt 3.30 3.30* *SART Concentrate
Insurance US$/wmt 1.00 1.00* *SART Concentrate
Ocean Freight US$/wmt 0.00 0.00 Ship to Mexican Smelter (San Luis de Potosi, MX, <1000 km)
Smelter Payables for Cu Concentrate
Copper deduction unit 0 0
Payable Copper % 97 97* *SART Concentrate
Payable Gold % 98 98
Mine Parameters Mining Recovery % 100 100
Grade factor % 95 95
Production capacity Mt/yr 8.0 3.0 Mill feed tonnage
Economics Discount Rate % 5.0 5.0
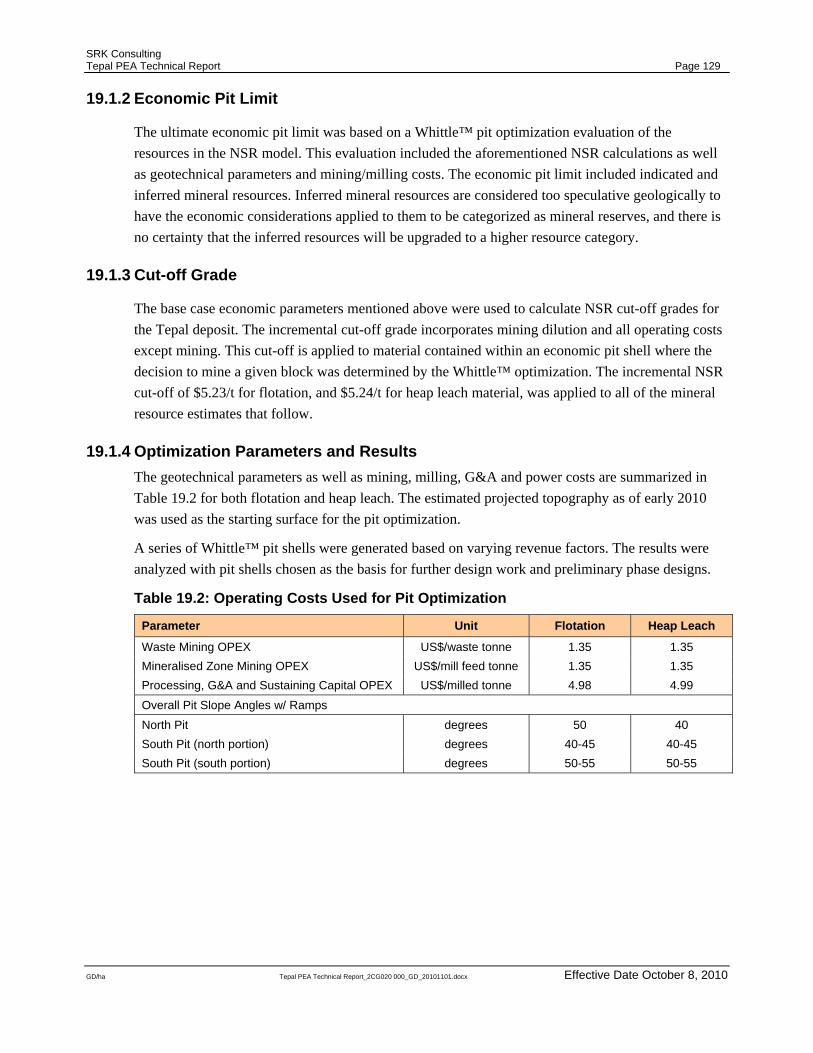
SRK Consulting Tepal PEA Technical Report Page 129
GD/ha Tepal PEA Technical Report_2CG020 000_GD_20101101.docx Effective Date October 8, 2010
19.1.2 Economic Pit Limit
The ultimate economic pit limit was based on a Whittle™ pit optimization evaluation of the resources in the NSR model. This evaluation included the aforementioned NSR calculations as well as geotechnical parameters and mining/milling costs. The economic pit limit included indicated and inferred mineral resources. Inferred mineral resources are considered too speculative geologically to have the economic considerations applied to them to be categorized as mineral reserves, and there is no certainty that the inferred resources will be upgraded to a higher resource category.
19.1.3 Cut-off Grade
The base case economic parameters mentioned above were used to calculate NSR cut-off grades for the Tepal deposit. The incremental cut-off grade incorporates mining dilution and all operating costs except mining. This cut-off is applied to material contained within an economic pit shell where the decision to mine a given block was determined by the Whittle™ optimization. The incremental NSR cut-off of $5.23/t for flotation, and $5.24/t for heap leach material, was applied to all of the mineral resource estimates that follow.
19.1.4 Optimization Parameters and Results The geotechnical parameters as well as mining, milling, G&A and power costs are summarized in Table 19.2 for both flotation and heap leach. The estimated projected topography as of early 2010 was used as the starting surface for the pit optimization.
A series of Whittle™ pit shells were generated based on varying revenue factors. The results were analyzed with pit shells chosen as the basis for further design work and preliminary phase designs.
Table 19.2: Operating Costs Used for Pit Optimization
Parameter Unit Flotation Heap Leach
Waste Mining OPEX US$/waste tonne 1.35 1.35 Mineralised Zone Mining OPEX US$/mill feed tonne 1.35 1.35 Processing, G&A and Sustaining Capital OPEX US$/milled tonne 4.98 4.99 Overall Pit Slope Angles w/ Ramps North Pit degrees 50 40 South Pit (north portion) degrees 40-45 40-45 South Pit (south portion) degrees 50-55 50-55

SRK Consulting Tepal PEA Technical Report Page 130
GD/ha Tepal PEA Technical Report_2CG020 000_GD_20101101.docx Effective Date October 8, 2010
The resources within the various pit shells were generated from the following 3-D block model items:
• Block centroid coordinates;
• Copper grade;
• Gold grade;
• Resource category (indicated, inferred);
• Rock code;
• Topography percentage;
• Specific gravity.
The results of the Whittle™ pit optimization evaluation for varying revenue factors values (Whittle™ shell 36 is revenue factor 1.0) are summarized in Table 19.3, as well as, Figure 19.1, Figure 19.2 and Figure 19.3, for indicated and inferred resources.

SRK Consulting Tepal PEA Technical Report Page 131
GD/ha Tepal PEA Technical Report_2CG020 000_GD_20101101.docx Effective Date October 8, 2010
Table 19.3: Whittle™ Pit Optimization Results
Final Pit
Revenue Factor
Mine Life
Diluted Tonnage
(Mt)
Diluted Grades Waste Tonnage
(Mt) Strip Ratio
Total Tonnage
(Mt)
NPV Best
M$ disc
NPV Spec
M$ disc
NPV Worst
M$ disc
Incr. Diluted
Mt Incr.
Mt waste Incr. strip ratio
NPV best
incr. M$ disc
NPV best
incr.%
NPV worst
incr. M$ disc
NPV worst incr.%
Au (g/t)
Cu (%)
NSR (US$/t)
1 0.30 0.8 6.9 0.78 0.36 25.05 1.4 0.20 8.3 122.1 122.1 122.1 2 0.32 1.1 9.1 0.73 0.34 23.72 1.7 0.19 10.8 148.9 148.4 148.4 2.24 0.35 0.15 26.79 21.9% 26.31 21.5% 3 0.34 1.4 11.2 0.70 0.33 23.08 2.7 0.24 14.0 174.8 174.4 174.4 2.10 1.03 0.49 25.95 17.4% 25.95 17.5% 4 0.36 1.5 12.7 0.68 0.32 22.58 3.3 0.26 16.1 191.4 190.9 190.9 1.52 0.59 0.39 16.54 9.5% 16.50 9.5% 5 0.38 1.9 16.6 0.64 0.30 21.30 4.2 0.25 20.8 226.8 226.9 226.9 3.84 0.86 0.22 35.43 18.5% 36.03 18.9% 6 0.40 2.6 22.6 0.60 0.29 20.58 8.7 0.38 31.3 286.1 278.4 278.4 6.02 4.47 0.74 59.26 26.1% 51.53 22.7% 7 0.42 3.0 25.8 0.58 0.29 20.15 10.8 0.42 36.7 312.8 304.3 304.3 3.22 2.18 0.68 26.76 9.4% 25.87 9.3% 8 0.44 3.3 29.4 0.56 0.28 19.60 12.4 0.42 41.8 339.0 328.7 328.7 3.57 1.53 0.43 26.17 8.4% 24.41 8.0% 9 0.46 3.5 30.5 0.56 0.28 19.48 13.3 0.44 43.9 347.6 336.6 336.6 1.14 0.94 0.83 8.58 2.5% 7.89 2.4%
10 0.48 3.9 34.2 0.54 0.27 18.94 15.0 0.44 49.2 369.7 357.8 357.8 3.67 1.68 0.46 22.07 6.3% 21.23 6.3% 11 0.50 4.4 39.3 0.52 0.26 18.45 19.7 0.50 58.9 400.2 386.3 386.3 5.05 4.68 0.93 30.49 8.2% 28.42 7.9% 12 0.52 5.2 46.3 0.50 0.25 17.87 26.0 0.56 72.3 438.2 421.8 421.8 7.04 6.35 0.90 38.09 9.5% 35.50 9.2% 13 0.54 5.4 47.4 0.49 0.25 17.79 27.1 0.57 74.5 443.8 426.5 426.5 1.10 1.08 0.98 5.59 1.3% 4.73 1.1% 14 0.56 5.7 50.1 0.49 0.25 17.59 30.2 0.60 80.3 456.4 437.8 437.8 2.71 3.07 1.13 12.58 2.8% 11.33 2.7% 15 0.58 5.8 51.2 0.49 0.25 17.51 31.6 0.62 82.8 461.3 442.4 442.4 1.12 1.42 1.26 4.93 1.1% 4.56 1.0% 16 0.60 6.2 54.9 0.48 0.25 17.24 36.2 0.66 91.1 476.0 455.4 455.4 3.69 4.56 1.24 14.61 3.2% 13.01 2.9% 17 0.62 6.5 57.2 0.47 0.24 17.08 39.4 0.69 96.6 484.5 461.5 461.5 2.31 3.21 1.39 8.54 1.8% 6.08 1.3% 18 0.64 6.6 58.5 0.47 0.24 16.98 40.7 0.70 99.1 488.4 464.5 464.5 1.23 1.30 1.05 3.89 0.8% 3.03 0.7% 19 0.66 6.7 59.9 0.47 0.24 16.90 43.2 0.72 103.1 493.0 468.2 468.2 1.41 2.52 1.79 4.66 1.0% 3.71 0.8% 20 0.68 6.9 61.3 0.46 0.24 16.78 44.9 0.73 106.2 496.8 470.5 470.5 1.44 1.67 1.16 3.72 0.8% 2.25 0.5% 21 0.70 7.2 64.3 0.46 0.24 16.57 49.6 0.77 113.9 504.8 475.9 475.9 3.02 4.73 1.56 7.99 1.6% 5.46 1.2% 22 0.72 7.3 65.1 0.46 0.23 16.53 51.5 0.79 116.6 506.8 477.4 477.4 0.75 1.96 2.60 2.09 0.4% 1.43 0.3% 23 0.74 7.5 66.1 0.45 0.23 16.47 53.6 0.81 119.7 509.1 478.9 478.9 1.02 2.03 2.00 2.29 0.5% 1.56 0.3% 24 0.76 7.5 66.9 0.45 0.23 16.41 55.0 0.82 122.0 510.7 480.0 480.0 0.81 1.47 1.82 1.56 0.3% 1.09 0.2% 25 0.78 7.7 68.2 0.45 0.23 16.33 57.7 0.85 125.8 512.9 481.2 481.2 1.25 2.62 2.10 2.24 0.4% 1.23 0.3% 26 0.80 7.7 68.4 0.45 0.23 16.31 58.0 0.85 126.4 513.3 481.3 481.3 0.25 0.32 1.29 0.34 0.1% 0.10 0.0% 27 0.82 7.7 68.6 0.45 0.23 16.31 58.9 0.86 127.5 513.6 481.5 481.5 0.19 0.86 4.63 0.36 0.1% 0.21 0.0% 28 0.84 7.8 68.8 0.45 0.23 16.30 59.4 0.86 128.1 513.9 481.6 481.6 0.15 0.51 3.33 0.21 0.0% 0.10 0.0% 29 0.86 7.8 69.1 0.45 0.23 16.28 60.1 0.87 129.2 514.2 481.8 481.8 0.30 0.77 2.61 0.32 0.1% 0.15 0.0% 30 0.88 7.8 69.4 0.45 0.23 16.26 61.4 0.88 130.8 514.6 481.4 481.4 0.38 1.24 3.28 0.40 0.1% -0.44 -0.1% 31 0.90 7.9 69.9 0.45 0.23 16.25 63.5 0.91 133.3 515.0 481.1 481.1 0.43 2.10 4.85 0.40 0.1% -0.21 0.0% 32 0.92 7.9 70.0 0.44 0.23 16.23 63.8 0.91 133.8 515.1 481.0 481.0 0.15 0.31 2.04 0.09 0.0% -0.10 0.0% 33 0.94 8.1 71.9 0.44 0.23 16.12 70.1 0.98 142.0 516.0 480.5 480.5 1.85 6.31 3.41 0.93 0.2% -0.54 -0.1% 34 0.96 8.2 72.2 0.44 0.23 16.11 72.0 1.00 144.3 516.1 480.0 480.0 0.38 1.93 5.13 0.15 0.0% -0.50 -0.1% 35 0.98 8.2 72.5 0.44 0.23 16.10 73.6 1.02 146.1 516.2 479.7 479.7 0.26 1.59 6.02 0.09 0.0% -0.26 -0.1% 36 1.00 8.3 73.2 0.44 0.23 16.05 76.0 1.04 149.2 516.3 479.3 479.3 0.70 2.42 3.46 0.07 0.0% -0.46 -0.1% 37 1.02 8.3 73.3 0.44 0.23 16.05 76.4 1.04 149.7 516.3 479.0 479.0 0.07 0.34 4.69 -0.01 0.0% -0.23 0.0% 38 1.04 8.3 73.4 0.44 0.23 16.05 76.7 1.05 150.0 516.3 479.0 479.0 0.07 0.31 4.14 -0.02 0.0% -0.07 0.0% 39 1.06 8.3 73.4 0.44 0.23 16.05 77.0 1.05 150.4 516.2 478.8 478.8 0.05 0.36 7.59 -0.03 0.0% -0.12 0.0% 40 1.08 8.3 73.5 0.44 0.23 16.04 77.5 1.06 151.0 516.2 478.6 478.6 0.08 0.49 6.09 -0.05 0.0% -0.27 -0.1% 41 1.10 8.4 74.0 0.44 0.23 16.01 80.0 1.08 154.0 515.8 477.7 477.7 0.52 2.45 4.67 -0.38 -0.1% -0.86 -0.2% 42 1.12 8.5 74.7 0.44 0.23 15.96 82.4 1.10 157.1 515.3 476.7 476.7 0.65 2.43 3.73 -0.50 -0.1% -0.97 -0.2% 43 1.14 8.5 74.7 0.44 0.23 15.96 82.5 1.10 157.2 515.3 476.7 476.7 0.03 0.08 2.17 -0.03 0.0% -0.05 0.0% 44 1.16 8.6 76.0 0.43 0.23 15.88 89.6 1.18 165.7 513.8 474.1 474.1 1.35 7.15 5.30 -1.51 -0.3% -2.64 -0.6% 45 1.18 8.7 76.4 0.43 0.23 15.87 91.7 1.20 168.1 513.3 472.9 472.9 0.34 2.10 6.16 -0.47 -0.1% -1.20 -0.3%

SRK Consulting Tepal PEA Technical Report Page 132
GD/ha Tepal PEA Technical Report_2CG020 000_GD_20101101.docx Effective Date October 8, 2010
Figure 19.1: Whittle™ Pit Optimization Results
.0
20.0
40.0
60.0
80.0
100.0
120.0
140.0
160.0
180.0
200.0
.0
100.0
200.0
300.0
400.0
500.0
600.0
0 10 20 30 40 50
Tonn
age
(Mill
ions
)
Valu
e (U
S$M
illio
ns)
Pit
Tepal PEA - Whittle Shells $1.35/t cost - 8.0/3.0mtpa MILL/HL -Increased HL RecoveryOverall Results
Waste (Mtonnes) Diluted (Mtonnes) NPV Best M$ disc NPV Worst M$ disc

SRK Consulting Tepal PEA Technical Report Page 133
GD/ha Tepal PEA Technical Report_2CG020 000_GD_20101101.docx Effective Date October 8, 2010
Figure 19.2: Incremental Whittle™ Value Results
.00
10.00
20.00
30.00
40.00
50.00
60.00
70.00
1 6 11 16 21 26 31 36 41 46 51
Val
ue U
S$ (m
illio
ns)
Pit
Tepal PEA - Whittle Shells $1.35/t cost - 8.0/3.0mtpa MILL/HL -Increased HL RecoveryIncremental Value
NPV best incr. M$ disc NPV worst incr. M$ disc

SRK Consulting Tepal PEA Technical Report Page 134
GD/ha Tepal PEA Technical Report_2CG020 000_GD_20101101.docx Effective Date October 8, 2010
Figure 19.3: Incremental Whittle™ Tonnage Results
.00
1.00
2.00
3.00
4.00
5.00
6.00
7.00
8.00
0.00
1.00
2.00
3.00
4.00
5.00
6.00
7.00
8.00
9.00
10.00
1 6 11 16 21 26 31 36 41 46 51
Incr
. Ore
(Mto
nnes
)
Strip
Rat
io (t
:t)
Pit
Tepal PEA - Whittle Shells $1.35/t cost - 8.0/3.0mtpa MILL/HL -improved recoveriesIncremental Ore Tonnage and Strip Ratio
Incr. Diluted Mtonne ore Incr. strip ratio Overall Strip Ratio

SRK Consulting Tepal PEA Technical Report Page 135
GD/ha Tepal PEA Technical Report_2CG020 000_GD_20101101.docx Effective Date October 8, 2010
The results indicate a significant increase in the incremental strip ratio beyond pit shell 26. Shells beyond 26 add mineralised rock and waste tonnages to the overall pit but have higher incremental strip ratios with minimal effects on the overall NPV.
To better determine the optimum Whittle™ shell on which to base the pit phasing and scheduling, and to gain a better understanding of the deposit, the shells were analyzed in a preliminary schedule. The schedule assumed a maximum milling capacity of 8.0 Mt/yr for flotation and 3.0 Mt/yr for Heap Leach. No stockpiles were used in the analysis and no capital costs were added. Both best case (mine out pit 1, the smallest pit, and then mine out each subsequent pit shell from the top down, before starting the next pit shell) and a worst case (mine each bench completely to final limits before starting next bench) scenarios were analyzed. The shells were each scheduled at varying revenue factors (0.3 through to 1.4 of base case) to produce a series of nested pit with the NPV results shown in Figures 19.1 through 19.3.
Based on the analysis of the Whittle™ pit shells and preliminary schedule, Whittle™ pit shell 26 was chosen as the base case shell for further pit phasing and scheduling. Table 19.4 and 19.5 below summarizes the tonnages and grades contained within the shell limits (using the incremental cut-off grade of $5.23/t for flotation, and $5.24/t for heap leach material, and a dilution factor of 5%).
A typical long section (looking west) is shown in Figure 19.4 with existing ground, selected Whittle™ shell, and NSR value block model outlines shown.

SRK Consulting Tepal PEA Technical Report Page 136
GD/ha Tepal PEA Technical Report_2CG020 000_GD_20101101.docx Effective Date October 8, 2010
Table 19.4: Resources Extracted in LOM Plan by Classification
Category
Oxide Sulphide Total
Mt Au (g/t)
Cu (%)
Contained Au (oz)
Contained Cu
(Mlbs) Mt Au
(g/t) Cu (%)
Contained Au (oz)
Contained Cu
(Mlbs) Mt Au
(g/t) Cu (%)
Contained Au (oz)
Contained Cu
(Mlbs) Indicated 2.7 0.58 0.31 50,852 18.5 21.6 0.52 0.25 361,150 119.5 24.3 0.53 0.26 412,002 138.0 Inferred 7.3 0.41 0.22 95,179 34.6 37.0 0.40 0.22 481,363 178.2 44.3 0.40 0.22 576,542 212.7
Table 19.5: Material by Type
Material Destination Tonnage (Mt)
Sulphide Material Mill 58.7 Oxide Material Heap Leach 10.0 Sulphide Waste Rock WRF 48.1 Oxide Waste Rock WRF 3.5 Total Material 120.3
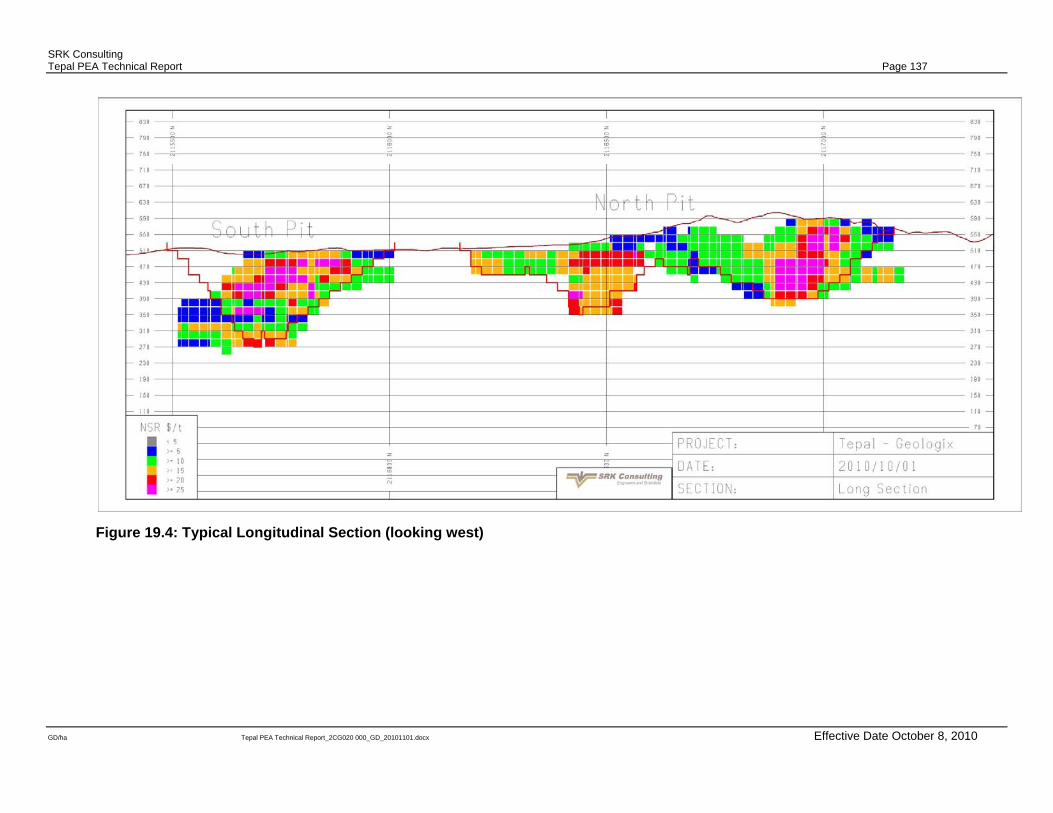
SRK Consulting Tepal PEA Technical Report Page 137
GD/ha Tepal PEA Technical Report_2CG020 000_GD_20101101.docx Effective Date October 8, 2010
Figure 19.4: Typical Longitudinal Section (looking west)
SRK Consulting Tepal PEA Technical Report Page 138
GD/ha Tepal PEA Technical Report_2CG020 000_GD_20101101.docx Effective Date October 8, 2010
19.1.5 Mine Design
Mine planning for the Tepal deposit was conducted using a combination of Mintec Inc. MineSight™ software and Gemcom GEMS™ software. The base 3-D block model as provided by ACA Howe, along with subsequent NSR modeling using GEMS™. The phase design and production scheduling was undertaken with the use of MineSight™ software.
Preliminary pit designs for both North and South Pits, along with the associated pit phasing, were then based on the Whittle™ shell analysis described in this report. Preliminary waste dumps were then designed to account for the material produced in each mining phase.
Whittle™ pit shell 26 was chosen as the base case pit design for the Tepal deposit. Figure 19.5 represents an isometric view of the pit designs for the base case Whittle™ shell with typical cross sections through the pits as shown in Figure 19.6 and 19.7.

SRK Consulting Tepal PEA Technical Report Page 139
GD/ha Tepal PEA Technical Report_2CG020 000_GD_20101101.docx Effective Date October 8, 2010
Figure 19.5: Preliminary Pit Designs - Tepal Deposit

SRK Consulting Tepal PEA Technical Report Page 140
GD/ha Tepal PEA Technical Report_2CG020 000_GD_20101101.docx Effective Date October 8, 2010
Figure 19.6: Cross Section of Tepal North Pit
Figure 19.7: Cross Section of Tepal South Pit

SRK Consulting Tepal PEA Technical Report Page 141
GD/ha Tepal PEA Technical Report_2CG020 000_GD_20101101.docx Effective Date October 8, 2010
Mine Operation
The open pit mining activities for the Tepal pits were assumed to be undertaken by the owner as the basis for this preliminary economic assessment. The unit rate used in the Whittle™ optimization was $1.35 per tonne of material mined for pit and dump operations, road maintenance, mine supervision and technical services. The cost estimate was built from first principles and based on experience of similar sized open pit operations.
Equipment The major mining equipment requirements are indicated in Table 19.6 and are based on similar sized open pit operations. The proposed plant processing rate of 8.0 Mtpa and 3.0 Mtpa heap leach operation was used, along with deposit and pit geometry constraints, to estimate the mining equipment fleet needed. The fleet has an estimated maximum capacity of 60,000 tpd total material, which will be sufficient for the life-of-mine plan.
Table 19.6: Mining Equipment
No. of units Equipment Type
1 Cat D10-class Dozer 2 Cat D9-class Dozer 1 Diesel, 13-cu-yd Front Shovel 2 Cat 992, 14-cu-yd Wheel Loader 1 Cat 988, 8.5-cu-yd Wheel Loader 9 Cat 777, 100-ton Haul Truck 2 Cat 16H-class Grader 1 Cat 14H-class Grader 1 Cat 824H-class Rubber Tire Grader 1 9.88” dia. Rotary, Crawler Drill 3 6.5” dia. Rotary, Crawler Drill 1 3.5” dia. Hydraulic Track Drill 1 16-cu-yd Scraper
Unit Operations
The 9.88” diameter drill performs the majority of the production drilling in the mine, with the 6.5” diameter drills primarily used in ore production. The hydraulic drill with a 3.5” diameter bit is to be used for secondary blasting requirements and may be used on the tighter spaced patterns required for pit development blasts. The main loading and haulage fleet consists of Cat 777- 100 ton haul trucks, which are loaded primarily with the diesel 13 yd3 front shovel or the Cat 992, 14 yd3 wheel loaders, depending on pit conditions. As pit conditions dictate, the Cat D10 and Cat D9 dozers are used to rip and push material to the excavators, as well as maintaining the waste dumps and heap leach pad.

SRK Consulting Tepal PEA Technical Report Page 142
GD/ha Tepal PEA Technical Report_2CG020 000_GD_20101101.docx Effective Date October 8, 2010
The additional equipment listed in Table 19.6 will be used to maintain and build access roads, and to meet various site facility requirements, (including coarse mill feed stockpile maintenance, heap leach pad maintenance, and further exploration development).
The work schedule is based on two twelve hour shifts, seven days a week, 365 days per year.
19.1.6 Production Schedule
Mine Sequence/Phasing
The base case Whittle™ pit shell 26 for the Tepal model was divided into a North and South Pit. The pits were further divided into a number of phases for the mine plan development to maximize the grade in the early years, reduce the pre-stripping requirements in the early years, provide required oxide production for the heap leach process and keep the process plant at full production capacity per period.
North Pit was divided into a North and South portion and a number of phases. The smaller South pit was divided into 3 phases. The pit and phase tonnages and associated grades and metal recoveries of the Tepal pits are summarized in Table 19.7.

SRK Consulting Tepal PEA Technical Report Page 143
GD/ha Tepal PEA Technical Report_2CG020 000_GD_20101101.docx\ Effective Date October 8, 2010
Table 19.7: Phase Tonnages and Grades
Pit/Phase Oxide Sulphide Total
Mtonnes Au (g/t) Cu % Contained Au (oz)
Contained Cu (Mlbs) Mtonnes Au (g/t) Cu % Contained Au
(oz) Contained Cu
(Mlbs) Mtonnes Au (g/t) Cu % Contained Au (oz)
Contained Cu (Mlbs)
Waste (Mtonnes)
North Pit NN1 1.88 0.73 0.36 43,887 15.0 3.08 0.89 0.41 87,643 28.0 4.96 0.83 0.39 131,531 43.0 0.6
NN2 1.92 0.38 0.24 23,309 10.2 12.52 0.47 0.27 187,789 75.5 14.43 0.45 0.27 211,098 85.7 9.1
NN3 0.80 0.29 0.21 7,390 3.7 5.90 0.34 0.20 64,607 25.4 6.69 0.33 0.20 71,997 29.2 6.3
NN4 0.17 0.25 0.28 1,357 1.0 3.05 0.30 0.16 29,829 11.0 3.22 0.30 0.17 31,185 12.0 4.4
NS1 0.87 0.36 0.22 10,169 4.2 2.75 0.45 0.23 39,566 14.1 3.62 0.43 0.23 49,735 18.2 2.0
NS2 1.02 0.37 0.13 12,062 3.0 5.57 0.39 0.21 70,004 26.0 6.59 0.39 0.20 82,066 28.9 8.0
NS3 0.14 0.34 0.11 1,516 0.3 1.56 0.33 0.17 16,700 5.9 1.70 0.33 0.17 18,216 6.3 3.2
Sub-Total North Pit 6.78 0.46 0.25 99,690 37.5 34.43 0.45 0.24 496,138 185.8 41.21 0.45 0.25 595,828 223.3 33.4 South Pit SS1 0.63 0.52 0.23 10,645 3.2 1.33 0.74 0.30 31,649 8.8 1.96 0.67 0.28 42,294 12.0 0.0
SS2 1.60 0.48 0.22 24,829 7.9 7.67 0.53 0.23 130,210 39.2 9.27 0.52 0.23 155,039 47.1 1.7
SS3 1.01 0.34 0.20 10,899 4.5 15.20 0.38 0.19 184,543 63.8 16.21 0.38 0.19 195,442 68.4 16.5
Sub-Total South Pit 3.25 0.44 0.22 46,373 15.6 24.19 0.45 0.21 346,402 111.9 27.44 0.45 0.21 392,775 127.5 18.2 Grand Total All Pits 10.03 0.45 0.24 146,063 53.1 58.62 0.45 0.23 842,540 297.6 68.65 0.45 0.23 988,603 350.7 51.6

SRK Consulting Tepal PEA Technical Report Page 144
GD/ha Tepal PEA Technical Report_2CG020 000_GD_20101101.docx Effective Date October 8, 2010
Figure 19.8 further summarizes the phase designs, with the phase layout shown in isometric view in Figure 19.9.
The pit phases were roughly based on the Whittle™ pit shells 01, 08 and 20. The North pit waste will be placed into a waste rock facility (“WRF”) to the north of the final pit limits, while the majority of the South pit waste will be placed in a WRF to the west of the pit. All oxide material will be placed on the heap leach pad to the east of the pit, while sulphide material will be hauled to the primary crusher to the south east of the pit.
Figure 19.10 provides an overall site plan of the Tepal project, outlining the pits, WRF’s, Heap Leach pad, process facilities, and TMF.
Figure 19.8: Open Pit Phase Summary
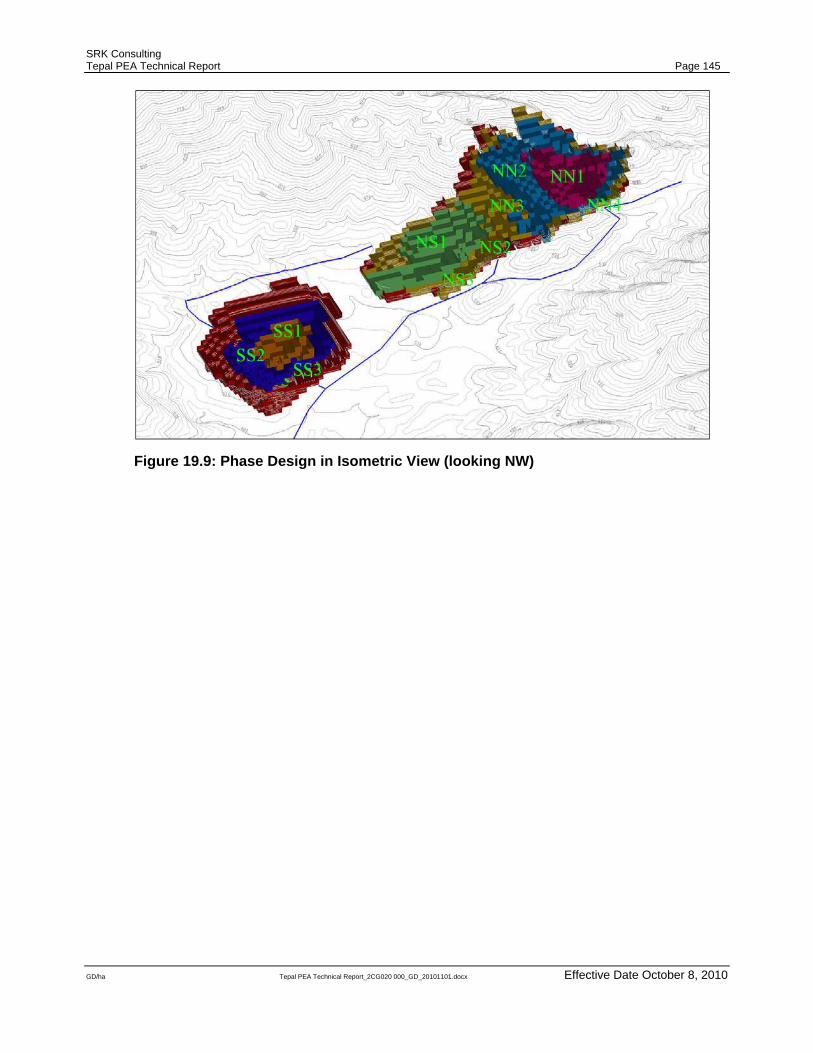
SRK Consulting Tepal PEA Technical Report Page 145
GD/ha Tepal PEA Technical Report_2CG020 000_GD_20101101.docx Effective Date October 8, 2010
Figure 19.9: Phase Design in Isometric View (looking NW)

SRK Consulting Tepal PEA Technical Report Page 146
GD/ha Tepal PEA Technical Report_2CG020 000_GD_20101101.docx Effective Date October 8, 2010
Figure 19.10: Tepal Overall Site Plan

SRK Consulting Tepal PEA Technical Report Page 147
GD/ha Tepal PEA Technical Report_2CG020 000_GD_20101101.docx Effective Date October 8, 2010
Mine Production Schedule
The production schedule for the Tepal deposit model was developed with the aid of MineSight™ software, and incorporated the various phases mentioned above.
The proposed plant processing rate of 8.0 Mtpa and 3.0 Mtpa heap leach was used, along with deposit and pit geometry constraints, to estimate the mining equipment fleet needed. The fleet has an estimated maximum capacity of 60,000 tpd total material, which will be sufficient for the life-of-mine plan. The plant throughput was planned at 8.0 Mtpa of sulphide material, with an additional 3.0 Mtpa Heap Leach capacity. Due to limited pre-stripping requirements, with the Oxide material near surface, Year 1 represents the commencement of Heap Leach processing. The maximum amount of planned total material to be moved is 60,000 tpd. The average total mining rate was planned to be 41,000 tpd. Indicated and inferred resources were used in the LOM plan, with inferred resources representing 65% of the material mined and processed. The resources calculated included an external dilution of 5%. Inferred mineral resources are considered too speculative geologically to have the economic considerations applied to them to be categorized as mineral reserves, and there is no certainty that the inferred resources will be upgraded to a higher resource category.
Table 19.8 below is a summary of total material movement by year for the mine production schedule.

SRK Consulting Tepal PEA Technical Report Page 148
GD/ha Tepal PEA Technical Report_2CG020 000_GD_20101101.docx Effective Date October 8, 2010
Table 19.8: Proposed Production Schedule
Parameter Unit Total YEAR
1 2 3 4 5 6 7 8 9 O/P MINING ALL DEPOSITS OP oxide waste Mt 3.5 0.6 0.9 1.2 0.6 0.2 0.0 0.0 0.0 0.0
OP sulphide waste Mt 48.1 7.8 3.3 6.9 11.1 6.5 6.5 3.0 2.7 0.4
OP total Waste Mt 51.6 8.3 4.2 8.1 11.6 6.7 6.5 3.0 2.7 0.4
ROM oxide ore Mt 10.0 2.5 3.0 3.0 1.2 0.3 0.0 0.0 0.0 0.0
Gold Grade oxide ore g/t Au 0.45 0.62 0.42 0.41 0.33 0.29 0.00 0.00 0.00 0.00
Copper Grade oxide ore % Cu 0.24 0.30 0.26 0.19 0.20 0.20 0.00 0.00 0.00 0.00
ROM sulphide ore Mt 58.7 0.0 7.5 8.0 8.0 8.0 8.0 8.0 8.0 3.1
Gold Grade sulphide ore g/t Au 0.45 0.00 0.57 0.47 0.44 0.49 0.42 0.39 0.37 0.39
Copper Grade sulphide ore % Cu 0.23 0.00 0.32 0.23 0.24 0.23 0.20 0.21 0.19 0.20
Total ore mined O/P Mt 68.7 2.5 10.5 11.0 9.2 8.3 8.0 8.0 8.0 3.1 Total Mined ounces O/P Koz Au 988.6 50.0 179.6 161.3 125.6 129.7 107.9 100.3 95.1 39.2 Total Mined lbs O/P Mlb Cu 351.0 16.3 70.5 53.0 47.9 42.2 36.0 37.2 33.7 14.1 Strip Ratio t:t 0.75 3.33 0.40 0.73 1.26 0.81 0.82 0.38 0.34 0.14
Avg O/P mining rate t/day 41,206 29,667 40,386 52,257 57,126 41,123 39,803 30,204 29,297 25,149

SRK Consulting Tepal PEA Technical Report Page 149
GD/ha Tepal PEA Technical Report_2CG020 000_GD_20101101.docx Effective Date October 8, 2010
The Tepal mine will produce a total of 10.0 Mt of oxide heap leach feed, 58.7 Mt of mill sulphide feed and 51.6 Mt of waste rock over an 8.3 year mine operating life (yielding an overall strip ratio of 0.75:1 (t:t). The current life of mine (“LOM”) plan focuses on achieving the required heap leach and mill feed production rates, mining of the higher grade material early in schedule, and balancing the grade and strip ratios. No blending of stockpiled material has been included in this preliminary schedule. The Tepal pits are most economical when phases are mined concurrently. Figure 19.11, 19.12 and 19.13 summarize pit tonnages, strip ratios and grades by period.
Figure 19.11: Period Tonnages and Strip Ratio
0
0.5
1
1.5
2
2.5
3
3.5
0
2
4
6
8
10
12
14
1 2 3 4 5 6 7 8 9
Strip Ra
tio (t:t)
Tonn
es (m
illions)
Period
Geologix Explorations ‐ Tepal Project PEA Open Pit Mine Schedule
Ore/Waste Tonnages and Strip Ratio
Ore total (Mt) Waste total (Mt) Strip ratio

SRK Consulting Tepal PEA Technical Report Page 150
GD/ha Tepal PEA Technical Report_2CG020 000_GD_20101101.docx Effective Date October 8, 2010
Figure 19.12: Material Tonnages and Strip Ratio

SRK Consulting Tepal PEA Technical Report Page 151
GD/ha Tepal PEA Technical Report_2CG020 000_GD_20101101.docx Effective Date October 8, 2010
Figure 19.13: Period Tonnages and Strip Ratio To further illustrate the progression of mining of the Tepal deposit, Table 19.9 summarizes bench elevations for each phase at the end of each period. Figures 19.14 through to 19.22 provide a snapshot of the pit configurations at the end of each period.
The Tepal deposit provides maximum returns when the various pit phases are mined concurrently. This also allows for the Oxide material to be delivered to the Heap Leach pad during the first half of the mine life at the targeted 3.0 Mtpa. Both North and South pits are mined out in a series of push-backs. The mining fleet was selected based on the need for this flexibility and mobility.
Table 19.9: End of Period Bench Elevations (masl)
Mine Phase 1 2 3 4 5 6 7 8 9
North - NN1 570 530 490
North - NN2 570 530 530 510 470 390
North - NN3 570 570 530 510 510 470 390
North - NN4 570 570 570 570 510 510 510 390
North - NS1 570 510 490 450
North - NS2 570 570 490 490 450 450 350
North - NS3 570 570 550 550 510 490 470 430 370
South - SS1 490 450 430
South - SS2 510 490 450 410 370
South - SS3 530 530 530 470 450 430 390 350 270

SRK Consulting Tepal PEA Technical Report Page 152
GD/ha Tepal PEA Technical Report_2CG020 000_GD_20101101.docx Effective Date October 8, 2010
Figure 19.14: End of Year 1

SRK Consulting Tepal PEA Technical Report Page 153
GD/ha Tepal PEA Technical Report_2CG020 000_GD_20101101.docx Effective Date October 8, 2010
Figure 19.15: End of Year 2

SRK Consulting Tepal PEA Technical Report Page 154
GD/ha Tepal PEA Technical Report_2CG020 000_GD_20101101.docx Effective Date October 8, 2010
Figure 19.16: End of Year 3
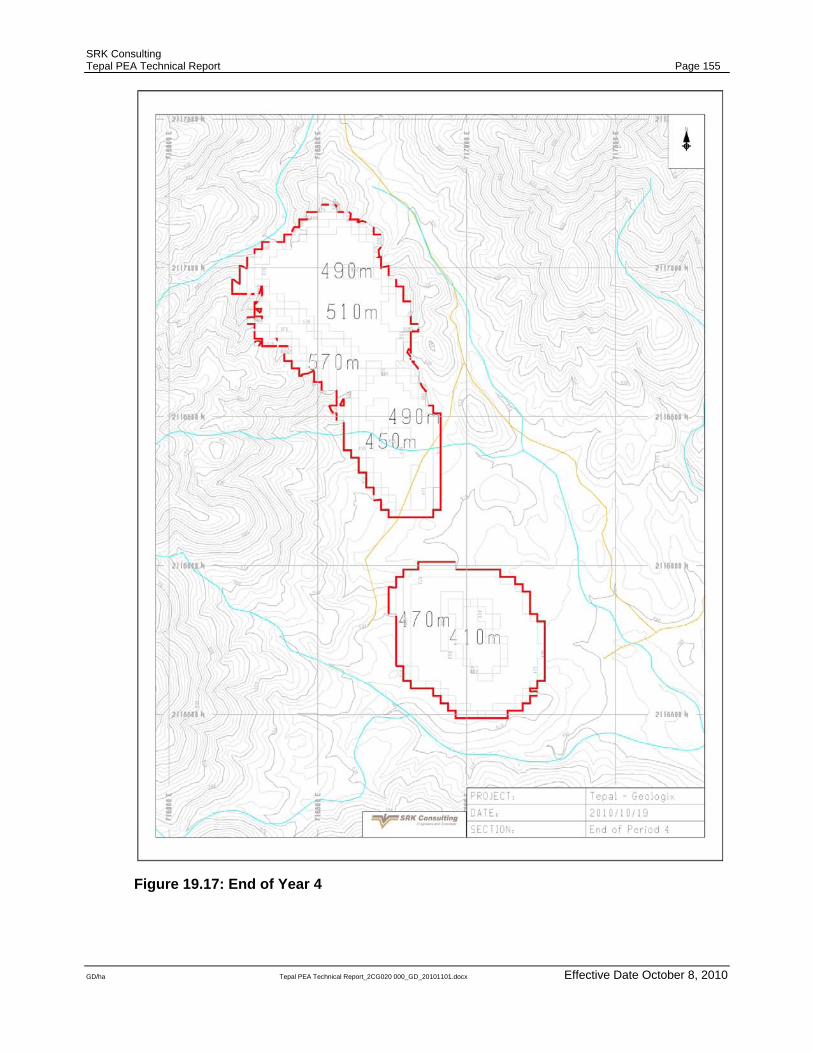
SRK Consulting Tepal PEA Technical Report Page 155
GD/ha Tepal PEA Technical Report_2CG020 000_GD_20101101.docx Effective Date October 8, 2010
Figure 19.17: End of Year 4

SRK Consulting Tepal PEA Technical Report Page 156
GD/ha Tepal PEA Technical Report_2CG020 000_GD_20101101.docx Effective Date October 8, 2010
Figure 19.18: End of Year 5

SRK Consulting Tepal PEA Technical Report Page 157
GD/ha Tepal PEA Technical Report_2CG020 000_GD_20101101.docx Effective Date October 8, 2010
Figure 19.19: End of Year 6
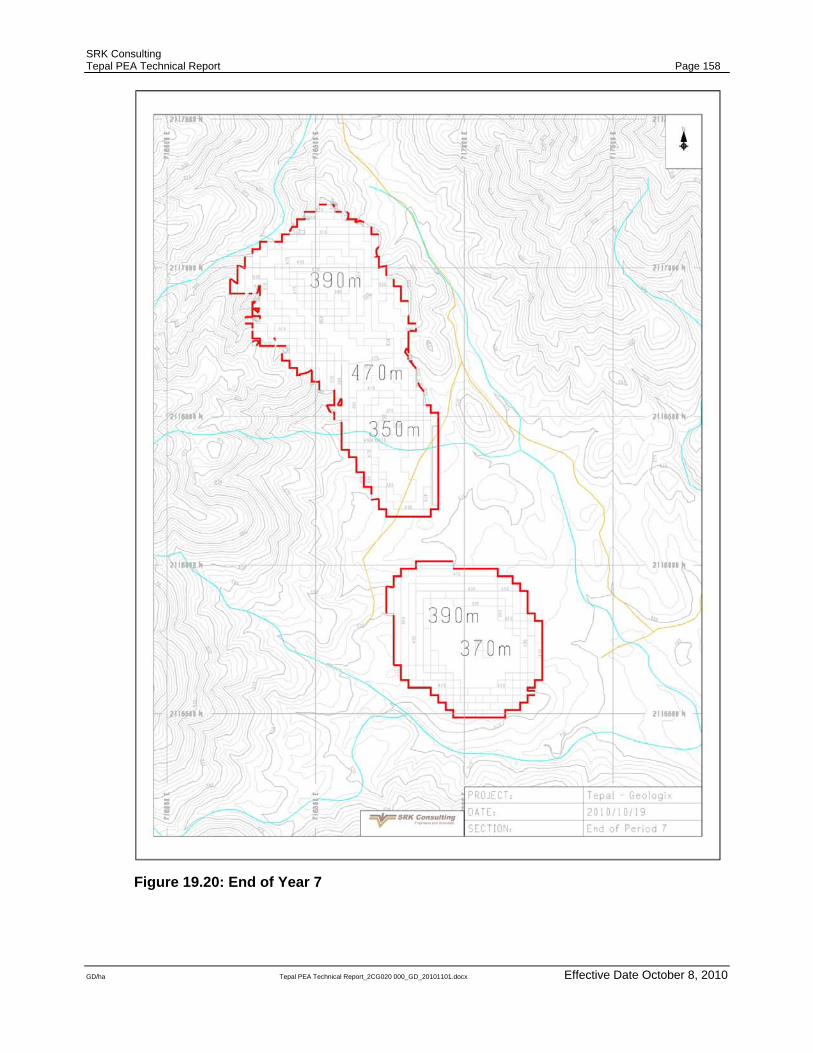
SRK Consulting Tepal PEA Technical Report Page 158
GD/ha Tepal PEA Technical Report_2CG020 000_GD_20101101.docx Effective Date October 8, 2010
Figure 19.20: End of Year 7

SRK Consulting Tepal PEA Technical Report Page 159
GD/ha Tepal PEA Technical Report_2CG020 000_GD_20101101.docx Effective Date October 8, 2010
Figure 19.21: End of Year 8

SRK Consulting Tepal PEA Technical Report Page 160
GD/ha Tepal PEA Technical Report_2CG020 000_GD_20101101.docx Effective Date October 8, 2010
Figure 19.22: Final Pit Configuration
SRK Consulting Tepal PEA Technical Report Page 161
GD/ha Tepal PEA Technical Report_2CG020 000_GD_20101101.docx Effective Date October 8, 2010
Pit Development
Year 1: Development of Tepal deposit commences with mining of both North and South pits for a total of 8.3 Mt of waste. A total of 2.5Mt of Oxide is mined and delivered to Heap Leach Pad. No sulphide ore is mined in the period.
Year 2: Both Oxide and Sulphide ore are mined. The 3.0 mtpa target of Oxide is attained while Sulphide production reaches 93% of targeted rate. Oxide gold head grade is 0.42 g/t Au, while Sulphide gold grade is 0.57 g/t Au with copper head grades of 0.32% Cu. A total of 4.2 Mt of waste rock is produced at a mined strip ratio of 0.40:1 (waste:ore).
Years 3: Sulphide production reaches target of 8.0 mtpa and Oxide remains at targeted 3.0 mtpa. Total waste mined is 8.1mt for a strip ratio of 0.73:1. North Pit phase 1 is completed and reaches 490m elevation, while South Pit phase 1 is completed at 430m elevation.
Years 4: Oxide material nears depletion with 1.2Mt sent to Heap Leach. Sulphide produced at 8.0 mtpa target. Stripping of push backs increases waste mined to 11.6 Mt at a strip ratio of 1.3. Production rate reaches maximum of 57,000 t/day total material. Oxide gold head grade is 0.33 g/t Au; Sulphide gold grade of 0.44 g/t Au and a copper head grade of 0.24 % Cu.
Years 5-9 Last remaining amount (0.3 Mt) of Oxide produced in Year 5, while Sulphide production maintained at 8.0 mtpa through Year 5 to 8. The mining rate averages 35,000 t/day with a declining strip ratio. Gold and copper grades slowly decline through periods.
19.2 Waste Management Facilities
19.2.1 Waste Rock Facilities (“WRF”)
The waste rock facilities will be located adjacent to the final pit limits. A North and West WRF have been designed. Due to the pit and deposit geometry, the potential for backfilling into previously mined out areas is limited and has not been utilized in this study.
The West WRF will be built in a series of lifts in a “bottom-up” approach in order to maximize stability. The dump will be constructed by placing material at its natural angle of repose (approximately 1.5H:1V) with safety berms spaced at regular intervals to allow for a final reclaimed slope of 3:1.

SRK Consulting Tepal PEA Technical Report Page 162
GD/ha Tepal PEA Technical Report_2CG020 000_GD_20101101.docx Effective Date October 8, 2010
The North WRF will take advantage of the existing natural topography to the north of the ultimate pit limits and will be built in two lifts (540 m elevation and 550 m elevation). The dump will be advanced to the north at the 540 m elevation with standard end dumping. Two 5 metre lifts will then be added once the ultimate limits are reached.
The North WRF is designed to contain 40 Mt of waste, while the West WRF has a design capacity of 12 Mt.
Tailings Management Facility (“TMF”)
Several options were researched for the location of the TMF. (See Figure 19.23) Costs and attributes of each option are documented in Appendix 2. Geologix selected TMF Site F, as it provides the least disturbance to local inhabitants.
Site F is located about 1.9 km east of the proposed process plant location. This alternative is a side hill impoundment facility with three dams (Dam F 462 I, Dam F 462 II, and Dam F 462 III). The main dam, Dam F 462 I is particularly long (~2.9 km). Crest length of dams F 462 II and F 462 III are 377 m and 149 m, respectively. With a maximum crest height of 42 m (at El. 462 masl) and a freeboard of 1 m, this site can store 40 Mm3
(60 Mt) of tailings using the cyclone technology. The basin has a 2D surface area of 2.26 Mm2
and a 3D surface area of 2.28 Mm2. Due to its topographical configuration, and long dams it incorporates, a side-hill impoundment at Site F is likely to be the least resistant to seismic activity among the alternative sites.
Construction of a retaining dam as prescribed in Figure 19.24 (earthen dam) and summarized in Table 19.10 (under Earthen Dam) will likely be expensive given the fact that waste rock is PAG and that most of the dam have to be constructed from a locally developed borrow site. Preliminary data on the tailings suggest that it has a significant coarse fraction and, therefore, it may be possible to construct containment dams using the cyclone technology. For preliminary cost estimate purposes we have assumed construction of a starter dam using non-PAG waste rock or local borrow materials and then construct the remainder of the dam using upstream cyclone tailings raises in increments of 2-3m at a time. This technique is schematically illustrated in Figure 19.24 (cyclone upstream raises). Given the high seismicity of the site, downstream construction may ultimately be required; however given the current lack of data pertaining to foundation conditions and tailings properties this optimistic view is not inappropriate.

SRK Consulting Tepal PEA Technical Report Page 163
GD/ha Tepal PEA Technical Report_2CG020 000_GD_20101101.docx Effective Date October 8, 2010
Table 19.10: Specifications of TMF Options
Site Dam ID Max. Crest
Height (m)
Crest Length
(m)
Dist. from
Planned Process
Plant (km)
3D Surface
Area of Basin
at Max. Elev. (m2)
Earthen Dam* Cycloned Tailings Dam**
DamVol.
(Mm3)
Storage Cap. @
Max. Crest Elev. (Mm3)
Ratio Storage
Cap. /
Dam Volume
Starter Dam Vol. (m3)
Storage Cap. @
Max. Crest Elev. (Mm3)
Ratio Storage Cap. / Dam
Volume
A
A 435 I 35 970 3.9
3.7
3.0
44.1 12.7
60,819
47.4 483 A 435 II 25 325 4.4 3.8 20,378
A 435 III 14 270 3.7 0.07 16,929
B B 450 49 1,730 3.3 2.2 7.2 36.5 5.1 108,471 43.6 402
C C 523 63 1,430 5.2 5.0 8.8 33.9 3.9 89,661 42.6 475
D D 437 37 1,251 6.1 5.7 4.3 39.7 9.3 78,438 43.9 560
E Ring Dam E 410 40 4,800 4.1 1.9 20.7 32.3 1.6 273,600 52.8 193
F
F 435 I 42 2,905 3.3
2.3
165,699
40.0 204 F 435 II 22 377 2.4 21,660
F 435 III 12 149 2.7 8,607

SRK Consulting Tepal PEA Technical Report Page 164
GD/ha Tepal PEA Technical Report_2CG020 000_GD_20101101.docx Effective Date October 8, 2010
Figure 19.23: TMF Site Alternatives

SRK Consulting Tepal PEA Technical Report Page 165
GD/ha Tepal PEA Technical Report_2CG020 000_GD_20101101.docx Effective Date October 8, 2010
Figure 19.24: Tailings Dam Design Alternatives

SRK Consulting Tepal PEA Technical Report Page 166
GD/ha Tepal PEA Technical Report_2CG020 000_GD_20101101.docx Effective Date October 8, 2010
19.3 Recoverability
Recovery estimates are shown in Table 19.11 and are based on metallurgical test results discussed in detail in Section 16 of the Priesmeyer report. Only the recovery of gold and copper were considered in the study.
Table 19.11: Estimated Copper and Gold Recovery by Process Process Metal Unit Recovery
Flotation Recovery Cu recovery % of Cu 87.4 Au recovery % of Au 60.7
HL/SART Recovery SART Cu recovery % of Cu 14.3 Leach Au recovery % of Au 78.4
19.4 Markets
It was assumed that the Tepal flotation and SART concentrates would be sent the San Luis de Potosi smelter, or similar, located in Mexico. The concentrates are envisioned to contain 25% Cu and over 30 g/t Au. The concentrates do not contain deleterious elements as indicated in the preliminary testwork analyses completed to date. Transportation to the smelter would be by truck at a distance of approximately 74 km and re-loaded onto a rail system to the San Luis de Potosi smelter, a distance of less than 700 km. Standard smelting terms common in the industry were used in the economic analysis and are as follows:
Planned annual concentrate production is shown in Table 19.12.

SRK Consulting Tepal PEA Technical Report Page 167
GD/ha Tepal PEA Technical Report_2CG020 000_GD_20101101.docx Effective Date October 8, 2010
Table 19.12: Planned Annual Concentrate Production
Parameter Unit Total Yr 12013
Yr 22014
Yr 32015
Yr 42016
Yr 52017
Yr 62018
Yr 72019
Yr 82020
Yr 9 2021
Flotation Concentrate Grade % Cu 25.1 25.1 25.1 25.1 25.1 25.1 25.1 25.1 25.1 25.1 Au g/t 33.8 - 31.2 36.0 31.8 37.1 35.9 32.2 33.7 33.3
Flotation Concentrate Tonnes
Dry t 470,438 - 84,009 63,878 66,962 64,537 56,843 58,761 53,227 22,222 Wet t* 508,074 - 90,730 68,989 72,318 69,700 61,390 63,462 57,485 24,000
Flotation Concentrate Contained Metal
Mlb Cu 260 - 46.49 35.35 37.05 35.71 31.45 32.52 29.45 12.30 t Cu 118,080 - 21,086 16,033 16,807 16,199 14,268 14,749 13,360 5,578
kg Au 15,908 - 2,620 2,299 2,128 2,395 2,038 1,894 1,795 739 oz Au 511,440 - 84,230 73,927 68,420 76,991 65,518 60,878 57,702 23,775
SART Concentrate Grade % Cu 70.0 70.0 70.0 70.0 70.0 70.0 70.0 70.0 70.0 70.0
SART Concentrate Tonnes Dry t 4,921 1,512 1,607 1,167 508 127 - - - -
Wet t* 5,315 1,633 1,736 1,260 548 137 - - - -
SART Concentrate Contained Metal Mlb Cu 8 2.33 2.48 1.80 0.78 0.20 - - - -
t Cu 3,445 1,059 1,125 817 355 89 - - - - *Assumes 8% moisture in concentrate

SRK Consulting Tepal PEA Technical Report Page 168
GD/ha Tepal PEA Technical Report_2CG020 000_GD_20101101.docx Effective Date October 8, 2010
Gold, in the form of doré, would be produced from the heap leach operation and is planned to be transported and sold to a refinery. It was assumed that 100% of doré gold would be payable and the refining charge would be $5.50/oz Au. Annual planned doré production is shown in Table 19.13.
Table 19.13: Annual Estimated Doré Production
Product Unit Total Yr 12013
Yr 22014
Yr 32015
Yr 4 2016
Yr 52017
Au in doré from heap leach
g Au 3,562,000 1,218,000 996,000 963,000 314,000 70,000 oz Au 114,500 39,200 32,000 31,000 10,100 2,200
As would be expected at this early project stage, Geologix currently does not have any smelting or refining contracts in place.
19.5 Contracts
As the project is still at an early stage, there are currently no mining, concentrating, smelting, refining, transportation, handling, sales and hedging contracts or arrangements.
19.6 Environmental Considerations
The Environmental Baseline (EBL) refers to the collection and generation of a preliminary inventory of the environmental background conditions for the Tepal Project. The survey, at this preliminary stage, has been conducted during the dry season (May 2010) and does not represent all the potential annual variations in the area. The seasonal fluctuations are considered as part of a second stage environmental baseline to be conducted at the end of the rainy season (October 2010).
19.6.1 Physical Environment
Meteorology and Air Quality
The Tepalcatepec River basin is characterized by a warm sub-humid climate on its central portion; the eastern and northern portions present semi-warm sub-humid and temperate-humid climates. The annual average temperature for the region is 26.61º C with an average annual precipitation rate of 860.37 mm and an evapo-transpiration rate ranging from 600 to 700 mm. The area is susceptible to dust generation, especially during the driest period of the year (January through May).
Tailings
The Tepal project is located within a moderately high seismic region (Zone D, frequent quakes and ground acceleration velocities may exceed 70% of the gravity caused by seismic activity) and within the area of cyclonic influence of the Pacific Ocean, falling under the following classification for the design of tailings impoundments (G.II-Sg.4-C.19-SR.D, according to Mexican Standard NOM-141-SEMARNAT):
SRK Consulting Tepal PEA Technical Report Page 169
GD/ha Tepal PEA Technical Report_2CG020 000_GD_20101101.docx Effective Date October 8, 2010
This classification (II-4-10) implies the following environmental design conditions:
• Construction method for downstream design (rock dike, homogeneous filters dike, classified and compacted sands);
• Conventional tailings dam;
• Static stability analysis (fixed element);
• Seismic stability analysis (fixed element);
• Requires the installation of piezometers;
• Installation of surface control points;
• Installation of seismograph;
• Drainage control by portal section.
Additional potential infrastructure might include:
• Waste rock dumps;
• Process plant (structure and foundations);
• Slope design;
• Open-pit mine walls;
• Drainage control systems;
• Ancillary facilities.
Dust Control
At present, the sources of dust are mainly of natural origin, activities related to extensive cattle grazing, traffic on unpaved roads, and slash and burn practices.
There are several areas considered as zones of high contribution of dust and low capacity to retain the generated dusts. This situation can be aggravated during subsequent stages of exploration, especially during site preparation and construction. All of these situations can be mitigated by the implementation of appropriate measures; such as: watering of roads, handling of wet material, setting speed limits and speed reducers, and the assessment of potential addition of soil stabilizers on dirt roads.
Hydrology and Sedimentation
The project is located on the western part of the Rio Tepalcatepec basin. The basin’s main rivers are Tepalcatepec or Río Grande and the El Marquez River. The Tepalcatepec River is important for the agricultural activities (second largest irrigation district in Mexico) within its reach as well as for providing flow for the El Infiernillo hydro-electrical dam.

SRK Consulting Tepal PEA Technical Report Page 170
GD/ha Tepal PEA Technical Report_2CG020 000_GD_20101101.docx Effective Date October 8, 2010
At the Tepal site, only seasonal streams have been identified, there are no relevant hydraulic structures such as deep wells or channels. There is however, one stream flowing from the site, which crosses the irrigation channels and pours into the irrigation district and special control measures should be installed in future stages for runoff and sediment control.
Water Reservoirs
The hydroelectric dam Plan de Apatzingán controls the runoff from the Tepalcatepec River, stores water for the Irrigation District 097 Lazaro Cardenas and generates electricity. It is located 25 kms to the northeast of the Tepal Site. Also on the basin, of the Otates River, the Los Olivos water dam was constructed to expand the irrigation district mentioned above. Los Olivos is the most important artificial water body related to the study area (approximately 9 kms NNE from the Tepal site). Surface water is not available for new concessions (surface water is compromised for agricultural purposes).
Water Quality
A total of 7 water samples were collected on May 16 and 17, 2010 at the Tepal site and the surrounding project area, on shallow wells, irrigation channels, and streams as a pre-mining development reference. Water quality in the area, currently does not present any evidence of serious issues. It has only minor issues on solid contents, hardness and alkalinity.
From a pre mining perspective, the total metals are relatively low, a characteristic that should be monitored and maintained in the following years, especially during operation and weathering of geological materials (tailings and waste rock).
Hydrogeology
The project stands between the provinces Eje Neovolcanico, and the Sierra Madre del Sur (transition area), on the south-western portion of Michoacán. The main hydrogeological unit in the region is the Apatzingan aquifer.
The region presents a diverse geology composed mainly of rhyolites, rhyolitic tuffs, andesites, and intrusives such as granites. These function, to some degree, as an impermeable barrier for underground flow. But on the surface, they preserve faulting and fracturing that serve as recharge paths towards the main valley (Tepalcatepec Depression).
The Tepalcatepec valley, according to CONAGUA, presents a horizontal underground flow of about 55 million m3 per year. The water availability for the aquifer is positive and new water concessions are viable according to the official CONAGUA water balance (2010).

SRK Consulting Tepal PEA Technical Report Page 171
GD/ha Tepal PEA Technical Report_2CG020 000_GD_20101101.docx Effective Date October 8, 2010
19.6.2 Biological Environment
The use of land for livestock, in an area with limited livestock capacities (such as the area of study), represents heavy pressure on the ecosystem, causing loss of plant cover, soil compaction, fragmentation of the ecosystem and increased risk of forest fires.
Furthermore, the area has traditionally been used for hunting; which is practiced mostly for subsistence purposes. The areas used for hunting purposes correspond to sites with topographic constraints that impede the advance of farming practices. The most hunted mammals are opossum and deer. Bird hunting was not detected and the locals are in disagreement with this practice, especially the west Mexican Chachalaca (diminished population).
The occurrence of fauna at the area is quite diverse, especially for large mammals that use ravines, canyons and high ground as shelter sites. On the other hand, the distribution of birds appears homogeneous, but certain preferences do take place; depending on the species, based on feeding and reproductive biology.
Vegetation
Tropical Deciduous Forest, Pine-Oak forest and Tropical Subdeciduous Forest are the vegetation associations that exist in the basin (CONABIO-INEGI). Tropical Deciduous Forest is the most common type of vegetation. The Tepal area is dominated by valleys and hill systems, in which a heterogeneous mosaic of plant species from the genera Acacia, Cordia and Amphypterigium exist. This has only changed in the areas transformed for agriculture and livestock ranches. The vegetation mosaic in the region also includes the main land use which is agriculture and seasonal crops. The main irrigated farmland is Irrigation District 097 Lazaro Cardenas, one of the most important districts in the country.
The conservation of the Deciduous forest resources at the Tepal area is considered moderate, ranging from well preserved sites, to areas affected by forest fires used to clear land for agricultural and livestock purposes, more markedly towards ejido grounds.
The area that presented the highest affectations is located to the northeast of the study area, towards La Estanzuela. This is an area where fires, erosion and degradation have had a greater effect on the land, allowing the colonization of huisache (Acacia) and induced grassland. The lower strata have been removed by cattle, impeding the growth of some species by natural regeneration. Most of the forest degradation is caused by livestock and human influence (clearing) and thus represents a higher fire risk during the dry season November-May.
SRK Consulting Tepal PEA Technical Report Page 172
GD/ha Tepal PEA Technical Report_2CG020 000_GD_20101101.docx Effective Date October 8, 2010
In the Tepal study area, a total of 54 species in 33 families of plants, were identified. Three of the species that were detected are described as, of difficult regeneration and one of local interest. Cordia eleagnoides is a plant of local interest; it is used for construction wood and domestic firewood. The species Stenocerous queretaroensis, Cephalocerous senilis, Mammillaria beneckei, are considered as difficult to regenerate due to habitat requirements and seed dispersal conditions.
Only one species was found under a protected category (NOM-059-SEMARNAT-2001), the Cephalocereus senile (“old man” cactus).
No existence of rare species has been reported. This may be due to the gradual alteration of the microclimate and constant pressure on the vegetation. The study area borders with the agricultural frontier, this makes the tropical deciduous forest subject to frequent human disturbances (fire, over grazing, trampling, compaction, and soil loss). The highest degradation degree for the vegetation is towards the north, mostly by pressures from La Estanzuela and the expansion of the agricultural frontier, though the areas to the south and east present indications of similar trends).
Mine development plans usually result in the loss of forest land and the mineralization seldom coincides with ecological criteria. This, along with the close proximity of towns warrants for the consideration of compensatory measures from early mine planning stages, measures such as selection of potential buffer zones around the potential Tepal Project infrastructure.
Reptiles and Amphibians
To classify the herpetological fauna, a direct and unrestricted search method was used. The method, in general terms, consists in daily and nocturnal walks, directing the search to the areas that may have a high probability for harbouring amphibians and reptiles (rock piles, canyons, high humidity areas, fallen trees, wells, holes, bark, crevices, etc.). The intensive field inspections and site evaluations have resulted in the identification of 17 species of reptiles; 5 of these species are protected by NOM-059-SEMARNAT-2001 and one of these (rattle snake) is also mentioned in Appendix III from Convention for International Trade of Endangered Flora and Fauna Species (CITES).
The study area is characterized by two seasonal periods: rain (June-October) and drought (November-May). In the case of amphibians, the field activities and inspections need to be executed during the rainy season in order to accurately register the presence and dynamics in regard to their natural surroundings. Currently, the Tepal Project contemplates a potential amphibian species inventory, pending validation.
SRK Consulting Tepal PEA Technical Report Page 173
GD/ha Tepal PEA Technical Report_2CG020 000_GD_20101101.docx Effective Date October 8, 2010
Mammals
In order to detect mammal presence within and around the study area, line transects extending 10 km were implemented using existing rural and secondary dirt roads (old exploration roads). In addition to the transects, exhaustive searches were performed for the detection of signs and tracks on hoof paths and streams in order to complete the inventory for existing species.
During the field inspections, a total of 13 species of mammal were identified in 6 orders and 9 families, 7 species were carnivores. It is important to note an indirect puma registry at the study area as a personal reference from the local community; this coincides with bibliographic registries that should be confirmed in the future.
For the identified mammal species, none is currently under a protection status by NOM-059-SEMARNAT-2001 or by the Convention for International Trade of Endangered Flora and Fauna Species (CITES).
Birds
To determine the presence and/or absence of bird fauna, intensive searches and monitoring stations were used. The tours included cool mornings, high temperature times and sunset. Little bird activity was detected during the hottest hours of the day (approx. from 2:00 to 4:00 PM).
A total of 30 bird species were detected at the Tepal area in 21 families and 10 orders. The best represented families are Columbidae, Cuculidae and Icteridae, with 3 species each.
The Tepal Project site is not located within an important bird conservation area (AICA). It is important to note that there is presence of migratory birds that use the Tepal area in their route; some individuals stay during their migration period. The bird inventory presents three species mentioned by one of the CITES appendixes.
19.6.3 Socio-Economic Context
Because of their proximity to the Tepal Project, four locations were selected for this study: Tepalcatepec, Colomotitlan, La Estanzuela and La Cienega. Tepalcatepec is the main population centre, with 14,598 people; it is the least marginal of the four, having better health, education and living conditions. Colomotitlan presents a medium margination index while La Cienega and La Estanzuela present higher levels.
At state level, 43.45% of the population does not have basic education (grammar school); Tepalcatepec has a higher education level while the three rural towns have lower education levels in comparison with the state average.
The Tepalcatepec region is one the largest irrigation districts (over 50,000 Ha) in Mexico and most of the productive activities are centered on agriculture (irrigation and seasonal) and livestock.

SRK Consulting Tepal PEA Technical Report Page 174
GD/ha Tepal PEA Technical Report_2CG020 000_GD_20101101.docx Effective Date October 8, 2010
Because of this, little attention has been paid to the potential mining development of the region. A few examples of mining activities have taken place and may raise potential concerns.
The social climate and its effects on the mining industry must be taken into account from early mine planning stages. Examples from other mining projects and operations, especially in Michoacán serve as a general guideline. Geologix is responsible for obtaining the social license, a process that requires consideration of current authorities, groups, community and the irrigation district.
Archaeology and Cultural Heritage
The main indigenous languages in the region are Purépecha and Zapoteco. Approximately 54 people speak some indigenous language this represents less than 1% of the population of the area (51 of them also speak Spanish).
Sites of Historical and Archaeological Significance
There are some architectural monuments in the Tepalcatepec municipality, such as the San Francisco Parrish, municipal building, portals and the Melchor Ocampo Avenue. Other significant sites are the Los Olivos Dam, Chilatan Dam and Las Jacarandas Hacienda.
There are no records regarding patrimonial investigations at the Tepal area, however, the property is located within the estimated limits of the ancient Tarasco Empire. For this reason, and taking into account that Tepalcatepec was considered an administrative centre in the XVI century; Geologix should apply for a land liberation permit from the National Institute of Anthropology and History (INAH).
Land Use
The land uses and activities within the municipality are represented by: agriculture, ranching and commerce. Industrial activities are limited to Tepalcatepec.
In the case of the project site, land use is limited by the slopes, steep topography, soil depth, erosion, access and low population density.
The areas restricted by topography, corresponding to the more remote western and northeastern portions of the project area are sites adequate for wildlife and forest lands, traditionally used for hunting (sport and subsistence) by the local community.
Special care and control measures will need to be taken into account during the wet season, when cattle are brought to the central areas near the exploration sites.
SRK Consulting Tepal PEA Technical Report Page 175
GD/ha Tepal PEA Technical Report_2CG020 000_GD_20101101.docx Effective Date October 8, 2010
19.6.4 Permitting
The Tepal Project, in terms of permitting will need to consider the following environmental procedures:
• Preparation of the Environmental Impact Statement (MIA document) for Environmental Impact Authorizations)
• Preparation of a Technical Report for Forest Land Use Modification (ETJ document), needed prior to forest clearing. The submittal if this report implies land tenure of the legal right granted from the land owner to modify the land use to mining
• Preparation of a Risk Assessment (ER report) in the event that the intended process involves cyanide in amounts that exceed SEMARNAT criteria (over 1 kg of CN requires an ER)
19.6.5 Summary Conclusions
The present environmental baseline is considered as a reference inventory appropriate for the 2,872 Ha of study area and covers the terrains of the Tepal mining concessions 1,406 Ha, deriving into the following general conclusions:
• The project is located in the vicinity of land routes suitable for the operation of a mining project, however, locally; the road system is rudimentary and requires an important work of access in the event of major mining related activities
• The Tepal concession are located on surface land belonging to the Tepalcuatita Ranch, private land and ejido lands, implying potential displacement of productive activities (cattle ranching and seasonal agriculture) and closing rural roads recently used by the local community (travel to and forth the highway and La Estanzuela)
• The Environmental Baseline (LBA) covers 200% more surface area than the polygon of the project (2,872 studied versus 1,406 ha of the current Tepal mining concession), this allows for a better understanding of the local environmental system and future consideration for the preliminary mine development plan
• Once a conceptual mining development plan is prepared, new areas for the expansion of environmental inventories should be contemplated in order to include potential new sites of interest (mining infrastructure)
• The main components that have been considered for the establishment of this area of study correspond to the area of geological interest (mining concessions), the possible development of open pit mining, areas suitable for the establishment of a process plant, associated infrastructure and the construction of an access road dedicated to the mining unit, that connects the project to the East (towards the state highway).

SRK Consulting Tepal PEA Technical Report Page 176
GD/ha Tepal PEA Technical Report_2CG020 000_GD_20101101.docx Effective Date October 8, 2010
Geologix is required to prepare and submit to SEMARNAT different environmental reports (MIA, ETJ, ER) for environmental impact authorizations prior to site preparation and construction for operation permits, land use modification, risk assessment, among others. Overall environmental permitting in Michoacán can take from 6 month to 1 year with land tenure usually being the most sensitive issue in delaying the permitting process.
The current environmental baseline information indicates that there are no environmental “fatal flaws” identified for the proposed Tepal Project. The extent of habitat degradation in the area as well as the surrounding conservation status (heterogeneous mosaic), current land use and local trends do suggest the need for an integrated and careful environmental management policy and program in order to ensure that the mine site activities can coexist with the local communities.
19.7 Taxes
The engineering economic model developed for Tepal for this report does not take into account taxation and, therefore, the information provided in this section is only for general information. Detailed tax calculations are typically very complex and take into account many factors of a corporation’s entire financial performance and not just the results of an individual operation.
The recent passing of the 2010 Mexican tax reform bill has increased corporate income tax from 28% to 30% for 2010 and 2012, 29% in 2013 and back to 28% in 2014.
A valued added tax (“IVA”) of 16% is due to the government but is 100 % and can be used to offset income tax. Mexican law also has a provision for a profit sharing tax paid to employees. The tax rate is 10 % of company profit after tax.
An NSR royalty of 2.5% was assumed for the economic analysis.
19.8 Capital and Operating Cost Estimates
19.8.1 Operating Cost Estimate
Mining Cost Estimate
The open pit mining activities for the Tepal pits were assumed to be undertaken by the owner as the basis for this preliminary economic assessment. The cost estimate was built from first principles, along with input from Geologix, as well as SRK experience of similar sized open pit operations. Equipment efficiency was estimated based on Tepal conditions (e.g. haul routes for each phase).
Local labour rates (for operating, maintenance, and supervision/technical personnel) and estimates on diesel fuel pricing were taken into consideration for the mining cost estimate.

SRK Consulting Tepal PEA Technical Report Page 177
GD/ha Tepal PEA Technical Report_2CG020 000_GD_20101101.docx Effective Date October 8, 2010
Open pit mining costs were estimated to be $1.35/tonne material mined or $2.37/tonne processed (includes both oxide and sulphide material), for pit and dump operations, road maintenance, mine supervision and technical services. Table 19.14 below further summarizes the mining operating cost by function.
Table 19.14: Mine Operating Cost Estimate by Function
Open Pit Function $US/t mined Drill $0.14
Blast $0.37
Load $0.14
Haul $0.33
Roads/Dumps/Support Equipment $0.23
General Mine/Maintenance $0.06
Supervision/Technical $0.10
Total $1.35
Processing Cost Estimate
Operating costs for the mill circuit are summarized in Table 19.15. Operating costs for the two leach options are summarized in Table 19.16. The Crushed ore leach was the option selected to be used in the economic model. Labour and supervision costs are built up from detailed manning charts and Mexican wage rate information. Power costs are built up from estimates of installed power and a cost of US$0.0942/kWh. The cost of consumables is based on estimated reagent cost and usage, wear items, and maintenance supplies. The mill costs include concentrate transportation to the port. No contingency is included.
Table 19.15: Summary of Operating Costs for the Mill Circuit
Operating Area M$/year $/t1
Consumables 17.2 2.15 Power 13.7 1.71 Labour 3.5 0.44 Total Operating Costs 34.4 4.30
Note 1. Based on 8,000,000 tonne/year throughput

SRK Consulting Tepal PEA Technical Report Page 178
GD/ha Tepal PEA Technical Report_2CG020 000_GD_20101101.docx Effective Date October 8, 2010
Table 19.16: Summary of Operating Costs for the Leach Circuit
Operating Area Crushed Ore Leach2 ROM Ore Leach
M$/year $/t1 M$/year $/t1
Ore Re-handling 0.2 0.05 0.0 0 Operating Labour 0.5 0.15 0.2 0.07 Staff/Supervision 0.5 0.15 0.3 0.10 Reagents 10.0 3.20 10.0 3.20 Electric Power 1.6 0.44 0.6 0.20 Mobile Equipment 0.2 0.06 0.2 0.06 SART 0.9 0.26 0.9 0.30 Total Operating Costs 13.8 4.31 11.3 3.63
Note 1 Based on 3,120,000 tonnes of leach ore per year Note 2 Option used in the economic analysis
General and Administration Cost Estimate
G&A costs were estimated to be $0.68/tonne of heap leach and mill feed material.
Off-site Costs
The following off-site costs and smelter terms were estimated and used in the economic analysis.
• Copper concentrate treatment charge: $50.00/dmt
• Copper refining charge: $ 0.05/ payable lb
• Gold refining charge: $ 5.50/ payable oz
• Concentrate transport cost: $37.30/wmt
• Copper payable in Cu concentrate: 97% with no deductions
• Gold payable in Cu concentrate: 98% with no deductions
• Gold payable in doré: 100% with no deductions
• Royalty: 2.5% of net smelter return
19.8.2 Capital Cost Estimate
Summary
Capital costs for the project were developed from a mix of first principles, reference projects, and experience. The annual capital costs by major category are shown in Table 19.17.

SRK Consulting Tepal PEA Technical Report Page 179
GD/ha Tepal PEA Technical Report_2CG020 000_GD_20101101.docx Effective Date October 8, 2010
Table 19.17: Capital Cost Estimate Summary
Category Unit Total Yr 0 2012
Yr 1 2013
Yr 2 2014
Yr 3 2015
Yr 4-82016-2020
Yr 9 2021
Mining Equipment M$ 44.3 16.0 27.1 3.3 1.7 - 3.8 Roads and General Infrastructure M$ 14.7 14.7 Electrical Power Line and Generators M$ 14.2 14.2 Flotation Process Plant M$ 124.0 24.0 100.0 Heap Leach Pad and Facility M$ 16.8 16.8 Tailings Management Facility M$ 20.0 5.0 15.0 Owners Costs M$ 8.8 2.3 6.5 EPCM M$ 26.3 6.9 19.5 Closure M$ 4.8 4.8 Contingency (10%) M$ 19.2 5.3 13.4 0.5 Total Capital Cost M$ 293.0 105.1 181.5 3.3 1.7 - 1.5
Mine Equipment
Mine equipment capital costs (Table 19.18) were developed using productivity factors for production equipment and SRK experience for ancillary equipment. Unit costs are based on budgetary manufacturer quotes.

SRK Consulting Tepal PEA Technical Report Page 180
GD/ha Tepal PEA Technical Report_2CG020 000_GD_20101101.docx Effective Date October 8, 2010
Table 19.18: Mine Capital Cost Estimate Item Unit Quantity Total Cost Primary Crawler-Mounted, Rotary Tri-Cone, 9.875-in Dia. M$ 1 1.20 Crawler-Mounted, Rotary Tri-Cone, 6.5-in Dia. M$ 3 2.72 Crawler-Mounted, Rotary Tri-Cone, 4.5-in Dia. M$ 1 0.67 Diesel, 13-cu-yd Front Shovel M$ 1 2.70 Diesel 14-cu-yd Wheel Loader M$ 2 3.20 100-ton class Haul Truck M$ 9 13.66 D10-class 17.3' blade M$ 1 0.90 D9-class 15.8' blade M$ 2 1.40 824H-class 13.8' blade M$ 1 0.64 16H-class 16' blade M$ 2 1.40 14H-class 14' blade M$ 1 0.40 HD325-7R(40ton) 35m3 9000 gallon M$ 2 1.05 Subtotal Primary M$ 29.93 Ancillary ANFO/Slurry Truck, 12-ton M$ 1 0.20 Stemming truck, 15-ton M$ 1 0.09 Powder Truck, 1-ton M$ 1 0.04 AN Storage Bin, 60-ton M$ 1 0.05 Powder magazine, 24-ton M$ 1 0.05 Cap magazine, 3.6-ton M$ 1 0.01 Excavator (backhoe), 4 cu-yd M$ 1 0.48 Haul Truck (road constr), 35-ton M$ 3 1.53 Backhoe/Loader, 1.4 cu-yd M$ 1 0.15 Portable Aggregate Plant,30 tph M$ 1 0.30 All-terrain Crane, 60-ton M$ 1 0.50 Transporter w/Tractor, 100-ton M$ 1 0.40 Fuel truck, 5000-gal M$ 1 0.28 Lube/Service Truck M$ 1 0.32 Mechanic Field Service Truck M$ 3 0.11 Off-Road tire handling Truck M$ 1 0.35 Wheel Loader 8.5-cu-yd M$ 1 0.80 16 cu-yd Scraper M$ 1 0.59 Light Plant, 6-kW M$ 5 0.10 Pickup Truck, 0.75-ton, 4-WD M$ 5 0.15 Crew Van, 1-ton, 4-WD M$ 2 0.08 Mobile Radio, installed M$ 51 0.04 Subtotal Ancillary M$ 6.60 Miscellaneous Shop Equipment M$ 1 0.75 Eng & Office Equip plus Software M$ 1 0.50 Radio Communications System + GPS M$ 1 0.50 Subtotal Miscellaneous M$ 1.75 Total Equipment & Misc. 38.29 Spares, Contingency, Training, Freight, Erection M$ 9.83 Salvage @10% M$ -3.83 TOTAL MINE CAPITAL, Pre-Tax M$ 44.29

SRK Consulting Tepal PEA Technical Report Page 181
GD/ha Tepal PEA Technical Report_2CG020 000_GD_20101101.docx Effective Date October 8, 2010
Infrastructure and Power
Infrastructure to provide access to the site (roads and a bridge) and on-site infrastructure were developed from a combination of factored costs and budgetary quotes. Diesel generator costs were based on a budgetary quote. The infrastructure and power cost estimates are shown in Table 19.19.
Table 19.19: Infrastructure and Electrical Power Capital Estimate
Item Cost Estimate (M$) Mine Haul Roads 1.5 Access Road (Hwy to site) 0.7 Access Road Canal Bridge 0.5 Buildings 4.0 Sewage and Waste Water 0.5 General 0.5 Mine Light Industrial Area 5.5 Mine Ancillary Facilities 1.5 Total Infrastructure Costs 14.7 Power Line from Tepalcatepec 3.0 Power Generators 11.3 Total Power Costs 14.3 Total Infrastructure and Power Costs 29.0
Flotation Process Plant
There are two types of process facilities envisioned to treat the Tepal ore types. The sulphide ore requires crushing, grinding and flotation to produce a concentrate for sale to a toll smelter. The oxide ore will be stacked on lined pads and then leached with a dilute cyanide solution to extract the gold. The ore may either be crushed and screened or treated in Run-of-Mine (ROM) condition. The gold and any silver are then recovered from the pregnant leach solution (PLS) in a carbon adsorption (ADR) plant. Due to the presence of high levels of cyanide soluble copper in the oxide ore, a Sulfidation-Acidification-Recycling-Thickening (SART) plant will be needed to remove the copper and recover and recycle the cyanide.
The initial capital costs for each type of process plant are summarized in Tables 19.20 and 19.21. These costs are drawn from a variety of sources including vendor budgetary quotations, equipment cost data bases and bench marking against similar Mexican projects. The summary tables exclude engineering, procurement and construction management fees, owner’s costs and working capital.

SRK Consulting Tepal PEA Technical Report Page 182
GD/ha Tepal PEA Technical Report_2CG020 000_GD_20101101.docx Effective Date October 8, 2010
Table 19.20: Flotation Capital Cost Estimate Area Cost Estimate (M$)
General Plant 5.7
Water Supply 4.4
Sulphide Primary Crushing 13.6
Sulphide Primary Grinding 45.1
Sulphide Flotation 21.3
Sulphide Concentrate Thickening and Filtration 9.3
Sulphide Tailings Thickening and Disposal 4.1
Sulphide Reagents 3.0
Sulphide Services 6.4
Mobilisation and Demobilisation 2.6
Temporary Facilities 2.6
Commissioning 0.6
Vendor Representatives 0.7
First Fills and Spares 4.5
Total 124.0
Table 19.21: Heap Leach – SART Facility Cost Estimate
Area Cost Estimate (M$) Crushing & Screening 3.0 Stacker, Conveyor & Lime Silo 1.3 Leach Pad & Ponds 7.0 Leach Pumps 0.2 SART Plant 2.0 ADR Plant 2.0 Loaded Carbon 0.5 Yard Facilities 0.2 Heavy Mobile Equipment 0.8 Total Direct Costs 16.8
Tailings Management Facility
The tailings management facility was estimated to cost $20 M. The cost does not include a liner which, for the purpose of this study, was assumed not to be needed. Further testwork of the tailings is required to confirm or refute this assumption. The TMF costs are shown in Table 19.22.

SRK Consulting Tepal PEA Technical Report Page 183
GD/ha Tepal PEA Technical Report_2CG020 000_GD_20101101.docx Effective Date October 8, 2010
Table 19.22: Tailing Management Facility Cost Estimate
Item Cost Estimate (M$) Clearing and grubbing 1.8
Starter Dam 1.8
Cyclone Equipment 13.7
Perimeter Roads 0.7
Water Diversion 2.0
Total TMF Costs 20.0
Reclamation
Reclamation/closure costs were estimated using unit rates ($/m2) based on other similar Mexican projects. It was assumed 1 m of cover material would be used for the heap leach and tailings areas. Water treatment was assumed not to be required at closure. This has not been confirmed with testing. Reclamation costs are shown in Table 19.23.
It was assumed that building and equipment removal would be paid for by the salvage value.
Table 19.23: Reclamation Closure Cost Estimate
Item Cost Estimate(M$)
Heap Leach pad cover (1 m) 0.36 Tailings cover (1 m) 3.6 Grading and Re-vegetation 0.8 Total Reclamation Costs 4.8
Owner’s Costs
Owner’s costs prior to the production decision on the project have been excluded. These costs would normally include preliminary and final feasibility studies (including the related field work), definition diamond drilling, environment and social impact assessments, permit applications, corporate office expenses, camp expenses, insurance, property taxes, etc. Owner’s costs, once a project go/no go decision is made, were given an allowance of 5% of the capital costs of infrastructure, process plant, heap leach facility and tailings management facility. Owner’s costs total $8.8 M.

SRK Consulting Tepal PEA Technical Report Page 184
GD/ha Tepal PEA Technical Report_2CG020 000_GD_20101101.docx Effective Date October 8, 2010
EPCM and Contingency
Engineering, procurement and construction management costs were estimated at 15% of capital costs for infrastructure, process plant, heap leach facility and tailings management facility. The total EPCM cost was estimated to be $26.3 M. It is Geologix’s intension to conduct some EPCM work on their own and this was allowed for in the owner’s costs.
A 10% contingency allowance was applied to process plant, heap leach facility, tailings management facility, EPCM and closure costs. A total contingency estimate of $19.2 M was used in the capital cost.
19.9 Economic Analysis
The economic analysis described in this report provides only a preliminary overview of the project economics based on broad, factored assumptions. The mineral resources used in the LOM plan and economic analysis include no Measured resources, 24.3 Mt (35%) of Indicated resources and 44.3 Mt (65%) of Inferred resources. Inferred mineral resources are considered too speculative geologically to have the economic considerations applied to them to be categorized as mineral reserves, and there is no certainty that the inferred resources will be upgraded to a higher resource category. Based on this, there is no certainty that the results of this preliminary economic assessment will be realized.
19.9.1 Assumptions
Simplified earning before interest, taxation, depreciation and amortization (“EBITDA”) analyses were compiled based on varying gold and copper prices. For each case the mill feed tonnes were held constant and the metal prices were varied only in the economic model. The base case metal prices were $900/oz Au and $2.75/lb Cu.
For every case, the mill feed tonnes and grades were held constant and were based on the Whittle optimization results using the base case metal prices of $900/oz Au and $2.75/lb Cu. Metal prices and other sensitivity analysis parameters were varied only in the economic model and not re-optimized to get revised Whittle results. The range of metal prices used was:
The range of metal prices used was:
• Gold (US$/oz): 800, 900, 1000, 1100, 1200;
• Copper (US$/lb): 2.50, 2.75, 3.00, 3.25, 3.50;
Common assumptions to all cases included:
• 5% discount rate (“DR”) for net present value (“NPV”) calculation;
• 100% equity financing as per guidance by Geologix;

SRK Consulting Tepal PEA Technical Report Page 185
GD/ha Tepal PEA Technical Report_2CG020 000_GD_20101101.docx Effective Date October 8, 2010
• Exclusion of all pre-development costs as per guidance by Geologix;
• Exclusion of all duties and taxes;
• 2.5% royalty on net smelter return;
• All 2011 costs were assumed to be sunk costs with analysis beginning in 2012 (Year 0).
19.9.2 Results
Based on using the base case metal prices of $900/oz gold and $2.75/lb copper, the EBITDA internal rate of return (“IRR”) was 28% and the EBITDA net present value at a 5% discount rate (“NPV5%”) was $258M. See Table 19.24 for a summary of the base case economic results.
Table 19.24: Base Case LOM Key Economic Results
Parameter Unit Base Case Results
Royalty Payments M$ 30.2
EBITDA NPV0% M$ 382
EBITDA NPV5% M$ 258
EBITDA IRR % 28
EBITDA payback period Production years 2.8
The simplified EBITDA economic analysis is shown in Table 19.26.
Gold and copper contribute approximately equally to the project net smelter return at 45% and 55% respectfully.
19.9.3 Break-even Metal Prices
With volatile metal prices seen in today’s economy, it is important to understand what the break-even metal prices for the project are. Table 19.25 shows some ranges of gold and copper prices that, when combined, result in a break-even situation or an NPV5% of $0. For example, with a gold price of $1,000/oz the project requires a copper price of $1.22/lb to break even.

SRK Consulting Tepal PEA Technical Report Page 186
GD/HA Tepal PEA Technical Report_2CG020 000_GD_20101101.docx Effective Date October 8, 2010
Table 19.25: Combined Copper and Gold Prices that Yield a $0 NPV5% (Break Even Economics)
Copper Price ($/lb) Gold Price ($/oz) 1.22 1,000 1.46 900 1.70 800 1.95 700 2.00 680 2.25 575 2.50 470 2.75 370 3.00 265

SRK Consulting Tepal PEA Technical Report Page 187
GD/HA Tepal PEA Technical Report_2CG020 000_GD_20101101.docx Effective Date October 8, 2010
Table 19.26: EBITDA Economic Analysis SECTION ITEM UNIT TOTAL 2011 2012 2013 2014 2015 2016 2017 2018 2019 2020 2021 MATERIAL SCHEDULE Mining Operating Days days 3,022 - - 365 365 366 365 365 365 366 365 100 Oxide Waste Mt 3.5 - - 0.57 0.92 1.21 0.57 0.22 0.00 - - - Sulphide Waste Mt 48.1 - - 7.76 3.31 6.86 11.05 6.49 6.53 3.03 2.69 0.42 Oxide Ore Mt 10.0 - - 2.50 3.00 3.00 1.23 0.31 - - - - Sulphide Ore Mt 58.7 - - - 7.51 8.00 8.00 8.00 8.00 8.00 8.00 3.15 Total Mt 120.3 - - 10.8 14.7 19.1 20.9 15.0 14.5 11.0 10.7 3.6 Strip Ratio t waste:t ore 0.75 - - 3.3 0.4 0.7 1.3 0.8 0.8 0.4 0.3 0.1 Daily Production t/day 39,815 - - 29,667 40,386 52,114 57,126 41,123 39,803 30,121 29,297 35,711 Flotation Circuit Operating Days days 2,701 - - 365 366 365 365 365 366 365 144 Daily Mill Feed Rate t/day 21,717 - - - 20,580 21,864 21,924 21,906 21,916 21,850 21,929 21,849
Flotation Circuit Feed Tonnes Mt 58.7 - - - 7.51 8.0 8.0 8.0 8.0 8.0 8.0 3.1 Cu head grade %Cu 0.23 - - - 0.32 0.23 0.24 0.23 0.20 0.21 0.19 0.20 Au head grade g/t Au 0.45 - - - 0.57 0.47 0.44 0.49 0.42 0.39 0.37 0.39
Heap Leach Operating Days days 1,497 365 365 366 365 36 Daily Heap Leach Rate t/day 6,700 - - 6,858 8,208 8,196 3,357 8,510 - - - -
Heap Leach Feed Tonnes Mt 10.0 - - 2.50 3.00 3.00 1.23 0.31 - - - -Cu head grade %Cu 0.24 - - 0.30 0.26 0.19 0.20 0.20 - - - -Au head grade g/t Au 0.45 - - 0.62 0.42 0.41 0.33 0.29 - - - -
Combined Flotation + Heap Combined Feed Tonnes Mt 68.7 2.50 10.51 11.00 9.23 8.30 8.00 8.00 8.00 3.15 Cu head grade %Cu 0.23 0.30 0.30 0.22 0.24 0.23 0.20 0.21 0.19 0.20 Au head grade g/t Au 0.45 0.62 0.53 0.46 0.42 0.49 0.42 0.39 0.37 0.39 FLOTATION PLANT RECOVERY Recovery Cu recovery % of Cu 87.4 87.4 87.4 87.4 87.4 87.4 87.4 87.4 87.4 87.4 87.4 87.4 Au recovery % of Au 60.7 60.7 60.7 60.7 60.7 60.7 60.7 60.7 60.7 60.7 60.7 60.7 Concentrate Grade Cu grade of concentrate % Cu 25.1 25.1 25.1 25.1 25.1 25.1 25.1 25.1 25.1 25.1 25.1 25.1 Au grade of concentrate g/dmt Au 33.8 - - - 31.2 36.0 31.8 37.1 35.9 32.2 33.7 33.3 Moisture content %H20 8.0 8.0 8.0 8.0 8.0 8.0 8.0 8.0 8.0 8.0 8.0 8.0 Concentrate Tonnes Cu Conc. Produced - Dry dmt 470,438 - - - 84,009 63,878 66,962 64,537 56,843 58,761 53,227 22,222 Cu Conc. Produced - Wet wmt 508,074 - - - 90,730 68,989 72,318 69,700 61,390 63,462 57,485 24,000 Cu Conc. % of Feed % dmt 0.80 - - - 1.12 0.80 0.84 0.81 0.71 0.73 0.66 0.71 Flotation Concentrate Metal Cu in Cu flotation concentrate Mlb Cu 260 - - - 46.49 35.35 37.05 35.71 31.45 32.52 29.45 12.30 tonnes Cu 118,080 - - - 21,086 16,033 16,807 16,199 14,268 14,749 13,360 5,578 Au in Cu flotation concentrate g Au 15,907,559 - - - 2,619,836 2,299,391 2,128,088 2,394,675 2,037,839 1,893,506 1,794,737 739,487 oz Au 511,440 - - - 84,230 73,927 68,420 76,991 65,518 60,878 57,702 23,775 HEAP LEACH /SART RECOVERY Recovery SART Cu recovery % of Cu 14.3 14.3 14.3 14.3 14.3 14.3 14.3 14.3 14.3 14.3 14.3 14.3 Leach Au recovery % of Au 78.4 78.4 78.4 78.4 78.4 78.4 78.4 78.4 78.4 78.4 78.4 78.4 SART Concentrate Grade SART Cu concentrate grade % Cu 70.0 70.0 70.0 70.0 70.0 70.0 70.0 70.0 70.0 70.0 70.0 70.0 Moisture content %H20 8.0 8.0 8.0 8.0 8.0 8.0 8.0 8.0 8.0 8.0 8.0 8.0 SART Concentrate Tonnes Cu Conc. Produced - Dry dmt 4,921 - - 1,512 1,607 1,167 508 127 - - - - Cu Conc. Produced - Wet wmt 5,315 - - 1,633 1,736 1,260 548 137 - - - - Cu Conc. % of Feed % dmt 0.05 - - 0.06 0.05 0.04 0.04 0.04 - - - -SART Concentrate Metal Cu in SART concentrate Mlb Cu 8 - - 2.33 2.48 1.80 0.78 0.20 - - - - tonnes Cu 3,445 - - 1,059 1,125 817 355 89 - - - - Leached Au Au in doré g Au 3,561,766 - - 1,218,108 995,828 963,489 314,408 69,933 - - - - oz Au 114,512 - - 39,162 32,016 30,976 10,108 2,248 - - - -
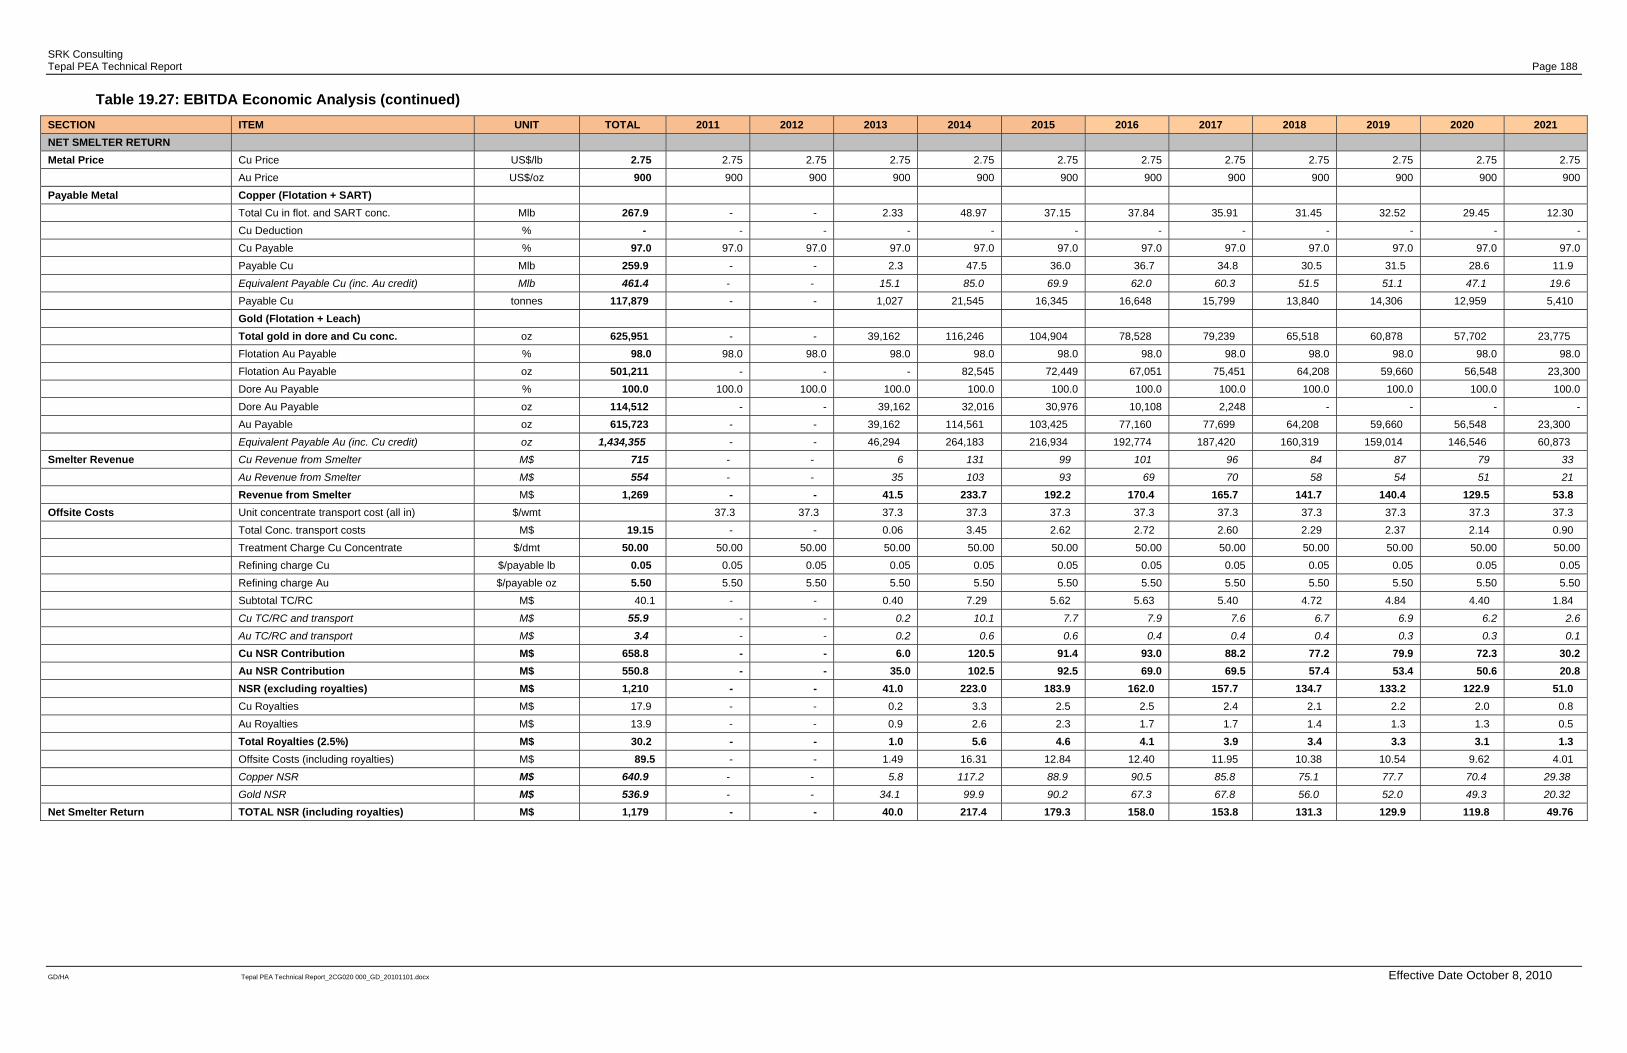
SRK Consulting Tepal PEA Technical Report Page 188
GD/HA Tepal PEA Technical Report_2CG020 000_GD_20101101.docx Effective Date October 8, 2010
Table 19.27: EBITDA Economic Analysis (continued) SECTION ITEM UNIT TOTAL 2011 2012 2013 2014 2015 2016 2017 2018 2019 2020 2021 NET SMELTER RETURN Metal Price Cu Price US$/lb 2.75 2.75 2.75 2.75 2.75 2.75 2.75 2.75 2.75 2.75 2.75 2.75 Au Price US$/oz 900 900 900 900 900 900 900 900 900 900 900 900 Payable Metal Copper (Flotation + SART) Total Cu in flot. and SART conc. Mlb 267.9 - - 2.33 48.97 37.15 37.84 35.91 31.45 32.52 29.45 12.30 Cu Deduction % - - - - - - - - - - - - Cu Payable % 97.0 97.0 97.0 97.0 97.0 97.0 97.0 97.0 97.0 97.0 97.0 97.0 Payable Cu Mlb 259.9 - - 2.3 47.5 36.0 36.7 34.8 30.5 31.5 28.6 11.9
Equivalent Payable Cu (inc. Au credit) Mlb 461.4 - - 15.1 85.0 69.9 62.0 60.3 51.5 51.1 47.1 19.6
Payable Cu tonnes 117,879 - - 1,027 21,545 16,345 16,648 15,799 13,840 14,306 12,959 5,410 Gold (Flotation + Leach) Total gold in dore and Cu conc. oz 625,951 - - 39,162 116,246 104,904 78,528 79,239 65,518 60,878 57,702 23,775 Flotation Au Payable % 98.0 98.0 98.0 98.0 98.0 98.0 98.0 98.0 98.0 98.0 98.0 98.0 Flotation Au Payable oz 501,211 - - - 82,545 72,449 67,051 75,451 64,208 59,660 56,548 23,300 Dore Au Payable % 100.0 100.0 100.0 100.0 100.0 100.0 100.0 100.0 100.0 100.0 100.0 100.0 Dore Au Payable oz 114,512 - - 39,162 32,016 30,976 10,108 2,248 - - - - Au Payable oz 615,723 - - 39,162 114,561 103,425 77,160 77,699 64,208 59,660 56,548 23,300 Equivalent Payable Au (inc. Cu credit) oz 1,434,355 - - 46,294 264,183 216,934 192,774 187,420 160,319 159,014 146,546 60,873 Smelter Revenue Cu Revenue from Smelter M$ 715 - - 6 131 99 101 96 84 87 79 33 Au Revenue from Smelter M$ 554 - - 35 103 93 69 70 58 54 51 21 Revenue from Smelter M$ 1,269 - - 41.5 233.7 192.2 170.4 165.7 141.7 140.4 129.5 53.8 Offsite Costs Unit concentrate transport cost (all in) $/wmt 37.3 37.3 37.3 37.3 37.3 37.3 37.3 37.3 37.3 37.3 37.3 Total Conc. transport costs M$ 19.15 - - 0.06 3.45 2.62 2.72 2.60 2.29 2.37 2.14 0.90 Treatment Charge Cu Concentrate $/dmt 50.00 50.00 50.00 50.00 50.00 50.00 50.00 50.00 50.00 50.00 50.00 50.00 Refining charge Cu $/payable lb 0.05 0.05 0.05 0.05 0.05 0.05 0.05 0.05 0.05 0.05 0.05 0.05 Refining charge Au $/payable oz 5.50 5.50 5.50 5.50 5.50 5.50 5.50 5.50 5.50 5.50 5.50 5.50 Subtotal TC/RC M$ 40.1 - - 0.40 7.29 5.62 5.63 5.40 4.72 4.84 4.40 1.84 Cu TC/RC and transport M$ 55.9 - - 0.2 10.1 7.7 7.9 7.6 6.7 6.9 6.2 2.6 Au TC/RC and transport M$ 3.4 - - 0.2 0.6 0.6 0.4 0.4 0.4 0.3 0.3 0.1 Cu NSR Contribution M$ 658.8 - - 6.0 120.5 91.4 93.0 88.2 77.2 79.9 72.3 30.2 Au NSR Contribution M$ 550.8 - - 35.0 102.5 92.5 69.0 69.5 57.4 53.4 50.6 20.8 NSR (excluding royalties) M$ 1,210 - - 41.0 223.0 183.9 162.0 157.7 134.7 133.2 122.9 51.0 Cu Royalties M$ 17.9 - - 0.2 3.3 2.5 2.5 2.4 2.1 2.2 2.0 0.8 Au Royalties M$ 13.9 - - 0.9 2.6 2.3 1.7 1.7 1.4 1.3 1.3 0.5 Total Royalties (2.5%) M$ 30.2 - - 1.0 5.6 4.6 4.1 3.9 3.4 3.3 3.1 1.3 Offsite Costs (including royalties) M$ 89.5 - - 1.49 16.31 12.84 12.40 11.95 10.38 10.54 9.62 4.01 Copper NSR M$ 640.9 - - 5.8 117.2 88.9 90.5 85.8 75.1 77.7 70.4 29.38 Gold NSR M$ 536.9 - - 34.1 99.9 90.2 67.3 67.8 56.0 52.0 49.3 20.32 Net Smelter Return TOTAL NSR (including royalties) M$ 1,179 - - 40.0 217.4 179.3 158.0 153.8 131.3 129.9 119.8 49.76

SRK Consulting Tepal PEA Technical Report Page 189
GD/HA Tepal PEA Technical Report_2CG020 000_GD_20101101.docx Effective Date October 8, 2010
Table 19.28: EBITDA Economic Analysis (continued) SECTION ITEM UNIT TOTAL 2011 2012 2013 2014 2015 2016 2017 2018 2019 2020 2021 OPERATING COST Unit OPEX Mining $/t mined 1.35 1.37 1.28 1.22 1.24 1.34 1.36 1.54 1.56 1.72 $/t processed 2.37 5.93 1.80 2.11 2.80 2.42 2.48 2.12 2.08 1.96 Flotation process $/t milled 4.30 4.30 4.30 4.30 4.30 4.30 4.30 4.30 4.30 4.30 Heap Leach/SART $/t leached 4.31 4.31 4.31 4.31 4.31 4.31 4.31 4.31 4.31 4.31 G&A and sustaining capital $/t milled 0.63 0.68 0.68 0.68 0.68 0.68 0.68 0.68 0.68 0.68 Total OPEX Mining M$ 162.5 14.8 18.9 23.2 25.8 20.1 19.8 17.0 16.6 6.2 Flotation process M$ 252.2 - 32.3 34.4 34.4 34.4 34.4 34.4 34.4 13.5 Heap Leach/SART M$ 43.2 10.8 12.9 12.9 5.3 1.3 - - - -
G&A and sustaining capital M$ 46.7 1.7 7.1 7.5 6.3 5.6 5.4 5.4 5.4 2.1 Total OPEX M$ 505 27.3 71.3 78.0 71.8 61.4 59.7 56.8 56.5 21.8
Unit OPEX per t milled $/t milled 7.35 10.92 6.78 7.09 7.78 7.40 7.46 7.10 7.06 6.94 Cost/Payable Metal Unit OPEX per Cu equivalent $/lb Eq. Cu payable 1.09 1.81 0.84 1.12 1.16 1.02 1.16 1.11 1.20 1.12 Unit OPEX per Au equivalent $/oz Eq. Au payable 358 593 274 366 379 334 379 364 393 365 NET OPERATING INCOME M$ 675 - - 13 146 101 86 92 72 73 63 28 CAPITAL COST Mining equipment fleet M$ 44.3 16.0 27.1 3.3 1.7 - - - - - - 3.8 Roads and Mining Infrastructure M$ 14.7 14.7 Electrical power line and generators M$ 14.2 14.2 Process plant M$ 124.0 24.0 100.0 Heap Leach Pad M$ 16.8 16.8 Tailings Management Facility M$ 20.0 5.0 15.0 Owners Costs M$ 8.8 2.3 6.5 EPCM M$ 26.3 6.9 19.5 Closure M$ 4.8 4.8 Contingency on non-sustaining capital M$ 10% 10% 10% 10% 10% 10% 10% 10% 10% 10% 10% 10% Contingency M$ 19.2 5.3 13.4 - - - - - - - 0.5
Sustaining Capital M$ - - - - - - - - - - - - TOTAL CAPITAL COST M$ 293.0 - 105.1 181.5 3.3 1.7 - - - - - 1.5
EBITDA EBITDA M$ 382 0 (105) (169) 143 100 86 92 72 73 63 26
5.0% Discounted EBITDA M$ 258 0 (105) (161) 130 86 71 72 53 52 43 17 Discounted Cumulative EBITDA M$ 0 (105) (266) (136) (50) 21 93 146 198 241 258 Total Unit Cost per Cu eq. (inc. post-construction capital) $/lb Eq. Cu payable 1.73 NA NA 13.85 0.88 1.14 1.16 1.02 1.16 1.11 1.20 1.19 Total Unit Cost per Au eq. (inc. post-construction capital) $/oz Eq. Au payable 566 NA NA 4,532 287 373 379 334 379 364 393 390

SRK Consulting Tepal PEA Technical Report Page 190
GD/HA Tepal PEA Technical Report_2CG020 000_GD_20101101.docx Effective Date October 8, 2010
19.9.4 Sensitivity Analysis
Sensitivity analyses were done for the base case by individually modifying the capital cost, operating cost, metal price and grade up and down by 20% to show the sensitivity of the EBITDA net present value using a 5% discount rate (“NPV5%”). The results of the sensitivity analyses show that the project is most sensitive to metal price and mill feed grade. A 20% increase in gold and copper price leads to a 77% increase in pre-tax NPV5% from $258M to $456M. A change in grade by 20% has a similar effect on NPV5%. The converse occurs if the metal price or mill feed grade drops by 20%, the pre-tax NPV5% drops from $258M to $60M when metal price is changed.
Operating costs are the next most sensitive parameter. A 20% increase in operating costs reduces the NPV5% by $80M. For capital costs, a 20% increase results in a $56M (18%) drop in NPV5%.
A summary of the sensitivity analysis is shown in Table 19.26 and Figure 19.25.
Table 19.29: Sensitivity Analysis Results
Case Variable EBITDA NPV5% (M$)
-20% Variance
0% Variance
20% Variance
Base Case
Capital Cost 315 258 202 Operating Cost 339 258 178
Metal Price 60 258 456 Grade 69 258 447

SRK Consulting Tepal PEA Technical Report Page 191
GD/HA Tepal PEA Technical Report_2CG020 000_GD_20101101.docx Effective Date October 8, 2010
Figure 19.25: Sensitivity Analysis Results
Further EBITDA NPV and IRR sensitivities were run for a variety of gold and copper prices with the results shown in Table 19.30.
Table 19.30: NPV5% and IRR Results for Varying Metal Prices
Gold Price ($/oz) Copper Price ($/lb)
2.50 2.75 3.00 3.25 3.50 5% Discount Rate EBITDA Net Present Value (M$)
800 159 210 260 310 360 900 208 258 309 359 409
1,000 257 307 357 407 458 1,100 305 356 406 456 506 1,200 354 404 454 505 555
EBITDA Internal Rate of Return (%) 800 20 24 27 31 35 900 24 28 31 35 38
1,000 28 32 35 39 42 1,100 32 35 39 42 46 1,200 36 39 43 46 49
Base Case

SRK Consulting Tepal PEA Technical Report Page 192
GD/HA Tepal PEA Technical Report_2CG020 000_GD_20101101.docx Effective Date October 8, 2010
19.10 Payback
Payback period for the base case at a discount rate of 0% is a little under 4 production years. The payback estimates do not include capital expenditures prior to construction.
19.11 Mine Life
The life of mine is 8.3 production years. The first year of production includes only heap leach operations with the flotation circuit starting up in the second year. The heap leach concludes operation after 5 years and the flotation plant continues to run until the end of the mine life. One year of pre-production construction including infrastructure and heap leach facilities is assumed. The remainder of flotation plant is built during the first year of heap leach operation.
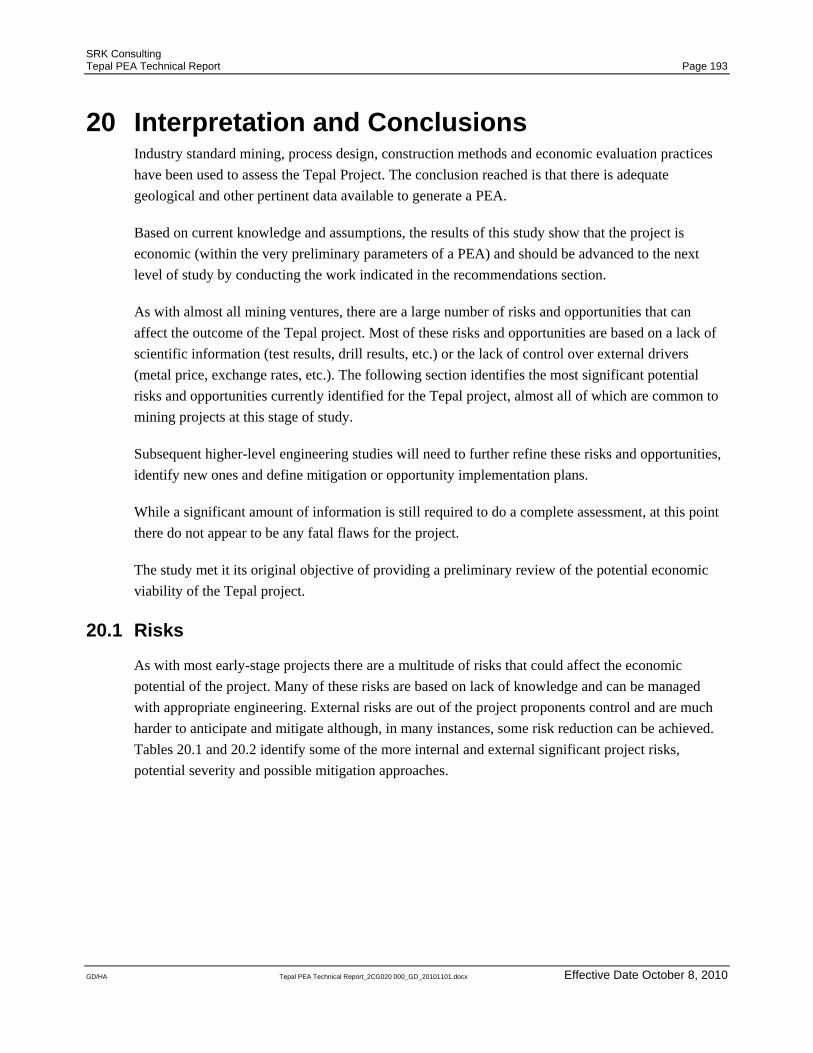
SRK Consulting Tepal PEA Technical Report Page 193
GD/HA Tepal PEA Technical Report_2CG020 000_GD_20101101.docx Effective Date October 8, 2010
20 Interpretation and Conclusions Industry standard mining, process design, construction methods and economic evaluation practices have been used to assess the Tepal Project. The conclusion reached is that there is adequate geological and other pertinent data available to generate a PEA.
Based on current knowledge and assumptions, the results of this study show that the project is economic (within the very preliminary parameters of a PEA) and should be advanced to the next level of study by conducting the work indicated in the recommendations section.
As with almost all mining ventures, there are a large number of risks and opportunities that can affect the outcome of the Tepal project. Most of these risks and opportunities are based on a lack of scientific information (test results, drill results, etc.) or the lack of control over external drivers (metal price, exchange rates, etc.). The following section identifies the most significant potential risks and opportunities currently identified for the Tepal project, almost all of which are common to mining projects at this stage of study.
Subsequent higher-level engineering studies will need to further refine these risks and opportunities, identify new ones and define mitigation or opportunity implementation plans.
While a significant amount of information is still required to do a complete assessment, at this point there do not appear to be any fatal flaws for the project.
The study met it its original objective of providing a preliminary review of the potential economic viability of the Tepal project.
20.1 Risks
As with most early-stage projects there are a multitude of risks that could affect the economic potential of the project. Many of these risks are based on lack of knowledge and can be managed with appropriate engineering. External risks are out of the project proponents control and are much harder to anticipate and mitigate although, in many instances, some risk reduction can be achieved. Tables 20.1 and 20.2 identify some of the more internal and external significant project risks, potential severity and possible mitigation approaches.

SRK Consulting Tepal PEA Technical Report Page 194
GD/HA Tepal PEA Technical Report_2CG020 000_GD_20101101.docx Effective Date October 8, 2010
Table 20.1: Internal Project Risks
Risk Explanation Potential Impact Possible Risk Mitigation
Process Costs and Recoveries
Flotation recoveries are largely based on results from just two composites, one from the North Zone and one from the South Zone.
If life-of-mine recovery of copper or gold is lower than projected, project economics could be negatively impacted.
Conduct a flotation variability study to determine how material from different areas responds and what the average copper and gold recoveries are likely to be..
The oxide ore contains significant cyanide-soluble copper, which leaches along with the gold.
The copper leaching increases cyanide consumption and complicates gold recovery, raising processing costs.
In conjunction with the next column leach program, initiate tests to determine the operating parameters for a SART plant to recover the copper and regenerate the cyanide.
Gold recovery by leaching has only been determined on ore with a 12.5 mm (1/2-in.) top size or less.
If gold recovery from coarser material proves to be lower than projected, a ROM ore leach may not be economically viable.
Column leach tests covering a wider range of top sizes should be initiated to guide selection of the optimum top size for the leach material.
Ability to Acquire Water
The region of the property is classified as a Warm-Dry Forest and the sources of water for the operation have not been well defined. However, the project is located on the immediate margin of the Tepalcatepec Basin, one of the largest water basins in Mexico
Failure to secure an adequate water supply could reduce the size of the operation and impact economics due to possible competition with agricultural usage in the project area.
Investigations on water sources need to continue and be documented in the next level of study. The design of water conservation measures in the plant will assist in the reduction of demand for water during the Dry period
CAPEX and OPEX
The ability to achieve the estimated CAPEX and OPEX costs would be an important element of success
An increase in OPEX of 20% would reduce the EBITDA NPV5% by 30%. An increase in CAPEX of 20% has a $56M negative impact on EBITDA NPV5% from the base case.
Further cost accuracy with the next level of study as well as the active investigation of potential cost-reduction measures
Permit Acquisition
The ability to secure a mining permit is, obviously, of paramount importance.
Failure to secure a mining permit would stop the project.
The development of close relationship with the communities and government along with a thorough ESIA and a project design that gives appropriate consideration to the environment and local people is required,
Development Schedule
The development schedule as shown in the production schedule and economic model is very aggressive and
A change in schedule would alter the project economics once project construction and mining commences.
If the schedule is to be followed Geologix needs to immediately embark on a PFS and the associated full field

SRK Consulting Tepal PEA Technical Report Page 195
GD/HA Tepal PEA Technical Report_2CG020 000_GD_20101101.docx Effective Date October 8, 2010
would require permitting, financing and further studies to continue unabated and have no major issues arise.
program including definition drilling
Water Management and Geochemistry
It has been assumed that the waste dumps and tailings ponds do not need to be lined and acid rock drainage and metal leaching (“ARD/ML”) will not be a problem. No water treatment facility was budgeted.
If ARD/ML testing indicates that that geochemistry will be an issue the liners may have to be placed under the TMF and/or the WRFs. This could add CAPEX and OPEX costs to the project but insufficient testing has been done to date.
Adequate testing of tailings and waste materials needs to be done to determine if there is an ARD/ML issue.
Inability to upgrade inferred resources to measured or indicated
The PEA mine plan uses roughly 50% inferred resources which cannot be used at a higher level of study
If none of the inferred resources can be upgraded to indicated then the mineable tonnage would be cut I half of what is presented here and would likely make the project uneconomic
A well planned definition drilling campaign, renewed geostatistical analysis and resource estimation needs to be undertaken to determine the amount of inferred resource that can be converted
TMF Location and Stability
The Site F selected by Geologix is the most expensive option and most susceptible to seismic activity
The current location of the TMF could create a permitting and stability issue and may have to be built out of earth and rock rather than the more economic cycloned tailing
The TMF could be moved to a different site or its design changed to improve stability. Various types of land use requires need to be assessed prior to the final site determination.
Table 20.2: External Project Risks
Risk Explanation Potential Outcome Possible Risk Mitigation
Metal prices
Gold and copper prices have a significant impact on the economic viability of the project.
A 20% drop in copper and gold price takes the project from having a EBITDA NPV5% of $258M down $60M.
Current strong demand for copper and gold make it possible to forward sell production to take the risk out of metal price volatility. This can be done for all or a portion of production.
Regional Political Stability
Mexico in the past has enjoyed a fairly stable mining environment. Should this situation change , the project could be impacted
Potential increased costs Close involvement and communication with local governments and increased security measures may be advantageous.
Earthquakes
The project is located in a seismically active area which could impact the stability of infrastructure, open pits and building
A significant earthquake could create a number of problems for the site from power failure to destruction of buildings, equipment and infrastructure. The current TMF design is
Appropriate design locations and standards must be adhered to should the project reach the construction phase to ensure all design work and building practices reasonably

SRK Consulting Tepal PEA Technical Report Page 196
GD/HA Tepal PEA Technical Report_2CG020 000_GD_20101101.docx Effective Date October 8, 2010
the most susceptible to seismic activity of the options reviewed.
consider the potential impact of an earthquake.
Securing Finance
The project will require a JV partner, purchase from a larger producing company or extensive bank financing (or a combination of the above).
Failure to secure funding could slow the project or stop its development altogether
Continued value-adding field work including additional resource development and technical studies as well as developing a financing plan if the project continues to develop are needed
Hiring Experienced Professionals
The selection of good people for the project will be important to its success
The inability of the company to retain a skilled development and operating team could have a negative impact on project timing, costs and overall success
The early search for the ideal people would be required along with appropriate compensation and benefits
20.2 Opportunities Table 20.3: Project Opportunities
Risk Explanation Potential Benefit
Metal prices Gold and copper prices have a significant impact on the economic viability of the project.
A 20% increase in copper and gold price increase the EBITDA NPV5% of about $200M.
Exploration Potential
Favourable exploration potential in the area could increase resources and might have a positive impact on the project mineral resources
Increased resources would lead to a potentially better project economics if they could be converted to reserves in the future. The more economic tonnes available to mine the better the project economics would be as total revenues would increase, potentially without adding more capital cost.
An increase in resource grade for copper and/or gold could have a significant impact on the economic viability of the project.
A 20% increase in copper and gold price increases the EBITDA NPV5% by about $189M.

SRK Consulting Tepal PEA Technical Report Page 197
GD/HA Tepal PEA Technical Report_2CG020 000_GD_20101101.docx Effective Date October 8, 2010
21 Recommendations 21.1 General Recommendations
• As per the Howe 2009 recommendations, a drilling program should be undertaken to improve the quality and reliability of future resources estimates and develop additional resources for the project; − At the current drill spacing over the deposit, continuous mineralised zones are shown to be
continuous, however there can be significant grade variability within the Tepal North and South zones and further infill drilling is warranted both to provide additional sample data to facilitate more meaningful geostatistical analysis and to upgrade currently defined inferred resources to indicated resources.
− Ensure logging procedures are maintained during Phase 2 activities so as to have consistency with Phase 1 practices.
− Develop the delineation of the weathering profile over the deposit in order to more reliably domain the geological model into zones of oxide, mixed and sulphide material.
− Following Phase 2 activities, the characteristics of gold and copper grade distribution should be assessed in the light of new data, and modelled separately if required.
− Implement the practise of orientated drill core for improved geotechnical and structural logging measurements, particularly as controls on mineralisation are structural. Consistency of geotechnical measurements is improved with the use of the orientation reference line. A system such as EzyMark provides a reliable easy to use means of obtaining oriented drill core.
− Ensure non biased core sampling through routine submittal of same half of core, achievable through use of orientation reference line.
− Develop the use of QA/QC samples, ensuring that adequate field duplicates and CRMs are submitted.
− Continued bulk density determination of half core samples to build up the density database for use in future estimations.
− Multi-element grade domain modelling for improved single element domain geostatistical analysis and restricted grade interpolation.
− Improved geological modelling to include the interpretation of host geology, breccia, stockwork and alteration zones to domain assay data for improved geostatistical analysis and wireframe restricted grade interpolation.
− The cost of the resource definition drilling is estimated to be $4.0M and require approximately 22,500 m of drilling.

SRK Consulting Tepal PEA Technical Report Page 198
GD/HA Tepal PEA Technical Report_2CG020 000_GD_20101101.docx Effective Date October 8, 2010
• PFS – This phase is contingent upon the conversion of a large percentage of Inferred resources to Indicated or Measured categories. The estimated cost of the PFS, including field work but excluding metallurgical testing and resource definition drilling detailed elsewhere in this section is expected to be $1.5M.;
• Continued work on the environmental baseline study.
21.2 Recommendations for Further Metallurgical Testing
Recommendations for further development of the processing routes for both the sulphide and oxide ore types are enumerated below. These are based on the current understanding of the Tepal resource. However, some adjustment may be appropriate if the current drilling program expands the tonnage and/or grade of the deposit. The metallurgical testing program is estimated to cost $0.15M for heap leach testing and $0.5M for comminution and flotation testing.
21.2.1 Sulphide Ore Processing • A core drilling program should be undertaken to provide representative ore from below the
oxide-sulphide transition zone. The minimum core size should be HQ, as this is the smallest size suitable for determining crushing work indices.
• A comminution variability program should be undertaken to measure the range of crushing work indices, grinding work indices, and abrasion indices to be encountered.
• Locked cycle flotation tests using the established operating parameters should be run on the representative composites to determine variation in flotation response by area.
• Once a final mine plan is established, composites representing quarterly production for the first few years of operation should be tested to provide input for production forecasting and financial modeling.
21.2.2 Oxide Ore Processing • A core drilling program should be undertaken to provide representative ore samples at depths
from just below the gold-bearing surface down to the oxide-sulphide transition. The minimum core size should be PQ, as this is needed to provide coarse ore for further column leach tests.
• A comminution variability program should be undertaken to measure the range of crushing work indices and abrasion indices to be encountered.
• Column leach cyanidation tests using the established operating parameters should be run on composites from various areas.
• The range of crush sizes should also be expanded to at least a 50 mm (nominal 2 in.) top size to determine if ore crushing is economically beneficial.

SRK Consulting Tepal PEA Technical Report Page 199
GD/HA Tepal PEA Technical Report_2CG020 000_GD_20101101.docx Effective Date October 8, 2010
• Bottle roll testing on splits from the column composites should be run to further establish a correlation between bottle roll and column recoveries and eventually commercial heap performance.
• A development plan should be initiated to determine operating parameters for the SART technology that will be required to remove copper from the leach circuit, while recovering the cyanide.
• Once a final mine plan is established, composites representing quarterly production for the first few years of operation should be tested to provide input for production forecasting and financial modeling.

SRK Consulting Tepal PEA Technical Report Page 200
GD/HA Tepal PEA Technical Report_2CG020 000_GD_20101101.docx Effective Date October 8, 2010
22 Illustrations All illustrations are included in the body of the report and in the Appendices.

SRK Consulting Tepal PEA Technical Report Page 201
GD/HA Tepal PEA Technical Report_2CG020 000_GD_20101101.docx Effective Date October 8, 2010
23 Acronyms, Abbreviations and Definitions Distance Unit Prefixes µm micron (micrometre) µ micro (one millionth) mm millimetre m milli (one thousandth) cm centimetre c centi (one hundredth) m metre d deci (one tenth) km km k or K kilo (one thousand) ” or in inch M Mega (one million) ’ or ft foot G Giga (one trillion) Area Temperature ac acre oC degree Celsius (Centigrade) ha hectare oF degree Fahrenheit Time Misc. s second Btu or BTU British Thermal Unit m or min minute Ø diameter h or hr hour r radius d day hp horsepower y or yr year s.g. specific gravity Volume masl metres above sea level l litre elev elevation above sea level usg US gallon Rates and Ratios lcm loose cubic metre p or / per bcm bank cubic metre mph miles per hour Mbcm million bcm cfm cubic feet per minute Mass usgpm United States gallon per minute kg kilogram tph tonnes per hour g gram tpd tonnes per day t metric tonne mtpa million tonnes per annum Kt kilotonne ppm parts per million lb pound ppb parts per billion Mt megatonne Acronyms oz troy ounce SRK SRK Consulting (Canada) Inc. wmt wet metric tonne CIM Canadian Institute of Mining dmt dry metric tonne NI 43-101 National Instrument 43-101 Pressure ABA acid- base accounting psi pounds per square inch AP acid potential Pa pascal NP neutralization potential kPa kilopascal ML/ARD metal leaching/ acid rock drainage MPa megapascal PAG potentially acid generating Elements and Compounds non-PAG non-potentially acid generating Au gold RC reverse circulation Ag silver DD / DDH diamond drill / diamond drill hole As arsenic IP induced polarization Cu copper HL heap leach Fe iron COG cut off grade Mo molybdenum NSR net smelter return Pb lead NPV net present value S sulphur LOM life of mine
Zn zinc EBITDA earnings before interest, taxation, depreciation and amortization
CN cyanide IRR internal rate of return NaCN sodium cyanide DR discount rate Electricity PEA preliminary economic assessment kW kilowatt PFS preliminary feasibility study kWh kilowatt hour FS feasibility study V volt Conversion Factors W watt 1 tonne 2,204.6 lb Ω ohm 1 troy ounce 31.1035 A ampere

SRK Consulting Tepal PEA Technical Report Page 202
GD/HA Tepal PEA Technical Report_2CG020 000_GD_20101101.docx Effective Date October 8, 2010
24 References Booth, M. (2007a): San Jose Exploration by Arian, Arian Silver Corp. internal memo, Dec 2007.
Booth, D. (2007b): San Jose – Sampling Methodology and QAQC. Arian Silver Corp. internal memo, Dec 2007.
Canadian Institute of Mining, Metallurgy and Petroleum, 2000, CIM Definition Standards on Mineral Resources and Reserves, November 14, 2004, 10 p.
Cooke, D.R., Wilson, A.J. and Davies, A.G.S, 2004, Characteristics and genesis of porphyry coppergold deposits, in Cooke, D.R, Deyell, C. and Pongratz, eds., 24 ct Au Workshop, CODES Special Publication 5, Centre for Ore Deposit Research, University of Tasmania, p. 17 – 34.
Copper Cliff, 1974, Tepal Property, Michoacán State, Mexico: Assessment of and Recommendations on Mineralised zones; 9 p.
Deloitte, Touche, Tohmatsu Mexico Tax Alert – 2010 Tax reform proposed (2009)
Duesing, C.M., 1973, Mexico – Tepalcuatita Copper Prospect – Request for Mill Testing: INCO intercompany memorandum July 3, 1973, 1 p.
Elliott, M. and Ackerman, S., 1993, The extraction of gold and copper from the Tepalcatepec Samples for Teck Corporation: Progress Report 1, 37 p.
Gómez-Tagle, Valdes, A., 1997, Levantamiento Geológico de Alteración-Mineralización del
Hogg J., 2008; Resource Estimation Study on the San Jose Silver-Lead-Zinc Prospect, Zacatecas, Mexico, April 2008; Technical Report by ACA Howe International Ltd.
Proyecto “Tepal”, Municipio de Tepalcatepec, Mich.; report prepared on behalf of Minera Hecla S.A. de C.V., 15 p.
Panteleyev, A. 1995, Porphyry Cu+/-Mo+/-Au, in Selected British Columbia Mineral Deposit Profiles, Volume 1 - Metallics and Coal, Lefebure, D.V. and Ray, G.E., Editors, British Columbia Ministry of Energy of Employment and Investment, Open File 1995-20, pages 87-92.
Priesmeyer, S. Technical Report on the Tepal Property, Michoacán, Mexico ACA Howe International Limited (2007)
Shonk, K. N.,1994, The Tepal Gold-Copper Property, Michoacán, Mexico: report prepared on behalf of Teck Resources Inc., 26 p.

SRK Consulting Tepal PEA Technical Report Page 203
GD/HA Tepal PEA Technical Report_2CG020 000_GD_20101101.docx Effective Date October 8, 2010
Singer, D.A., Berger, V.I. and Moring B.C., 2005, Porphyry Copper deposits of the World: Database, Map, and Grade and Tonnage Models; United States Geological Survey Open-File Report 2005-1060, 9 p.
Von Cruyningen, R. and Thorndyke, J., 1973, Tepalcuatita Copper Prospect, Mexico, Borehole 57002, 0-88 metres, Mill Testing: INCO intercomapny memorandum dated July 26, 1973, 1 p.
White, G.R., Resource Estimation Update Revised for the Tepal Gold-Copper Prospect, Michoacán, Mexico ACA Howe International Ltd. (Berkhamsted, Hertfordshire, UK, November 4, 2009)
Wilson, A.J., Cooke, D.R. and Harper, B.J. 2003, The Ridgeway Gold-Copper Deposit: A High-Grade Alkalic Porphyry Deposit in the Lachlan Fold Belt, New South Wales, Australia: Economic Geology, v. 95, p. 1637-1666.

SRK ConsultinTepal PEA Te
GD/HA
25 DThitech
Qu
Br
Di
Jo
Go
Ep
Ga
ThiRe
Gi
ng chnical Report
ate anis technical rehnical report
ualified Perso
ruce Murphy
ino Pilotto, P.E
oseph Schlitt
ordon Doerkse
pitacio Robledo
alen White
is report was eviewer
illes Arseneau,
Tepal PE
nd Signeport was wriis October 8,
on
Eng.
en, P.Eng
o
reviewed by:
, P.Geo.
EA Technical Report_2CG
nature itten by the Q 2010.
020 000_GD_20101101.d
Pageualified Perso
Signature
Signature
docx
ons listed belo
Effective
ow. The effec
Nove
Nove
Nove
Nove
Nove
Nove
D
Octobe
P
e Date October
ctive date of t
Date
mber 1, 2010
mber 1, 2010
mber 1, 2010
mber 1, 2010
mber 1, 2010
mber 1, 2010
Date
er 29, 2010
Page 204
r 8, 2010
this

SRK Consulting (Canada) Inc. Suite 2200 – 1066 West Hastings Street Vancouver, B.C. V6E 3X2 Canada [email protected] www.srk.com Tel: 604.681.4196 Fax: 604.687.5532
QP Certificate Murphy_Tepal PEA_20101031.doc
Group Offices:Africa Asia Australia Europe North America South America
Canadian Offices:Saskatoon 306.955.4778 Sudbury 705.682.3270 Toronto 416.601.1445 Vancouver 604.681.4196 Yellowknife 867.445.8670
U.S. Offices:Anchorage 907.677.3520 Denver 303.985.1333 Elko 775.753.4151 Fort Collins 970.407.8302 Reno 775.828.6800 Tucson 520.544.3688
CERTIFICATE OF QUALIFIED PERSON
Bruce Murphy, FSAIMM I, Bruce Murphy, a Fellow of the South African Institute of Mining and Metallurgy, am employed as a Principal Consultant – Rock Mechanics with SRK Consulting (Canada) Inc. This certificate applies to the technical report titled “Tepal Project Preliminary Economic Assessment Technical Report” submitted on November 1, 2010 with an effective date of October 8, 2010. I am a Fellow of the South African Institute of mining and Metallurgy. I graduated with a MSc.Eng (Mining) degree from the University Witwatersrand, in May 1996. I have been involved in mining since 1990 and have practised my profession continuously since then. I have been involved in mining operations, mining related rock mechanics and consulting covering a wide range of mineral commodities in Africa, South America North America and Asia. As a result of my experience and qualifications, I am a Qualified Person as defined in National Instrument 43-101 Standards of Disclosure of Mineral Projects (NI 43-101). I have visited the Tepal site on 9th and 10th July 2010
I am responsible for the Slope Design Review and Section 18 of “Tepal Project Preliminary Economic Assessment Technical Report”, submitted on November 1, 2010 with an effective date of October 8, 2010.
I am independent of Geologix Explorations Inc. as independence is described by Section 1.4 of NI 43-101. I have been involved with the Tepal Project since July 2010 doing the Slope Design Review. I have read National Instrument 43-101 and this report has been prepared in compliance with that Instrument. As of the date of this certificate, to the best of my knowledge, information and belief, the technical report contains all scientific and technical information that is required to be disclosed to make the technical report not misleading.
Bruce Murphy, FSAIMM Dated: November 1, 2010

SRK Consulting (Canada) Inc. Suite 2200 – 1066 West Hastings Street Vancouver, B.C. V6E 3X2 Canada [email protected] www.srk.com Tel: 604.681.4196 Fax: 604.687.5532
Dino QP.doc
Group Offices:Africa Asia Australia Europe North America South America
Canadian Offices:Saskatoon 306.955.4778 Sudbury 705.682.3270 Toronto 416.601.1445 Vancouver 604.681.4196 Yellowknife 867.445.8670
U.S. Offices:Anchorage 907.677.3520 Denver 303.985.1333 Elko 775.753.4151 Fort Collins 970.407.8302 Reno 775.828.6800 Tucson 520.544.3688
CERTIFICATE OF QUALIFIED PERSON
Dino Pilotto, P.Eng. I, Dino Pilotto, am a Professional Engineer, employed as a Principal Consultant - Mining with SRK Consulting (Canada) Inc. This certificate applies to the technical report titled “Tepal Project Preliminary Economic Assessment Technical Report” submitted on November 1, 2010 with an effective date of October 8, 2010. I am a member of the Association of Professional Engineers and Geoscientists of Saskatchewan and Alberta. I graduated with a B.A.Sc. (Mining & Mineral Process Engineering) from the University of British Columbia in May 1987. I have practiced my profession continuously since June 1987. I have been involved with mining operations, mine engineering and consulting covering a variety of commodities at locations in North America, South America, and Africa. As a result of my experience and qualifications, I am a Qualified Person as defined in National Instrument 43-101 Standards of Disclosure of Mineral Projects (NI 43-101). I have visited the Tepal site on July 9th and 10th, 2010.
I am responsible for Sections 14.2, 19.1, 19.2 and the mining part of 19.8 of “Tepal Project Preliminary Economic Assessment Technical Report”, submitted on November 1, 2010 with an effective date of October 8, 2010.
I am independent of Geologix Explorations Inc. as independence is described by Section 1.4 of NI 43-101. I have not had prior involvement with the Tepal Project. I have read National Instrument 43-101 and this report has been prepared in compliance with that Instrument. As of the date of this certificate, to the best of my knowledge, information and belief, the technical report contains all scientific and technical information that is required to be disclosed to make the technical report not misleading.
Dino Pilotto, P.Eng. Dated: November 1, 2010


SRK Consulting (Canada) Inc. Suite 2200 – 1066 West Hastings Street Vancouver, B.C. V6E 3X2 Canada [email protected] www.srk.com Tel: 604.681.4196 Fax: 604.687.5532
QP Certificate Doerksen_Tepal PEA_20101101.doc
Group Offices:Africa Asia Australia Europe North America South America
Canadian Offices:Saskatoon 306.955.4778 Sudbury 705.682.3270 Toronto 416.601.1445 Vancouver 604.681.4196 Yellowknife 867.445.8670
U.S. Offices:Anchorage 907.677.3520 Denver 303.985.1333 Elko 775.753.4151 Fort Collins 970.407.8302 Reno 775.828.6800 Tucson 520.544.3688
CERTIFICATE OF QUALIFIED PERSON
Gordon Doerksen, P.Eng. I, Gordon Doerksen, am a Professional Engineer, employed as a Principal Consultant - Mining with SRK Consulting (Canada) Inc. This certificate applies to the technical report titled “Tepal Project Preliminary Economic Assessment Technical Report” submitted on November 1, 2010 with an effective date of October 8, 2010. I am a member of the Association of Professional Engineers and Geoscientists of British Columbia. I graduated with a BS (Mining) degree from Montana College of Mineral Science and Technology in May 1990. I have been involved in mining since 1985 and have practised my profession continuously since 1990. I have been involved in mining operations, mine engineering and consulting covering a wide range of mineral commodities in Africa, South America North America and Asia. As a result of my experience and qualifications, I am a Qualified Person as defined in National Instrument 43-101 Standards of Disclosure of Mineral Projects (NI 43-101). I have not visited the Tepal site.
I am responsible for the Executive Summary and Sections 1, 2, 15, 19.4, 19.5, 19.7 to 19.11, 20, 21.1 and 22 to 25 of “Tepal Project Preliminary Economic Assessment Technical Report”, submitted on November 1, 2010 with an effective date of October 8, 2010.
I am independent of Geologix Explorations Inc. as independence is described by Section 1.4 of NI 43-101. I have not previously been involved with the Tepal Project. I have read National Instrument 43-101 and this report has been prepared in compliance with that Instrument. As of the date of this certificate, to the best of my knowledge, information and belief, the technical report contains all scientific and technical information that is required to be disclosed to make the technical report not misleading.
Gordon Doerksen, P.Eng. Dated: November 1, 2010

Florencia N° 2280 Col Providencia
Guadalajara, Jal. México C.P. 44630 Tel: (33) 3425735
Clifton Associates Ltd ingeniería* ciencia * tecnología Natural Environment S.C
Guadalajara, Jalisco, México; Nov 1st, 2010 Qualified Person Certificate Geologix: Tepal Project (Michoacan, Mexico) I, Epitacio Robledo, P. Eng, am a Principal of Clifton Associates Ltd. – Natural Environment S.C. (Mexico), based on Guadalajara, Jalisco, Mexico, a consulting firm employed to carry out environmental consulting on behalf of clients in the exploration and mining industry in Mexico. This certificate applies to the revised "Tepal Project Preliminary Economic Assessment Technical Report”, submitted on November 1, 2010 with an effective date of October 8, 2010 I am an environmental engineer from the Autonomous University of Guadalajara (1999) and have practiced my profession continuously since 1999 and have over 11 years of experience in environmental studies for the mining industry, including: mineral exploration, project planning and development, mining operations and closure planning. I have experience in a variety of commodities in over 20 different states of Mexico. As a result of my experience and qualifications, I am a Qualified Person as defined by National Instrument 43-101, Standards of Disclosure of Mineral Project (NI-43-101). I have visited the Tepal site and surrounding lands on three different dates during 2010. I am responsible for Section 19.6 of this Technical Report. I am independent of Geologix Explorations Inc., as independence is described by section 1.4 of NI-43-101. I have been involved in previous technical reports, environmental and engineering studies at Geologix Tepal Project prior to the undertaking of the environmental section for this technical report. I have read National instrument 43-101 and this report has been prepared in compliance with that instrument. As of the date of this certificate, to the best of my knowledge, information and belief, the technical report contains scientific, technical and interpretation that is required to be disclosed in order to make the technical report not misleading.
Date: Nov 1st, 2010, Guadalajara, Mexico
__________________________ Epitacio Robledo, P.E. [email protected] www.cliftonmexico.com.mx

QP Certificate G White.docx Page 1 of 1
CERTIFICATE OF QUALIFIED PERSON
Galen White, BSc(Hons), MAusIMM, FGS.
I, Galen White am a Professional Geologist employed as a Principal Geologist – CSA Global (UK) Ltd. This certificate applies to the technical report titled “Tepal Project Preliminary Economic Assessment Technical Report” submitted on November 1, 2010 with an effective date of October 8, 2010. I am a member of the Australasian Institute of Mining and Metallurgy, a Fellow of the Geological Society, London and graduated with a BSc (Hons) degree in Geology from the University of Portsmouth, UK in 1996. I have practised my profession for 14 years I have been involved in exploration and mining since 1996 and have practised my profession continuously for 14 years. I have been involved in mineral exploration, resource development & mining and consulting covering a wide range of mineral commodities in Australia, Canada, Africa and Europe. As a result of my experience and qualifications, I am a Qualified Person as defined in National Instrument 43-101 Standards of Disclosure of Mineral Projects (NI 43-101). I visited the Tepal site between June 18th and June 20th 2008.
I am responsible for sections 3-13 and 17 of “Tepal Project Preliminary Economic Assessment Technical Report”, submitted on November 1, 2010 with an effective date of October 8, 2010.
I am independent of Geologix Explorations Inc. as independence is described by Section 1.4 of NI 43-101. I was involved in the Tepal Project from June 2007 until November 4, 2009 completing project reviews and updating the Mineral Resource Estimate for the project on behalf of ACA Howe International Limited in the capacity of Senior Geologist for the company. I have read National Instrument 43-101 and this report has been prepared in compliance with that Instrument. As of the date of this certificate, to the best of my knowledge, information and belief, the technical report contains all scientific and technical information that is required to be disclosed to make the technical report not misleading. Signature “signed and sealed”
Galen White, BSc(Hons), MAusIMM, FGS. Dated: November 1, 2010

APPENDIX 1
Geotechnical Slope Design Review

Tepal Property – Slope Design Review PEA Level
October 2010

Seismicity Potential
The Tepal property is in a high seismogenic zone and this should considered when planning and costing the various facilities
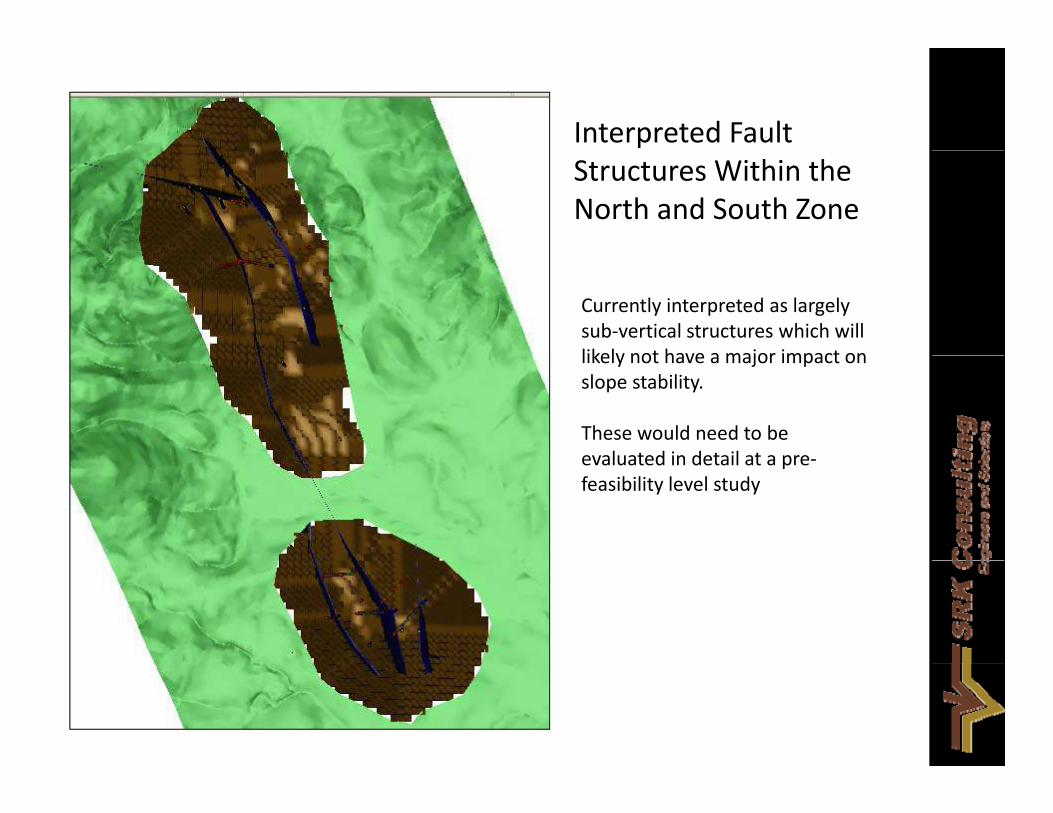
Interpreted Fault Structures Within the North and South Zone
Currently interpreted as largely sub‐vertical structures which will likely not have a major impact onlikely not have a major impact on slope stability.
These would need to be evaluated in detail at a preevaluated in detail at a pre‐feasibility level study

Oxide Zone SurfaceThe oxide zone generally shown weak ground conditions. These extend below the existing surface down into what may be termed the mixed zonedown into what may be termed the mixed zone
60 80 m
EW
60 –80 m
12
EW Section 1
N
EW Section 1
EW
EW Section 2

North Zone Drill Hole RQD
North View of the North zone showing the down‐hole RQD
E‐W Section through AS07‐032 showing the deep alteration
110 m

North Zone Drill Hole RQD

North Zone Slope Angle RecommendationsMore of the oxidation and alteration
t b f d i th thappears to be focused in the north sector of this pit, associated with the better mineralized zone. AS‐07‐032 shows poor rock mass conditions down to ~110m.
North East SectorFor a scoping level evaluation the assumption is the oxidation will reduce in thickness towards the slopereduce in thickness towards the slope areas. Thus in general the upper 60 m of the pit slope areas will be at 40° and the slope in the better rock mass conditions will be 50°
North West SectorFor the west slope, north of the 2116 600 the upper west weak zone should be taken down to 90 mbe taken down to 90 m
South SectorSouth of 2 116 600 the upper weak zone can be reduced to 20 m in the
f th larea of the slopes.
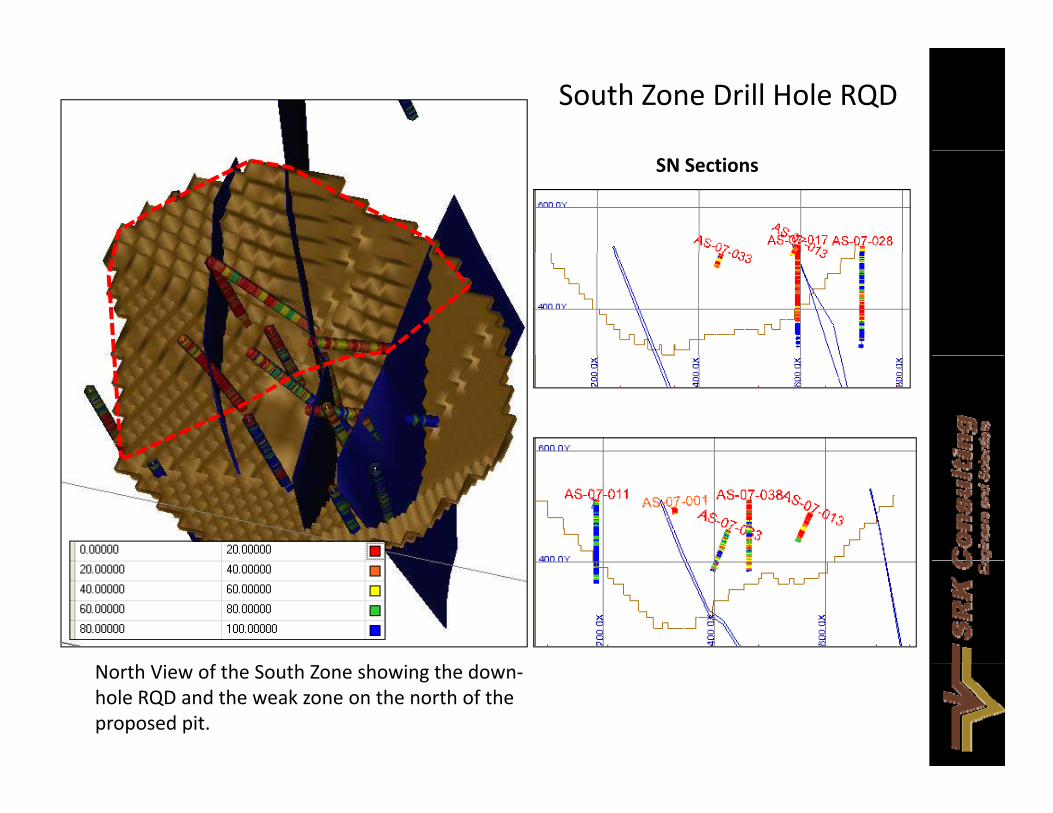
South Zone Drill Hole RQD
SN Sections
North View of the South Zone showing the down‐hole RQD and the weak zone on the north of the proposed pit.

South Zone Drill Hole RQD

South Zone Slope Angle Recommendations
AS07‐28 does show a strength increase in the upper area, but lower down in weak againlower down in weak again
North SectorMaximum overall slope on the north sector is to be a
IRA ‐40°north sector is to be a maximum of 40° . There may be a possibility of increasing the IRA over limited stack heights to 45° for 50 m heightheights to 45 for 50 m height to accommodate a ramp.
South SectorMaximum overall slope angleMaximum overall slope angle for the south sector is to be 50°. There may be a possibility of increasing the IRA over limited stack heights to 55° for
IRA ‐52°
limited stack heights to 55 for 50 m height to accommodate a ramp.

Slope Angle Recommendations ‐90m upper weak
zone: 40°60m upper weak zone: 40°
NW Sector NE Sector
SummaryBelow this: 50°zone: 40
Below this: 50°
20m upper weak zone: 40°
Below this: 50°
South Sector
40 overall slopes for North sector
North Sector
South Sector
50 overall slopes for south sector

APPENDIX 2
Tailings Management Facility Options

SRK Consulting (Canada) Inc. Suite 2200 – 1066 West Hastings Street Vancouver, B.C. V6E 3X2 Canada [email protected] www.srk.com Tel: 604.681.4196 Fax: 604.687.5532
TG/sdc Tepal_PEA_TMF_Alternatives_Memo_2CG020 000_TG_20101002.docx, 6:05 PM, Nov. 1, 10
Memo To: Gordon Doerksen Date: October 1, 2010
cc: Project File From: Tayfun Gurdal, Maritz Rykaart
Subject: Tepal PEA - TMF Alternatives Project #: 2CG020.000
1 Introduction This memo provides a desktop comparison of site alternatives for a Tailings Management Facility (TMF) for the Tepal Project Preliminary Economic Assessment (PEA) study. Sites were identified and compared at a scoping level and a preferred site is selected based on technical and economical basis.
2 Background Geologix Explorations Inc. (GIX) is a Vancouver-based mineral exploration company. Its flagship property, the Tepal Gold-Copper Porphyry Project, is located in Michoacán State, Mexico. The project is 70 km West of Apatzigán and 170 km South of Guadalajara, one of the largest cities in Mexico (Figure 1). The town of Tepalcatepec is 15.5 km from the property. Tepal hosts a current resource estimation of 1.15 Moz. gold and 413 Mlb. copper, and is open for possible expansion. In June 2010, Geologix initiated a 5,000m Phase 1 drilling program to expand the resource with a further 5,000m scheduled for Phase 2. GIX is also exploring the early stage Libertad gold-silver project in Sonora, Mexico and has numerous other fully owned and JV properties in the U.S., Mexico and Peru. SRK Consulting (Canada) Inc. (SRK) was commissioned by GIX to carry out a PEA for the Tepal Project. Part of the PEA involves identifying alternative TMF sites and comparing them based on a number of technical criteria and costs.
3 Tepal Site 3.1 Topography and Vegetation
Topography of the project area is dominated by a series of necks and ridges on the west and upper central part of the property, and relatively flat ground towards east, south, and southwest parts of the property. Elevation ranges from ~400masl at the east to ~1,000 masl at the west side of the property. No specific information was available with regards to vegetation present at the site, however, typically the Michoacan State has a wide variety of tree species, including forests of oak, cedar, and pine. Mango trees can be found in the eastern and western regions of the state. Common animals include coyotes, skunks, armadillos, squirrels, and lynxes. Eagles and parrots are found in the tropical regions.

SRK Consulting Page 2 of 13
TG/sdc Tepal_PEA_TMF_Alternatives_Memo_2CG020 000_TG_20101002.docx, 6:05 PM, Nov. 1, 10
3.2 Climate No site-specific climate information was available at the time of writing. In terms of state, the climate varies widely from place to place depending on altitude and prevailing winds. The coast enjoys a tropical climate with an average temperature of about 28°C. The central region has a milder climate, with an average temperature of about 22°C. The high-altitude regions can experience freezing temperatures. The average temperature in the state ranges from a minimum of 18°C to a maximum of 28°C. The average precipitation ranges from a minimum of 64cm to a maximum of 162cm. A weather station closest to Tepal Site indicates that annual precipitation is in the order of 850 mm. No specific evaporation data from the Tapl site was available at the time of writing. Therefore an an estimate was made based on geographic location of the site using Thorntwaite’s Method. Based on this, it is estimated that the annual evapotranspiration at the Tepal site is in the order of 1,170 mm, indicating that the natural water budget of the site is negative.
3.3 Seismicity The Tepal property is located in a highly seismic region. According to USGS’ seismic hazard map for Mexico, the project area falls in an area of 4.8 m/s2 peak ground acceleration with 10% probability of exceedance in 50 years (Figure 2). According to USGS’ earthquake density map (Figure 2), one earthquake of magnitude 5.0 or greater occurring at a depth between 70 and 300 km is expected every year.
4 Site Selection Criteria The process plant will process both oxide and sulphide ore. Oxide ore will be handled at a heap leach facility, therefore it is excluded here. The sulphide ore will be processed according to the mine production schedule given in Table 1. For the purposes of this report, it was assumed that 100% of the ore will be tailings. Therefore ore tonnages given in Table 1 also correspond to tailings tonnage. Given relatively coarse particle size distribution characteristics of the tailings material, an in-place tailings density of 1.5 t/m3 was adopted for capacity calculations. This assumption needs to be revised as further data becomes available. Table 1: Tailings Tonnage and Total Capacity Requirement
Tailings Year
Total 2012 2013 2014 2015 2016 2017 2018 2019 2020
Sulphide Processed (Mt)* 58.7 0.0 7.5 8.0 8.0 8.0 8.0 8.0 8.0 3.1
Tailings Volume ('000 m3)** 39,106 0 5,008 5,335 5,335 5,330 5,333 5,331 5,336 2,098
Cumulative Tailings Volume ('000 m3)
0 5,008 10,343 15,677 21,008 26,341 31,672 37,008 39,106
* Assumed tailings density = 1.5 t/m3. ** Assume tailings = ore processed. According to Table 1, the total tailings capacity requirement is 39.1 Mm3. Mine life is nine years, however tailings deposition (sulphide ore) will commence in Year 2 (2013) and deposition will continue for eight years.

SRK Consulting Page 3 of 13
TG/sdc Tepal_PEA_TMF_Alternatives_Memo_2CG020 000_TG_20101002.docx, 6:05 PM, Nov. 1, 10
5 Geochemistry Preliminary test work on a small set of samples including sulphide ore, waste rock, and tailings indicate that most of the samples are potentially acid generating (PAG). Sulpide level in all of the samples appears to be high enough to justify leach testing. For the purposes of this evaluation, it was, therefore, assumed that both the waste rock and tailings are acid generating. Therefore, waste rock is excluded as construction material, and a liner is required for any TMF site.
6 TMF Site Alternatives Six potential sites were identified in the analysis. These sites are labelled from A to F (Figure 3). A decision was made to limit the site selection to a 7km radius around the mine’s centroid. For volumetric analysis tailings containment was assumed to be obtained through construction of dams or dykes. Due to the high seismic risk, dam slopes are set at 3H:1V. For site selection a 2-m contour plan of the project site was available. The area covered in these alternatives assessment exceeds the limits of this 2-m contour plan for which a 20-m contour plan was used. Volumetric analysis for those sites outside the 2-m contour plan are expected to be less accurate at this stage. As higher resolution topographic plans become available, the analysis should be revisited. The alternative sites are discussed in greater detail in the following sections.
6.1 Site A Site A is located in a shallow and wide valley, and the main dam is 3.9km NEE of the proposed process plant. This site requires construction of three dams to contain a maximum tailings volume of 47.8 Mm3. The dams are labelled as Dam A 435 I, Dam A 435 II, and Dam A 435 III. Final crest elevation of the dams is 435masl. Maximum crest heights are 35m, 25m, and 14m, and crest lengths are 970m, 325m, and 270m, for Dams A 435 I, A 435 II, and A 435 III, respectively. Site A TMF basin (at full capacity) has a 2D surface area of 3,642,930 m2 (tailings surface), and a 3D surface area of 3,654,930 m2 (for liner installation). Dam construction volumes are as follows: • Dam A 435 I: 3,104,934 m3 • Dam A 435 II: 384,989 m3 • Dam A 435 III: 72,299 m3
6.2 Site B Site B falls in another wide valley NE of the proposed process plant location. This site requires a single dam (Dam B 450). The dam is 3.3km away from the process plant. Dam B 450 has a storage volume of 42.3 Mm3 at a final crest elevation of 450masl. The crest height is 49m and the crest length is 1,730m. The basin has a 2D surface area of 2,228,361 m2 and a 3D surface area of 2,231,687 m2. The dam construction volume is 7,187,685 m3. The area where Site B is located is considered by GIX as a target exploration area. Therefore even if Site B proves to be a feasible TMF site, it may not be possible to construct the TMF there.

SRK Consulting Page 4 of 13
TG/sdc Tepal_PEA_TMF_Alternatives_Memo_2CG020 000_TG_20101002.docx, 6:05 PM, Nov. 1, 10
6.3 Site C Site C falls in a valley NW of the proposed process plant location. This site contains a single dam (Dam C 523). The dam is 5.2km away from the process plant. Dam C 523 has a storage volume of 43.3 Mm3 at a final crest elevation of 523masl. The crest height is 63m and the crest length is 1,430. The basin has a 2D surface area of 5,015,398 m2 and a 3D surface area of 5,045,762m2. The dam construction volume is 8,751,786 m3.
6.4 Site D Site D is located 6.2km NNE of the proposed process plant location. Dam D 437 has a storage capacity of 49.6 Mm3 at its final crest elevation of 437 masl. The maximum final crest height is 37m and the final crest length is 1,251m. The basin has a 2D surface area of 5,614,781 m2 and a 3D surface area of 5,715,541 m2. The dam construction volume is 4,294,523 m3.
6.5 Site E Site E incorporates a ring dam. Site E is included in the analysis to illustrate how much of a difference the basic dam configuration will make in quantities and costs. The location of the dam (Dam E 410) has been selected arbitrarily to fall in an area with flat ground. For the purposes of this memo it is located on the flat grounds east of Sites A and B, 4.1km from the proposed process plant location. Dam E 410 has a final crest height of 40m and a final crest elevation of 410masl. Total crest length is 4,800m and the storage capacity is 45.5Mm3. Dam volume totals to 20,769,391m3.
6.6 Site F Site F is located about 1.9km NEE of the proposed process plant location. This alternative is a side-hill impoundment facility with three dams (Dam F 462 I, Dam F 462 II, and Dam F 462 III). The main dam, Dam F 462 I is particularly long (~2.9km). Crest length of dams F 462 II and F 462 III are 377m and 149m, respectively. With a maximum crest height of 42m (at El. 462masl) and a freeboard of 1 m, this site can store 40Mm3 of tailings using the cyclone technology.The basin has a 2D surface area of 2,264,820 m2 and a 3D surface area of 2,277,635m2. Due to its topographical configuration, and long dams it incorporates, a side-hill impoundment at Site F is likely to be the least resistant to seismic activity among the alternative sites.
7 Comparison of Alternative TMF Sites Results of site alternative analysis are presented in Table 2.
7.1 Dam Design Concept Construction of a retaining dam as prescribed in Figure 4 (earthen dam) and summarized in Table 2 (under earthen dam) will likely be expensive given the fact that waste rock is PAG and that most of the dam have to be constructed from a locally developed borrow site. Preliminary data on the tailings suggest that it has a significant coarse fraction and, therefore, it may be possible to construct containment dams using the cyclone technology. For preliminary cost estimate purposes we have assumed construction of a starter dam using non-PAG waste rock or local borrow materials and then construct the remainder of the dam using upstream cyclone tailings raises in increments of 2-3m at a time. This technique is schematically illustrated in Figure 4 (cyclone upstream raises). Given the high seismicity of the site, downstream construction may ultimately be required; however given the

SRK Consulting Page 5 of 13
TG/sdc Tepal_PEA_TMF_Alternatives_Memo_2CG020 000_TG_20101002.docx, 6:05 PM, Nov. 1, 10
current lack of data pertaining to foundation conditions and tailings properties this optimistic view is not inappropriate.

SRK Consulting Page 6 of 13
TG/sdc Tepal_PEA_TMF_Alternatives_Memo_2CG020 000_TG_20101002.docx, 6:05 PM, Nov. 1, 10
Table 2: Characteristics of Alternative TMF Sites and Dams
Site Dam ID
Maximum
Crest Elevation (m asl)
Maximum Crest Heigth (m)
Crest Length (m)
Distance from Proposed Process
Plant (m)
2D Surface Area
at Maximum Crest Elevation
(m2)
3D Surface Area
of Basin at Maximum
Crest Elevation(m2)
Earthen Dam* Cycloned Tailings Dam**
Dam Volume (m3)
Storage Capacity at
Maximum CrestElevation***
(m3)
Ratio Storage Capacity /
Dam Volume
Starter Dam Volume (m3)
Storage Capacity at
Maximum CrestElevation***
(m3)
Ratio Storage Capacity /
Dam Volume
A
Dam A 435 I 435 35 970 3,918
3,642,930 3,654,745
3,014,934
44,064,225 12.7
60,819
47,438,321 483.4 Dam A 435 II 435 25 325 4,421 384,989 20,378
Dam A 435 III 435 14 270 3,698 72,299 16,929
B Dam B 450 450 49 1,730 3,257 2,228,361 2,231,687 7,187,685 36,474,821 5.1 108,471 43,554,035 401.5
C Dam C 523 523 63 1,430 5,150 5,015,398 5,045,762 8,751,786 33,895,038 3.9 89,661 42,557,163 474.6
D Dam D 437 437 37 1,251 6,129 5,614,781 5,715,541 4,294,523 39,729,533 9.3 78,438 43,945,618 560.3
E Ring Dam E 410 410 40 4,800 4,123 1,433,895 1,900,000 20,769,391 32,293,614 1.6 273,600 52,789,405 192.9
F
Dam F 462 I 462 42 2,905 3,270
2,264,820 2,277,635
165,699
39,970,610 204.0 Dam F 462 II 462 22 377 2,420 21,660
Dam F 462 III 462 12 149 2,722 8,607
* Based on earthen dam design concept shown in Figure 4.Earthen dam quantities and capacity not calculated for Site F. ** Based on cyclone tailings dam design concept shown in Figure 4. ** Storage capacity values takes into account a 1m freeboard.

SRK Consulting Page 7 of 13
TG/sdc Tepal_PEA_TMF_Alternatives_Memo_2CG020 000_TG_20101002.docx, 6:05 PM, Nov. 1, 10
7.2 Costs A preliminary cost estimate was prepared, for comparison reasons, based on the figures listed in Table 2. The preliminary cost estimate assumes rough unit rates for each of the major construction items listed in Table 2. The cost estimate presented here is preliminary and its sole objective is to provide a basis for comparing estimated costs related to each alternative site. It is assumed that the dams will be constructed using cycloned tailings. This method calls for construction of a small starter berm (typically 2-3m high) using conventional earthen dam construction techniques and materials. Cyclones are then placed on this berm and deposition of coarser dry material takes place closer to cyclones and finer material with water is deposited further away from the cyclones towards the basin. The dam is continuously raised using coarser underflow of the cyclones. The cost estimate makes a comparison of capital cost items. Cyclone dam building is considered here as a sustained capital cost (or operational cost). It is estimated that this operational cost will be in the order of 28 cents per cubic meter of cyclone tailings. The dam quantities represented in Table 2 is a combination of starter berm and cyclone tailings. However, in Table 3, these two components are presented and costed separately. This memo assumes a conventional starter berm of 3m height with an operating crest width of 10m. Side slopes of the berm is 3H:1V. Preliminary hydrology data indicates that precipitation is less than evaporation at the project site. Therefore water is likely to become an important commodity for the Tepal Project. Given the likelihood of a negative natural water budget, water diversion structures around the TMF dams are excluded in this memo. It may be necessary to use the TMF as a water stoareg facility in addition to its intended purpose, or it may be necessary to construct a separate water storage dam to meet water requirements of the mine. As another alternative, tailings deposition strategy can be changed to include filtered or paste tailings. These considerations require further studies. For the purposes of this memo, cycloned tailings deposition with no water diversion structures around the TMF is assumed.

SRK Consulting Page 8 of 13
TG/sdc Tepal_PEA_TMF_Alternatives_Memo_2CG020 000_TG_20101002.docx, 6:05 PM, Nov. 1, 10
Table 3: Preliminary Comparative Capital Cost Estimate
Cost Item* Unit Unit
Rate** (CAD$)
Quantity Cost***
Site A Site B Site C Site D Site E Site F Site A Site B Site C Site D Site E Site F
Clear and grub basin m2 $ 0.79
3,654,745
2,231,687
5,715,541
5,715,541
1,900,000
2,277,635 $ 2,887,249 $ 1,763,033 $ 4,515,277 $ 4,515,277
$ 1,501,000
$ 1,799,331.65
Starter dam m3 $ 9.00
98,126
108,471
89,661
78,438
273,600
195,966 $ 883,134 $ 976,239 $ 806,949 $ 705,942 $ 2,462,400 $ 1,763,694.00
Cyclone equipment L.S. $ 5,000,000.00
1.25
1.38
1.14
1.00
3.84
2.74 $ 6,250,000 $ 6,900,000 $ 5,700,000 $ 5,000,000 $ 19,200,000 $ 13,700,000.00
Liner installation m2 $ 8.13 3,654,745 2,231,687 5,045,762 5,715,541 1,900,000 2,277,635 $ 29,713,077 $ 18,143,615 $ 41,022,045 $ 46,467,348 $ 15,447,000 $ 18,517,172.55
Access road construction m $ 43.60 20,908 13,785 37,852 35,421 8,923 16,074 $ 911,589 $ 601,026 $ 1,650,347 $ 1,544,356 $ 389,043 $ 700,826.40
Water diversion channel (allowance)
L.S. $ 2,000,000.00 1.00 1.00 1.00 1.00 1.00 1.00 $ 2,000,000 $ 2,000,000 $ 2,000,000 $ 2,000,000 $ 2,000,000 $ 2,000,000.00
Total Direct Costs $ 42,645,048 $ 30,383,913 $ 55,694,619 $ 60,232,923 $ 40,999,443 $ 38,481,024.60
Total Indirect Costs (Allow 50% of Direct Costs)
$ 21,322,524 $ 15,191,957 $ 27,847,309 $ 30,116,462 $ 20,499,721 $ 19,240,512.30
Total Cost $ 63,967,572 $ 45,575,870 $ 83,541,928 $ 90,349,385 $ 61,499,164 $ 57,721,536.90
* Major tasks only as cost items. Pump and pipelines excluded. ** Estimated unit rate takes into account sub-activities. *** Operational costs excluded. Cycloning tailings is considered an operational cost at an estimated $0.28 per m3 of cyclone tailings.

SRK Consulting Page 9 of 13
TG/sdc Tepal_PEA_TMF_Alternatives_Memo_2CG020 000_TG_20101002.docx, 6:05 PM, Nov. 1, 10
7.3 Comparison of Sites In this section, the alternative TMF sites are compared by means of a quantitative comparison table. This approach works by assigning a ranking to each of the compared parameter. Even though assigning rankings is a subjective process, it is an efficient method for a study of this stage. When comparing parameters, conditions assumed to be common to all sites are excluded. For example, there is equal seismic risk at each site, therefore this parameter is not taken into account. However resistance capability of each site against an earthquake might differ based on dam configuration, topography, and other factors. Seismic stability, therefore, has been included as a comparison criterion. Table 4 presents the ranking analysis.

SRK Consulting Page 10 of 13
TG/sdc Tepal_PEA_TMF_Alternatives_Memo_2CG020 000_TG_20101002.docx, 6:05 PM, Nov. 1, 10
Table 4: Quantitative Ranking Analysis for TMF Options
Site Maximum
Crest Height
Dam Volume**
3D Surface Area
of Basin at Maximum
Crest Elevation
Distance from
Proposed Process Plant (m)
Ratio Storage Capacity /
Dam Volume**
Ease of Liner
Installation
Seismic Stability
Expected Cost
Total Score***
A 5* 5 4 4 4 4 5 5 36
B 3 4 5 5 3 4 4 5 33
C 2 5 3 3 4 4 5 3 29
D 5 5 3 2 5 3 5 3 31
E 4 1 5 4 2 5 3 4 28
F 4 2 5 4 2 4 2 4 27
* Ranking for each parameter varies between 1 (least favorable) to 5 (most favorable). ** Cyclone tailings dam starter dam volumes taken into account. *** Highest total score = most favorable site.

SRK Consulting Page 11 of 13
TG/sdc Tepal_PEA_TMF_Alternatives_Memo_2CG020 000_TG_20101002.docx, 6:05 PM, Nov. 1, 10
8 Preferred TMF Site Based on the results of the quantitative ranking analysis (Table 4), it is concluded that Site A has the most advantages and the least amount of drawbacks (total score 36). Another advantage of Site A, which is not reflected in Tables 2 through 4 is that, it allows for staged construction of separate dams. Even though the bulk of the dam material is needed for Dam A 435 I, the rest of the dams do not need to be constructed up front. Table 5 lists the stage-capacity data for the preferred TMF site, Site A. Figure 4 presents this data graphically. Stage-capacity data was produced based on the cycloned tailings dam concept. Table 5: Preferred Site (Site A) Stage-Capacity Data
Elevation (masl)
Surface Area (m2)
Capacity (m3)
400 - - 401 226,794 242,442 402 246,108 505,531 403 267,067 791,026 404 289,949 1,100,981 405 314,962 1,437,675 406 341,327 1,802,554 407 369,326 2,197,363 408 399,009 2,623,904 409 430,292 3,083,886 410 463,203 3,579,050 411 497,488 4,110,865 412 534,013 4,681,725 413 571,245 5,292,386 414 610,751 5,945,279 415 651,615 6,641,855 416 694,594 7,384,376 417 739,598 8,175,006 418 787,129 9,016,447 419 836,881 9,911,073 420 888,389 10,860,761 421 1,589,174 12,559,588 422 1,727,518 14,406,305 423 1,857,930 16,392,432 424 1,982,467 18,511,689 425 2,100,517 20,757,142 426 2,212,301 23,122,092 427 2,325,612 25,608,172 428 2,442,706 28,219,424 429 2,577,307 30,974,566 430 2,716,831 33,878,858 431 2,865,572 36,942,154 432 3,001,883 40,151,168 433 3,162,006 43,531,352 434 3,342,661 47,104,656 435 3,532,443 50,880,837

SRK Consulting Page 12 of 13
TG/sdc Tepal_PEA_TMF_Alternatives_Memo_2CG020 000_TG_20101002.docx, 6:05 PM, Nov. 1, 10
The stage-capacity data suggests that the TMF dams at Site A can be constructed in stages if an earthen dam design approach is taken (for the cyclone method of dam building, no stages are necessary as the dam building process with cyclone tailings is a continuous activity throughout mine life). For example, a 20m initial raise will allow for two years of sulphide tailings deposition. Required capacity at this stage of mine (at Year 2) is 10.3 Mm3. A 20m-high starter dam, constructed at Year 1, will provide storage for 10.9 Mm3 of tailings. Later stages of TMF dams can be constructed at Year 2 (Raise to El. 428 masl) and Year 5 (Raise to El. 435 masl).
9 Conclusion Preliminary analysis indicates that Site A is the most suitable location for the TMF. Site F ranked the least favorable site due to, mainly, topographical and seismic stability considerations. The cost estimate for the sites included major construction components. However pump and pipe systems were excluded. The cost estimate has an allowance for installation of an HDPE geomembrane liner. With the inclusion of this allowance Site A has a total direct cost of $42.6M and total indirect cost of $21.3M, bringing the total cost for Site A to $63.9M. If no liner is installed at the TMF the total direct cost for Site A reduces to $12.9M, and the indirect cost becomes $6.5M, bringing the total expenditure for Site A to $19.4M. This memorandum provided a preliminary comparison of six alternative TMF sites and identified Site A as the preferred site. It is expected that information provided here will form the basis for upcoming stages of the project that deals with the TMF. However, it should be noted that findings of this current study is subject to change due to a-) future availability of data/information, and b-) changes in the overall project, or a combination of the two.
10 References G&T 2010, G&T Metallurgical Services Ltd, Metallurgical Assessment of the Tepal Project, Geologix Explorations Inc., Michoacan State, Mexico, KM2663, August 6, 2010 SRK 2010, Tepal Property – Slope Design Review PEA Level (Internal Draft), PowerPoint Presentation, August 2, 2010 German Monsalve Saenz, Hidrologia en la Ingenieria, 2a Edicion, 1999, Alfaomega Grupo Editor, S.A. de C.V. Gordon Doerksen, P.Eng, PE and Maritz Rykaart, PhD, P.Eng personal communications www.geologix.ca www.usgs.gov www.wikipedia.org

Figures

Tepal Project PEA
Filename: Figure 1_4_Location_Curve_20100929.pptx
Job No: 2CG020.000Figure: 1Date: Approved:
Location MapVANCOUVER
September 2010Tepal Project
TG

T l P j t PEA
Figure: 2Date: Approved:
Seismicity of Tepal Site VANCOUVER
Filename: Figure 2_Seismicity_20100929.pptx
Job No: 2CG020.000
September 2010Tepal Project
Tepal Project PEA
TG


C it d S f A El ti d C tH i ht
0 5 10 15 20 25 30 35
5,000,00050,000,000
Crest Height (m)
Capacity and Surface Area vs. Elevation and Crest Height for Site A (Preferred Site)
4,000,000
4,500,000
40,000,000
45,000,000Capacity (m3)
Surface Area (m2)
2,500,000
3,000,000
3,500,000
25,000,000
30,000,000
35,000,000 Surface Area (m
2)
acity (m
3 )
1,500,000
2,000,000
15,000,000
20,000,000
Capa
0
500,000
1,000,000
0
5,000,000
10,000,000
400 405 410 415 420 425 430 435400 405 410 415 420 425 430 435
Elevation (m asl)
Tepal Project PEA
Filename: Figure 1_4_Location_Curve_20100929.pptx
Job No: 2CG020.000Figure: 5Date: Approved:
Preferred Site (Site A) Stage-Capacity Curve
VANCOUVER
September 2010Tepal Project
TG