tenth conference on health survey research methods
TRANSCRIPT

Suggested
Methods. H
Heal
citation: Natio
Hyattsville, MD
TenthSu
onal Center for
D: National Cen
nthCorvey
r Health Statist
nter for Health
onfereResea
tics. (In press).
h Statistics.
enceoarchM
Tenth Confere
onMetho
ence on Health
ods
h Survey Researrch

Contents
Introduction 1
KEYNOTE: A Brief History of the Nine Conferences on Health Survey Research Methods 3
FLOYD J. FOWLER, JR.
SUMMARY OF WELCOME AND KEYNOTE SESSION 7
SESSION 1: Advances in Measuring Health Status and Health Behaviors 9
Advances in Survey Assessment of Disability in Older Adults: Measuring Physical and
Cognitive Capacity in the National Health and Aging Trends Study 11
JUDITH D. KASPER, BRAD EDWARDS, VICKI A. FREEDMAN, CHRISTOPHER L. SEPLAKI, CARLOS
WEISS, MICHELLE CARLSON, TAMARA BRUCE, JACK M. GURALNIK, BRENDA L. PLASSMAN, ROBERT
WALLACE, MARLENE NIEFELD, AND VIJAY VARMA
The Development and Evaluation of Disability Measures Using a Mixed‐Method
Approach 25
AARON MAITLAND, KRISTEN MILLER, MITCHELL LOEB, AND JENNIFER MADANS
Estimating Mental Illness in an Ongoing National Survey 35
JOE GFROERER, SARRA HEDDEN, PEGGY BARKER, JONAKI BOSE, AND JEREMY ALDWORTH
Planned Missing Data Designs in Health Surveys 43
DAVID R. JOHNSON, VERONICA ROTH, AND REBEKAH YOUNG
Advancing the Measurement of Health Status and Health Behaviors through Modern
Test Theory 53
ADAM CARLE
SESSION 1 DISCUSSION 65
GRAHAM KALTON
SESSION 1 SUMMARY 71
KAREN CYBULSKI, ANNE CIEMNECKI, AND KAREN BOGEN
SESSION 2: Monitoring Health Care Reform 75
Monitoring Health Care Reform: Self‐Reports of Health Insurance Premium Assistance
& Program in Social Surveys 77
DIANNE RUCINSKI
Improving the American Community Survey for Studying Health Insurance Reform 87
VICTORIA LYNCH AND GENEVIEVE M. KENNEY
Comparison of Estimates of Emergency Department Visits from the Medical Expenditure
Panel Survey and National Hospital Ambulatory Medical Care Survey 95
JEFFREY A. RHOADES, JOEL W. COHEN, STEVEN R. MACHLIN, AND MARC I. ROEMER
Assessing the Accuracy of Prescription Drug Purchase Data for Medicare Beneficiaries in
the Medical Expenditure Panel Survey 101
MARC W. ZODET, STEVEN C. HILL, AND SAMUEL H. ZUVEKAS
The RWJF Health Care Public Perceptions Index: Index Development, Results, and
Support for Reform 111
PETER GRAVEN
SESSION 2 DISCUSSION 117
JOEL W. COHEN
SESSION 2 SUMMARY 123
KAREN BOGEN AND PATRICIA GALLAGHER
SESSION 3: Optimizing Health Survey Strategies 125
The Use of Online Panels to Characterize the Management of Rare Diseases: The Case of
Primary Immune Deficiency Diseases 127
JOHN M. BOYLE
Design of Health Surveys for Public Health Emergencies: Early Responder Bias in the
National 2009 H1N1 Flu Survey 137
JAMES A. SINGLETON, TAMMY SANTIBANEZ, NICHOLAS DAVIS, KENNON R. COPELAND, N.
GANESH, KIRK M. WOLTER, AND CAROLYN DREWS‐BOTSCH
Does Using Multiple Modes Increase Sample Representativeness? 147
JEANETTE ZIEGENFUSS AND TIMOTHY BEEBE
Designed Missingness to Better Estimate Efficacy of Behavioral Studies 149
OFER HAREL, JEFFREY STRATTON, AND ROBERT ASELTINE
Correction for Survey Nonresponse and Measurement Error 155
ANDY PEYTCHEV
SESSION 3 DISCUSSION 167
CHARLES DISOGRA
SESSION 3 SUMMARY 175
MIKE BATTAGLIA AND MARTIN BARRON
SESSION 4: Building the Health Data Sets of Tomorrow 181
Population Health Research with Health Plan Data Linkage: Building from the HMO
Research Network Experience 183
MICHAEL VON KORFF
The Use of Cognitive Interviewing to Evaluate Data Quality in Administrative Records 189
STEPHANIE WILLSON
Issues in Designing and Fielding High‐Quality Surveys of Physicians and Medical
Group Practices 195
CARRIE KLABUNDE, CAROLINE MCLEOD, AND GORDON WILLIS

Collection of Biomarkers and Linkage of Administrative Data in the Survey of Health,
Ageing and Retirement in Europe 199
BARBARA SCHAAN AND JULIE KORBMACHER
The National Health Interview Survey Redesign and Other Upcoming Changes 207
JANE F. GENTLEMAN
SESSION 4 DISCUSSION 213
LINDA DIMITROPOULOS
SESSION 4 SUMMARY 217
ANGELA JASZCZAK AND NANCY WALCZAK
SESSION 5: Potential for Innovations with New Technology and Communication Tools 221
The Social Media Opportunity in Health Research 223
REG BAKER, THEO DOWNES‐LE GUIN, AND ERICA RUYLE
Social Media, New Technologies, and the Future of Health Survey Research 231
JOE MURPHY, ELIZABETH DEAN, CRAIG A. HILL, AND ASHLEY RICHARDS
The Feasibility of Using Handheld Computers to Conduct the Global Adult Tobacco
Survey 243
JEREMY MORTON, KRISHNA M. PALIPUDI, AND SAMIRA ASMA
“I Don’t Smoke but My Avatar Does!” Understanding the Unique Opportunities and
Challenges When Collecting Health‐Related Data in Virtual Environments 251
KELLY N. FOSTER
HINTS‐GEM: Using Science 2.0 to Construct a National Health Survey through
Community Engagement 259
RICHARD P. MOSER, ELLEN BURKE BECKJORD, LILA J. FINNEY RUTTEN, KELLY BLAKE, AND
BRADFORD W. HESSE
SESSION 5 DISCUSSION: Why Aren’t Survey Researchers Better at Leveraging New
Technologies? 269
MICHAEL W. LINK
SESSION 5 SUMMARY 277
VICKI PINEAU AND COURTNEY KENNEDY
PARTICIPANT LIST 281


Proceedings of the 10th Conference on Health Survey Research Methods 1
Introduction
We are pleased to present this volume of papers and discussion from the 10th Conference on Health
Survey Research Methods, which was held in Peachtree City, Georgia from April 8‐11, 2011. It has now been
36 years since the first such meeting was held in 1975. While the specific methods and research questions
have evolved considerably over this period, the importance of these meetings for summarizing current
knowledge and identifying future research priorities remains.
This conference almost did not happen. Spending authorization for the federal government was due to
expire at midnight on the first evening of conference, and it was unclear that Congressional leaders would
approve a new budget. The participation of federal employees, who represented a quarter of those planning
to attend the conference and a third of the papers to be presented, was thus placed in jeopardy. Conference
organizers reviewed options, including canceling or postponing the conference, in the final days before the
meeting was to take place. Acting in an uncertain environment, we elected to proceed with the original
conference plan that had been developed by the Steering Committee over the previous two years and hope
for the best. As the Conference’s opening keynote addresses were given, negotiations continued in
Washington. Our only certainty was that one of two things would happen the next morning: either some
conference participants who represented federal agencies would be required to leave the conference (due to
a shutdown of the federal government), or some, who had delayed their departures due to uncertainty,
would arrive. At 12:40 A.M., 40 minutes after the expiration of federal spending authority, Congress agreed
to a Continuing Appropriations Act (H.R. 1363), and a shutdown was averted.
The conference proceeded on schedule, with five sessions and 27 formal presentations over the ensuing
two‐and‐a‐half days. All papers originally scheduled for delivery at the conference were presented, in some
cases by surrogates stepping in for federal employees who were unable to make travel arrangements
subsequent to the budget agreement. The sessions on the first full day of the conference focused on specific
health survey content domains and measurement issues. The second day targeted specific methods and data
sources, including online panels and administrative records. The final session took the conference
participants further beyond traditional data collection methods to personal digital assistants, social media,
and virtual worlds. “Fitness for purpose” was a recurring theme of this conference, as participants identified
the pros and cons of alternatives to conventional methods and sources and types of data. Another recurring
theme was the potential for innovative statisticians to find ways to reduce survey error through
measurement models, imputation, and weighting, albeit with increased demands on the skills of data
analysts.
The conference included three keynote speeches. The opening address by Jack Fowler provided a broad
historical overview of this conference series by someone who has attended all but one of them. The next
address by Ed Sondik, director of the National Center for Health Statistics, highlighted the ongoing needs
for quality health survey data to address public health priorities and inform health reform policy, yet he also
emphasized that budget concerns lead to significant uncertainty at federal health agencies (see “shutdown,
government”) and the need to leverage investments in existing data systems. Norman Bradburn closed the
conference with an integrative summary of the topics covered by the various paper presentations, and he
used them to help frame a future research agenda. We were grateful and honored that each agreed to speak
at this conference.
It is with great pleasure that we acknowledge the generous support of a variety of public and private
organizations who contributed financially to this conference. These include Abt Associates, the Agency for

2
Healthcare Research and Quality (AHRQ), the Battelle Centers for Public Health Research and Evaluation,
ICF/Macro International, the Lewin Group, Mathematica Policy Research, Inc., the Mayo Clinic, the
National Center for Health Statistics, the National Cancer Institute, NORC at the University of Chicago, the
Rand Corporation, RTI International, the Substance Abuse and Mental Health Services Administration,
SSRS/Social Sciences Research Solutions, the University of Michigan Institute for Social Research, and
Westat. Without their support, the conference would not have happened.
We are also grateful to have had the opportunity to work with an unusually strong and supportive
Steering Committee of individuals who insured that the diverse perspectives of federal and non‐federal
research organizations were represented throughout the planning and organizing process. Their knowledge
and counsel proved invaluable and vital to the success of the conference, as did their leadership in
organizing the various conference sessions and their collective willingness to step forward to help address
the various logistical challenges that the potential government shutdown presented to us immediately
before the start of the conference. Members of this committee included Timothy Beebe, Jeanine Christian,
Anne Ciemnecki, Michal Davern, David Dutwin, Brad Edwards, Trena Ezzati‐Rice, Joe Gfroerer, Richard
Kulka, Jim Lepkowski, John Loft, Judie Mopsik, Ed Spar, and Gordon Willis.
A great debt of gratitude is also due to Diane O’Rourke, Conference Organizer for this as well as the
previous four conferences in this series. Her professionalism, organizational skills, careful planning, and
ability to “herd cats” insured a successful and productive meeting. Thank you, Diane. We are also very
appreciative of the excellent support provided by Lisa Kelly‐Wilson, who has now assisted Diane in
successfully coordinating two Health Survey Research Methods conferences and has taken on responsibility
for editing the proceedings of the last three conferences. We also must acknowledge Nancy Lockmiller, who
handled all of the details that none of us think about but desperately need to have addressed in a competent
manner. A special thanks also to Ed Spar at COPAS, who came to our rescue by providing us with a stable
and transparent mechanism for collecting and holding financial contributions to this conference, which
came from 15 organizations. As in the past, the federal health agencies (most notably, the Agency for
Healthcare Research and Quality, the National Cancer Institute, and the National Center for Health
Statistics) were steadfast supporters.
The remainder of this volume chronicles the rich papers and provocative discussions that took place
during the course of this meeting. We note that the Introduction to the proceedings from the First
Conference on Health Survey Research Methods in 1975 concluded that “this report is tentatively planned
as Volume 1 of a series of such conference proceedings on advances in health survey research methods.” We
respectfully submit Volume 10.
Stephen J. Blumberg Timothy P. Johnson
National Center for Health Statistics Survey Research Laboratory
Centers for Disease Control and Prevention University of Illinois at Chicago

Proceedings of the 10th Conference on Health Survey Research Methods 3
KEYNOTE: A Brief History of the Nine Conferences on Health Survey Research Methods
Floyd J. Fowler, Jr. (University of Massachusetts‐Boston)
Airlie House (now known as the Airlie Center) is located in a rural setting about 50 miles south of
Washington, DC. In 2011, it is a state‐of‐the‐art conference center, at least as far as I could tell from its Web
site. However, my memory is that the rooms were pretty spartan in 1975: all participants shared a room
with two twin beds, and the rooms lacked televisions and telephones so attendees could focus on the subject
of their conference.
In early May 1975, the Washington Bullets were in the NBA playoffs. The Bullets ended up losing in the
finals to San Francisco, but they were winning at the time of the conference. In the evening hours, following
the fortunes of the Bullets on the television in the pub was a distraction for some of those from DC.
However, for the most part, the first conference on health survey research methods was a total immersion in
methodological issues for the better part of three days.
Then, as now, the two federal agencies most concerned with using surveys to collect health‐related data
were the National Center for Health Statistics and the National Center for Health Services Research (since
transformed into the Agency for Healthcare Research and Quality). The two agencies jointly sponsored and
funded the conference.
The central idea of the conference was to bring together a range of people from different disciplines who
were active in survey methods research to share ideas about survey methods. Then, as now, research about
survey methods was presented at a variety of meetings and published in a wide range of journals. One
result of the conference was to create a document that summarized the state of current knowledge and an
agenda for needed research about how to collect survey data.
Fifty‐five people attended that first conference. The conference consisted of four half‐day sessions. There
were no formal papers presented. Rather, the session leaders laid out a summary of some of the things that
they thought had been established and a set of issues, which became the agenda for a group discussion. At
the end of each session, an effort was made to summarize what was known, what questions remained, and
what priorities should be for further research.
For each session, there was a rapporteur—a person responsible for recording the elements of the
discussion. At the end of the conference, the session chair and rapporteur were responsible for writing up a
summary of the session, including the discussion, for inclusion in the conference report before they left the
conference.
I believe that Norman Bradburn and I are the only people who attended the Airlie House conference
who also are attending the 10th conference in 2011. LuAnn Aday and Don Dillman, who were also at Airlie
House, were invited but unable to attend this conference.
The second conference was held in Williamsburg, Virginia, in 1978. It was larger, going up from fewer
than 60 to over 80 attendees. Another change for this conference was that each session was introduced by a
formal “commissioned” paper summarizing a set of issues to be addressed, and there was a formal
discussion paper for each “problem” paper, but the emphasis was still on the floor discussion to generate a
summary of the state of knowledge. The idea of having rapporteurs to capture the key elements and
conclusions in the proceedings was retained.

4
The third conference was moved to Reston, Virginia, closer to Washington to save travel money for
government attendees. The third conference also further amended the initial structure by having multiple
papers presented at each session, along with one or two formal discussion papers per session. One of the
most obvious effects of these changes in the program is that the published conference proceedings grew
from about 60 pages the first year and 90 pages for the second conference to about 300 pages for the third.
The proceedings have not come in at fewer than 200 pages since the second conference. The format change
initiated in the third conference of having several formal papers and discussion papers for each session has
been maintained ever since.
One other historical item of note: The first three conferences all had the same six nongovernmental
members of the planning committee. However, shortly before the third conference, two tragedies occurred
when Leo Reeder died in an airplane crash and Elijah White, who had been the NCHS representative on the
second and third planning committees, was killed in an auto accident. Thus, after the third conference, the
planning committee began to expand and evolve.
The fourth conference, in 1982, near the beginning of the first Reagan administration, was held in a time
of fiscal austerity. For the first time, outside help, in the form of a grant from the Milbank Fund, was needed
to supplement funds available from NCHS and NCHSR. The location was right outside Washington, DC.
Attendees stayed in a 4‐H Club Conference Facility. Austerity also was reflected in the fact that those who
lived in the DC area were encouraged to eat and sleep at home, rather than stay at the conference facility.
Proximity to DC also made it hard for some attendees to stay away from their offices for two and a half
days. Altogether, the fourth conference was probably the least conducive to focused attention on
methodology.
The longest gap in the series was between conferences four and five. However, the conference was
renewed in 1989. This time the conference planners addressed the temptations of those in DC to head off to
work in a big way: the conference was held high in the Rocky Mountains, a good long ride from the Denver
airport. The format was now set, with most sessions consisting of several research papers and one or two
formal discussants but still plenty of emphasis on the floor discussion.
The sixth conference also was held in the Rocky Mountains. The main innovation associated with
conference six was that the number of federal sponsors began to grow. While NCHS and, by then, AHCPR,
were still core sponsors, for the first time they were joined by several other federal agencies. A trend since
the sixth conference has been a growing list of federal agencies that have participated in supporting the
conference and that participate in planning the conference themes.
Conference six was also notable as the kickoff of the Diane O’Rourke era. Every conference has had a
conference chair, and for the first six conferences, the chair’s institution received the grants that funded the
conference and administered the expenses connected with the conference. Typically, someone who worked
with the chair was responsible for managing the conference logistics: everything from coordinating
communication with the participants to making arrangements for hotels, for travel, and for managing the
conference funds. Diane played that role in 1993, when the University of Illinois was the “host”
organization. However, Diane had such an aptitude for, and interest in, managing the conference details
that she was retained in the role of conference coordinator for the seventh conference, the eighth, the ninth,
and now the tenth. Her place in the history of these conferences is now firmly established.

Proceedings of the 10th Conference on Health Survey Research Methods 5
I’d like to return to the visionaries who started this conference some 36 years ago:
The Center Directors: Dorothy Rice of NCHS and Gerald Rosenthal of NCHSR.
The NCHS staff members who were on the original planning committees: Robert Fuchsberg and
Elijah White from NCHS; and Sherman Williams, Bill Kitching, Bill Lohr, and Joseph de la Puenta
from NCHSR.
The original rapporteurs, who inspired all the rapporteurs who followed in their footsteps: Ron
Anderson, Jack Fowler, Monroe Sirken, and Kirk Wolter.
And the original nongovernmental members of the first three conference planning committees: Leo
Reeder, Charles Cannell, Bernard Greenberg, Dan Horvitz, and Seymour Sudman.
These people created a conference that is different from all others. A few things have changed:
1. There are now formal papers rather than just a discussion leader with an outline of issues.
2. The founders envisioned a biennial conference, but the average has been about every 3.5 years.
3. There are more sponsors.
4. The conference is bigger, largely reflecting representation from a larger group of sponsors.
But look at all the features that have endured:
1. The conference is by invitation only.
2. All invitees have their expenses covered.
3. The conference is entirely in plenary session.
4. All attendees are expected to stay for the entire conference because they are attending not just to
listen but to contribute to the discussions.
5. Each session has a focus; the topics are integrated, not just a set of papers.
6. There are invited discussants for each session to help highlight the key theme and issues.
7. Floor discussion is an important part of the conference, and there are invited rapporteurs whose job
it is specifically to capture the discussion.
8. Chairs and rapporteurs have to stay after the conference to complete a draft of their summary of the
discussion and the key takeaway points from each session.
9. The proceedings are published, and they include the chair’s summary of the key methodological
conclusions and needs for research that emerged from the conference.
10. While a number of federal agencies contribute to the sponsorship of the conference, and their
support is critical, the National Center for Health Statistics and the Agency for Health Research and
Quality, the grandchild of the National Center for Health Services Research, are still core sponsors.

6
The fact that the key features of a conference that the founders envisioned 36 years ago are still largely
intact is a great tribute to their vision. But we should not focus solely on the structural features of the
conference.
The most important function of this conference is to remind those who collect and disseminate health
data that methods matter. In all times and places, there will be new challenges to old methods of doing
surveys. There will be pressures to collect more data with less money, sometimes in ways likely to
compromise the quality of those data. The federal government, directly and through grants and contracts to
others, collects a tremendous amount of survey data, seemingly more each year. This conference brings
together those who think the most about survey error and provides an environment in which they can talk
together for almost three days about what they know and how methodology affects the confidence we can
have in our data. This conference provides a periodic reminder to those who collect and use survey data that
we must continuously take stock and review our methods to make sure they are as good as they can be. This
conference provides a research agenda to encourage investing some of the money devoted to collecting new
data in studies of our methods. This conference is a time to remember that collecting a lot of data is not the
point; the point is to collect good quality data that accurately informs us about issues that matter. And that
is what these Heath Survey Research Methods Conferences are all about.

Proceedings of the 10th Conference on Health Survey Research Methods 7
SUMMARY OF WELCOME AND KEYNOTE SESSION Gordon Willis (National Cancer Institute) and Brad Edwards (Westat)
Jack Fowler provided a recap of the nine previous Health Survey Research Methods (HSRM)
conferences stretching back to 1975, and Edward J. Sondik spoke of anticipated future data needs. Chair
Stephen Blumberg opened the floor for discussion. The discussion focused on one major theme: the
importance of social network data.
What can we as researchers do to make data collection on social networks more productive for
policymakers? The federal government has not made a commitment to using social network data despite its
potential. Two related examples are wellness and obesity prevention. We can easily collect data on what an
individual physician does to counsel patients on wellness behaviors, but we rarely know what influences
that physician. What meeting is he or she attending? To what other practitioners is he or she talking? What
are other physicians in his or her practice doing about wellness?
While we all agreed that we are influenced by our social inputs, we also admitted a lack of knowledge
about the social influences we should study. Ed Sondik mentioned that there are papers from the
Framingham studies but not much beyond that. The National Institute on Aging’s longitudinal National
Social Life, Health, and Aging Project and the National Health and Aging Trends Study are addressing
social networks, but there is little or no focus on social network research across the federal statistical
agencies.
The behavioral data we could collect are not complex. While we do know it would cost more money (as
any additional data collection would), we do not know precisely what is influential and how we would use
the data. We need to learn more about the value of social networks and associated data for decision making.
Jack Fowler challenged the group to talk to respondents and proxies about what influences their lives.
Ed Sondik agreed, using the county he lives in as an example, and avowed that having these data would
lead to better decision making at the state and county levels. Such data collection requires partnering with
respondents and data users in communities.
The private sector already is mining massive private databases to study social networks. A famous
example is telephone record detail files. By examining who is calling whom, one can see what influential
nodes exist in a city. Then, the approach is to influence the influencers. It is a way to leverage information
dissemination. This is not part of the standard survey model and carries large privacy issues. But the data
are there and are already being used by the private sector.
Most of these data are collected passively. Most of the time, we (as respondents) are unaware that any
data are being collected about our behaviors. Consent to this data collection is not well informed, and often
the data are shared with others without our consent. While these data are prolific, the quality metrics are
different from those typically used in health survey research methods, and health survey researchers are
uninformed about them.
Ed Sondik and others noted that other data already exist that could also inform social network studies,
but these data are largely untapped for this purpose. Numerous NCHS longitudinal studies collect
household rosters. These data on population dynamics are quite valuable and worth pursuing, but there are
barriers to use. Because of the large amount of resources needed for data collection, resources for analysis of
the data are limited. Second, much of this information is not accessible to those outside the agency. Dr.
Sondik emphasized the need for intramural budget allocations across the federal statistical agencies to work

8
with social network data. He hopes this idea will move forward with support from Bob Groves at the
Bureau of the Census. Perhaps it could begin with National Institutes of Health staff.
This dynamic discussion addressed a unique need for future data exploration and set the stage for the
five sessions that followed.
A research agenda on social networks and networking and their potential role in survey research could
be drafted from this discussion, to be refined and explored before the 11th HSRM conference three or four
years from now. Here are some questions to begin the work:
1. How can data collection on social networks be made more productive for HSRM and policymakers?
2. What mechanisms and approaches in the public sector might accelerate health survey researchers’
use of social network data?
3. How do social networks work today?
4. What patterns of communication nodes and information exchange occur among network members
across various health‐research topics (for example, health care use, prevention, specific diseases)?
5. What can we learn quickly from the private sector about social networks?
6. How have individuals’ lives changed as a result of participation in today’s communication
networks?
7. What can be said about trends in social networks that might be helpful in positioning health survey
research methods in the next decade?
8. How can data currently housed in the federal agencies be mined to advance health survey research
knowledge? What approaches might leverage and accelerate this mining across agencies?
9. How can we engage respondents and communities in research on social networks?

Proceedings of the 10th Conference on Health Survey Research Methods 9
SESSION 1: Advances in Measuring Health Status and Health Behaviors
ORGANIZERS: Jeanine Christian (Battelle), Anne Ciemnecki (Mathematica), and Joe Gfroerer (SAMSHA)
CHAIR: Anne Ciemnecki

10

Proceedings of the 10th Conference on Health Survey Research Methods 11
Advances in Survey Assessment of Disability in Older Adults: Measuring Physical and Cognitive Capacity in the National Health and Aging Trends Study
Judith D. Kasper (Johns Hopkins University), Brad Edwards (Westat), Vicki A. Freedman (University of Michigan), Christopher L. Seplaki (University of Rochester),
Carlos Weiss (Michigan State University), Michelle Carlson (Johns Hopkins University), Tamara Bruce (Westat), Jack M. Guralnik (Consultant), Brenda L. Plassman (Duke University),
Robert Wallace (University of Iowa), Marlene Niefeld (Johns Hopkins University), and Vijay Varma (Johns Hopkins University)
The implications of disability trends for older adults grow in significance as the population ages (IOM,
2007). In studying late‐life disability, a key resource has been the National Long‐Term Care Survey
(NLTCS). Studies based on the NLTCS represent milestones in identifying late‐life disability trends
(Manton, Corder, & Stallard, 1993, 1997; Manton, Gu, & Lamb, 2006). The National Health and Aging
Trends Study (NHATS) is a new longitudinal national survey of persons 65 and older that is a successor to
the NLTCS. Focused on functional changes in daily life, NHATS draws on recent comprehensive
frameworks for conceptualizing disability (Freedman, 2009; Jette, 2009) and is designed to support research
on disability pathways at the individual level (Fried, Bandeen‐Roche, Chaves, & Johnson, 2000; Gill,
Gahbauer, Allore, & Han, 2006), as well as investigation of the factors that are driving disability trends.
The NHATS framework treats disability as encompassing several domains—capacity to do activities,
whether and how activities are done, and accommodations made to bridge gaps between capacity and the
demands of activities. This paper will focus on one key component of the NHATS framework—measures of
capacity—and, in particular, the use of performance‐based capacity assessments that are newer to national
surveys and complex to administer. Although not the first national survey to administer such tests, NHATS
includes a broad array of both physical and cognitive capacity measures and is unique in planning to
conduct these assessments annually. We present in this paper an overview of NHATS capacity measures,
administration protocols, and results regarding administration using data from two pilot studies conducted
in spring 2010 (n = 326) and winter 2011 (n = 120).
CAPACITY MEASURES IN NHATS
Conceptual Importance of Measuring Capacity
The NHATS disability framework (Freedman, 2009) is a blend of Nagi’s widely used model (1965) and
the more recent language and perspective of the World Health Organization’s International Classification of
Functioning, Health, and Disability. We explicitly distinguish between measures of capacity—the building
blocks for activities—and what is actually done within an individual’s environment (activities). Measures of
capacity over time are key elements in understanding individual patterns of progression to activity
limitations. Accommodations of various types—devices including technology, environmental modifications,
and personal help—also may be adopted to fill the gap between capacity and doing activities that are
necessary or valued. Capacity measures are important, then, for tracking trends in function that are
independent of environmental changes or accommodations, for understanding the disablement process, and
as targets for interventions to prevent or slow disability (LIFE Study Investigators, et al., 2006).

12
Table 1. NHATS Sensory, Physical, & Cognitive Capacity Measures, by Type of Administration
Self‐Report Performance‐Based
Sensory Capacity Hearing Vision
Physical Capacity
Upper Extremity
Able to:
put book on shelf/reach overhead? open jar1/grasp small object?
Grip strength
Lower Extremity
Able to:
walk 6/3 blocks? kneel/bend over? lift & carry 20/10 lbs.? walk up 20/10 stairs?
Walking speedBalance stands
side by side semi‐tandem
full tandem
one leg, eyes open one leg, eyes closed
Other Chair stands Peak air flow
Cognitive Capacity
Memory At present time? Memory problems interfere with activities? Memory compared to 1 year ago?
Ten‐word recall
immediate
delayed
Orientation
Day of week Date (month, day, year) Naming president Naming vice president
Overall Cognitive Screening/Executive function Clock‐drawing testAttention & Interference/Executive function Stroop test (computerized)1 Revised to read “open a jar using just your hands” following the Validation Study.
Self‐Report & Performance‐Based Approaches to Assessment
Self‐report measures of physical capacity—for example, questions about reaching overhead or lifting a
ten‐pound weight (e.g., grocery bag)—often are included in population‐based surveys. In recent years,
performance‐based measures of physical capacity, including tests of balance or strength, have become more
common in study protocols for older people. Research by Guralnik and colleagues (1996) has shown these
types of physical capacity measures to be strong predictors of subsequent disability and mortality. Self‐
report measures of cognitive capacity are less common in surveys, with the exception of questions about
memory (e.g., How would you rate your memory?). Performance‐based measures of cognitive capacity (for
example, tests of working memory), drawn primarily from neuropsychology, have been adapted for
computer‐assisted personal interviewing (CAPI) administration in surveys (e.g., Health and Retirement
Survey [www.hrsonline.isr.umich.edu], Survey of Health and Ageing in Europe [www.share‐project.org]).
One appeal of performance‐based measures of capacity is that they provide a direct assessment of
function rather than one filtered through a subject or proxy’s perspective. Self‐report of physical function in
particular can require speculation—for example, someone who doesn’t carry the groceries herself is asked to
indicate how difficult it would be to lift and carry a ten‐pound grocery bag. However, administration of
performance‐based assessments is substantially more complex than self‐report, especially in the context of
home‐based data collection.

Proceedings of the 10th Conference on Health Survey Research Methods 13
NHATS Assessments
NHATS uses a mix of self‐report and performance‐based capacity measures as shown in Table 1 on the
preceding page. The selection of self‐report and performance measures of capacity for NHATS were
informed by prior studies including the Women’s Health and Aging Study (WHAS) (Guralnik, Fried,
Simonsick, Kasper, & Lafferty, 1995; Simonsick et al., 1997) and the Health and Retirement Survey, among
others. Many of the measures being used in NHATS reflect important modifications, however, while others
are new. Where possible, measures were selected to capture a broad spectrum of capacity, both high and
low functioning (Freedman et al., 2011). In selecting performance‐based measures, consideration was given
to achieving a representation of all major physiologic systems, learning from past attempts to gather and
analyze such data through review of published reports and directly contacting investigators, and the need
to consider tradeoffs between gathering more in‐depth information regarding performance on the one hand
and participant burden and feasibility in a home setting on the other.
Table 1 shows the full array of capacity measures being administered in NHATS. As shown, sensory
capacity is assessed only through self‐report. Administration of performance‐based testing of vision or
hearing still requires equipment and training that is beyond the reach of in‐home surveys conducted by lay
interviewers. Physical capacity is assessed for lower and upper extremities through self‐report (Freedman et
al., in press) and through performance‐based tests that are predictive of disability and are components of the
Short Physical Performance Battery (Guralnik et al., 1994) and of a widely used frailty construct (Bandeen‐
Roche et al., 2006; Fried et al., 2001). Peak air flow, predictive of mortality (Melzer, Lan, & Guralnik, 2003), is
included as well. Results of the physical performance assessments (completed or attempted but not
completed) and reasons assessments were not done are recorded by interviewers in the NHATS Activities
Booklet (available at www.nhats.org).
Innovations in measuring cognitive capacity in the NHATS include a clock‐drawing test and a
computerized version of the Stroop test. Other cognitive assessments included are measures of orientation
(date/day of the week; naming the president and vice president) and the immediate and delayed ten‐word
recall (memory) that are more standard in surveys.
The clock‐drawing test has been widely used in both clinical and research settings as a part of overall
cognitive screening (Shulman, 2000), but it has not been used in a national survey to date. It is a complex
nonverbal task involving planning and a range of other cognitive skills that are elements of executive
function; an added benefit is that it is less influenced by education than some other screening instruments.
The Stroop test, which was developed in the 1930s, measures inhibition, which is a component of executive
function. It traditionally is administered with letters and words printed in color on paper. When given in
this fashion, the test can be frustrating; subjects often lose their place on the page and have a sense of failure
upon finishing. NHATS employs a computerized version of the Stroop test developed by Carlson (Stroop
Cognitive Frailty Instrument, CFI) and used in two prior intervention trials (Carlson et al., n.d.). The
application mimics a game and takes a maximum of six minutes. The respondent holds a color‐coded key
pad that is wirelessly connected to the interviewer’s laptop computer to press one of three colors that
corresponds to the color of letters or words shown on the computer screen. The Stroop CFI offers a number
of practical and methodological advantages in that it provides standardized administration, automated data
storage, and greater precision in measurement of participant response (to milliseconds), thus reducing the
number of trials needed to assess cognitive ability. For NHATS, we measure the participant’s ability to
maintain a high level of performance on attention under two conditions—nondemanding or “easy” (e.g.,
naming the color of strings of Xs) vs. demanding or “difficult” (e.g., color words shown in a conflicting
color—”red” shown in the color blue).
14
NHATS APPROACH TO ADMINISTERING PERFORMANCE‐BASED CAPACITY ASSESSMENTS
Implementation of performance measures of capacity, both physical and cognitive, in a large national
survey of several thousand people is challenging on several fronts. These assessments were developed in
clinical or laboratory settings for the most part. Adaptation for in‐home data collection as part of a national
survey conducted by lay interviewers requires attention to several issues: interviewer training,
standardizing administration, safety of respondents, and respondent reactions.
Interviewer Training
Conducting physical performance tests requires interviewers to use a variety of equipment including
stopwatches, hand dynamometers, and peak air flow meters. In addition, for activities like chair stands and
walking speed, interviewers need to navigate unfamiliar environments to identify an appropriate chair and
space for the activities, as well as kneel on the floor to set up the walking course. These activities represent
departures from the usual question‐and‐answer interviewing task and result in a broader and more complex
scope of demands on NHATS interviewers. Although several of the cognitive assessments are CAPI‐based
questions, the clock‐drawing test involves a special form and erasable pen; for some assessments, the laptop
screen needs to be hidden from the respondent, but for the Stroop test, the respondent has to watch the
screen. Instructions to respondents for some of these tests can be uncomfortable for interviewers—for
example, telling respondents not to look at a calendar or watch when answering “What is today’s date?” or
that words cannot be written down as aids during the memory assessment.
NHATS uses a video showing administration of the physical performance assessments in the
interviewer recruitment process so candidate interviewers understand the range of tasks. Interviewer
training for the physical performance tests makes use of practice but also includes a formal certification
process to insure that all components of the protocol, including maintaining safety and following test
administration standards, are followed.
Standardizing Administration
Standardizing test administration in terms of equipment and environment is relatively easy in smaller
scale studies where subjects come to central locations for testing—for example, all can be tested on the same
walking course. The NHANES provides a standardized environment and clinical evaluators in a national
survey but at significant cost in terms of data collection time and resources. Studies like the Established
Populations for Epidemiologic Studies of the Elderly (Guralnik et al., 1994) and the WHAS (Guralnik et al.,
1995) represent pioneering efforts to administer physical performance‐based assessments in home
environments using lay interviewers. Such measures have become more common in surveys—the Health and
Retirement Survey implemented physical performance tests in 2004 that are repeated on a four‐year cycle.
Standardizing use of equipment and administration protocols for NHATS involves (1) explicit directions
to interviewers in the NHATS Activities Booklet for both describing and demonstrating each activity to the
respondent, (2) gaining proficiency through practice in use of the equipment, (3) formal certification of
administration techniques at training for the first wave of data collection, and (4) a Web‐based recertification
midway through the data collection period to guard against administrator “drift” away from standard
protocol. Standardizing the walking course and the chair stands are especially challenging. Setting up the
walking course requires a space in or near (e.g., the hall of an assisted living facility) the home that is 16 feet
long and three feet wide; walking speed is timed over three meters of this distance with about one meter of
Proceedings of the 10th Conference on Health Survey Research Methods 15
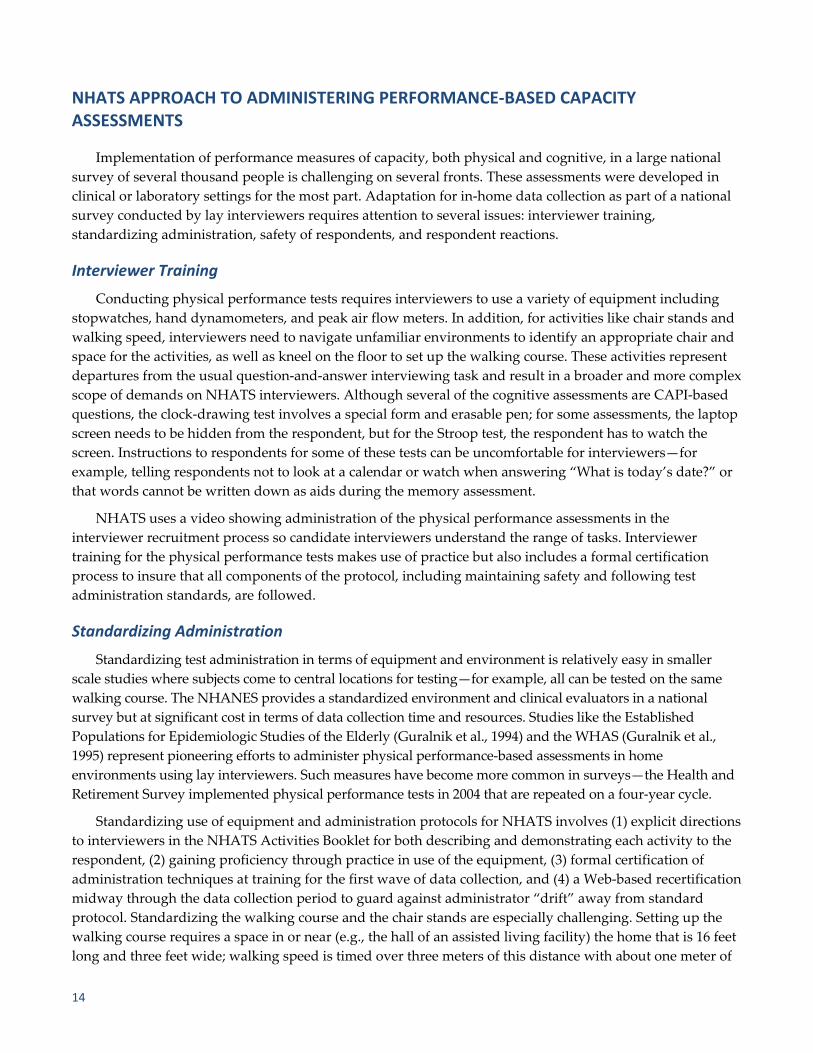
additional space needed at each end, before the start and after the finish. The space has to be cleared of
furniture and cannot be an irregular surface or cross the edge of a rug. The chair stand requires that
interviewers identify a chair with a hard back and no arms that can be positioned against a wall. The height
between the seat edge and floor is measured and recorded.
Table 2. Exclusions for Attempting Sensory, Physical, & Cognitive Capacity Assessments
ASSESSMENT Questions to Identify Persons Excluded from Attempting Assessments1
Sensory Capacity None
Physical Capacity
Grip Strength In last 3 months, surgery or serious injury to both sides (left and right) for hands or wrists?In last 3 months, surgery or serious injury to both sides (left and right) for arms or shoulders?Current flare‐up of pain to both sides (left and right) for hands or wrists?
Chair Stands In last 3 months, surgery or serious injury to both hips, including hip replacement surgery?If person always uses mobility device to get out of bed or always has help to get out of bed ask: Able to get up out of chair by yourself and without mobility devices (if used)?
Balance Stands If person always uses mobility device to get out of bed or always has help to get out of bed ask: Able to stand without holding onto someone or something?
Walking Exclude if earlier questions indicate sample person used wheel chair or scooter every time to get around home or building Able to walk a short distance in room by him/herself (using mobility device if needed)?
Peak Air Flow None
Cognitive Capacity None 1Administered as questions in the CAPI instrument.
Reasons for Not Conducting Tests
An important consideration in interpreting the results of these tests has to do with which individuals do
not perform them and why. Understanding the difference among persons excluded from attempting the
tests, those who do not do the tests because of concerns about safety, and those who do not do the tests for
other nonhealth reasons (e.g., insufficient room to conduct the walking test or refusal) is critical to analysts.
Protocols for making these distinctions are not well established. Considerable attention to distinguishing
among reasons for missing physical performance data has been undertaken for NHATS.
Exclusions. A series of questions has been developed for use in determining who should not be asked to
attempt specific performance assessments. These are based on clinical expertise and are included in the
CAPI instrument. As shown in Table 2, exclusions are tailored to activities and include recent surgery, pain,
and inability to stand or walk a short distance. On grip strength, for example, if a respondent is right‐
handed and has had surgery on that hand in the last three months, the test would be performed with the left
hand. Only in the case of surgery or a current flare‐up of pain in both hands would someone be excluded
from attempting the test. There are no exclusions for peak air flow nor for administering the sensory
capacity questions or the cognitive assessments.
Even when a proxy interview is conducted, we ask the exclusion questions and give sample persons the
opportunity to attempt the physical performance assessments. Similarly, for cognitive assessments, in the case
of proxy interviews, we ask the proxy whether the sample person could try to answer some questions about
memory. If the answer is “yes,” we attempt to administer the cognitive assessments to the sample person.
Safety concerns. After the interviewer demonstrates each physical performance activity, she asks the
respondent, “Do you think it would be safe to try this?” If the respondent or a proxy who is involved in the

16
interview indicates feeling unsafe, this can be selected from the precoded reasons for not attempting a test,
and the interviewer moves on to the next test. In addition, the interviewer may feel the test cannot be done
safely and can indicate that the test was not done because the interviewer felt unsafe for the sample person
or the sample person was unsteady with support.
Other reasons test was not conducted. Precoded reasons for not attempting a test are standardized
across assessments with minor exceptions. The walking course and chair stands include response categories
that allow interviewers to indicate “no appropriate space/no appropriate chair” as reasons these
assessments were not attempted. Another precoded reason for not attempting a test included for all
assessments is that the respondent is “unable to understand directions” after the interviewer has explained
and demonstrated the activity. Finally, an “other—specify” option is provided so interviewers can indicate
circumstances other than those covered in the precoded reasons for not attempting an assessment.
Respondent Reactions
We avoid the words “test” and “performance” as much as possible in connection with performance‐
based assessments; for example, the booklet interviewers use to record results is labeled the NHATS
Activities Booklet. In introducing the physical performance assessments, respondents are told they will be
asked “to perform a few simple movements, that is, to move your body in different ways.” The cognitive
assessments are introduced with the statement “The next few questions are about people’s memory and
ability to think about things.” Nonetheless, in connection with these types of activities—remembering a list
of words, performing timed repeated rapid chair stands—respondents sometimes ask about how their
performance ranks with others. For the Stroop test, a fireworks display at the end of the test is intended as
positive feedback for completing the test. Our experience from the NHATS Validation Study and pretest is
that interviewers are likely to be asked by respondents how their performance measures up for both
physical and cognitive capacity assessments, and they need training on how to respond to these requests.
DATA ON ADMINISTRATION: EXPERIENCE WITH PHYSICAL PERFORMANCE‐BASED ASSESSMENTS & THE COMPUTERIZED STROOP TEST
Tables 3 through 5 provide data regarding who did and did not attempt the physical performance‐based
activities. Data combine a sample chosen for the NHATS Validation Study (n = 326) selected purposefully to
include persons in residential care facilities and persons receiving help with self‐care activities and from a
pretest (n = 120) that employed a sample design that will be used for the national baseline (e.g., age‐
stratified). Characteristics of this total sample (n = 446) were 38% age 80 or older, 79% in excellent/very
good/good self‐rated health, 83% with excellent/very good/good self‐reported memory, and 13% in
residential care (other than nursing homes).
Overall, a high percentage did the physical performance activities: 93% for the easiest balance test (side‐
by‐side), 89% for walking speed, 86% for single chair stands, 89% for grip strength, and 97% for peak air
flow (Table 3). The proportions excluded from attempting a test were below 5% except for grip strength. For
both grip strength and peak air flow, an analysis of correlations between measures of average and highest
scores (by age and gender) based on two versus three trials were extremely high (.98) (data not shown),
leading to a decision to conduct two trials of each in the national data collection.

Proceedings of the 10th Conference on Health Survey Research Methods 17
Table 3. NHATS Physical Capacity Assessments (n = 446) ACTIVITY NOT DONE
ACTIVITY DID ACTIVITY1 Exclusions Did Not Complete Prior Activity2
Not Attempted for Safety Reasons3
Not Attempted for Other Reasons4
Balance Stands Side by side 93% 3% — 3% 1%Semi‐tandem 87% 3% 2% 6% 2%Full tandem 74% 3% 10% 11% 2%One leg, eyes open 47% 3% 30% 17% 3%One leg, eyes closed 11% 3% 65% 18% 3%
Walking Speed 1st trial 89% 3% — 1% 7%2nd trial 89% 3% — 1% 7%
Chair Stands Single 86% 4% — 6% 4%Repeated rapid 78% 4% 2% 8% 7%
Grip Strength 1st trial 89% 8% — 1% 2%2nd trial 89% 9% — 1% 2%3rd trial 89% 9% — 1% 2%
Peak Air Flow 1st trial 97% — — 2% 2%2nd trial 97% — — 2% 2%3rd trial 96% — — 2% 2%1Includes sample persons (SP) who completed the activity and sample persons who tried the activity but did not complete it. 2For example, an SP who tried a side‐by‐side balance stand but could not complete the activity was not asked to try the semi‐tandem balance stand or any of the other balance stands. 3Safety reasons include when an SP, proxy, or interviewer felt the activity would be unsafe for the SP or the SP was unsteady with support. 4Other reasons included SP did not understand the instructions, there was not enough room to attempt the walking course, no suitable chair for chair stands, and refusals. SOURCE: Data from Validation Study in spring 2010 (n = 326) and pretest in winter 2010 (n = 120).
For balance stands and chair stands, as sample persons progressed to harder activities, the percentage
performing the activity dropped, by design, since persons who were unable to complete an easier activity
(e.g., hold a side‐by‐side stand for ten seconds) were not asked to do the next harder one. The most difficult
balance stand—standing on one leg with eyes closed for 30 seconds—which is intended as a high
functioning test—was attempted by only 11%; 65% were not asked to attempt this activity based on failing
to complete easier balance tests. Similarly, while 86% did the single chair stand, the percentage doing the
more difficult repeated rapid chair stands was 78%. The tests most often not attempted for safety reasons
were the more difficult balance stands and the chair stands.
Tables 4 and 5 show physical performance activities by age, self‐reported health status, self‐reported
memory, and whether the sample person was in a residential care facility. In terms of balance stands (Table 4),
among those 80 or older, 89% attempted the side‐by‐side stand. Attempts dropped as the activity became more
difficult, but 25% attempted the “one leg, eyes open stand.” There were significant differences by age in
attempting all of the stands from the easiest—side by side (attempted by 96% of 65–79 year‐olds and 89% of
persons 80+)—to the most difficult—one leg, eyes closed (attempted by 18% of 65–79 year‐olds and 1% of
persons 80+). Persons in fair/poor self‐rated health were less likely to do all of the balance stands than those in
better health, with the exception of the easiest stand (side by side). There were differences by self‐rated
memory for only two of the five stands (full tandem and one leg, eyes closed). Persons in residential care
facilities were less likely to do all of the balance stands compared to those in community living settings.

18
The primary reasons for not doing a balance test were inability to do the prior easier test and safety
concerns of the sample person, proxy, or interviewer (these are coded separately but combined as “Safety”
in Table 4). Not surprisingly, as the tests become more difficult, fewer were eligible and safety concerns
were more often indicated. For example, among persons 80+, 59% tried holding the full tandem stand for ten
seconds. Only 25% tried the one leg stand with eyes open because 41% were unsuccessful in completing the
full tandem stand (or prior balance tests), and safety concerns were expressed for another 22%.
Percentages attempting the other physical performance tests also were high (Table 5). There were no
differences by age, self‐rated health or memory, or residence in doing the walking speed test. Significant
differences were observed for all of these characteristics for the single and repeated rapid chair stands,
however. Percentages attempting the repeated rapid chair stands were lower than for the single chair stand
(inability to do the single stand precluded attempting the repeated rapid stands). Nonetheless, over half of
persons in fair/poor self‐rated health or in a residential care facility attempted this test, which requires doing
five quick repetitions of standing and sitting with arms folded across one’s chest. For grip strength and peak
air flow, there were no significant differences in attempting these tests with the exception of self‐rated
health. Percentages attempting the grip strength test were above 85% for all groups except those in fair/poor
health and those in residential care facilities (where 83% attempted the test). Over 90% of all persons
attempted the peak air flow test.
Table 6 provides pretest data (n = 120) on the computerized Stroop CFI. Only pretest data are shown
because changes were made between the Validation Study and the pretest in administration of the practice
that precedes the test. The interviewer administered the Stroop CFI by describing the “game,” showing the
respondent how to use the handheld keypad to register answers (press red‐, blue‐, and green‐colored
buttons), and initiating a short practice that repeats instructions when individuals miss two consecutive
items. The interviewer confirms that the participant understands the instructions before starting the test.
The “easy” and “difficult” conditions (described earlier) appear in random order on the screen every two
seconds. Most study participants were willing to try the Stroop even though it was placed at the end of the
interview. In the pretest sample, only a small percentage (9%) of persons did not attempt the Stroop. These
included individuals who were blind, had severe cognitive impairment, or who refused.
Table 6 shows accuracy on the “easy” and “difficult” conditions on the Stroop CFI. Accuracy is important
in determining whether participants comprehended each condition and provided enough correct answers
beyond chance to calculate the Stroop effect (average speed of correct responses, or reaction time). The task is
feasible across a range of cognitive ability levels, and information on ability to complete the two conditions is
informative. Overall, 61% of pretest participants were able to accurately complete both the easy and difficult
conditions. About 15% were unable to complete both conditions, and another 15% were able to complete the
easy but not the difficult condition. The performance of the former group is indicative of global cognitive
impairment; the latter group may be at risk for cognitive impairment given their worse performance in
response to increased demands on attention. Ability to accurately complete both conditions varied by age and
memory (ten‐word recall). Differences by self‐rated health and education were not significant.

Proceedings of the 10th Conference on Health Survey Research Methods 19
Table 4. NHATS Balance Tests, by Age, Self‐Reported Health & Memory, & Residence in a Facility (n = 446)
AGE
SELF‐REPORTED HEALTH STATUS
SELF‐REPORTED MEMORY
FACILITY RESIDENT
65–79 80+
Excellent/ Very Good/
Good Fair/Poor
Excellent/ Very Good/
Good Fair/Poor Yes No
Total (n) 276 170 352 94 369 67 58 388
SIDE‐BY‐SIDE STANDS Did activity1 96% 89%* 94% 89% 94% 94% 79% 95%*Did not do: Exclusion2 0% 8% 2% 6% 2% 1% 9% 2%Prior test not done — — — — — — — —Safety3 3% 2% 2% 4% 2% 4% 9% 2%Other reason4 1% 1% 1% 0% 1% 0% 3% 1%
SEMI‐TANDEM STANDS Did activity1 91% 81%* 89% 78%* 89% 82% 62% 91%*Did not do: Exclusion2 0% 8% 2% 6% 2% 1% 9% 2%Prior test not done 1% 4% 2% 3% 2% 3% 7% 2%Safety3 6% 6% 4% 13% 5% 12% 16% 5%Other reason4 1% 2% 2% 0% 2% 1% 7% 1%
FULL TANDEM STANDS Did activity1 84% 59%* 79% 59%* 79% 58%* 38% 80%*Did not do: Exclusion2 0% 8% 2% 6% 2% 1% 9% 2%Prior test not done 6% 15% 8% 17% 8% 19% 24% 7%Safety3 8% 15% 9% 18% 10% 19% 22% 9%Other reason4 1% 3% 2% 0% 2% 1% 7% 1%
ONE LEG EYES OPEN STAND Did activity1 60% 25%* 51% 29%* 49% 37% 12% 52%*Did not do: Exclusion2 0% 8% 2% 6% 2% 1% 9% 2%Prior test not done 24% 41% 28% 41% 30% 34% 47% 28%Safety3 14% 22% 15% 23% 16% 25% 26% 16%Other reason4 2% 4% 3% 0% 3% 1% 7% 2%
ONE LEG EYES CLOSED STAND Did activity1 18% 1%* 13% 5%* 13% 3%* 2% 13%*Did not do: Exclusion2 0% 8% 2% 6% 2% 1% 9% 2%Prior test not done 64% 65% 65% 65% 65% 69% 57% 66%Safety3 15% 22% 16% 23% 17% 25% 26% 17%Other reason4 2% 4% 3% 0% 3% 1% 7% 2%
1Includes sample persons (SP) who completed the activity and sample persons who tried the activity but did not complete it. 2For example, an SP who tried a side‐by‐side balance stand but could not complete the activity was not asked to try the semi‐tandem balance stand or any of the other balance stands. 3Safety reasons include when an SP, proxy, or interviewer felt the activity would be unsafe for the SP or the SP was unsteady with support. 4Other reasons included SP did not understand the instructions, there was not enough room to attempt the walking course, no suitable chair for chair stands, and refusals. NOTE: Ten cases done by proxy respondent are missing on the self‐reported memory measure. *Significant difference between those who did and did not (all reasons) do activity at p < .05. SOURCE: Data from Validation Study in spring 2010 (n = 326) and pretest in winter 2010 (n = 120).

20
Table 5. NHATS Other Physical Capacity Assessments, by Age, Self‐Reported Health & Memory, & Residence in a Facility (n = 446)
AGE
SELF‐REPORTED HEALTH STATUS
SELF‐REPORTED MEMORY
FACILITY RESIDENT
65–79 80+
Excellent/ Very Good/
Good Fair/Poor
Excellent/ Very Good/
Good Fair/Poor Yes No
Total (n) 276 170 352 94 369 67 58 388
WALKING SPEED (1st Test) Did activity1 91% 86% 91% 84% 91% 90% 90% 89%Did not do: Exclusion2 1% 5% 2% 5% 2% 1% 7% 2%Prior test not done — — — — — — — —Safety3 1% 2% 1% 2% 1% 1% 2% 1%Other reason4 7% 8% 7% 9% 7% 7% 2% 8%
SINGLE CHAIR STANDS
Did activity1 91% 79%* 89% 76%* 89% 78%* 66% 89%*Did not do: Exclusion2 0% 9% 3% 7% 3% 0% 9% 3%Prior test not done — — — — — — — —Safety3 5% 6% 5% 11% 5% 13% 14% 5%Other reason4 4% 4% 3% 6% 3% 9% 12% 3%
REPEATED RAPID CHAIR STANDS Did activity1 84% 69%* 82% 66%* 82% 69%* 53% 82%*Did not do: Exclusion2 1% 9% 3% 9% 3% 0% 9% 3%Prior test not done 6% 11% 7% 12% 7% 15% 14% 7%Safety3 1% 4% 2% 3% 2% 3% 3% 2%Other reason4 7% 7% 6% 11% 6% 13% 21% 5%
GRIP STRENGTH (1st Test)
Did activity1 91% 86% 91% 83%* 91% 90% 83% 90%Did not do: Exclusion2 7% 11% 7% 14% 8% 10% 14% 7%Prior test not done — — — — — — — —Safety3 1% 1% 1% 1% 1% 0% 2% 1%Other reason4 1% 2% 1% 2% 1% 0% 2% 2%
PEAK AIR FLOW (1st Test) Did activity1 97% 96% 98% 93%* 97% 100% 97% 97%Did not do: Exclusion2 0% 0% 0% 0% 0% 0% 0% 0%Prior test not done — — — — — — — —Safety3 2% 1% 1% 4% 2% 0% 2% 2%Other reason4 1% 3% 1% 3% 1% 0% 2% 2%
1Includes sample persons (SP) who completed the activity and sample persons who tried the activity but did not complete it. 2For example, an SP who tried a side‐by‐side balance stand but could not complete the activity was not asked to try the semi‐tandem balance stand or any of the other balance stands. 3Safety reasons include when an SP, proxy, or interviewer felt the activity would be unsafe for the SP or the SP was unsteady with support. 4Other reasons included SP did not understand the instructions, there was not enough room to attempt the walking course, no suitable chair for chair stands, and refusals. *Significant difference in who did (vs. did not for all reasons) activity at p < .05. NOTE: Ten cases done by proxy respondent are missing on the self‐reported memory measure. SOURCE: Data from Validation Study in spring 2010 (n = 326) and pretest in winter 2010 (n = 120).

Proceedings of the 10th Conference on Health Survey Research Methods 21
Table 6. Levels of Ability to Perform the Easy & Difficult Components of the Stroop Cognitive Frailty Instrument (CFI) in the NHATS Pilot & Their Cognitive & Demographic Characteristics (n = 120)
VARIABLE Missing1 Unable to Complete Easy & Difficult
Unable to Complete Difficult
Able to Complete Both
Total, % (n) 9% (11) 15% (18) 15%(18) 61% (73)
Age, Mean [SD] 86.7 [9.4]** 81 [8.2]* 77.9 [7.5] 75.4 [7.6]
Self‐Rated Health
Excellent/Very good/Good 45% (5) 61% (11) 89% (16) 79% (58)
Fair/Poor 54% (6) 39% (7) 11% (2) 21% (15)
Education
1–12 years (no high school diploma) 30% (3) 28% (5) 11% (2) 19% (14)
High school graduate 30% (3) 33% (6) 28% (5) 29% (21)
Some college 30% (2) 28% (5) 39% (7) 23% (17)
College graduate, graduate degree 20% (2) 11% (2) 22% (4) 29% (21)
10‐Word Recall Immediate, Mean [SD] 1.5 [1.7]** 3.1 [1.7]** 4.4 [1.3] 5.0 [1.9]
10‐Word Recall Delayed, Mean [SD] 0.8 [1.4]** 1.5 [1.5]** 2.6 [1.8]* 3.8 [2.0]1Reasons include blindness, refusal, severe cognitive impairment. * p < .05, ** p < .001; all p‐values calculated using “Able to Complete Both” as the reference category; ANOVA tests used for continuous variables, Pearson’s chi‐square test for discrete variables. NOTE: Missing data: one case education. SOURCE: Data from pretest in winter 2010.
CONCLUSION
Capacity measures based on performance assessments of physical and cognitive function play a distinct
role in the conceptual framework of disability that has guided development of NHATS and will make it
possible to better understand individual trajectories and the role of accommodations and the environment in
doing activities when capacity declines. In addition, prior studies have confirmed the empirical value of
performance‐based physical and cognitive assessments in predicting health outcomes.
The measures selected for NHATS represent those that tap into major areas of physical (lower and
upper extremity) and cognitive (memory, orientation) capacity, can be used to create constructs such as the
Short Physical Performance Battery that have gained widespread use in the scientific literature, and provide
opportunities for harmonization with other large population‐based surveys of older people. NHATS also
has included tests that allow identification of high‐functioning people and can be used to observe small
changes over time in these individuals. Persons who attempted the one‐leg balance stands and those who
met accuracy thresholds for the Stroop test were in this high‐functioning segment of the older population.
Membership in this group was associated with better self‐reported health and memory (and for the Stroop
test, higher performance on two memory tests).
Performance‐based assessments of physical and cognitive capacity are increasingly common in
population‐based surveys, and NHATS represents an important step forward in this evolution. Drawing on
earlier studies of older people, the NHATS protocol is aimed at standardizing administration of these tests
by lay interviewers in home environments for annual administration in a longitudinal study. A particular
focus has been standardizing and accounting for reasons that tests are not done—health‐related exclusions,
inability to complete easier tests, and safety. Missing data on performance tests is often substantial but also
informative and useful analytically if the various reasons for missingness are carefully documented.

22
As a new survey, NHATS has been able to give consideration to the implications of doing these types of
assessments from the outset, starting with interviewer recruitment and training. Experience from the
Validation Study and Pretest have led to refinements of these procedures (e.g., use of videos in recruitment;
certification procedures in training) and to the NHATS Activities Booklet. Training materials and data
collection instruments will be available later this year at www.nhats.org.
FUNDING
This research was supported by the National Institute on Aging (Cooperative Agreement
1U01AG032947‐01). Dr. Seplaki also received support from a Mentored Research Scientist Development
Award (K01AG031332). The views expressed are those of the authors alone and do not represent those of
the funding agency or the authors’ universities or institutes.
REFERENCES
Bandeen‐Roche, K., Xue, Q. L., Ferrucci, L., Walston, J., Guralnik, J. M., Chaves, P., et al. (2006). Phenotype of
frailty: Characterization in the Women’s Health and Aging Study. Journals of Gerontology: Medical Sciences,
61A(3), 262–266.
Carlson, M. C., Varma, V., Xia, J., Fried, L. P., Williamson, J., et al. (n.d.). Development and validation of a
computerized cognitive frailty instrument to predict incident dementia. Manuscript submitted for
publication.
Freedman, V. A. (2009). Adopting the ICF language for studying late‐life disability: A field of dreams? The Journal
of Gerontology: Medical Sciences, 64A(11), 1172–1174.
Freedman, V. A., Kasper, J. D., Cornman, J., Agree, E., Bandeen‐Roche, K., Mor, V., et al. (2011). Validation of new
measures of disability and functioning in the National Health and Aging Trends Study. The Journal of
Gerontology: Medical Sciences, 66, 1013–1021.
Fried, L. P., Bandeen‐Roche, K., Chaves, P. H., & Johnson, B. A. (2000). Preclinical mobility disability predicts
incident mobility disability in older women. The Journal of Gerontology: Medical Sciences, 55(1), M43–M52.
Fried, L. P., Tangen, C. M., Walston, J., Newman, A. B., Hirsch, C., Gottdiener, J., et al. (2001). Frailty in older
adults: Evidence for a phenotype. The Journal of Gerontology: Medical Sciences, 56A(3), M146–M156.
Gill, T. M., Gahbauer, E. A., Allore, H. G., & Han, L. (2006). Transitions between frailty states among community‐
living older persons. Archives of Internal Medicine, 166(4), 418–423.
Guralnik, J. M., Fried, L. P., Simonsick, E. M., Kasper, J. D., & Lafferty, M. E. (Eds.). (1995). The Womenʹs Health and
Aging Study: Health and social characteristics of older women with disability. Bethesda, MD: National Institute on
Aging, NIH Pub. No. 95‐4009. Retrieved June 21, 2011, from
www.grc.nia.nih.gov/branches/ledb/whasbook/tablcont.htm
Guralnik J. M., Ferrucci, L., Simonsick, E. M., Salive, M. E., & Wallace, R. B. (1996). Lower extremity function in
persons over the age of 70 years as a predictor of subsequent disability. New England Journal of Medicine,
332(9), 556–561.
Guralnik, J. M., Simonsick, E. M., Ferrucci, L., Glynn, R. J., Berkman, L. F., Blazer, D. G., et al. (1994). A short
physical performance battery assessing lower extremity function: Association with self‐reported disability
and prediction of mortality and nursing home admission. The Journal of Gerontology, 49, M85–94.
IOM (Institute of Medicine). (2007). The future of disability in America. Washington, DC: The National Academies
Press.
Jette, A. (2009). Toward a common language of disablement. Journals of Gerontology: Medical Sciences, 64A(11),
1165–1168.

Proceedings of the 10th Conference on Health Survey Research Methods 23
LIFE Study Investigators, Pahor, M., Blair, S. N., Espeland, M., Fielding, R., Gill, T. M., et al. (2006). Effects of a
physical activity intervention on measures of physical performance: Results of the lifestyle interventions and
independence for Elders Pilot (LIFE‐P) study. Journals of Gerontology: Medical Sciences, 61(11), 1157–1165.
Manton, K. G., Corder, L., & Stallard, E. (1997). Chronic disability trends in elderly United States populations:
1982–1994. Proceedings of the National Academy of Sciences USA, 94(6), 2593–2598.
Manton, K. G., Corder, L. S., & Stallard, E. (1993). Estimates of change in chronic disability and institutional
incidence and prevalence rates in the U.S. elderly population from the 1982, 1984, and 1989 National Long
Term Care Survey. Journals of Gerontology, 48(4), S153–S166.
Manton, K. G., Gu, X., & Lamb, V. (2006). Change in chronic disability from 1982 to 2004/2005 as measured by
long‐term changes in function and health in the U.S. elderly population. Proceedings of the National Academy of
Sciences, 103(48), 18374–18379.
Manton, K., & Gu, X. (2001). Changes in the prevalence of chronic disability in the United States black and
nonblack population above age 65 from 1982 to 1999. Proceedings of the National Academy of Sciences USA,
98(11), 6354–6359.
Melzer, D., Lan, T. Y., & Guralnik, J.M. (2003). The predictive validity for mortality of the index of mobility‐
related limitations—Results from the EPESE study. Age Ageing, 32(6), 619–625.
Nagi, S. Z. (1965). Some conceptual issues in disability and rehabilitation. In M. B. Sussman (Ed.), Sociology and
rehabilitation. Washington, DC: American Sociological Association.
Schulman, K. I. (2000). Clock‐drawing: Is it the ideal cognitive screening test? International Journal of Geriatric
Psychiatry, 15, 548–561.
Simonsick, E. M., Maffeo, C. E., Rogers, S. K., Skinner, E. A., Davis, D., Guralnik, J. M., et al. (1997). Methodology
and feasibility of a home‐based examination in disabled older women: The Women’s Health and Aging
Study. The Journal of Gerontology: Medical Sciences, 52(5), M264–M274.

24

Proceedings of the 10th Conference on Health Survey Research Methods 25
The Development and Evaluation of Disability Measures Using a Mixed‐Method Approach1
Aaron Maitland, Kristen Miller, Mitchell Loeb, and Jennifer Madans (National Center for Health Statistics)2
INTRODUCTION
The assessment of many contemporary health survey variables is best accomplished with a dynamic
question development and evaluation strategy. This is particularly true of health survey items that focus on
complex concepts such as disability and functioning. It is also important when evaluating the quality and
performance of survey questions across cultural settings and national boundaries (Harkness et al., 2010).
Several methods are available to researchers for use in the development of survey questions; however, each
method has its own strengths and weaknesses. This paper presents a mixed‐method approach that
combined cognitive interviewing and field test methodology to evaluate a set of disability questions for use
on health surveys internationally.
In developing survey questions, a notable challenge is to account for the numerous ways that
respondents across differing cultures, languages, and socioeconomic conditions might interpret and process
those questions. The challenge is further heightened when the construct to be measured is a complex
concept. The concept of disability, for example, is complex because it involves numerous and varied
meanings, attitudes, and types of experiences across individuals and cultural subpopulations. Because social
context and cultural circumstances inform the way respondents interpret, consider, and ultimately respond
to questions, these differences can lead to systematic measurement error in survey data. Rather than
interpreting differences in survey estimates as response process bias, they can be wrongfully construed as
real differences in the phenomena of study.
To ensure comparability of measures across sociocultural groups, it is necessary to understand the
degree of interpretive and response process variation across groups. Survey questions can then be revised to
account for the variation. For this reason, question evaluation studies, particularly those intended for
heterogeneous populations, should address the following line of inquiry:
How do respondents understand each survey question?
Do respondents understand the questions differently?
Does each of the questions mean the same in all the languages in which it is asked?
Does each question mean the same in all of the cultures in which it is asked?
In processing each question, do all respondents recall information and construct an answer with
similar processes?
What other subgroups (e.g. gender, age, socioeconomic status, health or disability status) should be
considered for comparability?
1 This paper was the result of collaboration between the United Nations and Social Commission for Asia and the Pacific
(UNESCAP) and the Washington Group on Disability Statistics. We wish to acknowledge the efforts of all of the countries that
have participated in this project. 2 The findings and conclusions in this report are those of the authors and do not necessarily represent the views of the
Centers for Disease Control and Prevention.

26
To what extent are survey data elicited from each question a true representation of the intended
phenomena of study?
In what ways is the picture distorted because the questions do not accurately capture the intended
construct?
In successfully addressing these issues, a question evaluation study can provide rich understanding of
how questions perform. In turn, this understanding allows designers the opportunity to improve
measurement validity and increase equivalence or, at least, to provide documentation regarding the
appropriate interpretation of the resulting data.
METHODS3
In collaboration with the United Nations Economic and Social Commission for Asia and the Pacific
(UNESCAP), the Washington Group developed a set of disability questions intended as components of
population surveys, as supplements to surveys, or as the core of a disability survey. The WG/UNESCAP
question evaluation project is based on the line of inquiry outlined above and is reflected in the project’s
mixed‐method design. The specific objectives of the cognitive interviewing component were to identify the
following interpretive patterns: (1) respondents’ interpretations of the specific questions, (2) calculation and
other processes used by respondents to formulate their answers to the questions, and (3) types of response
error problems (Miller, 2011). Findings from the cognitive interviewing component established hypotheses to
be examined in the second component—the field test. While the cognitive interviewing study determined the
specific patterns of interpretation, the field test was used to understand the extent to which those patterns
existed in a larger, representative sample. More specifically, it was used to examine the extent of problematic
patterns, such as unintended interpretations and whether they occurred in particular subgroups.
The WG/UNESCAP project included cognitive interviewing and field testing of the extended question
set in six countries. A total of 155 cognitive interviews were completed in Cambodia, Canada, Kazakhstan,
Maldives, Mongolia, Philippines, South Africa, Sri Lanka, and the United States.
Each country first conducted approximately 20 semistructured qualitative cognitive interviews using a
purposive sample. Samples were broadly reflective of different disability statuses (types/severities), ages,
gender, and socioeconomic status. The interview was semistructured, consisting of the test and probe
questions to elicit narrative information from the respondent about their answers. The protocol was written
in English; countries conducting interviews in other languages were responsible for translating the protocol.
Interviewers were instructed to keep detailed notes during interviews so they would be able to write up
a thorough narrative regarding how each respondent answered each of the test questions. An online data
entry application (Q‐Notes) was developed for interviewers to record their notes for each question and each
interview. Methodologists at the National Center for Health Statistics then were able to review the quality of
the cognitive interview data and provide feedback for improvement. The application also allowed for a fast,
in‐depth analysis of the interviews.
The methodology of field tests is quite diverse (Converse & Presser, 1986). Field tests often are viewed as
pilot tests or dress rehearsals to ensure that survey processes and procedures are worked out prior to full‐
3 Detailed methodological information regarding the WG/UNESCAP project can be found at
www.unescap.org/stat/disability/analysis/

Proceedings of the 10th Conference on Health Survey Research Methods 27
scale implementation. This provides relatively minimal information with respect to question evaluation—
for example, information about the distribution of variables and the level of item nonresponse. Field tests
also may include embedded experiments or other methodological studies (e.g., behavior coding, debriefing
studies). Our approach was to improve the field test with information from the cognitive interviews by
supplementing the field test questionnaire with structured probe questions. That is, analysis of the cognitive
interviews revealed both problematic and nonproblematic interpretive patterns, and additional questions
were added to the field test questionnaire to capture the extent to which those various interpretive patterns
existed. This provides quantitative evidence about the presence and extent of the various interpretive
patterns in the different countries that participated in the field test. The field test was conducted in
Cambodia, Kazakhstan, Maldives, Mongolia, the Philippines, and Sri Lanka. Each country participating in
the field test conducted approximately 1,000 standardized survey interviews drawn from probability
samples within specific areas of each country.4 Resulting survey data from the follow‐up probe questions
were used to examine the extent of valid and nonvalid interpretive patterns. We present several descriptive
analyses below that illustrate the presence of these patterns and how they related to the responses to one of
the survey questions.
RESULTS
We illustrate this approach by presenting the results about the construct of anxiety from the functioning
domain of affect.5 Affect is the domain dealing with emotional functioning and includes depression and
anxiety. These two domains are important to measure as they provide some indications of emotional or
psychiatric disability. Symptoms of depression and anxiety can be common occurrences in most people’s
lives. However, the question developers’ intent was to be able to identify depression and anxiety that goes
beyond what is considered “normal.” The cognitive interviews were designed to determine if the questions
developed appropriately captured more severe levels of depression and anxiety.
Questions were designed to capture two specific aspects of anxiety: frequency and intensity. Analyzed
together, the intent of the questions was to place respondents along a severity continuum comprised of
various dimensions of anxiety (i.e., frequency and intensity).
Cognitive Interviewing Results
The following four questions were examined in the cognitive interviews:
1. How often do you feel worried, nervous or anxious? Daily, weekly, monthly, a few times a year, or
never?
2. Do you take medication for anxiety?
3. Thinking about the last time you felt anxious, how would you describe the level of anxiety? Mild,
moderate, or severe?
4. Thinking about the last time you felt anxious, was the anxiety worse than usual, better than usual, or
about the same as usual?
4 The sampling designs vary by country and were not intended to produce nationally representative estimates. Hence,
sampling design information and weights were not included in the data files. Most countries conducted cluster or systematic
samples of key populations (e.g., urban and rural populations). Significance tests in this paper assume simple random
sampling and may underestimate the variance in some countries. 5 Results from other functioning domains can be found at www.unescap.org/stat/disability/analysis/

28
In answering these questions, respondents considered a range of feelings and experiences they
recognized as anxiety—or rather, what they believed the question was asking in terms of being “worried,
nervous or anxious.” For the most part, the feelings and experiences considered by respondents were
consistent with various aspects of the intended concept of anxiety, with the following range of patterns
reported.
1. Clinical anxiety, whereby respondents described being diagnosed by a medical professional.
2. Elements of depression, whereby respondents spoke about being overly sad, wanting to stay in bed,
or being unable to perform daily activities, and
3. Stress‐related worry, which respondents connected to work (e.g., heavy workloads, deadlines,
performances), family or relationship problems, crime, or concerns about their economic future and
physical well‐being.
One problematic pattern, however, was reported by a handful of respondents who spoke about their
anxiety as being a positive characteristic. These respondents, it appears, interpreted the question as asking
about being excited, energetic, or looking forward to the future. For example, one U.S. narrative states:
“Well it depends on what it is I got to do. Because I kind of get like hyped up when I know Iʹve got to get
something done by a certain time. I put the pressure on me to get it done by that certain deadline. That’s
just me.” I asked him what he meant by hyped up and he stated “I get like an adrenaline rush. I make
myself get it done quick but whenever Iʹm doing it in a quick way I’m often doing it in a safe, productive
way to where I don’t get myself hurt or anybody else hurt.” I asked him if he feels nervous or worried
when this is happening and he said “no, just calm, relaxed, just know what I need to get done.” He
described what he was feeling as an energy boost, but not worried or nervous. I asked him about the last
time this happened, he described going to school, and making sure he got there on time.
This particular interpretation was clearly used by a small minority of respondents and was only found
in the United States and Canada. It is possible, however, that this interpretation did exist in other regions
that were not sufficiently detailed in the narratives. The field test was used to determine the extent of this
pattern and whether it exists in particular subgroups.
Field Test Results
The final questions used on the field test and relevant to this paper are shown in the appendix. The core
questions about the frequency and intensity of anxiety were included, as was the medication question. Also
included were respondent probe questions that were developed from the patterns identified in the cognitive
interviews and an impact question that was used to understand the amount of limitation respondents face
in their daily activities as a result of anxiety. We first report the descriptive findings by country.
Overall, nearly half of the respondents (47.3%) in the field test reported that they never felt worried,
nervous, or anxious. One in four reported that they experience these feelings a few times a year. One in ten
indicated they experience anxiety monthly. Nearly one in five (19.1%) respondents reported that they
experience anxiety either weekly or daily. As Table 1 shows, the frequency of anxiety reported varies
significantly by country. For example, almost one third (30.9%) of respondents in Kazakhstan reported that
they experience anxiety weekly or daily. Similarly, one in four (26.0%) respondents from Mongolia reported
that they experience anxiety at least weekly. At the other end of the spectrum, only about 10% of
respondents from Sri Lanka and the Philippines reported experiencing anxiety weekly or daily. In fact,
78.4% of respondents from Sri Lanka reported that they never experience anxiety.

Proceedings of the 10th Conference on Health Survey Research Methods 29
As shown in Table 2, almost one in five (19.2%) respondents reported that they experienced a lot of
anxiety the last time they had these feelings. The intensity of anxiety reported varies significantly by
country. One third (34.8%) of respondents from Sri Lanka and 40.9% of respondents from Maldives
described the level of these feelings as “a lot.” The level of these feelings is much lower in the other
countries. No more than 16.9% in any of the remaining countries described the level of their feelings as “a
lot,” and only 7.2% in the Philippines described the level of these feelings as “a lot.”
Table 3 demonstrates the association between anxiety frequency and intensity, showing the percentage
of respondents who report “a little” intensity by frequency for each country. In general, respondents
reporting lower levels of intensity also report lower frequencies of these feelings.
The field test included follow‐up probe questions based on patterns identified in the cognitive interviews.
The percentage reporting that each statement describes his or her feelings by country is shown in Table 4.
Table 1. Frequency of Anxiety, by Country
FREQUENCY Kazakhstan Cambodia Sri Lanka Maldives Mongolia Philippines ALL COUNTRIES
Never 31.9% 39.7% 78.4% 46.6% 35.4% 54.3% 47.3%Few times a year 22.9 28.7 7.5 27.3 25.6 25.3 23.0Monthly 13.6 14.5 2.7 5.7 12.8 10.8 10.1Weekly 17.6 9.2 2.1 9.0 12.4 7.7 9.7Daily 13.3 7.4 8.1 11.0 13.6 1.7 9.3Refused 0.2 0.0 0.1 0.1 0.1 0.0 0.1Don’t know 0.5 0.5 1.1 0.4 0.3 0.2 0.5N (1,000) (1,008) (1,000) (1,013) (1,222) (1,066) (6,309)Chi‐square = 817.34, 20 df, p < .05. NOTE: Refused and Don’t know categories excluded when calculating chi‐square statistic.
Table 2. Intensity of Anxiety, by Country
INTENSITY Kazakhstan Cambodia Sri Lanka Maldives Mongolia Philippines ALL COUNTRIES
A little 64.0% 62.7% 54.4% 39.4% 65.6% 83.5% 62.4%Closer to a little 4.9 2.0 2.0 1.7 4.3 1.4 3.0In between 10.2 18.6 6.4 15.1 6.8 6.8 11.0Closer to a lot 6.7 2.2 2.0 1.1 5.1 0.4 3.3A lot 12.9 14.1 34.8 40.9 16.9 7.2 19.2Refused 0.2 0.0 0.0 0.0 0.3 0.0 0.1Don’t know 1.2 0.5 0.5 1.9 1.0 0.6 1.0N (675) (603) (204) (536) (785) (486) (3,289)Chi‐square = 443.68, 20 df, p < .05. NOTE: Refused and Don’t know categories excluded when calculating chi‐square statistic.
Table 3. Percentage of Respondents Reporting “a Little” Intensity, by Frequency & Country
Frequency Kazakhstan Cambodia Sri Lanka Maldives Mongolia Philippines ALL COUNTRIES
Few times a year 81.3% 82.3% 60.0% 52.2% 77.5% 91.5% 76.1%Monthly 68.2 59.6 55.6 33.3 79.5 75.4 66.6Weekly 55.8 36.6 61.9 36.3 56.7 80.5 53.7Daily 45.5 27.0 47.5 17.3 42.3 44.4 37.1
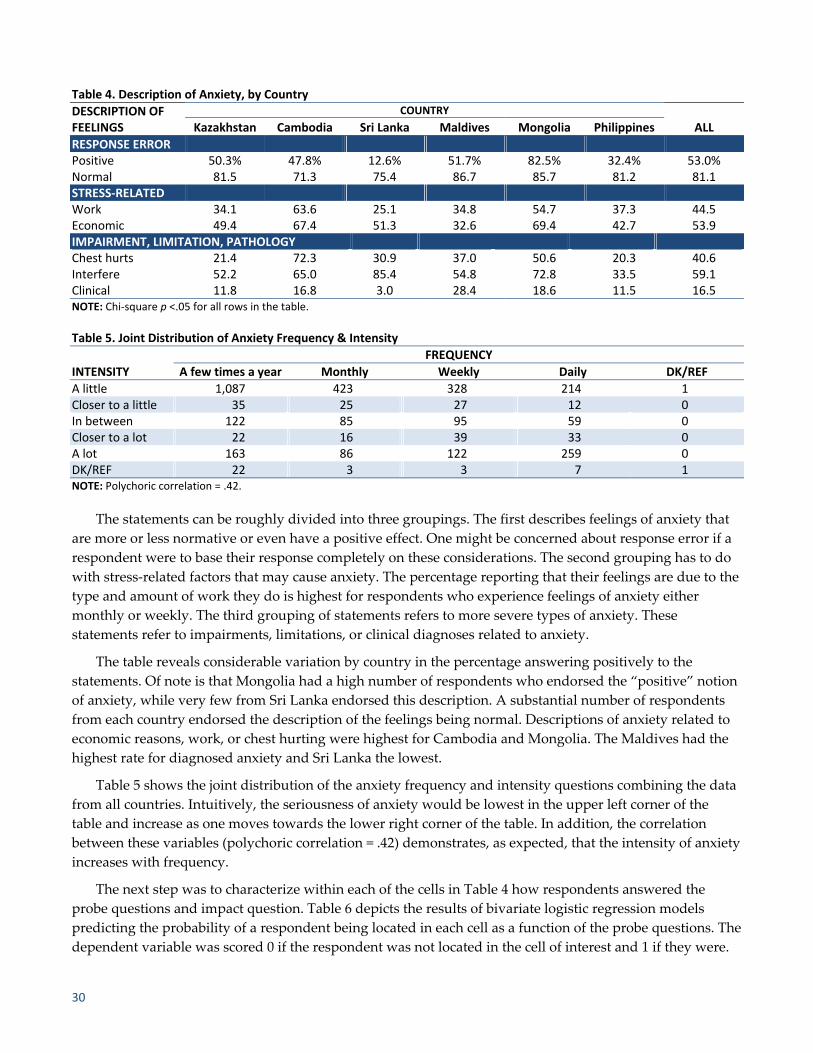
30
Table 4. Description of Anxiety, by Country
DESCRIPTION OF FEELINGS
COUNTRY
ALL Kazakhstan Cambodia Sri Lanka Maldives Mongolia Philippines
RESPONSE ERROR Positive 50.3% 47.8% 12.6% 51.7% 82.5% 32.4% 53.0%Normal 81.5 71.3 75.4 86.7 85.7 81.2 81.1STRESS‐RELATED Work 34.1 63.6 25.1 34.8 54.7 37.3 44.5Economic 49.4 67.4 51.3 32.6 69.4 42.7 53.9IMPAIRMENT, LIMITATION, PATHOLOGY Chest hurts 21.4 72.3 30.9 37.0 50.6 20.3 40.6Interfere 52.2 65.0 85.4 54.8 72.8 33.5 59.1Clinical 11.8 16.8 3.0 28.4 18.6 11.5 16.5NOTE: Chi‐square p <.05 for all rows in the table.
Table 5. Joint Distribution of Anxiety Frequency & Intensity
FREQUENCY
INTENSITY A few times a year Monthly Weekly Daily DK/REF
A little 1,087 423 328 214 1Closer to a little 35 25 27 12 0In between 122 85 95 59 0Closer to a lot 22 16 39 33 0A lot 163 86 122 259 0DK/REF 22 3 3 7 1NOTE: Polychoric correlation = .42.
The statements can be roughly divided into three groupings. The first describes feelings of anxiety that
are more or less normative or even have a positive effect. One might be concerned about response error if a
respondent were to base their response completely on these considerations. The second grouping has to do
with stress‐related factors that may cause anxiety. The percentage reporting that their feelings are due to the
type and amount of work they do is highest for respondents who experience feelings of anxiety either
monthly or weekly. The third grouping of statements refers to more severe types of anxiety. These
statements refer to impairments, limitations, or clinical diagnoses related to anxiety.
The table reveals considerable variation by country in the percentage answering positively to the
statements. Of note is that Mongolia had a high number of respondents who endorsed the “positive” notion
of anxiety, while very few from Sri Lanka endorsed this description. A substantial number of respondents
from each country endorsed the description of the feelings being normal. Descriptions of anxiety related to
economic reasons, work, or chest hurting were highest for Cambodia and Mongolia. The Maldives had the
highest rate for diagnosed anxiety and Sri Lanka the lowest.
Table 5 shows the joint distribution of the anxiety frequency and intensity questions combining the data
from all countries. Intuitively, the seriousness of anxiety would be lowest in the upper left corner of the
table and increase as one moves towards the lower right corner of the table. In addition, the correlation
between these variables (polychoric correlation = .42) demonstrates, as expected, that the intensity of anxiety
increases with frequency.
The next step was to characterize within each of the cells in Table 4 how respondents answered the
probe questions and impact question. Table 6 depicts the results of bivariate logistic regression models
predicting the probability of a respondent being located in each cell as a function of the probe questions. The
dependent variable was scored 0 if the respondent was not located in the cell of interest and 1 if they were.

Proceedings of the 10th Conference on Health Survey Research Methods 31
The independent variables in the models included the seven patterns of anxiety from Table 4 (all scored 1 if
the respondent selected the pattern; 0 if they did not) and a limitation in daily activities variable (scored 1 =
a little limited to 4 = completely limited).
Table 6 illustrates how the patterns of anxiety are associated with being located in each cell in the joint
distribution of frequency and intensity. Several observations can be made from this table. First, the upper
left corner of the table shows that anxiety described as being related to work, chest pains, interference with
life, economic issues, clinical diagnoses, and limitation in daily activities decrease the likelihood of selecting
the lowest levels of frequency and intensity. In contrast, anxiety described as being related to chest pains,
interference with daily life, clinical diagnoses, and limitation in daily activities generally increase the
likelihood of responding at the higher levels of the frequency and intensity variables. Moreover, these
variables are the most prominent when you get the highest level of the frequency and intensity variables.
Finally, we looked at how the patterns of anxiety varied by country. Tables 7a and 7b show how these
patterns were related to frequency and intensity in Cambodia and the Philippines. While Table 1 indicates
that the frequency of anxiety was similar in these two countries, Table 3 shows that the intensity of anxiety
is generally lower in the Philippines than in Cambodia. This could be due to respondents in the two
countries experiencing different levels of anxiety or it could be that the intensity question is interpreted
differently in the two countries. That is, different response patterns may persist in the two countries. In fact,
an examination of the two tables shows that intensity increases with the prevalence of similar types of
response patterns. For example, respondents with higher levels of intensity tend to experience more
interference with their lives and limitation in their daily activities. This pattern is observed in both countries
and is present at nearly every level of frequency.
Table 6. Factors Influencing Different Levels of Response to the Anxiety Frequency & intensity Question
INTENSITY
FREQUENCY
A few times a year Monthly Weekly Daily
A little
Work*** Chest hurts*** Interfere*** Economic*** Clinical*** Limited***
Clinical** Limited*** Work*** Economic**
Chest hurts*** Interfere*** Work***
Normal*** Interfere*** Limited**
Closer to a little Economic**
In between Normal** Positive**Work*** Limited**
Chest hurts*** Limited***
Interfere***Economic** Limited***
Closer to a lot Interfere** Interfere**Economic*** Limited***
Chest hurts** Limited**
A lot
Work*** Economic** Normal** Chest hurts*** Interfere** Clinical***
Positive** Chest hurts*** Interfere** Clinical*** Limited***
Chest hurts*** Interfere*** Clinical*** Limited***
Positive*** Chest hurts*** Interfere*** Clinical*** Limited***
NOTE: Negative associations shown in red text. Positive associations shown in black text. **p < .05, ***p < .005.

32
Table7a. Factors Influencing Different Levels of Response to the Anxiety Frequency & Intensity Question in the Philippines
INTENSITY
FREQUENCY
A few times a year Monthly Weekly Daily
A little
Work** Chest hurts*** Interfere*** Economic*** Limited***
Work** Interfere**
Closer to a little Clinical**
In between Interfere** Interfere** Chest hurts** Interfere**
Closer to a lot
A lot Normal** Chest hurts*** Limited**
Chest hurts** Limited***
Chest hurts** Interfere** Limited**
Limited***
Negative associations shown in red text. Positive associations shown in black text. **p < .05, ***p < .005.
Table7b. Factors Influencing Different Levels of Response to the Anxiety Frequency & Intensity Question in Cambodia
INTENSITY
FREQUENCY
A few times a year Monthly Weekly Daily
A little
Work** Chest hurts*** Interfere*** Limited*** Positive**
Work*** Work** Economic**
Closer to a little Clinical**
In between Positive**Work** Limited**
Chest hurts** Limited***
Closer to a lot Limited**
A lot Work**
Clinical**Limited***
Limited** Interfere**
Negative associations shown in red text. Positive associations shown in black text. **p < .05, ***p < .005.
DISCUSSION
In this paper, we have illustrated a mixed‐method approach to question evaluation that combines a
qualitative method (cognitive interviewing) with quantitative methods (supplemented field test data). We
utilized the qualitative nature of cognitive interviewing to understand the detailed response processes that
respondents used to answer questions about physical, mental, and emotional functioning. We then used the
information that we learned about the patterns of responses to develop probe questions that would help us
understand the prevalence of these interpretive patterns across countries in the field test.
Overall, we feel the mixed‐method approach was a powerful technique that provided valuable insight
into question performance. However, as with all methods, we did encounter our share of limitations with
both the cognitive interviews and field methods. First, the cognitive interviews utilized relatively
inexperienced interviewers. Even though the Q‐Notes application enabled feedback, the level of experience
may have had some impact on the resulting data. For example, the amount of narrative recorded varied by
country and question. This has an implication for the analysis of the data and identification of the resulting

Proceedings of the 10th Conference on Health Survey Research Methods 33
response patterns. More details in the narrative might have allowed us to identify different interpretive
patterns.
The field test also presented challenges. So far, the preliminary analyses presented here suggest that
when used together, the anxiety frequency and intensity questions capture a meaningful gradation in this
very complex concept. However, we also have found that different levels of anxiety are captured in the
countries in the field test. In addition, the descriptions of anxiety as captured by the follow‐up probe
questions vary by country. The next step in our analysis is, therefore, to explore in more detail whether the
combination of frequency and intensity produces equivalent characteristics cross‐culturally.
Although there are many quantitative methods available for studying equivalence, there is little
agreement on the best approach or even the definition of equivalence. Johnson (2006) describes a number of
different notions of equivalence and hence different methods to establish equivalence. It is often difficult to
determine which notion is the most appropriate for a given set of data. It probably differs depending on the
type of data and their intended use. We will be exploring various methods for determining cross‐national
equivalence in the future. The successful application of mixed‐methods approaches in the field of question
evaluation methodology has been a perennial challenge (e.g., Presser & Blair, 1994), and the cross‐cultural
component of projects like this one adds another dimension to this task.
REFERENCES
Converse, J., & Presser, S. (1986). Survey questions: Handcrafting the standardized questionnaire. Thousand Oaks, CA:
Sage.
Harkness, J., Braun, M., Edwards, B., Johnson, T., Lyberg, L., Mohler, P., et al. (Eds.). (2010). Survey methods in
multinational, multiregional, and multicultural contexts. New York: Wiley.
Johnson, T. (2006). Methods and frameworks for crosscultural measurement. Medical Care, 44, S17–S20.
Meredith, W., & Teresi, J. (2006). An essay on measurement and factorial invariance. Medical Care, 44, S69–S77.
Miller, K. (2011). Cognitive interviewing. In J. Madans, K. Miller, G. Willis, & A. Maitland (Eds.), Question
evaluation methods: Contributing to the science of data quality. New York: Wiley.
Presser, S., & Blair, J. (1994). Survey pretesting: Do different methods produce different results? In P. V. Marsden
(Ed.), Sociological methodology (Vol. 24, pp. 73–104). Washington, DC: American Sociological Association.

34
APPENDIX. ANXIETY FIELD TEST QUESTIONS
How often do you feel worried, nervous or anxious? Daily, Weekly, Monthly, A few times a year, Never
Do you take medication for these feelings? Yes, No
Thinking about the last time you felt worried, nervous, or anxious, how would you describe the level of
these feelings? A little, a lot, somewhere in between a little and a lot
Would you say this was closer to a little, closer to a lot, or exactly in the middle? Closer to a little, Closer to a
lot, Exactly in the middle
Please tell me which of the following statements, in any describe your feelings. Yes, No
My feelings are caused by the type and amount of work I do.
Sometimes the feelings can be so intense that my chest hurts and I have trouble breathing.
These are positive feelings that help me to accomplish goals and be productive.
The feelings sometimes interfere with my life, and I wish that I did not have them.
If I had more money or a better job, I would not have these feelings.
Everybody has these feelings; they are a part of life and are normal.
I have been told by a medical professional that I have anxiety.
How much do these feelings limit your ability to carry out daily activities? Not at all, A little, A lot,
Completely

Proceedings of the 10th Conference on Health Survey Research Methods 35
Estimating Mental Illness in an Ongoing National Survey Joe Gfroerer, Sarra Hedden, Peggy Barker, Jonaki Bose, and Jeremy Aldworth (SAMSHA)
I. INTRODUCTION
There has long been a need for estimates of the prevalence of mental disorders in the U.S. population.
Periodic studies such as the Epidemiologic Catchment Area (ECA) study, the National Comorbidity Study
(NCS), and the National Epidemiologic Survey on Alcohol and Related Conditions (NESARC) have
provided important findings on the prevalence, predictors, and correlates of mental disorders, but none of
these studies was designed to track trends on an annual basis or to provide state estimates.
The demand for more frequent and detailed data on mental illness increased with the passage of the
1992 ADAMHA Reorganization Act. This legislation created the Substance Abuse and Mental Health
Services Administration (SAMHSA) and required the agency to develop a definition and methodology for
estimating serious mental illness (SMI) among adults, by state. States were required to utilize these data in
developing their plans for use of block grant funds distributed by SAMHSA. SAMHSA convened a technical
advisory group (TAG) that developed a definition of SMI, published in the Federal Register in 1993:
Persons age 18 and over, who currently or at any time during the past year, have had diagnosable
mental, behavioral, or emotional disorder of sufficient duration to meet diagnostic criteria specified
within DSM‐III‐R that has resulted in functional impairment.…Functional impairment is defined as
difficulties that substantially interfere with or limit role functioning in one or more major life
activities including basic daily living skills; instrumental living skills; and functioning in social,
family, and vocational/educational contexts. (SAMHSA, 1993)
SAMHSA later published state estimates of SMI based on this definition, using the limited data that
were available at the time (NCS and ECA) and a regression model that projected national data to states
according to demographic characteristics (Kessler et al., 1998). However, concerns about the validity of these
estimates led SAMHSA to explore other approaches for obtaining annual estimates of SMI by state.
In December 2006, SAMHSA convened a TAG meeting to solicit recommendations for mental health
surveillance data collection and analysis strategies. The TAG recommended that SAMHSA’s National
Survey on Drug Use and Health (NSDUH) be modified to produce estimates of SMI among adults.
Recognizing the limitations on the length of the NSDUH interview, the TAG suggested that the K6
psychological distress module, already included in the NSDUH, be supplemented with questions on
functional impairment. The data from these short scales then would be used to estimate SMI using a
statistical model based on clinical psychiatric interviews conducted on a subsample of NSDUH respondents.
The K6 had already been demonstrated to be an excellent predictor of SMI in prior studies (Kessler et al.,
2003). Adding impairment indicators was important for improving statistical prediction, and the TAG also
felt that this would improve face validity, and consequently public acceptance of the estimates, since
impairment is a component of the SMI definition.
After the TAG meeting, SAMHSA began methodological development and testing to implement these
enhancements, referred to as the Mental Health Surveillance System (MHSS), to NSDUH in 2008 (Colpe et
al., 2010). The next section provides an overview of the NSDUH design. Subsequent sections describe the
development, implementation, and initial results of the MHSS. A final section discusses future plans for
evaluating, improving, and utilizing the MHSS.

36
II. DESCRIPTION OF THE NSDUH
The NSDUH is the federal government’s primary source of information on the nature and extent of
substance use and abuse in the United States. Conducted since 1971, the survey collects data by
administering questionnaires to a representative sample of about 67,500 persons in the U.S. at their place of
residence. NSDUH data are used extensively by policymakers and researchers to measure the prevalence
and correlates of substance use, to identify and monitor trends, and to analyze differences in substance use
patterns by population subgroups.
The respondent universe is the civilian noninstitutionalized population age 12 years old or older
residing within the U.S. and the District of Columbia. Persons excluded from the universe include active‐
duty military personnel, persons with no fixed household address (e.g., homeless and/or transient persons
not in shelters), and residents of institutional group quarters, such as jails and hospitals. The eight largest
states have samples of about 3,600 respondents. For the remaining 42 states and the District of Columbia,
samples of about 900 persons are selected. Young people are oversampled, with one‐third of the sample in
each state allocated to age groups 12–17, 18–25, and 26 and older. Thus, although the sample of adults is
45,000, half of the adult sample is 18–25. At each sampled address, a five‐minute screening procedure using
a handheld computer lists all household members and their basic demographic data. To obtain the target
sample sizes, a preprogrammed selection algorithm selects zero to two sample person(s), depending on the
composition of the household.
The data are collected through computer‐assisted interviewing (CAI), including audio computer‐
assisted self‐interviewing (ACASI), on a laptop computer. The interviews average about an hour. Each
respondent who completes a full interview is given a $30 cash payment. The questionnaire contains
demographic items (interviewer‐administered) and self‐administered questions pertaining to the use of
tobacco, alcohol, and illicit drugs (as well as injection drug use), perceived risks of substance use, substance
dependence or abuse, arrests, treatment for substance use problems, pregnancy and health care issues, and
mental health issues (SAMHSA, 2010).
III. DESIGN OF THE MENTAL HEALTH SURVEILLANCE SYSTEM (MHSS)
Based on the Federal Register definition, SAMHSA established an operational definition of SMI among
adults: at least one DSM‐IV disorder, other than developmental or substance‐use disorder, in the past 12
months that resulted in serious impairment. Serious impairment was determined to be equivalent to a DSM‐
IV Axis V Global Assessment of Functioning (GAF) score of less than or equal to 50.
Questionnaires
In consultation with the TAG, two candidate impairment scales were selected and modified for use in
the 2008 NSDUH. They are the World Health Organization Disability Assessment Scale [WHODAS] (Rehm
et al., 1999) and the Sheehan Disability Scale [SDS] (Leon, Olfson, Portera, Farber, & Sheehan, 1997).
The WHODAS consists of a series of 16 questions used for assessing disturbances in social adjustment
and behavior. Because of the length of the WHODAS, an IRT analysis was done to see if a reduced set of
items would be sufficient for measuring impairment. This resulted in an abridged set of eight WHODAS
items used in NSDUH (Novak, Colpe, Barker, & Gfroerer, 2010). Respondents were asked how much
difficulty they had doing each of eight activities “during the one month in the past 12 months when your
emotions, nerves, or mental health interfered most with your daily activities.” The eight items were assessed

Proceedings of the 10th Conference on Health Survey Research Methods 37
on a 0 to 3 scale with categories of “no difficulty” (0), “mild difficulty” (1), “moderate difficulty” (2), and
“severe difficulty” (3).
The SDS consists of a series of questions that is used to measure impairment in a person’s daily
functioning in four role domains. Respondents were asked how much their “emotions, nerves or mental
health” interfered with each role domain “…during the month in the past 12 months when you were at your
worst emotionally.” The SDS role domains are assessed on a 0 to 10 visual analog scale with impairment
categories of “none” (0), “mild” (1–3), “moderate” (4–6), “severe” (7–9), and “very severe” (10).
The K6 scale used to measure past‐year nonspecific psychological distress consists of six questions
asking frequency of symptoms during the month in the past year when the respondent was at his/her worst
emotionally. Response options are “none of the time” (0), “a little of the time” (1), “some of the time” (2),
“most of the time” (3), and “all of the time” (4). The sum of the values for the six questions is the K6 score
(range 0–24).
The clinical diagnostic interview used in the MHSS is the Structured Clinical Interview for DSM‐IV‐TR
Axis I Disorders Non‐Patient Edition (SCID‐I/NP). The SCID‐I/NP (First, Spitzer, Gibbon, & Williams, 2002)
is a semi‐structured diagnostic interview that has been widely used in clinical components of studies such as
the NCS‐R (Kessler et al., 2004), the National Survey of American Life (Jackson et al., 2004), and the NSDUH
substance‐use disorders reappraisal study (Jordan, Karg, Batts, Epstein, &Wiesen, 2008). The interview was
modified to assess past 12‐month mental health disorders and functioning via telephone.
Diagnostic modules contained in the MHSS version of the SCID include mood disorders, psychotic
disorders, anxiety disorders, eating disorders, impulse control disorders, substance use disorders, and
adjustment disorders. Also included in the MHSS SCID is the DSM‐IV Axis V GAF Scale, a clinical
interviewer (CI) rating of the respondent’s period of worst psychological, social, and occupational
functioning during the past year. Functioning is rated on a scale from 1–100.
Field Interviewer (FI) and Clinical Interviewer (CI) Training
For the MHSS, all NSDUH FIs were required to review a MHSS handbook, complete a MHSS electronic
training course, and attend a one‐hour classroom training session (Colpe et al., 2010). Clinical interviews
were conducted by master’s and doctoral level mental health professionals who had been carefully and
extensively trained to administer the SCID over the telephone. Training was led by four clinical supervisors
(CSs)—experts in the DSM and the SCID—and was overseen by the lead author of the SCID. The study
protocol included comprehensive instructions for identifying and managing distressed respondents as well
as ongoing supervision and inter‐rater training exercises for the clinical interviewers.
Protocol for Selection of SCID Subsample
At the end of the main NSDUH interview, a subsample of adult respondents was asked if they would be
willing to participate in an additional study that would gather more information about their recent mental
health history. The request was scripted as part of the CAPI interview, and field interviewers (FIs) did not
know in advance which respondents would be selected. Selected respondents were presented with a Special
Study Description for informed consent. Those agreeing to participate were given a $30 cash incentive in
addition to the $30 they received for completing the main NSDUH. FIs collected contact information (first
name, telephone number(s), and best days and times to call). Within two to four weeks of the NSDUH main
interview clinical interviewers called respondents and conducted the SCID interview. CIs completed the
SCID on paper and audio‐recorded the interview (with permission).

38
Sample Design & Response Rates for the 2008 MHSS
The two primary objectives for the first year of the MHSS were to (1) determine which of the two
impairment scales, used in combination with the K6 scale, provided the more accurate prediction of SMI in
NSDUH and would therefore be administered to the entire sample of adults in the 2009 and later surveys,
and (2) develop prediction models that will accurately classify NSDUH respondents as meeting or not
meeting criteria for SMI. Half of the NSDUH adult sample was randomly assigned the WHODAS and the
other half the SDS. A subsample of approximately 1,500 adult NSDUH participants was selected for the
follow‐up clinical interview (750 from each of the main study half samples). The SCID subsample was
stratified, based on respondents’ K6 scores, to optimize the sample allocation for prediction modeling. Strata
were constructed according to seven K6 scoring bands. Sampling rates were substantially lower for K6
scores 0 to 7 under the assumption that clinical positives would be rare in that scoring range. Of the 2,291
NSDUH respondents selected for the follow‐up interview, 1,977 agreed to participate (86%). Clinical
interviews were completed for 1,506 of those (76%). The most common reason for noncompletion among
those initially agreeing to participate was inability to contact respondents by telephone after repeated
attempts (15%).
IV. MODEL DEVELOPMENT & ESTIMATION
A series of weighted logistic regression prediction models were developed in which the K6 and either
the WHODAS or SDS (collected within the main study) were used as explanatory variables of SMI status
(collected from the SCID interview; Aldworth et al., 2010). The response variable, Y, was defined such that Y
= 1 when an SMI diagnosis is positive; otherwise, Y = 0. If X is a vector of explanatory variables, then the
response probability ( = Pr (Y = 1 | X ) can be estimated using separate weighted logistic regression models
for each of the WHODAS and SDS half samples. For each model, a cut point probability π was determined,
so that ifπ π for a particular respondent, then he or she was predicted to be SMI positive; otherwise, he or
she was predicted to be SMI negative. Receiver Operating Characteristic (ROC) analyses were used to
determine the cut point that resulted in (approximately) equal weighted numbers of false‐positives and
false‐negatives, to provide nearly unbiased estimates. Models were evaluated based on three criteria: (1)
model robustness (e.g., preference given to parsimonious models that could be implemented in other
surveys collecting similar covariates), (2) minimization of misclassification errors in SMI prediction (i.e.,
exhibiting reasonable ROC statistics), and (3) reasonable SMI estimates based on the full 12‐month data set
(i.e., balanced across several demographic subgroups and across the WHODAS and the SDS half samples).
Model fit statistics and sensitivity analyses indicated that in combination with the K6, the WHODAS
was a better predictor of SMI than the SDS. Consequently, this impairment scale was chosen for
administration in the 2009 and subsequent surveys.
The final WHODAS prediction model for estimating SMI was determined as follows, with a cut point π of 0.26972:
logit π ≡ log π / 1 π 4.7500 0.2098 0.3839 (1)
Where π refers to an estimate of the SMI response probability π for the model,
Xk refers to the recoded past year K6 score, where scores less than 8 were recoded as 0, and scores of 8 to
24 were recoded as 1 to 17, and

Proceedings of the 10th Conference on Health Survey Research Methods 39
refers to the sum of recoded WHODAS item scores, where item scores of 0 or 1 were recoded as 0,
and item scores of 2 or 3 were recoded as 1.
SAMHSA also was interested in deriving model‐based estimates of “any mental illness” (AMI). AMI,
defined similarly to SMI with respect to the presence of a diagnosable mental disorder, does not require
functional impairment from the disorder. After assessing a variety of models, the original SMI model was
chosen to estimate AMI, using a cut point of 0.024. National model‐based estimates for 2008 were 4.4% for
SMI and 19.5% for AMI (SAMHSA, 2010). These prevalence rates, as well as patterns across subgroups and
correlations with key variables (e.g., treatment), were compared with corresponding estimates from other
studies and found to be similar.
V. KEY ISSUES & FUTURE DIRECTIONS
Updating the Models & Measuring Changes across Time
The MHSS has been continued with 500 clinical interviews completed in 2009 and 2010, and 1,500
planned for collection in 2011 and 2012, supported by funding from NIMH. However, a plan for
incorporating the 2009 and subsequent SCID data into the production of SMI and AMI estimates has not
been finalized. One approach would be to identify a new “best” prediction model each year using the
additional clinical interview data. However, given the small size of the SCID subsample, the updated model
would likely introduce substantial variability that would make trend analysis difficult. Data from the 2009
SCID sample produced parameter estimates similar to those from 2008, providing evidence that the 2008
models are reasonable. Therefore, the 2008 WHODAS model, parameter estimates, and cut points were used
by SAMHSA to produce 2009 national estimates of SMI and AMI prevalence (4.8% and 19.9%, respectively).
SAMHSA plans to continue to apply the 2008 model for 2010 estimation, but to re‐evaluate after more SCID
data are accumulated in 2011 and 2012.
Estimation of the Variance of SMI & AMI
Currently, the variance that has been estimated for SMI and AMI assumes that the prediction model is
correct and the estimated parameters from the prediction model are the “true” parameters. That is, the
calculation of the standard errors does not take into account the variability incurred by using a small sample
based model to calculate predicted values which are then used to produce estimates of SMI and AMI. A
study is currently underway to investigate methods for estimating the “true” variance.
Determining an Optimal Sample Design for Model‐Based & Direct Estimates
Since one of the initial goals of the MHSS was to develop models for estimating SMI, the sample design
oversampled cases with higher K6 scores and had very low sampling rates for cases with K6 scores below 4.
In addition, the main NSDUH sampling rates varied by age and state. The resulting extreme variation in
sampling weights created difficulties in the analysis, particularly due to the small number of cases with very
large weights (primarily older adults with low K6 scores) that were diagnosed with SMI in the SCID. In
addition, the shift in focus to include the estimation of AMI created a need for a more balanced design, so
SAMHSA made adjustments to the sampling rates to attempt to address this, increasing the sampling rates
for low K6 scores (beginning July 2009) and reducing the sampling rate for 18–25 year olds (beginning
January 2010). However, a clear approach to make decisions about the design of the SCID subsample has yet
to be determined.

40
Nonresponse Bias
Since the recruitment for the MHSS occurs after the main NSDUH interview is completed, there is a
depth of information available for both the respondents and nonrespondents to the MHSS. This allows for
the evaluation of nonresponse bias between the NSDUH interview and the clinical interview. Differences
between MHSS respondents and nonrespondents on demographic variables as well as substance use, health
status, and mental health status are being investigated. Preliminary results showed that adults sampled who
initially refused to participate had much lower rates of mental health problems than NSDUH respondents,
while those not completing the SCID interview after agreeing to participate (and collecting the $30
incentive) had rates similar to NSDUH respondents. Analyses will evaluate whether there is a relationship
between the main study key outcome variables and propensity to respond, whether persons with low
response propensities are similar to nonrespondents on key outcome measures, and whether there is a
relationship between response propensity and the clinical mental health measures collected through the
SCID. Results from these analyses will be used to assess the nonresponse bias and to better inform the
adjustment for nonresponse via weighting.
Bias Corrected Alternative Estimators of SMI & AMI
The prediction model yielded estimates that are unbiased for the overall adult population because the
chosen cut‐point equalized the weighted numbers of false‐positive and false‐negative counts of SMI.
However, the false‐positive and false‐negative counts may not necessarily be equally distributed within
population subgroups. Within some domains, therefore, the models may yield biased estimates of mental
illness. Studies are underway that investigate alternative estimates of mental illness that correct for this bias
within domains.
Disorder Specific Estimates Using Data from the SCID
Although the primary goals of the MHSS study were to produce model‐based estimates of SMI and
AMI, the nationally representative SCID data potentially could be used to produce direct estimates of
specific mental disorders. Direct disorder‐specific estimates have been generated for each year of data
collection, for 2008, 2009, and 2010, and by combining 2008–2010 data. Preliminary results indicate that
disorder‐specific estimates produced separately for each year of collection were unstable and affected by
extreme weights, leading to a decision to not publish estimates at this time, but investigations are
continuing.
REFERENCES
Aldworth, J., Colpe, L. J., Gfroerer, J. C., Novak, S. P., Chromy, J. R., et al. (2010). The National Survey on Drug
Use and Health Mental Health Surveillance Study: Calibration analysis. International Journal of Methods in
Psychiatric Research, 19(Suppl.1), 61–87.
Colpe, L. J., Barker, P. R., Karg, R. S., Batts, K. R., Morton, K. B., Gfroerer, J. C., et al. (2010). The National Survey
on Drug Use and Health Mental Health Surveillance Study: Calibration study design and field procedures.
International Journal of Methods in Psychiatric Research, 19(Suppl.1), 36–48.
First, M. B., Spitzer, R. L., Gibbon, M., & Williams, J. B. W. (2002). Structured clinical interview for DSM‐IV‐TR Axis I
Disorders, research version, Non‐patient Edition (SCID‐I/NP). New York State Psychiatric Institute, Biometrics
Research.

Proceedings of the 10th Conference on Health Survey Research Methods 41
Jackson, J. S., Torres, M., Caldwell, C. H., Neighbors, H. W., Nesse, R. M., Taylor, R. J., et al. (2004). The National
Survey of American Life: A study of racial, ethnic and cultural influences on mental disorders and mental
health. International Journal of Methods in Psychiatric Research, 13, 196–207.
Jordan, B. K., Karg, R. S., Batts, K. R., Epstein, J. F., & Wiesen, C. A. (2008). A clinical validation of the National
Survey on Drug Use and Health assessment of substance use disorders. Addictive Behaviors, 33, 782–798.
Kessler, R. C., Abelson, J., Demler, O., Escobar, J. I., Gibbon, M., Guyer, M. E., et al. (2004). Clinical calibration of
DSM‐IV diagnoses in the World Mental Health (WMH) version of the World Health Organization (WHO)
Composite International Diagnostic Interview (WMH‐CIDI). International Journal of Methods in Psychiatric
Research, 13, 122–139.
Kessler, R. C., Barker, P. R., Colpe, L. J., Epstein, J. F., Gfroerer, J. C., Hiripi, E., et al. (2003). Screening for serious
mental illness in the general population. Archives of General Psychiatry, 60, 184–189.
Kessler, R. C., Berglund, P. A., Walters, E. E., Leaf, P. J., Kouzis, A. C., Bruce, M. L., et al. (1998). A methodology
for estimating the 12‐month prevalence of serious mental illness. In R. W. Manderscheid & M. A.
Sonnenschein (Eds.), Mental Health, United States, 1998 (Center for Mental Health Services, DHHS Pub No.
SMA 01‐3537, pp. 99–109). Washington, DC: U.S. Government Printing Office.
Leon, A. C., Olfson, M., Portera, L., Farber, L., & Sheehan, D. V. (1997). Assessing psychiatric impairment in
primary care with the Sheehan Disability Scale. International Journal of Psychiatry in Medicine, 27(2), 93–105.
Novak, S. P., Colpe, L. J., Barker, P. R., & Gfroerer, J. C. (2010). Development of a brief mental health impairment
scale using a nationally representative sample in the USA. International Journal of Methods in Psychiatric
Research, 19(Suppl.1), 49–60.
Rehm, J., Üstün, T. B., Saxena, S., Nelson, C. B., Chatterji, S., Ivis, F., et al. (1999). On the development and
psychometric testing of the WHO screening instrument to assess disablement in the general population.
International Journal of Methods in Psychiatric Research, 8, 110–123.
Substance Abuse and Mental Health Services Administration, Center for Mental Health Services. (1993, May 20).
Final notice [Final definitions for: (1) Children with a serious emotional disturbance, and (2) Adults with a
serious mental illness]. Federal Register, 58(96), 29422–29425.
Substance Abuse and Mental Health Services Administration. (2010). Results from the 2009 National Survey on Drug
Use and Health: Mental health findings. NSDUH Series H‐39, DHHS Publication No. SMA 10‐4609. Rockville,
MD: Center for Behavioral Health Statistics and Quality.

42

Proceedings of the 10th Conference on Health Survey Research Methods 43
Planned Missing Data Designs in Health Surveys David R. Johnson, Veronica Roth, and Rebekah Young (The Pennsylvania State University)
When designing a survey, researchers often must decide whether to abandon standard measures for
shorter measures. Many survey methods are designed for relatively short data collection instruments (Groves
et al., 2004). Telephone, Web, or mail surveys all require strict limits on the amount of information to be
gathered to insure high response rates, reduce respondent burden, and increase the validity of the responses
obtained. Long survey instruments can lead to increased respondent burden and satisficing—the tendency to
answer with little cognitive effort, which decreases response validity (Krosnick, 1991). Researchers usually
have two choices for keeping the survey instrument at a reasonable length: (1) decrease the number of
concepts measured, which may decrease the utility of the data gathered, including the validity of the findings,
and (2) measure multi‐item scales with shortened scales or single items. For example, instead of using a full
standard 30‐item scale, a researcher may select only ten items to ask. This strategy may reduce reliability and,
perhaps more importantly, hinder comparisons with published studies that use the full scales.
Planned missing designs (also referred to as matrix sampling) present a third option for health
researchers. The length of a questionnaire can be reduced by decreasing the number of scale items asked of
each participant, while the information still can be analyzed as if the full standard scale measures were used.
This method retains full reliability and comparability to studies using complete measures. The cost is in
statistical power; research goals requiring full statistical power should be assessed by measures and items
collected from all study participants. Other research objectives can be addressed with lower statistical power
for certain items or scales less central to the principal aims of the study. Scales or items in the questionnaire
that do not require the statistical power of the full sample could benefit from a planned missing data design.
In a planned missing (PM) data design, entire sections of an instrument may be omitted for certain
respondents, or respondents may receive only a partial version of a given section (Belin, Datt, Desmond, &
Ganz, 1999). Items or scales to be included are randomly assigned to each respondent. A common PM
design is the three‐form design (Graham, Taylor, Olchowski, & Cumsille, 2006); it includes a set of items
asked of everyone plus three randomly assigned sets of items, one set of which is included on each form,
such that respondents receive two‐thirds of the total survey items. Many other designs are conceivable, such
as including a smaller percentage of the items asked or using more forms (Schafer & Graham, 2002). With
multiple‐item scales, either the whole scale can be dropped from a random sample of the surveys, or each
respondent can be given a random subsample of the scale items (Graham et al., 2006). The main requirement
is that for every pair of items in the survey, there should be a subset of respondents who answer both items.
The relative sample size of these pairs affects the standard errors obtained when the data are analyzed
(Bunting, Adamson, & Mulhall, 2002). Loss of statistical power is a concern, though it is often substantially
smaller than researchers expect if efficient imputation methods are used (Enders, 2010). When items with
PM data are correlated with other items included in the survey, the power lost can be quite small. In a
simulation study with inter‐item correlations of 0.3 and a three‐form design leaving 33% of data missing,
Enders (2010) found power for the covariances with the smallest proportion of cases to be within 90% of the
power without a PM design. When the inter‐item correlations were .1, however, the power for these was
reduced to only 20% of that found when the PM design was not used. Because scale items tend to be
substantially correlated with other items in the scale, a PM design to reduce the scale length is expected to
have little impact on statistical power.

44
Accounting for all the observed data with a PM design requires that the analyst use modern techniques
for the treatment of missing data. The most widely used techniques are multiple imputation (MI) and full
information maximum likelihood (FIML) methods. MI replaces missing values with sets of plausible ones,
accounting for the uncertainty arising from missing values by running the analysis on multiple data sets
with complete information for all variables (Little & Rubin, 2002). Maximum likelihood techniques,
commonly found in structural equation software (e.g., Mplus, Amos), allow for the estimation of
multivariate models with incomplete data matrices. Recent developments in these techniques and user‐
friendly, accessible software have increased the practical utility of PM designs and the range of analysis
models that can be applied (Johnson & Young, 2011).
In this paper, we describe the application of a three‐form planned missing design to three health‐related
scales in the National Survey of Fertility Barriers (NSFB). The NSFB is a nationally representative probability
sample of 4,700 women, ages 25–44, interviewed by telephone (Johnson & White, 2009). The study was
designed to assess social and health factors that relate to the reproductive choices and infertility of American
women. The theoretical model that guided this study built on medical health service utilization and help‐
seeking models. Multiple outcome, structural, and intervening variables were needed to test facets of the
model. These included factors that contributed to help‐seeking for infertility and social psychological, social
structural, and economic outcomes for women and their partners. Due to budget reductions, a desire to limit
respondent burden, and limitations of the survey mode, it was necessary to restrict the interview to an
average length of 30–35 minutes. This required reducing the number of items in 21 multi‐item scales
measuring key concepts. We sought the shortest standard measures with acceptable reliability and validity
then further reduced the number of items in some scales based on a pilot study conducted with 580 women
living in Midwestern states. These steps helped reduce the length of the survey, but further reduction was
necessary. We decided that a PM approach would reduce the survey length but still permit us to assess all
the measures needed to meet study objectives.
We focus on only three of the health‐related scales that all respondents were eligible to answer: (1) a ten‐
item version of the CES‐D depression scale (Andresen, Malmgren, Carter, & Patrick, 1994), (2) a Medical Locus
of Control Scale (Wallston, Wallston, & Devellis, 1978), and (3) an eight‐item scale constructed for this study
that assessed respondents’ attitudes about the ethics of infertility treatments (Ethics of ART). The PM design
and the wording of the items from the three scales used can be found in Appendix A. For the 21 scales
included in the survey, including the three we focus on here, the scale items were divided into three sets. For
each scale, one in five respondents was randomly selected to receive all items. Otherwise, each respondent
received two of the three sets, the third set having been omitted at random. Because selection into the PM
design occurred for each scale and for each respondent, all respondents were likely to have a shortened
version of at least one of the scales. Overall, there were 96 items in the 21 scales subject to the PM design. For
respondents who were eligible for all scales, the average number of excluded survey items was 38; this
resulted in a savings of approximately five minutes in survey length. Respondents who neither had infertility
problems nor sought treatment for infertility saved less time.
The three‐form PM design we implemented differs from the designs described in the literature (Enders,
2010; Graham et al., 2006). With a conventional design, the entire instrument, rather than specific scales, is
divided into parts—three subject to being dropped in the PM design and a fourth asked of every
respondent. This is a practical strategy for paper‐and‐pencil questionnaires because only four versions must
be designed and printed. A computer‐assisted telephone interviewing (CATI) system offers researchers
greater design flexibility because there can be as many versions of the questionnaire as there are
respondents. In the NSFB design, each scale was divided into three parts, each containing approximately

Proceedings of the 10th Conference on Health Survey Research Methods 45
two‐thirds of the scale items, and separate random numbers were used to assign each scale to each
respondent. This strategy had the advantage of increasing the randomness of the distribution of PM items
and reducing problems estimating higher‐order interaction effects among variables appearing in different
forms (Graham et al., 2006). In our design, no restrictions are imposed on the levels of interaction effects
between scales that can be estimated.
Rather than dropping items within scales, an alternative strategy, also designed for the flexibility of a
CATI system, is the random dropping of entire scales. This approach simplifies the process of imputing the
PM data and incorporating whole scales into analyses with FIML methods. Imputation is simplified because
the imputation model can be set to impute summated scale scores rather than the actual items, which
greatly reduces the number of variables in the imputation model. Maximum likelihood approaches require
the estimation model to include equations that combine items for the linear creation of scale scores. For
scales with many items, computation time would increase substantially, as well as the odds of failed
estimation. Dropping whole scales, however, has been found to yield lower power then dropping a fraction
of scale items (Graham et al., 2006). We choose the item‐level approach because of plans to use some single
items from the scales in analyses and because some of the investigators on the project had concerns about
deleting whole scales for some respondents. The large number of variables in the dataset that needed to be
imputed complicated, but did not prevent, the imputation of a dataset which accounted for all PM values.
The specific PM design we used appeared to be unique; no other surveys using a similar design could be
found. We added components to our design to aid in evaluating the quality of the data obtained and to
assess whether our design would affect the substantive results. Beginning about one‐third of the way into
the data collection process, we decided to modify the basic PM design by randomly selecting one of five
respondents to receive all items in a scale. This allows us to compare characteristics and reliability of the
scales that did and did not include a PM component. To reduce potential selection bias, we restrict our
analysis here to respondents interviewed after the design change occurred. This reduced our sample size to
approximately 2,700 respondents.
IMPUTING WITH A PM DESIGN
The missing data that occurs with a PM design has been randomly assigned, and is therefore missing
completely at random (MCAR). When data are MCAR, the statistical characteristics (mean, distribution, etc.)
of the variable are unbiased estimates of the values that would have occurred had all cases been observed.
This pattern of missingness allows for use of imputation and maximum likelihood methods to maximize use
of the data that were observed. Compared to maximum likelihood approaches, imputing PM values is
advantageous as a general data analysis strategy because it generates a complete data matrix, though both
strategies yield nearly indistinguishable results in multivariate models (Johnson & Young, 2011). For the
NSFB data, an imputed version of the PM design items was included in the public release data set. We
evaluate imputation strategies in this paper.
A number of imputation approaches have been developed and described elsewhere (Johnson & Young,
2011; Schafer & Graham, 2002). One widely implemented approach has been the normal multiple
imputation model, implemented in several forms in SAS, Stata, SPSS, R, and others. When the missing data
are MCAR or missing at random (MAR), this approach yields proper unbiased estimates that take into
account the uncertainty introduced by the missing values. Multiple data sets (five or more) are generated
that vary only in the values assigned to the missing data. Statistical analysis is conducted separately in each

46
data set, and the separate estimates are combined using Rubin’s Rules so that the standard errors reflect the
uncertainty of each imputed value.
The normal model requires the assumption that all variables are quantitative and continuous, with a
multivariate normal distribution. As a result, the imputed values follow a normal continuous probability
distribution. Although measures rarely conform to this assumption, simulation studies have shown that the
method is quite robust to violations. The imputed values in the normal model are also likely to assume
decimal values and values beyond the range of the observed data. For example, a variable with four ordinal
categories (1, 2, 3, 4) may be imputed with a decimal (e.g., 2.87) or outside the range (e.g., 4.92). For
applications involving multivariate models that rely on variables’ covariance (e.g., regression and structural
equation models), the univariate distribution of the imputed values is of little concern, and, therefore, it is
entirely appropriate (and recommended) to leave imputed values “as is.”
For other uses, particularly when a large fraction of the data are imputed, discrepancies between the
distribution of observed values and missing values may be problematic, as imputed values will follow a
normal distribution even when the observed distribution is quite different. Some scales may have
established cutoff scores that indicate pathology, for example, but these cutoff points may be biased if the
distributions of the imputed data vary widely from the distribution of the observed data. Here we evaluate
three strategies that can be used to solve this problem. The first is to use an imputation approach that treats
the response categories as nominal and uses multinomial regression to generate the imputed values. This
“tailored” approach does not require the fully normal assumption for the imputed variables and usually
leads to distributions that more closely approximate the observed distribution. The second approach we use
here is to calibrate the imputed values to match the observed distribution. Yucel, He, and Zaslavsky (2008)
developed a procedure for calibrating the values under a MCAR model. We have implemented this
approach in a Stata ado, available by request from the authors. A third common strategy is to round the
values to fit within the observed range. This “naïve” rounding strategy modifies the imputed values to
parallel the observed values but does not yield matching distributions and may create biased estimates
(Horton, Lipsitz, & Parzen, 2003). While this strategy is not advisable, we include it here because it is
commonly employed with implausible values.
A final strategy for handling missing values in scales is to use information only from the available items.
For example, if observed values are available for six of the ten items in the scale, the mean of the six items
can be computed and used for that respondent. If a summated score for the scale is used, the mean can then
be multiplied by the total number of items in the scale to yield the same range. Schafer and Graham (2002)
describe this approach and conclude that, although it is not optimal, it is likely to yield reasonably unbiased
estimates, particularly if the missing pattern is MCAR.
These data were imputed using the ICE program in Stata. The imputation models were informed by all
items in the three scales used here and an additional set of three variables in the data set, which were used
to improve predictions of the unknown values. We generated 25 imputed data sets. One set of imputed
values employed the normal model and assumed all variables were quantitative and continuous. Next,
these values were modified in two ways: (1) the imputed values were calibrated using the Yucel, He, and
Zaslavsky (2008) method and (2) the values were rounded and recoded to fit the observed range. The
tailored model also was generated with ICE, using a multinomial logistic regression as opposed to linear
regression, for the predictive equations for the imputed values. The scales were created as summated scores
after the item‐level data were imputed; we created an available‐item scale score from the mean of available
(nonmissing) items, multiplied by the total number of scale items. We also present results from a subsample

Proceedings of the 10th Conference on Health Survey Research Methods 47
of respondents who were asked to respond to the full scale. For the purposes of this study, we did not use
the sample weights.
FINDINGS
We begin by examining descriptive information on each version of the three scales. Table 1 presents the
averaged means and standard deviation of each version from each of the 25 imputed data sets. Each strategy
produced very similar results. For the CES‐D scale, the mean score rounded to two digits was 17 for all, but
varied slightly with more digits of accuracy. The respondents who received all items had the lowest mean
and the available‐item strategy produced the highest standard deviation. Mean and standard deviations of
the various versions of the other two scales were also very similar.
Table 1 also presents the Cronbach’s alpha reliability coefficient for each version of the scales, except the
available‐items scale, for which alpha cannot be calculated. These were remarkably similar to each other and
to the reliability for respondents receiving all items. The planned missing design did not result in a loss of
scale reliability. The CES‐D was the only scale where alpha was slightly higher for those not in the PM
design. We conclude that a PM design with imputed data can yield scale reliability estimates approximately
the same as would be found if no PM design were used.
Table 2 presents the correlations among the different estimates for the respondents in the PM design. For
all three scales, the mean of the available items had the lowest average correlations with the imputed
estimates. All correlations were over 0.9, many in the 0.99 range. We conclude that the approaches yield
similar estimates as indicated by the high correlations among them.
Table 1. Descriptive Information & Alpha Reliability of the Scales
CES‐D
(10 items) Medical Locus of Control
(6 items) Ethics of ART Scale
(8 items)
CODING OF PM RESPONSES Mean SD Alpha Mean Mean SD
Alpha Mean Mean SD
Alpha Mean
Respondent received all items (no PM) 16.67 4.94 0.82 17.44 2.34 0.74 13.04 3.77 0.84Available items scale 17.02 5.05 — 17.63 2.91 — 12.95 3.82 —Imputed with normal model 17.00 4.84 0.80 17.61 2.67 0.78 12.97 3.70 0.85Calibrated imputed normal model 16.96 4.78 0.79 17.61 2.60 0.76 12.97 3.64 0.84Imputed with tailored (multinomial) model 17.02 4.86 0.80 17.59 2.68 0.78 12.99 3.69 0.85Naïve rounding of normal model 17.20 4.68 0.79 17.59 2.66 0.77 13.03 3.62 0.85
Table 2. Correlations among Five Strategies for Handling PM Values for the Three Scales
PM M
ETHOD USED
CESD Mean of Available Items (M) CES‐D (M) CES‐D (N) CES‐D (T) CES‐D (C)
CESD Normal (N) 0.971 CESD Tailored (T) 0.970 0.950 CESD Calibrated (C) 0.971 0.992 0.951 CESD Rounded normal (R) 0.974 0.994 0.953 0.994
Ethics Mean of Available Items (M) Ethics (M) Ethics (N) Ethics (T) Ethics (C)
Ethics Normal (N) 0.930 Ethics Tailored (T) 0.934 0.943 Ethics Calibrated (C) 0.934 0.986 0.944 Ethics Rounded Normal (R) 0.936 0.987 0.946 0.995
Medical Locus Mean of Available Items (M) MLOC (M) MLOC (N) MLOC (T) MLOC (C)
Medical Locus Normal (N) 0.931 Medical Locus Tailored (T) 0.929 0.914 Medical Locus Calibrated (C) 0.921 0.986 0.910 Medical Locus Rounded Normal (R) 0.926 0.988 0.908 0.9904

48
Similarities in the means,
standard deviations, and high
correlations may still result in
different distributions, which
may have substantive
consequences when using the
PM approach. In the next step,
we compared the distributions
resulting from the different
approaches. Because the
calibrated approach is likely to
reflect the distribution at the
item level most accurately, we
compare the distributions of the
calibrated imputed sample with
the distributions of the scales in
the subsample of respondents
who were given all items.
Figure 1 compares the distributions for the CES‐D, using a kernel density estimator. As can be seen, the
distributions are very similar. For this scale which has used cutoffs for determination of depression
pathology, we also compared the cumulative frequency distributions to determine the proportion of cases
below cutoffs of 20 and 30. The percentage of values above the cutoff in both cases ranged from the same to
within 0.1%. Distributions were also similar for the Ethics of ART scale.
Figure 2 compares the distributions for the calibrated version of the imputation to the all‐item version of
the Medical Locus of Control Scale. While very similar, the difference in distributions is larger than was
observed for the CES‐D scale. The distribution in the no‐PM subsample was more peaked, with a greater
proportion of the cases falling near the mean and fatter tails for the calibrated measure. We explore possible
reasons for this difference in a
later table.
In Table 3 we explore
whether there were differences in
the scales depending on the
specific set of items that were
excluded in the PM design. In
this model we use regression
analysis to examine differences in
the scores depending on the set
of items received by the
respondent. The PM set used was
coded into dummy variables,
with the omitted (reference)
group consisting of the set in
which respondents received all
items. For the CES‐D scale, only
0.0
2.0
4.0
6.0
8.1
Dens
ity
10 20 30 40CESD Scale Score
No PM subsample
Calibrated Imputed subsample
Kernel Density DistributionFig. 1. CESD Scale distribution for No PM sample and Calibrated Imputed Sample
0.0
5.1
.15
.2.2
5D
ens
ity
10 15 20 25Medical Locus of Control Scale Scores
No PM subsample
Calibrated Imputed subsample
Kernel density distribution
Fig 2. Medical Locus of Control Scale Distribution for No PM and Calibratred Imputed samples

Proceedings of the 10th Conference on Health Survey Research Methods 49
one set (set 1) was significantly different from the respondents receiving all items, and only for the available‐
items version. For all other versions, there was no significant difference between the PM sets and the non‐
PM group. For the Ethics scale, two sets differed significantly with the available item measure, but only set 2
differed significantly for all but the rounded version. Set 2 yielded significantly lower mean scores for the
scale. This might reflect the exclusion of items on egg donation and in vitro fertilization (IVF). For the Medical
Locus of Control Scale, all three sets differed significantly from the scores of those receiving all items on the
available‐items measure, but only set 2 differed significantly from this group for the other four measures.
When the scale was asked without items 3 and 4 (“When I get sick, I am to blame” and “If I take care of
myself, I can avoid illness”) higher scores were obtained in all versions. When the responses to the
individual items in the scale were examined, the only items with significantly higher scores for set 2 were
the last two items on the scale. Apparently, omitting items 3 and 4 affected how items 5 and 6 were
answered—perhaps evidence for an effect of item ordering on responses. These results raise cautions that
omitting items may alter the responses to the remaining items in the scale.
The final table selects two variables in the data set, a Life Satisfaction Scale and Self‐Reported Health,
and explores differences using a regression model in the effects of the three scales on these outcomes in
equations, including a number of background and control variables. We only present results for the
available‐item, normal imputed, and calibrated normal models. Results from the other models (by request)
are similar to the results reported here. The three ways of handling the PM data had little effect on results
for both outcome variables. The largest differences in the b‐coefficients is found for the effect of the Medical
Locus of Control Scale on Life Satisfaction, where the effect was substantially smaller for the normal
imputed version than for the calibrated and available‐item mean versions.
Table 3. Regression Models of Scales on PM Set Asked of Respondent†
Available Items Normal Model Calibrated Normal Tailored Model Rounded NormalSCALE b b b b b
CESD Scale Set 1 0.672* 0.227 0.088 0.228 0.438Set 2 –0.037 0.247 0.202 0.278 0.449Set 3 –0.292 –0.303 –0.250 –0.274 –0.113Constant 16.937 16.941 16.940 16.944 16.942
Ethics of ART Scale Set 1 0.436* 0.039 0.031 0.031 0.108Set 2 –0.393 –0.473* –0.414* –0.472* –0.371Set 3 –0.412* 0.163 0.105 0.170 0.216Constant 13.045 13.028 13.032 13.028 13.035
Medical locus of Control Scale Set 1 –0.379* 0.009 0.091 –0.008 –0.026Set 2 1.378** 0.442** 0.307* 0.414** 0.437**Set 3 –0.370* 0.169 0.211 0.126 0.145Constant 17.446 17.442 17.443 17.442 17.442† Respondents asked all scale items are the comparison group. *p < .05, **p < .01.

50
Table 4. Regression Models for Effects of Three Ways of Coding PM Data on Life Satisfaction & Self‐Reported Health
Life Satisfaction Scale† Self‐Reported Health
(1 = Poor, 4 = Excellent)‡
Mean of Available Items
Normal Imputation
CalibratedNormal
Imputation
Mean of Available Items
Normal Imputation
CalibratedNormal
Imputation INDEPENDENT VARIABLES b b b b b b
CESD Scale –0.109*** –0.114*** –0.114*** –0.025*** –0.026*** –0.027***Ethics of ART Scale –0.082 ‐0.012 –0.020 –0.068 –0.007 –0.008Medical Locus of Control Scale 0.176*** 0.118*** 0.189*** 0.016** 0.017** 0.017**Constant 11.170*** 14.170*** 11.080*** 3.566*** 3.562*** 3.589***N 2,658 2,708 2,708 2,658 2,708 2,708Adjusted R2 0.321 0.315 0.314 0.276 0.269 0.277†Controlling for religiosity, economic hardship, biomedical barriers to conception, presence of a chronic illness, self‐report of health, presence of mental illness, self‐admission of infertility, age, education, marital status, race, and religion. ‡ This controls for all variables in the first model except self‐reported health. *p < .05, ** p < .01, ***p < .001.
DISCUSSION & CONCLUSIONS
Our findings suggest that a planned missing approach is a viable option for assessing health‐related
scales when there are concerns about respondent burden and interview length. Our analysis demonstrated
that when proper tools and methods are used to impute the values for variables excluded by the PM design,
the measures yield reliable scales with means and distributions closely matched to what would be found if
all the items had been queried. Although imputing the PM data can be an onerous and time‐consuming task
increasing the analyst burden, particularly if there is a desire to impute all PM data in a large survey, new
imputation and calibration tools are available that can facilitate this process. If the researcher chose to leave
the PM missing values in the data set and only deal with missing data in the analysis of specific research
problems, then the presence of these missing cases would be less of a chore. In this circumstance, it is likely
that the researcher would need to impute missing data for other variables also, and the imputation of the
planned missing values would be carried out as part of that process.
The most serious concern we encountered that suggests some caution in using a PM design such as used
here was the evidence that omitting items in the middle of a scale may affect responses to items asked later.
It would be possible to avoid this ordering effect in two ways. First, items can be randomly rotated to reduce
an order effect. Second, a PM design can be used that randomly drops whole scales for some of the survey
respondents. The advantage of this second approach is that everyone assessed on the scale gets the same set
of items. The disadvantage is some reduction in statistical power.
Many possible types of PM designs can be tailored to the specific needs of the research. These need not
follow the basic three‐form design or the design used here. The proportion of respondents dropped for
specific questions can also be smaller or larger depending on the needs of the research. For example, in a
large survey of health care utilization in 15 markets with over 10,000 respondents, there was an interest in
assessing whether social desirability response tendencies may have affected reports of adherence to
physicians’ recommendations. Including a multiple‐items social desirability scale on all surveys would
increase respondent burden and distract from the main objective of the study. Including the scale on only a
random fraction of the respondents, perhaps even as little as 25–50%, and imputing values for the rest,
would allow the social desirability scale to be included in multivariate models without decreasing the
power of other variables but would still test for social desirability effects.

Proceedings of the 10th Conference on Health Survey Research Methods 51
REFERENCES
Andresen, E. M., Malmgren, J. A., Carter, W. B., & Patrick, D. L. (1994). Screening for depression in well older
adults: Evaluation of a short form of the CES‐D (Center for Epidemiologic Studies Depression Scale).
American Journal of Preventative Medicine, 10(2) 77–84.
Belin, T. R., Datt, M., Desmond, K., & Ganz, P. A. (1999, August). Comparing imputation of entire subscales versus
individual items in a study of quality of life following cancer. Paper presented at the Joint Statistical Meetings of
the American Statistical Association, Baltimore.
Bunting, B. P., Adamson, G., & Mulhall, P. K. (2002). A Monte Carlo examination of an MTMM model with
planned incomplete data structures. Structural Equation Modeling: A Multidisciplinary Journal, 9(3), 369–389.
Enders, C. K. (2010). Applied missing data analysis. New York: Guilford Press.
Graham, J. W., Taylor, B. J., Olchowski, A. E., & Cumsille, P. E. (2006). Planned missing data designs in
psychological research. Psychological Methods, 11(4), 323–343.
Groves, R. M., Fowler, F. J. Jr., Couper, M. P., Lepkowski, J. M., Singer, E., et al. (2004). Survey methodology.
Hoboken, NJ: John Wiley and Sons.
Horton, N. J., Lipsitz, S. R., & Parzen, M. (2003). A potential for bias when rounding in multiple imputation. The
American Statistician, 57(4), 229–233.
Johnson, D. R., & Young, R. (2011). Toward best practices in analyzing data sets with missing data: Comparisons
and recommendations. Journal of Marriage and Family, 73, 926–945.
Johnson, D. R., & White, L. K. (2009). National Survey of Fertility Barriers [Computer File]. Population Research
Institute [distributor]. University Park, PA: The Pennsylvania State University.
Krosnick, J. A. (1991). Response strategies for coping with the cognitive demands of attitude measures in surveys.
Applied Cognitive Psychology, 5(3), 213–236.
Little, R. J. A., & Rubin, D. B. (2002). Statistical analysis with missing data (2nd ed.). New York: John Wiley and Sons.
Schafer, J. L., & Graham, J. W. (2002). Missing data: Our view of the state of the art. Psychological Methods, 7(2),
147–177.
Wallston, K. A., Wallston, B. S., & Devellis, R. (1978). Development of the multidimensional health locus of
control (MHLC) scales. Health Education Monographs, 6(1), 160–170.
Yucel, R. M., He, Y., & Zaslavsky, A. M. (2008). Using calibration to improve rounding in imputation. The
American Statistician, 62(2), 125–129.

52
Appendix. Items & Planned Missing Design for the Three Scales
Planned
Missing Set
Scale Question Wording 1 2 3
CES‐D†
1 I was bothered by things that usually don’t bother me. x x2 I had trouble keeping my mind on what I was doing. x x3 I felt depressed. x x4 I felt that everything I did was an effort. x x5 I felt hopeful about the future. x x6 I felt fearful. x x7 My sleep was restless. x x x8 I was happy. x x9 I felt lonely. x x10 I could not get going. x x
MLOC‡
1 If I get sick, it is my own behavior which determines how soon I get well again x x2 I am in control of my health x x3 When I get sick, I am to blame x x4 If I take care of myself, I can avoid illness. x x5 If I take the right actions, I can stay healthy. x x6 The main thing which affects my health is what I myself do x x
Ethics*
1 Helping a woman get pregnant by inseminating her with her husband or partner’s sperm? x x2 Helping a woman get pregnant by inseminating her with sperm from a donor. x x3 Using In vitro fertilization, or IVF. x x4 Using the eggs of a donor. x x5 Using a surrogate mother. x x6 Using a gestational carrier. x x
7 Some medical procedures used to help people have children increase the chance of twins, triplets, or more.
x
x
8 When a large multiple pregnancy occurs, it is possible to remove some of the fetuses in order to reduce the risk to the remaining fetuses. For example, it is possible to reduce a quadruplet pregnancy to a twin pregnancy.
x x
† The response options were read in this order: (1) rarely or never, (2) some of the time, (3) quite a bit of the time, or (4) all the time. Items 5 and 8 were reverse coded. High scores indicate more depression. ‡ The response options were given as: Please indicate whether you (4) strongly agree, (3) agree, (2) disagree, or (1) strongly disagree. High scores indicate greater control. * The response options were given as: Do you think this causes (1) no ethical problem, (2) some ethical problems, or (3) serious ethical problems? High scores indicate greater ethical problems.

Proceedings of the 10th Conference on Health Survey Research Methods 53
Advancing the Measurement of Health Status and Health Behaviors through Modern Test Theory
Adam Carle (University of Cincinnati)
1. INTRODUCTION
Health surveys frequently rely on fallible self‐report data, with participants reporting on themselves.
Thus, they typically measure participants’ health statuses and behaviors only indirectly. This leads to
challenges. In this paper, I briefly review some of these challenges and discuss modern test theory and
related measurement models as tools for addressing them. These models include item response theory
(IRT), confirmatory factor analysis (CFA), and structural equation modeling (SEM)‐based models (e.g.,
multiple group [MG] multiple cause multiple indicator [MIMIC]). Each uses mathematical models to
describe how individuals respond to questions. Equations describe the relations among item responses, and
equations’ parameters provide empirical assessments of the questions’ measurement properties. With them,
one can make empirically based decisions about measurement quality.
2. CHALLENGES IN MEASURING HEALTH STATUSES AND BEHAVIORS
2.1 Reliability
When measuring constructs indirectly, random measurement error influences measurement (McDonald,
1999), leading to unreliable measurement. Reliability refers to the concept that, if respondents answered a
set of questions under the same circumstances, they should give the same answers each time (McDonald,
1999). Despite best efforts, random measurement error will influence responses. Without reliability, it is
unclear whether survey responses have captured the construct of interest. With high reliability, one feels
confident that random measurement error does not influence responses. Respondents would consistently
receive a similar value on the question(s) of interest. Low reliability suggests that respondents may give a
response or receive a score based on random measurement error rather than their “true” status.
Subsequently, any research or decisions would be based in error. To date, too little survey research has
addressed reliability (Carle, Blumberg, Moore, & Mbwana, 2011).
When survey research has addressed reliability, it has tended to use the traditional classical test theory
approach (Carle et al., 2011), which treats reliability as a constant. It does not allow for the possibility that
some questions may provide more reliable measurement at higher (or lower) health status levels (Embretson
& Reise, 2000). For example, consider a question that asks respondents to describe illegal behavior related to
alcohol use. Respondents may dwell on the question due to its sensitive nature. This could lead to
consistent, reliable responses. However, describing legal behavior may not cause as much concern. Thus,
respondents may provide less consistency in these responses. If this occurs, the questions would provide
excellent reliability for individuals engaging in illegal behavior (likely those with high problem levels), but
poorer reliability for those with less severe problems. Researchers should acknowledge that reliability can
differ across construct levels (Carle et al., 2011).
Parameters in measurement models explicitly address this possibility. In SEM‐based models, loadings
describe how strongly questions relate to the construct (Bollen, 1989). In IRT, the discrimination parameters
provide similar information (Hambleton, 1985). High loadings or discrimination parameters indicate
questions that provide reliable measurement. A second set of parameters in the models indicate at what

54
construct level responses prove
most reliable. In IRT, location
parameters give the level of the
underlying construct at which
respondents are more likely than
not to endorse an item (Embretson
& Reise, 2000). Thresholds provide
similar information in SEM
(Muthén, 1984). Responses to
questions are most reliable at the
threshold (in SEM) and
discrimination (in IRT) values.
Figure 1 provides an example of
an item characteristic curve (ICC).
One can generate ICCs from both
SEM‐ and IRT‐based models.
Values of the measured construct fall along the x‐axis, while the y‐axis reflects the probability of endorsing
the question. The ICC depicts how the probability of endorsing the question changes as levels of the
construct increase. At low levels, individuals will not likely endorse the question. At the location (threshold)
parameter’s value, the probability that an individual will endorse the question surpasses 50%. The slope of
the curve reflects reliability. The steeper the curve, the more reliably the question discriminates between
individuals at a given level of the measured construct (Embretson & Reise, 2000).
Using ICCs, a researcher can examine whether responses to a question tend to provide reliable
measurement (e.g., is the ICC steep?) and at what levels responses provide their most reliable measurement
(e.g., where is the ICC steepest?). If a researcher seeks to reliably measure a construct across all levels, one
would want a set of questions with steep ICCs but with location/threshold parameters dispersed across
levels of the construct. Alternatively, if seeking to measure only one level of a construct, one would want a
set of questions with steep ICCs but with location/threshold parameters clustered around a specific
construct level. In this way, health survey methods researchers can make empirically informed decisions
about which questions to include on a survey questionnaire.
2.2 Internal Validity
As a second challenge, measurement in health surveys may lack internal validity. Health surveys often
use a set of questions to measure a single construct (e.g., alcohol dependence) and subsequently create a
summary score based upon the set. If the researcher expects that the questions measure a single construct,
internal validity refers to the extent to which empirical data support the hypothesis that the questions
measure a single construct (McDonald, 1999). Scoring systems should have internal validity in order for the
scores to have meaning. Unfortunately, few studies have examined internal validity in health surveys.
0.0
0.2
0.4
0.6
0.8
1.0
‐3 ‐2 ‐1 0 1 2 3
Probab
ility of Response
Construct Level
Figure 1. An Example Item Characteristic Curve

Proceedings of the 10th Conference on Health Survey Research Methods 55
2.3 Measurement Bias
Health surveys also should
have equivalent internal
validity and psychometric
properties across various
subpopulations (e.g., Whites,
Blacks, Hispanics). The
possibility exists that
participants respond to
questions about themselves
differently depending on their
social and economic (SES)
backgrounds or other
characteristics. This possibility,
a form of systematic
measurement error often
labeled measurement bias or
differential item functioning (DIF), refers to the fact that two individuals with an identical underlying health
status may nevertheless respond differently to questions asking about their health. For example, two people
with equivalent alcohol dependence behavior levels may respond differently to questions about their
alcohol use due to culturally divergent beliefs about discussing their alcohol use. One may feel free to discuss
his/her behavior, while the other does not. Thus, despite equivalent pathology, the two would appear
dissimilar based on their responses to questions. As a result, efforts to understand individuals’ health based on
their responses to questions about their health would include systematic flaws (see Figure 2).
Measurement bias leads to the possibility that observed health disparities may reflect measurement bias
rather than true differences. This leaves unclear whether the results of health surveys across subpopulations
reflect true differences or bias. Bias can obscure differences, decrease reliability and validity, and render
group comparisons impossible (Carle, 2009a; 2009c). Without establishing equivalent measurement, the field
cannot (1) draw strong conclusions about disparate outcomes, (2) support evidence‐based practice and
policy, or (3) address health disparities.
Modern test theory and related measurement models offer a powerful set of models capable of tackling
the challenges identified above (Bollen, 1989; Carle, 2010; Hu & Bentler, 1998; Muthén, 1989). However, little
work integrates these models into health survey research, impeding the advances they could bring. In
addition to investigating bias, these methods can correct for bias, allowing more valid comparisons across
groups. These models have seen few applications in health survey research methods. Thus, I briefly describe
them here and provide an example of using them to evaluate a set of survey questions about alcohol
dependence.
3. MEASUREMENT MODELS AS A SOLUTION
3.1 Multiple Group Multiple Indicator Multiple Cause Models
SEM‐based Multiple Group Multiple Indicator Multiple Cause (MG‐MIMIC) models offer a potent
method to investigate the psychometric properties of health surveys, including whether one can form a
single summary score based upon responses and whether responses to questions provide suitable reliability
Measurement bias
Systematically flawed
subpopulation estimates of
White
Black
Hispanic
Incorrect evaluation
No measurement bias
Correct subpopulation estimates of disparities
White
Black
Hispanic
Correct evaluation
Figure 2. An Example of Measurement Bias’ Influence on Population Health Measurement

56
and internal validity, both generally and equivalently across subpopulations. MG‐MIMIC models extend
“traditional” models by incorporating additional background variables as covariates in SEM (Jones, 2003;
2006; Carle, 2010; Muthén, 1989). Rather than limiting analyses to a single variable as traditional approaches
do, the MG‐MIMIC approach simultaneously controls for differences in responses due to some variables
(e.g., education and income) and allows an investigation of bias across another (e.g., race or ethnicity)(Carle,
2010; Jones, 2006). Moreover, MG‐MIMIC models provide empirical measures of internal validity (Bollen,
1989). With them, one can directly examine the validity of creating a single summary score.
First, consider the model. Let ∗ equal the individual’s score on the ordered‐categorical item
(question), let the number of items equal p (j = 1, 2,...p), and let the number of item responses range (0, 1,…s).
For simplicity, consider a dichotomous item (i.e., responses 0 or 1). The model assumes that a latent
response variate, ∗ , determines responses. The variate corresponds to the idea that, although observed
responses fall into discrete categories (e.g., no/yes), an underlying continuum represents the possible
responses. A threshold value on the variate determines responses. If an individual’s value on the latent
response variate is less than the threshold, the individual won’t endorse the item (i.e., will say “no”), but, if
their value is greater than the threshold, the individual will endorse the item. Formally:
if ∗ (1)
where is the latent threshold parameters for the dichotomous item. As noted above, one can use the
thresholds to estimate the level of the construct at which individuals will likely endorse an item.
Further suppose that some factor(s), η, is responsible for responses ∗ relates to the factor(s) as follows:
Y∗ Λ η ε (2)
is a latent intercept parameter, λ is an r x 1 vector of factor loadings for the variable on r factors, is
the r x 1 vector of factor scores for the person, and is the unique factor score for that person. The
loadings, similar to correlations, represent the degree to which an item relates to the factor(s); the greater the
value of the factor loading, the greater the relation between the item and the latent variable. As noted above,
the loadings provide an indication of reliability. Intercept parameters give the expected value of an item
when the value of the underlying factor(s) is zero. Uniquenesses include sources of variance not attributable
to the factor(s). As a result, the uniquenesses also provide information about reliability. As a uniqueness
value increases, the reliability of an item decreases (Bollen, 1989; Carle, 2010).
Through two equations, MG‐MIMIC models expand Equation 2 to include background covariate(s) that
can directly influence the latent variable’s measurement and the latent variable itself. The first allows the
covariate to directly influence the measurement of the latent trait:
Y∗ Λ η Γ x
(3)
The second, a structural equation, allows the covariate to predict the latent variable:
Γ x ζ
(4)
describes the latent trait’s mean value, ζ indicates residuals in the structural model, and captures the
covariate’s influence on the latent variable.
To investigate bias, one subscripts measurement parameters to allow for group differences. Then, one
constrains some or all of the measurement parameters to equality across groups and tests the constrained
model’s fit compared to a less constrained model. If fit indices indicate the constraints’ acceptability,

Proceedings of the 10th Conference on Health Survey Research Methods 57
measurement equivalence exists. If not, bias presents. Once one has developed a final model, one can use
model‐based estimates to compare the health of various groups, removing the error that bias introduces.
In the remainder of the manuscript, using data from the National Epidemiologic Survey on Alcohol and
Related Conditions (NESARC) (Grant, Kaplan, Shepard, & Moore, 2003), I describe a MG‐MIMIC analysis. I
show how measurement bias as a function of income, educational attainment, and minority status can lead
to erroneous conclusions about alcohol dependence. I show how model‐based estimates can mitigate this
error (Carle, 2010).
3. METHODS
3.1 Participants
Participants (16,109 non‐Hispanic White [hereafter White], 4,072 non‐Hispanic Black/African‐Americans
[hereafter Black], and 4,819 Hispanic) were a subset of the 2001–2002 NESARC data designed and sponsored
by the National Institute for Alcohol Abuse and Alcoholism. The original sample consisted of 43,093
noninstitutionalized U.S. adults age 18 and older. The complex multistage design oversampled Black,
Hispanics, and adults age 18–24. Sample weights adjust the data to make it representative (Grant, Kaplan, et
al., 2003). My analyses included White, Black, and Hispanic participants with complete data who reported
on their alcohol consumption in the past 12 months.
3.2 Measures
Alcohol Dependence. Alcohol dependence is a maladaptive alcohol use pattern that leads to significant
impairment or distress. It demonstrates at least three of seven criteria identified by the DSM‐IV (American
Psychiatric Association, 1994). The NESARC’s Alcohol Use Disorder and Associated Disabilities Interview
Schedule‐IV (Grant, 1997; Grant, Dawson, & Hasin, 2001; Grant et al., 2003; Grant, Harford, Dawson, &
Chou, 1995; Harford & Muthén, 2001; Hasin, Grant, & Cottler, 1997; Hasin & Paykin, 1999), uses 27
dichotomous items (0 = Yes, 1 = No) to operationalize these criteria. My analyses used all 27.
Ethnicity. Five options coded race. A single item allowed Hispanic self‐identification. I considered
individuals White if they identified as White and non‐Hispanic, Black/African‐American if they identified as
Black/African‐American and non‐Hispanic, and Hispanic if they identified as Hispanic.
Income. Participants reported their total past 12 months’ personal and family incomes. From this, the
NESARC estimated household income (hereafter income). I used centered income, which allowed me to
interpret bias attributable to this variable in terms of how differences from the average income level.
Educational attainment. I used centered years of education.
3.3 Analytical Approach
I examined measurement invariance following the method described by Millsap and Yun‐Tein (2004),
Carle (2010), and Woods (2009). I used fit index levels identified by the literature (Hu & Bentler, 1998; 1999;
Steiger, 1998): After identifying bias using omnibus fit criteria, I used item level comparisons to identify the
source of bias and modify the model accordingly. Constraints that led to significantly decreased fit
identified bias. I subsequently freed these constraints to develop a partial invariance model. All analyses
used Mplus, its theta parameterization and robust weighted least squares estimator, and appropriately
incorporated the complex sampling design and weights in Mplus (Muthén & Muthén, 2009). I used zero‐
weighting (Korn & Graubard, 2003) to create the subsample (Carle, 2009b; Korn & Graubard, 2003).

58
4. RESULTS
4.1 Evaluating Internal Validity
I first examined whether the question set measured a single construct. This provided a test of whether
data reflected the theoretical assumption that responses measured alcohol dependence only and whether
alcohol dependence appears to be a single construct (Harford & Muthén, 2001l; Muthén, 1995). Thus, I tested
a single factor alcohol dependence model (Model 1) across Whites, Blacks, and Hispanics. Model 1 allowed
income and educational attainment each to have direct effects on each of the items (within statistical
identification limits) and allowed income and educational attainment to correlate.
For statistical identification, Model 1 fixed the factor mean and variance at one and zero for Whites,
while freely estimating the Black/African‐American and Hispanic means and variances. Additional
statistical identification constraints required constraining all groups’ item intercepts to zero, fixing the direct
effect of income and educational attainment on the “usual number of drinks had less effect” item to zero in
all groups, constraining the loading for the “drinks” item to equality across the groups, constraining the
threshold for the “drinks” item to equality across the groups, and fixing the uniquenesses to one for all
groups. This method used the “anchoring” method described by Woods (2009). Model 1 included no other
constraints. Model 1 fit the data well (RMSEA = 0.014; CFI = 0.98; TLI = 0.98; 2 = 2918.43, 1151; n = 25,000; p < 0.01). This provided evidence for internal validity within and across the groups.
4.2 Evaluating Measurement Bias
Given good fit, I tested Model 2, which constrained the direct effects of income and educational
attainment to zero across all groups. These constraints led to statistically significant misfit (2 = 355.197; 156; n = 25,000; p < 0.01), indicating bias as a function of income and educational attainment. Item‐level
analyses showed that 14 equality constraints led to misfit. Table 1, which provides the parameters for the
final model, details the differences across the groups. Model 2b relaxed the misfitting constraints. Model 3
modified Model 2b to constrain the loadings to equivalence across groups. This examined whether the items
provided similar reliability and related similarly to alcohol dependence across Whites, Blacks, and
Hispanics, after accounting for bias due to income and educational attainment. Constraining the loadings
resulted in statistically significant misfit (2 = 94.646, 52; n = 25,000; p < 0.01) indicating bias as a function of race/ethnicity. Analyses indicated that five equality constraints led to the misfit (see Table 1). Model 3b
relaxed these constraints. Model 4 modified Model 3b to constrain the thresholds to equality across Whites,
Blacks, and Hispanics. This examined whether affirmative item endorsements had similar likelihoods across
race and ethnicity. Constraining the thresholds resulted in statistically significant misfit (2 = 280.608, 52; n = 25,000; p < 0.01), indicating bias. Analyses showed that 17 equality constraints led to misfit (see Table 1).
The final model relaxed these constraints. Summarily, analyses revealed statistically significant bias across
race, ethnicity, income, and education.

Proceedings of the 10th Conference on Health Survey Research Methods 59
Table 1. Final Partially Invariant Measurement Model (bolded values correspond to statistically significantly different values across groups) WHITES BLACKS HISPANICS
ITEM Loadings ThresholdsIncome's Effect
Education's Effect Loadings Thresholds
Income's Effect
Education's Effect Loadings Thresholds
Income's Effect
Education's Effect
Usual number of drinks had less effect 1.301 –2.662 0 0 1.301 –2.662 0 0 1.301 ‐2.662 0 0
Needed to drink more to get desired effect 1.975 –4.141 0 0 1.975 –4.141 0 0 1.975 ‐4.136 0 0
Drank equivalent of fifth of liquor in one day 1.110 –2.862 0 0 1.110 –2.862 0 0 1.11 ‐2.876 0 0
Increased use to get desired effect 2.006 –4.563 0 0 2.006 –4.563 0 0 2.006 ‐4.516 0 0
More than once wanted to stop or cut down 1.109 –2.033 –0.067 0 1.109 –1.686 0 0 1.109 ‐1.911 0 0.168
More than once tried unsuccessfully to stop or cut down 1.253 –3.490 0 0 1.253 –3.071 0 0 1.253 –3.139 0 0.285
Ended up drinking more than intended 2.033 –2.860 –0.081 –0.108 2.033 –3.079 0 0 2.033 –3.453 0 0
Kept drinking longer than intended 2.103 –3.181 –0.117 0 1.790 –3.181 0 0 2.103 –3.806 0 0
Trouble falling asleep when alcohol's effects wore off 1.083 –2.563 –0.129 –0.298 1.225 –3.082 0 0 1.083 –2.91 0 0
Shook when alcohol's effects wore off 1.52 –3.839 0 0.008 1.52 –4.327 0.739 0 1.52 –4.065 0 0
Felt anxious or nervous when alcohol's effects wore off 1.666 –3.986 0 0 1.666 –4.477 1.186 0 1.666 –4.213 0 0.278
Nausea when effects of alcohol wearing off 1.262 –2.146 0 –0.083 1.262 –2.146 0.008 0 1.262 –2.274 0 0
Felt unusually restless when alcohol's effects wore off 1.416 –3.155 –0.064 0 1.416 –3.381 0 0 1.416 –3.217 0 0
Sweat/heart beat fast when alcohol's effects wore off 1.268 –2.997 –0.085 0 1.268 –2.997 0 0 1.268 –3.33 –0.126 0
See, felt, heard things when alcohol's effects wore off 1.089 –3.809 0.272 0 1.089 –3.809 0 0 1.089 –3.886 0 0
Had fits or seizures when alcohol's effects wore off 1.037 –4.510 0 0 1.037 –4.51 0 0 1.037 –4.652 0 0
Had bad headaches when alcohol's effects wore off 1.160 –1.846 –0.046 –0.172 1.16 –2.193 0 0 1.16 –1.928 0 0
Drank or used drugs to get over alcohol's bad effects 1.152 –3.055 0 –0.108 1.152 –3.055 0 0 1.152 –2.998 0 0
Drank or used other drugs to avoid getting over alcohol's bad effects 1.224 –3.489 0 0 1.224 –3.489 0 0 1.224 –3.574 0 0
Spent lot of time drinking 1.633 –3.787 0 0 1.633 –3.787 0 0 1.633 –4.1 –0.15 0
Spent lot of time getting over drinking's aftereffects 1.466 –4.206 0 0 1.466 –4.206 0 0 1.466 –4.286 –0.163 0
Gave up or cut down important activities to drink 2.344 –6.215 0 0 3.88 –10.325 0 0 2.344 –6.21 0 0
Gave up or cut down pleasurable activities to drink 2.548 –6.949 0 0 2.548 –6.949 0 0 2.548 –6.874 0 0
Continued to drink though made depressed 1.766 –4.433 0 0 1.766 –4.433 0 0 1.766 –4.485 0 0
Continued to drink even though causing health problem 1.284 –3.271 0 0 1.284 –3.271 0 0 1.284 –3.388 0 0
Continued to drink despite prior blackout 1.404 –3.427 –0.063 0 1.404 –3.889 0 0 1.404 –3.667 0 0
Found could drink less than before to get desired effect 0.567 –1.369 0 0 0.567 –1.369 0 0 0.567 –1.546 0 0
Alcohol Dependence Factor Mean 0 0.019 –0.180
Alcohol Dependence Factor Variance 1 1.042 1.022

60
Figures 3 though 5 graphically
demonstrate examples of the
influence of bias on responses. They
present the ICCs across Whites,
Blacks, and Hispanics for the
“Trouble falling asleep” question.
Figure 3 gives the ICCs for Whites
above average income and
education. Figure 4 gives the ICC
for Whites with below average
income and education. Because
these variables did not directly
influence measurement for Blacks
and because the ICCs did not differ
visually for these groups, Figure 5
presents a single ICC for these
groups. As seen, bias most visibly
influences measurement when
respondents will likely to say “No”
to the question. As the figure
reveals, Whites with above average
education and income are more
likely to say “Yes” to this question
than Whites with below average
education and income, Blacks, or
Hispanics. This group is only 1.5
standard deviations below mean
dependence levels before they will
likely endorse the question, as
opposed to the others who are not
likely to endorse the question until
they are nearly 3.5 standard
deviations below meandependence levels.
4.3 Mitigating Measurement Bias
The presence of significant bias
indicates that one should not use
unadjusted scores to measure
alcohol dependence. Rather, one
should use model‐based estimates
of alcohol dependence levels to
mitigate systematic error. I
compared model‐based estimates
0.0
0.2
0.4
0.6
0.8
1.0
‐5 ‐4 ‐3 ‐2 ‐1 0 1
Probab
ility of Response
Alcohol Dependence Levels
Figure 3. ICC for the “Fall Asleep” Question for Whites with above Average Education and Income after Adjusting Measurement Parameters for Measurement Bias
0.0
0.2
0.4
0.6
0.8
1.0
‐5 ‐4 ‐3 ‐2 ‐1 0 1
Probab
ility of Response
Alcohol Dependence Levels
Figure 4. ICC for the “Fall Asleep” Question for Whites with below‐Average Education and Income after Adjusting Measurement Parameters for Measurement Bias
0.0
0.2
0.4
0.6
0.8
1.0
‐5 ‐4 ‐3 ‐2 ‐1 0 1
Probab
ility of Response
Alcohol Depedence Levels
Figure 5. ICC for the “Fall Asleep” Question for Blacks & Hispanics after Adjusting Measurement Parameters for
Measurement Bias

Proceedings of the 10th Conference on Health Survey Research Methods 61
that resulted from the final model incorporating measurement differences to estimates that resulted from a
model ignoring bias. Under the model ignoring bias, Whites served as the reference group and had a mean
of zero (for statistical identification). Both Blacks and Hispanics had greater means (MBlack = –0.07:z = –2.86;
MHispanic = –.211:z = –8.88), than Whites where negative values reflect more use. However, under the model
mitigating bias, Blacks no longer differed significantly from Whites (MBlack = 0.019:z = 0.28) and, while
Hispanics still had greater alcohol dependence levels (MHispanic = –0.18:z = –2.325), the disparity was
somewhat smaller.
5. DISCUSSION
In this study, I sought to provide an example of how measurement models can provide an empirically
informed method of meeting some of the challenges facing health survey research methodologists. I aimed
to show how to use an SEM‐based model (MG‐MIMIC) to evaluate internal validity. And, I aspired to show
the importance of empirically evaluating measurement bias. Additionally, I sought to demonstrate how bias
can influence analytic results and how model‐based techniques can mitigate this.
5.1 Addressing the Challenges
In the current example, results supported the notion that one can create a summary score of severity
from these questions. Individuals lower on this score will have greater levels of alcohol use behavior related
to dependence. Second, income, educational attainment, and race and ethnicity all directly influenced
alcohol dependence measurement. Without accounting for this bias, one would conclude that Hispanics and
Black demonstrate significantly greater amounts of alcohol dependence behavior than Whites. However,
after using model‐based estimates that corrected for bias, model‐based estimates clarified that only
Hispanics demonstrate lower amounts of alcohol dependence behavior in comparison to Whites and that
Blacks do not differ significantly from Whites. These findings highlight that research must consider whether
group differences (or similarities) reflect true differences or result from bias.
5.2 Limitations & Additional Challenges
First, stakeholders often require dichotomous indicators. The method for combining and dichotomizing
the aggregate all affect reliability and validity. Health survey research has not sufficiently attended to this.
Carle et al. (in press) describe model‐based methods for creating and evaluating cut‐points. Second, the
validity of developing contextual‐level measures using individuals’ self‐reports remains relatively
unexplored. For example, how can (or should) a set of responses describing contextual aspects of an
individual’s environment be used to develop a contextual‐level measure? Multilevel (ML) SEM uses
individuals’ responses to estimate contextual‐level variables (Lüdtke et al., 2008; Muthén, 1991). This
approach explicitly recognizes that individuals’ responses include measurement error. In essence, ML‐SEM
capitalizes on the aspects of using model‐based estimates of reliability as described above and generalizes
them to the ML setting.
Third, survey research organizations often must make decisions about the number of questions to
include. For example, while it may be ideal to include 27 questions, respondent burden may require a
smaller set. By using the measurement parameters from the full question set, a methodologist could make
an empirically informed choice about which questions to include. The parameters allow methodologists to
target the construct levels of interest and maintain reliability. Finally, investigators should always seek to
demonstrate external as well as internal validity. External validity refers to whether a set of questions

62
actually measure the construct they purport to measure (McDonald, 1999). Though a description falls
beyond this paper’s scope, SEM‐based measurement work also can address external validity (Bollen, 1989).
It is worth mentioning some of this study’s limitations. First, the NESARC did not include a gold
standard against which to compare individuals’ responses. Responses may not validly reflect individuals’
true experiences. Second, NESARC estimates and models are sample‐based. These data may not accurately
reflect the population. Finally, the cross‐sectional nature of the data and lack of random assignment limit
causal conclusions regarding the influence of the variables included in the analyses.
5.3 CONCLUSION
In sum, health survey research faces a number of challenges with respect to measurement quality.
Model‐based methods provide a powerful conceptual and analytical framework for addressing these
challenges. They provide an empirical scaffold for addressing reliability and validity, for evaluating the
extent to which measurement bias influences efforts to evaluate health statuses across subpopulations,
provide a method for more validly aggregating individuals’ responses into contextual measures, and deliver
an empirical approach to evaluating the reliability and validity of cut‐points based on sets of questions.
Importantly, model‐based methods offer a tool to simultaneously investigate and mitigate bias. Hopefully,
future work will see these methods more frequently integrated in health survey research.
REFERENCES
American Psychiatric Association. (1994). Diagnostic and statistical manual of mental disorders (4th ed.). Washington,
DC: Author.
Bollen, K. A. (1989). Structural equations with latent variables. New York: Wiley.
Carle, A. C. (2009a). Assessing the adequacy of self‐reported alcohol abuse measurement across time and
ethnicity: cross‐cultural equivalence across Hispanics and Caucasians in 1992, non‐equivalence in 2001–2002.
BMC Public Health, 9, 60.
Carle, A. C. (2009b). Fitting multilevel models in complex survey data with design weights: Recommendations.
BMC Medical Research Methodology, 9, 49.
Carle, A. C. (2009c). Tolerating inadequate alcohol dependence measurement: Cross‐cultural invalidity of alcohol
dependence across Hispanics and Caucasians in 2001 and 2002. Addictive Behaviors, 34, 43–50.
Carle, A. (2010). Mitigating systematic measurement error in comparative effectiveness research in heterogeneous
populations. Medical Care, 48, S68.
Carle, A. C., Blumberg, S. J., Moore, K. A., & Mbwana, K. (2011). Advanced psychometric methods for developing
and evaluating cut‐point‐based indicators. Child Indicator Research, 4, 101–126.
Embretson, S., & Reise, S. P. (2000). Item response theory for psychologists. Mahwah, NJ: Erlbaum.
Grant, B. F. (1997). Convergent validity of DSM‐III‐R and DSM‐IV alcohol dependence: Results from the national
longitudinal alcohol epidemiologic survey. Journal of Substance Abuse, 9, 89–102.
Grant, B. F. (2000). Theoretical and observed subtypes of DSM‐IV alcohol abuse and dependence in a general
population sample. Drug and Alcohol Dependence, 60, 287–293.
Grant, B. F., Dawson, D. A., & Hasin, D. S. (2001). The Alcohol Use Disorder and Associated Disabilities Interview
Schedule‐DSM‐IV Version (AUDADIS‐IV). Bethesda, MD: National Institute of on Alcohol Abuse and
Alcoholism.
Grant, B. F., Dawson, D. A., Stinson, F. S., Chou, P. S., Kay, W., et al. (2003). The Alcohol Use Disorder and
Associated Disabilities Interview Schedule‐IV (AUDADIS‐IV): Reliability of alcohol consumption, tobacco

Proceedings of the 10th Conference on Health Survey Research Methods 63
use, family history of depression and psychiatric diagnostic modules in a general population sample. Drug
and Alcohol Dependence, 71, 7–16.
Grant, B. F., Harford, T. C., Dawson, D. D., & Chou, P. S. (1995). The Alcohol Use Disorder and Associated
Disabilities Interview Schedule (AUDADIS): Reliability of alcohol and drug modules in a general population
sample. Drug and Alcohol Dependence, 39, 37–44.
Grant, B. F., Kaplan, K., Shepard, J., & Moore, T. (2003). Source and accuracy statement for wave 1 of the 2001–2002
National Epidemiologic Survey on Alcohol and Related Conditions. Bethesda MD: National Institute on Alcohol
Abuse and Alcoholism.
Hambleton, R. K. (1985). Item response theory. Boston: Kluwer.
Harford, T. C., & Muthén, B. O. (2001). The dimensionality of alcohol abuse and dependence: A multivariate
analysis of DSM‐IV symptom items in the National Longitudinal Survey of Youth. Journal Studies of Alcohol,
62, 150–157.
Hasin, D. S., Grant, B., & Cottler, L. (1997). Nosological comparisons of alcohol and drug diagnoses: A multisite,
multi‐instrument international study. Drug and Alcohol Dependence, 47, 217–226.
Hasin, D., & Paykin, A. (1999). Alcohol dependence and abuse diagnoses: Concurrent validity in a nationally
representative sample. Alcoholism: Clinical and Experimental Research, 23, 144–150.
Hu, L., & Bentler, P. M. (1998). Fit indices in covariance structure modeling: Sensitivity to underparameterized
model misspecification. Psychological Methods, 3, 424–453.
Hu, L., & Bentler, P. M. (1999). Cutoff criteria for fit indexes in covariance structure analysis: Conventional criteria
versus new alternatives. Structural Equation Modeling, 6, 1–55.
Jones, R. N. (2003). Racial bias in the assessment of cognitive functioning of older adults. Aging & Mental Health, 7,
83–102.
Jones, R. N. (2006). Identification of measurement differences between English and Spanish language versions of
the Mini‐Mental State Examination. Detecting differential item functioning using MIMIC modeling. Medical
Care, 44(11 Suppl 3), S124–133.
Korn, E., & Graubard, B. (2003). Estimating variance components by using survey data. Journal of the Royal
Statistical Society: Series B (Statistical Methodology), 65, 175–190.
Lüdtke, O., Marsh, H. W., Robitzsch, A., Trautwein, U., Asparouhov, T., et al. (2008). The multilevel latent
covariate model: A new, more reliable approach to group‐level effects in contextual studies. Psychological
Methods, 13, 203–229.
McDonald, R. P. (1999). Test theory: A unified treatment. Mahwah, NJ: Erlbaum.
Millsap, R. E., & Yun‐Tein, J. (2004). Assessing factorial invariance in ordered‐categorical measures. Journal of
Multivariate Behavioral Research, 39, 479–515.
Muthén, B. (1984). A general structural equation model with dichotomous, ordered categorical, and continuous
latent variable indicators. Psychometrika, 49, 115–132.
Muthén, B. (1991). Multilevel factor analysis of class and student achievement components. Journal of Educational
Measurement, 28, 338–354.
Muthén, B. O. (1989). Latent variable modeling in heterogeneous populations. Psychometrika, 54, 557–585.
Muthén, B. O. (1995). Factor analysis of alcohol abuse and dependence symptom items in the 1988 National
Health Interview Survey. Addiction, 90, 637–645.
Muthén, L. K., & Muthén, B. O. (2009). Mplus User’s Guide. Los Angeles: Muthén & Muthén
Steiger. J. (1998) A note on multiple sample extensions of the RMSEA fit index. Structural Equation Modeling: A
Multidisciplinary Journal, 5, 411–419.
Woods, C. M. (2009). Empirical selection of anchors for tests of differential item functioning. Applied Psychological
Measurement, 33, 42.

64

Proceedings of the 10th Conference on Health Survey Research Methods 65
SESSION 1 DISCUSSION Graham Kalton (Westat)
The five papers in this session address the highly important issue of improving the survey measurement
of various aspects of health status and health behaviors. I start by reviewing the standard model for
measurement error and the methods that can be used for assessing the effects of measurement errors on
survey estimates, and then, in line with the treatment provided by Carle, I will discuss the need for more
elaborate models and assessment methods. I will then consider the use of measurement scales and discuss
specific aspects of the papers.
The basic model for measurement errors in survey responses dates back to Hansen, Hurwitz, and
Bershad (1961) and is discussed in the first edition of Cochran (1963). The model assumes that conceptually,
the survey questioning could be repeated over an infinite number of equivalent trials that employ identical
survey procedures under the same essential survey conditions. A sampled person may give different
responses to the different trials. The basic response error model is then
where represents the response of individual i on trial t, is the true value for individual i, is the
individual response bias for individual i, is the average response of individual i over all the
conceptually repeatable trials, and is the random deviation from this average response on trial t. This
general model thus expresses an individual’s response on a given trial as the sum of the individual’s true
value, the individual response bias, and a deviation specific to that particular trial. Under this general
formulation, both the individual bias and the individual response variance (the variance of the deviation
terms) may be different for each individual. The bias in the estimate of the overall population mean is the
average of the individual response biases ∑ / , where N is the population size and the overall response
variance is the average of the individual response variances ∑ / .
Various simplifying assumptions often are made within this general model. One common type of
assumption is that the response errors are simply random measurement errors. In this case, sample means
are unbiased. It is important to note, however, that correlations with other variables are attenuated, as are
regression coefficients when the variable in question is a predictor variable. There also is a loss in the
precision of the various estimates. Reliability (re‐interview) studies often are used to assess the extent of
random measurement errors in pilot studies (as in the pilot study for the National Health and Aging Trends
Study [NHATS] described by Kasper et al.) and sometimes also in ongoing surveys (e.g., the Current
Population Survey). Given the effects of random measurement errors on measures of relationships between
variables, I believe that reliability studies could usefully be conducted more often in conjunction with the
main surveys, where operational conditions are likely to be different from those applying in pilot studies.
As Carle notes, it is also useful to analyze reliability for subgroups since it may vary across them.
A variant of the completely random response error model assumes that interviewers affect responses so
that the random deviations are correlated for the set of respondents interviewed by the same interviewer.
Interviewer variance studies that randomly assign sample cases between interviewers are used to examine
this form of correlated error (often with restricted random assignment for ease of implementation). Again, I
think that greater use could be made of this type of study.
Unless individual response biases cancel out in the aggregate, they lead to a bias in the sample mean.
Validity studies, with an external “gold standard,” may be used to examine response biases. Researchers

66
often assume that the average bias is the same for different subgroups of the sample or across time for a
repeated survey. This assumption provides the justification for the commonly made, convenient argument
that, even though sample means may be biased, differences between subgroup means or means over time
are unbiased. However, as Carle notes, this assumption is highly questionable and deserves to be viewed
with much greater skepticism. The assumption is of particular concern in the growing area of multinational
surveys, where both attaining translation equivalence and cultural differences present severe challenges.
Furthermore, there are within‐country cultural and linguistic differences to consider.
Maitland et al. provide a good discussion of the challenges in achieving measurement equivalence in
health measures such as anxiety across a very diverse set of countries. Their approach started with cognitive
interviews in each country around four basic questions about the respondents’ experiences of anxiety. These
interviews provided some valuable insights into how respondents interpreted the questions, and then
questions about these interpretations were added to the field tests conducted in each country. The results
demonstrate the difficulties in making cross‐national comparisons. For example, the variability in the
reported rates of what Maitland et al. classify as impairments, limitations, and pathology is extremely large
and highly unlikely to reflect the true variability, thus making cross‐country comparisons very questionable.
The paper does an important service in demonstrating that one should not naïvely compare the simple
frequency rates across countries and in describing an approach for understanding the findings. However, it
still leaves open the taxing question of how to make valid cross‐country comparisons. In some situations,
another line of attack would be to conduct a study using anchoring vignettes to investigate variability across
countries in the response scales used by respondents, as has been done for a number of outcomes across
countries and across socioeconomic groups (e.g., Chevalier & Fielding, 2011; King, Murray, Saloman, &
Tandon, 2004; van Soest, Delaney, Harmon, Kapteyn, & Smith, 2011). The use of focus groups early in the
questionnaire design process and the recordings of field test interviews, using computer‐assisted recorded
interviewing (CARI) where possible, also could be informative.
Since measurement scales have been developed for many aspects of health, it is not surprising that
several of the papers discuss the application of such scales in health surveys. Carle points to the value of
item response theory (IRT) models for developing and assessing scales for health survey research. These
models are widely used in surveys of educational attainment. See, for example, the National Center for
Education Statistics (2009) for a description of the IRT models used in the National Assessment of
Educational Progress (NAEP). As Carle points out, analyses of differential item functioning (DIF) with such
models have the important benefit of being able to identify subgroups of the sample that respond differently
to specific items (e.g., subgroups defined by socioeconomic or racial characteristics, or by country in
multinational surveys).
A problem that frequently occurs in the application of existing health scales in surveys is that the full
scales are too long for easy administration. The most common approach for reducing respondent burden is
to cut the scale length by carefully choosing a subset of the items that retains high reliability. Cronbach’s
alpha coefficient of reliability often is used in selecting scale items and in assessing the reliability of the
reduced scale. When there are many scales to be administered, another approach for reducing respondent
burden is to give a different subset of scales to different subsets of respondents. This can be done to ensure,
for example, that all pairs of scales are administered to selected subsets of respondents. However, this
approach results in a reduction in the respondent sample size for each scale. In their paper, Johnson et al.
describe applying yet another approach uncommon in health surveys but widely used in education surveys
such as the NAEP. This planned missing design, also known as matrix sampling and the split or partial
questionnaire design, administers subsets of scale items to subsets of respondents in a balanced randomized

Proceedings of the 10th Conference on Health Survey Research Methods 67
way. Multiple imputation is then widely used to assign values for unasked items. For example, in NAEP,
each student receives only two of a possible ten booklets of test items, markedly reducing the burden on the
students yet still covering a large number of items across the sample; five values, termed plausible values,
are imputed for each missed item. In the field of health surveys, Thomas and colleagues (2006) evaluate the
use of matrix sampling for the National Health and Nutrition Examination Survey (NHANES).
The matrix sampling approach clearly reduces respondent burden, but that benefit needs to be balanced
against the added analytic complexity. First, there is the need for careful specification of the imputation
models, which need to incorporate all variables relating to subclasses for which estimates are required;
otherwise, the subclass estimates will be biased. This requirement presents a problem for public use data
sets since not all the subclasses of analytic interest can be foreseen. Also, as Johnson et al. discovered, there
is a risk of context effects affecting the responses, with a respondent’s answer to one item depending on
whether the respondent was asked another item. This interesting finding is a warning for the use of matrix
sampling since context effects are not that uncommon (Schuman & Presser, 1981). Second, the reduced
respondent burden is shifted to the analysts who need to apply multiple imputation variance estimation
procedures in their analyses. Researchers need to consider these issues in deciding whether it is necessary to
collect some responses for the full range of items across subsamples of respondents or whether a carefully
selected subset of items asked of all respondents will better serve their needs.
As discussed in this session, Gfroerer et al. used the more common approach of reducing the number of
items in their scaling: they reduced the number of items in the World Health Organization Disability
Assessment Scale (WHODAS) from 16 to eight based on an IRT analysis for use in the Mental Health
Surveillance System incorporated in the National Survey on Drug Use and Health (NSDUH). They also used
Kessler’s K6 scale. To develop a classification of whether a survey respondent had a serious mental illness, a
sample of respondents was assessed using a standard clinical diagnostic interview (the SCID), with a SCID
score of 50 or less being classified as a serious impairment. This classification was then taken to be the “gold
standard” and used as the dependent variable in a logistic regression, with the scores on the reduced
WHODAS and K6 scales as predictors. The results suggest that the regression fit may not have been that
strong, which could have occurred because the predictors were not strong and/or because the “gold
standard” was imperfect. Since “gold standards” are rarely perfect, it is useful to conduct evaluations of
such measurements—for example, by conducting reliability studies and perhaps interviewer variance
studies. For classification purposes, a cut point was determined on the predicted values so that the estimate
of the rate of serious impairment from the predicted values agreed with the rate determined from the SCID
for the full sample. This cut point was found to be 0.27, so that anyone with a predicted probability of over
0.27 was classified as seriously impaired. It thus appears that many individuals were misclassified and more
so in the case when the same approach was used to predict “any mental illness” where the cut point was
0.024. High levels of misclassification raise serious concerns about the quality of the estimates for subgroups
of the sample, where the predicted estimates may well diverge from the “gold standard” subgroup
estimates. See, for example, the subgroup results reported by Aldworth et al. (2010) for the Mental Health
Surveillance System classification. This problem arises in large part because of the common desire in health
survey research to classify persons as either having or not having a health condition, whereas in practice it is
often the case, as here, that they fall somewhere along a continuum for that condition.

68
The paper by Kasper et al. describes the experience of using in‐home performance tests of physical and
cognitive capacity in the pilot study for the NHATS.6 The growing interest in the use of performance tests in
survey research rather than relying solely on respondents’ reports is an important development because in
many areas, respondents’ reports of their capacities can be highly subjective, not reflecting reality. However,
as Kasper et al. discuss, conducting performance tests in an in‐home survey setting faces significant
operational challenges. Thus, it is not a simple step to add performance tests to regular interviews. Since
self‐reports will therefore remain the means for collecting information about respondents’ capacities in most
surveys, it is important that those surveys conducting performance tests also collect self‐reports as a bridge
to the data collected in other surveys. Although performance tests avoid the potential reporting biases of
self‐reports, it needs to be recognized that the data they provide are not error‐free. It is valuable to conduct
reliability studies to establish the extent to which a person’s performance changes from one administration
to another, as was done in the NHATS pilot study (see Freedman et al., 2011, for the results). Also, given the
demands on the persons administering the tests, it would be useful to conduct tester (interviewer) variance
studies. An attraction of performance tests over self‐reports is that the findings should be more comparable
across cultural groups and countries.
In summary, among other things, this session highlighted for me the following the measurement issues
in health survey research:
The assumption that responses in health surveys are comparable across different segments of the
target population and across countries in multinational surveys should not be adopted uncritically.
More research is needed to examine the validity of the underlying constant bias assumption, and
more effort is needed to develop well‐tested instruments that do yield comparable results for the
segments of interest.
More research is needed to develop effective, easily administered techniques for obtaining clinical
assessments and performance measures in in‐home survey settings. Assessing and reducing the
magnitude of the measurement errors in clinical assessments and performance measures also
warrants greater attention.
With the ongoing expansion in the number of health‐related scales for application in clinical settings,
there will continue to be a need to adapt these scales for survey settings. The benefits and costs of
alternative methods for doing so need to be examined on a case‐by‐case basis.
And, in all the measurement error research, the advances in techniques of statistical analysis that
have been made in the recent past can usefully be more widely exploited.
REFERENCES
Aldworth, J., Colpe, L. J., Gfroerer, J. C., Novak, S. P., Chromy, J. R., Barker, P. R., Barnett‐Walker, K., Karg, R. S.,
Morton, K. B., and Spagnola, K. (2010). The National Survey on Drug Use and Health Mental Health
Surveillance Study: Calibration analysis. International Journal of Methods in Psychiatric Research, 19(Supplement
1), 61–87.
Chevalier, A., & Fielding, A. (2011). An introduction to anchoring vignettes. Journal of the Royal Statsitical Society,
A, 174, 569–574.
Cochran, W. G. (1963). Sampling techniques (1st ed.). New York: Wiley.
6 I should disclose that I am a co‐principal investigator for the NHATS.

Proceedings of the 10th Conference on Health Survey Research Methods 69
Freedman, V. A., Kasper, J. D., Cornman, J. C., Agree, E. M., Bandeen‐Roche, K., Mor, V., et al. (2011). Validation
of new measures of disability and functioning in the National Health and Aging Trends Study. Journals of
Gerontology, Series A: Medical Sciences, 66A, 1013–1021.
Hansen, M. H., Hurwitz, W. N., & Bershad, M. (1961). Measurement errors in censuses and surveys. Bulletin of the
International Statistical Institute, 38, 359–374.
King, G., Murray, C. J. L., Salomon, J. A., & Tandon, A. (2004). Enhancing the validity and cross‐cultural
comparability of measurement in survey research. American Political Science Review, 98, 567–583.
National Center for Education Statistics. (2009). National Assessment of Educational Progress: Item scale models.
Available at http://nces.ed.gov/nationsreportcard/tdw/analysis/scaling_models.asp
Schuman, H., & Presser, S. (1981). Questions and answers in attitude surveys. New York: Academic Press.
Thomas, N., Raghunathan, T. E., Schenker, N., Katzoff, M. J., & Johnson, C. L. (2006). An evaluation of matrix
sampling methods using data from the National Health and Nutrition Examination Survey. Survey
Methodology, 32, 217–231.
Van Soest, A., Delaney, L., Harmon, C., Kapteyn, A., & Smith, J. P. (2011). Validating the use of anchoring
vignettes for the correction of response scale differences in subjective questions. Journal of the Royal Statistical
Society, A, 174, 575–595.

70

Proceedings of the 10th Conference on Health Survey Research Methods 71
SESSION 1 SUMMARY Karen CyBulski, Anne Ciemnecki, and Karen Bogen (Mathematica)
INTRODUCTION
William Arthur Ward, an American scholar, author, editor, pastor, and teacher, said, “The pessimist
complains about the wind; the optimist expects it to change; the realist adjusts the sails.” As survey
methodologists, we are the realists of the research community, and this was a session about adjusting sails.
The onus is upon us to measure progress toward our nation’s public health goals. It seems that every day
we are asked to do our work faster, more cost‐effectively, and more accurately than ever before. This session
addressed adjusting sails by using tests rather than self‐report of functional performance; adjusting by
reducing respondent burden by using planned missing data designs; adjusting for cultural differences by
understanding the response patterns of different cultures and seeking ways to standardize them (through
biomeasures or response to vignettes); and adjusting by using modern test theory and related measurement
models such as item response theory, confirmatory factor analysis, and structural equation‐based models
that provide empirical assessments of questions’ psychometric properties to make empirically based
decisions about the quality of our measurements.
AGENDA FOR FUTURE RESEARCH
How does performance testing of functional and cognitive abilities differ from self‐reported abilities
in the elderly?
What errors are inherent in performance tests of functional ability?
How can researchers determine and analyze the reasons for missing performance test data?
Can self‐reported data and performance test data be used together for validity?
What are the impacts of performance tests on future participation in interviews?
How does one balance the competing demands of cost, timeliness, accuracy, and burden of data
collection?
How can we be sure that when we reduce respondent burden we are not creating more analytic
complexity and cost? That is, how can we avoid replacing respondent burden with analyst burden?
How can we standardize differences in responses that are the result of cultural norms?
Are biomarkers and vignettes useful tools? This is especially important as new immigrants enter our
nation and our society becomes more diverse.
How can we, as survey researchers, use modern measurement theory to address the challenges we
face as we measure constructs indirectly?
How can these mathematical models help us (1) address reliability and validity, (2) evaluate the
extent to which systematic measurement error influences health statuses across subpopulations, (3)
provide a method for more validly aggregating individuals’ responses into contextual measures,
and (4) deliver an empirical approach to evaluating the reliability and validity of cut points based on
sets of questions?

72
RAPPORTEUR NOTES
After the five papers were presented and the discussant commented on the papers, the floor discussion
focused on four main themes: (1) potential errors in performance tests of functional abilities, (2) shifting
burden from the respondent to the survey management and analysis staff, (3) enhancing our understanding
of cultural differences, and (4) a deeper understanding of how to mitigate against context effects.
Potential errors in performance tests of functional abilities. The early part of the discussion focused on
the Kasper paper Advances in Survey Assessment of Disability in Older Adults: Measuring Physical and Cognitive
Capacity in the National Health and Aging Trends Survey. The discussion compared self‐report data on
functional ability with data collected through observations and performance tests. Participants in the
discussion pointed out that performance tests (1) are not necessarily objective and (2) not only have missing
data, but the reasons for the missing data vary and must be understood by those who analyze the
performance test data. As survey researchers, we legitimately question the objectivity of self‐reported
physical‐functioning data. Respondents may report about functions they think they can—but actually
cannot—accomplish. Do they know for sure that they can carry a ten‐pound bag of groceries, when they
never carry bags of groceries? Self‐reported data are subject to the perception of the reporter. Walking five
city blocks might be “good” for a respondent who used to run marathons. Another respondent might
consider walking 50 feet “good.” A third respondent might report her ability to walk 50 feet “excellent” but
have no conception of how far 50 feet is.
Like self‐reports, performance tests are subject to their own form of random and systematic errors. One
cognitive test asks for today’s date. Though instructed not to use a memory aid, respondents could look at
watches with date functions or at calendars that are in sight. Although interviewers are supposed to record
the use of such recall aids, they might not notice that the respondent relied on an aid. Knowing to consult
the recall aid to recollect an unknown date is not the same functional response as not knowing the date and
not having the cognitive context or anchor with which to find it.
Understanding missing data is important for interpreting performance test results. Reasons for missing
data vary: the respondent could refuse to perform the function, there could be a lack of room in the
respondent’s dwelling to conduct the performance test, or the interviewer could assume it would be unsafe
for the respondent to perform the test and skip over that performance measure. Interviewers must balance a
respondent’s ability to perform a measure based on how the respondent looks, while at the same time not
asking a respondent to perform a physical task that could bring him or her harm.
Performance tests, particularly cognitive tests, change the nature of the interviewing experience.
Performance measures (and collection of biomarkers) make the experience more interactive and build
rapport between the interviewer and the respondent. On one hand, they break the monotony of the
interviewer asking questions and the respondent answering. On the other hand, they may involve the
interviewer “touching” the respondent, which might make the respondent uncomfortable. Administering
cognitive tests is particularly uncomfortable for the interviewer if a respondent with diminished capacity
asks how he or she performed. We have not tested the impacts of performance measurement on future
survey participation. These measures have also changed our perspectives as data collectors. We can no
longer say, “There are not right or wrong answers to these questions,” and we must be diligent about
obtaining informed consent for the performance testing.
In light of this discussion, one participant reminded us that there are some objective data that can be
validated from other sources. He pointed out that, in principal, one can verify voting behavior from voter

Proceedings of the 10th Conference on Health Survey Research Methods 73
registration records. Thus, we should be cognizant of the sources of the data we are using and the resources
available to validate the data.
Shifting burden. Rebekah Young’s presentation of Planned Missing Data in Designs of Health Surveys
generated a discussion of balancing competing demands of cost, timeliness, accuracy, and burden. Her
missing data design saved five minutes of respondent burden, which is not trivial for large samples. It did,
however, require more complex programming and analysis, including multiple weights and imputation.
Shifting the burden from the respondent to the analyst could incur more cost. The group coined the term
analyst burden and suggested it might not be a fair trade‐off for respondent burden.
Response patterns are subject to cultural norms. Response patterns can vary by the respondent’s
culture and country of origin. Prevalence rates of mental disorders vary dramatically by country. Cultural
norms influence where responses on a scale fall. One presenter suggested that respondents in Asian cultures
avoid responding at the extreme endpoints of scales and those from Hispanic cultures are less likely to select
a scale’s midpoint. A participant wondered if there was a way to use biomeasures such as heart rate, blood
pressure, or even an MRI to adjust for these cultural differences in response. He proposed presenting a
standard stimulus, mapping how the respondent reacts to the stimulus, and recording biomeasures. Others
expressed that although interesting, the methodology lacked promise unless researchers understood the
meaning of the biomeasure. If we discover a biomeasure that performs the same across cultures and
countries of origin and correlates with the domain we are measuring, it could become an anchor for
adjusting responses to scales. Another participant suggested vignettes in a similar fashion. Though neither
biomeasures nor vignettes will overcome cultural differences, we should keep exploring them as means of
adjusting for cross‐cultural differences.
Mitigating against context effects. Participants questioned why we use questions that are sensitive to
context effects, and, further, why we use these questions to create scales. Although we are aware that
context effects exist, we do not test for them. In fact, as we add more questions and topics of interest, we
increase the likelihood of context effects. Question order matters more. Do performance measures reduce
measurement error or add to error based on the context of when and how the measures are introduced? Can
we use modern test theory to examine and overcome context effects?

74

Proceedings of the 10th Conference on Health Survey Research Methods 75
SESSION 2: Monitoring Health Care Reform ORGANIZERS: Timothy Beebe (Mayo Clinic), Michael Davern (NORC),
and Trena Ezzati‐Rice (AHRQ) CHAIR: Timothy Beebe

76

Proceedings of the 10th Conference on Health Survey Research Methods 77
Measuring Health Care Reform: Self‐Reports of Health Insurance Premium Assistance and Program in Social Surveys
Dianne Rucinski (Institute for Health Research and Policy, University of Illinois at Chicago)
Debates about health care reform raged during the 2008 election and dominated President Obama’s
agenda his first years in office. The resulting Patient Protection and Affordable Care Act and Health Care
and Education Reconciliation Act of 2010, jointly known as the Affordable Care Act (ACA), was more about
health insurance than health care. Because the high and escalating cost of health insurance is perceived as a
fundamental cause of uninsurance and underinsuance, the ACA contains numerous provisions ranging
from tax credits for individuals and small businesses to further expanding Medicaid to lower the cost of
coverage. When fully implemented, provisions of the ACA will expand eligibility for existing programs,
shift current program participants from existing programs into new programs, create new programs, and
provide tax‐funded subsidies for purchasing private plans. As designed, the ACA promises to significantly
alter health insurance access, premium assistance, and coverage in the United States. In addition, the act
offers states considerable latitude in how elements of support may be implemented at the state level; thus,
we might expect substantial variability at the state level in terms of program characteristics and eligibility
procedures. Accurate monitoring of the reach and impact of ACA will depend on solid survey measurement
of health insurance status and premium support.
This paper examines the implications of the ACA on how we measure health insurance coverage and
premium support in population surveys. After describing a set of provisions in the ACA that are expected to
have consequences for survey measurement of health insurance and premium support, I follow with brief
discussion of how three major health and economic surveys measure premium assistance. Next, using data
from a recent survey about health insurance coverage, I present data on the extent to which respondents can
and do report receiving health insurance subsidies and characteristics of those providing accurate and
inaccurate reports. Finally, I suggest an initial research agenda for exploring health insurance premium
assistance measurement.
PROVISIONS OF ACA FOR HEALTH INSURANCE COVERAGE & SURVEY RESPONSES
Because uninsured individuals are disproportionately lower income, many provisions of the ACA
concern subsidizing the health insurance for lower income individuals and families. Higher income
individuals and those in small group markets face affordability problems too because their premium rates
are often substantially higher than group market rates. The ACA contains provisions for subsidized
premium assistance in these instances as well. Subsidies can take the form of grants, direct expenditures, tax
exemptions, tax deductions, and tax credits. The ACA employs several of these approaches to lower the cost
of health insurance to the insured or employers of the insured (Table 1).
The ACA subsidies vary considerably with respect to their visibility to the end user, ranging from the
most transparent and intentional such as tax credits and tax deductions to the most hidden and passive such
as direct grants and expenditures to third parties (i.e., current and former employers and providers). In the
case of the former, individuals must actively document and petition for a tax rebate, a tax credit, or a tax
deduction. And the deliberate and often onerous steps necessary to establish program eligibility in the cases
of Medicaid, Medicare, and hundreds of other state and federal programs may render the fact of these
subsidies visible to individuals.

78
Table 1. Subsidy Provisions in ACA
Effective Date Provision
9/23/2010 Early retiree reinsurance program will provide direct reinsurance reimbursement to participating businesses for medical claims for retirees age 55 & older who are not eligible for Medicare & their spouses, surviving spouses, & dependents.
1/1/2011 Rebates to employers/individuals if an insurance company’s medical loss ratio is less than 85% (large group) or 80% (small group/individual policy).
1/1/2014 Expand Medicaid eligibility for individuals & families up to 133% FPL.
1/1/2014 Sliding fee subsidy for the direct purchase of health insurance policies through health insurance exchanges for families/individuals between 134–400% FPL.
1/1/2014 Tax credit for very small businesses to purchase health insurance for workers through health insurance exchange.
For the latter type of assistance, the end beneficiaries of these subsidies may have no direct knowledge
of the amount paid through the subsidy nor the services rendered covered by the subsidy. The assistance
does not go directly to them but to a third party. Since respondents can only retrieve what they hold in
memory, survey questions about health insurance subsidy or premium assistance must consider the extent
to which these subsidies are known or even knowable to recipients. The fact that many employees are not
aware of the extent to which their employers subsidize health insurance coverage appears to have motivated
one provision of the ACA—that which requires employers to disclose the value of the benefits they
provided beginning in 2012 for each employee’s health insurance coverage on the employees’ annual Form
W‐2s. Such efforts to make individuals aware of the value of employer‐paid health insurance subsidies is
but one indication that the challenge for survey researchers in assessing the impact of ACA will be the
development of survey tools that accurately capture the existence of subsidies.
The difficulty of accurately measuring health insurance coverage and type of coverage is well
established, as is the measurement of publicly sponsored program participation in general. Ample evidence
points to a systematic mismatch between survey reports of Medicaid enrollment and administrative records
(Blumberg & Cynamon, 1999; Davern, Klerman, Baugh, Call, & Greenberg, 2008; Kincheloe et al., 2006;
Lewis, Ellwood, & Czajka, 1998; Pascale, Roemer, & Resnick, 2009; Wheaton, 2007). This finding will not be
discussed further here. Rather, I focus on measurement of another type of subsidy—premium assistance. I
examine this phenomenon in the Health and Retirement Survey (HRS), Medical Expenditures Panel Survey
(MEPS), and National Health Interview Survey (NHIS).
APPROACHES MEASURING PREMIUM ASSISTANCE
The HRS, MEPS, and NHIS take similar approaches to capturing premium assistance and are similar in
wording of the questions used to explore characteristics associated with premium assistance reports
described later in this paper.
The MEPS and NHIS directly ask whether the respondent or another entity pays some or all of the
premium. This approach focuses on identifying other entities that may contribute to paying premiums. In
neither the MEPS nor the NHIS premium questions are response categories read to respondents, which may
prompt recall of premium assistance. Both questions assume that the respondent is aware that the total cost
of the premium is higher than the individual portion of the premium the respondent might pay and assume
this information is salient to the respondent. Neither the MEPS nor the NHIS includes elements of program
eligibility that may help respondents self‐identify or prompt recall. Neither notes behaviors in which
respondents must engage in order to gain assistance.
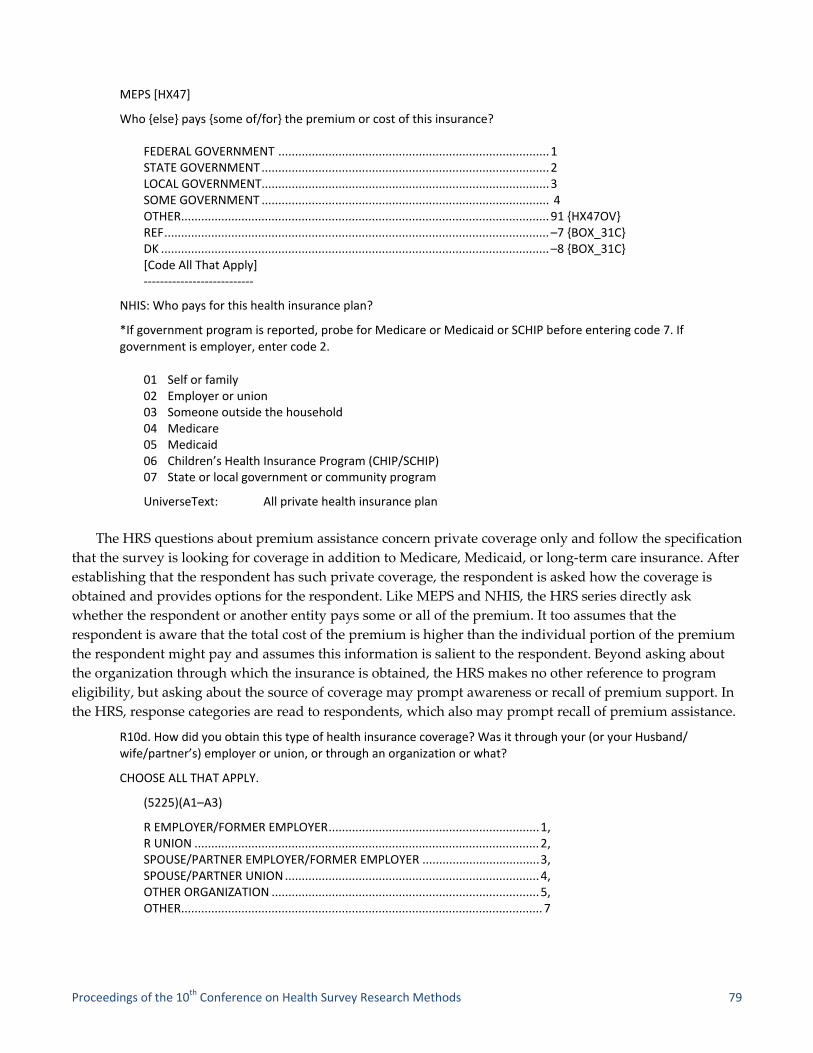
Proceedings of the 10th Conference on Health Survey Research Methods 79
MEPS [HX47]
Who {else} pays {some of/for} the premium or cost of this insurance? FEDERAL GOVERNMENT ................................................................................. 1 STATE GOVERNMENT ...................................................................................... 2 LOCAL GOVERNMENT ...................................................................................... 3 SOME GOVERNMENT ...................................................................................... 4 OTHER .............................................................................................................. 91 {HX47OV} REF ................................................................................................................... –7 {BOX_31C} DK .................................................................................................................... –8 {BOX_31C} [Code All That Apply] ‐‐‐‐‐‐‐‐‐‐‐‐‐‐‐‐‐‐‐‐‐‐‐‐‐‐‐
NHIS: Who pays for this health insurance plan?
*If government program is reported, probe for Medicare or Medicaid or SCHIP before entering code 7. If government is employer, enter code 2.
01 Self or family 02 Employer or union 03 Someone outside the household 04 Medicare 05 Medicaid 06 Children’s Health Insurance Program (CHIP/SCHIP) 07 State or local government or community program
UniverseText: All private health insurance plan
The HRS questions about premium assistance concern private coverage only and follow the specification
that the survey is looking for coverage in addition to Medicare, Medicaid, or long‐term care insurance. After
establishing that the respondent has such private coverage, the respondent is asked how the coverage is
obtained and provides options for the respondent. Like MEPS and NHIS, the HRS series directly ask
whether the respondent or another entity pays some or all of the premium. It too assumes that the
respondent is aware that the total cost of the premium is higher than the individual portion of the premium
the respondent might pay and assumes this information is salient to the respondent. Beyond asking about
the organization through which the insurance is obtained, the HRS makes no other reference to program
eligibility, but asking about the source of coverage may prompt awareness or recall of premium support. In
the HRS, response categories are read to respondents, which also may prompt recall of premium assistance.
R10d. How did you obtain this type of health insurance coverage? Was it through your (or your Husband/ wife/partner’s) employer or union, or through an organization or what?
CHOOSE ALL THAT APPLY.
(5225)(A1–A3)
R EMPLOYER/FORMER EMPLOYER ............................................................... 1, R UNION ....................................................................................................... 2, SPOUSE/PARTNER EMPLOYER/FORMER EMPLOYER ................................... 3, SPOUSE/PARTNER UNION ............................................................................ 4, OTHER ORGANIZATION ................................................................................ 5, OTHER ............................................................................................................ 7

80
R10e. How is this coverage paid for—entirely by you (or your Husband/wife/partner), entirely by your (Husband/ wife/partner’s) (former) employer or union, or partly by a (former) employer or union, or what?
(5226)
ENTIRELY BY R OR SP/PARTNER ................................................................... 1, R UNION ....................................................................................................... 2, —Skip—(5230) PARTLY BY (FORMER) EMPLOYER OR UNION ............................................... 3, OTHER ............................................................................................................ 7
REPORTING PREMIUM ASSISTANCE
To what extent are respondents able to report receipt of health insurance subsidies? In this section, I
report on the results of a 2009–2010 study, conducted for the Illinois Department of Health Care and Family
Services (HFS), whose purpose was to assess children’s access to private health insurance coverage, parents’
and guardians’ perceptions of program services, and their experiences in program utilization. Two random
samples of respondents—an RDD landline sample with cell phone supplement and a random sample drawn
from administrative records—were asked about payment assistance from five sources: employers/unions,
professional associations, federal government, state government, and local government. The RDD landline
and cell phone supplement sample was drawn to produce population estimates of uninsured children by
region and income. The administrative list sample served to explore elements of health care utilization,
health status, and other aspects of the All Kids program.
The RDD landline sample with cell phone supplement used an overlapping sample frame design to
account for the rapidly changing telephone environment. This was especially important for representing
families with children since national estimates indicate nearly one in four children resided in cell‐phone‐
only households at the time of the survey (Blumberg & Luke, 2010). The goal of the landline/cell phone RDD
survey was to interview 1,000 knowledgeable respondents (parents and caregivers) from families with
children under 18 in Illinois. The landline RDD portion of the sample was stratified by three geographic
strata (e.g., Cook—the most densely populated and urban county, suburban collar counties surrounding
Cook, and the remainder of the state) and three income strata measured by ratio of income to the poverty
level (under 133% FPL, 134–200% FPL, and over 200% FPL). Incentives were offered to encourage
participation in the low‐performing strata cells (under 133% FPL and 134–200% FPL). AAPOR Response
Rate 1 was 35.9% for the landline RDD sample.
To help compensate for the increasing number of households without landline telephone service, a
separate RDD sample of telephone numbers assigned to cellular service was drawn using a Telcordia
database. Cell phone interviews were conducted regardless of whether the household had a landline, but
only callers with children residing in the respondent’s home were included in the sample. The cell phone
sample was not screened for income or for region. Incentives were offered to all cell phone respondents.
AAPOR Response Rate 1 was 19.9% for the cellphone RDD sample.
For the list sample, a stratified random sample of caregivers with at least one child enrolled in Illinois’s
All Kids program was drawn from agency administrative records. Thus, all respondents in this sample had
at least one child receiving government‐subsidized health insurance. The sample was stratified by program
type and geography into nine cells. The three program types are All Kids Assist, covering children in
families with annual income less than 133% FPL; All Kids Share and Premium Level 1, for children in
families with annual income between 133%–150% and 150–200% FPL, respectively; and All Kids Premium

Proceedings of the 10th Conference on Health Survey Research Methods 81
2–8, for children in families with annual incomes over 200% FPL. Members of the sample were excluded if
they were residing in an institution.
For the administrative record sample, prenotification letters in English and Spanish were mailed by
replicate. The letters addressed to the parent/caregiver named in the administrative record and described
the purpose of the study, described the sponsor and the director of study, and encouraged survey
participation. The primary contact number provided by caregivers in the records included both landline
telephone and cell phone numbers. A small incentive ($10) was offered to all respondents for completing the
survey. Interviews were completed for a total of 776 case records. Because there was a lag time between the
drawing of the sample and completion of interviews, enrollment on the date of the interview was assessed
for each case leading to the elimination of 54 cases or 7% of the cases. The remaining 723 cases were verified
as enrolled in the All Kids program at the time of the interview according to administrative records.
Eligibility for the survey was established when the contact person(s) listed in agency records was identified
in the telephone interview screener. Approximately 41% of the telephone numbers associated with the case
records were deemed not eligible because they were disconnected or nonresidential numbers. Only cases in
which administrative record contact name was positively affirmed by the survey respondent were included
in this analysis. The AAPOR Response Rate 1 for the list sample was 36.5%.
In the All Kids list sample, according to the records, all respondents have children receiving some kind
of government‐subsidized health care. Families with children in the Assist program pay no premium or co‐
payments: the premium is fully subsidized jointly by state and federal government. Those in the Share and
Premium Level 1 pay nominal premium and co‐payments but most of the coverage is subsidized jointly by
state and federal government. Families with children in Premium Levels 2–8 pay graduated premium and
co‐payment amounts based on income, ranging from a $40 premium (Premium Level 2) to a $300 premium
(Premium Level 8), and the premiums are subsidized by the state government only.
MEASUREMENT
All respondents were asked a series of questions about health insurance coverage for each family
member. Half of each sample was asked the following question after a respondent reported having some
type of coverage:
Who else pays some of or all of the premium or cost of this insurance? Is it paid by…?
CODE ALL THAT APPLY [IWER NOTE: READ ALL CHOICES]
1 Employer/job/union 2 Professional association 3 Federal government 4 State government 5 Local government 6 No one else helps to pay the premium 7 Another source
Those reporting an employer, job, or union helping pay all or some of the cost or premium for the
coverage were coded as reporting employment‐based premium assistance. Those reporting the federal, state,
or local government helping pay all or some of the cost or premium for the coverage were coded as
reporting government premium assistance.
In this analysis, we focus on employment‐based and government‐sponsored coverage, omitting the
uninsured and those with direct purchase policies. Nearly all those with employment‐based coverage and

82
government‐sponsored coverage have some level of premium assistance, and for this analysis, I assume that
respondents with employment‐based coverage or government‐sponsored coverage for themselves or for
their children have a premium subsidy. This assumption is plausible given that nationwide in 2010, 95% of
workers with family coverage benefited from an employer subsidy (Kaiser Family Foundation and Health
Research and Educational Trust, 2010). The average worker contribution for family was 30% with the
remainder paid by the employer. In this analysis, all respondents with a child enrolled in All Kids had some
level of government‐subsidized coverage. In Illinois, government‐sponsored health insurance subsidies
range from 100% of the premium cost to approximately 50% (based on $600 premium for two children).
RESULTS RDD/CELL SAMPLE
Table 2. Proportion Reporting Premium Assistance, by Coverage Type: RDD Sample
R with at least 1 child with employment‐based coverage (N = 232)
R with at least 1 child with All Kids coverage (N = 214)
Reporting government premium assistance
0.06(0.04–0.09)
0.63 (0.56–0.69)
Reporting employment‐based premium assistance
0.80(0.75–0.85)
0.12 (0.08–0.16)
Preliminary analyses suggest that neither those with government nor employment‐based premium
assistance are universally aware of the premium support they receive, but those receiving government
premium assistance are less likely to report receiving assistance than those with employment‐based
premium assistance.
In the RDD/cell sample, 80% of the respondents with at least one child enrolled in employment‐based
coverage reported employment‐based premium assistance, while just under two‐thirds of those with at least
one child enrolled in All Kids reported government premium assistance. The clear majority of those
reporting government‐subsidized coverage cited state government (84%); few cited federal (14%).
Logistical regression was used to explore characteristics of the respondents reporting different types of
premium assistance using Stata 11.0. Logistic regressions were run separately for those respondents with at
least one child with employment‐based coverage and those with All Kids coverage with the same predictive
model with reporting premium assistance as the dependent variables. For the employment‐based coverage
subsample, “reported premium assistance” was coded one if respondents reported an employer, job, or
union paid some or all of the premium. For those in the All Kids subsample, “reported premium assistance”
was coded one if respondents reported the federal or state government paid some or all of the premium. In
separate logistic regressions, the dependent variables were regressed on a model incorporating marital
status (married = 1), race (White = 1), ethnicity (Hispanic = 1), rural residency (rural = 1), presence of
working adult in family (at least one working adult = 1), and income.
Among respondents with at least one child with employment‐based coverage, none of the potential
demographic predictors were related to premium reporting. Among respondents with at least one child
with All Kids coverage, Hispanics were less likely to report premium assistance (odds ratio = 0.45, linearized
standard error = 0.16, t = –2.16, p = 0.031), as were respondents with at least one working family member
(odds ratio = 0.51, linearized s.e. = 0.17, t = 1.92, p = 0.06), holding marital status, race, rural residency, and
income constant.
Proceedings of the 10th Conference on Health Survey Research Methods 83
RESULTS LIST SAMPLE
To look more closely at the respondents whose children are enrolled in All Kids, we use the All Kids list
sample data set. Just about half the sample (49.6%) reported government premium assistance, and more
than 92% of those mentioning government support cite state funding assistance, with 4% citing federal
sources and 6% citing local government sources.
Logistical regression also was used to explore characteristics of the All Kids list sample respondents
reporting premium assistance. Only respondents who reported at least one child enrolled in All Kids were
included in the analysis. Reports of premium assistance were regressed on marital status (married = 1), race
(White = 1), ethnicity (Hispanic = 1), rural residency (rural = 1), presence of working adult in family (at least
one working adult = 1), and program indicator (Assist/Medicaid or Share/SCHIP program type = 1). All Kids
program type is highly correlated with family income with families under 133% FPL in Assist/Medicaid,
134–200% FPL in Share/SCHIP, and those over 200% FPL in All Kids Premium Levels 2–8. As noted earlier,
each All Kids program type was associated with different recipient‐paid premium levels with none paid by
the Assist/Medicaid recipients, nominal but low premiums paid by the Share/SCHIP recipients, and higher
but based on a sliding fee for the All Kids Premium recipients. Because the Assist/Medicaid and Share/
SCHIP recipients pay nominal or no premium, they have been combined into a single category for this
analysis. Those paying significantly more for All Kids may be less likely to report premium assistance.
Respondents with a child in the Assist/Share (Medicaid/SCHIP) components of All Kids were more
likely to report premium assistance than those with a child in All Kids Premium (odds ratio = 2.34,
linearized standard error = 0.98, t = 2.02, p = 0.04). Holding all other factors constant, the mean respondents
with a child in the Assist/Share (Medicaid/SCHIP) components of All Kids had a 59% predicted probability
of reporting government premium assistance compared to 37% of respondents with a child in All Kids
Premium.
DISCUSSION
In response to a direct question about premium assistance, reports of assistance were more likely among
those with employment‐based coverage than those with publicly sponsored coverage. While there is room
for improvement among those with employment‐based coverage, reporting was not systematically
associated with marital status, race, Hispanic ethnicity, presence of a working adult in the household, rural
residency, or income. In contrast, premium assistance reporting among respondents with All Kids enrollees
was significantly lower. In addition, reporting varied by ethnicity, with Hispanics less likely to report.
Respondents with children in the Assist/Share (Medicaid/SCHIP) All Kids program were significantly more
likely to report premium assistance than were respondents within children in the All Kids Premium 2–8
program. These results suggest that new approaches to measuring government‐supported assistance be
explored.
If implemented, a central provision of the ACA will expand the Medicaid program to persons with
much higher incomes than previously enjoyed in many states. In addition, new subsidies for direct purchase
policies based on a sliding income scale will provide premium assistance where none previously existed.
Based on the data presented here, we can expect bias in estimates of self‐reported participation among those
in Medicaid expansion.
The approaches to measuring premium assistance as employed in the MEPS, NHIS, and HRS and
analyzed in this study should be empirically compared with alternative approaches in a split‐ballot design.

84
One such approach might be based on a series employed in the HRS for the prescription drug assistance
program called Extra Help. The HRS begins by specifying the eligibility target population (Medicare
beneficiaries with limited income and resources) and continues by assessing whether the respondent is
aware of a program and what the program is supposed to do—deliver extra help for people to pay for
prescription drugs. The questions further incorporate aspects of the process and outcome of securing
assistance. It asks the respondent about specific necessary behaviors the respondent would have engaged in
order to secure coverage—applying for coverage—and asks about the outcome, anticipating the likely
scenario that a respondent would not be aware of the application outcome at the time of the survey.
HRS [N425] Medicare beneficiaries with limited income and resources may qualify to get extra help paying for their prescription drug coverage. Did you know about this program?
1. YES 5. NO 8. DK 9. RF
GO TO N428 BRANCHPOINT
N426 Did you apply for extra help?
YES 5. NO 8. DK 9. RF
GO TO N428 BRANCHPOINT
N427 Was your application for extra help accepted or denied?
1. ACCEPTED 2. DENIED 3. STILL WAITING TO HEAR 8. DK 9. RF
The approach can be modified in a number of ways to conform to program eligibility guidelines and
tailored to state‐specific processes. It can be adapted to nearly all of forms of subsidy permitted under the
ACA from Medicaid participation to tax credits or direct purchase subsidies. Currently, questions about
Medicaid participation in ACS, MEPS, NHIS, and other surveys do include short descriptions of the
Medicaid program and who it is designed to serve. Thus, a few more questions—has the respondent heard
about the program, whether the respondent applied for help covering medical insurance, or even what
documents were required in support of the application (i.e., “did you have to show your paystub or tax
return when you applied?”)—might boost reports of premium assistance for government‐sponsored
premium support.
In the data presented here, employer premium assistance was much higher than government‐
sponsored, but there was still nontrivial underreporting. A slightly different approach to that suggested for
increasing reports of government‐sponsored premium support would be needed for increasing premium
assistance reporting from employers. For example, a series might start by specifying the eligibility target
population (employees), followed by a statement that many employers pay part of employees’ health
insurance premium as an employment benefit, and then asking the respondent if her or his employer pays a
portion of the premium. However, it is possible that the provision of the ACA that requires employers to
disclose the value of the benefits they provided beginning in 2012 for each employee’s health insurance
coverage on the employees’ annual Form W‐2s might increase reports of employer support by specifying the
extent of the subsidy.
The variety of health insurance subsidy options in the ACA and the likelihood that states will develop
their own programs and systems for implementing the various provisions require survey methodologists to
consider how the subsidy provision is experienced by groups—Medicaid expansion, tax credits, cash
subsidies for direct purchase policies—in order to create survey questions that resonate sufficiently with
respondents and result in accurate reports.

Proceedings of the 10th Conference on Health Survey Research Methods 85
REFERENCES
Blumberg, S. J., & Cynamon, M. L. (1999). Misreporting Medicaid enrollment: Results of three studies linking
telephone surveys to state administrative records. In M. L. Cynamon & R. A. Kulka (Eds.), 7th Conference on
Health Survey Research Methods. DHHS Publication No. (PHS) 01‐1013. Hyattsville MD: Department of Health
and Human Services, Centers for Disease Control and Prevention. Available at
www.cdc.gov/nchs/data/conf/conf07.pdf
Blumberg, S. J., & Luke, J. V. (2010, May). Wireless substitution: Early release of estimates from the National Health
Interview Survey, July–December 2009. National Center for Health Statistics. May 2010. Available at
www.cdc.gov/nchs/nhis.htm
Davern, M., Call, K. T., Ziegenfuss, J., Davidson, G., Beebe, T. J., & Blewett, L. (2008). Validating health insurance
coverage survey estimates: A comparison of self‐reported coverage and administrative data records. Public
Opinion Quarterly, 72, 241–259.
Kaiser Family Foundation and Health Research and Educational Trust (2010). Employer health benefits 2010 annual
survey. Available at http://ehbs.kff.org/pdf/2010/8085.pdf.
Kincheloe, J., Brown, R. E., Frates, J., Call, K. T., Yen, W., & Watkins, J. (2006). Can we trust population surveys to
count Medicaid enrollees and the uninsured? Health Affairs, 25, 1163–1167.
Lewis, K., Elwood, M. R., & Czajka, J. L. (1998). Counting the uninsured: A review of the literature. Washington DC:
The Urban Institute. Available at www.urban.org/url.cfm?ID=308032
Pascale, J. (2006). Measuring health insurance in the U.S. In Proceedings of the AAPOR‐ASA Section on Survey
Research Methods (pp. 4197–4204). Available at
www.amstat.org/sections/srms/proceedings/y2006/Files/JSM2006‐000900.pdf
Wheaton, L. (2007). Underreporting of means‐tested transfer programs in the CPS and SIPP. In 2007 Proceedings of
the American Statistical Association (pp. 3622–3629). Social Statistics Section [CD‐ROM], Alexandria, VA:
American Statistical Association.

86

Proceedings of the 10th Conference on Health Survey Research Methods 87
Improving the American Community Survey for Studying Health Insurance Reform
Victoria Lynch and Genevieve M. Kenney (The Urban Institute)
I. INTRODUCTION
The Affordable Care Act (ACA) is expected to lead to substantial increases in health insurance coverage,
particularly through both Medicaid and nongroup plans offered through the new exchanges that will be
established in 2014 (Elmendorf, 2011). To assess the impacts of the ACA, it will be critical to have valid
estimates of how the distribution of health insurance coverage changes at the national, state, and local levels,
overall and for different subgroups. While a number of surveys provide national coverage estimates, the
American Community Survey (ACS) is the only survey with sufficient sample size to track coverage at the
state and local levels on an annual basis. However, prior research suggests that ACS estimates of nongroup are
too high and that estimates of Medicaid/CHIP coverage are too low (Turner & Boudreaux, 2010). In this paper,
we summarize methods we developed to address misreporting of coverage on the ACS and show how their
use appears to produce nongroup and Medicaid/CHIP estimates on the ACS with more face validity.
II. DATA
The American Community Survey (ACS) is an annual household survey conducted by the U.S. Census
Bureau.1 It is uniquely suited to tracking the impact of the ACA because its sample size is many times larger
than other surveys used to study coverage and sufficiently large to study local area coverage in all states and
to study nongroup coverage, a relatively rare type of coverage. In terms of potential measurement error, it is
important to note that it is a mixed‐mode survey that starts with a mail‐back questionnaire, with follow‐up of
nonresponders by telephone and, for a subsample, by an in‐person interview with the same questionnaire.
Interviewers are not instructed to help the respondent by defining concepts and probing for all relevant
information as they do in other surveys used to study health coverage (Jones & Cohen, 2007). In 2008, a
question was added to the ACS to ask the respondent about coverage of each individual in the household by
any of the following types of health insurance or health coverage plans at the time of the survey:
1. Insurance through a current or former employer or union (of this person or another family member)
2. Insurance purchased directly from an insurance company (by this person or another family
member)
3. Medicare, for people 65 and older, or people with certain disabilities
4. Medicaid, Medical Assistance, or any kind of government‐assistance plan for those with low
incomes or a disability
5. TRICARE or other military health care
6. VA [Department of Veterans Affairs] (including those who have ever used or enrolled for VA health
care)
1 U.S. Census Bureau. American Community Survey. www.census.gov/acs/www/. Although the survey includes both
housing units and group quarters, as well as active duty military personnel, our estimates focus on the civilian,
noninstitutionalized population.

88
7. Indian Health Service
8. Any other type of health insurance or health coverage plan—specify
Overall, the ACS produces uninsured estimates that are similar to other surveys (Boudreaux,
Ziegenfuss, Graven, Davern, & Blewett, 2011), but there are concerns about both the nongroup and the
Medicaid/Children’s Health Insurance Program (CHIP) estimates. It appears that the ACS substantially
overstates the prevalence of nongroup coverage. In 2008, according to the ACS, 27.8 million nonelderly had
nongroup coverage2 compared to 16.6 million in the Current Population Survey (CPS), which has been
shown to overcount nongroup coverage (Cantor, Monheit, Brownlee, & Schneider, 2007). Moreover, the
National Health Interview Survey (NHIS), which we consider to have the most valid coverage estimates
(Kenney, Holahan, & Nichols, 2006; Lynch, Kenney, Haley, & Resnick, 2011) has notably lower estimates:
11.5 million3 for the nonelderly in 2008. The extent of dual coverage involving nongroup coverage on the
ACS is also evidence of misreporting: according the ACS, 9.6 million nonelderly have both ESI and
nongroup coverage and 1.3 million have both nongroup coverage and Medicaid/CHIP. We suspect that
most of these are misclassified (up to as many as about one‐third, resulting from a misallocation of write‐in
responses) (Mach & O’Hara, 2011) because it is unlikely someone would purchase nongroup coverage if
they were already receiving coverage through an employer or government.4 Like other surveys, the ACS
estimates fall below administrative counts of children enrolled in Medicaid or CHIP: in 2008, the ACS
estimate of Medicaid/CHIP children was 22.7 million compared the administrative count of 27.9 million (the
NHIS estimate was 24.1 million).5, 6 Prior research indicates that confusion is responsible for some of the
incorrect reporting of nongroup and Medicaid (Cantor et al., 2007; Lynch & Resnick, 2009, O’Hara, 2009).
III. METHODS
We developed a set of ACS logical coverage edits that are applied if other information collected in the
ACS and, for some cases, eligibility status based on state Medicaid/CHIP eligibility rules imply that the
sample case had misclassified coverage (Lynch et al., 2011). We build on edit rules used by Census Bureau
that add Medicare, Medicaid/CHIP, and TRICARE/military coverage to sample persons with apparent
misreported coverage of those types (Lynch, Boudreaux, & Davern, 2010). The primary motivation for using
logical coverage edits are findings that people may lack the knowledge to answer technical questions
correctly but that correct answers can be derived from other information respondents are able to provide
correctly (Tourangeau, Rips, & Rasinki, 2000). Literature on cognitive interviewing demonstrates how
official definitions of health insurance often do not map to respondent perceptions but that interviewees are
able to indirectly answer the health insurance question by providing the interviewer with information that
can be used to infer coverage status (Pascale, 2009). Coverage edits also are considered a reasonable method
for improving the validity of estimates from other surveys (Lynch et al., 2011). For example, NCHS uses
2 Direct estimates are derived from an augmented version of the ACS, the Integrated Public Use Microdata Series
(IPUMS), prepared by the University of Minnesota Population Center. The IPUMS differs from the ACS public use microdata
sample (PUMS) released by the Census Bureau for 2008 because it reflects the final coverage edits the Census Bureau applies
as well as edits to family relationship data (Ruggles et al., 2010). 3 Authors’ calculation. 4 It is unlikely that someone would find it worthwhile to buy coverage for themselves or another person who also has
Medicaid/CHIP. It is also unlikely that someone who is eligible for Medicaid/CHIP would be able to afford to buy coverage. 5 Authors’ calculation. 6 By contrast to ACS and NHIS estimates, the administrative counts do not include enrollees in state and other non‐
Medicaid/CHIP public coverage programs.

Proceedings of the 10th Conference on Health Survey Research Methods 89
other information reported about NHIS sample cases to reclassify coverage for at least nine million
nonelderly persons.7 It is also common practice on surveys to draw inferences from multiple questions
without actually asking the respondent to try to answer the question of interest. For example, the labor
status used in official employment estimates is derived this way.8
Our edits use family income, employment, program participation, eligibility status, health insurance
coverage, functional limitation, and combinations of other family‐ and person‐level data to check each case
for the presence of a scenario implying that the ACS coverage status is incorrect. We apply the rules in the
order of our confidence that the situation implies the alternative coverage type, and we recode the case to
the implied coverage if it meets the conditions specified under the rule. Tables 1 and 2 summarize the
nongroup rules for adults and children and, due to limited space, we refer readers to a previous report for a
summary of the Medicaid/CHIP edit rules we developed (Lynch et al., 2011).
IV. RESULTS
The nongroup edits reduce the estimated number of children with nongroup from 6.4 million to 3.5
million in 2009 (Table 1). They shift 3.7% of all children to another coverage status and change the percent
with nongroup from 8.1 to 4.5 (results not shown). Overall, the estimate was reduced to .45 of the original
estimate, and the reduction was most dramatic among children with SSI (where the derived estimate was 0),
TANF (.02 of the original estimate), and SNAP (.03), and non‐Hispanic Black children (.23), American
Indian/Alaskan Native children (.27), children above the poverty line but less than twice poverty (.31), and
poor children (.33). By state, the reduction was greatest in Hawaii (.44) and least in Vermont (.76), with the
median being .54 of the original estimate.
The nongroup edits reduce the estimated number of nonelderly adults with nongroup coverage from
18.9 million to 11.6 million. The impact on the coverage distribution was slightly larger for adults compared
to kids; editing moved 4.0% of the adult population to another coverage status and reduced the percent with
nongroup coverage from 10.2% to 6.3%. Overall, the nonelderly nongroup estimate was reduced to .61 of the
original estimate; the reduction was most dramatic among those with SSI (where the derived estimate was
0), SNAP (.15 of the original estimate), cash assistance (.14), and those who are non‐Hispanic Black (.38) or
American Indian/Alaskan Native (.41). The reduction was least dramatic among 19–25 year olds (.78), many
of whom have nongroup coverage through their college. By state, the reduction was greatest in West
Virginia (.41) and least in California (71), with the median being 60% of the original estimate.
After editing, the child population with nongroup coverage is higher income (76.9% have incomes more
than twice the poverty threshold compared to 67.9% before), more white non‐Hispanic (71.3% compared to
64.9% before), and less likely to be in SNAP (0.5% compared to 6.7% before). After editing, the adult
population with nongroup coverage is slightly younger (22.4% were under age 26 after the edits compared
to 17.6% before) and more White non‐Hispanic (77.9% compared to 74.3%).
The Medicaid/CHIP edits increase the number of children with Medicaid/CHIP and no ESI by 2.8
million and increase the Medicaid/CHIP rate from 29.3% to 32.8% in 2009. The vast majority of the edited
cases are determined to be Medicaid/CHIP‐eligible in our model, and the others are ones that could have
7 Urban Institute calculation. 8 See the item on Labor Force Status Recode in the CPS Data Dictionary available at
www.census.gov/apsd/techdoc/cps/cpsmar10.pdf

90
been eligible based on information that our model is not able to take into account (e.g., family income at an
earlier point in the year). Editing based on illogical combinations of coverage within a family accounts for
most of the impact (1.9 million). Editing based on illogical nongroup, Medicare, or ESI among Medicaid/
CHIP‐eligible children accounts for about 470,000 cases and editing children flagged with illogical coverage
according to the rules we developed, but not found eligible accounts for about 300,000 cases. After editing,
the Medicaid/CHIP child population has a fairly similar demographic distribution relative to the
distribution based on the unedited data. However, it is slightly more middle income (40.7% with incomes
100–399% of FPL compared to 39.2% before) and has slightly fewer children from SNAP households (50.7%
compared to 53.2% before).
The edits increase the number of nonelderly adults with Medicaid/CHIP by 1.4 million. About 1.2
million are from those originally classified as having nongroup coverage and are edited based on there
being a combination of low family income, other means‐tested program participation, an indication of a
disability, Medicaid/CHIP coverage of another family member, and/or no full‐time workers in the family
who could afford nongroup coverage. The edits did not change the demographic and socioeconomic
characteristics of the Medicaid/CHIP adult population in any noticeable ways.
Table 1. Impact of Editing of ACS Private Nongroup (PNG) Coverage, by Edit Rule, U.S. Children (0–19) in 2009
RULE SUMMARY ANY NONGROUP(in the order in which the rules are applied) Number Rate
DIRECT ESTIMATE 6,430,207 8.15%Edited to Medicaid/CHIP based on being eligible & enrolled in Medicaid/CHIP. 5,980,324 7.58%Edited to TRICARE/military based on parental status. 5,897,509 7.47%Edited the Medicaid/CHIP based on refinements to Census rules. 5,801,253 7.35%Edited to Medicaid/CHIP based on eligibility & sibling’s status. 5,769,974 7.31%Edited to Medicaid/CHIP based on eligibility & parental status implying misreported dual PNG‐ESI. 5,730,876 7.26%Edited to Medicaid/CHIP based on being eligible & having a parent edited to Medicaid/ CHIP from PNG for a non‐SSI reason.
5,314,163 6.73%
Edited to Medicaid/CHIP based on being eligible & being a minor parent. 5,309,038 6.73%Edited to Medicaid/CHIP based on being eligible & having implied misreported dual PNG‐ESI from not living with parents & being low income or having functional limitation.
5,270,195 6.68%
Edited to Medicaid/CHIP based on being eligible & having no evidence that the family could afford PNG, the PNG is misreported ESI, or the PNG is paid for by someone outside the household.
5,155,673 6.53%
Edited to Medicaid/CHIP based on being eligible, not having misreported ESI, & having SNAP or cash assistance
5,114,464 6.48%
Edited to Medicaid/CHIP based on being flagged as having possibly illogical coverage & being immigrant‐eligible & having an indicator of possibly being income‐eligible earlier in the year.
5,007,364 6.34%
Edited to Medicaid/CHIP based on being flagged as having possible illogical coverage & being immigrant‐eligible & being in a SNAP household with no military coverage.
5,003,762 6.34%
Edited to Medicaid/CHIP based on being flagged as having possibly illogical coverage & being in a SNAP household with no military coverage.
5,003,311 6.34%
Edited to ESI based on having a parent edited from PNG to ESI. 4,113,673 5.21%Edited to ESI based on having reported ESI & a parent with a full‐time public sector job. 3,783,679 4.79%Edited to ESI based on having reported ESI & a high‐income parent with ESI & no PNG. 3,630,719 4.60%Edited to ESI based on having reported ESI & an unemployed parent. 3,628,776 4.60%Edited to ESI based on having reported ESI & a parent with a full‐time private‐sector job & not being poor or in a public program.
3,068,039 3.89%
Edited to ESI based on having reported ESI & a parent with some other type of HIU employment other than self‐employment.
2,892,064 3.66%
DIFFERENCE FROM UNEDITED ESTIMATE 3,538,143 4.49%

Proceedings of the 10th Conference on Health Survey Research Methods 91
Table 2. Impact of Editing of ACS Private Nongroup (PNG) Coverage, by Edit Rule, U.S. Nonelderly Adults (19–64) in 2009
RULE SUMMARY ANY NONGROUP(in the order in which the rules are applied) Number Rate
DIRECT ESTIMATE 18,889,778 10.23%
Nonelderly Adult with Nongroup & Medicaid Edited to Medicaid/CHIP based on being a parent with Medicaid/CHIP & less than 200% FPL. 18,726,521 10.14%Edited to Medicaid/CHIP based on having Medicaid/CHIP & a functional limitation. 18,426,736 9.98%Edited to Medicaid/CHIP based on Medicaid/CHIP with SSI, SNAP, or cash assistance but no minor child.
18,288,821 9.91%
Edited to Medicaid/CHIP based on having Medicaid/CHIP & SSI, SNAP, or cash assistance but income higher than 200% FPL.
18,269,368 9.89%
Edited to Medicaid/CHIP based on having Medicaid/CHIP & SSI, SNAP, or cash assistance but income higher than 200% FPL & no minor child.
18,258,775 9.89%
Nonelderly with Nongroup & Military 17,972,693 9.73%
Nonelderly with Nongroup & Other Employer CoverageEdited to ESI based on being a full‐time public‐sector worker or being the spouse or dependent child of one.
16,801,262 9.10%
Edited to ESI based on being the spouse or dependent child in a high‐income HIU with a full‐time private‐sector spouse/parent with ESI & no PNG.
16,330,960 8.84%
Edited to Medicaid/CHIP based on being a 19‐ or 20‐year old in a low‐income HIU (dorms excluded) with program participation & a parent (to avoid selecting college students who don’t live at home because they often have PNG through school) but none with nongroup or ESI.
16,330,001 8.84%
Edited to ESI based on having low or moderate income, a functional limitation, & someone in the HIU with employment.
16,267,024 8.81%
Edited to ESI based on having cash public assistance or SNAP & being in an HIU with someone who has a full‐time job.
16,184,434 8.77%
Edited to Medicaid/CHIP based on having cash public assistance or SNAP & no one with a full‐time job.
16,126,207 8.73%
Edited to ESI based on being an unemployed HIU. 16,047,992 8.69%Edited to ESI based on having a full‐time public‐sector worker in HIU & not being poor or in a public assistance program.
13,916,925 7.54%
Edited to ESI based on being in an HIU with some form of non‐self‐employment. 13,333,775 7.22%
Other People with Nongroup Edited to ESI based on having a full‐time public‐sector worker in HIU. 13,165,343 7.13%Edited to ESI based on being in a high‐income family & having a spouse with ESI & no PNG. 12,618,883 6.83%Edited to ESI based on being a dependent child in a high‐income family with a parent that has ESI & no PNG.
12,569,279 6.81%
Edited to ESI based on being a dependent child with two parents with ESI & one parent with a full‐time non‐self‐employed job & the other with no job.
12,566,536 6.81%
Edited to Medicaid/CHIP based on having a low‐income adult & a functional limitation 12,116,304 6.56%Edited to Medicaid/CHIP based on having a low income & cash assistance or SNAP. 11,897,610 6.44%Edited to Medicaid/CHIP based on being a citizen with a low income & a spouse or child with Medicaid/CHIP
11,873,164 6.43%
Edited to Medicaid/CHIP based on being a citizen parent with a low income & no public‐sector job in the HIU.
11,432,742 6.19%
DIFFERENCE FROM UNEDITED ESTIMATE 7,457,036 4.04%
The logical coverage edits we apply to the ACS data generally move the ACS coverage distributions
closer to the NHIS coverage distributions. Table 1 shows the 2009 insurance coverage distribution of
children before and after editing in the ACS compared to the distribution from the NHIS. After editing ACS,
its estimated rate of Medicaid/CHIP coverage for children (in a hierarchy after ESI) is 32.8%, which is the
same point estimate derived from the NHIS. The majority of the reclassified cases—1.5 million—had

92
previously been identified as having nongroup coverage, and an additional 0.7 million were reclassified
from ESI. After editing, children have lower rates of nongroup coverage (3.6%) that are similar to NHIS
(3.4%). For adults, Table 2 shows that after editing, the rate of Medicaid/CHIP is 8.7% compared to the NHIS
estimate of 8.9% and the rate of nongroup coverage is 5.6% compared to the NHIS estimate of 5.0%.
Table 3. Coverage Distribution of U.S. Children (0–18) before & after Editing in ACS, Compared to NHIS, 2009
ACS NHIS
Before After# % # % # %
Total 78.9 100.0% 78.9 100.0% 78.5 100.0%ESI 44.2 56.0% 43.5 55.1% 42.7 54.4%Medicaid/CHIP 23.1 29.3% 25.9 32.8% 25.8 32.8%PNG 4.3 5.5% 2.8 3.6% 2.7 3.4%Medicare 0.2 0.3% 0.1 0.1% 0.2 0.3%Uninsured 7.1 9.0% 6.6 8.4% 6.6 8.5%Other* 0.5 0.6%Source: Urban Institute analysis of American Community Survey (ACS) 2009 data from the Integrated Public Use Microdata Series (IPUMS). The Urban Institute Health Policy Center’s ACS Medicaid/CHIP Eligibility Simulation Model and coverage estimates were developed under a grant from the Robert Wood Johnson Foundation.
Table 4. Coverage Distribution of U.S. Nonelderly Adults (19–64) before & after Editing in ACS, Compared to NHIS, 2009
ACS NHIS
Before After# % # % # %
Total 184.6 100.0% 184.6 100.0% 184.9 100.0%ESI 116.8 63.3% 118.2 64.0% 115.7 62.6%Medicaid/CHIP 14.9 8.1% 16.1 8.7% 16.5 8.9%PNG 12.7 6.9% 10.3 5.6% 9.2 5.0%Medicare 1.9 1.0% 1.8 1.0% 2.8 1.5%Uninsured 38.4 20.8% 38.3 20.8% 39.2 21.2%Other* 1.6 0.8%Source: Urban Institute analysis of American Community Survey (ACS) 2009 data from the Integrated Public Use Microdata Series (IPUMS). The Urban Institute Health Policy Center’s ACS Medicaid/CHIP Eligibility Simulation Model and coverage estimates were developed under a grant from the Robert Wood Johnson Foundation.
DISCUSSION
As designed, the edits increase the number of children and adults with Medicaid/CHIP and decrease the
number with nongroup coverage. The edits add more children than adults to the Medicaid/CHIP
population, which is expected given the larger difference between the unedited ACS estimates and the
NHIS estimates for children compared to adults. That the child enrollee population is higher income after
the edits is not surprising given that record check studies show that higher income enrollees are more likely
to be misreported. That the adult enrollee population is similar before and after editing suggests that the
sample cases we edit may not be very different from those originally reported as having Medicaid/CHIP.
The impact of the edits on any nongroup coverage is much larger than the impacts on nongroup coverage
considered in the context of a coverage hierarchy (after Medicaid/CHIP and ESI) because there is so much dual
coverage in the unedited ACS estimates. As expected, there is little dual‐nongroup/ESI or dual‐nongroup/
Medicaid/CHIP coverage in the child population after editing, because people rarely simultaneously have
those combinations of coverage (Mach & O’Hara, 2011). That the child nongroup population is higher income
with fewer SNAP households also suggests that the resulting estimates are more valid because low income

Proceedings of the 10th Conference on Health Survey Research Methods 93
people cannot usually afford to buy nongroup coverage (Mach & O’Hara, 2011). There are still 1.1 million
individuals with dual coverage in the adult nongroup population after editing, which this suggests that the
edits for adults are conservative. That the ACS nongroup estimate is still 1.1 million higher than the NHIS
estimate of 9.2 million and has 2.1 million poor people (data not shown) also suggests that the editing is
conservative (although some of the individuals classified as poor are likely college students who get nongroup
through their school or other young adults who get it from their parents).
CONCLUSION
Coverage edits appear to improve the validity of Medicaid/CHIP and non‐group estimates on the ACS.
They are an intuitive and inexpensive technique for improving the validity of the ACS coverage estimates.
Despite the face validity of the edited estimates, there are a number of outstanding questions that should be
addressed in order to confirm that these edits are valid and to further strengthen the validity of the ACS
estimates. First, we recommend that the Census Bureau re‐interview sample people who look like
Medicaid/CHIP enrollees but do not have Medicaid/CHIP reported to assess the validity of the coverage
information reported on the ACS. Second, we recommend record‐check analysis to assess how well the edits
identify enrollees found in Medicaid/CHIP enrollment records. Third, we recommend that the Census
Bureau conduct cognitive interviewing to inform improvements to the ACS questionnaire and also provide
insights about the dynamics of coverage misreporting and the covariates associated with misreporting.
Fourth, we recommend that the Census Bureau re‐evaluate how recodes write‐in responses to nongroup
coverage. Finally, we recommend that the Census Bureau test changes to the instrument aimed at
improving the accuracy of the coverage information provided on the ACS.
ACKNOWLEDGMENTS
This analysis relied on the Urban Institute Health Policy Center’s American Community Survey (ACS)
Medicaid/CHIP Eligibility Simulation Model and coverage estimates which were developed under a grant
from the Robert Wood Johnson Foundation. The opinions and conclusions expressed in this report are those
of the authors and do not necessarily represent the views of the conference organizers, the Robert Wood
Johnson Foundation, or the Urban Institute or its sponsors or trustees. The authors thank Michel Boudreaux
of the University of Minnesota, Joel Cantor of the Rutgers Center for State Health Policy, and Joanne Pascale
of the U.S. Census Bureau for their insight in thinking about the coverage issues discussed in this report. We
also benefited from feedback from HSRM conference attendees and are grateful to the organizers for the
opportunity to participate.
REFERENCES
Boudreaux, M., Ziegenfuss, J. Y., Graven, P., Davern, M., & Blewett, L. (2011). Counting uninsurance and means‐
tested coverage in the American Community Survey: A comparison to the Current Population Survey. Health
Services Research, 46, 210–231.
Cantor, J., Monheit, A., Brownlee, S., & Schneider, C. (2007). The adequacy of household survey data for
evaluating the non‐group health insurance market. Health Services Research, 42, 1739–1757.
Elmendorf, D. W. (2011, March). Statement on CBO’s analysis of the major health care legislation enacted in March 2010
before the U.S. House of Representatives, Subcommittee on Health Committee on Energy and Commerce (Table 3).
Available at www.cbo.gov/ftpdocs/121xx/doc12119/03‐30‐healthcarelegislation.pdf

94
Jones, J., & Cohen, R. A. (2007). Comparison of estimates of health insurance coverage, by type of coverage from
the National Survey of Family Growth (2002) and the National Health Interview Survey (April 2002–March
2003). Health E‐stats. Hyattsville, MD: National Center for Health Statistics.
Kenney, G., Holahan, J., & Nichols, L. (2006). Towards a more reliable federal survey for tracking health insurance
coverage and access. Health Services Research, 41, 918–945.
Lynch, V., Boudreaux, M., & Davern, M. (2010). Applying and evaluating logical coverage edits to health insurance
coverage in the American Community Survey. U.S. Census Bureau, Housing and Household Economic Statistics
Division. Available at www.census.gov/hhes/www/hlthins/publications/coverage_edits_final.pdf
Lynch, V., Kenney, G. M., Haley, J., & Resnick, D. M. (2011). Improving the validity of the Medicaid/CHIP estimates on
the American Community Survey: The role of logical coverage edits. Submitted to the U.S. Census Bureau.
Mach, A., & B. O’Hara, B. (2011). Do people really have multiple health insurance plans? Estimates of nongroup health
insurance in the American Community Survey. Census Bureau Working Paper 2011‐28.
O’Hara, B. (2009, August). Is there an undercount of Medicaid participants in the ACS Field Test? Paper presented at
the Joint Statistical Meetings, Washington, DC.
Ruggles S., Alexander, T. J., Genadek, K., Goeken, R., Schroeder, M., & Sobek, M. (2010). Integrated public use
microdata series: Version 5.0 [Machine‐readable database]. Minneapolis: University of Minnesota.
Turner, J., & Boudreaux, M. (2010). Health insurance coverage in the American Community Survey: A
comparison to two other federal surveys. In Databases for estimating health insurance coverage for children (pp.
83–108). Washington, DC: National Academies Press.
Proceedings of the 10th Conference on Health Survey Research Methods 95
Comparison of Estimates of Emergency Department Visits from the Medical Expenditure Panel Survey and National Hospital Ambulatory Medical Care Survey1
Jeffrey A. Rhoades, Joel W. Cohen, Steven R. Machlin, and Marc I. Roemer (Agency for Healthcare Research and Quality)
INTRODUCTION
The level of emergency department utilization and associated trends are important areas of interest for
health services researchers and policy makers. Surveys that contain emergency department utilization data
used to analyze such issues may have different objectives and data collection methodologies. Thus, it is
important to understand the available data sources and their methodologies in order to correctly interpret
data from a given survey or make informed decisions about which survey data set(s) are most appropriate
for a particular analysis (Machlin, Valluzzi, Chevarley, & Thorpe, 2001; Machlin & Zodet, 2007). The
purpose of this paper is to examine the large differences that occur in estimates of the same use variable
(emergency department visits) derived from household vs. provider‐based sources of information. The
focus is on illustrating important methodological and contextual considerations that can affect analyses
when using different surveys for measuring emergency department use.
BACKGROUND
The U.S. Department of Health and Human Services sponsors a number of national surveys that provide
data on emergency department use but entail different objectives and methodologies. One of these surveys,
the Medical Expenditure Panel Survey (MEPS), collects utilization data through household interviews. In
contrast, the National Hospital Ambulatory Medical Care Survey (NHAMCS) collects data from hospitals
pertaining to emergency department visits (Machlin et al., 2001). Here we compare 2008 data on emergency
department use collected in the MEPS to comparable use data collected in the NHAMCS.
MEPS collects detailed data on health care use, expenditures, and sources of payment by means of its
Household Component (HC) and Medical Provider Component (www.meps.ahrq.gov/). The panel design
of the HC includes five rounds of interviews that cumulatively cover two consecutive calendar years. At
each interview, one adult respondent typically provides information about all persons in the household. The
MEPS‐HC covers the U.S. civilian noninstitutionalized population. For all emergency department visits and
hospital stays reported in the HC, permission is requested to contact the medical provider for additional
details. This portion of MEPS is referred to as the Medical Provider Component (MPC). The MEPS‐MPC
collects information on all hospital events for each person‐provider pair included in the survey, whether or
not each event is reported by the household respondent.
The NHAMCS is a national probability sample of visits to emergency departments of noninstitutional
general and short‐stay hospitals, exclusive of Federal, military, and Veterans Administration (VA) hospitals,
hospital units of institutions, and hospitals with less than six beds. Within each hospital, all emergency
1 The views expressed in this paper are those of the authors, and no official endorsement by the Department of Health and
Human Services or the Agency for Healthcare Research and Quality is intended or should be inferred.

96
Table 1. Aligning Estimates of Total Emergency Department Visits
MEPS NHAMCS
2008 total (in millions) 56.8 123.8Exclude VA facility 0.7 —Exclude institutionalized, homeless — 3.5Total after exclusions 56.1 120.3
departments are selected. Patient visits are
systematically selected over a randomly
assigned four‐week reporting period. A visit
is defined as a direct personal exchange
between a physician or a staff member
operating under a physician’s direction for
the purpose of seeking health care
(www.cdc.gov/nchs/ahcd/about_ahcd.htm).
In comparing estimates of emergency department visits for MEPS and NHAMCS, we take several steps
to align the population represented and make the bases of the MEPS and NHAMCS statistics as similar as
possible (Table 1). For MEPS, alignment involves subtracting visits taking place in a VA facility, while for
the NHAMCS, residents of a nursing home or other institution and the homeless are removed. These
exclusions result in totals equaling 56.1 million emergency department visits based on MEPS and 120.3
million based on NHAMCS.
Number of Emergency Department Visits, 2008
The estimate from NHAMCS for total visits to emergency departments in 2008 (120.3 million) is
approximately double that of the estimates for MEPS (56.1 million; Table 2). The bulk of this difference is
attributable to visits where a physician is seen (108.8 million for NHAMCS vs. 52.8 million for MEPS). For
both MEPS and NHAMCS, the percent of emergency room visits where a non‐physician is reported as
having been seen is relatively small (2.3% and 10.9%, respectively).
Table 2. Number of Emergency Department Visits, 2008
MEPS NHAMCS
Estimate in millions (SE) Percent distribution Estimate in millions (SE) Percent distribution
Total after exclusions 56.1 (1.6) 100.0% 120.3* (6.1) 100.0%Saw doctor 52.8 94.1% 108.8 89.7%Saw nondoctor 2.3 4.1% 10.9 9.1%Unknown 1.0 1.8% 1.4 1.2%*Significantly different from MEPS (p < 0.05).
The comparisons reveal substantial differences between the two survey estimates of emergency
department use. These variations are likely due to the interaction of a number of factors, including
differences in data collection methodologies, target populations, types of providers and settings covered,
and reporting differences. The household survey (MEPS) targets the civilian noninstitutionalized
population, whereas the provider survey (NHAMCS) is more inclusive and includes visits from persons
outside that population. Differences in reporting of emergency department visits immediately followed by
an inpatient admission may explain a small part of this wide variation. Distinguishing an initial emergency
department visit from a subsequent hospital stay may not be obvious for MEPS respondents, especially
considering the emergency department visit may have been brief relative to the inpatient stay (Machlin et
al., 2001). Also, MEPS estimates could result in potential underreporting if persons who use the emergency
department as their usual source of care may tend to underreport or misclassify some of these visits as
outpatient department or office‐based visits (Machlin et al., 2001). Additionally, what a household
respondent in MEPS might consider to be an emergency department visit would not necessarily be
consistent with how such visits are classified in the NHAMCS from the provider’s perspective. For example,

Proceedings of the 10th Conference on Health Survey Research Methods 97
a hospital visit that was initiated in the emergency department but then immediately referred to another
department for tests may be reported as an outpatient department visit in MEPS but would be counted as an
emergency department visit in NHAMCS (Machlin & Zodet, 2007).
Nonetheless, it is unclear precisely what accounts for the large difference in estimates of emergency
department visits between MEPS and NHAMCS. This research is designed to better account for that
difference. In this investigation, we obtained the MPC records for all hospital events captured in the
provider component of the survey and compared them to household respondent‐reported utilization of
those hospitals to investigate the possible underreporting or misreporting of emergency department visits in
the HC. The objective is to better inform efforts to improve the quality of data collection in both household
and provider‐based surveys.
METHODS
Research Questions
1. To what extent is the undercount due to underreporting by household respondents?
2. What characteristics of sampled persons are associated with underreporting?
Analytic Sample
The analytic sample is derived from the household respondent’s reported hospital events. Once
permission is obtained from the household respondent, providers are contacted in order to obtain hospital
event records. Cooperating facilities provide medical and billing records for all the sampled person’s events.
This process produced 4,259 person‐hospital pairs in 2008. Of these 4,259 person‐hospital pairs, 3,434 have a
positive count of emergency department visits in both the HC and MPC. Additionally, there are 825 person‐
hospital pairs with a positive count of emergency department visits in the MPC but none in the HC.
Once we extracted the analytic sample of 3,434 person‐hospital pairs, we compared counts of emergency
department visits between the HC and MPC, using the MPC count as the gold standard. We used
multivariate logistic models and calculated odds ratios to identify characteristics of persons in the sample
significantly associated with accurate reporting and substantial underreporting in the HC.
RESULTS
For two‐thirds (66.5%) of the person‐hospital pairs, there is perfect agreement between the HC and the
MPC in the number of emergency department visits. In addition, 10.7% of the person‐hospital pairs have
overreporting in the HC relative to the MPC. However,
22.9% of the person‐hospital pairs have underreporting:
4.8% pairs with underreporting of two emergency
department visits and 4.4% with underreporting of three or
more (Table 3).
As a consequence of these differences, the estimate of
aggregate emergency department visits varies depending on
the data source (Table 4). Using the public use file HC‐121
(www.meps.ahrq.gov/mepsweb/data_stats/download_data_
files_detail.jsp?cboPufNumber=HC‐121), there were 56.1
Table 3. Comparing Counts of Emergency Department Visits among Person‐Hospital Pairs
HC‐MPCDifference
Percent distributionN = 3,434
≤ –3 4.4–2 4.8–1 13.70 66.51 9.02 1.2
≥3 0.5

98
million emergency department
visits in 2008. The 3,434 person‐
hospital pairs originating in the HC
produce an estimate of 42.7 million
emergency department visits. In
contrast, using the MPC as the
source (for the same 3,434 person‐
hospital pairs), the estimate is 51.2
million such visits. Also, there are an
additional 12.7 million visits that are
only identified in the MPC. These
are from a very select sample,
however. That is, a person who had
at least one household‐reported
hospital event for which the hospital
responded in the MPC, and the
hospital reported an ER visit that
was not reported by the household
respondent. Nonetheless, the existence of these unreported visits indicates that underreporting is not limited
to undercounting of visits for reported users but also extends to nonreporting of any hospital use.
We also constructed two multivariate logistic models to examine characteristics associated with
accuracy of reporting. One model represented fully accurate reporting (the HC and MPC counts were
equal); an alternative model represented substantial underreporting (the HC count was at least three less
than the MPC count). A number of characteristics of the sample person in the person‐hospital pair were
included in the models: income, marital status, sex, age, race/ethnicity, consistency of respondent during the
reference year, health insurance status, number of chronic conditions, presence of health limitations,
perceived health status, and usual location of care (Table 5).
Accurate Reporting
Those person‐hospital pairs with a doctor’s office as the sample person’s usual source of care were 2.86
and 1.41 more likely to show accurate reporting compared to those with an emergency department or other
hospital department, respectively, as their usual location of care. Person‐hospital pairs with privately
insured sample persons were 1.52 times more likely to show accurate reporting compared to those with
public health insurance. Those in excellent, very good, or good health were 1.59 times more likely to be
accurate reporters compared to those reporting fair or poor health. With respect to demographic
characteristics, those White (1.96 or 1.39), male (1.32), age 65 and older (1.41), married (1.56), and having a
high income (400% or more of the Federal poverty level; 1.84) were more likely to be accurate reporters
compared to their respective reference categories (Table 6).
Substantial Underreporting
In contrast to accurate reporters, Asians, Blacks, those in fair or poor health, those with public insurance,
and those reporting more than one chronic condition were more likely to be substantial underreporters.
Asians and Blacks (4.31 and 1.95) were more likely to be associated with substantial underreporting
compared to Whites. Those in fair or poor health were 3.14 times more likely to be substantial
Table 5. Estimated Aggregate Emergency Department Visits, by Data Source
Data Source Estimate(millions)
2008 MEPS‐HC (reports for all sample persons weighted) 56.1HC Analytic Total (3,434 pairs weighted) 42.7MPC Analytic Total (3,434 pairs weighted) 51.2MPC Additional (825 pairs weighted where HC ED counts = 0) 12.7
Table 4. Multivariate Logistic Models
Dependent Variables
Accurate reporting: 1 if HC‐MPC ED visit count, 0 otherwise Substantial underreporting: 1 if HC‐MPC ≤ –3, 0 otherwise
Independent Variables
Income Health insurance status Marital status Number of chronic health conditions Sex Health limitations Age Perceived health status Race/Ethnicity Usual location of health care Original respondent

Proceedings of the 10th Conference on Health Survey Research Methods 99
underreporters compared to those in excellent, very good or good health. Those with public health
insurance were 1.99 times more likely than those with private health insurance to be substantial
underreporters. Finally, those having one or more chronic conditions were 1.95 more times likely to be
substantial underreporters compared to those with no chronic conditions (Table 7).
Table 6. Accurate Reporting Model (HC‐MPC = 0)—Significant Odds Ratios
Significant Odds Ratio Odds Ratio Reference Category
Usual location of care is doctor’s office 2.86 Usual location of care is hospital emergency departmentPrivate health insurance 1.52 Public health insuranceExcellent/Very good/Good health 1.59 Fair/poor healthUsual location of care is doctor’s office 1.41 Usual location of care is hospital, not emergency departmentWhite 1.96 AsianHigh income 1.84 PoorMarried 1.56 WidowedAge 65+ 1.41 Age 18–64White 1.39 BlackMale 1.32 FemaleSignificantly different from reference category (p < 0.05).
Table 7. Substantial Underreporting Model (HC‐MPC ≤ –3): Significant Odds Ratios
Significant Odds Ratio Odds Ratio Reference Category
Asian 4.31 WhiteFair/Poor health 3.14 Excellent/very good/good health Public insurance 1.99 Private health insuranceBlack 1.95 WhiteOne or more chronic conditions 1.95 No chronic conditions Significantly different from reference category (p < 0.05).
DISCUSSION
While it is likely that the HC and MPC will agree on the number of emergency department events
(66.5%), two issues emerge from these analyses with regards to household reporting of hospital events. First,
there is a greater propensity to underreport (22.9%) emergency department visits than to overreport (10.7%).
Second, there is a substantial number of emergency department visits not reported by the household
respondent (at least 12.7 million). Characteristics of those identified as substantial underreporters (HC‐MPC
≤ –3) are Asian, Black, in poor or fair health, having more than one chronic condition, and having public
health insurance.
Taking into account the finding of underreporting and nonreporting partially explains the observed
differences in estimates of aggregate emergency department visits between the MEPS and NHAMCS. Still,
the observed underreporting and nonreporting does not entirely close the gap between the two surveys.
While potential adjustment strategies are not clearly revealed through this analysis, factors that also should
be considered include representativeness of the sample, how households vs. providers define an emergency
department visit, respondent (who responds for the entire household) vs. sampled person characteristics,
and misclassification of events. In addition, instrument redesign could be considered in order to elicit more
accurate reporting and minimize the likelihood of underreporting, nonreporting, and misclassification,
especially for those respondents with characteristics associated with substantial underreporting.

100
MEPS and the NHAMCS data sources have unique advantages and disadvantages when used to
examine patterns of emergency department visits, making the different data sources appropriate for
different applications. For example, MEPS may be better suited for trend analysis or behavioral research,
while NHAMCS may be preferable for generating estimates of the aggregate number of emergency
department visits. Understanding the design, population coverage, and estimates from each of the data
sources is therefore critical to choosing the most suitable data source to study emergency department care.
Whether working with one or multiple data sources, it is important for researchers to assess the strengths
and limitations of the particular source(s) being used and to use caution when interpreting and comparing
estimates (Machlin et al. 2001; Machlin & Zodet, 2007; Owens et al., 2010; Rhoades, Cohen, & Machlin, 2010).
ACKNOWLEDGMENTS
The authors wish to thank Jessica Banthin for her helpful review of this paper. In addition, the authors
wish to thank Zhengyi Fang of Social Scientific Systems for programming support.
REFERENCES
Machlin, S. R., Valluzzi, J. L., Chevarley, F. M., & Thorpe, J. M. (2001). Measuring ambulatory health care use in
the United States: A comparison of 1996 estimates across four federal surveys. Journal of Economic and Social
Measurement, 27, 57–69.
Machlin, S. R., & Zodet, M. W. (2007, October). A methodological comparison of ambulatory health care data collected in
two national surveys. Agency for Healthcare Research and Quality Working Paper No. 07001. Available at
http://gold.ahrq.gov
Owens, P. L., Barrett, M. L., Gibson, T. B., Andrews, R. M., Weinick, R. M., & Mutter, R. L. (2010). Emergency
department care in the United States: A profile of national data sources. Annals of Emergency Medicine, 56, 150–
165.
Rhoades, J. A., Cohen, J. W., & Machlin, S.R. (2010, September). Methodological comparison of ambulatory health care
use estimates from the Medical Expenditure Panel Survey and other data sources. Joint Statistical Meeting, ASA
Proceedings, Vancouver, Canada.

Proceedings of the 10th Conference on Health Survey Research Methods 101
Assessing the Accuracy of Prescription Drug Purchase Data for Medicare Beneficiaries in the Medical Expenditure Panel Survey1
Marc W. Zodet, Steven C. Hill, and Samuel H. Zuvekas (Center for Financing, Access and Cost Trends, Agency for Healthcare Research and Quality)
INTRODUCTION
The Medical Expenditure Panel Survey (MEPS) collects data on health care utilization, expenditures,
sources of payment, insurance coverage, and health care quality measures. The survey, conducted annually
since 1996 by the Agency for Healthcare Research and Quality (AHRQ), is designed to produce national and
regional estimates for the U.S. civilian noninstitutionalized population (Ezzati‐Rice, Rohde, & Greenblatt,
2008). In particular, MEPS data has the capacity to support studies of prescription drug utilization and
expenditures in the United States. Moreover, these data are widely used by researchers for behavioral
modeling and policy simulations. Given the potential for MEPS data to shape national health care policy, the
validity of the data is critical.
Information on prescription medicine use in MEPS is collected during household interviews in a series
of five rounds. At each round, respondents are asked to enumerate all prescription drug acquisitions and
the number of times each drug was obtained for all family members. Annual use counts are derived for each
person by summing across rounds in the calendar year. Prescription medicine utilization is measured as (1)
the total number of drugs and (2) the total number of drug acquisitions (i.e., number of fills/refills).
Additional information about payments for these prescription drugs is collected via follow‐back interviews,
but this study focused only on the utilization measures (i.e., number of drugs and number of fills/refills).
The objectives of this study were to assess the quality of the MEPS household‐reported prescription drug
utilization data via a matched comparison with Medicare administrative claim records and to investigate
whether reporting errors lead to systematic biases in behavioral analyses of the MEPS prescription medicine
data.
BACKGROUND
The accuracy of other forms of health care service use in the MEPS has been the subject of various
validation studies. For example, in a linked study of MEPS and Medicare claims data, Zuvekas and Olin
(2009a, 2009b) found inpatient stays and number of inpatient nights were accurately reported. MEPS
respondents, however, underreported office visits by 19%, emergency department visits by 34%, and
Medicare expenditures by 12%. Nonetheless, behavioral analyses are not likely to be significantly affected
by misreporting, because variation in underreporting across subgroups was small in magnitude even when
statistically significant.
Validation studies of reported prescription drug use in other surveys typically find high accuracy but
variation across drugs (e.g., Klungel et al., 2000). The accuracy of drug use reporting varies with drug
characteristics and amount of drugs used. Other studies report measures of agreement for drug classes and
find agreement varies greatly (Nielsen, Søndergaard, Kjøller, & Hansen, 2008.). Most studies have focused on
1 The views expressed in this paper are those of the authors and no official endorsement by the Department of Health and
Human Services or the Agency for Healthcare Research and Quality is intended or should be inferred.

102
people with specific conditions or specific classes of drugs, or validated data collected for specific studies.
Poisal (2003–2004) evaluated many measures of use in the U.S. Medicare Current Beneficiary Survey
(MCBS) before the Medicare Part D program started. Respondents reported 82.3% of fills or refills found in
pharmacy data, but 23% of respondents reported fills not found in the pharmacy data. Apparent
overreporting may reflect incomplete pharmacy data or free samples, and Poisal made assumptions about
the amount of missing pharmacy data to estimate the accuracy of the MCBS.
METHODS/ANALYTIC APPROACH
Data
We used the Medicare Part D claims as our validation data for this study. The Medicare Part D program
began on January 1, 2006. Beneficiaries may obtain Part D coverage through either a prescription drug plan
or a Medicare Advantage plan. The Medicare Part D Denominator files indicate the months beneficiaries
were enrolled in either of these two plans. The MEPS Prescription Drug Event files contain drug claims from
both types of plans.
The MEPS analytic sample was constructed by matching MEPS Medicare beneficiaries to their Medicare
administrative data. We selected MEPS Medicare beneficiaries from 2006 and 2007. These MEPS
beneficiaries were asked to voluntarily provide their Medicare card number so that their Medicare records
could be located and used for statistical research purposes. Summary of the matching process is found in
Table 1.
Table 1. Matched Sample of MEPS Medicare Part D Beneficiaries (2006–07) & CMS Claims Data
MEPS sample members reporting Medicare coverage 7,293
Exclusions
Sample members with no identifiers for matching or did not match 4,479
Sample members with <12 months of Part D coverage or institutionalized for any part of the year 1,515
Sample members who used Veterans Administration or other federal pharmacies 28
Final number of matched sample members 1,271
Since our matched sample was not random, we adjusted the MEPS standard sampling weights to reflect
the Medicare population. A logistic regression found that MEPS Medicare beneficiaries that matched to
Centers for Medicare and Medicaid Services (CMS) data were more likely to be the household respondent,
report their race as White compared with non‐White, have completed high school, and have at least one
prevalent, chronic condition compared with the Medicare beneficiaries who did not match exactly or who
did not provide their HICN or SSN for the matching. We used a propensity‐score reweighting procedure
based on this regression to adjust the standard MEPS weights for differences in sociodemographic and
interview characteristics in the likelihood of matching to CMS enrollment files. Applying the adjusted
weight, we found no statistically significant differences in expenditures, and differences in survey‐reported
drug use between the matched and unmatched samples diminished but were not eliminated. This adjusted
weight was used for all analyses.
Measures of Medication Use
Our two dependent variables of interest from the matched data are the number of distinct drugs and the
number of fills/refills (i.e., the number of times each drug was obtained during the year). Drugs are defined
as active ingredients (e.g., atorvastatin, omeprazole, clopidogrel). So if a person obtains the brand name and

Proceedings of the 10th Conference on Health Survey Research Methods 103
generic for the same active ingredient, we count that once. If the person obtains both the regular drug and
the extended release version or different strengths, we count that once. To ensure comparability, we
excluded some drugs from both the MEPS and claims data. These are drugs not covered under Part D (e.g.,
barbituates, over‐the‐counter drugs, nearly all vitamins and minerals), drugs purchased during inpatient
stays (rarely covered under Part D), and insulin and syringes (in MEPS, such information is collected
differently than for other pharmaceutical items).
Control Variables
We created the following sociodemographic variables from the MEPS. Age was categorized as under 65,
65–74, 75–84, and 85 and older. Binary indicators represent the following categories: female, non‐White,
Hispanic, married, and living in an MSA. Region was categorized as North, South, Midwest, and West.
Family income was coded as below 100, 100–199, and 200% or more of the federal poverty line (FPL).
Education was categorized as <12, 12, and >12 years. There are five categories of perceived health: excellent,
very good, good, fair, and poor. Binary indicators represented one, two, or three or more prevalent, chronic
conditions (active asthma, diabetes, emphysema, high blood pressure, high cholesterol, ischemic heart
disease, stroke, and arthritis or joint pain). A cognitive limitation indicator was coded “1” for persons who
experienced confusion or memory loss, had problems making decisions, or required supervision for their
own safety. An activity limitation indicator was coded “1” if the person received help or supervision with
any activities of daily living (ADLs) or instrumental activities of daily living (IADLs) “because of
impairment or physical or mental health problem.” Medicaid was coded “1” if the person had Medicaid
coverage any time during the year. Private drug coverage any time during the year was divided into
coverage through an employer or union or other private coverage. We also constructed indicators
describing the interviews and how utilization data were obtained for each beneficiary. Interview language
was classified as entirely in English or at least one MEPS interview was in a language other than English.
We classified reporting of drug use data into one of three categories: self‐reported indicates that the sample
beneficiary was the household informant in her last interview, household proxy indicates that use data were
reported by a proxy living in the household, and nonresident proxy indicates that a person outside of the
household reported use data for the sampled person. Finally, we created an indicator for year in survey.
Analytic Approach
We used both a descriptive approach and a modeling approach to assess the validity of the MEPS data.
First, as part of the descriptive analysis, we examined weighted distributions of number of drugs and
number of fills from each data source. We calculated Lin’s concordance correlation coefficient to assess the
agreement in measures between MEPS and the claims data. This coefficient contains measurement of both
precision and accuracy and is used to assess the agreement between continuous variables. The correlation
coefficient ranges from –1.0 (perfect disagreement) to 1.0 (perfect agreement) (Lin, 1989).
Second, we utilized negative binomial regression models to evaluate any potential differences in the
predictive effects of the above‐mentioned control variables. The regression analysis involved fitting two
models for each dependent variable: one where the dependent variable is based on the MEPS data and one
where the dependent variable is based on the claims data. Using the same set of explanatory variables (i.e.,
control variables) in each model, we calculated the marginal effect for each explanatory variable. We
formally tested whether the effect of each covariate was the same in the pairs of regressions. For example,
does poor health increase the number of drugs by the same magnitude whether using the household‐
reported or claims‐based measure? Because coefficient estimates and the marginal effects are interpretable

1
a
t
m
t
T(
IdNNNNS*
R
D
s
w
a
o
(
d
p
(
m
r
f
d
6
F
t
t
m
o
M
d
g
1
104
as random va
two (correlate
All analy
matched and
the MEPS sur
Table 2. Compa2006–2007)
ndicator of andrugs (0/1) Number of druNumber of fillsN = 1,271. NOTE: All estimaSE = standard err*** p‐value < 0.0
RESULTS
Descriptive
Table 2 co
sample. Ther
with an agree
agreement (L
Figures 1
overlaid dens
(MEPS/claim
drugs and nu
prescription f
(the dashed l
means). On a
respondents t
fewer drugs c
documented
6.5 vs. 8.5. Th
Figure 1 with
the MEPS dis
to the claims
measured by
overall conco
MEPS and cla
drugs at the p
good: 0.71 on
1.0, but respo
ariables, the c
ed) random v
ses used the
unmatched
rvey.
arison of MEPS
M
y 0.95
ugs 6.52 s 37.40
ates were weightror. 01 for difference
Analyses
ompares mea
e were no di
ement rate of
Landis & Koc
and 2 show
sity distribut
s) for numbe
umber of
fills, respecti
ines represen
average, MEP
tended to rep
compared to
in the claims
his is illustrat
h the higher p
stribution com
distribution.
Lin’s statisti
ordance betw
aims number
person level
n a scale from
ondents in M
comparison o
variables.
adjusted ME
samples and
S Household R
MEAN
MEPS
(0.01)
(0.20) (1.60)
ted using the pr
e between MEPS
an utilization
fferences in t
f 0.97 (95% C
ch, 1977).
the
tions
er of
vely
nt
PS
port
what is
s data:
ted in
peak in
mpared
. As
ic,
ween the
r of
was
m –1.0 to
MEPS did
of marginal e
EPS sampling
d accounted f
Reported Annu
(SE)
Claims
0.95 (0.
8.49 (0.38.2 (1.
opensity score‐d
S and claims mea
n based on cl
the proportio
CI: 0.96–0.98)
Figure 1. De
N = 1,271. Das
effects was an
g weights to
for the stratif
ual Drug Use &
RatMea
01) 1.00
28)*** 0.7760) 0.98
derived weight f
asures of utilizat
aims and ME
on of benefici
and a κ stati
ensity DistributMa
hed lines repres
nalogous to a
compensate
fied and clus
& Medicare Par
tio of ns (SE) κ‐st
(0.01)
(0.01)(0.02)
for the matched
tion.
EPS househo
iaries reporti
istic of 0.66, i
tions for Numatched Sample
sent mean numb
a pairwise t‐
for differenc
tered (at the
rt D Claims Re
tatistic AgRa
0.66 0.9
sample.
old reports fo
ing any pres
ndicating “su
ber of Drugs, b (2006–2007)
bers of drugs.
test of the m
ces between t
PSU level) d
cords, Matche
reement ate (SE) Con
97 (0.01)
or our matche
cription drug
ubstantial”
by Data Source
means of
the
design of
ed Sample
Lin’s ncordance
0.710.81
ed
g use,
e, MEPS

P
t
n
F
o
M
m
t
m
F
T
c
o
d
r
c
f
A
o
M
n
c
g
t
f
w
c
o
a
d
c
i
c
l
M
T
m
r
m
Proceedings of
tend to under
number of m
Further analy
observed und
MEPS is for s
medications (
topical agents
medications)
The dens
Figure 2 are m
Table 2 show
concordance
or refills than
drugs. The m
reported in th
compared wi
for the analyt
As measured
overall conco
MEPS‐report
number of dr
Differenc
characteristic
groups under
those residing
found in the c
were age 65–
coverage was
of drug use w
accurately rep
drugs. In fact
claims drugs.
n English an
For most
claims (data n
ine and thos
Medicaid did
This could be
more drugs o
reported for i
medications o
the 10th Confe
rreport their
edications (T
yses suggest
derreporting
short‐term
(e.g., antibiot
s, pain
.
ity distributi
much more s
ws there is gre
for number o
n for number
mean number
he MEPS was
ith 38.2 in the
tic matched s
d by Lin’s stat
ordance betw
ted and claim
rugs at the pe
ces in reportin
cs, and some
rreported the
g in the West
claims data.
74, had high
s through an
were associat
ported for sa
t, beneficiarie
. Also, interv
nd using bottl
sociodemog
not shown). R
e enrolled in
d not. Those w
e a floor effec
or 41 or more
interviews co
obtained.
erence on Hea
Table 2).
that the
in
tics,
ions in
similar.
eater
of fills
of
of fills
s 37.4,
e claims
sample.
tistic,
ween the
ms
erson‐year le
ng vary with
of these facto
e number of
t, those with
Similarly, co
er incomes, a
employer al
ed with bette
ample membe
es who obtain
view characte
les and receip
raphic chara
Reporting pa
n Medicaid te
with fewer d
ct: when few
e fills were m
onducted in E
N
lth Survey Rese
evel was very
h some drug u
ors differ acr
drugs obtain
higher incom
oncordance fo
and had bette
so were less
er reporting o
ers who repo
ned fewer th
eristics were
pts to enume
acteristics, the
atterns varied
ended to und
drugs and few
fills are repo
more likely to
English and w
Figure 2. Den
N = 1,271. Dashe
earch Methods
y good: 0.81.
use patterns
ross medicati
ned (data not
mes, and tho
or number of
er health. Par
accurate in r
of the numbe
orted receivin
han six drugs
associated w
erate the med
e number of
d across the a
derreport, but
wer fills in th
orted, it is ha
underreport
when bottles
nsity DistributMEPS M
ed lines represen
s
and sociode
ion use meas
t shown). On
se not in Me
f drugs was h
rt D benefici
reporting the
er of drugs. T
ng free samp
s had the high
with better rep
dications obt
reported fills
age distribut
t those with h
he claims wer
arder to unde
t fills. The nu
s and receipt
tions for NumbMatched Samp
nt mean number
emographic a
sures. All soc
n average, ma
dicaid report
higher for sa
aries who re
e number of d
The number
ples and thos
hest ratio of r
porting: cond
tained.
s was similar
tion. People b
higher incom
re more likely
erreport them
umber of fills
ts were used
ber of Fills/Refple (2006–2007
rs of fills or refill
and interview
ciodemograp
arried benefic
ted more of t
mple membe
ported their
drugs. Some
of drugs was
e who used f
reported dru
ducting the i
r to the numb
below the po
mes and not i
y to overrepo
m. Those with
s was more a
to enumerat
fills, by Data So7)
ls.
105
w
phic
ciaries,
the drugs
ers who
drug
patterns
s more
fewer
ugs to
interview
ber of
overty
in
ort fills.
h 16 or
ccurately
e the
ource,

106
Regression Analyses
Some of the sociodemographic factors associated with better reporting are clearly related to each other
(e.g., health status and number of chronic conditions). So, rather than using multivariate regressions to
estimate their independent effects on reporting accuracy, we focused on the impact of reporting error in
typical behavioral analyses of health care use.
Table 3 reports the results of pairs of regressions of the determinants of prescription drug use based on
MEPS household‐reported measures and claims measures, respectively, as the dependent variable and the
same set of covariates from the matched sample. The first set of columns shows the marginal effects from
the number of drugs regressions. There were marked gradients in perceived health status and number of
chronic conditions, with no statistically significant differences between the marginal effects. Women and
beneficiaries with ADL/IADL limitations obtained more drugs, and the magnitudes and statistical
significance were similar across regressions. The differences were mainly in insurance status. The effect of
Medicaid coverage was larger for the claims‐based number of drugs (1.90) than the MEPS number of drugs
(1.05, p = 0.030). The MEPS‐claims difference was larger for the effect of reported employment‐related
insurance on number of drugs (0.40 versus 1.72, p = 0.035). Using the claims data, Hispanics were associated
with 0.01 fewer drugs, but using the MEPS measures, the effect was 1.00 drugs (p = 0.083). The magnitude of
the effect of residing in an urban area was similar across the pair of results, but the MEPS estimate was
marginally significant, whereas the claims‐based estimate was not. The effects of income were small and
statistically insignificant in both models, but the signs were reversed and the differences were statistically
significant at the 10% level. The marginal effects were small and not statistically significant in any
regressions for age, race, marital status, having a high school education, having a cognitive limitation,
reporting private drug coverage not through an employer, and residing in the Midwest, South, or an MSA.
The second set of columns in Table 3 shows the marginal effects from the number of fills or refills
regressions. Perceived health status, number of chronic conditions, ADL/IADL limitations, women, residing
outside an MSA, and Medicaid coverage were associated with more use in both sets of marginal effects. For
these variables, the marginal effects were similar and have similar levels of significance. The magnitude of
the effect of residing in the West was similar across the pair of results, but the claims‐based estimate was
marginally significant, whereas the MEPS estimate was not. The marginal effects of non‐English language
interviews were imprecisely estimated in both regressions, but the difference was statistically significant (3.7
vs. 11.1, p = 0.049). The effects of income were small and statistically insignificant in both models, but the
signs were reversed and the differences were statistically significant. For example, in the MEPS, income
more than twice the poverty line was associated with 2.9 additional fills, compared with 2.2 fewer fills in the
claims data (p = 0.015).
CONCLUSIONS
Our comparisons of household‐reported prescription drug use to Medicare Part D claims in the matched
analytic sample revealed that household respondents in the MEPS were consistent with claims when
reporting the number of fills and refills but underreported the number of drugs. Consistent with other
validation studies of reported drug use, we found that the drugs that were not reported typically have
short‐term or intermittent uses (anti‐infectives, topical agents, and pain medications), rather than
maintenance drugs.

Proceedings of the 10th Conference on Health Survey Research Methods 107
MEPS respondents typically report on drug use over a five‐month period, so drugs that were used early
in the reference period could be forgotten at the time of the interview. Generally, marginal effects from drug
use and expenditure regressions have the same sign and often similar magnitudes.
Table 3. Comparison of MEPS & Claims‐Based Drug Use Regression Model Results, Matched Sample (2006‐2007)
NUMBER OF DRUGS NUMBER OF FILLS OR REFILLS
MEPS Part D Claims MEPS Part D Claims
CHARACTERISTIC Marginal Effect (SE)
Marginal Effect (SE)
Difference(p‐value)
Marginal Effect (SE)
Marginal Effect (SE)
Difference(p‐value)
Age 65–74 −0.40 0.44 −1.08 0.72 0.183 −1.9 3.4 −3.9 3.9 0.51675–84 −0.44 0.46 −0.40 0.71 0.921 −5.2 3.2 −2.8 3.7 0.41785+ −0.64 0.64 −0.79 0.96 0.834 4.3 5.6 2.0 5.8 0.581
Nonwhite −0.16 0.33 0.01 0.56 0.680 −3.7 2.7 −3.8 2.6 0.939
Hispanic −1.00* 0.58 −0.01 0.85 0.083 −4.9 4.4 −5.3 4.4 0.865
Women 1.23*** 0.31 1.53*** 0.39 0.264 6.7*** 2.3 5.8** 2.3 0.602
Married −0.14 0.36 −0.58 0.48 0.151 0.5 2.8 −0.1 2.8 0.748
Region Midwest 0.31 0.54 0.60 0.69 0.523 4.7 4.7 4.1 4.8 0.757South −0.13 0.46 −0.48 0.67 0.419 −0.9 4.3 −2.3 4.5 0.540West −0.12 0.52 −1.07 0.68 0.013 −6.2 4.2 −7.8* 4.3 0.415
MSA −0.72* 0.40 −0.72 0.51 0.993 −9.2*** 3.5 −7.2** 3.1 0.297
Family Income 1–2× FPL 0.28 0.37 −0.32 0.50 0.078 4.4 2.8 −1.3 3.0 0.003>2× FPL 0.44 0.42 −0.24 0.60 0.057 2.9 3.2 −2.2 3.5 0.015
Education (years) 12 0.13 0.32 0.20 0.50 0.855 −1.5 2.6 −0.2 2.7 0.477>12 1.00** 0.42 1.35** 0.62 0.394 1.9 3.4 1.1 3.1 0.737
Perceived Health Very good 1.41*** 0.40 1.48** 0.63 0.979 11.0*** 3.0 11.0*** 2.8 0.598Good 2.53*** 0.44 2.55*** 0.71 0.937 19.6*** 3.4 18.1*** 3.3 0.223Fair 3.49*** 0.49 4.15*** 0.71 0.401 24.4*** 3.1 21.8*** 3.1 0.141Poor 5.09*** 0.64 5.69*** 0.93 0.453 40.4*** 5.7 30.7*** 5.1 0.011
Chronic Conditions 1 1.51*** 0.40 2.91*** 0.61 0.004 8.8*** 2.4 10.8*** 2.4 0.6022 3.22*** 0.40 3.97*** 0.55 0.053 19.6*** 2.6 20.0*** 2.9 0.951≥3 5.50*** 0.39 7.09*** 0.49 0.001 35.5*** 2.6 34.8*** 2.4 0.764
Cognitive Limitation 0.38 0.36 0.13 0.57 0.546 −0.7 3.0 −1.3 3.1 0.773
ADL/IADL Limitation 1.05** 0.42 1.31** 0.52 0.397 7.5** 3.1 9.5*** 3.2 0.322
Insurance Medicaid 1.05** 0.42 1.90*** 0.61 0.030 9.4*** 3.4 13.1*** 3.8 0.125Employment‐related 0.40 0.55 1.72** 0.87 0.035 −0.3 4.2 3.9 4.2 0.200 Other private 0.22 0.60 −0.01 0.68 0.519 −4.5 3.5 −3.2 3.0 0.548
Non‐English Interview 0.99 0.75 2.16* 1.21 0.156 3.7 5.9 11.1 7.3 0.049 N = 1,271. NOTES: Marginal effects from negative binomial regression models. All estimates were weighted using the propensity score‐derived weight for the matched sample. *p < 0.10, **p < 0.05, ***p < 0.01 for marginal effects. ADL = activities of daily living; FPL = Federal poverty line; IADL = instrumental activities of daily living; MSA = metropolitan statistical area; SE = standard error.

108
We note two potential limitations in our comparisons of MEPS household reporting to Medicare claims.
First, we matched a large sample of Medicare beneficiaries in MEPS to claims data, but our matched sample
itself was not nationally representative of Medicare beneficiaries. However, we note that our matched
sample mirrors expenditures by the full sample of Medicare beneficiaries in MEPS when using weights
adjusted for differential matching. Second, we examined household reporting for Medicare beneficiaries
only, and our findings may not generalize to the reporting for other family members of Medicare
beneficiaries or to the rest of the U.S. population residing in households with no Medicare beneficiaries.
Elderly and disabled Medicare beneficiaries use substantially more health care services than other
Americans (Ezzati‐Rice, Kashihara, & Machlin, 2004), and a previous study and results presented here
suggest underreporting is greatest among higher use groups (Poisal, 2003–2004). To this extent, our findings
may provide an upper‐bound estimate of underreporting for the full MEPS sample. The elderly and
disabled Medicare populations differ in other important ways from the rest of the population, but it is
unclear how this would affect reporting of prescription drug use.
On average, MEPS estimates of the number of fills and inpatient use are similarly close to claims‐based
estimates. The accuracy of medication use in the MEPS compares favorably with the accuracy of medication
use in other surveys. In the MEPS, the number of fills is underreported by 2%, on average, compared with
17% in the MCBS (Poisal, 2003–2004). In the MEPS, we found households reported very few medications not
found in the claims data. While Poisal found considerably more overreported fills in the MCBS (23% of
beneficiaries overreported), the problem could be due to missing pharmacy data, whereas our study
compares the MEPS with claims data. Like the MCBS, underreporting in the MEPS is higher among
beneficiaries who obtained more fills and refills. While the MCBS and MEPS are similar surveys, the results
may not be fully comparable, because we studied beneficiaries in the Part D program, whereas Poisal
studied all Medicare beneficiaries before Part D began. After Part D began, the MCBS used the Part D claims
rather than household reports to measure use and expenditures covered by Medicare and survey reports for
use covered by other payers.2 Like Van den Brandt et al. (1991), we found accuracy decreases with the
number of drugs used. Like Caskie and Willis (2004) and Caskie et al. (2006), we found cognitive ability
does not affect reporting, but the household respondent likely reports for the more severely impaired
sampled persons. We also found, like Caskie and Willis, that accuracy increases with income.
REFERENCES
Caskie, G. I. L., & Willis, S. L. (2004). Congruence of self‐reported medications with pharmacy prescription
records in low‐income older adults. The Gerontologist, 44, 176–185.
Caskie, G. I. L., Willis, S. L., Schaie, W., & Zanjani. F. A. K. (2006). Congruence of medication information from a
brown bag data collection and pharmacy records: Findings from the Seattle Longitudinal Study. Experimental
Aging Research, 32, 79–103.
Ezzati‐Rice, T. M., Kashihara, D., & Machlin, S. R. (2004). Health care expenses in the United States, 2000. Rockville,
MD: Agency for Healthcare Research and Quality. Retrieved January 7, 2008, from
www.meps.ahrq.gov/mepsweb/data_files/publications/rf21/rf21.shtml
Ezzati‐Rice, T. M., Rohde, F., & Greenblatt, J. (2008). Sample design of the Medical Expenditure Panel Survey Household
Component, 1998–2007. Methodology Report No. 22. Rockville, MD: Agency for Healthcare Research and
Quality. Retrieved January 7, 2008, from
www.meps.ahrq.gov/mepsweb/data_files/publications/mr22/mr22.pdf
2 Personal communication with A. E. Shatto, Centers for Medicare and Medicaid Services, February 26, 2009.

Proceedings of the 10th Conference on Health Survey Research Methods 109
Klungel, O. H., de Boer, A., Paes, A. H. P., Herings, R. M. C., Seidell, J. C., & Bakker, A. (2000). Influence of
question structure on the recall of self‐reported drug use. Journal of Clinical Epidemiology, 53, 273–277.
Landis, J. R., & Koch, G. G. (1977). The measurement of observer agreement for categorical data. Biometrics, 33,
159–174.
Lin, L. (1989). A concordance correlation coefficient to evaluate reproducibility. Biometrics, 45, 255–268.
Nielsen, M. W., Søndergaard, B., Kjøller, M., & Hansen. E. H. (2008). Agreement between self‐reported data on
medicine use and prescription records vary according to method of analysis and therapeutic group. Journal of
Clinical Epidemiology, 61, 919–924.
Poisal, J. A. (2003–2004). Reporting of drug expenditures in the MCBS. Health Care Financing Review, 25, 23–36.
Van den Brandt, P. A., Petri, H., Dorant, E., Goldbohm, R. A., & Van de Crommert, S. (1991). Comparison of
questionnaire information and pharmacy data on drug use. Pharmaceutisch Weekblad Scientific edition, 13, 91–
96.
Zuvekas, S. H., & Olin, G. L. (2009a). Validating household reports of health care use in the Medical Expenditure
Panel Survey. Health Services Research, 44(5 Part I), 1679–1700.
Zuvekas, S. H., & Olin, G. L. (2009b). Accuracy of Medicare expenditures in the Medical Expenditure Panel
Survey. Inquiry, 46, 92–108.

110

Proceedings of the 10th Conference on Health Survey Research Methods 111
The RWJF Health Care Public Perceptions Index: Index Development, Results, and Support for Reform
Peter Graven (University of Minnesota)
INTRODUCTION
The health care system is undergoing a major change in how insurance is delivered in the U.S. with the
passage of the Patient Protection and Affordable Care Act (PPACA). Most of these reforms have yet to be
implemented, and understanding the effects is critical to both successful policy and additional reforms. In
light of these changes, we developed an index to measure consumers’ confidence in their health‐related
experiences and their expectation for the future. Released in April 2009, the index is designed to track
changes in public perceptions of health care during the process of health care reform and implementation of
the PPACA. The goals of this paper are to (1) describe the development of the index and its validity, (2)
describe demographic differences in index levels, and (3) show how the index related to support for reform
prior to PPACA’s passage.
The health care system affects individuals in many ways, including their sense of security. Assessing
these perceptions in their day‐to‐day lives provides a basic measure of the system’s performance. As
opposed to a narrow program with well‐defined metrics for evaluation, the PPACA health reform law
presents a broad set of changes in the system. The Robert Wood Johnson Foundation (RWJF) Health Care
Public Perceptions Index provides an opportunity to capture the impacts of many policies and provides a
bellwether measure of the impacts on confidence.
Disparities across the population in access to health care are well documented. These have translated
into varying levels of support for reform. In 2010, support for health care reform was higher among women,
younger Americans compared to those older than 65, non‐Whites compared to Whites, and those with lower
incomes (Blendon & Benson, 2010). Furthermore, research has suggested that members of the public who
have the most to gain from changes to the health care system, and thus are more self‐interested in the policy,
tend to support reform more than others. For example, people who are more confident that they can pay for
their own medical care express more support for government responsibility for health care (Jacobs &
Shapiro, 2000); people lacking health insurance support government insurance more than those who do not
(Koch, 1998); and people who are disabled, cannot afford health insurance, or have lower incomes are also
more likely to support government‐provided health insurance (Lau & Heldman, 2009). Even research that
has sought to demonstrate the relatively low predictive power of self‐interest on public policy attitudes has
found that when it comes to health insurance policy, those with more need for health insurance are more
likely to support changes to the health care system (Sears, Lau, Tyler, & Allen, 1980).
INDEX METHODOLOGY
Survey Information
The core survey sample is designed to be representative of all households in the coterminous United
States. The core of the Surveys of Consumers questionnaire is composed of 50 questions designed to track
different aspects of consumer attitudes and expectations. Added to this was the Health Care Security
supplement, which consisted of 23 questions. The monthly response rate is approximately 39% (using the

112
AAPOR Response Rate 2 calculation). The margin of error for the survey is 4.4% at a 95% level of
confidence.
Factor Analysis
Index development included a principal components factor analysis to isolate the items providing the
most efficient measure of the two targeted constructs: recent experiences and future expectations. A list of 18
items, field‐tested for relevance, generated two factors with eigenvalues greater than one, among nine items.
These items correlated exactly with the questions phrased to include recent experiences and future
expectations. Cronbach’s alpha from the inter‐item correlations is midranged at 0.85 for each construct and
the combined construct.
Item Validation
Individual items from the index are found in a variety of existing surveys. The National Health
Interview Survey (NHIS) has estimated the percent who have delayed care or skipped treatment due to cost
at 10.9% and 8.0%, respectively. These items have remained relatively stable from year to year, peaking in
2003 at 11.3% and 9.0%, respectively. In our survey, the rates are higher at 21% and 20%, respectively. The
increase is likely due to the household phrasing of the question, which asks if the respondent or anyone in
the family has delayed care. Shown in Table 1 are the levels from the RWJF survey for items used in the
index compared with the Kaiser Health Tracking poll for March 2010 (the approximate midpoint of the
survey). The Kaiser poll tends to run about 10 points higher for each of the items. A context effect is
suspected because the Kaiser poll centers on problems and issues in health care whereas the Surveys of
Consumers is more positively oriented around confidence.
Table 1. Item Validation
# Item RWJF
(24‐month average) Kaiser
(March, 2011)
1 Delayed seeing a doctor due to cost 21 302 Skipped treatment due to cost 20 283 Skipped prescription due to cost 19 264 Difficulty paying medical bills 23 305 Worried about losing coverage 25 486 Worried cannot afford serious care 49 57*7 Worried cannot afford routine care 44 57*8 Worried cannot afford drugs 42 529 Worried about bankruptcy from medical bills 27 NA
* “Not being able to afford the health care services you think you need* NA = Not available.
Index Construction
Similar to the economic index in the Surveys of Consumer Sentiment, the health index is composed of
recent and future subindices. To calculate the indices for each person, each of the nine items in the index is
given a score of 0 if negative, 1 if neutral, and 2 if positive.
The Recent Health Cost Barriers (RHCB) Index is constructed first by summing the item scores for each
person by month. Then, the base period is established by summing the total scores for the first two months
of the survey and dividing by the number of respondents in the period. The published index is calculated by
dividing the monthly score by the base period score. The scores and respondent counts are weighted.

Proceedings of the 10th Conference on Health Survey Research Methods 113
Similar to the RCHB Index, the Future Health Cost Concerns (FHCC) Index is constructed first by
summing the item scores for each person by month. However, because item 5 is only for the insured, the
weights for the other four items are increased proportionately. The base period is established by summing
the total scores for the first two months of the survey and dividing by the number of respondents in the
period. The index for each person is calculated by dividing the monthly score by the base period score. The
RWJF Index is simply the average of the two subindices. Alternatively, it can be calculated independently
using all nine items.
Index Validation
The results of the factor analysis suggest the index is capturing the concepts of recent experiences and
expectations underlying the various items in the survey. Another way to look at the performance of the RWJF
index is to compare it with other indices measuring similar concepts. The Consumer Healthcare Sentiment
Index (CHS; Pickens, 2011) is calculated from the items asked of 3,000 households per month using a
methodology nearly identical to the one developed for the RWJF Index. An early version of the index began in
March 2009, and a revamped version established its baseline in November and December 2009. Month‐to‐
month movements in the index are very similar to the CHS Index. A de‐meaned regression model of the two
indices gives an adjusted R‐square of over 52%, suggesting that although the RWJF Index moves up and down
from month to month, the movement is more likely related to actual oscillations in perceptions than random
noise. Additional tests of validation should be undertaken as more data become available.
ANALYSIS METHODOLOGY
Demographic Patterns
The demographic patterns in the data were assessed by calculating the mean index values for each
subpopulation and testing their difference from the overall total. The percentage difference is discussed to
provide a relative measure of the disparity. Data for the analysis is drawn from the survey sample between
April 2009 through the end of April 2010. This provides for 6,633 total observations.
Support for Reform
As described in the introduction, research about the relationship between public perceptions and policy
suggests that individuals who are less confident in their access to care have more to gain by policies
expanding coverage. To test this hypothesis, we looked at a another question on the survey that asks “How
important is it that President Obama include health care reform as part of his approach to addressing the
economic crisis of the United States?” This question is a bit problematic because it combines the concepts of
support for reform with how to approach the economic crisis; however, the responses are thought to be
driven by an individual’s support for reform. The percentage of those who answered “very important” or
“somewhat important” were categorized by their overall index score. The differences in the percentages
were tested using t‐tests of proportions. Additionally, we report the percentage who thought reform would
make their own finances and access better as well as the percentage who thought it would make the
country’s finances and access better. The question was fielded continuously between April 2009 and March
2010.

114
RESULTS
Demographic Patterns
As Table 2 indicates, those age 65 or older had a higher level of confidence than each of the other age
groups (18–34, 35–49, 50–64). Given the high rate of insurance, this is not unexpected. However, it is
somewhat surprising given that their health status was the lowest on average and lower health status is
associated with lower levels of confidence. Those in the 50–64 age group were significantly more confident
than the 18–34 year old age group for the recent index, but the reverse was true for the future index. Lower
overall confidence was found among minority racial/ethnic groups (17% lower for Hispanics and 8% lower
for Blacks), among the lowest third of income (16% lower), among lower education levels (9% lower for high
school or less), among females (4% lower), among those with lower health status (23% lower for fair/poor),
and among the insured (41% lower).
Table 2. Respondent Demographics
CHARACTERISTIC Population (%) Recent Mean Future Mean Overall Mean N
OVERALL 100.0 101.4 97.3 99.4 6,633
Age 18–34 16.3 93.6 100.7 97.2 76535–49 27.9 96.3 96.7 96.5 1,68450–64 30.3 98.5 90.4 94.4 2,20365+ 25.5 115.5 104.0 109.7 1,981
Race White non‐Hispanic 81.7 103.1 100.4 101.7 5,414Black non‐Hispanic 8.5 92.8 90.7 91.8 539Hispanic 6.5 93.4 72.3 82.8 355Other 3.4 100.8 86.5 93.6 196
Income Bottom third 31.9 89.4 76.5 82.9 1,791Middle third 34.0 99.0 95.5 97.3 2,151Top third 34.2 113.5 118.1 115.8 2,181
Education HS or less 33.0 97.8 83.0 90.4 2,076Some college 23.2 96.3 93.8 95.0 1,504College degree 25.8 104.9 107.3 106.1 1,724Grad studies 18.0 109.3 113.8 111.6 1,315
Sex Male 44.4 104.8 103.7 104.3 2,846Female 55.6 98.7 92.2 95.4 3,787
Health Status Excellent 18.3 115.1 120.2 117.7 1,233Very good 30.8 109.1 109.5 109.3 2,040Good 28.8 99.3 90.3 94.8 1,930Fair/Poor 22.1 82.7 70.8 76.7 1,411
Insurance Status Insured 89.7 105.5 102.7 104.1 6,065Private insurance 77.0 107.2 105.6 106.4 5,262Public insurance 40.1 107.2 98.2 102.7 2,578Uninsured 10.3 65.8 50.9 58.3 554

Proceedings of the 10th Conference on Health Survey Research Methods 115
Support for Reform
Overall, the support for reform was at 80% during the sample period. As shown in the Table 3, the
percentage supporting reform was higher for those with a low overall index score. These results suggest that
the policies in the reform were targeted at those lacking access. Similarly, a higher percentage of people with
lower confidence responded that it was likely to improve their own finances and access. When asked about
how the reform would affect the country’s finances and access, the results did not display a similar trend.
This suggests that the trend is not just a function of having low confidence in the future.
Table 3. Importance of Health Reform
Impact on Self Impact on CountryFHCCI index Reform Important Access Better Finance Better Access Better Finance Better
0 92% 28% 26% 40% 33%1–32 84% 17% 16% 31% 26%33–75 83% 16% 14% 34% 26%76–125 81% 18% 16% 38% 33%126–157 75% 10% 6% 39% 32%158 76% 8% 7% 39% 33%
TOTAL 80% 14% 13% 38% 31%
DISCUSSION
PPACA presents many changes to the health care system that may affect health confidence in many
ways. Given the difficulty of knowing what issues may arise once health reform is implemented, a broad
measure of the system, rather than individual features that may be irrelevant after reform, may be desirable.
The RWJF indices provide a valuable opportunity to evaluate a broad‐based measure of the effects of health
reform. The index itself, however, primarily covers items related to access and cost. Therefore, changes in
the system that do not pertain to these will be missed. Concerns about choice of plans and potential
interference in the doctor‐patient decision are examples of topics that may be affected by reform but may
not show up in the items of the index. The index is scheduled for suspension in April of 2011. Nonetheless,
with two years of consistent monitoring, it is well poised to be re‐instituted once implementation of PPACA
is further along. Also, due to the similarity with the Thomson Reuters Healthcare Sentiment Index, it may be
possible to use the results from that index as a proxy for months missing in the RWJF Index.
ACKNOWLEDGMENTS
This research was funded by the Robert Wood Johnson Foundation. Sarah Gollust and Lynn Blewett
have contributed as co‐authors to this project but are not directly responsible for this publication. I would
like to acknowledge Kathleen Call, Michael Davern, and the University of Michigan Survey Research Center
for their contributions to the development of the index. I also would like to thank Joel Cohen, as discussant,
for his helpful comments on a draft of this document. The errors are, of course, the author’s.
REFERENCES
Blendon, R., & Benson, J. (2010). Public opinion at the time of the vote on health care reform. New England Journal
of Medicine, 362, e55(51)–e55(56).

116
Jacobs, L., & Shapiro, R. (2000). Politicians donʹt pander: Political manipulation and the loss of democratic responsiveness.
Chicago: University of Chicago Press.
Koch, J. (1998). Political rhetoric and political persuasion: The changing structure of citizens’ preferences on
health insurance during policy debate. Public Opinion Quarterly, 62, 209–229.
Lau, R., & Heldman, C. (2009). Self‐interest, symbolic attitudes, and support for public policy: A multilevel
analysis. Political Psychology, 30, 513–537.
Pickens, G. (2011). Thomson Reuters Consumer Healthcare Sentiment Index: Background, methods, and baseline results.
Retrieved June 21, 2011, from
http://healthcarescience.thomsonreuters.com/Indexes/assets/H_PAY_EMP_1103_8558_CHSI_White_Paper_W
EB.pdf
Rottinghaus, B. (2007). Following the “mail hawks”: Alternative measures of public opinion on Vietnam in the
Johnson White House. Public Opinion Quarterly, 71(3), 367–391.
Sears, D., Lau, R. R., Tyler, T., & Allen, A. M. (1980). Self‐interest versus symbolic politics in policy attitudes and
presidential voting. American Political Science Review, 74, 670–684.
APPENDIX. ITEM WORDING
J1: In the past 12 months, was there any time when you (or someone in your family living there) delayed
seeing a doctor when it was necessary because of the cost? (Yes/No/Don’t know)
J2: In the past 12 months, was there any time when you (or someone in your family living there) skipped a
recommended medical test, treatment, or follow‐up because of the cost? (Yes/No/Don’t know)
J3: In the past 12 months, was there any time when you (or someone in your family living there) did not fill
a prescription because of the cost? (Yes/No/Don’t know)
J4: In the past 12 months, did you (and your family living there) ever have difficulty paying for your
medical bills? (Yes/No/Don’t know)
J5: [If insured] At this time, how worried are you that you will lose your health insurance coverage in the
next 12 months? Are you very worried, somewhat worried, not too worried, or not worried at all?
J6: Thinking about the future, how worried are you that you will not be able to afford treatment if you (or
someone in your family living there) become(s) seriously ill? (Are you very worried, somewhat worried,
not too worried, or not worried at all?)
J7: Thinking about the future, how worried are you that you will not be able to afford all of the routine
health care services you (and your family living there) might need? (Are you very worried, somewhat
worried, not too worried, or not worried at all?)
J8: Thinking about the future, how worried are you that you will not be able to afford all of the prescription
drugs you (and your family living there) might need? (Are you very worried, somewhat worried, not
too worried, or not worried at all?)
J9: Thinking about the future, how worried are you that you will go bankrupt from not being able to pay
your (family’s) medical bills? (Are you very worried, somewhat worried, not too worried, or not
worried at all?)
Proceedings of the 10th Conference on Health Survey Research Methods 117
SESSION 2 DISCUSSION Joel W. Cohen (Division of Social and Economic Research,
Center for Financing, Access and Cost Trends, Agency for Healthcare Research and Quality)
The papers in this session cover many of the critical issues health care reform is designed to address. The
main goal of the recent Affordable Care Act (ACA) is to provide insurance coverage to many more Americans,
and the mechanism is expansion of both public and private insurance. In addition, with health care costs
accounting for more than 18% of the Gross Domestic Product and continuing to rise faster than other sectors of
the economy, the issue of how to encourage the most efficient provision of care and contain costs without
harming quality of care are vitally important. Finally, as we have seen in the debate of the health care reform
bill, public perceptions of the health care system and potential changes to it can shape the political landscape
in the country, which in turn has substantial impacts on whether and how policies are implemented.
Survey data have a vital role in informing policy makers and the public about the parameters of the
current system and what the effects of specific changes to that system would be. For example, in addition to
basic descriptive and behavioral analyses, survey data are at the core of every major microsimulation model
used by policymakers to evaluate proposals for change. Survey data also have a number of advantages over
administrative data in monitoring and analyzing the U.S. health care system. While administrative data are
designed for specific purposes and can be used effectively in some types of analyses, they typically are
drawn from selected populations, are not flexible with respect to tailoring or changing the information
collected, and tend to be very difficult to access. In contrast, surveys provide generalizable data, can be
tailored to specific purposes, and typically are widely disseminated.
As background for my comments, I would like to start with a few personal principles I have found
helpful in guiding my work on survey design and data analysis over the last two decades. I think they are
relevant to the papers in this session and are useful to keep in mind when engaged in collecting and
analyzing survey data, particularly in terms of maintaining realistic expectations as to what can be done in
surveys. These principles are as follows:
1. Nothing is simple in the U.S. health care system,
2. Insurance coverage is harder to measure than you think,
3. Obtain estimates of ostensibly the same thing from two different sources, and you’ll get two
different estimates, and
4. Respondents don’t know what they don’t know.
For the most part, these points are self‐evident, but my experience has been that it is easy to forget them
when engaged in the pursuit of some important policy‐relevant piece of information. For example, an
analyst might want to do a survey to find the answer to what seems to be a fairly simple question—say, how
many people are uninsured. Points one and two are relevant here. First, although it may seem on the surface
relatively straightforward to tell whether someone is insured, in the U.S. system there are a number of gray
areas. For example, if an individual is eligible for care for a service‐connected illness through the
Department of Veterans Affairs or for care at an Indian Health Service facility, is that the same as having
private insurance or Medicare, which provide broad coverage of illnesses and sites of care? How exactly is
insurance coverage defined, and how do you operationalize that definition in a household survey? Second,
distinguishing between different types of insurance, which is critical for policy purposes, can be very
difficult in a survey. For example, research has shown that many Medicaid beneficiaries think they are

118
covered by nongroup private insurance, even though the alleged private insurance is really Medicaid
coverage purchased through a private insurer by the state. Given that, how does one distinguish between
private and public coverage in a household survey? Insurance coverage is a good example of point three as
well. Different national surveys produce very different estimates of the number of uninsured people in the
U.S. Some of this is due to differences in samples, reference periods, and scope, but the differences exist
even for surveys in which the populations covered and definitions of coverage and insurance are ostensibly
comparable.
Finally, the 4th point refers both to the fact that respondents often just can’t answer a question
accurately—for example, how much did your employer pay for your health insurance?—and to situations in
which they think they are answering correctly but are unaware they are not. For example, in reporting how
much was paid in total for their doctor visits, respondents often will subtract their out‐of‐pocket payments
from the total charge appearing on a bill and tell you that insurance paid the rest, not aware that the insurer
has negotiated a discounted fee with the provider. Government subsidies for insurance are particularly
likely to be susceptible to this lack of awareness problem, which brings us to the specific papers presented in
this session.
SELF‐REPORTS OF PREMIUM ASSISTANCE (RUCINSKI)
This paper uses random samples from phone lists and administrative records to address the extent to
which household respondents can report subsidies. The author finds that with a phone‐based sample,
government subsidies are less likely to be reported than private subsidies, and that even when using
samples selected from lists of beneficiaries of government programs, less than half of respondents report
receiving subsidies for their insurance coverage. The findings based on the beneficiary sample are
particularly instructive, since selecting a sample from administrative records of who is signed up provides a
“gold standard” for determining whether someone is covered. Unfortunately, no national gold standard for
determining who receives public and private subsidies currently exists.
The findings from this study confirm that household respondents are not very good at reporting this
kind of information. It is very difficult to get accurate information about insurance coverage from simple
survey questions. Public coverage often gets mistaken for private coverage, because respondents think they
are covered by, for example, Kaiser’s private plan, but it is really Kaiser’s Medicaid plan. Subsidies are
particularly difficult to determine from household respondents because there are often transactions
occurring behind the scenes about which respondents are not aware. In addition, it is very difficult to sort
out Medicaid from Children’s Health Insurance Plan (CHIP) coverage, since eligibility can depend entirely
on an income cut‐off, although the premium subsidy structures of the two programs are very different.
These issues are very likely to present a problem for monitoring changes produced by the ACA because
employer and government subsidies implemented under the act can be very complicated. Interactions
between employers, health insurance exchanges, and Medicaid/CHIP are likely to make determining the
sources and amounts of subsidies extremely difficult for household survey respondents. The Health and
Retirement Survey (HRS) approach has promise in at least determining how much of this information about
which a respondent may be aware, but that will not necessarily lead to accurate responses about the
amounts of subsidies. The additional questions needed to determine levels of awareness also could be
prohibitive in terms of respondent burden.

Proceedings of the 10th Conference on Health Survey Research Methods 119
IMPROVING THE AMERICAN COMMUNITY SURVEY (KENNEY & LYNCH)
This presentation examines the validity of insurance coverage estimates from the American Community
Survey (ACS). The findings indicate that ACS insurance estimates are consistent with those from other
national surveys for most types of coverage. The ACS does appear to have high estimates of the number of
people with nongroup coverage and also has low estimates of the number of persons covered under
Medicaid and CHIP. The authors propose some adjustments to the original nongroup and Medicaid/CHIP
numbers based on logical edits that appear to improve those estimates, although even after the edits, the
nongroup estimates still appear to be high and the Medicaid/CHIP estimates still somewhat low compared
with administrative totals.
There are a number of features of the ACS that make it very useful for monitoring the effects of health
reform. It is a very large survey, has very high response rates, and supports small area estimates; further, in
general, the ACS‐based estimates of insurance coverage look reasonable relative to other sources. Thus, the
ACS is an excellent addition to the available data infrastructure on insurance coverage, even though it does
risk adding to the concern about why estimates differ across surveys.
A main focus of this analysis is public coverage. Public coverage is an important issue in using survey
data to evaluate the effects of reform because, as noted previously, reporting tends to be poor for Medicaid
and CHIP beneficiaries. Comparisons between survey and administrative data consistently show that
Medicaid coverage tends to be substantially underreported in surveys. Because the ACA addresses a large
portion of the uninsured problem by expanding public coverage, accurate estimates of both public coverage
and the uninsured are critical to evaluating the impact of reform. Adjustment strategies can help, but in
using them, analysts have to be careful not to make asymmetric adjustments that introduce bias into the
data. For example, adjustments such as switching some uninsured to public coverage but no publicly
insured to uninsured can bias estimates and behavioral analyses. Also, changes in editing procedures can
make trend analyses difficult, as it may be difficult to later disentangle a shift in the trend resulting from a
change in policy from a shift due to a new edit. Of course, this is a problem faced by all ongoing surveys.
COMPARING COUNTS OF ED VISITS (RHOADES, COHEN, MACHLIN, & ROEMER)
This analysis compares counts of emergency department visits from the MEPS household survey with
similar data from the MEPS provider survey to determine the extent and reasons for differences in total
visits counts between MEPS and other sources of emergency department (ED) visit data. Historically, MEPS
ED visit totals have been consistently lower than those produced by other surveys, although totals for
overall ambulatory visits, including office‐based and outpatient‐based care, are very similar. MEPS,
however, tends to show more office‐based visits and fewer ED visits than the National Center for Health
Statistics (NCHS) provider surveys, the National Ambulatory Medical Care Survey (NAMCS), and the
National Hospital Ambulatory Medical Care Survey (NHAMCS), and those differences have been consistent
over time. The reasons for the differences are not clear. Potential explanations include underreporting by
household respondents, misclassification of sites of care by household respondents, and differences in the
definition of what constitutes an ED visit from the household and provider perspectives.
This paper attempts to shed light on this issue by comparing household‐derived reports of ED
utilization with provider derived reports for all sampled persons in the2008 MEPS who had any hospital use
reported in the household survey. The findings indicate that among those in the household survey for
whom the respondent reported any ED visits, there was underreporting in the tail of the distribution—that

120
is, for individuals with a large number of visits during the year, only some of them were reported; there was
also underreporting of any use. However, even accounting for both of these sources of underreporting, a
gap between MEPS and other surveys in total ED visit counts remained. Thus, there is still an unexplained
component, something besides underreporting, to the difference in estimates from MEPS compared with
other surveys.
This analysis illustrates another good use of administrative data. Because the MEPS collects provider
data for hospital events, as well as household reports, the household reported data on utilization can be
compared with matched provider data. Using these comparisons, the authors were able to explain at least
part of the difference in ED visits counts and, unsurprisingly, that part is a function of underreporting by
household survey respondents. The remaining gap is more puzzling, however, and much harder to
examine. This also points out some of the limitations of administrative data. The available matched data in
the MEPS represents a selected sample, i.e., persons who reported hospital events in the household survey.
That means the authors could not look at persons who did not report anything in the household survey but
actually did have one or more ED visits. It is not clear how one could use administrative data to examine
this issue. Also, the question of the extent of misclassification remains. Are household respondents reporting
visits the hospital classifies as ED visits as either outpatient or office‐based care? Further research is needed
to sort this out. Finally, it would be helpful to extend the study to examine the effects of underreporting on
behavioral analyses, as was done in the previous presentation on MEPS prescribed medication data.
ACCURACY OF MEPS PMED DATA (ZODET, HILL, & ZUVEKAS)
This paper looks at the accuracy of Medical Expenditure Panel Survey (MEPS) use and expenditure
estimates for prescribed medications (PMEDS). The authors compare the MEPS estimates with Medicare Part
D claims data for a matched sample of Medicare beneficiaries. They pay very careful attention to making the
data as comparable as possible across the two data sources and generally find that MEPS estimates are
consistent with use and expenses data derived directly from Medicare claims. They also find that what
differences do exist do not have a substantial impact on behavioral analyses of PMED use and spending.
The paper demonstrates a very good use of matched survey and administrative data, which generally
provides the best “gold standard” for evaluating the accuracy of surveys. Given the difficulty of pulling
claims for particular survey respondents and ensuring the comparability of the types of claims examined,
this paper does a good job of comparing survey estimates with actual claims. However, the small sample
size and selected population are limitations of the analysis, as noted by the authors. There remains a
question about whether the findings for this population are applicable to the privately insured. It would be
useful to do the same analysis with private claims, but a comparable data set for use in conducting that
analysis is not available. Nonetheless, the finding that any measurement errors in MEPS are unlikely to
affect behavioral analyses for the Medicare Part D population does suggest that MEPS prescribed
medication data are likely to be a good source for evaluating the effects of health care reform on PMED use
and expenditures for other populations as well.
HEALTH CARE CONSUMER SENTIMENT INDEX (GRAVEN)
This paper describes the development of an index to track individuals’ current perceptions and
expectations for the future of the U.S. health care system to gauge how perceptions of that system change
over time. The index was based on nine items from existing surveys that measured people’s recent
experiences with the affordability of care and their degree of concern with the cost of care in the future, and

Proceedings of the 10th Conference on Health Survey Research Methods 121
produced separate index scores for recent problems, concern about the future, and a composite score. The
authors then examined these scores in the context of the recent debate over health care reform legislation.
They found a relationship between individual circumstances and people’s opinion on reform, with a low
score on the overall index—indicating more problems and concerns with the affordability of care—
associated with greater support for reform of the system.
This paper represents a good use of existing survey questions to develop an index of individuals’
perceptions of the health care system. There are a few areas of the analysis that could use some additional
explanation, however. First, I had some questions about item validation. The table comparing the results
from this index and the Kaiser Health Tracking poll for the same items in some cases showed substantial
differences. In part this appeared to be a function of the questions being slightly different, but if small
wording changes can produce large differences in results, what are the implications for the utility of the
index? Another aspect of the study that could use some additional explanation is the multivariate analysis.
It was not clear whether any additional variables, aside from the indices, were used in the analysis to control
for other factors that might affect people’s perceptions of health care in the U.S. It would be helpful to spell
this out more clearly, as well as clearly stating the specific regression equation estimated.
The model specification issue leads us as well to what is perhaps the most important area of concern
with the paper, which is the issue of attribution. Association does not necessarily imply causation. While the
paper shows that changes in the index were associated with various health reform related events, I am a bit
skeptical that the general public was following those events closely enough to be influenced by them. Did
the events identified really affect people’s perceptions, or were they both shaped by something else? It
might be helpful to include some measure of individuals’ knowledge of these types of events to shed some
light on this question. I would be more convinced of a causal impact if there was a measurable effect
associated with the knowledge, and even more so if the effect was greater for those who were more closely
following the health care debate.
I also wondered about the level of support for reform estimated in the paper. My understanding of
public opinion polls is that support has been fairly stable at about 50/50. What accounts for the high support
level found in this survey? Finally, it would be helpful to give some examples of how the index might be
used in informing health care policy. For example, if the future index could be used to predict public
support for various proposals to change the current system, it would help inform policymakers about how
to prioritize those proposals and how difficult it will be to secure their adoption.
CONCLUSION
This set of papers provides a broad overview of the value of survey data in characterizing critical
aspects of the provision and perceptions of health care in the U.S., as well as some of the difficulties
involved in the collection and interpretation of data from health care related surveys. Because of their
demonstrated past and clear future value, survey data certainly will be vital in monitoring the impact of
health care reform and to continuing to inform consumers, policymakers, and providers about the current
and projected state of the U.S. health care system.

122

Proceedings of the 10th Conference on Health Survey Research Methods 123
SESSION 2 SUMMARY Karen Bogen (Mathematica) and Patricia Gallagher (University of Massachusetts‐Boston)
The floor discussion was largely an expansion of issues raised by the session discussant, notably that
nothing is simple in U.S. health care and respondents may not know what they don’t know. The complexity
of the measurement issues related to health care reform described below follow directly from the fact that
the system itself is complex and continually evolving. There is measurement infrastructure in place that will
allow answers to some of the research questions, but that system may not be agile enough to provide the
requisite data in the way and time that it’s needed.
ISSUES & CONCEPTS GERMANE TO HEALTH CARE REFORM MEASUREMENT ARE COMPLEX
Health care reform itself is complex, and there is a call for new measures before regulators, practitioners,
and patients are in a position to fully understand all facets of the legislation. For example, it’s critical to
measure health insurance coverage because one of the fundamental goals of health care reform is universal
coverage. Thus, we need to further develop and test measures to track movement towards or away from
that goal. The papers presented in this session identified underreporting of coverage, as noted in the
Rucinski paper, and the misreporting of coverage in the ACS, as reported in the Lynch and Kenney paper.
Another example of a critical but complex measure is health insurance exchanges, a concept that is just
emerging and whose presentation to the public is still unformed but may soon dictate the development of
relevant survey items. State variations in implementation and associated data needs also will influence item
creation and wording. Another key area for measurement is health care utilization. The Rhoades paper
demonstrated the underestimates in MEPS of emergency department use. Likewise, the Hill paper discusses
the underreporting of prescription drug use in the Medicare population.
Another issue that was raised in the floor discussion was approaches to improving data quality for
health care reform measures. For example, some states, such as Massachusetts, will be better suited for
testing questions on these topics because a number of the features of health care reform are being
implemented there first. The Kenney paper uses post‐data‐collection logic to edit some data, but there was
agreement that while data editing might be useful, developing better survey questions is the ultimate goal.
The increasing demand for high‐quality data, not just at the federal level but for state and small area
estimates as well, resounded in the floor discussion. A key theme was whether survey data collection is
approaching an audit activity (a simple counting that would be better done with administrative data) and if
we are asking too much of respondents in terms of both interview length and level of detail requested.
Survey researchers cannot ask respondents to report information or details they simply do not know (and
may never have known), such as specifics about their insurance‐covered health care expenses. There were
comments that some respondents learn to answer in a particular way to shorten their interview length by
avoiding the follow‐up questions they have learned to anticipate. This is a long‐known problem, and there
was a suggestion to consider random reinforcement to minimize training respondents that way.

124
THE TOOLS FOR SUPPORTING THE MEASUREMENT OF THE IMPACT OF HEALTH CARE REFORM HOLD PROMISE BUT ARE NOT YET IDEAL
The tools currently in place and being used for measurement of health care include the ACS, MEPS,
NHANES, and other federal data collection efforts. The ACS is large and more timely than the decennial
census but doesn’t provide estimates at state and local levels that will be required. Conference attendees
discussed the challenges of expanding these large surveys in a timely manner to address emerging issues in
health care reform. For example, the process of adding items to the ACS involves extensive discussion and
negotiation with the Census Bureau and could take a number of years. Pressure from data users may cause
the Census Bureau to respond more quickly to the data demands.
MEPS holds promise for collecting data about health care utilization and costs, but there are some
questions around data quality, as noted above. The benefits and shortcomings of other federal data
collection efforts also were discussed in other conference sessions.
The decidedly gray areas that exist in important health care concepts represent another major limitation
of current surveys. For example, the floor discussion included the description of a free‐standing urgent care
center that looked very much like a doctor’s office but that billed as an emergency department because it
was affiliated with a nearby hospital. Would a respondent be able to correctly report that he/she was seen at
an ED, or would this be identified as an office visit? An approach to tackling other gray areas might be to
look at patient experiences and perceptions in the manner described in the Graven paper, where
respondents are asked to report both about recent experiences and future concerns. This approach bypasses
difficult health care reform concepts themselves and looks at recent experiences and distal outcomes that
can be tracked over time, such as delaying care due to costs.
Floor discussion emerged about how much we should rely on self‐reports versus electronic health data.
Health industry consolidation is bringing together administrative data sources as well as giving researchers
the opportunity to collaborate and build relationships with industry and government, the owners of the
electronic health records and administrative data. Others pointed out that survey data provide a richer and
deeper source of information on sociobehavioral domains such as expenditures and demographics. There
was a call for combining survey and administrative data to optimize data quality (covered more extensively
in Session 4, Building the Data Sets of Tomorrow).
As in most discussions about the use of electronic health records, there were follow‐up comments about
legal ramifications and confidentiality concerns. There is belief that such electronic data will become
increasingly available, from such sources as all‐payer databases, clinical trials, and CMS. This increasing
access raises concerns about both legal issues of data linkage involving protected health information and
respondents’ willingness to provide such information when their health insurance is employer‐based.

Proceedings of the 10th Conference on Health Survey Research Methods 125
SESSION 3: Optimizing Health Survey Strategies ORGANIZERS: Stephen Blumberg (National Center for Health Statistics), Brad Edwards (Westat),
and James Lepkowski (University of Michigan) CHAIR: Stephen Blumberg

126

Proceedings of the 10th Conference on Health Survey Research Methods 127
The Use of Online Panels to Characterize the Management of Rare Diseases: The Case of Primary Immune Deficiency Diseases
John M. Boyle (Abt SRBI Inc.)
There are many rare or uncommon diseases in the United States whose management and treatment are
largely unreported outside of clinical settings. The prevalence rates of these conditions are assumed to be
too low for their inclusion in even the largest health surveys. In the absence of population‐based
assessments of these conditions, there are no reliable estimates of the characteristics of the affected
individuals, management and treatment of the disease, or health outcomes in the general population.
The population prevalence for one such condition—primary immune deficiency disease (PIDD)—was
established by a national random‐digit‐dialing (RDD) telephone survey of 10,000 households in 2005. This
survey also unexpectedly suggested that only a minority of PIDD patients were being treated with
immunoglobulin therapy, the standard of care for antibody disorders. However, the sample of patients in
this survey was too small to reliably characterize the rate of treatment for the condition.
The current study was undertaken to test the hypothesis that primary immune deficiency diseases are
currently undertreated in the general population. A national online panel was used as the most cost‐efficient
method for obtaining a reasonably large community sample of a rare population. Although online panels
are not probability samples and exclude persons without Internet access, they offer large community‐based
samples that could provide useful assessments of the treatment of rare diseases outside of clinical settings.
This paper examines the utility of this approach for one rare disease.
BACKGROUND
Primary immunodeficiency diseases (PIDD) represent more than 150 rare disorders that impair
immunological defenses resulting in increased susceptibility to infections (Yong, 2009). The majority of
patients have an antibody deficiency for which immunoglobulin therapy is the standard of care (Buckley,
2009). A patient organization—the Immune Deficiency Foundation (IDF)—has conducted surveys of PIDD
patients and families from its “member” database for two decades (Abt SRBI, Inc., 2009; Schulman, Ronca, &
Bucuvalas, Inc., 1999, 2003). These surveys have provided the most widely accepted population estimates of
the characteristics of patients with these conditions and the management of these diseases in the U.S.
In order to estimate the prevalence of diagnosed primary immune deficiency diseases in the U.S., IDF
undertook a national RDD household survey in 2005. This survey of 10,000 households, including nearly
30,000 individuals in those households, was large enough to establish a precise estimate of the prevalence of
PIDDs in the population (Boyle, 2009). The prevalence survey also unexpectedly found that only 22% of
PIDD patients were currently being treated with intravenous immunoglobulin (IVIG), compared to 67% in a
2002 survey of 1,526 PIDD patients from the IDF database. However, the number of PIDD cases in the
prevalence survey was too small to reliably characterize the rate of treatment.
The primary objective of the 2010 online survey was to characterize the treatment of PIDD patients,
particularly those with antibody deficiencies, based on a reasonably large, community based sample of
patients. A minimum sample size of at least 100 PIDD patients with antibody disorders was sought to
reliably characterize the current use of immunoglobulin therapy.

128
STUDY DESIGN: INTERNET SURVEY OF NATIONAL ONLINE PANEL
Since the prevalence survey yielded only 23 eligible patients out of 10,000 households, about 43,000
households would have to be screened to obtain 100 cases with PIDD patients. Approximately 60,000
households would need to be screened for 100 PIDD cases with antibody deficiency disorders. The cost to
conduct a national probability sample of even 100 cases for such an uncommon condition would exceed the
resources of most interested parties. Hence, a design alternative was needed to provide community‐based
estimates of treatment of patients with primary immune deficiency diseases.
Currently, the most cost‐efficient method for obtaining a nationally distributed sample of a rare
population is to conduct Internet‐based screening of a general population online panel. Although online
panels are not probability samples (although a few online panels are initially recruited from probability
samples) and they exclude approximately one quarter of U.S. adults who do not use the Internet at home or
other locations, they are designed to provide large samples whose demographic characteristics are
representative of the population (AAPOR, 2010). Hence, an online panel provides a cost‐efficient approach
to exploring the characteristics of a low incidence subset of the general population.
SURVEY METHODS
A large national online general population panel with approximately 1,000,000 current members was
selected to test the approach. A generic invitation to participate in a new Internet survey was sent to panel
members as they became available for new surveys (e.g., completed or screened out of another survey).
Those panel members willing to participate in a new survey were sent to a site where they were shown
broad screening questions for available surveys. Based on their answers, panelists were designated as
potentially eligible for these surveys. If the panelist was eligible for multiple available surveys, the low‐
incidence survey, like primary immune deficiency diseases, was given priority.
Panelists who qualified for the PIDD survey on the broad screening question were offered an invitation
to click on a hyperlink that took them to a secure server maintained by IDF’s survey contactor. The
respondent was issued a personal identification number (PIN) as part of the hyperlink so that they could
access their own questionnaire repeatedly until they completed the interview. If the selected panelist
accessed the PIDD survey on the IDF contractor’s server, the respondent saw a series of screening questions
that were used to determine whether the respondent or another household or family member had been
diagnosed with a primary immune deficiency disease. All patients with eligible PIDD diagnoses were
queried about their condition, treatment, and health outcomes.
The online panelists were offered a small incentive (entry into a lottery for a small prize) to participate in
any survey hosted by the Internet panel organization. This is a panel maintenance function rather than an
inducement to participate in a particular survey. No additional incentive was offered for the PIDD treatment
survey to minimize incentives for noneligible respondents to participate.
In addition to the requirement that someone in the household (or immediate family living outside of the
household) had been diagnosed with one of 18 specific primary immune deficiency diseases, potential
participants were deemed unqualified if (1) they reported more than five persons with PIDD in the
household or in the immediate family outside of the household, (2) they reported three or more different
PIDD diagnoses for individual, (3) they reported either of two rare non‐PIDD diagnoses that were placed at
the beginning of the PIDD diagnosis list, or (4) they reported combinations of diagnoses that were
improbable. Further, the length of interviews was reviewed to determine if any were too short to be

Proceedings of the 10th Conference on Health Survey Research Methods 129
legitimate (i.e., speedsters); the pattern of responses also was checked for invariant responses (i.e., straight
lining); and only a limited number of “not sure” and “no answer” responses were acceptable. These steps
were designed to eliminate potentially fraudulent respondents from the survey.
SURVEY OUTCOMES
The survey was conducted from March 8–31, 2010. A total of 859,379 unique panelists from a Census‐
balanced national online panel were sent generic invitations to participate in a new survey opportunity. A
total of 114,934 panelists (13%) went to a “requirements” page and completed a broad PIDD screening
question. Three percent of those who completed the screening question on the requirements page (3,487
panelists) reported a primary immune deficiency disease in the household or immediate family (Table 1).
Table 1. Outcomes of Online Panel Survey
ACTION n % of Previous Action % of Total
Sent e‐mail invitations to survey 859,379 100.000%Went to screening page 114,934 13.40% 13.400%Qualified on screening page 3,487 3.00% 0.040%Went to main questionnaire 1,702 48.80% 0.020%Qualified on diagnosis 159 0.09% 0.002%
Table 2. Outcomes of Survey Screen (n = 1,702)
Of the 3,487 online panelists who reported a PIDD in
their household or immediate family, about half (49%)
accepted the invitation to participate in the survey and
went to the IDF survey Web site. These 1,702 qualifying
respondents who went to the site then were asked: “Has
anyone currently living in your household ever been
diagnosed with a primary immune deficiency disease, such as…?” These respondents also were asked: “Has
anyone in your immediate family (parents, children or siblings) currently living outside of your household
ever been diagnosed with a primary immune deficiency disease, such as…?”
A total of 728 respondents from the online panel reported a person with a primary immune deficiency
disease living in their household or in their immediate family living outside of the household. The ages and
genders were obtained for each PIDD living in the household and any PIDDs living outside of the
household if there were no PIDDs in the household. For each PIDD patient, respondents were asked what
specific types of primary immune deficiency that person had been diagnosed as having. A precoded answer
list was presented on two screens that included 18 legitimate diagnoses of primary immune deficiency
diseases, 13 nonlegitimate diagnoses, and an “other” (specify) category. Most of the legitimate diagnoses
were presented on the first screen, along with a few nonlegitimate diagnoses.
Overall, among 1,702 persons who qualified on the requirement question and went to the survey
website, only 9% reported a legitimate PIDD diagnosis in the household or immediate family. Twice as
many (22%) claimed a PIDD in the household or immediate family but reported a nonqualifying diagnosis.
Another 8% reported a PIDD in the household or family but did not give any diagnosis. Half (51%) reported
no PIDD in the household or family. One in ten (10%) did not answer any of the qualifying questions after
going to the survey Web site (Table 2).
OUTCOME n %
Good PIDD diagnosis 159 9.3%Bad PIDD diagnosis 382 22.4%No diagnosis given 130 7.6%No PIDD in household or family 865 50.8%No answer to screening question 166 9.8%
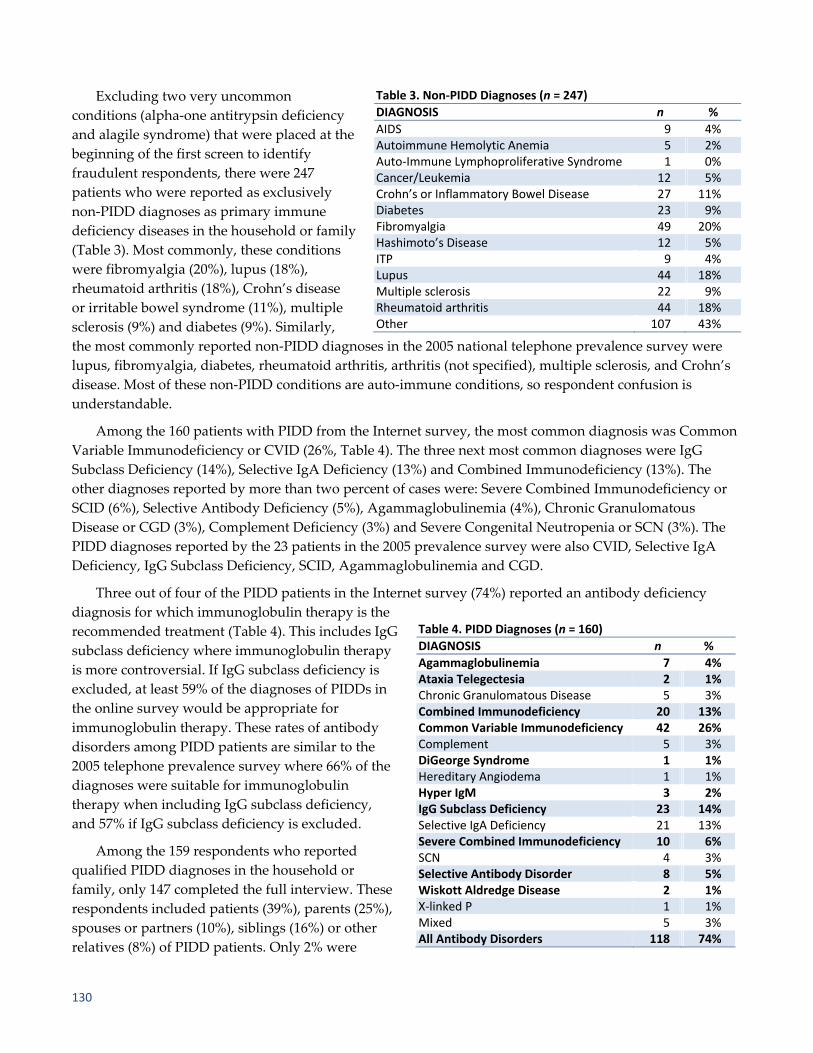
130
Excluding two very uncommon
conditions (alpha‐one antitrypsin deficiency
and alagile syndrome) that were placed at the
beginning of the first screen to identify
fraudulent respondents, there were 247
patients who were reported as exclusively
non‐PIDD diagnoses as primary immune
deficiency diseases in the household or family
(Table 3). Most commonly, these conditions
were fibromyalgia (20%), lupus (18%),
rheumatoid arthritis (18%), Crohn’s disease
or irritable bowel syndrome (11%), multiple
sclerosis (9%) and diabetes (9%). Similarly,
the most commonly reported non‐PIDD diagnoses in the 2005 national telephone prevalence survey were
lupus, fibromyalgia, diabetes, rheumatoid arthritis, arthritis (not specified), multiple sclerosis, and Crohn’s
disease. Most of these non‐PIDD conditions are auto‐immune conditions, so respondent confusion is
understandable.
Among the 160 patients with PIDD from the Internet survey, the most common diagnosis was Common
Variable Immunodeficiency or CVID (26%, Table 4). The three next most common diagnoses were IgG
Subclass Deficiency (14%), Selective IgA Deficiency (13%) and Combined Immunodeficiency (13%). The
other diagnoses reported by more than two percent of cases were: Severe Combined Immunodeficiency or
SCID (6%), Selective Antibody Deficiency (5%), Agammaglobulinemia (4%), Chronic Granulomatous
Disease or CGD (3%), Complement Deficiency (3%) and Severe Congenital Neutropenia or SCN (3%). The
PIDD diagnoses reported by the 23 patients in the 2005 prevalence survey were also CVID, Selective IgA
Deficiency, IgG Subclass Deficiency, SCID, Agammaglobulinemia and CGD.
Three out of four of the PIDD patients in the Internet survey (74%) reported an antibody deficiency
diagnosis for which immunoglobulin therapy is the
recommended treatment (Table 4). This includes IgG
subclass deficiency where immunoglobulin therapy
is more controversial. If IgG subclass deficiency is
excluded, at least 59% of the diagnoses of PIDDs in
the online survey would be appropriate for
immunoglobulin therapy. These rates of antibody
disorders among PIDD patients are similar to the
2005 telephone prevalence survey where 66% of the
diagnoses were suitable for immunoglobulin
therapy when including IgG subclass deficiency,
and 57% if IgG subclass deficiency is excluded.
Among the 159 respondents who reported
qualified PIDD diagnoses in the household or
family, only 147 completed the full interview. These
respondents included patients (39%), parents (25%),
spouses or partners (10%), siblings (16%) or other
relatives (8%) of PIDD patients. Only 2% were
Table 4. PIDD Diagnoses (n = 160)
DIAGNOSIS n %
Agammaglobulinemia 7 4%Ataxia Telegectesia 2 1%Chronic Granulomatous Disease 5 3%Combined Immunodeficiency 20 13%Common Variable Immunodeficiency 42 26%Complement 5 3%DiGeorge Syndrome 1 1%Hereditary Angiodema 1 1%Hyper IgM 3 2%IgG Subclass Deficiency 23 14%Selective IgA Deficiency 21 13%Severe Combined Immunodeficiency 10 6%SCN 4 3%Selective Antibody Disorder 8 5%Wiskott Aldredge Disease 2 1%X‐linked P 1 1%Mixed 5 3%All Antibody Disorders 118 74%
Table 3. Non‐PIDD Diagnoses (n = 247)
DIAGNOSIS n %
AIDS 9 4%Autoimmune Hemolytic Anemia 5 2%Auto‐Immune Lymphoproliferative Syndrome 1 0%Cancer/Leukemia 12 5%Crohn’s or Inflammatory Bowel Disease 27 11%Diabetes 23 9%Fibromyalgia 49 20%Hashimoto’s Disease 12 5%ITP 9 4%Lupus 44 18%Multiple sclerosis 22 9%Rheumatoid arthritis 44 18%Other 107 43%

Proceedings of the 10th Conference on Health Survey Research Methods 131
nonrelatives of the patient and another 2% did not specify their
relationship to the patient (Table 5). These 147 respondents reported a
total of 160 patients with legitimate PIDD diagnoses in the household or
immediate family. The geographic distribution of the PIDD patient
population from the Web survey is almost identical with the U.S. adult
population distribution by Census division in 2009 (Table 6).
There were 144 respondents from the Web survey who reported one
or more legitimate PIDD cases living in their household. If the 144
households with a qualified PIDD diagnosis is divided by the full 114,934 panelists who completed the
initial requirement question about primary immune deficiency disease, it would yield a household rate of
PIDD of 1 in 798 households. However, if those who reported a PIDD on the requirements page but did not
go to the IDF Internet survey had the same rate of eligibility as those who did, then we would expect a total
of 295 eligible respondents. This would mean a prevalence rate of 1 in 390 households. These two estimates
of the household prevalence of PIDD from the 2010 online panel survey bracket the estimate of 1 PIDD in
555 households from the 2005 telephone prevalence survey.
In the 2005 telephone prevalence survey, respondents were asked whether the PIDD patient was
currently being treated with intraveneous immunoglobulin (IVIG), and, if not, whether they had ever been
treated with IVIG. Since the prevalence survey, the use of subcutaneous immunoglobulin (SCIG) has
become much more widespread for PIDD in the United States. In addition, intramuscular immunoglobulin
(IMIG) was the standard of treatment before the adoption of IVIG. Hence, in the 2010 Internet survey,
respondents were asked whether the PIDD patient had ever used IMIG, IVIG, or SCIG. For each form of
immunoglobulin treatment they reported the PIDD patient had ever used, they were asked whether the
patient was still using that treatment. Hence, the measurement of lifetime and current use of
immunoglobulin treatment was broader in the 2010 Internet survey than the prevalence survey, which
focused exclusively on what was then the most common form of treatment—IVIG.
Among the 23 patients with a PIDD diagnosis in the 2005 national telephone prevalence survey, only
44% reported they had ever been treated with IVIG for their condition. Among the 160 patients with PIDD
diagnoses in the online survey, 36% reported they had ever been treated with IVIG. However, an identical
44% of PIDD patients in the 2010 Internet survey reported they have ever been treated with IVIG or SCIG,
which is a more appropriate comparison because many PIDD patients have switched to SCIG from IVIG
since 2005. When also including intramuscular immunologlobulin, the lifetime use of any form of
immunoglobulin (IMIG, IVIG, or SCIG) is 58% in the Internet survey.
Even when including IVIG, SCIG, and IMIG, less than half (48%) of PIDD patients in the Internet survey
report current treatment with
immunoglobulin therapy. The
difference in estimates of current
immunoglobulin treatment
between the 2005 telephone
prevalence survey (22%) and the
Internet survey (48%) is large
enough to be outside of the
expected pooled error based on
sample size (Table 7). However,
the Internet survey estimate is
Table 5. Relationship to Patient
RELATIONSHIP %
Patient 39%Parent 25%Spouse or partner 10%Brother or sister 16%Other relative 8%Other nonrelative 2%No answer 2%
Table 6. Geographic Distribution of PIDD Patients & Total U.S. Population
REGION U.S. Adult Population 2009 Patients (n = 144)
New England 5% 6%Mid Atlantic 14% 16%East North Central 15% 16%West North Central 7% 6%South Atlantic 19% 17%East South Central 6% 6%West South Central 11% 8%Mountain 7% 6%Pacific 16% 17%

132
based on a broader definition of immunoglobulin therapy (i.e., IMIG, SCIG, and IVIG) compared to the 2005
telephone survey. And, the larger estimate of current immunoglobulin use in the 2010 Internet survey (48%)
is still well below the estimates of current IVIG use (67% in 2002 and 74% in 2007) in two large surveys of
PIDD patients conducted by IDF from its database. Even more importantly, only half of patients with
specific PIDD diagnoses for which immunoglobulin is the recommended treatment (51%) reported currently
being treated with any form of immunoglobulin in the 2010 Internet survey (Table 7).
Table 7 also shows that the relatively low level of current immunoglobulin therapy among patients from
the online panel is paralleled by their attitudes toward immunoglobulin treatment. Only 22% of patients in
the online survey felt that immunoglobulin therapy was very effective (Table 7). Only 24% of patients felt
that immunoglobulin therapy was very safe. And little more than half of these patients felt that their
primary doctor strongly (29%) or somewhat (27%) favored treating them with immunoglobulin. The patient
attitudes about immunoglobulin treatment are similar to those found among primary care doctors in the
IDF surveys of pediatricians and family practitioners.
Table 7. Immunoglobulin Treatment
%
Current Treatment with Immunoglobulin, by All Patients IVIG 2002 IDF Patient Survey (n = 1,526) 67%IVIG 2005 RDD Telephone Survey (n = 23) 22%IVIG 2010 Web Survey (n = 160) 29%IVIG & SCIG 2010 Web Survey (n = 160) 35%IVIG, SCIG & IMIG 2010 Web Survey (n = 160) 48%IVIG & SCIG 2007 IDF Patient Survey (n = 1,351) 74%Current Treatment with Immunoglobulin by Antibody Deficient PatientsIVIG, SCIG & IMIG 2010 Web Survey (n = 119) 51%
Effectiveness of Immunoglobulin Therapy (n = 147)Very effective 22%Somewhat effective 44%Not too effective 9%Not sure 25%How Safe is Immunoglobulin Therapy (n = 147) Very safe 24%Somewhat safe 41%Not too safe 10%Not safe at all 1%Not sure 25%
Doctor’s Attitudes about Immunoglobulin (n = 147)Strongly favors 29%Somewhat favors 27%Neither favors nor opposes 16%Somewhat opposes 5%Strongly opposes 1%Not sure 22%

Proceedings of the 10th Conference on Health Survey Research Methods 133
Table 8. Respondent Health Issues: 2010 Web Survey vs. 2002 IDF Survey
2010 WEB 2002 IDF n % %
Acute Conditions in Last month (n = 147) (n = 1,526)Bronchitis 53 36% 45%Candida 20 14% 17%Diarrhea (repeated) 54 37% 34%Ear infections (repeated) 35 24% 25%Eye infections 16 11% 16%Lymphopenia 8 5% 3%Malabsorption 9 6% 8%Neutropenia 5 3% 3%Pneumonia 29 20% 17%Sepsis 7 5% 2%Urinary infections 37 25% 17%Current Health Status (n = 147) (n = 1,526)Excellent 10 7% 8%Very good 11 7% 21%Good 48 33% 30%Fair 55 37% 28%Poor 17 12% 10%Very poor 6 4% 2%No answer — — 1%Activity Limitation (n = 147) (n = 1,526)No limitation 25 17% 20%Slight limitation 48 33% 29%Moderate limitation 50 34% 25%Severe limitation 24 16% 14%No answer — — 2%Hospitalization in Past Year (n = 147) (n = 1,526)Yes 57 39% 30%No 87 59% 69%Not sure 3 2% 1%
The prevalence of specific acute health conditions in the past 12 months was remarkably consistent
between the 2002 IDF member survey and the 2010 online panel for bronchitis (45%‐36%), Candida (17%‐
14%), repeated diarrhea (34%‐37%), repeated ear infections (25%‐24%), eye infections (16%‐11%),
lymphopenia (3%‐5%), malabsorbtion (8%‐6%), neutropenia (3%‐3%), pneumonia (17%‐20%), and sepsis
(2%‐5%, Table 8). Although the populations from the member surveys and online panel look similar in
terms of specific conditions, their current health outcomes look different. Only 15% of patients from the
online panel are reported as being in excellent or very good health, compared to 28% in the 2002 member
survey. Similarly, 50% of the patients from the online survey are reported as having moderate or severe
activity limitations as result of their health, compared to only 39% of patients from the member survey.
Nearly two out of five patients in the online survey (39%) reported being hospitalized in the past 12 months,
compared to 30% from the member survey. These differences in health outcomes may be related to
differences in rates of treatment with immunoglobulin between IDF member surveys and the community‐
based online survey, although the survey suggests that sicker patients in the online panel are more likely to
be treated with immunoglobulin.
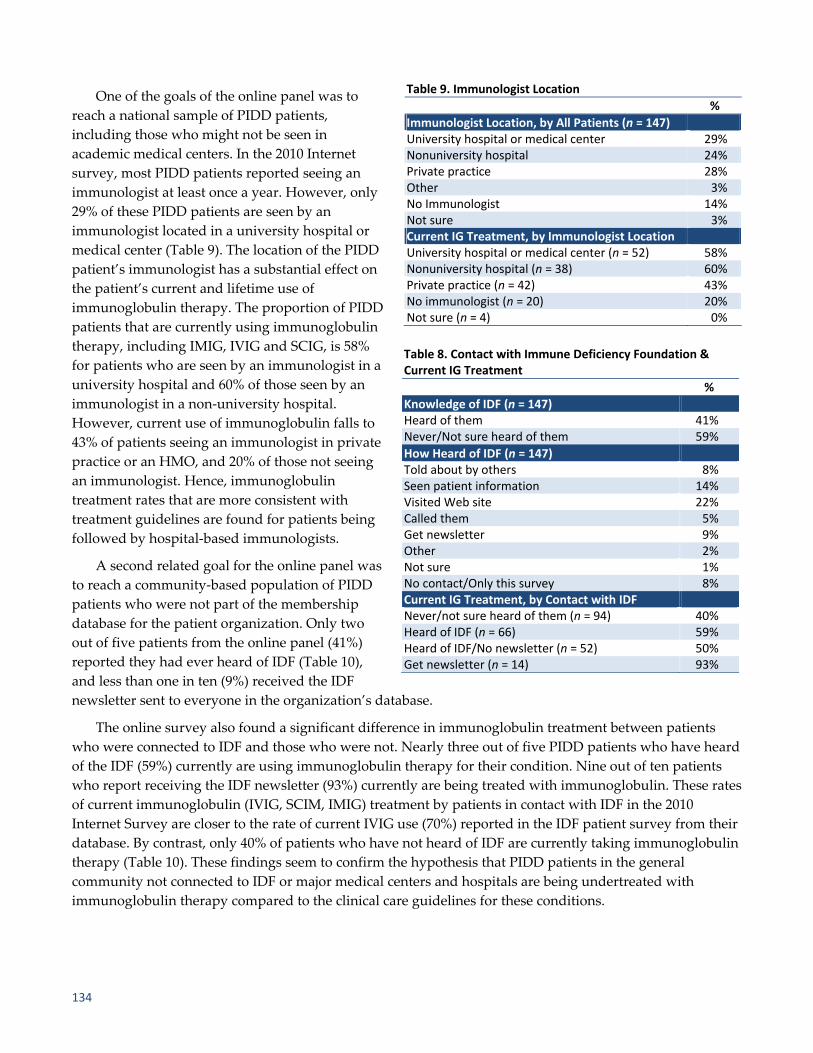
134
One of the goals of the online panel was to
reach a national sample of PIDD patients,
including those who might not be seen in
academic medical centers. In the 2010 Internet
survey, most PIDD patients reported seeing an
immunologist at least once a year. However, only
29% of these PIDD patients are seen by an
immunologist located in a university hospital or
medical center (Table 9). The location of the PIDD
patient’s immunologist has a substantial effect on
the patient’s current and lifetime use of
immunoglobulin therapy. The proportion of PIDD
patients that are currently using immunoglobulin
therapy, including IMIG, IVIG and SCIG, is 58%
for patients who are seen by an immunologist in a
university hospital and 60% of those seen by an
immunologist in a non‐university hospital.
However, current use of immunoglobulin falls to
43% of patients seeing an immunologist in private
practice or an HMO, and 20% of those not seeing
an immunologist. Hence, immunoglobulin
treatment rates that are more consistent with
treatment guidelines are found for patients being
followed by hospital‐based immunologists.
A second related goal for the online panel was
to reach a community‐based population of PIDD
patients who were not part of the membership
database for the patient organization. Only two
out of five patients from the online panel (41%)
reported they had ever heard of IDF (Table 10),
and less than one in ten (9%) received the IDF
newsletter sent to everyone in the organization’s database.
The online survey also found a significant difference in immunoglobulin treatment between patients
who were connected to IDF and those who were not. Nearly three out of five PIDD patients who have heard
of the IDF (59%) currently are using immunoglobulin therapy for their condition. Nine out of ten patients
who report receiving the IDF newsletter (93%) currently are being treated with immunoglobulin. These rates
of current immunoglobulin (IVIG, SCIM, IMIG) treatment by patients in contact with IDF in the 2010
Internet Survey are closer to the rate of current IVIG use (70%) reported in the IDF patient survey from their
database. By contrast, only 40% of patients who have not heard of IDF are currently taking immunoglobulin
therapy (Table 10). These findings seem to confirm the hypothesis that PIDD patients in the general
community not connected to IDF or major medical centers and hospitals are being undertreated with
immunoglobulin therapy compared to the clinical care guidelines for these conditions.
Table 9. Immunologist Location
%
Immunologist Location, by All Patients (n = 147)University hospital or medical center 29%Nonuniversity hospital 24%Private practice 28%Other 3%No Immunologist 14%Not sure 3%Current IG Treatment, by Immunologist Location University hospital or medical center (n = 52) 58%Nonuniversity hospital (n = 38) 60%Private practice (n = 42) 43%No immunologist (n = 20) 20%Not sure (n = 4) 0%
Table 8. Contact with Immune Deficiency Foundation & Current IG Treatment
%
Knowledge of IDF (n = 147)Heard of them 41%Never/Not sure heard of them 59%
How Heard of IDF (n = 147)Told about by others 8%Seen patient information 14%Visited Web site 22%Called them 5%Get newsletter 9%Other 2%Not sure 1%No contact/Only this survey 8%Current IG Treatment, by Contact with IDF Never/not sure heard of them (n = 94) 40%Heard of IDF (n = 66) 59%Heard of IDF/No newsletter (n = 52) 50%Get newsletter (n = 14) 93%
Proceedings of the 10th Conference on Health Survey Research Methods 135
CONCLUSIONS
A rare disease is defined in the Rare Disease Act of 2002 as “any disease or condition that affects less
than 200,000 persons in the United States” or about 1 in 1,500 persons. This definition of rare disease,
however, is derived from a legal definition of an “orphan disease,” which has not been adopted by the
pharmaceutical industry for the development of medications because the size of the affected population is
too small to be commercially viable. From the standpoint of health research, we might define a rare or
uncommon disease as one of which prevalence is too low to make population‐based assessments of the
disease and its treatment feasible under most conditions. For example, there are very few examples of health
surveys conducted in the U.S. of medical conditions with prevalence rates less than 1%. As a result, there are
thousands of medical conditions for which little is known about the management and treatment of the
condition in the general population, outside of controlled clinical trials.
Primary immune deficiency diseases represent an example of an uncommon or rare disease for which
community‐based assessments of disease management are needed. The 2005 IDF prevalence telephone
survey was conducted to estimate the prevalence of this condition in the U.S. A sample size of 10,000
households was sufficient to estimate the prevalence of this relatively rare condition but much too small to
generate a sample of diagnosed PIDD patients that could reliably characterize their treatment. However, the
findings from the small probability sample suggested for the first time that there might be a serious problem
of undertreatment among patients diagnosed with PIDD. Treatment rates in other surveys conducted by
IDF from its database were consistent with clinical guidelines, but the patients known to a patient
organization may not be typical of the general population.
The current study was designed to test the hypothesis that a substantial number of PIDD patients in the
U.S. were not being treated with immunoglobulin therapy as recommended by current clinical guidelines.
In order to test this hypothesis, a national sample was needed large enough to provide a reasonable
confidence interval about estimates (assuming a probability sample). It also needed to be a community‐
based sample so that it could represent the patient population that is not being serviced by nor could be
reached through patient organizations and major medical centers. Finally, the study design needed to be
sufficiently cost efficient to be supported by patient organizations or other interested parties without the
resources of the federal government or major pharmaceutical companies. A large Census‐balanced online
panel appeared to meet the requirements to test this hypothesis
Online panels have a number of well‐known limitations, including coverage of persons without Internet
access and overrepresentation of the population who are more experienced and comfortable in online
transactions. They are based on a self‐selected sample rather than a true probability sample. There are well‐
known demographic biases (e.g., age, race) associated with online panels. Response rates are extremely low.
There are also problems of survey gaming to obtain incentives, which need to be controlled in the survey
design. Nonetheless, the judicious use of a large Census‐balanced online panel appeared to be the only
practical way to obtain a community sample of a rare population large enough to answer some critical
questions about disease treatment in the general population.
We believe that the findings of this Internet survey support the hypothesis that immunoglobulin
therapy, the standard of care for most patients with PIDD, is being underutilized in the general patient
population, particularly outside of major medical centers and hospital‐based immunology practices.
Moreover, we believe that the findings from this study demonstrate the potential value of the approach for
other rare conditions. The online panel was large enough to generate a sample of approximately 150 patients
for a condition of which prevalence is estimated at 1 in 1,250 persons. The sample was geographically
136
distributed in proportion to the population. The distribution of specific diagnoses and specific types of
infections in the past year were consistent with previous surveys of this population. At the same time, the
patient sample provided by the online panel represented a community sample much broader than the IDF
membership or patients who might be recruited at major medical centers. Nine out of ten cases would not
have been in the relatively large patient database maintained by the patient organization, and only a
minority was being seen for their condition in major medical centers.
The patients from the online panel who were not in the IDF database and not being seen by hospital‐
based immunologists were less likely to be currently treated with immunoglobulin, explaining much of the
difference in treatment estimates from both the telephone and Internet surveys and previous “membership”
surveys. The Internet survey also finds a PIDD patient population that tends to be sicker (i.e., general health
rating, activity limitations, and hospitalizations) than the population described in earlier IDF surveys from
its patient database. These poorer health outcomes would be consistent with undertreatment for the
condition. Hence, monitoring the treatment and health outcomes of rare or uncommon diseases outside of
the university hospitals and major medical centers may identify treatment gaps with profound effects on
public health and quality of life. Although no substitute for probability samples, this study suggests that
online panels may play a useful role in the monitoring of treatment and health outcomes in rare diseases
where adequate community samples cannot be obtained from population‐based sampling frames.
ACKNOWLEDGMENT
The survey was partially supported by an unrestricted educational grant from Talecris Biotherapeutics
to the Immune Deficiency Foundation.
REFERENCES
Abt SRBI, Inc. (2009, May). Primary immunodeficiency diseases in America 2007: The Third National Survey of Patients.
Immune Deficiency Foundation.
American Association of Public Opinion Research. (2010, March). AAPOR report on online panels. Available at
www.aapor.org/AM/Template.cfm?Section=AAPOR_Committee_and_Task_Force_Reports&Template=/CM/C
ontentDisplay.cfm&ContentID=2223
Boyle, J. & Buckley, R. (2007). Population prevalence of diagnosed primary immunodeficiency diseases in the
United States. Journal of Clinical Immunology, 27, 497–502.
Buckley, R. (Ed.). (2009). Diagnostic and clinical care guidelines for primary immunodeficiency diseases (2nd ed.).
Immune Deficiency Foundation.
Schulman, Ronca, & Bucuvalas, Inc. (1999, May). Primary immune deficiency diseases in America: The First National
Survey of Patients and Specialists. Immune Deficiency Foundation.
Schulman, Ronca, & Bucuvalas, Inc. (2003, April). Primary immune deficiency diseases in America 2002: The Second
National Survey of Patients. Immune Deficiency Foundation.
Yong, P., Boyle, J., Ballow, M., Boyle, M., Berger, M., Blessing, J., et al. (2009). Use of intravenous immunoglobulin
and adjunctive therapies in the treatment of primary immunodeficiencies. Clinical Immunology, 135, 255–263.

Proceedings of the 10th Conference on Health Survey Research Methods 137
Design of Health Surveys for Public Health Emergencies: Early Responder Bias in the National 2009 H1N1 Flu Survey1
James A. Singleton and Tammy Santibanez (Centers for Disease Control and Prevention) Nicholas Davis, Kennon R. Copeland, N. Ganesh, and Kirk M. Wolter
(NORC at the University of Chicago) Carolyn Drews‐Botsch (Emory University)
INTRODUCTION
Design of surveillance systems for public health emergencies must consider the content, frequency, and
turnaround time of information needed, use of existing systems, need for development of new systems, and
possible tradeoffs in data quality and precision given time and resource constraints (Link, Mokdad, &
Balluz, 2007). In response to the 2009 influenza A (H1N1) (pH1N1) pandemic, the Centers for Disease
Control and Prevention (CDC) developed systems to monitor pH1N1 disease and the use, safety, and
effectiveness of pH1N1 vaccine (Schuchat, Bell, & Redd, 2011). The goals for monitoring pH1N1 vaccination
included the use of surveys to provide weekly estimates of the proportion of target groups vaccinated, place
of vaccination, reasons for non‐vaccination, and opinions about risk of influenza and safety and
effectiveness of influenza vaccination (Singleton, 2010). Given the uncertainty regarding the types of
influenza viruses that would circulate in the upcoming 2009–2010 influenza season, both monovalent
pH1N1 and trivalent seasonal influenza vaccines were recommended for various target groups (Fiore et al.,
2009; National Center for Immunization and Respiratory Diseases, 2009).
The National 2009 H1N1 Influenza Survey (NHFS), a dual landline and cell telephone survey, was
conducted October 2009–June 2010 to provide weekly estimates for pH1N1 and seasonal influenza
vaccinations (Singleton, Santibanez et al., 2010). Data from NHFS and other systems were used in
development of public messages about the vaccination campaign, to help assess safety and effectiveness of
the vaccine, and to provide feedback to states on their vaccination programs (CDC, 2010; Ding et al., 2010;
Gargiullo et al., 2009; Lu et al., 2010; Velozzi et al., 2010). Evaluation of this enhanced surveillance system is
needed to identify areas of improvement for influenza vaccination surveys during future pandemic and
inter‐pandemic seasons.
Nonresponse bias is an important survey attribute to assess, particularly in rapid response surveys,
which may have lower responses rates than routine surveys. Comparison of survey respondents by level of
effort (e.g., time or number of call attempts to complete) is one readily available approach for assessing
nonresponse bias (Groves, 2006). These studies assume a continuum of resistance with nonresponders
represented by hardest to reach respondents (Biemer & Link, 2008; Keeter, Kennedy, Dimock, Best, &
Craighill, 2006). Such studies are also useful for evaluating potential change in validity of survey estimates
that would result by reducing the effort expended to obtain interviews. This information is relevant for
improving cost‐efficiency, and for decision making in special circumstances when timely information is
needed and some level of systematic error in estimates can be tolerated or accounted for based on past
experience.
1 The findings and conclusions in this report are those of the authors and do not necessarily represent those of the Centers
for Disease Control and Prevention.

138
The purpose of this paper is to compare early and late responders to the NHFS to assess potential
change in validity of survey estimates if effort to obtain interviews had been reduced and to assess
nonresponse bias in the NHFS in a level of effort analysis comparing early and late respondents. This paper
expands on previous preliminary analysis of early responder bias in the NHFS (Singleton, Copeland,
Ganesh et al., 2010).
METHODS
NHFS data collected October 2009–June 2010 were used for this analysis (56,656 completed adult
interviews and 14,652 completed interviews for children). The CDC contracted with NORC at the University
of Chicago to design and implement the NHFS. The NHFS consisted of a national random‐digit–dial survey
based on a rolling weekly sample of landline and cellular telephones contacted to identify residential
households. For the landline sample, within each contacted NHFS sample household, one adult was
randomly selected for interview, and the parent or guardian of one randomly selected child (if present) was
selected for interview. For the cell sample, the target was owners of privately used cell phones and an
interview was attempted if the person answering was ≥18 years. Monthly targets for the NHFS sample were
established to achieve approximately 6,000 total completed adult interviews (4,889 from landline and 1,111
from cell‐phone‐only or cell‐phone‐mainly households). The cell phone sample was screened for households
with wireless only service (cell‐only) or households with both cellular and landline service who responded
“somewhat unlikely” or “not at all likely” to the question, “Thinking just about the landline home phone,
not your cell phone, if that telephone rang and someone was home, under normal circumstances how likely
is it that it would be answered?” (cell‐mainly). The landline NHFS sample was augmented with a sample of
children age less than 18 years identified during screening for the National Immunization Survey (NIS); the
NIS child data were not analyzed for this paper. Sample for the NHFS was released to the NORC calling
center on a weekly basis, with “week” defined as Sunday through Saturday, and each released panel
remaining active for five weeks. Each sampled telephone number continued to be called across the five
weeks until the number was resolved as nonresidential, there was a confirmed refusal, or a completed
interview was obtained. A minimum of eight call attempts were made to each sampled telephone number,
more if there was evidence the number was associated with a household. Completed interviews obtained
within a survey week (regardless of the panel to which they belonged) then were used in generating the
estimates for that survey week. The estimates for a given survey week were thus based upon completed
interviews from five panels that included both early and late responders. Sample weights were developed
with adjustments for probability of selection, multiple phone lines per household, age‐specific national
proportion of the population estimated to be in landline vs. cell‐only/mainly households, and ratio
adjustment to Census population estimates by age group, gender, race/ethnicity and state of residence. The
response rates (type RR3) for the first 21 completed weekly panel releases were 35% for the landline sample
(79% resolution, 100% screening, 44% interview completion) and 27% for the cell‐only/mainly sample (56%
resolution, 86% screening, and 56% interview completion (American Association of Public Opinion
Research, 2011).
Respondents were classified by week since sample release (WSR), from one to five weeks, and grouped
into early (WSR = 1, 2) and later (WSR = 3, 4, 5) respondents. The median number of call attempts for
completed interviews across landline and cell‐only/mainly samples ranged from 2, 5–6, 8–10, 11–13, and 14–15
for weeks 1, 2, 3, 4, and 5 since release, respectively. Respondent characteristics examined included age group,
race/ethnicity, sex, region, level of education, pH1N1 and seasonal influenza vaccination target groups, health
care worker status, household income, Metropolitan Statistical Area status, housing tenure, and employment

Proceedings of the 10th Conference on Health Survey Research Methods 139
status. Influenza‐vaccine‐related outcomes examined include receipt of pH1N1 vaccination since October 2009,
receipt of seasonal influenza vaccination since August 2009, opinions about safety and effectiveness of
influenza vaccines, risk of influenza illness if not vaccinated, and level of concern about “swine flu.”
All analyses were conducted with SUDAAN software to account for the complex survey design.
Associations between WSR and respondent characteristics were assessed by chi‐square tests, overall and
by source of sample (landline vs. cell‐only/mainly). The prevalence of influenza‐vaccine‐related outcomes
for early vs. later responders were compared, overall and stratified by sample source. Because vaccination
and other outcomes varied over time, logistic regression models were fit for each outcome and sample
source, with main effects for WSR group (early, later) and interview week. Because of incomplete time for
full five‐week follow‐up, the first four weeks of interview data were excluded from this analysis. Adjusted
differences in outcome proportions were estimated from predictive marginals obtained from the logistic
regression models. The cumulative proportion of persons vaccinated by end of May 2010 was estimated
using the Kaplan‐Meier procedure based on reported month of vaccination as the time unit. Vaccination
coverage estimates were compared between early and later responders.
To assess the potential increase in nonresponse bias if the survey had been restricted to early
respondents, differences in influenza vaccination coverage between reweighted early responders and all
responders were estimated. Comparisons were made for pH1N1 and seasonal vaccination for adults and
children, and for adults stratified by race/ethnicity, age, target group, and healthcare personnel. To reweight
the early responder sample, the sample restricted to early responders was post‐stratified to the Census
population controls.
To assess overall nonresponse bias in final survey results, the difference in estimated vaccination
coverage based on all respondents and later respondents was multiplied by the nonresponse rate.
Vaccination coverage estimates were examined for each of the five weeks since sample release to assess for
possible dose‐response (larger difference between estimates for 1st week vs. later week responders, as week
since release increases), to determine if WSR = 5 responders or WSR = 3, 4, or 5 should be used to represent
nonresponders.
RESULTS
Of the 56,656 adult respondents, 53.7% responded by the first week since sample release, 23.3% in the 2nd
week, 12.5% in the 3rd week, 6.7% in the 4th week, and 3.8% in the 5th week. Thus, 77% were classified as
early and 23% as later respondents. The distribution by WSR did not differ between landline (80.5% of
respondents) and cell‐only/mainly samples (19.5%). For the landline sample, there were differences between
early and later responders for 13 of 16 characteristics, with the largest differences by age (25.5% of early
responders ≥65 years vs. 17.8% of later respondents), race/ethnicity (non‐Hispanic White only 75.8% vs.
68.9%), having a child in the household (34.8% vs. 40.9%), employment status (employed, 50.8% vs. 56.9%;
retired, 23.8% vs. 16.3%), and member of seasonal target group (72.5% vs. 66.4%, Table 1). Fewer
characteristics differed by responder status for the cell‐only/mainly sample, and effects were different for
age and sex compared to the landline sample (in the cell‐only/mainly sample, early responders were more
likely to be 18–24 years and male). Overall, the cell‐only/mainly respondents were more likely than landline
respondents to be younger, non‐White, interviewed in Spanish, male, have a child in the household, live in
the principal city of a metropolitan statistical area, live below the poverty level, rent their dwelling, be
employed, have no health insurance, not have a chronic medical condition, be in the pH1N1 target group,
and not be in the seasonal target group.

140
Table 1. Comparison of Respondent Characteristics between Early & Later Responders, by Sample Source, National 2009 H1N1 Flu Survey (standalone component)
LANDLINE CELL‐ONLY/MAINLY
CHARACTERISTIC Early Responders
(n = 35,079) Later Responders
(n = 10,520) Early Responders
(n = 8,540) Later Responders
(n = 2,517)
Age (years) 18–24 7.7† 12.4† 21.2‡ 15.1‡
25–29 5.1 6.4 16.2 16.130–34 6.3 6.4 12.1 14.235–44 16.5† 19.4† 19.1 21.145–49 10.0 9.5 9.8 11.750–54 10.3 10.7 8.0 8.155–64 18.6 17.4 9.6 9.5≥65 25.5† 17.8† 3.9 4.2Race/Ethnicity Hispanic 9.1† 13.2† 20.8 22.0Non‐Hispanic, Black only 9.8 12.2 13.3 15.4Non‐Hispanic, White only 75.8† 68.9† 57.7 54.0Non‐Hispanic, other or multiple races 5.3 5.8 8.2 8.6Interview Language English 96.1† 91.2† 90.0‡ 80.5‡
Spanish 2.8† 6.7† 8.7‡ 16.3‡
Other language 1.1† 2.2† 1.3‡ 3.2‡
Sex Male 42.6† 46.1† 56.8‡ 52.3‡
Female 57.4† 53.9† 43.2‡ 47.7‡
Child in Household Yes 34.8† 40.9† 40.0 43.2No 65.2† 59.1† 60.0 56.8Region I. CT, ME, MA, NH, RI, VT 5.2 5.3 3.6 3.7II. NJ, NY 9.8 10.6 7.7‡ 11.0‡
III. DE, DC, MD, PA, VA, WV 9.8 10.5 8.5 10.1IV. AL, FL, GA, KY, MS, NC, SC, TN 18.9 18.6 22.1 19.6V. IL, IN, MI, MN, OH, WI 18.1 17.2 15.2 14.1VI. AR, LA, NM, OK, TX 10.2 10.4 16.1 14.7VII. IA, KS, MO, NE 4.7† 3.8† 4.6‡ 2.8‡
VIII. CO, MT, ND, SD, UT, WY 3.3 3.0 3.5 3.3IX. AZ, CA, HI, NV 15.9 16.1 14.7 17.1X. AK, ID, OR, WA 4.1 4.5 4.2 3.7Metropolitan Statistical Area MSA, principal city 28.8 29.8 41.4 39.2MSA, not principal city 53.0 54.4 44.6 48.7Non‐MSA 18.2† 15.8† 14.0 12.0Education Level <12 years 10.5 11.6 13.9 13.112 years 22.1 22.3 21.2 25.6Some college 27.2 27.3 30.2 30.4College graduate 40.2 38.8 34.7 30.9Household Poverty Status Above poverty, annual income >$75,000 29.1 29.7 22.0‡ 17.1‡
Above poverty, annual income ≤$75,000 44.8† 40.2† 44.0 41.0Below poverty 9.9 10.3 17.5 17.8Unknown 16.3† 19.8† 16.4‡ 24.2‡

Proceedings of the 10th Conference on Health Survey Research Methods 141
Table 1, cont’d.
CHARACTERISTIC
LANDLINE CELL‐ONLY/MAINLYEarly Responders
(n = 35,079) Later Responders
(n = 10,520) Early Responders
(n = 8,540) Later Responders
(n = 2,517)
Own or Rent Dwelling Own 79.9† 77.9† 48.2 50.9Rent 17.7 18.3 46.6 45.0Other 2.5† 3.8† 5.3 4.1
Employment Status Employed 50.8† 56.9† 65.9 66.6Out of work 6.9 7.2 10.2 10.2Homemaker 8.6 8.0 4.4 5.7Student 4.2† 6.8† 9.9 8.4Retired 23.8† 16.3† 4.5 4.6Unable to work 5.7 4.7 5.2 4.4Health Insurance Status Insured 89.0 87.7 72.5 67.1No insurance 11.0 12.3 27.5 32.9Chronic Medical Condition* No 71.7† 74.3† 80.5 79.5Yes 28.3† 25.7† 19.5 20.5pH1N1 Target Group** No 63.0† 58.7† 49.4 53.4Yes 37.0† 41.3† 50.6 46.6Seasonal Target Group¶ No 27.5† 33.6† 48.7 51.0Yes 72.5† 66.4† 51.3 49.0Works in Health Care Setting No 89.4 89.7 87.0 86.6Yes 10.6 10.3 13.0 13.4† For landline sample, statistically significant association between responder status (early vs. later) and characteristic (Adjusted Wald F p‐value < 0.05), and statistically significant difference in prevalence of characteristic level between early and later respondents by post‐hoc t‐test (p < 0.05). ‡ For cell‐only/mainly sample, statistically significant association between responder status (early vs. later) and characteristic (Adjusted
Wald F p‐value < 0.05), and statistically significant difference in prevalence of characteristic level between early and later respondents by post‐hoc t‐test (p < 0.05). * Chronic medical conditions that a health professional has reported to respondent, including current asthma, other lung condition, heart condition, diabetes, kidney condition, sickle cell or other anemia, neurological or neuromuscular condition, liver condition, or weakened immune system. ** Initial H1N1 target group (among persons ≥18 years) included all persons 18–24, persons 25–64 years with a chronic medical condition, pregnant women, health care personnel, and persons living with or providing care for infants <6 months. ¶ Seasonal target group (among persons ≥18 years) included all persons 18 years, persons 19–49 with a chronic medical condition,
pregnant women, health care personnel, persons living with or providing care for infants <6 months and others at high risk for influenza‐related complications, and all persons ≥50.
Comparing influenza‐related opinions and vaccination status, some statistically significant differences
by responder status were found. For the landline sample, early responders had higher adjusted pH1N1 and
seasonal vaccination coverage than later responders, by 1.6 and 2.2 percentage points, respectively (Table 2).
Early responders had a 2.2 percentage point higher prevalence than later responders of reporting they had
very or somewhat high chances of seasonal flu sickness if not vaccinated for the landline sample, while for
the cell‐only/mainly sample, prevalence was 4.3 percentage points lower for early responders. For the cell‐
only/mainly sample, early responders were also less likely to report they were very or somewhat worried
about getting sick from seasonal flu vaccine.

142
When comparing influenza vaccination coverage as of end of May 2010 between early and later
responders by age, race/ethnicity, and target groups, most differences were not significant; however, some
statistically significant differences were found, ranging from 7.3 percentage point lower seasonal vaccination
coverage for Hispanic adults to 15.0 percentage points higher pH1N1 coverage among non‐Hispanic black
only children (Table 3). When comparing reweighted early to all responders, differences were reduced
substantially; in all subgroups examined, the point estimate for reweighted early responders fell within the
95% confidence interval for all respondents.
Table 2. Comparisons of Adjusted Prevalence* (%) of Influenza‐Related Outcomes between Early & Later Responders, National 2009 H1N1 Flu Survey (standalone component)
OUTCOME
LANDLINE SAMPLE CELL‐ONLY/MAINLY SAMPLEEarly Resp. (n = 35,079)
Later Resp. (n = 10,520)
Early –Later
Early Resp. (n = 8,540)
Later Resp. (n = 2,517)
Early –Later
Very concerned about H1N1 flu 17.1 18.1 –1.0 17.2 18.7 –1.5H1N1 flu vaccination very or somewhat effective in preventing H1N1 flu 72.6 72.8 –0.2 72.1 70.6 1.5 Very or somewhat high chances of H1N1 flu sickness if not vaccinated 25.9 25.8 0.2 28.4 28.5 –0.1 Very or somewhat worried about getting sick from H1N1 flu vaccine 31.0 32.0 –1.0 33.5 36.6 –3.1 Received H1N1 vaccination 21.4 19.8 1.6† 16.7 14.8 1.8Seasonal flu vaccination very or somewhat effective in preventing seasonal flu 82.2 81.3 0.9 77.9 78.3 –0.4 Very or somewhat high chances of seasonal flu sickness if not vaccinated 39.6 37.4 2.2† 36.8 41.1 –4.3† Very or somewhat worried about getting sick from seasonal flu vaccine 25.9 27.2 –1.4 28.5 33.9 –5.4†
Received seasonal flu vaccination 46.9 44.7 2.2† 30.2 30.8 –0.6 * Adjusted prevalence determined from predictive marginal of logistic regression model with outcome as dependent variable and main effects for responder status (early vs. later) and week of interview. Excludes first four weeks of interviews. † Statistically significant difference between adjusted prevalence of outcome between early and later responders.
To evaluate nonresponse bias by level‐of‐effort, differences in vaccination coverage estimates for all
minus later respondents (from Table 3) were multiplied by the nonresponse rate (67.8%, calculated as the
weighted average of landline and cell‐only/mainly CASRO rates, using the weighted percent of the
population in landline households of 64.6%). Estimated nonresponse bias across the 44 vaccination coverage
estimates in Table 3 ranged from –3.5 to 6.6 percentage points (median 0.4, 25th percentile –1.4, 75th percentile
1.4). No trends were detected in vaccination coverage estimates for adults or children (pH1N1 or seasonal)
by five‐level weeks since release (data not shown).

Proceedings of the 10th Conference on Health Survey Research Methods 143
Table 3. Influenza Vaccination Coverage through May 2010 for Early vs. Later & Reweighted Early vs. All Responders, by Vaccine & Selected Respondent Characteristics, National 2009 H1N1 Flu Survey (standalone component)
VACCINE & POPULATION GROUP
Early Responders
LaterResponders Early – Later
Early Reweighted All
Early Rewt. – All
pH1N1, Children 41.7 (±2.4) 39.9 (±3.5) 1.8 (±4.2) 41.7 (±2.4) 41.1 (±1.9) 0.6Race/Ethnicity Hispanic 49.6 (±6.7) 47.5 (±9.7) 2.1 ( ±11.8) 49.5 (±6.8) 48.8 (±5.6) 0.7Non‐Hispanic, Black only 35.0 (±8.1) 20.0 (±7.3) 15.0* (±10.9) 34.9 (±8.1) 29.7 (±5.9) 5.2Non‐Hispanic, White only 40.8 (±2.6) 40.6 (±4.0) 0.2 (±4.8) 40.9 (±2.6) 40.8 (±2.2) 0.1Non‐Hispanic, other 41.8 (±6.8) 48.9 (±11.8) –7.1 (±13.6) 41.8 (±6.7) 44.0 (±6.0) –2.2pH1N1, Adults 24.4 (±1.1) 23.1 (±1.8) 1.5 (±2.1) 24.3 (±1.1) 24.1 (±0.9) 0.2Race/Ethnicity Hispanic 19.6 (±4.2) 22.9 (±7.1) –3.3 (±8.3) 19.7 (±4.4) 20.7 (±3.7) –1.0Non‐Hispanic, Black only 16.8 (±3.1) 15.8 (±3.9) 1.0 (±5.0) 16.8 (±3.1) 16.5 (±2.4) 0.3Non‐Hispanic, White only 26.7 (±1.1) 24.2 (±1.8) 2.6* (±2.1) 26.7 (±1.1) 26.1 (±1.0) 0.6Non‐Hispanic, other 23.0 (±4.7) 27.8 (±6.8) –0.8 (±8.2) 23.0 (±4.6) 24.3 (±3.8) –1.3Age Group (years) 18–24 19.8 (±3.1) 19.3 ( ±4.3) 0.5 (±5.3) 19.7 ( ±2.5) 19.8 (±3.1) –0.125–29 20.0 (±3.5) 22.4 (±6.7) –2.4 (±7.6) 20.8 (±3.2) 20.1 (±3.5) 0.730–34 22.0 (±3.3) 23.2 (±5.6) –1.2 (±6.5) 22.4 (±2.8) 21.9 (±3.3) 0.535–44 23.8 (±2.6) 19.1 (±3.2) 4.7* (±4.1) 22.3 (±2.0) 23.7 (±2.6) –1.445–49 26.7 (±5.3) 24.7 (±7.4) 2.0 (±9.1) 26.1 (±4.3) 26.8 (±5.5) –0.750–54 23.1 (±3.1) 19.8 (±3.9) 3.3 (±5.0) 22.1 (±2.4) 23.0 (±3.1) –0.955–64 28.6 (±2.3) 29.1 (±3.8) –0.5 (±4.4) 28.7 (±2.0) 28.6 (±2.3) 0.1≥65 27.7 (±2.0) 27.9 (±5.7) –0.2 (±6.0) 27.9 (±2.1) 27.7 (±2.0) 0.2pH1N1 Target Group Not in target group 20.1 (±1.1) 20.0 (±2.3) 0.1 (±2.5) 19.9 (±1.2) 20.0 (±1.0) –0.1In target group 30.5 (±2.0) 27.3 (±2.9) 3.2 (±3.5) 30.4 (±2.1) 29.6 (±1.7) 0.8Health Care Setting (HCS) Does not work in HCS 22.1 (±1.1) 21.0 (±2.0) 1.1 (±2.2) 22.0 (±1.1) 21.9 (±0.9) 0.1Works in HCS 45.8 (±4.9) 41.1 (±5.4) 4.8 (±7.3) 45.8 (±5.1) 44.4 (±3.7) 1.4Seasonal, Children 45.6 (±2.3) 45.9 ( ±3.6) –0.3 (±4.2) 45.6 (±2.3) 45.7 (±1.9) –0.1Race/Ethnicity Hispanic 51.5 (±7.5) 41.5 (±10.0) 10.0 (±12.5) 51.6 (±7.6) 48.4 (±6.0) 3.2Non‐Hispanic, Black only 39.3 (±8.0) 45.8 (±10.8) –6.5 (±13.4) 39.2 (±8.0) 41.3 (±6.2) –2.1Non‐Hispanic, White only 44.4 (±2.2) 45.6 (±3.7) –1.3 (±4.3) 44.4 (±2.2) 44.7 (±1.9) –0.3Non‐Hispanic, other 51.9 (±6.8) 59.0 (±11.3) –7.1 (±13.2) 52.0 (±6.8) 54.0 (±5.9) –2.0Seasonal, Adults 43.3 (±1.0) 41.8 (±1.9) 1.5 (±2.1) 42.8 (±1.1) 43.0 (± 0.9) –0.2Race/Ethnicity Hispanic 28.1 (±3.5) 35.4 (±6.1) –7.3* (±7.0) 27.9 (±3.4) 30.3 (±3.1) –2.4Non‐Hispanic, Black only 36.4 (±3.8) 32.6 (±5.3) 3.8 (±6.6) 35.9 (±3.8) 35.1 (±3.1) 0.8Non‐Hispanic, White only 47.8 (±1.1) 45.1 (±2.0) 2.7* (±2.3) 47.4 (±1.1) 47.1 (±1.0) 0.3Non‐Hispanic, other 38.8 (±4.2) 44.8 (±7.2) –6.1 (±8.3) 38.5 (±4.2) 40.4 (±3.6) –1.9Age Group (years) 18–24 24.5 (±3.1) 28.7 (±5.5) –4.2 (±6.3) 24.4 (±3.1) 25.7 (±2.7) –1.325–29 27.5 (±3.7) 30.3 (±6.1) –2.8 (±7.1) 27.3 (±3.7) 28.3 (±3.2) –1.030–34 35.1 (±3.8) 31.4 (±5.6) 3.6 (±6.8) 34.9 (±3.8) 34.0 (±3.1) 0.935–44 35.1 (±2.4) 34.6 (±3.7) 0.4 (±4.4) 34.9 (±2.4) 34.9 (±2.0) 0.045–49 36.8 (±3.3) 35.0 (±5.4) 1.8 (±6.3) 36.7 (±3.4) 36.4 (±2.8) 0.350–54 41.8 (±3.1) 45.3 (±7.4) –3.5 (±8.0) 41.8 (±3.1) 42.8 (±3.1) –1.055–64 52.9 (±2.3) 55.3 (±3.9) –2.4 (±4.5) 52.9 (±2.3) 53.5 (±2.0) –0.6≥65 72.5 (±2.0) 69.3 (±3.8) 3.2 (±4.3) 72.5 (±2.1) 71.9 (±1.8) 0.6

144
Table 3, cont’d.
VACCINE & POPULATION GROUP
Early Responders
LaterResponders Early – Later
Early Reweighted All
Early Rewt. – All
Seasonal, Adults (cont’d) 41.7 (±2.4) 39.9 (±3.5) 1.8 (±4.2) 41.7 (±2.4) 41.1 (±1.9) 0.6Seasonal Target Group Not in target group 25.0 (±1.6) 28.4 (±2.8) –3.4* (±3.3) 24.9 (±1.6) 26.0 (±1.4) –1.1In target group 53.2 (±1.3) 50.6 (±2.3) 2.6 (±2.7) 52.7 (±1.3) 52.6 (±1.1) 0.1Health Care Setting (HCS) Does not work in HCS 41.1 (±1.1) 39.6 (±2.0) 1.5 (±2.3) 40.5 (±1.1) 40.8 (±1.0) –0.3Works in HCS 62.0 (±3.2) 60.0 (±5.6) 2.1 (±6.4) 61.7 (±3.2) 61.5 (±2.8) 0.2* Statistically significant difference in estimated vaccination coverage between early and later respondents, p < 0.05.
DISCUSSION
This study found moderate differences in many sociodemographic and other characteristics between early
and later cooperators to a telephone survey about influenza vaccination. For key influenza‐related opinions
and vaccination status, some differences were found between early and later responders. After restricting the
sample to early responders and adjusting the weights by poststratification to population control totals, these
differences were reduced. With 77% of the total respondents classified as early respondents, differences
between early and later respondents would need to be larger to result in substantial bias from restriction of the
sample to early respondents. Assuming later responders were representative of nonresponders, nonresponse
bias of influenza vaccination coverage estimates from the full sample were estimated to be less than two
percentage points for the majority of population subgroups examined.
Similar to a previous study using the 2004 Behavioral Risk Factor Surveillance System, this study found
early cooperators were more likely to be older, non‐Hispanic White, and female (Biemer & Link, 2008). That
study reported a larger difference (7.6 percentage points) in receipt of influenza vaccination between early
and later cooperators (defined by number of call attempts) but similarly found a smaller difference (2.6)
between early cooperators and all respondents.
This study is among the first to evaluate early responders from a cell phone sample. Fewer differences
were found between early and later responders to the cell sample compared to the landline sample; in some
cases, the opposite effect was found. In the cell sample, early responders were more likely to be younger and
male, and race/ethnicity was not associated with responder status. Influenza vaccination coverage did not
differ by responder status for the cell sample, but there were differences for two of the opinion outcomes,
with an opposite early responder effect between cell and landline samples for one of them. These findings
underscore the need for further studies to evaluate factors associated with propensity to respond to cell
phone surveys, and implications for nonresponse bias.
The five‐week rolling sample design of the NHFS maximized response rates while allowing weekly
estimates during the 2009–2010 influenza pandemic. For the 2010–2011 season, the CDC needed estimates
for the start of National Influenza Vaccination Week (NIVW) in early December. Because the incidence of
influenza vaccination typically changes substantially during October and November, a short survey field
period was desired to provide the most up‐to‐date estimates with results available in time for use during
NIVW. Thus, the 2010–11 season National Flu Survey was conducted November 1–13, 2011. The findings of
this NHFS analysis suggest that estimates would not have been substantively different with a longer field
period. Future two‐week rapid influenza surveys should consider including a subsample followed for a
longer time to allow assessment of early responder bias, which may differ in different influenza seasons
depending on the nature of public perceptions and saliency related to severity of influenza season, shortage

Proceedings of the 10th Conference on Health Survey Research Methods 145
of vaccine, or safety issues. For repeated cross‐section designs like the NHFS, cost could have been reduced
by about 13% if restricted to two‐week rolling panels; these resources could be redirected to increasing
sample size.
This report has several limitations. If the NHFS had been designed with a two‐week follow‐up period,
survey operations likely would have been modified, as was done for November 1–13, 2010, National Flu
Survey, which would tend to improve the results compared to restricting to early respondents in a longer
period survey. While reducing the field period appeared not to affect results, the bias in estimates based on
the full sample is unknown. The nonresponse bias analysis assumed that later respondents were
representative of nonrespondents, which may not be true. Thus, further studies comparing NHFS results to
external sources are needed to assess overall bias. Because the NHFS was conducted for the purpose of
monitoring influenza vaccination during a pandemic, response propensity may have been influenced by
topic saliency and altered the early cooperator effects as compared to other general purpose surveys
conducted at the same time or in future inter‐pandemic influenza seasons.
When timely information is needed for decision making during emergency situations, tradeoffs may be
necessary with other survey attributes (e.g., response rates). The “fitness for use” of survey estimates in this
situation will depend on how the estimates will be used (Groves et al., 2009), how much potential random
and systematic error can be tolerated, and the loss function associated with incorrect conclusions resulting
from survey error. This study indicates that shortening the field period of a telephone‐based influenza
vaccination survey can provide more rapid results without increasing systematic error.
REFERENCES
American Association of Public Opinion Research. (2011). Standard definitions: Final dispositions of case codes and
outcome rates for surveys. Available at
www.aapor.org/AM/Template.cfm?Section=Standard_Definitions2&Template=/CM/ContentDisplay.cfm&Cont
entID=3156
Biemer, P. P., & Link, M. W. (2008). Evaluating and modeling early cooperator effects in RDD surveys. In J. M.
Lepkowki, C. Tucker, J. M. Brick, E. D. De Leeuw, L. Japec, & P. J. Lavrakas (Eds.), Advances in telephone survey
methodology. John Wiley & Sons, Inc.
CDC. (2010). Preliminary results: Surveillance for Guillain‐Barré syndrome after receipt of influenza A (H1N1)
2009 monovalent vaccine—United States, 2009–2010. MMWR, 59, 657–661.
Ding, H., Lu, P.J., Euler, G.L., Furlow, C., Bryan, L. N., Bardenheier, B., et al. (2010). Interim results: state–specific
seasonal influenza vaccination coverage—United States, August 2009–January 2010. MMWR, 59, 477–484.
Final estimates online at www.cdc.gov/flu/professionals/vaccination/vaccinecoverage.htm
Fiore, A.E., Shay, D. K., Broder, K., Iskander, J. K., Uyeki, T. M., Mootrey, G., et al. (2009). Prevention and control
of seasonal influenza with vaccines: Recommendations of the Advisory Committee on Immunization
Practices (ACIP). MMWR, 58(RR–8), 1–52.
Gargiullo, P., Shay, D., Katz, J., Bramley, A., Nowell, M., Michalove, J., et al. (2009). Effectiveness of 2008–09
trivalent influenza vaccine against 2009 pandemic influenza A (H1N1)—United States, May–June 2009.
MMWR, 58, 1241–1245.
Groves, R. M. (2006). Nonresponse rates and nonresponse bias in household surveys. Public Opinion Quarterly, 70,
646–675.
Groves, R. M., Fowler, F. J., Couper, M. P., Lepkowski, J. M., Singer, E., & Tourangeau, R. (2009). Survey
methodology (2nd ed.). John Wiley & Sons, Inc.
Keeter, S., Kennedy, C., Dimock, M., Best, J., & Craighill, P. (2006). Gauging the impact of growing nonresponse
on estimates from a national RDD telephone survey. Public Opinion Quarterly, 70, 759–779.

146
Link, M. W., Mokdad, A., & Balluz, L. (2010). Conducting real‐time health surveillance during public health
emergencies: The Behavioral Risk Factor Surveillance System experience. In L. A. Aday & M. Cynamon
(Eds.), Ninth conference on health survey research methods. Hyattsville, MD: National Center for Health Statistics.
Available at www.cdc.gov/nchs/data/misc/proceedings_hsrm2010.pdf
Lu, P. J., Ding, H., Euler, G. L., Furlow, C., Bryan, L. N., Bardenheier, B., et al. (2010). Interim results: State–
specific influenza A (H1N1) 2009 monovalent vaccination coverage—United States, October 2009–January
2010. MMWR, 59, 363–368. Final estimates online at:
http://www.cdc.gov/flu/professionals/vaccination/vaccinecoverage.htm.
National Center for Immunization and Respiratory Diseases (NCIRD), Centers for Disease Control and
Prevention. (2009). Use of influenza A (H1N1) 2009 monovalent vaccine: Recommendations of the Advisory
Committee on Immunization Practices (ACIP). MMWR, 58(RR–10), 1–8.
Schuchat, A., Bell, B. P., & Redd, S. C. (2011). The science behind preparing and responding to pandemic
influenza: The lessons and limits of science. Clinical Infectious Diseases, 52, S8–S12.
Singleton, J. A. (2010, April). Who got H1N1 vaccine? Findings from the U.S. 2009–2010 influenza vaccination
surveillance systems. Paper presented at the National Immunization Conference, Atlanta.
Singleton, J. A., Copeland, K. R., Davis, N., Ganesh, N., Wolter, K.M., & Euler, G. (2010). The National 2009 H1N1
Flu Survey: Rapid data collection and early responder analysis. Paper presented at the 65th Annual Meeting of the
American Association of Public Opinion Research, Chicago.
Singleton, J. A., Santibanez, T. A., Lu, P. J., Ding, H., Euler, G. L., Armstrong, G. L., et al. (2010). Interim results:
Influenza A (H1N1) 2009 monovalent vaccination coverage—United States, October–December 2009. MMWR,
59, 44–48.
Velozzi, C., Broder, K.R., Haber, P., Guh, A., Nguyen, M., Cano, M., et al. (2010). Adverse events following
influenza A (H1N1) 2009 monovalent vaccines reported to the Vaccine Adverse Events Reporting System,
United States, October 1, 2009–January 31, 2010. Vaccine, 28, 7248–7255.

Proceedings of the 10th Conference on Health Survey Research Methods 147
Does Using Multiple Modes Increase Sample Representativeness?
Jeanette Ziegenfuss and Timothy Beebe (Mayo Clinic College of Medicine)
Paper not submitted; alternate version published as Beebe, T. J., McAlpine, D. D., Ziegenfuss, J. Y.,
Jenkins, S., Haas, L., & Davern, M.E. (2012). Deployment of a mixed‐mode data collection strategy does not
reduce nonresponse bias in a general population health survey. Health Services Research, 47, 1739–1754.

148

Proceedings of the 10th Conference on Health Survey Research Methods 149
Designed Missingness to Better Estimate Efficacy of Behavioral Studies
Ofer Harel and Jeffrey Stratton (Department of Statistics, University of Connecticut) Robert Aseltine (Institute for Public Health Research, University of Connecticut Health Center)
INTRODUCTION
Randomized trials of diverse behavioral interventions routinely observe declines in problem behavior
among control subjects that cannot be attributed to flawed experimental design (e.g., contamination). For
example, in nearly a dozen separate studies of risky drinking among adults reviewed by the U.S. Preventive
Services Task Force, the average decline in drinking from baseline to follow‐up among treatment subjects
was 28%, but was 16% for control subjects (Whitlock, Polen, Green, Orleans, & Klein, 2004). Explanations for
this pattern of effects generally focus on assessment reactivity, which refers to changes in behavior that result
from exposure to either intensive assessment protocols used to identify subjects for inclusion in the research
study or routine baseline research assessments in a pretest‐posttest control group design (Jenkins,
McAlaney, & McCambridge, 2009). In other words, the research activities and procedures themselves may
constitute an intervention of sorts, and control subjects in this context may be better characterized as an
“intervention lite” group as opposed to an untreated control group. Such conditions may lead to serious
underestimates of the efficacy of behavioral interventions. An additional complication with long baseline
assessments is incomplete data.
One possible remedy for this problem is the use of “designed missingness” in the collection of baseline
or pretest data. This strategy, which intentionally collects data on only a subset of cases and/or indicators
and uses imputation techniques to address the resulting structured missingness, has been employed to
increase the efficiency and cost‐effectiveness of data collection in large‐scale epidemiologic studies (Strauss
et al., 2010). In the current study, we employed a designed missingness strategy for a different objective: to
mitigate the potential for assessment reactivity. The following sections present our motivating example for
this study, the methods we used, the results, and finally, a discussion.
MOTIVATING EXAMPLE
This strategy was implemented as part of the Connecticut Youth Suicide Prevention Initiative conducted
from 2006–2009 by the Connecticut Department of Mental Health and Addiction Services and the University
of Connecticut Health Center. Seventeen (CT) schools were included in the intervention, which featured the
“Signs of Suicide” (SOS) prevention program, a brief school‐based suicide prevention program produced by
Screening for Mental Health, Inc. The study utilized a randomized pretest‐posttest experimental design,
with outcomes assessed at baseline and at three months post‐intervention using anonymous questionnaires
administered during class. Four versions of the pretest questionnaire were used: one full version and three
truncated versions, each of which included a different subset of items in the full version. Three out of sixteen
technical high schools were randomly selected to receive one of three truncated versions of the pretest
questionnaire. In addition, class periods in a separate large comprehensive high school were randomly
selected to receive one the four versions of the questionnaire. Table 1 specifies the questions asked of
students on each of the four pretests. The truncated versions were modified to reduce the amount of
behavioral information collected at baseline among control subjects.

150
The SOS instrument measures students’ attitudes and knowledge about suicide. Attitudes were
measured with a ten‐item scale, and knowledge with a 7‐item scale (Aseltine & DeMartino, 2004). The initial
survey had 1,586 cases, but 295 cases were not used due to a missing VERSION on the questionnaire. Thus,
the final sample size for this study is 1,291 students. The sample was 58% male and 42% female. Ten percent
of respondents spoke English as a second language. The students self‐identified their race/ethnicity as White
non‐Hispanic (60%), Black non‐Hispanic (6%), Hispanic (23%), multi‐ethnic (9%), and other (2%).
Table 1. Questionnaire Items, by Version
Item Versions Content Valid Values
Q1 0 1 People who talk about suicide don’t really kill themselves. Yes/No (1/5)
Q2 0 1 People who commit suicide are usually suffering from depression or some other mental illness.
Yes/No (1/5)
Q3 0 3 Most suicide attempts occur without any warning signs or clues. Yes/No (1/5)Q4 0 1 Depression is an illness that doctors can treat. Yes/No (1/5)
Q5 0 3 The best thing to tell a suicidal friend is to “pull yourself together and things will get better.”
Yes/No (1/5)
Q6 0 2 If I talk to someone about their suicidal feelings, it may cause them to commit suicide.
Yes/No (1/5)
Q7 0 2 Alcohol use is not related to suicidal behavior. Yes/No (1/5)
Q8 0 2 Sometimes young people have so many personal problems they have no other options besides suicide.
Likert (1/2/3/4/5)
Q9 0 1 If someone really wants to kill himself/herself, there is not much anyone can do about it.
Likert (1/2/3/4/5)
Q10 0 2 It's none of my business if a friend says he/she wants to kill himself/herself. Likert (1/2/3/4/5)
Q11 0 2 If I were feeling really down, I would try to talk to a counselor or some other adult about my problems.
Likert (1/2/3/4/5)
Q12A 0 1 3 If a friend told me...: I wouldn't know what to do. Likert (1/2/3/4/5)Q12B 0 1 3 If a friend told me...: I would keep it to myself. Likert (1/2/3/4/5)Q12C 0 2 3 If a friend told me...: I would wish that I had not found out about it. Likert (1/2/3/4/5)
Q12D 0 3 If a friend told me...: I would keep it a secret if my friend made me promise not to tell.
Likert (1/2/3/4/5)
Q12E 0 3 If a friend told me...: I would tell an adult at school about it. Likert (1/2/3/4/5)
Q12F 0 3 If a friend told me ...: I would tell a parent or some other adult outside of school about it.
Likert (1/2/3/4/5)
MULTIPLE IMPUTATION
Multiple imputation (MI) is a technique initially proposed by Rubin (1977, 1978). The basic procedure of
multiple imputation is quite simple. We create m multiple complete data sets, filling in the missing
observations in a principled way. The objective of MI is to use complete‐data methods to analyze a data set.
Multiple imputation incorporates the uncertainty due to the missing data in the imputation process (Harel
& Zhou, 2007). We perform a complete‐data analysis on the m different data sets and then combine the
results using rules defined by Rubin (1987). A good summary of multiple imputation as well as software is
provided by Harel and Zhou (2007).
Multiple imputation combines aspects of both the Bayesian and frequentist statistical paradigms. The
imputed data sets are often created using Markov Chain Monte Carlo (MCMC) simulations. However, the
complete‐data analysis often uses frequentist statistical methods. This research implements the multiple
imputation methodology of Raghunathan and colleagues (2001), which is well suited to survey data where
there are many different variable types and the data structure can be complicated by skip patterns.

Proceedings of the 10th Conference on Health Survey Research Methods 151
Imputations are obtained by fitting a sequence of regression models and drawing values from the
corresponding predictive distributions. The types of regression models used are linear, logistic, Poisson,
generalized logit, or a mixture of these depending on the type of variable being imputed. The method also
allows the imputations to be restricted to relevant subpopulations or to satisfy bounds on the variables.
Software to implement the method is available as a SAS macro called IVEware. This macro produces
imputed values for each individual in the data set conditional on all the values observed for that individual
(Raghunathan, Solengerger, & Van Hoewyk, 2002). Imputation is done on a variable‐by‐variable basis while
conditioning on all observed variables. Imputations are created using a sequence of multiple regressions,
varying the type of regression model by the type of variable being imputed. Covariates include all other
variables observed or imputed for that individual. The imputations are drawn from the posterior predictive
distribution specified by the regression model with a flat or non‐informative prior distribution for the
parameters in the regression model. Variables are imputed in sequence, each time overwriting previously
drawn values. This builds in dependencies among imputed values and uses the correlation structure among
the covariates. To generate multiple imputations, the same procedure can be applied with different random
starting seeds or taking every pth imputed set of values in the cycles mentioned above. This research uses 100
multiple imputations based on a recommendation in Harel (2007). We analyze the influence of test version
on survey response for both the complete data and using multiple imputation.
RESULTS
The attrition and completion rates by version are summarized in Table 2. Cases are complete if
Version 0: a respondent responded to all of the nondemographic questionnaire items (Q1–Q28)
Version 1: a respondent responded to all of the questionnaire items for Version 0 except Q3, Q5, Q6,
Q7, Q8, Q10, Q11, Q12C, Q12D, Q12E, and Q12F
Version 2: a respondent responded to all of the questionnaire items except Q1, Q2, Q3, Q4, Q5, Q9,
Q12A, Q12B, Q12D, Q12E, and Q12F.
Version 3: a respondent responded to all of the questionnaire items except Q1, Q2, Q4, Q6, Q7, Q8,
Q9, Q10, and Q11.
Cases are considered “attritions” if respondents did not even attempt the questionnaire; they are
incomplete if it was attempted but some questions were left blank. As indicated by the contrast between and
completion rates for version 0 versus all other versions, we found that the response rate was larger for the
truncated versions of the questionnaire compared to the full version.
There was also a significant effect of the use of “designed missingness” on individuals’ response
patterns at pretest and posttest. In particular, we examined the effect of version on attitudes toward and
knowledge of suicide in the pretest, the posttest, and in the difference between the two. We regressed each
question on version, controlling for race, gender, reduced lunch status (Lunch), grade point average (GPA),
and motherʹs education level (MomEd):
Version Race Gender Lunch GPA MomEd
We present both complete case analysis and multiple imputation. The regression coefficients for
VERSION along with their p‐values for each item are given in Table 3. As the data in Table 3 indicate, out of
17 questions, six had a significant version coefficient. All version coefficients indicated that students who
answered the question at pretest had more knowledge or more favorable attitudes toward suicide in the
posttest.

152
In addition to regressions for each individual item, we computed a summary statistic for the attitude
questionnaire items. The SOS Average variable (SOSavg) is an overall measure of student attitudes about
suicide. It consists of the average score of all or a subset of questionnaire items Q8–Q12F. Pretest version 0
subjects received all 10 questions, while subjects of the other pretest versions received a subset of those
questions (see Table for details). Each of these questions is a Likert‐scale question with five possible
responses. A higher SOS Average score represents more negative responses with regard to suicide attitudes.
Questionnaire items Q11, Q12E, and Q12F needed to have their responses reversed to match the scales of the
other items. We compute SOSaverage for each respondent, and present the mean SOSaverage for the pretest
and posttest of controls compared with the truncated versions. Figure 1 shows the mean SOS average of
controls compared with the truncated versions.
Table 2. Attrition & Completion Rates, by Version
Test
n
Demographic Variables? Version
AttritionRate
CompletionRate
Pretest
1,291 Yes All 4/1291 = 0.0031 984/1291 = 0.7622982 Yes 0 4/982 = 0.0041 720/982 = 0.7332114 Yes 1 0 99/114 = 0.8684117 Yes 2 0 101/117 = 0.863278 Yes 3 0 64/78 = 0.8205
Posttest
1,291 Yes All 237/1291 = 0.1836 818/1291 = 0.6336982 Yes 0 212/982 = 0.2159 577/982 = 0.5876
114 Yes 1 7/114 = 0.0614 89/114 = 0.7807
117 Yes 2 16/117 = 0.1368 89/117 = 0.7607
78 Yes 3 2/78 = 0.0256 63/78 = 0.8077
Table 3. Significance of Version in Regressions
Item Questionnaire Versions Posttest Complete Posttest MI Result
Q1 0, 1 NS NSQ2 0, 1 NS NSQ3 0, 3 0.5512 (0.0089) 0.5317 (0.0125) More knowledgeQ4 0, 1 –0.5182 (0.0080) –0.5734 (0.0031) More knowledgeQ5 0, 3 NS NSQ6 0, 2 0.4566 (0.0403) 0.4929 (0.0242) More knowledgeQ7 0, 2 –0.3980 (0.0646) NS Less knowledgeQ8 0, 2 NS NSQ9 0, 1 –0.3425 (0.0415) –0.4996 (0.0019) Better attitudeQ10 0, 2 NS NSQ11 0, 2 NS NSQ12A 0, 1, 3 NS –0.3293 (0.0910) Better attitudeQ12B 0, 1, 3 NS –0.4218 (0.0304) Better attitudeQ12C 0, 2, 3 NS NSQ12D 0, 3 NS NSQ12E 0, 3 NS NSQ12F 0, 3 0.3311 (0.0381) NS Better attitude
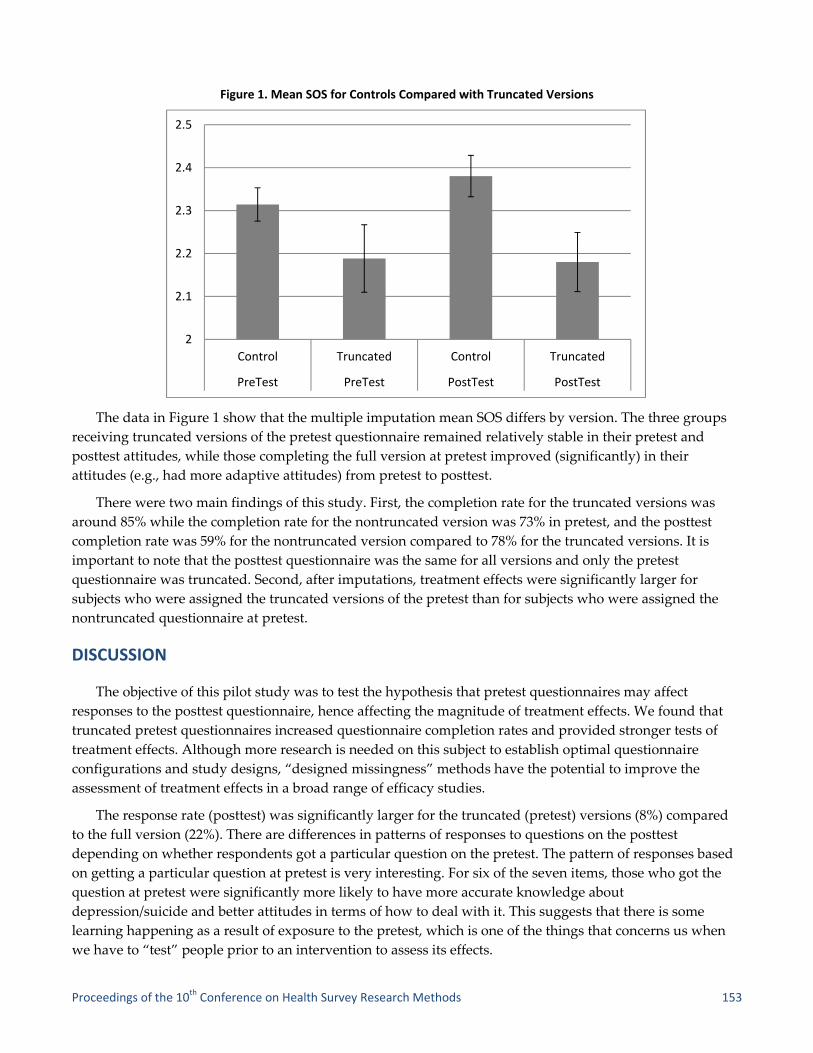
Proceedings of the 10th Conference on Health Survey Research Methods 153
Figure 1. Mean SOS for Controls Compared with Truncated Versions
The data in Figure 1 show that the multiple imputation mean SOS differs by version. The three groups
receiving truncated versions of the pretest questionnaire remained relatively stable in their pretest and
posttest attitudes, while those completing the full version at pretest improved (significantly) in their
attitudes (e.g., had more adaptive attitudes) from pretest to posttest.
There were two main findings of this study. First, the completion rate for the truncated versions was
around 85% while the completion rate for the nontruncated version was 73% in pretest, and the posttest
completion rate was 59% for the nontruncated version compared to 78% for the truncated versions. It is
important to note that the posttest questionnaire was the same for all versions and only the pretest
questionnaire was truncated. Second, after imputations, treatment effects were significantly larger for
subjects who were assigned the truncated versions of the pretest than for subjects who were assigned the
nontruncated questionnaire at pretest.
DISCUSSION
The objective of this pilot study was to test the hypothesis that pretest questionnaires may affect
responses to the posttest questionnaire, hence affecting the magnitude of treatment effects. We found that
truncated pretest questionnaires increased questionnaire completion rates and provided stronger tests of
treatment effects. Although more research is needed on this subject to establish optimal questionnaire
configurations and study designs, “designed missingness” methods have the potential to improve the
assessment of treatment effects in a broad range of efficacy studies.
The response rate (posttest) was significantly larger for the truncated (pretest) versions (8%) compared
to the full version (22%). There are differences in patterns of responses to questions on the posttest
depending on whether respondents got a particular question on the pretest. The pattern of responses based
on getting a particular question at pretest is very interesting. For six of the seven items, those who got the
question at pretest were significantly more likely to have more accurate knowledge about
depression/suicide and better attitudes in terms of how to deal with it. This suggests that there is some
learning happening as a result of exposure to the pretest, which is one of the things that concerns us when
we have to “test” people prior to an intervention to assess its effects.
2
2.1
2.2
2.3
2.4
2.5
Control Truncated Control Truncated
PreTest PreTest PostTest PostTest

154
The (pretest) testing itself can produce posttest changes in the outcome measures irrespective of effects
of the intervention. It was beneficial to use multiple imputation to reduce assessment reactivity. After
imputations, treatment effects were significantly larger for subjects who were assigned the truncated
versions of the pretest than for subjects who were assigned the non‐truncated questionnaire at pretest.
The objective of this pilot study was to test the hypothesis that pretest questionnaires may affect
responses to the posttest questionnaire, hence affecting the magnitude of treatment effects. Although more
research is needed on this subject to establish optimal questionnaire configurations and study designs,
“designed missingness” methods have the potential to improve the assessment of treatment effects in a
broad range of efficacy studies.
ACKNOWLEDGMENTS
This project was partially supported by Award Number K01MH087219 from the National Institute of
Mental Health. The content is solely the responsibility of the authors and does not necessarily represent the
official views of the National Institute of Mental Health or the National Institutes of Health.
REFERENCES
Aseltine, R. H., Jr., & DeMartino, R. (2004). An outcome evaluation of the SOS suicide prevention program.
American Journal of Public Health, 94, 446–451.
Harel, O. (2007). Inferences on missing information under multiple imputation and two‐stage multiple
imputation. Statistical Methodology, 4, 75–89.
Harel, O. & Zhou, X. H. (2007). Multiple imputation: Review of theory, implementation and software. Statistics in
Medicine, 26, 3057–3077.
Jenkins, R. J., McAlaney, J., & McCambridge, J. (2009). Change over time in alcohol consumption in control
groups in brief intervention studies: Systematic review and meta‐regression study. Drug and Alcohol
Dependence, 100, 107–114.
Raghunathan, T. E., Lepkowski, J. M., Van Hoewyk, J., & Solenberger, P. (2001). A multivariate technique for
multiply imputing missing values using a sequence of regression models. Survey Methodology, 27, 85–95.
Raghunathan, T. E., Solenberger, P. W., & Van Hoewyk, J. (2002, March). IVEware: Imputation and variance
estimation software user guide. Survey Methodology Program, Survey Research Center, Institute for Social
Research, University of Michigan.
Rubin, D. B. (1976). Inference and missing data. Biometrika, 63, 581–592.
Rubin, D. B. (1978). Multiple imputations in sample surveys—A phenomenological Bayesian approach to
nonresponse. In Proceedings of the Survey Research Methods Section of the American Statistical Association (pp. 20–
34).
Rubin, D. B. (1987). Multiple imputation for nonresponse in surveys. Hoboken, NJ: John Wiley and Sons.
Strauss, W. J., Ryan, L., Morara, M., Iroz‐Elardo, N., Davis, M., Cupp, M., et al. (2010). Improving cost‐
effectiveness of epidemiological studies via designed missingness strategies. Statistics in Medicine, 29, 1377–
1387.
Whitlock, E. P., Polen, M. R., Green, C. A., Orleans, T., & Klein, J. (2004). Behavioral counseling interventions in
primary care to reduce risky/harmful alcohol use by adults: A summary of the evidence for the U.S.
preventive services task force. Annals of Internal Medicine, 140, 557–568.

Proceedings of the 10th Conference on Health Survey Research Methods 155
Correction for Survey Nonresponse and Measurement Error Andy Peytchev (RTI International)
NONRESPONSE & MEASUREMENT ERROR
Surveys often employ adjustments that aim to correct for nonresponse. Such adjustments typically
increase the variance of estimates, invoking a tradeoff between bias reduction and variance inflation.
Corrections for measurement error in public use data files are seldom—if ever—made. Yet, depending
on the influences on nonresponse in a survey and the factors affecting misreporting to a particular question
in that survey, bias in an estimate can be dominated by measurement error. Several studies already have
demonstrated instances where measurement is the dominant source of bias compared to nonresponse
(Groves & Magilavy, 1984; Olson, 2006). Thus, corrections for measurement error in addition to adjustments
for nonresponse are needed. Moreover, these corrections need to be accessible to the wide range of data
users rather than to a select few who could implement complex procedures to estimate the combined effect
of multiple error sources (e.g., Biemer, 2001; Jackman, 1999; Voogt, 2005).
There could be common causes and correlates for nonresponse and measurement error (e.g., Peytchev,
Peytcheva, & Groves, 2010). If, for instance, interviewers with particular characteristics or skills lead to less
nonresponse and lower measurement error, interviewer selection criteria and training can be altered to
reduce total survey error. Conversely, experienced interviewers have been found to achieve higher response
rates but elicit lower reporting of sensitive behaviors suggesting that a greater proportion of experienced
interviewers could yield less nonresponse in a survey, but higher measurement error (Chromy et al. 2005).
Such information would be useful in correcting for both sources of error.
The relative magnitude of each error also needs to be measured in order to help reduce total survey
error in an estimate. Steps could be taken to embed design features for the reduction of the dominant
source—thus disproportionately allocating study resources where they make the greatest impact. For
example, finding that most of the error stems from underreporting to interviewers, a greater number of
questions can be included in the self‐administered portion despite the possibly higher nonresponse if the
instrument is lengthened. The magnitude of each error has similar implications for postsurvey adjustments.
The largest source of error should receive greater attention in modeling efforts, and collection of more
auxiliary information to inform these models. For example, if underreporting of a sensitive behavior is the
dominant source of bias in population prevalence estimates for this behavior, correlates of how
sensitive the respondent finds this topic and how likely she is to report it to an interviewer could be
most beneficial (in addition to correlates of the behavior itself).
This leads to two related research questions that can be posed for a given estimate:
1. Are there common correlates of nonresponse and measurement error?
2. What are the relative magnitudes of nonresponse and measurement error?
To answer each of these questions, however, methods are needed to estimate each source of error. This
is the focus of the next section.

156
MULTIPLE IMPUTATION FOR UNIT NONRESPONSE, ITEM NONRESPONSE, & MEASUREMENT ERROR
Rather than weight for nonresponse and omit adjustments for measurement error, we propose
implementing multiple imputation for both sources of error, treating both as missing data problems.
Multiple imputation involves the filling of missing values in variables using a selected imputation method
and repeating the process multiple times, creating multiple datasets. Imputed values vary across the
datasets to the extent that there is uncertainty in the imputation. Variance is estimated by adding the
variance of the estimates of the parameter of interest, say a proportion, between the multiple imputed
datasets (between imputation variance) and the average variance of the estimate across the datasets (within
imputation variance). For a detailed discussion, the reader is referred to the seminal work by Rubin (1978;
1987); a less technical presentation can be found in the IVEware manual (www.isr.umich.edu/src/smp/ive/).
Analogous to weighting, multiple imputation is not by itself a method but an approach. Different methods of
imputation can be used within the multiple imputation inferential framework. However, it is most often
associated with methods that model each variable rather than the nonresponse mechanism. For the present
study, an increasingly common and widely available method was selected—sequential regression multiple
imputation (Raghunathan et al., 2001)—and described in more detail in the next section.
There are several important theoretical and practical advantages to using multiple imputation instead of
weighting for unit nonresponse, three of which are of critical importance to the reduction of survey errors.
First, imputation can model the variable of interest rather than on whether a sample member responded to
the survey. That is, the imputation models typically address the problem of how sample members would
have responded if they had completed the interview. In contrast, weighting for nonresponse addresses the
question of how likely these sample members were to respond to the survey. Even when both models fit
reasonably well, the difference between these two objectives can lead to greater variance in survey estimates
that employ weighting, compared to imputation, particularly when the identified mechanisms producing
unit nonresponse are not strongly associated with the survey variables. Thus, weighting typically increases
variance estimates, especially when the response propensity model is highly predictive of nonresponse
(Little & Vartivarian, 2005). A good‐fitting imputation model, however, can potentially lead to lower
variance estimates.
Second, model specification in imputation can be variable‐specific, while in weighting the same weights
are used for all or majority of survey variables. Rather than limiting which auxiliary variables can be used
for an overall adjustment, imputation methods such as those employing regression can tailor the set of
auxiliary variables and model specification to each specific survey variable, such as including different
higher order interactions that would vary across models—thus producing better adjustments for each
survey variable. Thus, imputation could not only lead to lower variance estimates but also lower bias,
compared to weighting.
Third, imputation allows for the use of a larger array of auxiliary variables by easily incorporating data
subjected to missingness themselves. When weighting is employed, either only variables without missing
data are used or variables with low levels of missingness are used after imputation. In contrast, multiple
imputation as a method initially conceived for dealing with item nonresponse (Rubin, 1987) readily
incorporates variables with missingness even when it is substantial. For example, administrative data may
be highly associated with survey variables but available only for a relatively small proportion of the sample;
multiple imputation can incorporate such data to help further reduce nonresponse bias and can also account
for the uncertainty in the missing values of the auxiliary variables.

Proceedings of the 10th Conference on Health Survey Research Methods 157
Multiple imputation also can be used for measurement error by treating it as a missing data problem—
when the information with more desirable measurement properties is not available for part or even the
entire sample. Several studies have attempted multiple imputation for measurement error, whether through
simulation, a validation study to a larger survey, a survey with physical measures of only part of the
sample, or simply a survey deemed less measurement error‐prone compared to administrative data, making
an argument for the benefits of this approach to reduction of measurement error (Brownstone & Valletta,
1996; Cole, Chu, & Greenland, 2006; Ghosh‐Dastidar & Schafer, 2003; Raghunathan, 2006; Yucel &
Zaslavsky, 2005).
This leads to a third important research question:
3. Could multiple imputation for unit nonresponse, item nonresponse, and measurement error reduce
standard errors and total survey error (MSE) for an estimate, compared to weighting?
This question is one that may have the broadest implications and may spur future research, as it
addresses the inherent need to address both nonresponse and measurement error effectively and efficiently
in surveys. A necessary discussion at this point needs to be about the circumstances in which multiple
imputation for nonresponse and measurement error can be particularly relevant.
TYPES OF DATA STRUCTURES FACILITATING MULTIPLE IMPUTATION FOR NONRESPONSE & MEASUREMENT ERROR
Several general designs can be identified in which both nonresponse and measurement error in
household surveys could be addressed through multiple imputation—we briefly describe four. A first type
of design is when a superior approach to the collection of accurate survey reports is available but not
feasible to collect for the entire sample. For example, the National Survey of Family Growth (NSFG) collects
information on sensitive behaviors, such as abortion experiences, that are subjected to underreporting when
asked by an interviewer. Underreporting due to the social interaction between the interviewer and the
respondent can be minimized by asking about such behaviors in a self‐administered portion of the
interview. To control the length of the self‐administered part of interview and respondent engagement,
either a small number of questions can be re‐asked in the self‐administered part of the interview or different
respondents can be asked subsets of the sensitive questions, again creating a missing data problem in the
less measurement error‐prone reports. Furthermore, some respondents may refuse to answer some or all of
the self‐administered questions. Another example of this data structure is the National Survey of Drug Use
and Health (NSDUH), which uses field interviewers to collect mental health data, among other measures.
Serious mental illness is identified based on these data. Improved measurement can be achieved through
administration of multiple mental health scales by clinical researchers. Use of highly trained professionals
and a separate data collection is costly and can only be afforded for a small subsample of NSDUH
respondents, creating a missing data problem in the improved measures that were handled through
weighting (Aldworth et al., 2010). The resulting missing data pattern is presented in Figure 1 (panel a),
which we label the Multiple Measures design. To fill in all the shaded areas, as well as any item
nonresponse in any of the data, multiple imputation can be employed.

r
t
o
v
n
t
r
i
m
e
h
c
c
C
S
A
o
u
s
t
a
c
a
p
s
Another g
respondents,
the last six de
overreporting
verify whethe
number of re
that should le
respondents.
nterviewing
medical expe
A third d
error for diffe
having a grea
combine their
collected on o
Collaborative
Survey Repli
Asian Americ
otherwise be
using variabl
The fourt
sampling fram
the administr
and the goal
conducts surv
agency from
population as
survey data a
F
general desig
shown in Fig
ecades in the
g. Voter valid
er the respon
asons (e.g., m
end itself to i
This is not a
respondents
enditures (the
design is whe
erent sets of c
ater number
r data but on
one of the su
e Psychiatric
cation (NCS‐
can Study (N
limited by sa
les deemed to
th design is in
me is an adm
rative databa
of conductin
veys to obtai
the national
s well as coll
and the more
Figure 1. Four GBoth No
gn is when ex
gure 1 (pane
U.S., are sub
dation was co
ndent actuall
moving, prob
imputation—
a rare paradig
s, such as imm
e Medical Ex
en data may c
concepts. Th
of responden
nly to achieve
rveys are left
Epidemiolog
‐R), the Natio
NLAAS). This
ample size. I
o have least m
n some respe
ministrative d
ase. However
ng the survey
in more accu
register. Thu
ecting variab
e accurate da
General Typesonresponse &
xternal valid
l b). For exam
bjected to soc
onducted in
y voted. Sinc
blems in matc
—multiply im
gm—several
munization r
xpenditure Pa
come from m
e utility of th
nts and great
e a greater nu
t missing. On
gy Surveys, b
onal Survey o
s project has
mputation, h
measuremen
ects the conv
database. In f
r, the admini
y is to collect
rate estimate
us, collecting
bles that help
ta can be imp
of Data StructMeasurement
dation data m
mple, the Na
cial desirabili
several elect
ce validation
ching, and lo
mputing voter
ongoing nat
records (the N
anel Survey,
multiple surve
he data collec
ter array of su
umber of inte
ne ambitious
bringing toge
of American
allowed for m
however, cou
nt error.
verse of the re
fact, sometim
istrative data
more accura
es of income,
more accura
p explain the
puted for eve
tures That Post Error Correct
may be obtain
ational Electio
ity in reports
tion years in
n is not possib
ocal laws) thi
r validation d
tional health
National Imm
MEPS).
eys, each sur
cted by each
urvey measu
erviews for a
s project to co
ether data fro
Life (NSAL)
much more i
uld also allow
ecord check d
mes the key in
a may be seen
ate data. For e
although tax
ate measures
discrepancie
eryone who w
se the Need fotion
nable, but onl
on Studies (N
s of voting be
which attem
ble for the en
is creates a m
data for the e
surveys colle
munization S
rvey offering
survey is the
ures. Some su
analyses—va
ombine data
om the Natio
), and the Na
in‐depth ana
w analysis of
design. In so
nformation is
n as flawed b
example, Sta
x data are rea
s for a sample
es between th
was not selec
or
ly for part of
NES), conduc
ehavior, resu
mpts were ma
ntire sample f
missing data p
entire pool of
ect record da
Survey, NIS)
g less measur
en increased,
urveys curren
ariables that a
across surve
onal Comorb
ational Latino
alyses that wo
the combine
me instances
s already ava
by measurem
atistics Norw
adily availab
e of the targe
he administr
cted for the s
158
f the
cted for
ulting in
ade to
for a
problem
f survey
ata after
and
rement
, by
ntly
are not
eys is the
bidity
o and
ould
ed data
s the
ailable in
ment error
ay
ble to the
et
rative and
survey.
Proceedings of the 10th Conference on Health Survey Research Methods 159
Next, we present an application of multiple imputation for nonresponse and measurement error in a
study that falls in the first general design. We use it to obtain relative magnitudes of each source of error
and to compare it to weighting.
DATA AND METHODS
The NSFG cycle 5, conducted in 1995, presents a unique opportunity to gain insight into the common
correlates of nonresponse and measurement error and to compare the magnitudes of each error. The
sampling frame for the NSFG was the 1993 NHIS respondent pool, which achieved a household respondent
response rate of 95.6%. Women and girls who were 12–44 years old by 1995 were eligible; 14,000 were
selected for NSFG, of which 13,795 were eligible sample members at the time of interviewing and 10,847
completed interviews. Among the selected respondents from the NHIS, the unweighted and weighted
response rate for NSFG were 78.6% and 78.7%, respectively (Potter et al. 1998), providing potential for
nonresponse bias. It is nonresponse to NSFG that we call unit nonresponse from here on. This methodology
creates a very rich sampling frame for the NSFG with numerous types of information on both respondents
and nonrespondents, and most notably, includes health related variables that can be particularly useful in
measuring and adjusting for nonresponse bias in NSFG.
Key to NSFG are estimates of abortion experiences. These sensitive behavior reports, however, are
subjected to measurement error when asked by interviewers. The prevalence of abortion based on survey
reports has been found to be underestimated compared to other sources (Fu et al. 1998; Jones and Forrest
1992; Smith, Adler, and Tschann 1999). The most common explanation for this underestimation is that
females who have experienced an abortion are subjected to social stigma in reporting it to an interviewer.
Indeed, removing the social interaction of the personal interview has been found to lead to higher reports of
having ever had an abortion (Lessler, Weeks, and O’Reilly 1994). Cycle 5 was the first time Audio Computer
Assisted Self Interviewing (ACASI) was used to obtain these estimates (in addition to the questions asked by
the interviewer), which method has been found to lead to higher reporting of socially undesirable behaviors
(Tourangeau and Smith 1996). We use these data to define an estimate of measurement error as any woman
who reported having had an abortion in ACASI but reported no abortions to an interviewer in the
Computer Assisted Personal Interviewing (CAPI) section.
There may be common causes of nonresponse and measurement error. For example, one may
hypothesize that an older interviewer can achieve higher response rates and less nonresponse bias because
sample members find it more difficult to refuse to her, while she may be also more likely to evoke greater
underreporting of abortion experiences if perceived as more socially undesirable compared to a younger
interviewer. Common causes, however, may not be necessarily found in the NSFG cycle 5. The relative
magnitudes of nonresponse bias and measurement error bias, nonetheless, are of great importance to the
optimization of survey design. If, for example, bias in estimates of lifetime abortion experiences is
dominated by nonresponse, and measurement error does not lead to substantively important differences,
resources should be directed to the reduction of nonresponse bias; and vice versa. To address this question,
we first need to estimate nonresponse and measurement error bias in this estimate.
Five sets of ancillary data can help inform both sources of error, presented in Figure 2: sample member
characteristics from NHIS, survey data from NHIS, paradata from NHIS, and two types of paradata from
NSFG—interviewer beliefs, experiences, and characteristics and respondent self‐reports gauging the
likelihood of measurement error.

c
s
c
r
m
m
v
p
a
m
t
e
I
T
e
i
r
s
s
m
f
m
N
n
n
m
h
n
1
s
o
s
(
I
a
t
r
In additio
cycle 5 presen
survey and p
creating a “Sw
regression mul
missing data
missing data
variables with
perturbations
also informed
missing data.
the incorpora
estimates (Ru
IVEware (Rag
Triangle Insti
entering all v
ncluded betw
To identif
regression mo
survey weigh
selection wei
missing value
first two mod
member was
NSFG intervi
For any o
nonresponse
nonresponse
The third
measurement
had an aborti
nonresponse
1. Additional
significant co
Finally, M
only from res
self reports re
The entir
(except for lo
IVEware as d
abortion were
those who rep
response pro
on to the maj
nted in Figur
paradata are s
wiss cheese”
ltiple imputat
problems wh
are imputed
h more missi
s so that imp
d by the varia
. The process
ation of the im
ubin 1978; Ru
ghunathan et
itute, 2008). F
variables used
ween intervie
fy common c
odels were e
hts. The surv
ghts and the
es in predicto
dels focused o
a nonrespon
iewer beliefs,
of these varia
and the surv
bias in unad
d and fourth m
t error, defin
ion in ACAS
and measure
lly, common
oefficients in
Model 4 is an
spondents. U
elated to mea
e set of predi
ogical restrict
described ear
e imputed fo
ported an ab
pensities, em
jor missing d
re 2, all obser
subjected to i
missing data
tion approach
here values f
d first in orde
ing data, then
puted values
able with a h
s is repeated
mputation un
ubin 1987). Th
t al. 2001). A
For each anal
d in the analy
ewer and res
correlates of n
stimated. All
ey weights th
final NHIS w
or variables w
on nonrespo
ndent on dem
, experiences
ables to be rel
vey variable.
djusted estim
models were
ned as not rep
I, also on the
ement error w
causes or cor
Model 1, 2, a
attempt to im
Underreportin
asurement er
ictors was us
ions) and no
lier, using al
or both CAPI
bortion in AC
mploying the
data patterns
rved data inc
item nonresp
a pattern. A s
h is well suite
for variables
er to inform im
n iterating th
for the first v
higher propor
multiple tim
ncertainty in
he sequentia
nalysis was c
lysis, 25 mul
ysis as main
spondent race
nonresponse
l models emp
hat were con
weights that
were multipl
nse and nonr
mographic ch
s, and charac
lated to nonr
Model 2 rela
ates by regre
e directed at m
porting an ab
e same set of
would have
rrelates of no
and 3.
mprove the m
ng was regre
rror in CAPI
sed in two w
onresponse ad
l the covaria
I and ACASI.
CASI, was rec
same variab
in NSFG
cluding
ponse,
sequential
ed for such
with least
mputation of
hrough
variable are
rtion of
mes, allowing
the survey
l regression m
conducted us
tiply‐impute
effects in the
e, Hispanic o
e, nonrespons
ployed the co
nstructed for
include adju
ly imputed a
response bia
haracteristics,
teristics.
response bias
ates the same
essing the CA
measuremen
bortion in CA
independent
a similar and
onresponse b
measuremen
essed on a lar
responses to
ays: to create
djusted weig
tes in Model
. Measureme
computed. Th
les to focus t
f
multiple imp
sing IVEwar
ed data sets w
e imputation
origin, and ag
se bias, and m
omplex samp
this analysis
ustments for n
and used acro
as. Model 1 re
, NHIS surve
s, they have t
e set of predi
API abortion
nt error. Mod
API ( 0y ) a
t variables. A
d significant
bias and meas
nt error mode
rger set of pr
o sensitive qu
e imputed da
ghts. Imputat
l 4. Missing v
ent error, def
he weighting
the comparis
Figure
putation was
re and SUDA
were created.
models, inte
ge.
measuremen
ple design va
s were the pro
nonresponse
oss the differ
egressed whe
ey responses,
to be associa
ictors to the p
reports on th
del 3 regresse
among those
A common co
coefficient in
surement err
el by using m
edictors to in
uestions.
atasets with n
tion was imp
values for hav
fined as CAP
g approach in
son to multip
2. Missing Dat
s carried out i
AAN 10 (Rese
. In addition
eractions wer
nt error, four
ariables and
oduct of the
e to NHIS. As
rent error mo
ether the sam
, NHIS parad
ted with both
potential for
hese predicto
ed the estima
who reporte
orrelate of
n Model 3 as
ror would ha
measures colle
nclude respo
no missing d
plemented us
ving ever ha
PI reports am
nvolved estim
ple imputatio
ta Structure in
160
in
earch
to
re
logistic
the
NSFG
s noted,
odels. The
mple
data, and
h
ors.
ated
ed having
in Model
ave
ected
ndent
data
sing
d an
mong
mation of
on on the
n NSFG

Proceedings of the 10th Conference on Health Survey Research Methods 161
analytic approach, rather than the variables used. In order to avoid confounding the comparison between
multiple imputation and weighting with how item nonresponse in the abortion variable is treated (i.e.,
typically ignored in weight construction and cases dropped in analysis), the weighting approach also
included adjustments for item nonresponse in CAPI and ACASI reports of abortion.
RESULTS
Among the 2,189 women who reported an abortion in ACASI, 397 (18.1% unweighted, or 18.5% when
weighted using the combined NHIS final weights and NSFG base weights) reported not having had an
abortion to the interviewer in the CAPI part of the interview. Contrary to previous findings, measurement
error was not associated with nonresponse. The selection‐weighted differences among those who reported
an abortion in ACASI in underreporting across quintiles formed by response propensities were not
significant, with 18.6%, 19.0%, 17.4%, 18.1%, and 19.3%, in the lowest through highest propensity quintile,
respectively (χ2(4) = 0.358), p = 0.986). Similarly, the mean response propensity was not different for those
who reported an abortion in ACASI compared those who did not, 0.778 and 0.780, respectively (F(1,88.9) =
0.084), p = 0.773).
A common cause or correlate of nonresponse and measurement error, a variable needs to be significant
in models 1, 2, and 3. There were no such covariates. Most parameter estimates were significant in either one
of the nonresponse or measurement error models, with age, race, and Hispanic origin being an exception,
presented in Table 1.
These findings suggest that each error source can be treated separately, to improve abortion reports in
this study design. The determination on which error source to focus can be informed by the relative
magnitude of each error—the second main research question in this study. To address it, three estimates
were compared: (1) using CAPI reports from respondents weighted only for selection probability, thus
subjected to both unit nonresponse and measurement error, (2) using CAPI reports from respondents and
imputed CAPI reports for all eligible nonrespondents, addressing unit nonresponse, and (3) using ACASI
reports from respondents and imputed ACASI values for nonrespondents, addressing both nonresponse
and measurement error.
Table 2 shows that nonresponse accounted for only 1.41 percentage point bias in the abortion estimate
(16.09% vs. 17.50%). However, measurement error accounted for an additional 3.84% bias, with an estimate
of 21.34% based on the full sample ACASI imputed data. The pattern was the same for the estimates using
weighting.
The third research objective is to empirically evaluate whether the multiple imputation approach could
yield efficiency gains over propensity score weighting. Despite the use of multiple imputation that accounts
for the uncertainty in imputed values, imputation led to estimates with smaller standard errors than the
complete case analysis, shown in the first three data rows in Table 2. Weighting, however, led to a loss in
efficiency due to weight variation. While imputation led to a substantial decrease in the standard error of the
CAPI estimate by almost 50% (from 0.83% to 0.43%), weighting led to an increase of more than 50% (to
1.29%). This is consistent with the theoretical justification (e.g., Little & Vartivarian, 2005) and is the first
empirical demonstration in a national household survey to show such results.

162
Table 1. Logistic Regression Models Predicting Nonresponse, Potential for Nonresponse Bias, & Measurement Error Propensity NONRESPONSE ERROR MEASUREMENT ERROR Model 1:
Nonrespondent in NSFG
Model 2:Reported Abortion
in CAPI
Model 3: Underreported in
CAPI
Model 4:Underreported
(Expanded Model)VARIABLE CATEGORY/UNIT Beta (S.E.) Beta (S.E.) Beta (S.E.) Beta (S.E.)Demographic Characteristics (NHIS)
Any unrelated individual in household
Yes 0.142 (0.087) –0.106 (0.135) –0.153 (0.240) –0.207 (0.247)
Birth region
Midwest –0.473*** (0.115) –0.069 (0.106) 0.128 (0.235) 0.165 (0.245)Northeast –0.363*** (0.096) –0.063 (0.106) 0.290 (0.242) 0.185 (0.262)South –0.341** (0.117) –0.198 (0.106) 0.216 (0.258) 0.231 (0.257)West –0.652*** (0.114) –0.040 (0.105) 0.114 (0.404) 0.156 (0.432)Mexico –0.227 (0.241) –0.069 (0.219) 0.475 (0.713) 0.559 (0.723)
Geographic location
1,000,000 or more 0.370** (0.120) –0.026 (0.099) 0.059 (0.263) 0.054 (0.266)250,000–999,999 0.210 (0.120) –0.036 (0.102) 0.170 (0.252) 0.200 (0.267)100,000–249,999 –0.003 (0.144) 0.079 (0.162) 0.179 (0.272) 0.200 (0.303)Under 100,000 –0.078 (0.191) –0.042 (0.229) 0.937** (0.317) 0.681 (0.364)Non‐MSA‐Other Urban Areas
–0.221* (0.102) –0.043 (0.128) –0.186 (0.344) –0.027 (0.354)
Hispanic origin Yes –0.363* (0.156) –0.022 (0.117) –0.106 (0.267) –0.155 (0.255)
Race White –0.274** (0.089) 0.027 (0.125) –0.179 (0.235) –0.308 (0.211)Black –0.311*** (0.094) ‐0.019 (0.184) –0.281 (0.211) –0.465* (0.234)
Marital status Married –0.008 (0.080) –0.180* (0.091) –0.088 (0.232) –0.096 (0.219)Separated, divorced, or widowed
0.011 (0.092) 0.041 (0.116) 0.092 (0.235) 0.163 (0.237)
More than high school Yes –0.221*** (0.051) –0.063 (0.067) 0.024 (0.140) 0.086 (0.141)
Family income
Under $10,000 0.048 (0.117) –0.196 (0.137) 0.307 (0.249) 0.337 (0.268)10,000–19,999 0.184 (0.098) –0.070 (0.099) 0.290 (0.239) 0.370 (0.261)20,000–34,999 0.013 (0.074) –0.075 (0.105) 0.275 (0.185) 0.277 (0.203)35,000–49,999 –0.094 (0.091) 0.088 (0.089) 0.037 (0.233) 0.063 (0.251)
Age Years 0.017*** (0.004) 0.005 (0.005) –0.001 (0.009) –0.006 (0.010)Health‐Related Variables (NHIS)
Height Inches 0.002 (0.009) –0.019 (0.012) 0.006 (0.028) 0.008 (0.027)
Weight Pounds –0.004*** (0.001) 0.000 (0.001) 0.000 (0.002) 0.001 (0.002)
Family size People –0.049** (0.019) –0.007 (0.020) –0.014 (0.037) –0.037 (0.043)
Health status Excellent –0.139 (0.084) 0.189 (0.142) –0.521* (0.225) ‐0.437 (0.267)Very good –0.118 (0.090) 0.192 (0.148) –0.508* (0.200) –0.455* (0.221)Good –0.163 (0.098) 0.216 (0.132) –0.526** (0.193) –0.593** (0.211)
Activity limitation status
Unable to perform major activity
0.200 (0.158) 0.282 (0.235) –0.987* (0.463) –1.078* (0.482)
Limited kind/amount major activity
0.184 (0.125) 0.311* (0.152) –0.075 (0.262) –0.009 (0.276)
Limited in other activities
–0.035 (0.143) –0.078 (0.169) 0.286 (0.363) 0.304 (0.375)
Restricted activity days in past 2 years
Days 0.004 (0.009) 0.011 (0.016) –0.016 (0.024) –0.024 (0.030)
# doctor’s visits in past 12 months
Visits –0.009 (0.005) –0.004 (0.003) 0.008 (0.009) 0.011 (0.009)
# bed days in past 12 months
Days 0.001 (0.002) –0.002 (0.001) –0.001 (0.004) 0.000 (0.004)

Proceedings of the 10th Conference on Health Survey Research Methods 163
Table 1, cont’d. NONRESPONSE ERROR MEASUREMENT ERROR Model 1:
Nonrespondent in NSFG
Model 2:Reported Abortion in
CAPI
Model 3: Underreported in
CAPI
Model 4:Underreported
(Expanded Model)VARIABLE CATEGORY/UNIT Beta (S.E.) Beta (S.E.) Beta (S.E.) Beta (S.E.)
Paradata (NHIS)
Telephone Yes, given –0.372** (0.118) –0.194 (0.110) 0.366 (0.267) 0.397 (0.272)Yes, not given 0.565*** (0.165) –0.269 (0.180) 0.218 (0.415) 0.435 (0.511)
Respondent type Self‐entirely –0.270*** (0.061) 0.101 (0.068) –0.237 (0.151) –0.270 (0.167)Self‐partly –0.077 (0.100) 0.026 (0.105) 0.024 (0.324) 0.048 (0.331)
Paradata—Interviewer Beliefs, Experiences, & Characteristics (NSFG)
First time interviewer Yes –0.025 (0.118) 0.022 (0.155) 0.129 (0.226) 0.065 (0.242)
Interviewer with more than high school
Yes –0.358** (0.126) 0.051 (0.083) 0.078 (0.182) 0.112 (0.190)
Interviewer of Spanish/ Hispanic descent
Yes –0.080 (0.173) –0.049 (0.127) –0.304 (0.286) –0.368 (0.286)
Interviewer race White 0.053 (0.262) 0.101 (0.203) –0.094 (0.408) –0.149 (0.446)Black –0.022 (0.261) 0.177 (0.199) –0.108 (0.417) –0.159 (0.462)
Interviewer marital status
Married 0.194 (0.179) 0.121 (0.201) 0.412 (0.283) 0.452 (0.299)Separated, divorced, widowed 0.009 (0.199) 0.100 (0.176) 0.589 (0.311) 0.709* (0.333)
Interviewer ever pregnant
Yes –0.065 (0.173) –0.058 (0.175) –0.458 (0.307) –0.447 (0.312)
Interviewer importance of religion in life
Very important –0.401*** (0.120) 0.039 (0.103) –0.006 (0.205) 0.004 (0.213)Somewhat important –0.474*** (0.113) 0.048 (0.091) –0.057 (0.219) 0.015 (0.232)
Interviewer age Years –0.005 (0.005) 0.000 (0.003) –0.007 (0.006) –0.009 (0.007)Paradata—Measurement Error Related to Self‐Reports (NSFG)
People give more honest answer to…
The interviewer 0.334 (0.293)Audio self‐administration 0.060 (0.175)
Difficulty in using the keyboard
Very easy –1.376 (27.129)Easy –1.264 (27.109)Difficult –0.775 (27.112)
How did you conduct the self‐administered questions?
Read & listened 0.153 (0.123)Turned screen off & listened 0.076 (0.388)
Most comfortable answering abortion & # of sexual partners questions
With interviewer –0.266 (0.320)
With headphones 1.042*** (0.180)
How likely to give different answers to other questions if self‐administered
Very likely 1.541*** (0.205)
Somewhat likely 0.973*** (0.214)
Not very likely 0.695** (0.217)
Intercept 0.725 (0.749) –0.493 (0.890) –1.381 (2.038) –1.481 (27.311)‐2 Log Likelihood (df) 52573034 (33.6) 36766023 (31.4) 7750905 (30.3) 6958223 (29.2) Max‐rescaled R‐square 0.086 0.073 0.074 0.219 n 13,795 10,664 2,189 2,189 *p < .05, **p < .01, ***p < .001. NOTE: Missing data in the predictors were imputed. All models use the same 25 multiple imputations. Reference categories: birth region—other country; geographic location—non‐MSA‐rural areas; race—other; marital status—never married; family income—$50,000 or more; health status—fair or poor; activity limitation status—not limited (includes unknowns); telephone—no; respondent type—proxy; interviewer race—other; interviewer marital status—never married; interviewer importance of religion in life—not important; people give more honest answer—does not matter; difficulty using the keyboard—very difficult; how did you conduct the self‐administered questions—read screen and turned tape off; most comfortable answering abortion and number of sexual partners questions—did not matter; how likely to give different answers to other questions if self‐administered—not at all likely.
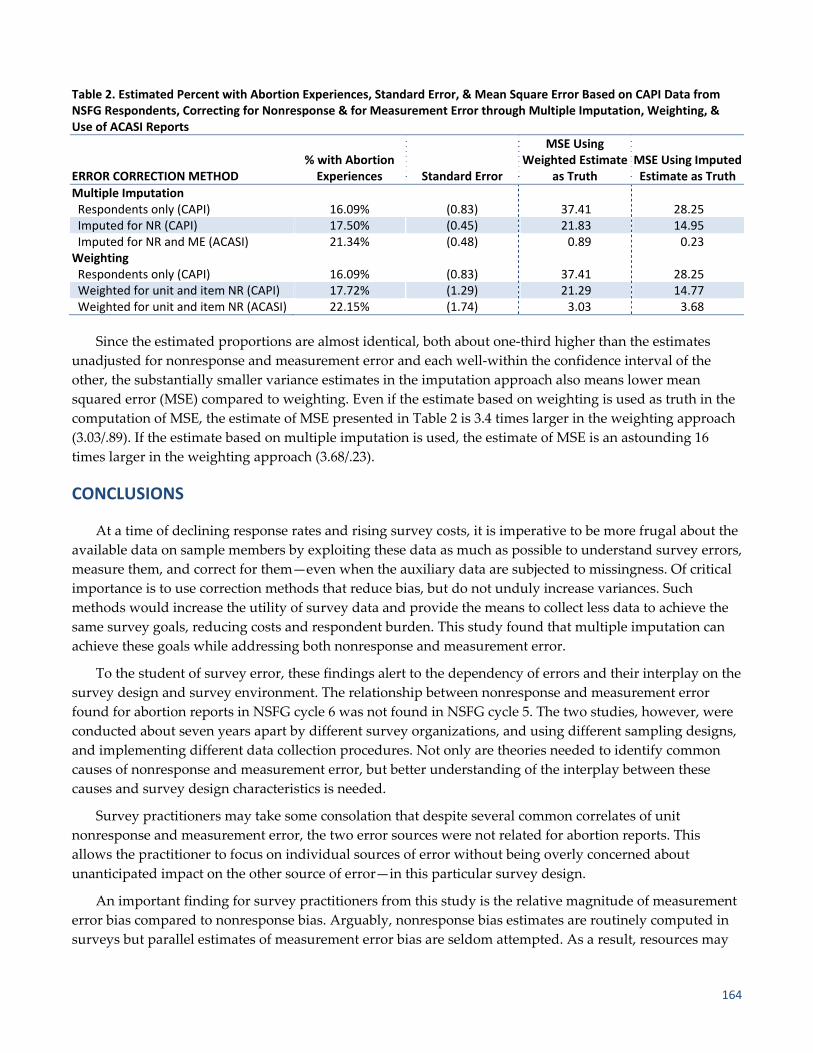
164
Table 2. Estimated Percent with Abortion Experiences, Standard Error, & Mean Square Error Based on CAPI Data from NSFG Respondents, Correcting for Nonresponse & for Measurement Error through Multiple Imputation, Weighting, & Use of ACASI Reports
ERROR CORRECTION METHOD % with Abortion Experiences Standard Error
MSE Using Weighted Estimate
as Truth MSE Using Imputed Estimate as Truth
Multiple Imputation Respondents only (CAPI) 16.09% (0.83) 37.41 28.25Imputed for NR (CAPI) 17.50% (0.45) 21.83 14.95Imputed for NR and ME (ACASI) 21.34% (0.48) 0.89 0.23Weighting Respondents only (CAPI) 16.09% (0.83) 37.41 28.25Weighted for unit and item NR (CAPI) 17.72% (1.29) 21.29 14.77Weighted for unit and item NR (ACASI) 22.15% (1.74) 3.03 3.68
Since the estimated proportions are almost identical, both about one‐third higher than the estimates
unadjusted for nonresponse and measurement error and each well‐within the confidence interval of the
other, the substantially smaller variance estimates in the imputation approach also means lower mean
squared error (MSE) compared to weighting. Even if the estimate based on weighting is used as truth in the
computation of MSE, the estimate of MSE presented in Table 2 is 3.4 times larger in the weighting approach
(3.03/.89). If the estimate based on multiple imputation is used, the estimate of MSE is an astounding 16
times larger in the weighting approach (3.68/.23).
CONCLUSIONS
At a time of declining response rates and rising survey costs, it is imperative to be more frugal about the
available data on sample members by exploiting these data as much as possible to understand survey errors,
measure them, and correct for them—even when the auxiliary data are subjected to missingness. Of critical
importance is to use correction methods that reduce bias, but do not unduly increase variances. Such
methods would increase the utility of survey data and provide the means to collect less data to achieve the
same survey goals, reducing costs and respondent burden. This study found that multiple imputation can
achieve these goals while addressing both nonresponse and measurement error.
To the student of survey error, these findings alert to the dependency of errors and their interplay on the
survey design and survey environment. The relationship between nonresponse and measurement error
found for abortion reports in NSFG cycle 6 was not found in NSFG cycle 5. The two studies, however, were
conducted about seven years apart by different survey organizations, and using different sampling designs,
and implementing different data collection procedures. Not only are theories needed to identify common
causes of nonresponse and measurement error, but better understanding of the interplay between these
causes and survey design characteristics is needed.
Survey practitioners may take some consolation that despite several common correlates of unit
nonresponse and measurement error, the two error sources were not related for abortion reports. This
allows the practitioner to focus on individual sources of error without being overly concerned about
unanticipated impact on the other source of error—in this particular survey design.
An important finding for survey practitioners from this study is the relative magnitude of measurement
error bias compared to nonresponse bias. Arguably, nonresponse bias estimates are routinely computed in
surveys but parallel estimates of measurement error bias are seldom attempted. As a result, resources may

Proceedings of the 10th Conference on Health Survey Research Methods 165
be disproportionately allocated towards the reduction of nonresponse bias although the dominant source of
error for a particular estimate or set of estimates may be measurement error. The sensitive nature of abortion
experiences suggests that this may be one such example. Indeed, the computed bias due to nonresponse was
a tenth of a percentage point, yet the bias from measurement error was over three percentage points.
Designs in anticipation of multiple sources of error can lend themselves to more effective postsurvey
adjustments. A key goal in this study was to demonstrate the ability to use multiple imputation to address
unit nonresponse, item nonresponse, and measurement error. Apart from being able to deal with all three of
these sources of error simultaneously, multiple imputation can achieve lower variance estimates than the
commonly used single weight adjustment that focuses on the interview outcome. In fact, in this study,
multiple imputation not only yielded lower variance estimates compared to those under weighting, but also
lower variance estimates compared to complete case analysis—not a loss, but a gain in efficiency or a design
effect of less than one.
REFERENCES
Aldworth, J., Colpe, L. J., Gfroerer, J. C., Novak, S. P., Chromy, J. R., Barker, P. R., et al. (2010). The National
Survey on Drug Use and Health Mental Health Surveillance Study: Calibration analysis. International Journal
of Methods in Psychiatric Research, 19, 61–87.
Biemer, P. P. (2001). Nonresponse bias and measurement bias in a comparison of face to face and telephone
interviewing. Journal of Official Statistics, 17, 295–320.
Brownstone, D., & Valletta, R. G. (1996). Modeling earnings measurement error: A multiple imputation approach.
The Review of Economics and Statistics, 78, 705–717.
Chromy, J. R., Eyerman, J., Odom, D., McNeeley, M. E., & Hughes, A. (2005). Association between interviewer
experience and substance use prevalence rates in NSDUH. In Evaluating and Improving Methods Used in the
National Survey on Drug Use and Health, edited by J. Kennet and J. Gfroerer. Washington, DC: Substance Abuse
and Mental Health Services Administration.
Cole, S. R., Chu, H., & Greenland, S. (2006). Multiple‐imputation for measurement‐error correction. International
Journal of Epidemilogy, 35, 1074–1081.
Fu, H., Darroch, J. E., Henshaw, S. K., & Kolb, E. (1998). Measuring the extent of abortion underreporting in the
1995 National Survey of Family Growth. Family Planning Perspectives, 30, 128–138.
Ghosh‐Dastidar, B., & Schafer, J. L. (2003). Multiple edit/multiple imputation for multivariate continuous data.
Journal of the American Statistical Association 98, 807–817.
Groves, R. M., & Magilavy, L. (1984). An experimental measurement of Total Survey Error. Proceedings of
American Statistical Association.
Jackman, S. (1999). Correcting surveys for non‐response and measurement error using auxiliary information.
Electoral Studies, 18, 7–27.
Jones, E. F., & Forrest, J. D. (1992). Underreporting of abortion in surveys of U.S. women: 1976 to 1988.
Demography 29 (1):113‐126.
Lessler, J. T., Weeks, M. F., & O’Reilly, J. M. (1994). Results of the National Survey of Family Growth Cycle V
Pretest. Proceedings of American Statistical Association, Section on Survey Research Methods.
Little, R. J., & Vartivarian, S. (2005). Does weighting for nonresponse increase the variance of survey means?
Survey Methodology, 31, 161–168.
Olson, K. (2006). Survey participation, nonresponse bias, measurement error bias, and total bias. Public Opinion
Quarterly, 70, 737–758.
Peytchev, A., Peytcheva, E., & Groves, R. M. (2010). Measurement error, unit nonresponse, and self‐reports of
abortion experiences. Public Opinion Quarterly, 74, 319–327.

166
Potter, F. J., Iannacchione, V. G., Mosher, W. D., Mason, R. E., & Kavee, J. D. (1998). Sample design, sampling
weights, imputation, and variance estimation in the 1995 National Survey of Family Growth. In Vital Health
Statistics. Hyattsville, Maryland: National Center for Health Statistics.
Raghunathan, T. E. (2006). Combining information from multiple surveys for assessing health disparities.
Allgemeines Statist. Archiv. 90:515‐26.
Raghunathan, T. E., Lepkowski, J. M., Van Hoewyk, J., & Solenberger, P. (2001). A Multivariate Technique for
Multiply Imputing Missing Values Using a Sequence of Regression Models. Survey Methodology 27:85‐95.
SUDAAN (Release 10.0). Research Triangle Institute, Research Triangle Park, NC.
Rubin, D. B. (1978). Multiple imputations in sample surveys‐‐A phenomenological Baysian approach to
nonresponse. Proceedings of the Survey Research Methods Section, American Statistical Association.
Rubin, D. B. (1987). Multiple imputation for nonresponse in surveys. New York: Wiley.
Smith, L. B., Adler, N. E., & Tschann, J. M. (1999). Underreporting sensitive behaviors: The case of young
womenʹs willingness to report abortion. Health Psychology, 18, 37–43.
Tourangeau, R., & Smith. T. W. (1996). Asking sensitive questions—The impact of data collection mode, question
format, and question context. Public Opinion Quarterly, 60, 275–304.
Voogt, R. J. J. (2005). An alternative approach to correcting response and nonresponse bias in election research.
Acta Politica, 40, 94–116.
Yucel, R. M., & Zaslavsky, A. M. (2005). Imputation of binary treatment variables with measurement error in
administrative data. Journal of the American Statistical Association, 100, 1123–1132.

Proceedings of the 10th Conference on Health Survey Research Methods 167
SESSION 3 DISCUSSION Charles DiSogra (Knowledge Networks)
What do we mean by “optimization”? It is fairly obvious that we want to make the most with what we
have, squeezing more out of the methods and data at hand, and more to the point, economizing our health
survey efforts. We have five papers on this theme, but before I raise some discussion points, I have a second
task to accomplish today.
WEB PANELS
The session’s organizers asked me to raise another related issue. The many papers submitted on
optimizing health surveys covered a number of survey modes, but it was most disappointing that there
were so few papers, in this age of the Internet, using Web‐based data collection. So, to borrow from an old
marketing slogan, “Where’s the beef?” we ask, where’s the Web?
Although one paper in this session is grounded in Web‐based data collection, certainly there is much
more health‐related research out there using Web‐based panels for the sample and Web as the collection
mode. I think sessions such as today’s need to see and discuss the types of Web‐based studies and methods
currently being used. We need an updated dialog about Web surveys and especially Web panels as to what
viable role they can play in health survey methods today and into the near future.
All survey methods have their limitations as well as their advantages; this is also true when it comes to
Web panels and their accuracy (Yeager et al., 2009). In the spirit of full disclosure, my current employment
with Knowledge Networks does bias me in my opinions about aspects of the large volunteer opt‐in panels.
But, as a methodologist, I want to review some opportunities that may exist in using these volunteer opt‐in
panels and, of course, in using probability‐based panels such as Knowledge Networks’ KnowledgePanel®.
These opt‐in panels are large online volunteer panels with membership sizes in the millions. Anyone on
the Web can join them by responding to recruitment advertisements or pop‐up invitations or by going to
recruitment Web sites that aggregate multiple panels, giving you a chance to join as many as you like (based
on topic interest and usually opportunity to earn cash incentives). There is also blanket e‐mail marketing to
recruit panel members. Not all opt‐in panels are equal; some work harder at achieving recommended
industry standards for tenure, eliminating “professional respondents,” controlling for member overlap
among panels, and general panel management. Industry organizations, such as the Advertising Research
Foundation, work to set voluntary standards for online panels. These panels are used extensively by market
researchers with the advantages of being low cost, having a rapid data turnaround, delivering large sample
sizes, and locating target audiences using profile data already collected on panel members. They can pull
quick quota‐like or purposive samples using a variety of proprietary techniques and can even weight
samples, again using proprietary methods. But, if you just want the raw data, that’s good, too.
In 2009, the market research industry spent about $2 billion on online research. According to Inside
Research (2009) and quoted in the AAPOR Report on Online Panels (Opt‐In Online Panel Task Force, 2010),
“about 85% of that research replaces research that previously would have been done with traditional
methods, principally by telephone or face‐to‐face.” So, what are some of the methodological limitations?
Basically, these opt‐in Web panels are convenience samples. They are not probability‐based samples drawn
from any definable frame. If anything, members come from among people on the Web and obviously with
Web access. Their findings are not generalizable for prevalence estimates, even though some researchers do

168
it anyway. The methods used by these opt‐in panel firms are not always transparent. Generally, their survey
completion rates are quite low, and because they are not probability samples from a known frame, true
response rates cannot be calculated (Callegaro & DiSogra, 2008).
On the plus side, these opt‐in panels do have some state‐of‐the‐art Web‐based programmed
questionnaire administration that can display video, motion graphics, and other animation and play sound.
They also will deliver a clean data file and do all this relatively quickly and at a low cost. These can be very
attractive features for the right purpose. But can they be used for health research? Yes, but only with great
caution and probably only for some kinds of research. Some examples might be for concept testing,
examining relationships between variables, methods testing for Web survey development, missingness
studies, reaching a fairly good sample size of some rare groups or persons with rare health conditions (who
are on the Web), doing exploratory surveys, and probably other types of studies you can imagine.
However, if you need a representative sample with generalizable results or prevalence estimates in the
U.S. population with valid confidence intervals on those estimates, then you want a probability‐based panel
like KnowledgePanel. This panel’s members are recruited from national samples drawn from the U.S. Postal
Service’s computerized delivery sequence file. This is an address‐based frame inclusive of some 97% of the
physical addresses in the entire U.S. In this way, every sample unit has a known probability of selection and
thus the descriptor of being a probability‐based sample. Address‐based sampling, or ABS, means that
telephone status becomes irrelevant since participants are recruited based on mailing address using printed
materials. Cell phone, cell mostly, landline, and no phone all are included. Since people are being recruited
to join an online Web panel, households without Internet access are provided with a laptop computer and
free monthly ISP service as long as they remain on the panel. This is the unique Knowledge Networks
solution in addition to offering this panel membership and survey participation in Spanish as well as
English. (Note that the Hispanic members of KnowledgePanel are called KnowledgePanel LatinoSM, as they
are also a representative panel for U.S. Latinos.)
One point I want to make here is that you can report true response rates for studies done with a
probability‐based sample. However, you need to appreciate a new paradigm for panel response rates. These
rates are a multiplicative function consisting of a recruitment rate, a profile rate (i.e., providing the essential
background information to obtain panel membership), and the survey sample’s completion rate (see
Callegaro & DiSogra, 2008). So don’t be surprised when this math produces a low double‐digit or even
single‐digit response rate. This is actually a perfect example of having a high‐quality survey with an
apparent low response rate, but such low‐number response rates need to be recognized as the normal
domain of what are, in fact, high‐quality probability‐based panel studies.
An alternative to KnowledgePanel is to build one’s own probability‐based panel. What should be better
known is that Knowledge Networks uses its experience, staff skills, and engineering infrastructure to help
universities and other groups build custom Web panels for their research use and purposes.
Finally, a hybrid method that been used successfully with a number of health and other studies
calibrates an opt‐in panel sample with a probability‐based sample. This approach uses paradata to minimize
any bias introduced from the opt‐in cases in a final weighted sample blended from these two sources. You
would do this when the finite size of the probability‐based panel is unable to deliver the desired sample
sizes for a given study. Although many health‐related studies using calibrated samples have been done at
Knowledge Networks, where are they at this conference? This is certainly a viable optimization method that
needs more exposure and discussion.

Proceedings of the 10th Conference on Health Survey Research Methods 169
THIS SESSION’S PAPERS
Five studies were presented, each optimizing some element of five different survey types. One
employed a mega opt‐in Web panel to locate patients with a rare disease. This is what I call thinking out of
the box, since a true prevalence study using a probability‐based sample approach would be cost‐prohibitive
for this team. In an effort to locate and interview at least 120 cases, this was a most practical idea. A second
paper looked hard at whether or not a short time period, rapidly fielded telephone survey can out of
necessity produce “good enough” information for urgent monitoring purposes. The third paper explored
whether or not telephone follow‐up calls, when you can reach people by telephone, biases findings from a
mail survey. Although proper weighting should effectively mitigate this type of bias. At least, I believe,
that’s the point of doing weighting. Our fourth paper used paper and pencil questionnaires in a classroom
setting, but employed planned missingness to reduce respondent burden and at the same time
demonstrating an intriguing Hawthorne effect‐like phenomenon in its control group (Gillespie, 1991). And
finally, our fifth paper tackled the issue of nonresponse and measurement error using multiple imputation
techniques applied to traditional in‐person data collection. With a wide array of variables from two large
surveys of which one is a subset of another plus paradata from interviewers about themselves and the
interview experience, this study is what you might call a “variable perfect storm” all coming together!
As survey scientists, when we look at the optimization efforts in these papers, the errors of our ways
become more transparent. And, not all errors are necessarily bad. When John Boyle sees opportunity in
nonprobability Web panels, knowing they are not a representative sample, that’s both bold and resourceful.
Jim Singleton takes a step back and sees the pragmatic opportunity to use early responders as a bellwether,
knowing that a likely bias could be tolerated in his application. Jeanette Ziegenfuss re‐examines the use of
telephone follow‐up efforts in a mail survey as a potential mixed mode problem that researchers may be
ignoring. Ofer Harel takes up the challenge of incorporating planned missingness in a survey questionnaire
design and absorbs the higher analyst burden to do so. And finally, Andy Peytchev immerses his work in
the disentanglement of measurement and nonresponse errors using elaborate multiple imputation models, a
kind of multiple imputation gone wild, so to speak. All of this done in pursuit of minimizing bias measured
with mean square error. I kind of think of this minimalization endeavor as “taming of the skew,” if you will
excuse this pun.
WEB PANELS AND RARE DISEASES
One thing to pay attention to when working with a large opt‐in Web panel is the usually low completion
rates associated with their invitations to get panel members to take a survey. This is just the invitation, not
the survey itself. As reported in this first paper, only 13% accepted the invitation to take the survey.
Although there were almost 900,000 persons on this panel that was attempting to identify patients with a
rare immune deficiency disease, effectively the researches had the attention of “only” about 115,000 of them.
Still, this is a lot of people. But nonresponse is not ignorable. Unsurprisingly, only 3% of these reported a
qualifying “rare” immune problem, but less than half of these 3,486 “found” cases completed the eligibility
screener resulting in the identification of just 144 eligible cases. That’s some significant nonresponse along
the way. However, what this study did exceptionally well was to have a very tight and exhaustive set of
screener questions to maximize assurance of eligibility. I think this is essential when working with opt‐in
Web panels since we can’t ignore the fact that some panel members may not be totally truthful or attentive.
Of those who advanced to take the screener, only 43% were identified as potentially eligible with a desired
immune disease diagnosis. Note that 10% did not give any answers to the screener for unknown reasons.

170
Upon completing the screener, two out of three were eliminated with a bad or erroneous diagnosis, and
another 14% could not or did not give a diagnosis (who were they?). Only one out of five gave a good
diagnosis making them eligible for the study.
From a what‐I‐like‐to‐see perspective when reporting results from Web surveys, it is important to
address quality‐control procedures such as how questionnaire “speedsters” were identified and handled or
how straight‐lining and other evidence of inattentive response patterns were dealt with. The study’s finding
that certainly appears intuitively credible is that the type of treatment patients receive is associated with the
setting in which their immunologist practices. If anything, this illustrates that an opt‐in Web panel source
can reveal notable associations of value to this type of research. One caution I have for the authors is to not
conclude that their findings “confirm” but instead say they “suggest” that nonmedical center patients are
being undertreated. Given the high level of nonresponse and the source of their data, I think this is a more
appropriate wording.
MONITORING H1N1 FLU IMMUNIZATION
This CDC survey work is a dual‐frame landline RDD and cell phone sample. When doing these kinds of
surveys, it is important to describe how the field administration was handled in the cell phone component.
Were all cell‐phone persons interviewed or just those who reported living in cell‐only households? How
was this handled in the weighting of the two combined samples? These are important methodological
elements to be made transparent given the rapidly growing proportions of cell‐only/mostly households and
the resultant impact on telephone surveys. The paper did not address these issues.
It was no surprise that the early responder landlines were more likely White, older, and retired, while
early responder cell phones tended to be younger, Hispanic, and employed. This encapsulates the
descriptive picture of each of these communication device populations based on what we know from the
National Health Interview Survey (NHIS) data on wireless and landline populations (Blumberg & Luke,
2010). Another methodological weakness and likely a confounder in obtaining an accurate prevalence
estimate is respondent recall, especially among late responders. Survey participants are asked to report on
their vaccination status for the week the survey is fielded. Some three to five weeks after the week of
interest, there has to be some recall issues clouding the information provided by late responders.
Figure 1. This figure shows that of the 43% who gave a positive answer to the screen, only one out of five gave a good diagnosis making them eligible for the study.
No answerto screen
10%
No PID in HH/Family47%
Good PIDDiagnosis
20%
Bad PID diagnosis given66%
No Diagnosisgiven14%
Positive answer to screen43%
One out of five gave a good diagnosis

Proceedings of the 10th Conference on Health Survey Research Methods 171
While the authors conclude that a two‐week rapid survey may be sufficient for urgent monitoring
purposes, data collected from an additional three weeks of “late responder” effort tend to correct the early
estimate downward by about two percentage points. If the bulk of resources goes into a rapid two‐week
survey, some resources might be set aside for a parallel five‐week phone survey so a correction factor can be
obtained and applied to the weekly prevalence picture retroactively. Thus, the use of such backward
adjustments will provide some historical accuracy to the immunization campaign.
Also, the graphing of weekly immunization prevalence, attitude, or intent information based on survey
data might use some kind of curve‐smoothing technique. In some instances (e.g., when measuring public
attitudes over time about intent to be vaccinated), a simple linear trend line can be fitted to the data,
avoiding a “rollercoaster” picture difficult to visually read and interpret. As far as tracking immunization
prevalence, a cumulative picture logically should increase from week to week. For demonstration purposes,
I took the CDC prevalence data reported in this paper and fitted a polynomial curve to them, including the
confidence interval values, and plotted this over the more choppy survey estimates. As shown in Figure 2
(next page), this gives a more generalized progressive view of immunization prevalence increase over time.
MULTIPLE MODES & SAMPLE REPRESENTATIVENESS
The Ziegenfuss and Beebe paper presents an interesting dilemma: The earlier mail respondent sample
looked “better” before telephone (different mode) follow‐up efforts reached out to bring in nonresponders.
After achieving a higher response rate in the end, the final sample composition demonstrated more bias.
Bias was assessed by linking 97% of the sample to extensive health records information available from the
Rochester Epidemiology Project (REP). The uniqueness of this Olmstead County study population is that
they have excellent coverage among health care providers to participate in the REP. As a result, the REP
covers a good portion of the county population. With such a rich database, the authors admit this may be a
Figure 2. This figure, using the same graphic used in the presentation, shows how a smooth curve fitted over more erratic weekly survey estimates makes the progressive immunization prevalence picture easier to read.
y = 0.0004x4 ‐ 0.0278x3 + 0.5458x2 ‐ 2.0314x + 2.448R² = 0.9818
0
5
10
15
20
25
30
35
40
45
50
H1N1 Vaccination Coverage
Rate (%)
H1N1 Vaccination Coverage Rate for Total PopulationOct Week 1 ‐ Apr Week 2, NHFS
Weekly Estimate Upper CI
Weekly Estimate
Weekly Estimate Lower CI
Poly. (Weekly Estimate Upper CI)
Poly. (Weekly Estimate)
Poly. (Weekly Estimate Lower CI)

172
heavily surveyed population. Also, the demographic profile of this population is unique in that it is 90%
White and less than 3% Hispanic, and the Mayo Clinic and the Olmstead Medical Center are prestigious
institutions with wide name and reputation recognition in this county. All of this makes these survey results
difficult to generalize outside of this county.
From a methodological perspective, I was surprised that the sample was not restricted to one person per
household. This leads to some loss of unit (patient) independence and makes the study subject to within‐
household cluster effects; it also may confound response if two‐patient households are more likely to have
both patients respond.
The authors didn’t indicate if the materials used in the mailing were message and design tested with
different age focus groups or similar qualitative assessment. Did the decisions about print messages and
design presentation appeal more to the population that turned out to be overrepresented? I call this a
“materiogenic” response effect, where the responders are more likely to be those to whom the materials
appeal to and, conversely, the nonresponders are more likely those to whom the materials are just not
talking. Might this have shaped the mail response? This can extend to the caller ID that shows up for
telephone calls and even the messages left on answering machines, if messages are left. Also, it is not clear
whether cell phones were called or even if they knew they had cell phones. If the follow‐up was restricted to
landline phones, then a different set of nonresponders would be obtained from this limited set of
households, and more bias would be expected to result.
Finally, it wasn’t clear if proxy respondents were allowed. This would certainly permit more of the
sickest/most disabled patients to be included by both mail and telephone. I think proxy interviews need to
be a carefully designed part of a patient population survey; otherwise, we end up with a healthier sample as
this study suggested, with some identified health conditions.
The classic design of mail, reminder postcard, mail follow‐up, and where possible, telephone follow‐up,
as in the Total Design Method (Dillman, 1978) style, is here to stay with us for a while, and it is expected that
responders at each stage will likely be different, especially if there is a mode change. However, standard
poststratification weighting remains the usual solution when the weighting dimensions are carefully
identified for the study sample.
DESIGN MISSINGNESS IN EVALUATION RESEARCH
The theoretical basis for using multiple imputation to address item nonresponse has been known of over
two decades (Rubin, 1987). Designing missingness into a survey questionnaire strategy to reduce
respondent burden is a clever, proactive statement of faith that results will be meaningful for generalizing
from the entire sample. In this piece of evaluation research by Harel et al., we see this application in play.
The imputation model covariates are sparse, but this is the choice of the researchers who presumably know
the study population and the relevant variables in the sample necessary for imputation modeling. At first I
noticed “lunch” as a covariate and assumed there was more here than the presentation of this paper
explained (it turned out to be eligibility for participation in the free school lunch program).
While I want to believe that multiple imputation has a valid place in this type of evaluation research, I
found the changes in some of the study outcomes after imputation unsettling. The evaluation was
measuring the impact of a suicide prevention/education program for teenagers. The multiple imputation
data produced a different outcome on four questions. Granted, given the number of questions asked, some
will change by chance alone; however, one question (Q12F), to which I would think an educator would pay

Proceedings of the 10th Conference on Health Survey Research Methods 173
attention, changed in an undesirable direction. If a teen was told by another teen they were contemplating
suicide, would the now‐informed teen tell a parent or other adult? The nonimputed data indicates they’d be
more likely to do so. With the imputed data, the intervention program had no effect on improving this
attitude. That may be due to the fact that the program was truly ineffective on this lesson, or was the
imputed data masking the finding? I want to believe the former, but the data set, including the imputed
data that produced this finding, still leaves me with some doubt. Which do we believe and on what basis?
I want to address the control group as a baseline against which these changes are being compared. The
authors acknowledge they observed “improvement” in the CES‐D measures in the control group even
though there was no intended educational intervention. They explain a test effect or an assessment
reactivity taking place. That is, the process of taking the baseline questionnaire constitutes an “intervention
lite” for the control group. This makes it more difficult to assess change in the intervention groups since the
control group is changing in the direction that the program would like to produce. I would recommend that
the authors on their next design foray consider a quasi‐experimental design that eliminates the baseline
questionnaire from the control group. As antithetical as that may sound for an experimental design, those
familiar with an older text (Cook & Campbell, 1979) will remember such a design to address this very
problem. Think of it as an “intervention zero” approach for the control group. Figure 3 illustrates this using
a simulation of the data graphic presented in this paper.
CORRECTING SURVEY NONRESPONSE AND MEASUREMENT ERROR
This last paper by Andy Peytchev is an excellent example of what can be done with access to a wealth of
survey variables, especially on nonresponders, to
explore both nonresponse and measurement error.
Using survey data from the National Survey of
Family Growth (NSFG), a subsample of the larger
NHIS with a broad array of interviewer paradata
available, this research was able to look at a unique
sensitive NSFG question on abortion history. The
bonus here is that the CAPI question fielded with
an interviewer also was fielded with a subsequent
verification using an audio‐CASI mode to remove
interviewer effects and elicit a possibly “more
honest” answer. Data from the NHIS were used for
nonresponse analyses, and multiple imputation
was employed for item nonresponse solutions.
I want to focus on the multiple imputation
method since it was reported that imputed data
were used to further impute other missing data.
This is not entirely unusual, but I am always
troubled by the layering of imputed data on
imputed data. With this type of “inbreeding”
activity where no new data are introduced, it only
makes sense to me that the variance around
estimates will tend to decrease. Likewise, the mean
square error will similarly decrease. Can we
Figure 3. This graph, using Center for Epidemiologic Studies—Depression Scale data, illustrates a design
where a no‐pretest control group receives no baseline measure in order to avoid an assessment reactivity
effect. A standard control group with a reactivity effect is also shown.
10
12
14
16
18
20
22
24
Pre‐Test Post‐Test 6 month follow‐up
12 month folow‐up
Group 1
Group 2
Control
No Pre‐Test
CES‐D
No Pre‐Test Group
Simulated data based on a graphic borrowed from: Mackinnon, A. et al., Br J Psychiatry 2008; 192:130‐134

174
honestly claim higher precision in our estimates using the imputed results? I want to believe that the
precision we have is never any greater than the extent of the real data that were reported. Would it be more
appropriate to report the standard error based on the real data? Should we report both?
I think extensive multiple imputation methods applied to large health surveys, despite the enormous
analyst burden it imposes, needs to be evaluated from the perspective of data interpretation and the policy
consequences of extracting results and conclusions using multiple imputation techniques with these
surveys. I hope this will instigate further discussion on this all‐important topic and give the author an
opportunity to respond and perhaps, for all of us, an opportunity to reflect.
REFERENCES
Blumberg, S. J., & Luke, J. V. (2010). Wireless substitution: Early release of estimates from the National Health Interview
Survey, January–June 2010. National Center for Health Statistics. Retrieved June 21, 2011, from
www.cdc.gov/nchs/data/nhis/earlyrelease/wireless201012.htm
Callegaro, M., & DiSogra, C. (2008). Computing response metrics for online panels. Public Opinion Quarterly, 72,
1008–1032.
Cook, D. C., & Campbell, D. T. (1979). Quasi‐experimentation: Design and analysis issues for field settings. Boston:
Houghton Mifflin.
Dillman, D. A. (1978). Mail and telephone surveys: The Total Design Method. New York: Wiley‐Interscience.
Gillespie, R. (1991). Manufacturing knowledge: A history of the Hawthorne Experiments. Cambridge: Cambridge
University Press.
Inside Research. (2009). U.S. online MR gains drop. 20(1), 11–134.
Opt‐In Online Panel Task Force. (2010). AAPOR report on online panels. Public Opinion Quarterly, 74, 711–781.
Rubin, D. B. (1987). Multiple imputation for nonresponse in surveys. New York: Wiley.
Yeager, D. S., Krosnick, J. A., Chang, L.‐C., Javitz, H. S., Levindusky, M. S., et al. (2009). Comparing the accuracy of
RDD telephone surveys and Internet surveys conducted with probability and non‐probability samples. Retrieved June
21, 2011, from www.knowledgenetworks.com/insights/docs/Mode‐04_2.pdf

Proceedings of the 10th Conference on Health Survey Research Methods 175
SESSION 3 SUMMARY Mike Battaglia (Abt) and Martin Barron (NORC)
OVERVIEW OF THE PRESENTATIONS
Stephen Blumberg introduced the five‐paper session by mentioning the CDC concept of winnable public
health battles. Examples include increasing seat belt use, reducing smoking, reducing dietary sodium intake,
etc. These battles may be carried out through public health campaigns and other approaches. The people
leading these initiatives need information from surveys to guide implementation and assess progress. The
information is likely to be needed on a quick turnaround basis at the national and/or state level and
potentially the substate level. For some public health initiatives, obtaining information quickly and at a low
cost per interview may be more important that having highly accurate survey data.
This session looked at techniques such as the use of nonprobability opt‐in Internet panel samples, short
field period telephone surveys, multimodality mail surveys, and building design missingness in behavioral
studies, along with techniques to correct for nonresponse bias and measurement error when a rich set of
covariates are available.
John Boyle presented The Use of Online Panels to Characterize the Management of Rare Diseases: The Case of
Primary Immune Deficiency Diseases. A previous attempt at screening 10,000 households in a national
telephone sample yielded only 23 persons with primary immune deficiency diseases (PIDD). National
probability samples can do a good job screening for rare populations, but the PIDD population is very rare,
making standard probability sampling techniques problematic. One probability sampling method is a
multiple frame design that would add list samples to a random‐digit‐dialing telephone screening sample,
but for the PIDD population, no such lists appear to exist. Probability samples make it possible to estimate
totals (e.g., the total number of persons in the U.S. with PIDD) and associate a standard error with those
totals. This study seemed to be more interested in examining treatment gaps and related associations. The
approach of using a nonprobability online panel sample was tested as an alternative to probability
sampling. The study used a two‐phase screening approach. An invitation was sent to a “balanced sample”
of around 880,000 persons in an opt‐in Web panel. Those that went to the screener and passed the initial
screening questions were invited to go to the questionnaire Web site where a second round of more detailed
screening questions were used to narrow the sample down to persons who actually have PIDD. A sample of
around 145 persons with PIDD was achieved. This sample found some associations that provided useful
information to the Immune Deficiency Foundation. From the point of view of “fit for use,” using a
nonprobability sample design seemed to work in this specific situation. However, because none of the large
federal health surveys collects data on the PIDD population, no benchmarks exist for assessing the accuracy
of the estimates of associations found in the opt‐in panel sample.
James Singleton presented Design of Health Surveys for Public Health Emergencies: Early Responder Bias in
the National 2009 H1N1 Flu Survey. The CDC was charged with monitoring the uptake of the H1N1 vaccine
from the fall of 2009 through the first half of 2010. Weekly estimates were needed on receipt of the
vaccination, intent to vaccinate, and reasons for not seeking to be vaccinated. Primary interest was in
cumulative vaccination coverage national and state estimates for high‐risk groups such as the elderly and
children under age two. The design used a dual‐frame telephone sample (landline telephone households
and households in a cellular sample that had only cellular telephone service or had cell phones and were not
likely to answer the landline telephone in the household). A five‐week rolling sample approach with limited

176
call attempts was used. Each survey week contained early versus late responders in terms of the number of
weeks the sample telephone number was in the field. Early respondents were those obtained within the first
two weeks of sample release. The concept was to view late responders as a proxy for nonrespondents
because the level of effort required to complete an interview was viewed as a continuum of resistance. Each
rolling sample was weighted, and the early responders within each rolling sample were reweighted.
Although some differences between early and late responders were found for demographic characteristics,
when the cumulative proportion vaccinated for the early responders was compared to all responders, the
curves pretty much lie on top of each other. It appears that a two‐week rolling sample might suffice for
rapid data release because the bias in vaccination coverage was no larger than around four percentage
points for some subgroups.
Jeanette Ziegenfuss presented Does Using Multiple Modes Increase Sample Representativeness? This was an
application of sequential multiple modes where administrative (medical records) data were available for
most of the population in Olmsted County, Minnesota, to examine nonresponse bias. Multimodality surveys
may be used to decrease the cost per completed interview, increase the response rate, and to increase sample
representativeness. It is possible that individuals have a mode preference and thus will be more likely to
respond if they are offered that mode. This survey used two mailings followed by a telephone survey of
mail survey nonrespondents. The overall response rate was 47%, and the second mailing and the telephone
survey each added about ten percentage points to the initial response rate. It was possible to compare the
respondents to the population on the characteristics available in the medical records. Little evidence of
nonresponse bias was found, and the switching of modes from mail to telephone may be more akin to
multiple attempt strategies, whereby late responders are brought into the sample but do not differ by a
substantial amount on the key survey outcome variables.
Ofer Harel presented Design Missingness to Better Estimate Efficacy of Behavioral Studies. This behavioral
intervention studied suicide prevention. The population was students in Connecticut schools. It appears that
schools were randomized to treatment versus control status, and pre‐ and postintervention interviews were
administered in the schools to the students in the sample. The pretest interview was needed in this
randomized design, but it was known that the pretest questionnaire was likely to increase the knowledge
and attitudes of students in the control group regarding suicide prevention, which can make the
intervention look less effective. Because the pretest was divided into three modules, this could be tested by
administering all three modules to some students; for other students, only two of the three modules were
administered in a randomized fashion. In effect, this reduces the impact of the pretest questionnaire on the
outcomes measured in the posttest interview. The study found that the control group students who received
all three modules did exhibit different posttest responses than those who received only two of the modules.
In other words, the treatment effect was stronger than a design with no design missingness would have
found. Also, students who received only two of the three modules were more likely to participate in the
posttest survey than those who answered all three modules at the pretest survey. This type of design
missingness approach requires that multiple imputation techniques be used to fill in the missing pretest
module data, but this was offered as a design advantage as opposed to a missing data design limitation.
This also points out that in a randomized design, if one can avoid the need for a pretest survey, the posttest
difference would give an accurate estimate of the treatment effect. This is not always possible because the
pretest interview may be used to determine the intervention that will be given to that individual.
Andy Peytchev presented Correction for Survey Nonresponse and Measurement Error. Three topics were
covered: (1) common causes and correlates of nonresponse and measurement error, (2) magnitude and
source of error, and (3) correction approaches. Unit nonresponse can be affected by topic interest, topic

Proceedings of the 10th Conference on Health Survey Research Methods 177
sensitivity, length of interview, interviewer training, etc. With regard to magnitude of survey errors, the
survey design should be optimized to address dominant sources of error. As for common correction
approaches, nonresponse weighting generally is used—poststratification and propensity weighting.
Corrections for measurement error typically are not made. One can use imputation to address missing data
due to nonresponse and item nonresponse. This works best if one has a rich set of covariates (from the
sampling frame). In weighting, we adjust the weights of the respondents; in imputation, we can impute the
Y variables for the nonrespondents and also the missing Y values for item nonresponse among respondents.
The idea is to fill in the entire data set. The 1995 NSFG cycle 5 was used to demonstrate this approach. This
was a CAPI survey that used the NHIS as a sampling frame. They also have better ACASI measurements for
sensitive items (e.g., abortion reporting) within specific replicates. This makes it possible to look at the CAPI
estimates prior to imputation, the CAPI estimates after imputation, and the impact of the ACASI
measurements on the sensitive items. The multiple imputation approach was compared with a propensity
weighting approach. Relative magnitude analysis: (1) 16% abortion estimate before imputation; (2) after
imputation for nonresponse, the estimate was 17.5%; and (3) after ACASI adjustment, the estimate rose to
21.3%. The three estimates for weighting versus imputation were similar. But given a rich set of covariates,
one may be able to decrease the variance relative to the propensity weighting; the researchers found that SEs
were lower for the second and third estimates. In this case, the use of multiple imputation increased
complexity for the analyst, but the effective sample size was larger.
Discussant Charles DiSogra indicated that the topic of the session was along the lines of making the
most of what you have, squeezing more out of the methods and data at hand, and economizing on effort.
For example, opt‐in Internet panels are fast and low cost, but many of the panel recruitment, panel
maintenance, and estimation techniques are proprietary, and completion rates are very low. Therefore, they
may not really be appropriate for prevalence estimates. It was noted that opt‐in panels do provide
information that allows one to search for and remove responses from “speedsters” and inattentive
respondents. This points to a range in quality of nontraditional approaches, and the researcher needs to
understand these issues at the design stage so that various quality devices and measures can be built into
the implementation of the design.
FLOOR DISCUSSION
Framing of Panel
Much of the discussion focused around whether the content of the discussion should best be framed as
“How far are we willing to go to trade quality for cost savings?” or instead as “Is a given method fit for the
purpose(s) of a particular study?” But one participant wondered about fitness for use—how is it defined
and measured.
According to panel members, some government agencies struggle with the competing demands of cost,
quality, and timeliness. While probability sampling is neither impossible nor dead, it is expensive and
requires a great deal of effort to gain cooperation. We need to be open to unconventional techniques to
address problems that may be unsolvable using traditional methods. The best approach when we think an
unconventional approach works is through test and replication.
In addition to the methodologies presented by the panel, audience members suggested a number of
alternative designs (e.g., a rolling cross‐sectional design or an omnibus survey as an alternative to Web
surveys). There also are many people eager to participate in surveys if given the chance. A goal posed by

178
one commenter is to investigate how we can take advantage of those wishing to participate in a reasonable
and structured way.
New Methods
Boyle’s Internet panel survey of an extremely rare population was complimented for its rigor, a trait
lacking in some other surveys that employ opt‐in Internet panels. However, concerns were raised that even
high‐quality implementations of Internet panels may miss some low‐incident populations. Audience
members also noted that Internet panels are problematic for looking at trends since the makeup of any given
panel can vary substantially from month to month. A key aspect of using this type of nontraditional
approach in health survey research is to gain as great an understanding of the detailed working of the
methodology as is feasible given the proprietary nature of some of these tools.
In employing new methods, one audience member argued that it can’t be done in half steps (e.g., using
an Internet panel but still trying to calculate some approximation of a response rate or considering a panel to
be an independent frame). Instead, we should be concerned with questions relevant to the method: Are
people who they claim to be, are data machine entered, etc.?
Some discussion revolved around whether it is preferable to employ more complex methods that
increase the burden on analysts. At least two panel members believed that is the preferred course. For
example, a complex public use data file based on the use of multiple imputation greatly increased burden on
the analyst, but a well‐done data release will provide documentation and even programs on how to take the
added complexity into account. Data users must be willing to invest in understanding how to take the
increased complexity into account when they analyze the data.
Response Rates
Several audience members discussed the limits on alternative methods placed by clients, journals, and
IRBs. One audience member noted that some journals have minimum response rates requirements. Others
have clients with requirements or IRBs that place limits on or require certain response rates; unfortunately,
some efforts to increase response rates also can increase error. For example, incentives might improve
response but reduce the quality of answers a respondent gives.
One alternative is to educate clients, journal editors, and IRBs on the limits of response rates. OHRP has
begun to discuss the possibility that surveys could be exempted, but that could only occur if and when
certain safeguards were in place (e.g., to ensure data confidentiality).
Education also requires better measures of response error. Multiple factors that contribute to survey
error need to be considered.
Imputation
The discussion of the advantages of using imputation to create a complete data set with all survey
variables present for both nonrespondents and respondents compared with traditional weighting
approaches focused on the variable‐specific nature of imputation (i.e., each Y variable is imputed for
nonrespondents and respondents with missing values) versus the creation of a single weight for only the
respondents. For a single Y variable, if one used the same X variables used in imputation in a weighting
approach, then the variances should be the same. This is sometimes referred to as predictive means weights
and contrasts with propensity weighting. There was agreement that we should concentrate on using
weighting variables that are associated with the Y variables if we are interested in reducing nonresponse

Proceedings of the 10th Conference on Health Survey Research Methods 179
bias. It was argued that since imputation is variable specific, we can make better use of the rich covariates
compared to weighting, where one must ultimately create one weight for each respondent as opposed to a
weight for each Y variable.
Research Agenda
This session pointed to four major areas of research. First, it is clear that new and innovative research
needs to be conducted comparing rigorous probability sampling designs with the continuum of
nonprobability methods that have been used or proposed. The availability of external benchmarks can greatly
assist this type of research. Even the sampling statisticians at the session agreed that in some situations, the use
of probability sampling is not feasible. In that situation, we should not conclude that the survey should not be
conducted but rather understand what nontraditional methods are available—for example, what are the
tradeoffs between respondent‐driven sampling and an opt‐in Web panel for sampling a very rare population?
We also need to better understand how probability samples can be used to calibrate nonprobability samples.
Second, we need to apply simulation techniques to high‐quality/high‐effort surveys to understand how
reducing effort to save money or speed up the release of survey estimates affects the quality of the estimates.
Simulations, if well designed, can determine the impacts of reducing the number of call attempts when
rapid release estimates are needed. In the area of weekly rolling samples, it can be used to determine the
impact of curtailed field periods to allow for the timely release of rolling weekly estimates.
Third, the use of sequential multimodality surveys without thought being given to building experiments
into the designs limits what we are learning from the large number of sequential multimodality surveys
being presented at survey conferences. For example, as we move from one mode to another, are we reaching
sample groups that differ on our key survey health variables, or are we just seeing mode effects? This makes
it very difficult to judge the benefits of using sequential multimodality designs; carefully designed
experiments can inform the discussion of whether these types of surveys should be more widely used.
Fourth, imputing for item nonresponse is well accepted by survey statisticians, and multiple imputation is
now widely used in surveys. Imputing all variables for unit nonrespondents versus weighting the respondents
is an area of active debate and research in the survey statistics community. Most major surveys continue to
provide a weight for each respondent. The alternative approach of imputing the nonrespondents is viewed by
some statisticians as preferable from the point of view of nonresponse bias reduction when a rich set of
sampling frame covariates is available. Part of the argument in favor of imputation is that it is variable specific.
Some survey statisticians argue that techniques such as predictive mean weighting (i.e., weighting on variables
associated with the key survey health variables) can achieve the same objective with less complexity for the
data users. This will be an area of continued debate and research in the survey statistics community for health
surveys as well as many surveys about many other subject matters. One aspect of future research should focus
on the common situation in the U.S. of not having access to a rich set of covariates in the sampling frame.
One session attendee ended with a comment along the lines that caution should be a watchword, but we
need to solve problems. Future research on nontraditional methods should be guided by those this
philosophy.

180

Proceedings of the 10th Conference on Health Survey Research Methods 181
SESSION 4: Building the Health Data Sets of Tomorrow ORGANIZERS: Michael Davern (NORC), John Loft (RTI International), and
Judie Mopsik (The Lewin Group) CHAIR: Judie Mopsik

182

Proceedings of the 10th Conference on Health Survey Research Methods 183
Population Health Research with Health Plan Data Linkage: Building from the HMO Research Network Experience
Michael Von Korff (Group Health Research Institute)
“Change is hard because people overestimate the value of what they have, and underestimate the
value of what they may gain by giving that up.” (Belasco & Stayer, 1993)
Since the 1970s, the Veteran’s Administration, Kaiser Permanente, Group Health Cooperative, and other
large integrated health plans have invested billions of dollars in electronic health care data systems to
improve health care provided to their patients, more recently implementing comprehensive electronic
medical records. As the U.S. transitions gradually toward near universal coverage, larger health plans, and
Accountable Care Organizations, high‐quality electronic health care data are likely to become available for
larger segments of the U.S. population. This change has the potential to transform how population health
research is done.
Changes starting to take place include greater use of health plan electronic data in research, more
efficient primary data collection through health plans taking advantage of available electronic health care
records, and the potential for greater accountability of health plans and researchers for achieving progress
towards national health and health care objectives. Experience with population health research in the HMO
Research Network can provide insight into how increased availability of high‐quality electronic health care
data can change the methods of population health research. Examples of the kinds of research that have
been carried out using these populations and data resources have been reviewed by Saunders, Davis, and
Stergachis (2005) and Selby et al. (2005).
The HMO Research Network (HMORN) is a consortium of 16 research centers located in health plans
that serve defined populations with access to high‐quality electronic health care data. The 15 HMORN
research centers in the U.S. are in health plans with diverse health care delivery arrangements including
integrated group practice and network models. The plans serve large, diverse, relatively stable populations.
The research centers have access to comprehensive electronic health care data organized in SAS archive files,
and they do public‐domain health services, clinical, epidemiologic, and behavioral sciences research
predominantly funded by NIH, other federal agencies, and foundations.
The combined populations of these health plans include about 11 million people with linked archival
health care data. There are now online electronic medical records (EMR) data available for almost 8 million
current enrollees. The research centers routinely link these data to state birth and death records. Seniors and
children are well represented in the HMORN populations, as are racial and ethnic minorities (see Table 1 on
the next page). HMORN health plans serve persons insured by Medicare, Medicaid, and state low‐income
plans, as well as employer‐based health insurance and individual policies. Across the health plans, 57% of
persons who enroll remain in the plan three years later, but retention is substantially higher among the
subset of these populations enrolled for at least one year.

184
Table 1. HMO Research Network Population Characteristics across the 15 U.S. Health Plans
Combined population of ~11 million persons with linked archived electronic health care data of high quality ~7.5 million persons with online electronic medical recordsState birth & death records routinely linked by research centersAge <18 years: 25% (~ 2.7 million); > 65 years: 17% (~ 1.3 million)Racial/Ethnic minorities: 43% (~ 4.7 million) Includes Medicare & low‐income insured populationsMedian enrollment retention at 1 year: 84%; at 3 years: 57%Enrollment retention higher for persons enrolled at least one year
Table 2. Emergent Data Resources in HMO Research Network Health Plans
Over the past 15 years, the HMORN has developed a series of research consortia funded by NIH and
other federal agencies, including major initiatives concerning cancer, vaccine safety, cardiovascular disease,
and drug safety surveillance, among others. These initiatives include Cancer Research Network (NCI),
Vaccine Safety Datalink (CDC), Cardiovascular Research Network (NHLBI), Mental Health Research
Network (NIMH), Center for Education and Research on Therapeutics (AHRQ), Mini‐Sentinel (FDA),
DeCIDE Network (AHRQ), and the Breast Cancer Surveillance Consortium (NCI), among others. NIH
currently is working with the HMORN in a collaborative arrangement to facilitate large‐scale clinical trials
and genetics research.
Most of the HMORN research centers have survey centers with CATI, mail, and Web‐based data
collection capabilities. The sampling frames available in these populations include not only age, sex, and
contact information, but also diagnostic data, information about drug exposures, and other information
from the health plan databases. Survey calls are identified as coming from the health plan. Telephone
interviews remain the predominant form of survey data collection, but mail, Web‐based, and mixed‐mode
data collection are increasing in use. Many of the research centers have facilities for clinical assessments.
Survey response rates have declined in the HMORN populations, but it is routine to achieve response rates
in the 60–80% range depending on interview length, the target population, and the research subject. Follow‐
up rates are generally high—in the 85 to 95% range for a one‐year follow‐up in a longitudinal study or
clinical trial. Demographic and electronic health care data can be compared for survey nonrespondents and
respondents, and nonresponse adjustment for variables associated with nonresponse often is employed.
HMORN health plans have unique data resources that are becoming available for millions of enrollees
(see Table 2). With the implementation of EMRs, biometric data now are available for entire populations,
including height and weight, blood pressure, cholesterol, and (among persons with diabetes) glycemic
control. These measures can be tracked longitudinally on a population basis. Natural language processing is
RESOURCE DESCRIPTION
Biometric data Height, weight, blood pressure, cholesterol levels, glycemic control, & other biometric measures can be tracked longitudinally on a population‐basis for persons with EMR data coverage.
Natural language processing (NLP) NLP is being used to process clinical text data obtained from health plan electronic medical records.
Genetic data Saliva samples are being obtained through the mail. Blood samples are collected via health plan laboratories in the primary care clinic of the research participant.
Geographic data By geocoding address data, HMORN health data are being linked to geographic data (e.g., neighborhood walkability).
Health Risk Appraisal (HRA) data In concert with employer groups, some HMORN health plans are collecting extensive health behavior & health risk data through online HRAs. These data are becoming available for hundreds of thousands of enrollees.

P
b
e
a
t
t
d
o
c
a
s
a
e
r
g
s
s
l
o
c
H
t
u
h
i
a
o
a
a
o
e
a
h
i
r
e
t
o
p
f
i
Proceedings of
being used to
extracted from
and pharmac
the HMORN
to EMR data
diagnostic an
obtained from
considerable
abstracting u
substantially
abstracting p
efficient elect
reviews are b
growing expe
saliva sample
samples in he
ocated in the
obtained by g
characteristic
Some of t
HRAs implem
thousands of
unique and v
health and he
While hea
s generally o
archive. Rath
or VDW (see
algorithms ag
analyzing VD
original healt
external colla
approving m
The kinds
hard to imagi
ncrementally
research. Ove
electronic hea
these data is u
As these
organizations
potentially be
for dissemina
llness care.
the 10th Confe
o process clin
m EMRs with
coepidemiolo
is now using
to validate a
nd health eve
m administra
success. Med
sing the EMR
more efficien
aper charts, a
tronically gui
being used. T
erience with
es via mail an
ealth plan lab
e primary car
geocoding ad
cs such as nei
the health pla
mented in co
enrollees, an
valuable data
ealth care obj
alth plan dat
obtained thro
her, multiplan
Figure 1). Th
gainst databa
DW data obta
th plan data.
aborators, an
multisite use o
s of data and
ine even 20 y
y, but the end
er the next de
alth care data
underway, a
changes play
s to emerge a
eneficial for t
ation of evide
erence on Hea
nical text
h some succe
ogic research
g online acce
nd refine
ent data
ative data wit
dical record
R is
nt than
and highly
ided chart
There is
collecting
nd blood
boratories
re clinics of r
ddress data, p
ighborhood w
ans are collec
ncert with em
nd coverage s
a resources th
jectives.
ta are archive
ough research
n data analys
he VDW invo
ases that hav
ains access to
Data use inv
d often the re
of HMORN d
d data collecti
years ago. Th
d result has b
ecade, the pe
a will increas
and these tren
y out, there is
as key partne
the health of
ence‐based b
lth Survey Rese
ess,
in
ess
th
research parti
permitting an
walkability.
cting extensiv
mployer grou
should incre
hat can be use
ed in SAS file
hers working
ses are devel
olves running
e been set up
o de‐identifie
volves partne
esearch spon
data more eff
ion capabilit
he way resear
been fundam
ercent of the U
se dramatical
nds will acce
s the potentia
ers in the con
the America
best practices
earch Methods
icipants. The
nalyses that l
ve Health Ri
ups. HRA da
ase in comin
ed for resear
es and routin
g within the h
oped throug
g site‐specifi
p to be comp
ed variables c
erships betwe
nsor. Progres
ficient. Major
ies now acce
rch with thes
mental change
U.S. populat
lly. The trans
lerate as pop
al for large h
nduct of popu
an population
s for preventi
s
ere is also gro
link health p
isk Appraisal
ata are becom
ng years. The
rch and for tr
nely are used
health plan. T
gh what is cal
ic programs d
arable across
created by th
een the healt
s has been m
r multisite an
essible throug
se data is carr
e in the meth
tion covered
sition to pop
pulation cove
health plans a
ulation health
n, as health p
ion, health ca
owing use of
plan data to e
l (HRA) data
ming availabl
health plans
racking progr
d in research,
There is not a
lled the Virtu
developed fr
s health plan
he common a
th plans, hea
made in maki
nalyses of VD
gh health pla
ried out has
hods of popu
by health pla
pulation healt
erage increas
and accounta
h research. T
plans are ulti
are value and
f geographic
environmenta
a through onl
le for hundre
s are develop
ress towards
access to the
a national da
ual Data War
rom common
ns. The resear
algorithms bu
alth plan rese
ng IRB proce
DW are now
ans would ha
changed
ulation health
ans with high
th research u
ses.
able care
These change
imately accou
d safety, and
185
data
al
line
eds of
ping
s national
ese data
ata
rehouse
n
rch team
ut not the
earchers,
esses for
routine.
ave been
h
h‐quality
using
es are
untable
chronic

1
a
i
s
a
i
n
h
f
n
p
p
t
c
o
i
b
A
r
t
H
f
h
P
w
i
e
d
b
o
a
o
h
c
t
s
A
c
186
If we are
as “learning h
nfluences res
systems capa
ahead. At Gro
nstitute has d
national scale
health outcom
How cou
first step wou
national objec
plans to cond
process. Such
Through
to dramatical
care data reso
of health plan
nitiatives cou
Using the
based data po
Americans in
reducing hea
treatments be
Baseline d
HRA could b
far‐reaching o
health and lo
Participation
with reduced
nsurance pre
Once a na
enrolled with
data, it would
biometric me
occurrence, tr
and costs, and
outcomes usi
health care da
care data cou
targeted prim
subsets of the
Appropriate
could be deve
to improve h
health care sy
search. Enlist
able of addres
oup Health C
developed in
e, we would b
mes.
ld national r
uld be to recr
ctives. Such i
duct policy‐re
h partnership
efficiencies o
lly reduce the
ources. Majo
ns—and of re
uld draw on
e health plan
ortals that en
n a national c
alth care costs
eing adminis
data might b
be promoted
opportunitie
ower health c
might be inc
d out‐of‐pock
emiums.
ational cohor
h comprehen
d be possible
easures, disea
reatments, he
d selected he
ing health pla
ata. The elect
uld be supple
mary data col
e national coh
data sharing
eloped to per
health outcom
ystems” (see
ting health p
ssing the cha
Cooperative,
n ways that in
be in a much
esearch polic
ruit health pl
initiatives co
elevant resea
ps would view
of scale, techn
e costs of pri
r research in
esearchers—f
methods tha
n as a samplin
nrollees are a
ohort dedica
s, discovering
stered are saf
be collected u
to health pla
s to improve
are costs.
centivized
ket health
rt was
sive baseline
e to track
ase
ealth care us
ealth
an electronic
tronic health
emented with
llection in
hort.
g mechanisms
rmit large‐
mes and cont
Figure 2). In
plans as resea
allenges assoc
for example
ncrease the im
h better posit
cies become m
lans as partne
ould form par
arch and to ch
w health plan
nological inn
imary data ac
itiatives then
for achieving
at are being u
ng frame and
lready using
ated to achiev
g the causes
fe and effectiv
using a standa
ans as a strate
e
e
e
c
h
h
s
trol health ca
n such a syste
arch partners
ciated with r
e, the relation
mpact and re
tion to contro
more effectiv
ers in carryin
rtnerships be
hange how h
n data as a n
novation, and
cquisition wi
n could be us
g national he
used now (se
d baseline dat
g, it would be
ving aims suc
of major dise
ve.
ardized Web
egy to engage
are costs, we
em, research
s could help u
reorganizatio
nship betwee
elevance of r
ol health care
ve in achievin
ng out major
etween acade
health care se
national asset
d health plan
ith linkage to
sed as a mean
ealth and hea
ee Table 3 on
ta acquisition
e possible to
ch as improv
eases and dis
b‐based Heal
e their enroll
need health
influences p
us develop le
on of health c
en the health
esearch. If th
e costs and im
ng national p
r research init
emia, govern
ervices are de
t for achievin
n engagemen
o health plan
ns of increasi
alth care obje
the followin
n through th
enroll literal
ving health o
sabilities, and
lth Risk Appr
lees in a natio
plans that fu
practice, and
earning healt
care services
plan and the
his happened
mprove popu
policy objecti
tiatives relev
nment, and h
elivered in th
ng policy obje
nt, it could be
n electronic h
ing the accou
ctives. Such
ng page).
he health plan
ly millions o
outcomes and
d ensuring th
raisal (HRA)
onal initiativ
unction
practice
th care
that lie
e research
d on a
ulation
ives? A
vant to
health
he
ectives.
e possible
ealth
untability
n Web‐
of
d
hat
). The
ve with

Proceedings of the 10th Conference on Health Survey Research Methods 187
scale use of national cohort data by researchers in academia and government and policy research
organizations, as well as researchers working in health plans.
Through partnerships with health plans, it would be possible to implement major trials of preventative
interventions and innovations in health care delivery within segments of the national cohort. Self‐reported
health measures could be obtained by interview or Web‐based data collection in subsamples. Genetic data
also could be collected in subsamples through standing orders administered by health plan laboratories
activated when patients make a health care visit.
This sort of research endeavor could serve as a basis for clarifying the accountabilities of health plans
and of researchers for achieving national policy objectives through discovery of effective innovations and
dissemination of evidence‐based best practices. Such an initiative might close the gap that currently exists
between policy research and research funded by NIH for scientific discovery. It also could drive down the
aggregate costs of data acquisition that currently are outpacing national funding resources. Fundamental
change in the way we organize population health research is not only possible—it is necessary if we hope to
make our research more effective in achieving national policy objectives.
Table 3. Building the Health Data Set of Tomorrow Using Methods in Use Today
Efficiently enroll millions of Americans in a National Cohort dedicated to
Improving health outcomes & reducing health care costs
Discovering causes of major diseases & disabilities
Ensuring that treatments are effective & safe Collect baseline data through a standardized online Health Risk Appraisal promoting it as a strategy to engage health plan members in a national initiative with far‐reaching opportunities to improve health outcomes & lower health care costs. Incentivize participation with reduced out‐of‐pocket health insurance premiums. Track biometric measures, disease occurrence & treatments, health care use & costs, & health outcomes using health plan electronic health care data supplemented by targeted primary data collection. Implement major trials of preventative interventions & innovations in health care delivery within segments of the national cohort. Measure self‐reported health outcomes in targeted subsamples by telephone survey and/or online data collection.Collect genetic data in targeted subsamples through standing orders administered by health plan laboratories activated when patients make a health care visit. Define accountabilities of the health plans & researchers for achieving national health policy goals through discovery of effective interventions & dissemination of evidence‐based best practices.
REFERENCES
Belasco, J. A., & Stayer, R. C. (1993). Flight of the buffalo. New York: Warner Books.
Saunders, K. W., Davis, R. L., & Stergachis, A. (2005). Group health cooperative. In B. L. Strom (Ed.),
Pharmacoepidemiology (4th ed., pp. 221–239). New York: Wiley.
Selby, J. V., Smith, D. H., Johnson, E. S., Raebel, M. A., Friedman, G. D., et al. (2005). Kaiser Permanente Medical
Care Program. In B. L. Strom (Ed.), Pharmacoepidemiology (4th ed., pp. 241–259). New York: Wiley.

188

Proceedings of the 10th Conference on Health Survey Research Methods 189
The Use of Cognitive Interviewing to Evaluate Data Quality in Administrative Records
Stephanie Willson (National Center for Health Statistics)
INTRODUCTION
Evaluating administrative data is becoming more salient as the federal statistical system has been
expanding—and likely will continue to expand—its use of administrative records. This paper argues that
cognitive interviewing, a methodology typically associated with survey question evaluation, is an
appropriate and helpful tool for evaluating administrative data quality. This paper draws on a study
conducted by the Questionnaire Design Research Laboratory (QDRL) at the National Center for Health
Statistics aimed at understanding how select medical and health items on the Facility Worksheet for the 2003
Revision of the U.S. Standard Certificate of Live Birth are collected. The cognitive interviewing method
helped us understand the patterns of different processes by which the abstraction of birth certificate data
take place, where the process deviates from the federally recommended standards, and the possible causes
of error in birth certificate data. As a result, we feel the method can be successfully applied to the evaluation
of data quality in various types of administrative data.
ADMINISTRATIVE DATA & THE JUSTIFICATION FOR USING COGNITIVE INTERVIEWING
Defining Administrative Data
Administrative data can take many forms. For the purposes of this paper, I am including hospital
records (e.g., medical records and billing records) and state vital records (e.g., birth and death certificates) as
examples of administrative data. It’s important to recognize that administrative records are used in different
ways, which can impact what the data look like. Sometimes administrative records are used in validation
studies as a “gold standard” against which survey estimates are compared. For example, survey estimates of
health insurance coverage (both public and private) have been compared against Medicare, Medicaid, and
Blue Cross/Blue Shield records (Blumberg & Cynamon, 1999; Davern et al., 2008). Other times,
administrative records have been linked to survey data to augment analytic power. The National Health
Interview Survey has linked death certificates in order to obtain a more complete picture of cause of death
(see Denney, 2010; Klatsky, 2010). In these examples, the administrative records are themselves the data.
In other instances, administrative records are not used as data in‐and‐of themselves but are instead
modified and adapted to serve research purposes. In this case, they are a source of data but are not used
directly as data. As a result, information must be either extracted or abstracted from the record and
transformed into a more “useable” form. Extraction is generally easier because it involves a literal
transcription of a piece of information from one place to another. Abstraction is more complicated because
information from the administrative record must be altered in some way in order to suit the purposes of the
research agenda. The focus of this paper is on the latter—administrative records as a source of data.
Justifying the Use of Cognitive Interviewing
Traditionally, cognitive interviewing primarily has been used to evaluate survey data. For surveys, a
respondent is the source of data. Health survey questions ask respondents about their life, their experiences,
or even their opinions on certain topics. With administrative data, on the other hand, the record is seen as

190
the source of data. Despite these perceived differences, data quality is a consideration in both. With surveys,
attention must be paid to the amount and nature of measurement error associated with a particular
question. With administrative records, it’s easy to assume that the information is self evident. Because it
doesn’t involve the interaction of an interviewer posing a question to a respondent—which can be fraught
with communication difficulties—the data are seen as more reliable and the process as more
straightforward. Instead, accuracy and completeness of the record are recognized as the potential problems.
With surveys, cognitive interviews are used to assess the data that come from asking questions. With
administrative records, when data quality is assessed, it is most often done by repeating or observing the
abstraction process to assess data reliability or, for computerized records, it can include range and logic
checks for things like dates. However, we feel that more can and should be done to evaluate the quality of
data obtained from administrative records. My assertion is that although cognitive interviewing has been
used predominantly for evaluating survey data quality, it also can be used to evaluate and explicate
administrative data.
Traditional Model of Cognitive Interviewing: Exploring the Question‐Response Process
Cognitive interviewing, as a qualitative methodology, is a tool for exploring how respondents go about
answering a survey question. The model most commonly used to explicate this phenomenon is
Tourangeau’s four‐step process of comprehension, retrieval, judgment, and response (Tourangeau, Rips, &
Rasinski, 2000). When answering a survey question, respondents must first understand what it’s asking.
Second, they must recall relevant information from memory. Next they make judgments about the
applicability of the information they have recalled. Finally, they map the answer they have arrived at in
their mind onto the response categories provided for the question. Cognitive interviewing taps into this
process in order to determine where things can go wrong (in each of those steps) and to evaluate and
describe the construct validity of each survey question (Willis, 2005). The ultimate goal is to design a survey
question that accurately captures the intended construct.
Adapting the Traditional Model: Adding Structure & Process
The question‐response model can, and has been, extended for use beyond traditional surveys. For
example, Edwards and Cantor (1991) and more recently Willimack and Nichols (2001; 2010) modified the
model for establishment surveys. The original steps still apply and have utility, but Willimack and Nichols
add steps to reflect the realities of the collection of data from businesses.
In working with administrative data obtained from hospitals, I find utility—both theoretically and
empirically—in the way Willimack and Nichols adapted Tourangeau’s model. However, this paper
emphasizes the process as more of a multidimensional (rather than linear) one because the abstraction of
administrative data occurs in different ways and at different levels, sometimes simultaneously. Willimack
and Nichols (2010) emphasize the benefits of the modified model to be exclusively in the identification of
measurement error “so that the survey design may be altered to reduce or eliminate such error” (p. 19).
While the identification of measurement error is an important endeavor, I argue that cognitive interviewing
can be extended to reveal patterns of process and structure that give a more complete meaning behind what
is being captured by items in different organizational contexts for specific surveys.
Administrative personnel, nurses, and physicians create medical records. In this study, I focused on the
abstraction of data from hospital administrative records and identified four phases in the process that
potentially impact data quality. First, the person abstracting the data first has to understand and interpret the

Proceedings of the 10th Conference on Health Survey Research Methods 191
administrative record. Second, in the process of abstracting data from records, there is often some kind of
worksheet. This worksheet also has to be understood and interpreted. On a third level, the abstraction process
itself must be understood and interpreted by the data collector. In essence, this is the understanding of how
people interpret the connection or relationship between the administrative record and worksheet. Finally, the
way the job is structured can play a role in how data are abstracted. This is perhaps the biggest modification of
the original Tourangeau model because it adds sociological insight to a largely psychological model. For
example, if the process of abstraction is structured differently in different locations, the nature and quality of
the data will be impacted. If one location uses doctors to abstract data and another uses administrative clerks,
the process and all the other steps will occur very differently. Hence, data are less likely to be comparable
across sites, and the difference is likely to be patterned and systematic.
The way this occurs is not necessarily a linear process. Instead, each of these processes (understanding
the worksheet, understanding the administrative record, understanding the process, and the structure of the
task) interact together and often occur simultaneously to produce administrative data. Cognitive
interviewing can shed light on how each of these processes function, as well as how they work together to
tell us something about the nature of the data they produce. The next section provides a specific example of
these ideas. It discusses how these processes were identified and studied in the QDRL birth certificate study.
THE BIRTH CERTIFICATE STUDY
The birth certificate study covered four states in different parts of the country. Each state had experience
with the 2003 revision; however, states (and even hospitals within each state) modified the revised
certificate of live births to suit their own needs. A total of 54 interviews were conducted with Birth
Information Specialists in hospitals.
The goal was to discover how hospitals structure the task of abstracting data on live births, how hospitals
go about completing the task, and how they interpret various items on the worksheet. Cognitive interviews
were conducted with the worksheets each state uses to collect birth certificate information prior to entering the
information into the Electronic Birth Certificate (EBC) system. The birth certificate worksheets consist of
essentially two parts: the first contains information that becomes part of the official birth certificate given to
parents, and the second part contains medical and health information related to the mother and the birth. The
focus of data abstraction was on part two (the medical and health information portion of the birth certificate
worksheets). For example, probing centered on specified pregnancy history and prenatal care items, as well as
all other medical and health information items. Interviews took place with hospital employees responsible for
completing the state form and for transmitting data to the EBC database.
Aside from exploring the interpretive aspects of individual items on the birth certificate worksheet,
another goal of the project was to discover how hospitals structure the task of collecting data on live births,
as well as how hospital personnel go about completing this task given day‐to‐day realities in a hospital. The
question to be answered was if and how the structure of the job and the process of completing the forms
impact the data being collected. We used cognitive interviewing to explore process and structure in addition
to interpretation. During the interview, the researcher collected detailed information on how the form was
being completed from start to finish and respondents’ understandings of their role in the process. We also
explored how responsibility for completing the forms was organized by each hospital and the extent to
which that protocol was followed. Interviews usually began with a discussion of how the worksheet is
envisioned to be completed in that hospital, followed by an explanation of how the form actually is filled

192
out. Respondents were prompted to discuss any problems they encounter in completing the worksheet and
how they resolve these problems.
Results
A primary finding is that there is great variability among hospitals in the abstraction process. This
variation creates differences in the data produced on the birth certificate worksheet resulting in a lack of
data comparability among states. For example, if higher Cesarean rates are observed in one state compared
to another, that difference may be an artifact of how the data are produced and not attributable to a true
difference in Cesareans. Four sources of variability were identified.
One source was in Birth Information Specialists’ interpretations of items in the medical records and on the
birth certificate worksheet. Understandings of various terms and medical phrases were not consistent among
the specialists. The item on whether the mother was breastfeeding upon discharge from the hospital is a good
example. Respondents were sometimes confused over the definition of breastfeeding. Some wondered
whether one try counts. If not one try, then how many? (At what point does the answer go from no to yes?)
Others did not know if pumping counts. They wondered if the point was in knowing only that the infant is
ingesting breast milk or in knowing that the bonding process is occurring as well. Relatedly, some respondents
were not certain how to record information when the mother was choosing to both bottle and breastfeed. They
weren’t sure if the item was designed to capture 100% breastfeeding or if “part‐time” breastfeeding counted.
Second, there was variability among states in worksheet design. Some states used separate sheets for
different sections while others put all information on one sheet (front and back). Moreover, absent any
instruction (as was usually the case), it was unclear who should complete each section of the form—the
mother or a clinician. As a result, different people were completing different sections, both among hospitals
and among states. This variability is noteworthy to the extent that some people are better suited than others
to complete certain items. For example, clinicians are better suited than mothers to fill out the medical and
health information section. Mothers cannot necessarily be expected to know medical terms. For example,
one item on the worksheet asks whether there was “moderate/heavy meconium staining of the amniotic
fluid.” This item can be difficult for many laypeople to answer. Federal recommendations regarding who
should complete certain items do exist, but deviation from and variation in the structure of the worksheet
used by individual states contributed to those recommendations being overlooked.
Third, there was variability in who is responsible for getting medical and health information from
medical records. In some states, the Birth Information Specialists are responsible for this information; in
other states, clinicians are responsible; and in a few cases, the mother is responsible. Despite federal
recommendations that encourage a unified approach, states and even local hospitals structured this task
differently. This is an important finding because each group (mothers, birth clerks, and clinicians) has
different levels of knowledge and understanding of items on the worksheet and of the medical records (the
chief source of information for items on the worksheets).
Finally, there was variability in how certain items were collected (e.g., pregnancy history items vs. other
medical and health information) by Birth Information Specialists. Some respondents would use the medical
records for the medical and health information, but ask the mother for pregnancy history items. Others
would ask the nurse for all information or ask the mother for all information. The medical record was
consulted only when nurses or mothers could not provide the requested information.
Additionally, when information is missing from the medical records (not an uncommon phenomenon) or
is not stated in a straightforward manner, many Birth Information Specialists developed another strategy to
Proceedings of the 10th Conference on Health Survey Research Methods 193
come up with information to record on the birth certificate worksheets. This involves making a logical
assumption as to what the answer would be based on other available and relevant information. One
respondent referred to this as “putting two‐and‐two together,” and another called it “estimating.” I refer to
this process as “logical estimation.” This tends to occur when a key piece of information they need is not
directly available in the medical record. However, other information can provide insight into what the missing
value would be. Unfortunately, this is not always a straightforward process and can lead to inconsistent
conclusions. Trial of labor is a good example. For mothers who had Cesarean deliveries, the item on the
worksheet asks, “Was a trial of labor attempted? Yes/no.” Nowhere in the medical record does it explicitly
state, “trial of labor was attempted.” So birth clerks usually have to read through the labor and delivery log to
determine the answer to this question. Some said that if they see that the mother had a previous Cesarean
delivery, they assume that no trial of labor was attempted and mark ‘no’ on the worksheet. This, of course,
may not be the case. Some mothers do delivery vaginally after having a Cesarean. Another example of
frequently missing information is date of last normal menses. To arrive at a logical estimate for this, many
respondents use the mother’s expected date of delivery to calculate the date of her last period. However, as
women’s menstrual cycles are sometimes quite unpredictable, this has the potential to introduce variability
and error into the data. This lack of standardization at many points and on different levels in the process
resulted in data that are not comparable and draws into question the validity of certain items.
CONCLUSION
The cognitive interviewing method was very good at helping us understand the patterns of different
processes by which the abstraction of birth certificate data takes place, where the process deviates from the
federally recommended standards, and the possible causes of any error in birth certificate information. It
was shown that the method is not limited to its traditional use of the four‐stage model of question‐response
(comprehension, retrieval, judgment, response). It also can incorporate sociological insight by examining the
structural features of the creation of data, and how these features impact data quality. The findings from this
study were used to create new federal recommendations for the abstraction of birth certificate data, with an
eye toward improving data quality.
REFERENCES
Blumberg S. J., & Cynamon M. L. (2001). Misreporting Medicaid enrollment: Results of three studies linking
telephone surveys to state administrative records. In M. L. Cynamon & R. A. Kulka (Eds.), Proceedings of the
Seventh Conference on Health Survey Research Methods (pp. 189–195). Hyattsville (MD): Department of Health
and Human Services, Publication No. (PHS) 01‐1013.
Davern, M., Call, K. T., Ziegenfuss, J., Davidson, G., Beebe, T., & Blewett, L. A. (2008). Validating health insurance
coverage survey estimates: A comparison between self‐reported coverage and administrative data records.
Public Opinion Quarterly, 72, 241–259.
Denney, J. T. (2010). Family and household formations and suicide in the United States. Journal of Marriage and
Family, 72, 202–213.
Edwards, W. S., & Cantor, D. (1991). Toward a response model in establishment surveys. In P. P. Biemer, R. M.
Groves, L. E. Lyberg, N. A. Mathiowetz, & S. Sudman (Eds.), Measurement error in surveys (pp. 211–233). New
York: John Wiley & Sons.
Klatsky, A. L. (2010). Alcohol and cardiovascular mortality: Common sense and scientific truth. Journal of the
American College of Cardiology, 55, 1336–1338.

194
Tourangeau, R., Rips, L. J., & Rasinski, K. (2000). The psychology of survey response. New York: Cambridge
University Press.
Willimack, D. K., & Nichols, E. (2001, August). Building an alternative response process model for business surveys.
Paper presented at the annual meeting of the American Statistical Association, 2001. Available at
www.amstat.org/Sections/Srms/Proceedings/y2001/Proceed/00071.pdf
Willimack, D. K., & Nichols, E. (2010). A hybrid response process model for business surveys. Journal of Official
Statistics, 26, 3–24 .
Willis, G. (2005). Cognitive interviewing: A tool for improving questionnaire design. Thousand Oaks, CA: Sage.

Proceedings of the 10th Conference on Health Survey Research Methods 195
Issues in Designing and Fielding High‐Quality Surveys of Physicians and Medical Group Practices
Carrie Klabunde (National Cancer Institute),1 Caroline McLeod (NOVA Research Company), and Gordon Willis (National Cancer Institute)
INTRODUCTION
Surveys of physicians and medical groups are widely regarded and frequently employed as a cost‐
effective and meaningful way to obtain information about many aspects of clinical care and the health care
settings in which care is delivered. This type of health survey is a particularly important source of
information on physicians’ knowledge, attitudes, opinions, and practices related to new or controversial
technologies, clinical practice guidelines, decision‐making regarding specific interventions, and
motivation/barriers to changing their clinical practices. Yet physicians are a challenging population to
survey, and surveys of physicians generally attain response rates that are ten or more percentage points
lower than those of the general population; further, recent evidence suggests that response rates to
physician surveys may be declining. Given the central role of physicians in implementing new standards of
care, guidelines, new technologies, and health care reform, obtaining information about their practices and
perspectives via surveys will remain a critical need for health services and policy researchers.
In November 2010, the National Cancer Institute convened a one‐and‐a‐half day Provider Survey
Methods Workshop to review and discuss current methodologies in designing and fielding large‐scale
surveys of physicians and medical group practices, as a means of informing future efforts in developing
valid, high‐quality provider surveys. Goals of the workshop were to
Describe methods used in fielding and reporting on large‐scale surveys of physicians and medical
group practices published in the U.S. during the period 2000–2010.
Identify and discuss the most effective methodologies for fielding valid, high‐quality surveys among
physicians and medical group practices.
Highlight opportunities for methods research in surveys of physicians and medical group practices.
Consider the need to develop reporting standards to enhance understanding of the methods used in
surveys of physicians and medical group practices and assessments of survey quality.
The workshop was organized around four topics: (1) sample frames for surveying physicians and
medical practices, (2) point of contact and survey administration modes, (3) respondent incentives, and (4)
questionnaire design, topic, and burden. Prior to the workshop, a literature review to identify publications
involving completed surveys and methodological studies was conducted. During the workshop,
presentations covering the four topic areas were provided by 15 subject matter experts, with extensive
discussion by workshop participants following each session. A three‐member expert panel offered
reflections and prompted further discussion on future prospects for conducting high‐quality surveys of
physicians and medical practices. This paper summarizes key findings and recommendations from both the
literature review and the workshop.
1 Contact author: Applied Research Program, Division of Cancer Control and Population Sciences, National Cancer Institute,
EPN 4005; 6130 Executive Boulevard, Bethesda, MD 20892‐7344. Phone: 301‐402‐3362; fax: 301‐435‐3710; e‐mail:

196
LITERATURE REVIEW
A background literature review was conducted in 2010 to identify methodological variables that may be
associated with the quality of provider survey data. The review was restricted to large‐scale health care
provider surveys fielded between 1998 and 2009 (and published between 2000–2010) that had at least 500 or
more respondents. A search of the peer‐reviewed and the “grey” literature (e.g., unpublished reports available
on the Internet) was conducted. The source of the peer‐reviewed literature was PubMed, whereas Google and
federal agency Web sites were the sources of the grey literature search. For all information sources, the
following search terms were used: physician, health care provider, nurse, physician assistant, survey, questionnaire,
national, methods, incentive, and response rate. Over 6,700 citations initially were identified. Eighty‐eight survey
projects met the eligibility criteria, and detailed information about them was abstracted, including survey
topic, dates fielded, sponsor, type of provider surveyed, sampling frame, initial sample size, survey mode,
survey length, incentive, follow‐up strategy, response rate, and method for calculating the response rate.
In over 90% of the survey projects, physicians (as opposed to, for example, medical practices) were the
provider type surveyed. Eighty percent of survey projects used the American Medical Association (AMA)
Physician Masterfile, specialty society mailing lists, or state licensing board databases for the sampling frame.
Seventy‐five percent of survey projects employed mail as the survey administration mode, 11% used the Web,
8% used more than one mode, and only 2% used telephone. Forty‐three percent of survey projects reported the
length of the survey in terms of the number of items, 25% reported the number of pages, and 31% did not
include information about survey length or burden. Monetary incentives were more common than
nonmonetary, and contingent incentives were more common than noncontingent. However, for nearly half of
the survey projects, either no incentive was used or the type of incentive was not specified. The most common
method of nonrespondent follow‐up was an additional mailing, followed by the use of an additional mailing
plus telephone reminder calls. In nearly 25% of the survey projects, however, either no follow‐up method was
used or this was not mentioned in the survey description. Nearly half of the surveys in the literature review
achieved a response rate of 60% or higher, but reporting of response rates was inconsistent, and it was not
always clear from the survey documentation whether a response rate (versus a cooperation rate) had been
computed. Further, whether a response rate fit any particular standard definition as defined by the American
Association for Public Opinion Research (AAPOR) often was unspecified. In particular, publications tended to
lack information concerning whether providers who could not be located were included or excluded from the
denominators of response rates, and eligibility was not always clearly described.
KEY DISCUSSION POINTS FROM THE WORKSHOP
Sample Frame
In surveys of physicians, particularly those that are national in scope, the AMA Physician Masterfile has
been the most commonly used sample frame, as this source is regarded by many researchers as providing a
high level of coverage. On the other hand, the Masterfile also has the drawback of containing a considerable
amount of out‐of‐date information, which poses challenges to survey researchers who require accurate
eligibility and contact information for fielding a valid and efficient physician survey. Workshop attendees
agreed that linkages of survey samples drawn from the Masterfile to other physician databases, such as the
American Medical Information (AMI) or National Provider Identifier (NPI) files, might provide a cost‐
effective means for obtaining up‐to‐date eligibility and contact information but that such methods are yet to
be developed.

Proceedings of the 10th Conference on Health Survey Research Methods 197
Another conclusion was that identification of appropriate sample frames for surveys of medical groups,
as opposed to individual clinicians, has proved to be particularly challenging. No single, comprehensive
national database for the study of medical groups in the U.S. exists. As it is increasingly important to obtain
information from groups of providers, there is need for a single sample frame that enumerates both
physicians and the organizations in which these physicians provide clinical care. Given the decentralized
nature of health care delivery in the U.S., it is likely that one or more federal government agencies would
need to take a lead role in creating and maintaining a comprehensive national sample frame of physicians
nested within medical groups and other health care organizations.
Survey Administration Mode
Consistent with the findings from the literature review, workshop attendees noted that over the past
decade, most large‐scale provider surveys have used mail as the administration mode. Telephone surveys,
especially of physicians, have become exceedingly rare. Further, compared with mail surveys, those
conducted by Web or e‐mail attain lower response rates. A small proportion of provider surveys have been
conducted using more than one administration mode. It is not clear, however, whether offering a choice of
mode results in higher response rates, and it is possible that providing choice sometimes lowers response
rate. Given growing use of the Internet, it will be important in designing future provider surveys to
optimize a mixed‐mode approach (i.e., mail and Web). It was suggested that mode will undergo dramatic
change over the near future and that 15 or so years from now, all surveys (including those of providers)
essentially will be paperless.
Incentives
Presentations and discussion at the workshop suggested that in surveys of physicians, use of monetary
incentives appears to contribute to higher response rates than do nonmonetary incentives. Likewise,
noncontingent incentives (those normally delivered prior to survey completion) appear to contribute to
higher response rates than do contingent incentives (those delivered after completion). A major theme
emerging from the workshop was that the optimal or ideal monetary incentive for surveys of physicians has
not been well established. It is clear, though, that incentives rarely take into account other staff in the
physician’s office who serve as gatekeepers and who themselves may need to be incentivized. The attendees
agreed that there is a critical need for further methodological study to determine how best to optimize
incentives in provider surveys and that this work should include gatekeepers in medical practices.
Follow‐up Strategy
Although it is widely acknowledged that follow‐up of nonrespondents is an important component of
the survey process, workshop participants felt that it is not known which follow‐up strategies are the most
effective in surveys of physicians and medical groups. As made clear by the literature review, well‐
documented studies have reported a variety of follow‐up strategies, including increasing the intensity of use
of the initial contact mode (e.g., repeated telephone calls), diversifying the contact mode (e.g., use of both
telephone and mail), and offering additional incentives to nonrespondents. However, follow‐up strategies
are not consistently documented in survey publications and do not appear to have been empirically tested
in a systematic way. Therefore, a major conclusion from the workshop was that a promising area for future
research would entail assessing the effectiveness and efficiency of various follow‐up strategies for
improving response in surveys of physicians and medical groups.

198
Questionnaire Design, Topic, & Burden
The quality of survey data can be optimized through carefully designed questionnaires that address a
topic salient to the respondent and impose low response burden. Pretesting strategies such as cognitive
testing, focus groups, and pilot studies are important tools for informing questionnaire design and assessing
topic salience and response burden. Yet, our literature review made clear that in most literature describing
surveys of physicians and medical groups, there is a general lack of detail about the questionnaire design
process, with the exception of surveys sponsored by federal agencies. Moreover, there has been no
systematic attempt to conduct research to determine how questionnaire design, topic, and burden influence
the data quality within health care provider surveys. Nevertheless, workshop participants suggested it is
likely that time‐pressured physicians respond best to survey questions that are presented in a clear, concise,
logical manner, and to response formats that minimize burden. Further, researchers should give
consideration to identifying practice staff other than the physician who might be able to respond to certain
questions as a means of minimizing burden on busy clinicians.
Response Rates
Reiterating the literature review, workshop presentations and discussion concluded that there is poor
and variable documentation of response rates in literature describing surveys of physicians and medical
groups, even though researchers themselves, journal editors, and journal reviewers tend to regard response
rate as a key indicator of survey quality. In particular, participants noted that even when response rates are
reported, further scrutiny may reveal that the reported “response rate” is actually a (more liberal)
“cooperation rate.” Few papers have reported both measures, and the AAPOR standards for calculating
survey response rates are seldom cited. The poor and variable documentation of response rates makes it
difficult to compare response rates across surveys or to draw conclusions about the quality of the data
collected in the survey.
CONCLUSIONS
In this paper, we summarize both the results of a literature review on methods used in fielding and
reporting on large‐scale surveys of physicians and medical group practices conducted in the U.S. during the
last decade and discussion points from a workshop convened by the National Cancer Institute in November
2010 to inform future efforts in developing and fielding valid, high‐quality surveys of health care providers.
Key conclusions from the review and workshop were that there is great need for
1. Improved sample frame databases, especially to allow study of providers nested within health care
organizations.
2. Empirical study of how to optimize mixed‐mode surveys (i.e., mail and Web) of health care
providers, given that mail remains a viable mode and the Web is anticipated to become increasingly
prominent over the next decade.
3. Empirical study of incentives and their utility among gatekeepers, especially within surveys of
medical group practices.
4. Empirical study of factors that motivate or impede the participation of physicians and other health
care providers in survey research.
5. Most importantly, better documentation in journal articles and other literature of the methods used
in health care provider surveys, particularly of pretesting procedures, follow‐up strategies, and
response rate calculations.

Proceedings of the 10th Conference on Health Survey Research Methods 199
Collection of Biomarkers and Linkage of Administrative Data in the Survey of Health, Ageing and Retirement in Europe
Barbara Schaan and Julie Korbmacher (Mannheim Research Institute for the Economics of Aging)
INTRODUCTION
Population aging in Europe is one the major challenges of the 21st century. Up to now, we have
insufficient information to understand how population aging affects the living conditions of older people
and their families, and we do not know much about how state policies may influence these living
conditions. In order to tackle this challenge, the European Commission placed a call to researchers in Europe
to build up infrastructures to learn more about our aging societies. Following this call, the Survey of Health,
Ageing and Retirement in Europe (SHARE) explores Europe’s “natural laboratories” across many scientific
disciplines and over time, as SHARE is designed as a panel survey. The infrastructure created by SHARE
provides a rich data source for evidence‐based policies.
SHARE became an innovative and unique infrastructure as it combines three major strengths: First,
SHARE is ex ante harmonized across countries. This allows researchers to compare the effects of different
health and welfare systems in Europe on individuals as well as on families. Second, SHARE is
multidisciplinary: SHARE researchers come from many different disciplines such as demography,
economics, sociology, epidemiology, psychology, gerontology, medicine, and public health. SHARE aims to
fill the research gap of the interaction between health and socioeconomic factors. Third, SHARE is a
longitudinal study. Since aging is a process and not a state, the same individuals are interviewed repeatedly
every two years, enabling researchers to learn more about individual aging processes and how these
processes are influenced by ongoing political and social changes.
The SHARE success story started in 2004 when the first interviews were conducted in Sweden,
Denmark, The Netherlands, Germany, Belgium, France, Switzerland, Austria, Spain, Italy, and Greece. Two
years later, SHARE started its longitudinal dimension by re‐interviewing respondents from the first wave.
Additionally, Ireland, Czech Republic, Poland, and Israel joined the SHARE survey. In wave 3, SHARE
collected life histories from the wave 1 and wave 2 respondents—the so‐called SHARELIFE project. At that
point, SHARE mainly was funded by the EU framework programmes 5 to 7 and the U.S. National Institute
on Aging (NIA; for a full list of funding institutions, see www.share‐project.org) and collected more than
100,000 individual interviews from Europeans age 50 and older. Wave 3 also marked the beginning of a
pilot project within SHARE: the linkage of administrative data from the German Pension Fund (Deutsche
Renterversicherung [DRV]) to SHARE survey data. This ongoing pilot project is funded by the German
Volkswagen Foundation.
Currently, the panel data of wave 4 is being collected and includes some further additions and novelties.
Five new countries joined the SHARE family: Portugal, Luxemburg, Slovenia, Hungary, and Estonia. The
sample in many SHARE countries was expanded, resulting in a much larger sample sizes in these countries.
Furthermore, a new social network module enriches the SHARE questionnaire. Last but not least, SHARE
started collecting biomarkers in a German pilot project, also funded by the Volkswagen Foundation.
SHARE is a member of a family of aging surveys around the world, such as the U.S. Health and
Retirement Study (HRS) or the English Longitudinal Study on Ageing (ELSA), and stimulated follow‐up
projects all around the world, especially in Asia (e.g., the Longitudinal Ageing Study in India [LASI], the

200
Korean Longitudinal Study of Aging [KLoSA], the Japanese Study on Aging and Retirement [J‐STAR], the
Chinese Health and Retirement Longitudinal Study [CHARLS]). The common aim of these sister studies is to
provide researchers with comparable data that enable empirical research from a cross‐cultural perspective.
CLOSING THE GAP—A NEW PERSPECTIVE OF EMPIRICAL RESEARCH ON AGING IN GERMANY
While aging research has made several remarkable achievements in many areas (an overview can be
found in Wahl & Mollenkopf, 2007), there is still need for a better integration of previous results and future
research projects across disciplines that takes into account the complex interdependences between biological‐
medical and socioeconomic factors in the aging process, both at individual and societal levels.
This research gap is the starting point for a German pilot project within SHARE, which is funded by the
Volkswagen Foundation and will be expanded to more participating countries. This project exploits the
existing SHARE data infrastructure in order to create a comprehensive database, consisting of the following:
1. Information on the current living conditions from waves 1, 2, and 4 of SHARE
2. Retrospective life histories from wave 3 (SHARELIFE)
3. Administrative process data from the German Pension Fund
4. Objectively measured biomarkers
This generates a basis for the integration of interdisciplinary research on aging, since the separation
between medical‐biological and socio‐gerontological research on aging is an impediment to the
development of measures that help improve the quality of life of older individuals.
Our pilot project focuses on intervention points in the life cycle. We understand both medical and
socioeconomic interventions, which can—sometimes with a substantial time lag—affect the morbidity,
mortality, and quality of life of persons at age 50+. A “social management” of aging processes must address
such intervention points, and in most cases, the effects of such interventions depend on interrelated health
and socioeconomic factors.
While many correlations are known, it is not well understood which concrete causal mechanisms drive
the interactions between interventions and environment; neither is well understood which interventions are
the most effective in improving the quality of life. For example, it is still not clear
What causal and especially biological mechanisms are the basis of the observed strong relationship
between socioeconomic status and health;
How measures of social policy (e.g., reducing eligibility periods for unemployment benefits for older
employees by the German Hartz IV laws) affect the health of older persons; and
How the interaction between biological processes of aging and individual attitudes and expectations
affects health behaviors (e.g., with regard to prevention).
These three examples demonstrate that a better understanding of causal mechanisms—and this implies
better recommendations with respect to interventions—only can be reached by combining medical‐biological
insights with knowledge about the socioeconomic environment of individuals.
Examples for extremely fruitful combinations of biomedical and socioeconomic research and proof of its
successes come so far most often from the United States. Two examples include the Aging Center of the
RAND Corporation in Santa Monica, California, and the very successful Schools of Public Health—for

Proceedings of the 10th Conference on Health Survey Research Methods 201
example, at Harvard or at Johns Hopkins University. They provide role models for our pilot project and
show that we pursue a very realistic goal.
This pilot project includes several project partners: the German Pension Fund (DRV), the Network
Aging Research (NAR, an interdisciplinary research network on aging locted in Heidelberg and Mannheim),
and the German Cancer Research Center in Heidelberg (“Deutsches Krebsforschungszentrum,” [DKFZ]).
The project is divided into two parts: part one is the collection and compilation of an empirical database,
which will be available free of cost to the research community. The second part of the project enfolds the
analysis of the data regarding certain research questions. Special attention will focus on two areas of
research: aging research (as described above) and methodological research.
LINKAGE OF ADMINISTRATIVE DATA WITH SHARE
Survey data can cover a wide range of topics. However, the information provided by respondents is
often incomplete or inaccurate. On the other hand, administrative data is—in an ideal world—complete and
accurate. The disadvantage of administrative data is that the information is limited to a certain topic only.
Linking survey data with administrative data is a way to combine the best of both worlds, which offers
several benefits.
1. Respondent self‐reports are often subject to recall bias. Comparing administrative data with survey
data can help to estimate the extent of the recall bias or to validate the survey data.
2. The linkage leads to an improved measurement of the explanatory and dependent variables. This
reduces the bias and increases the precision of model estimates.
3. Using administrative data can reduce respondent burden. For instance, aging surveys can benefit
from adding Social Security records to explain retirement behavior or measurement of economic
resources during retirement. Doctors’ or health insurance records can be used to improve the
measurement of health.
Experience from other countries shows the great value of the combination of survey data with
administrative health and social records (e.g., Lillard & Farmer, 1997).
Since 2001, the access to administrative data for research reasons is much easier in Germany due to the
new Research Data Centers (“Forschungsdatenzentren” [FDZ] ; Gramlich, Bachteler, Schimpl‐Neimanns, &
Schnell, 2010). The goal of the cooperation project between SHARE and the German Pension Fund (DRV) is
to link survey data with administrative records held by the DRV. The method of linking different data
sources depends on legal as well as technical possibilities of each single data set. First, one has to define the
type of data linkage:
Link data sources of the same person
Link data sources of people who are similar (in a statistical sense)
The linkage project within SHARE is based on a direct linkage, which means that different data sources
from exactly the same person will be linked. The starting point of this project is people who participated in
the SHARE survey. By means of the respondent’s Social Security number, which is collected with an extra
form during the interview, it is possible to identify the records of the respondents in the DRV database,
which is primarily used to calculate the entitlements and value of public pension benefits.
For research purposes, the DRV allocates a scientific use file that includes a random sample of all
records (for privacy reasons with less detailed information on the individual level). For SHARE, the DRV
202
creates a data set in exactly the same format as the scientific use file that consists of the SHARE respondents
who gave their consent to the linkage.
The data consist of two parts: The first part includes sociodemographic characteristics (age, gender,
number and age of children, education) and information about important aspects for the calculation of the
public pension (as accumulated earning points [“Entgeltpunkte”]). The second part is implemented as a panel
database beginning in the year the person is age 14. Beginning on that date, very detailed information about
the working history (e.g., employment status and the corresponding earning points) is available on a
monthly basis, including unemployment periods and all activities or states that generate entitlements for
public pension. The information will be updated with each wave of SHARE so that the panel is continuing.
Privacy laws in Germany require respondents’ written consent when directly linking survey data with
administrative data on the individual level. The SHARE consent process consists of two steps:
1. The first step is verbal consent at the end of the SHARE interview. The respondents are asked for their
consent to link their survey data with the administrative data held by the DRV.
2. If the respondent gives her/his consent, the interviewer provides a consent document that has to be
filled out by the respondent her/himself. This document records the respondent’s SHARE
identification number, Social Security number (SSN), and information used to generate and/or check
the SSN. Most importantly, linkage is only possible with the respondent’s signature. The signed
document then is directly sent to the DRV.
The DRV collects the consent letters and creates a data set from all SHARE respondents who consented
to the linkage. In Germany, the SSN always is generated in the same way and includes date of birth, the first
character of the (birth) name, and a gender code. Therefore, with the help of additional information
collected on the consent form, it is possible to check whether the SSN is correct, to correct it if necessary, or
to generate it if the respondent gave consent but couldn’t provide the SSN.2
After the end of fieldwork, the DRV creates a file that consists of the respondents’ SHARE identification
numbers and SSNs. Based on this information, the DRV is able to identify the respondents’ records in their
database in order to create a scientific use file. For data protection reasons, the SSN is deleted from the
database after the file is generated.
The scientific use file is sent to SHARE and linked with the SHARE data using the SHARE identification
number. Mismatches can be identified by comparing demographics such as gender and year and month of
birth, which are included in the scientific use file as well as in the SHARE survey data. The project of linking
administrative data from the DRV already started in wave 3 by linking administrative information to
respondents´ self‐reported life histories (SHARELIFE).
BIOMARKERS IN SHARE
One recent development in social surveys is the inclusion of physical measurements and biomarkers. So
far, these measurements often have been taken in smaller nonrepresentative clinical studies. In the last
2 In contrast to the U.S., in Germany, the Social Security number is not so commonly used; nearly no one knows her/his
number by heart. Additionally, not every person in Germany has a Social Security number. People who were never subject to
social insurance contributions (e.g., because they are civil servants) are not included in the database. In 2009, the DRV held
accounts for about 66 million Germans, thus covering about 80% of the population.

Proceedings of the 10th Conference on Health Survey Research Methods 203
couple of years, more and more large‐scale surveys added physical measurements and biomarkers to their
programme since there is promising scientific value to it:
(1) Measurement of respondent health can be improved. Standard health questions in surveys often are subject to the respondent’s own interpretation (of the question), own evaluation or perception (of
health status), and own knowledge (of health status). The value of subjective health measurements is
undeniable, but some research questions require objective measurements. Biomarkers enable
researchers to validate respondent self‐reports and therefore study the amount and determinants of
under‐, over‐, and misreporting in large‐scale population surveys.
(2) Identification of causal relationships. Biomarkers can help to understand the complex relationships
between social status and health and their physiological pathways.
(3) Pre‐disease information. Biomarkers allow the identification of pre‐disease pathways, since the
physiological processes are often below the individual‘s threshold of perception.
A unique feature of SHARE is that it builds on existing European surveys by incorporating a wider
array of assessments that include multiple measures of self‐rated health, specific chronic and acute diseases,
symptoms, multiple measures of disability and functioning, mental health, cognitive function, and objective
measures of performance (grip strength, walking speed, chair stand, and peak‐flow). From the first wave on,
SHARE combined self‐reports on health with two physical performance measurements: grip strength and
walking speed. Additionally, respondents reported their height and weight. In wave 2, SHARE added peak‐
flow and chair stand to the questionnaire programme. In wave 3 (SHARELIFE), grip strength was the only
physical measurement included. Currently, wave 4 data is being collected, this time including grip strength,
peak‐flow, and self‐reported height and weight.
Wave 4 also adds biomarkers to the German part of the study. Measures included are height (in addition
to respondent self‐reported height), waist circumference, and blood pressure. Additionally, SHARE
Germany collects blood for dried blood spots (DBS), which will be analyzed in a laboratory with regard to
total cholesterol, HbA1c, and C‐reactive protein (CRP). The results from the lab then will be linked to the
SHARE data set. In summer 2010, SHARE Germany conducted a small wave 4 pretest (125 interviews; 86
individuals agreed to DBS sampling) to test the protocols and logistics of the biomarker collection as well as
the collaboration with the lab analyzing HbA1c and CRP and testing a method for cardiovascular disease
estimation (total cholesterol vs. ApoA1/ApoB). An overview of the health measures in SHARE can be found
in the table on the following page.
The ethics review board in Germany advised to provide respondents with the results of the blood spot
analyses via their GPs if requested. This adds further logistics to the project since respondents have to provide
their GPs’ addresses and special letters for the GPs had to be designed. Furthermore, respondents have the
option to narrow the range of possible analyses with their blood (e.g., exclusion of DNA analyses).
While the linkage of survey data and biomarkers is relatively new for Germany, experience from other
countries with respect to such linkage has been extremely positive (e.g., Crimmins & Seeman, 2001;
Weinstein & Willis, 2001). A similar pretest is planned for France in wave 5 with funds from a large French
public organization. Denmark is preparing for the collection of biomarkers in wave 5 as well. We expect to
combine all these efforts towards a full‐scale implementation of biomarker collection in wave 6 (2014–2015).

204
Overview of Physical Measurements & Biomarkers in SHARE
Wave 1 (2004/05) Wave 2 (2006/07) Wave 3 (2008/09) Wave 4 (2010/11)
PERFORMANCE MEASURES Grip strength yes yes yes yesLung strength (peak flow) — yes — yesWalking speed yes yes — —Chair stand — yes — —BIOMARKERS (Germany only) Height: Self‐reported — — — yes*Measured — — — yesWaist circumference — — — yesBlood pressure (seated) — — — yesBLOOD BIOMARKERS (DBS) (Germany only) HbA1c — — — yesC‐reactive protein — — — yesTotal cholesterol — — — Method still
to be decided ApoA1/ApoB — — — *In all countries.
CHALLENGES & OPPORTUNITIES
So far this pilot project—which combines survey data, biomarkers, and administrative data—is taking
place in Germany only.3 The expansion of linking administrative data and biomarkers over more SHARE
countries is planned for future waves (subject to funding).
Researchers who want to link administrative data to survey data have to answer four essential questions
first:
1. Which organisations are responsible for storing administrative data on pension contributions and
payments? On which level are they stored (e.g., national, regional)?
2. Is the access to individual administrative data on pension contributions and payments legally
possible for researchers?
3. Is the linkage of individual administrative data on pension contributions and payments with survey
data legally possible? Are there any special requirements regarding the ethical review in case of
linkage?
4. What are the conditions under which researchers are given access to linked data? Is access given
across borders?
Collecting and linking record data within one country is already a challenge, but it becomes even more
challenging when linkage is done in several countries and still expected to produce comparable data, since
each country has different regulations, data sources, and formats, which in the end all have to be combined
in a harmonized survey. It has to be ensured that data formats and contents are as comparable as possible,
although full comparability will never be achieved since data sources differ to a very large extent. Privacy
legislation poses another challenge: data dissemination rules often cannot follow the standards set by the
survey to which the administrative data are linked. But restricted access to linked data will make cross‐
3 Administrative data also has been successfully linked to SHARE survey data in Denmark, but no biomarkers have been
collected as of this writing.

Proceedings of the 10th Conference on Health Survey Research Methods 205
national analyses using linked data a very difficult enterprise. Thus, new cross‐national solutions of data
access that fulfill all legal confidentiality requirements are needed.
The collection of biomarkers is not less challenging in a multinational setting. Here, the essential
questions are as follows:
1. What are the conditions (e.g., written consent) under which blood samples can be obtained from
respondents in each country?
2. Are there any special requirements regarding the ethical review in case of collection of biomarkers?
3. Are trained interviewers allowed to take blood samples if minimally invasive methods (e.g., dried
blood spots) are used?
4. Can blood samples be sent across borders for analysis?
5. Is access of researchers to biomarker data subject to specific conditions?
SHARE is still investigating the specific requirements and limitations of collecting biomarkers across
Europe— and in some countries, breaking new ground—since the collection of biomarkers is far beyond
usual survey business.
The scientific value of collecting biomarkers and linking administrative data to representative survey
data is undeniable, especially with regard to aging research, but it also offers great opportunities for
methodological experiments and research. To get access to respondents’ administrative data records,
respondents need to provide their Social Security number. Asking for this (in some countries together with
written consent to link the data) may have adverse affects on retention and response rates. The same holds
for the collection of biomarkers, which increases respondent burden and may affect the willingness of
survey participants to cooperate in future waves. To shed more light on this issue of nonresponse, SHARE is
conducting some fascinating experiments:
All German SHARE respondents who participated in previous waves were asked for their Social
Security number and for their participation in collecting biomarkers. Since these are panel
respondents, we already have a great variety of information about them, which allows us to study
determinants of nonresponse.
Wave 4 adds a large refresher sample to the study in Germany. Since not all respondents from the
refresher sample will be asked to participate in administrative data linkage and biomarker
collection, we are able to compare those who participated with those who were not asked in order to
identify potential biases caused by the introduction of record linkage and biomarkers.
SHARE also is experimenting with different incentives. We will examine the effect of unconditional
monetary incentives on respondents’ willingness to participate in the study. Respondents from the
refresher sample will be randomly selected into three different treatment groups and a control group.
Each treatment group will receive a different amount of money (either 10, 20, or 40 Euros) in advance
together with a cover letter introducing the SHARE study. The control group receives a cover letter
only (no monetary incentive).4 This experiment will allow researchers to evaluate whether monetary
incentives contribute to increasing participation rates in general, but it will be particularly interesting
to examine the effect of incentives on participation rates with regard to collecting biomarkers and
linking administrative data.
4 This incentive experiment will not take place in sampling units with less than 10,000 inhabitants.

206
Collecting biomarkers and asking for SSNs is way beyond usual survey business—especially for
interviewers. Not all interviewers feel comfortable about such an enterprise. Hence, interviewer
effects also might play an important role. Although interviewers are the key to success of a survey,
often not much is known about interviewers’ attitudes towards the research projects and their
motives for working as an interviewer. Therefore, we asked all German SHARE interviewers to
participate in a paper‐and‐pencil study, the aim of which is to learn more about the interviewers
themselves. In particular, we are interested in the work experience they have, which strategies they
apply to cope with refusals, and how they feel about the collection of biomarkers and the linkage of
administrative data to find out how this affects their success in collecting the respective information.
As already pointed out, so far Germany is the only country to combine the four data sources:
1. Information on current living conditions from waves 1, 2, and 4 of SHARE
2. Retrospective life histories from wave 3 (SHARELIFE)
3. Administrative process data from the DRV
4. Objectively measured biomarkers
We expect the fieldwork for wave 4 to be finished in early fall 2011. Although we are still in an early
stage of fieldwork, preliminary results look very promising. After the end of the fieldwork, we will process
and link the colleted data and release it to the research community, and we will evaluate the processes,
logistics, and protocols to refine them for wave 5 if necessary. Detailed debriefing sessions with our
interviewers will help us identify problematic issues.
SHARE is looking toward an interesting future. More and more countries join the SHARE family, and
many of these will introduce the linkage of pension fund data and the collection of biomarkers and explore
the possibilities to link other process data (e.g., health insurance data) to SHARE.
REFERENCES
Crimmins, E. M., & Seeman, T. (2001). Integrating biology into demographic research on health and aging (with a
focus on the MacArthur Study of Successful Aging). In C. E. Finch, J. W. Vaupel, & K. Kinsella (Eds.), Cells
and surveys—Should biological measures be included in social research? (pp. 9–41). Washington, DC: National
Academy Press.
Gramlich, T., Bachteler, T., Schimpl‐Neimanns, B., & Schnell, R. (2010). Panelerhebungen der amtlichen statistik
als datenquellen für die wirtschafts‐ und sozialwissenschaften. Wirtschafts‐ und Sozialstatistisches Archiv, 4,
153–183.
Lillard, L. A., & Farmer, M. M. (1997). Linking Medicare with national survey data. Annals of Internal Medicine,
127, 691–695.
Wahl, H.‐W., & Mollenkopf, H. (2007). Alternsforschung am beginn des 21. hahrhunderts. Alterns‐ und
lebenslaufkonzeptionen im deutschsprachigen raum. Berlin: Akademische Verlagsanstalt.
Weinstein, M., & Willis, R. J. (2001). Stretching social surveys to include bioindicators: Possibilities for the Health
and Retirement Study, experience from the Taiwan Study of the Elderly. In C. E. Finch, J. W. Vaupel, & K.
Kinsella (Eds.), Cells and surveys—Should biological measures be included in social research? (pp. 250–275).
Washington, DC: National Academy Press.
Proceedings of the 10th Conference on Health Survey Research Methods 207
The National Health Interview Survey Redesign and Other Upcoming Changes
Jane F. Gentleman (National Center for Health Statistics)
A BRIEF DESCRIPTION OF TODAY’S NATIONAL HEALTH INTERVIEW SURVEY
The National Health Interview Survey (NHIS) went into the field for the first time in July 1957. From the
beginning, the survey was designed to represent the U.S. civilian noninstitutionalized population and serve
a diverse community rather than focus solely on selected policy or program needs. Topics presently covered
by the relatively stable core of the survey include health status, utilization of health care services, health
insurance coverage, health‐related behaviors (such as use of tobacco and alcohol), risk factors, and
demographic and socioeconomic information. In addition, supplemental questions on special topics are
added to the NHIS questionnaire each year, co‐sponsored by government agencies other than NCHS.
The most recent extensive revision of the NHIS questionnaire was in 1997. Since then, the NHIS has
collected data about all family members in the Family Section of the NHIS core, from one randomly selected
adult (the “sample adult”) in the Sample Adult Section, and about one randomly selected child (the “sample
child”) in the Sample Child Section. To improve precision of estimates for certain minority subpopulations,
the NHIS has been oversampling Black persons since 1985 and Hispanic persons since 1995. Also, since the
NHIS sample was last redesigned in 2006, Asian persons have been oversampled, and the probability of
selection as the sample adult has been increased for persons age ≥65 who are Hispanic, Black, or Asian.
The NHIS is in the field collecting data in face‐to‐face interviews virtually continuously throughout the
year. Telephone follow‐up sometimes is done to finish parts of the interview. The questionnaire is
administered in either English or Spanish. The Census Bureau has been NCHS’s contractor for fielding the
NHIS since the inception of the survey. Each year, NCHS releases one year of NHIS microdata online in
public use files that have been suitably altered to protect confidentiality. In recent years, this data release has
occurred less than six months after the end of the data collection year. Paradata describing the NHIS
interview process are released along with the annual public use files, and multiply imputed income and
earnings data are released about two months after the annual microdata release.
NHIS staff members analyze NHIS data and produce a variety of publications and presentations. In
particular, the NHIS Early Release Program produces two quarterly reports (on 15 key indicators and on
health insurance coverage), and one biannual report (on cell phone usage). To provide early access to
microdata by outside analysts, the Early Release Program also produces periodic preliminary NHIS
microdata files for use in the NCHS Research Data Center. The Early Release Program is so‐named because
its products are made available before the annual public use microdata files are released.
For more information about the NHIS, see www.cdc.gov/nchs/nhis.htm
For a list of NHIS supplements and their cosponsors, see
www.cdc.gov/nchs/nhis/supplements_cosponsors.htm
For more information about the NHIS Early Release Program, see www.cdc.gov/nchs/nhis/releases.htm
This paper describes two NHIS projects:
Planning for and development of the next NHIS sample redesign
Planning for and development of two systems for online real‐time analysis of NHIS microdata

208
PLANNING FOR & DEVELOPMENT OF THE NEXT NHIS SAMPLE REDESIGN
The NHIS sample is redesigned about every 10 years, a few years after the decennial census. The most
recent redesign was implemented in 2006. The next redesign is expected to be implemented in 2014 or 2015.
In planning for that next redesign, NCHS must decide the characteristics of the next NHIS sample and
whether to contract again with the Census Bureau or to contract with a private‐sector survey research firm
to field the survey. NCHS’s Board of Scientific Counselors (BSC), which is the official advisory committee
for NCHS, reviewed the NHIS program in 2008–2009, and one of the BSC recommendations was to consider
the possibility of using a private research firm. (See
www.cdc.gov/nchs/data/bsc/NHISFinalReportwithexecsumm112108.pdf)
To assist NCHS in planning the next NHIS redesign, an outside contractor is now developing
descriptions and cost models for various potential modifications to the NHIS sample design. This also will
assist NCHS in assessing the viability of using an outside private contractor to field the NHIS.
The current NHIS sample design uses an all‐area sampling frame of housing units that were in place at
the time of the 2000 Decennial Census. NHIS operates as a U.S. Code Title 15 survey, and as such, NHIS
does not have access to the Census Master Address File (MAF). Therefore, NHIS must do its own listing of
household addresses. Working for the NHIS, Census staff members go into areas designated by the Census
Bureau and make lists of the addresses of households in those areas. The NHIS sample is drawn from those
lists. Admittedly, the listing process is duplicative, but that is the tradeoff necessary for Title 15 surveys to
have access to and control over the addresses of the households in their samples. NHIS also obtains
information from building permits in order to be able to add new households to the sample.
As a Title 15 survey, NHIS may release sample addresses to its own contractors for additional data
collection, which would not be permitted if NHIS were a Title 13 survey. For example, the Medical
Expenditure Panel Survey (MEPS), conducted with the Agency for Healthcare Research and Quality
(AHRQ), “piggybacks” on the NHIS interviewed sample by using half of the NHIS interviewed households
as the MEPS sample frame. A private contractor fields MEPS, requiring addresses of NHIS‐interviewed
households to be given to the contractor. If NHIS were a Title 13 survey, those addresses could not be
provided to an outside private contractor; MEPS would have to be fielded by the Census Bureau.
The NHIS has PSUs in all states and the District of Columbia. State‐level estimates using NHIS data are
representative of their respective states, but because of sample size limitations and depending on the specific
estimates, some estimates may not have adequate precision to be useful. NCHS is able to release annual state‐
level estimates of health insurance coverage for the 20 largest states. By combining data from multiple NHIS
years, more state‐level estimates with adequate precision can often be produced. In its next redesign—sooner
if possible—NCHS is hoping and planning to increase the NHIS sample size within specific states to add
precision to estimates, and NCHS also wants to add PSUs to some states to add breadth of coverage. In the
field now, the 2011 NHIS has an increased sample size within all but the 18 largest states. In its next redesign—
sooner if possible—NCHS plans to add an address‐based telephone component to the NHIS sample to further
increase state‐specific sample sizes. The questionnaire for the telephone component will necessarily have to be
shorter, and the resulting data will be more complex to analyze, but there is a great and increasing demand
from policy makers and other analysts for state‐level NHIS estimates, and a telephone component will be a
less costly (and more flexible) way to provide that capability.

Proceedings of the 10th Conference on Health Survey Research Methods 209
Specifically, the outside contractor is developing cost models for the following hypothetical future NHIS
designs:
Basic designs
o A design the same as the current NHIS sample design
o Specific types of modifications of the current NHIS sample design
Designs providing improved state estimates
o With additional face‐to‐face interviews
o With additional telephone interviews
Designs collecting biomeasures (e.g., height, weight, blood spots, buccal cell swabs)
o Using interviewers
o Using specialists (such as technicians)
A multipurpose NHIS sample design: one that deals with the tradeoffs between improving state
estimates and collecting biomeasures and does some of each
A design such that a survey like the current NHIS would serve as the sample frame for a survey like
NCHS’s current National Health and Nutrition Examination Survey (NHANES)
Once the reports are received from the outside contractor, NCHS will make some difficult decisions, such
as whether and how to integrate NHIS with NHANES, what the next NHIS design will look like (if NHIS is
not integrated with NHANES), what the next integrated design will look like (if NHIS and NHANES are
integrated), and what contractual arrangements to make for fielding the future version of the NHIS.
In particular, an integrated NHIS and NHANES would be complex in many ways. Multiple contractors
would likely be necessary. Protecting confidentiality of some NHIS respondents would be more difficult
because some NHIS data would be linked to NHANES data, and NHANES is publicized in communities
where the survey is being conducted, so as to increase response rates. Such publicity also puts the primary
sampling units in the public domain. Also, the timeliness of releases of some NHIS data might be reduced
because NHANES now releases its data every two years, and NHIS releases its data every year; thus, linked
NHIS and NHANES microdata would have to be released using the less frequent release timeframe.
Analysis of the complex integrated data would be more complex, increasing analyst burden.
NHIS also must plan a necessary transition from using large amounts of listing to using the U.S. Postal
Service’s Delivery Sequence File and/or commercially‐available address files. Research will be required to
determine how best to use these address files to meet the specific needs of the NHIS, and it is hoped that
listing will be reduced to a minimum and be confined to selected rural areas only.
Further, developing plans for a new sample design is a lengthy and costly process. NHIS planners must
deal with perennial NCHS funding insufficiencies, uncertainties, unpredictability, and inconvenient timing
as they move forward to implementation of the next design.
PLANNING FOR & DEVELOPMENT OF TWO SYSTEMS FOR ONLINE REAL‐TIME ANALYSIS OF NHIS MICRODATA
Users of the National Health Interview Survey have several resources for accessing its microdata and
analytic products. Users interested in a particular health subject or in health survey methods can consult
appropriate reports and papers produced by NCHS analysts and by many others outside NCHS. Those who
wish to conduct their own NHIS analyses can use the online NHIS public use microdata files, which are
released once per year, along with thorough documentation, and are available free of charge. NHIS data

210
users also can analyze the preliminary NHIS microdata files (described above) that are made available in the
NCHS Research Data Center (RDC) before the annual public release. Further, they can use microdata from
the Integrated Health Interview Series (IHIS), which is a collection of selected NHIS variables that have been
“harmonized” to facilitate time‐trend analysis from the 1960s to the present. IHIS microdata are based on
NHIS public use files and are available free of charge from the IHIS Web site at www.ihis.us/ihis/. The IHIS
project provides extensive documentation and now has a tabulation capability. NHIS users whose analyses
require access to restricted NHIS (or other NCHS) variables that are not released publically can use the
NCHS RDC, which provides on‐site access facilities in Hyattsville, Maryland; in Atlanta; and at Census
Bureau RDCs across the country. The NCHS RDC also provides a capability for remote analysis of restricted
variables. Analyses conducted via these RDCs are limited and carefully supervised to protect
confidentiality. RDC users must submit and have approved a project proposal, and fees are charged. See
www.cdc.gov/rdc/ for more details about the NCHS RDC.
To provide additional mechanisms for analyzing NHIS data, NCHS is developing two online real‐time
analytic systems that will be publicly available without submission of project proposals and without charge:
System P will provide analyses of the same public use NHIS microdata files that are released online
each year.
System R will provide analyses of public use NHIS microdata plus selected restricted variables,
with a focus on state‐specific analyses. (The NHIS currently does not release state identifiers on its
public use files.) Analyses will not be “canned” but will be performed in real time “on demand”
from the user but with strict screening for disclosure avoidance before provision of the analyses.
These two new systems will complement the mechanisms and opportunities already available for access
to NHIS data and analyses. Many surveys already offer analytic capabilities like System P. However,
capabilities like System R are very rare because of the complexity of real‐time confidentiality screening for
analyses, which is an ongoing area of research.
The development of System R is motivated by the great and increasing demand for state‐level analysis.
Because health care is largely administered at the state level in the United States, state‐level analysis is
needed for research and for development and evaluation of health policies. In particular, monitoring the
effects of the new Patient Protection and Affordable Care Act will require state‐level analyses.
System P and System R will provide assorted analyses (fewer for System R because of disclosure
avoidance requirements). The analytic “wish list” includes descriptive statistics, outlier identification, multi‐
way cross tabs, significance tests, standard errors, confidence intervals, assorted graphs (scatter plots, bar
graphs, histograms, box plots, time trend graphs, U.S. maps displaying estimates by state, graphs able to
show results for very large sample sizes effectively, etc.), crude rates, directly‐standardized rates (using
selected standard populations or user‐provided standard populations), regressions, etc. These analytic
capabilities will be implemented in stages.
System P and System R both will use methods for variance estimation that account for the complex
sample design of the NHIS. Both systems will use NHIS microdata dating back to 1997 (when major changes
to the NHIS questionnaire were made), and both will add newly available NHIS microdata each year.
For System R, proper confidentiality screening is the most critical requirement. Analyses must be
screened to avoid disclosure before the results are shown to the user. Screening methods must be rigorous
and sophisticated to meet the strict confidentiality mandates for NCHS data. A cocktail of methods will be
used, some involving alteration of the underlying NHIS microdata files and some involving real‐time data

Proceedings of the 10th Conference on Health Survey Research Methods 211
perturbation and barriers to certain analyses. Special methods will be used to prevent “differencing attacks,”
in which malicious data users try to gain information about inappropriately small groups of individuals by
subtracting frequencies in one cross‐tabulation from frequencies in another.
Confidentiality screening methods for System R must take into account the separate public availability
of microdata from NHIS public use microdata files and linked files. NHIS has imposed nontrivial
restrictions on System R that will require it to use confidentiality screening methods that will not alter or
impose any concomitant new restrictions on the contents of public use NHIS microdata files or reduce the
excellent timeliness with which those public use files are released.
NCHS staff members are working closely with an outside contractor on the following phases of the
project to develop System R and System P:
Phase 1: Develop, describe, and demonstrate the effectiveness of methods for screening analyses
produced by System R that are sufficiently rigorous to meet NCHS’s high standards for disclosure
avoidance and confidentiality.
Phase 2:
o Develop and demonstrate System R. Produce appropriate documentation for use by those
maintaining the system and those using the system. Include instructions for adding new
capabilities and/or data to the system.
o Develop and demonstrate System P. Produce appropriate documentation for use by those
maintaining the system and those using the system. Include instructions for adding new
capabilities and/or data to the system.
o Delivery of System R and P may be carried out simultaneously.
Phase 3: Install and implement the new systems at NCHS.
Phase 4: Maintain the new systems and update them as new data and analytic capabilities are
added.
The methods developed in Phase 1 must be acceptable to NCHS for the development of System R to
continue to later phases of that project.
Many challenges will be encountered in developing System P and System R. For example, once ready
for public use, both systems will have to undergo a series of approvals to ensure that system security is
protected. Especially in the case of System R, this may take some time.
Development of disclosure avoidance methods for System R is one of the biggest challenges. Such
methods are being custom developed for System R to meet NCHS’s strict confidentiality requirements. They
must balance confidentiality needs with the need for the analyses to be sufficiently accurate and useful after
disclosure avoidance techniques are applied. Further, they must be effective, but a system that very often
refuses to let see users see requested analyses would be frustrating to users. Before going online, System R
will have to be approved by the NCHS Disclosure Review Board.
Obtaining adequate funding for development and maintenance of the two systems is another challenge,
given the uncertainties and limitations of the federal budget and of NCHS’s budget. These uncertainties
apply not just to amounts of funding but also to the timing of when funding will become available. For
example, augmentation of a survey’s sample size requires advance planning (e.g., for sample design
modification, hiring extra interviewers, and training new interviewers), and commitments sometimes have
to be made before funding has been confirmed.

212
CONCLUDING REMARKS
The National Center for Health Statistics is the nation’s official health statistics agency, and the NCHS
National Health Interview Survey is the primary source of information on the health of the civilian
noninstitutionalized population of the U.S. NCHS strives to meet the needs of its data users and thus to
promote public health through providing valuable data and data products. NCHS is committed to conducting
the NHIS and meeting the challenges of developing plans for the survey’s future, including developing its
next sample design and developing new user services such as online real‐time analytic systems.

Proceedings of the 10th Conference on Health Survey Research Methods 213
SESSION 4 DISCUSSION Linda Dimitropoulos (RTI International)
Research using health data is entering an exciting period where we will increasingly seek to supplement
primary data collection through surveys with various other types of data linking electronic data sets in new
ways to answer complex research questions. Supplementing survey data with other types of data is not new,
but the sheer volume of electronic data that has been collected to date and that is growing at a rapid pace
will change the way social scientists and health researchers work. For example, linking data sets, especially
those with medical records or images, can lead to extremely large data sets that can run into 100s of
terabytes or even a petabyte of data. Data sets of this size create challenges for those charged with the
management and analysis of the data. This trend will create the need for specialists who are expert in the
management and analysis of extreme data sets. This wealth of data will create both opportunities and
challenges that will change the way we think about and use health data going forward.
The health data sets of the future will draw from many sources. They will include data collected for
research purposes through traditional survey data collection methods and data collected for many other
purposes, such as administrative data and electronic medical record data. Health researchers will come to
rely more heavily on linking to administrative records, all‐payer claims data, electronic medical record data,
and other types of data collected for purposes other than research. There will be more access to clinical data
sets originally collected for purposes of patient care through electronic health records and personal health
records, health data generated by individuals through the use of Web and Smartphone applications, and
data collected through social media such as Twitter and Facebook and from Web sites such as
www.PatientsLikeMe.com. As the availability of electronic data sets becomes greater, so do the challenges
of making sure that the data are appropriate and of sufficient quality for research purposes. Understanding
the genesis of the data will be critical to assess the validity of the data. Those collected for purposes other
than research may not have been collected with the rigor necessary to support the conclusions that health
researchers need to draw. Researchers also will need to assess the appropriateness of the data to answer a
given research question. For example, electronic prescription data can tell us if a drug has been prescribed,
the pharmacy claims data can tell us if the prescription was paid for, pharmacy data can tell us if the
prescription was picked up, the patient can tell us if he or she took the medication, and a lab test result can
validate whether the patient self‐report is accurate.
This was an insightful set of papers that point to both exciting times now and in the future of health
research, but they also point to a number of exciting challenges ahead. Each paper stretched our thinking
about what is possible and identified some of the challenges and solutions we will face. The Schaan and
Korbmacher and the Von Korff papers discussed innovative ways to answer complex questions by linking
data sources and data types in innovative ways.
The Schaan and Korbmacher discussion of plans to link data collected by the Survey of Health, Ageing
and Retirement in Europe (SHARE), a panel survey that provides an important source of data for policy
analysis and research in Europe, to administrative records highlighted many of the challenges inherent in
linking data sets from multiple sources. The study is conducted cooperatively among 18 countries and
serves to create a rich source of cross‐cultural data. However, SHARE recently decided to attempt to link to
administrative data sets and add physiological measures to the data collection protocol. Linking to
administrative data is seen as a way to validate the survey data, to reduce bias, and to decrease respondent
burden, but there are specific challenges that health researchers need to address to ensure that the effort

214
results in a quality data set that is appropriate for addressing the research questions. The first challenge is
determining what the law will require in terms of variables available for matching and whether the goal is
to match records based on the personal identifiers or match records using a measure of statistical similarity.
The process the SHARE project followed of obtaining consent to link to the records and having a specific
scientific data set prepared is a familiar process to most researchers dealing in identifiable data, and it is
never straightforward. The real challenge comes when SHARE expands this approach to the other countries.
They will need to identify comparable administrative data sets in the partner countries, if they exist;
navigate the legal and ethical issues of linking the data, if it is permitted; and determine whether the
authority for granting permission is at the local, regional, or national level. The issues of sharing health data
in the U.S. mirror these challenges in many ways. There are both state and federal laws governing the use of
identifiable health information, and each organization holding a given data set offers a different set of
criteria that need to be met through some type of data use agreement. Data quality and consistency will be
added issues, especially with administrative data and other data that are collected for purposes other than
research.
The Von Korff paper also discussed the potential for data linkage to create valuable data sets that bring
together clinical information collected for treatment purposes, administrative data from payer claims,
genetic information from saliva and blood samples, and primary data collection to create data sets that may
be valuable for certain types of population health research. The data discussed in the paper comes from
many sources, including 15 health plans and research centers and about 370 providers. Data quality
questions were not discussed, but there are a number of questions that should be addressed. The question
that comes to mind regarding clinical data is how much variation is there in the types of electronic health
records used by providers to capture the information? Different systems have differing formats and collect
data in different ways. What kind of variability is there across health plans in how they collect genetic
information and biomarker data? How are the records matched? These should be critical questions for
researchers linking to these potentially rich sources of data.
The additional three papers focused on data quality and consistency. The Willson paper acknowledged
the increasing use of administrative data in health research and the need to evaluate the quality of these
data. Willson demonstrated that cognitive interviewing can be used to evaluate administrative data quality
by interviewing the staff that collects birth certificate data to learn more about the process and to identify
ways to improve the quality of basic birth record data. Reliance on administrative data to validate survey
data and to reduce recall bias assumes a level of quality that may not be warranted. Willson identified many
sources of variation in the ways these seemingly simple data are collected—staff interpreting the federal
standards differently, hospitals varying in their policies on how the forms should be completed, and missing
information derived by the staff using various methods to impute the data all affect data quality.
The Klabunde, McLeod, and Willis paper focused on identifying ways to improve survey data collection
among physicians. Physicians are an important source of data for understanding trends in knowledge,
practices, adoption and use of new technology, and, importantly for NCI, progress toward physician‐related
goals for reducing cancer burden. Physicians are also a challenging group to sample, recruit, and interview
for a number of reasons. This paper discusses a number of key issues including the need for a reliable
method of sampling physicians, citing that the American Medical Association Masterfile is out of date and
that there is no reliable way of sampling physicians working within organizations. Sampling issues aside, it
is increasingly difficult to contact physicians because of the layers of office staff that insulate them. The
study noted that over time, phone surveys have given way to mail surveys and that there is variable success
with Web‐based surveys. Identifying appropriate incentives is also a challenge and often fails to take into

Proceedings of the 10th Conference on Health Survey Research Methods 215
account the office staff that is key to getting access to physicians. Klabunde recommended that the federal
government find a solution to the sampling frame issue. The Centers for Medicare and Medicaid Services
requires physicians to have a national provider identification number to receive payment under the
Medicare program, which might serve as a starting point. It would not include providers that do not
participate in the program, however.
The National Health Interview Survey (NHIS) undergoes a sample redesign every 10 years. For this
redesign, the goals include improving the state estimates and adding the collection of biomeasures.
Redesigning the NHIS is rife with challenges and requires careful consideration of the options before
committing to a course of action. The concerns are driven by the need to ensure the quality of the data. The
redesign of the NHIS discussion by Gentleman described how NCHS is weighing its options in an effort to
preserve the quality of the data collected, given the challenges of uncertain funding for research and the
need for the federal government to identify ways to reduce the federal budget. There is no doubt that in the
future we will need to look for ways to streamline survey data collection at the national level and look to
existing data sources to fill the gaps.
The data sets of tomorrow will be larger and more complicated and will allow researchers to answer
questions they might not have been able to answer just 10 or 15 years ago. The sheer volume of electronic
health data that has been collected to date and that is seemingly growing exponentially will change the way
we think about and conduct health survey research.

216

Proceedings of the 10th Conference on Health Survey Research Methods 217
SESSION 4 SUMMARY Angela Jaszczak (NORC) and Nancy Walczak (Lewin Group)
Looking to the future, data sets used by health survey researchers for population‐based health and
policy research likely will consist of multiple different types of data from a wide range of sources. These
potentially include survey responses drawn from a variety of different methods, biomarkers or biomeasures
and related health information, and administrative data linked from public and private data repositories.
The diversity of future data and sources is noted in the omission of the word “survey” from the title of this
session. A number of new national‐level initiatives, some publicly funded and some proprietary, that are
aimed at promoting the development and adoption of electronic medical records (EMR) and all‐payer
claims databases point to a new and potentially beneficial role for electronic health data in future
population‐based health research. In particular, the health data sets of tomorrow will be more robust and
have the potential to link data to create family/household histories and to support longitudinal research.
BASIC THEMES IN THE FLOOR DISCUSSION: EXPANSION OF ELECTRONIC HEALTH DATA IS CREATING NEW OPPORTUNITIES & CHALLENGES
Three basic themes were identified and discussed in the floor discussion: new challenges and
opportunities, using existing methods in new circumstances, and ensuring the provenance of the data is
appropriate for its purpose.
The Expansion of Electronic Health Data Are Creating New Challenges & Opportunities
All papers presented provide new information on the challenges and opportunities that exist today
when working with multiple data sources and types of data.
Challenges:
Response rates: What does this mean when the context is not a survey?
Linkages: Informed consent, HIPAA.
Harmonizing data: Are items across data sets, across countries, comparable?
Evaluating quality of available data: Cognitive methods may be appropriate.
Quality assurance: For data we have not collected ourselves.
Appropriate for use: Data are reliable when recorded for a specific use (e.g., date of birth/death)
Opportunities:
Getting more robust data for multivariate analysis.
Efficiencies of scale, both in time and cost.
Getting more timely data, not relying on recall.
Technological innovation will dramatically reduce costs associated with primary data acquisition
Can create standing orders to collect supplemental or missing information.
Taking What We Know & Applying It to the New Circumstances to Advance the Practice
Another theme that surfaced in the papers and floor discussion was how to take already established
methods and apply them to the data sets of tomorrow to improve validity and confidence in the conclusions

218
drawn from them. For example, the paper by Willson applied established cognitive interviewing techniques
to understand the process of creating a birth record. The floor discussion raised the issue that the Birth
Information Collectors are trained to provide birth certificate data rather than additional research items.
This is reflected in the variability of the research data items.
The paper by Klabunde, McLeod, and Willis challenged the group to take what methodologists know
about physician surveys and think about their similarities to establishment surveys to better reflect the
realities and evolving structure of medical practices and care settings in today’s world. Among the questions
raised: Can some other members of an organization answer some questions, or do they have to be
physician‐answered? Sampling frames are problematic—the AMA Masterfile is frequently out of date. Also,
we should rethink the use of incentives and who should receive them, and we need more research to the
barriers to conducting research in physician practices.
In addition, as health data sets and surveys expand to include multiple data sources, health survey
researchers should implement traditional experiments and review past work by colleagues in their efforts to
grow the data sets. For example, there is current research on data set linkages that might serve as a resource
for future work.
Notably, the NHIS was mentioned in nearly every session of the Tenth Conference, and its upcoming
redesign was discussed at length in this session. The NHIS often is considered our “gold standard” for
survey data collection. Consequently, there was an extended discussion precipitated by the presentation of
the NHIS redesign and other upcoming changes. Two major changes were made to the initial structure of
the NHIS in 1997: (1) The instrument changed from paper‐and‐pencil to CAPI, and (2) The questionnaire
itself was revamped in major ways. The NHIS sample was redesigned to its current form a few years later
and implemented in 2006. The launch of the next redesigned survey is targeted for 2014–15. Discussion of
the NHIS raised interest in integrating NHIS with NHANES and the lessons learned from the earlier
integration with the MEPS. NHIS has been faithful to limiting household sample participation to two
surveys per year. Hence, integration is limited by sample use. Development costs and sample size expansion
continue to challenge the survey. Can the use of existing data sources—e.g., electronic health records—be
considered in the future to augment data collected by the in‐person interview?
The discussion of the Schaan paper focused on data linkage, informed consent, and the use of
biomeasures to validate available data. These are issues that we will face in the United States as we move
forward in collaborating with electronic health data aggregators. The author shared with us that
administrative data are not 100% complete and also described the techniques used to encrypt the data to
maintain privacy.
Purpose & Provenance
A final theme and guiding principle running through the session was the importance of understanding
the purpose and provenance of the data. For example, what was the original intended use of the
administrative data? What insures the quality of the data? When data are used for billing purposes, they are
subject to audits for correct coding and patient identification. They are not designed for health research, so
potentially “imputed” information such as income and race/ethnicity that may be on the record must be
qualified. For example, the pension data presented in the Schaan research is self‐validated because German
citizens are naturally incented to verify its accuracy and completeness so that their pension credits are
accumulated properly. Other variables on the record may not be self‐validating. For example, laboratory
data that survey researchers often think of as objective may be improperly transcribed or calibrated due to

Proceedings of the 10th Conference on Health Survey Research Methods 219
human error within the laboratory setting. We must be mindful that we understand the original intent of the
data and are extrapolating cautiously and insure that the data we use are “fit for use.”
FUTURE RESEARCH
While there is an extensive body of work based on the NHIS, research using the robust HMORN data
assets is just beginning to emerge. Von Korff described how widespread implementation of electronic health
data systems by health plans and providers—e.g., electronic medical records, health claim records, and
other health IT—has the potential to transform health research in the future. He shared how researchers at
the HMORN consortium supplement data collected via traditional methods such as computer‐assisted
telephone interviewing or mail surveys through linkages to health plan data stored in a virtual data
warehouse. The floor discussion inquired about access to the data by the research community at large.
Currently, the HMORN and member organizations are collaborating with numerous researchers, but
independent access to their information and data sets by third parties it not permitted.
RUNNING DIALOGUE
The papers presented on physician surveys and the NHIS redesign stimulated a running dialogue that
focused on the role of maintaining high response rates. In regards to this session, if the health data sets of
tomorrow are combined from multiple sources, we will need to consider new metrics other than response
rate for researchers and journal editors to use in order to evaluate the reliability and generalizability of
conclusions drawn from the data sources. It was posed to the group that instead of asking “What was the
response rate in the study?” should we be asking “Where did the data come from, and is this an appropriate
use of the data?” Towards the end of the session, there was recognition that the real issue is demonstrating
lack of nonresponse bias; response rate is simply an imperfect proxy.
CONCLUSION
Survey methods must keep pace with the developments in health information technology. Through
enhanced techniques for accessing and linking records maintained by medical establishments and
improvements in collecting biomeasures and environmental samples, the health data sets of tomorrow can
be more robust and more current. While there are gaps and limitations in all data sets, the papers in this
panel discussed some of the innovative ways that the emerging health information infrastructure is being
used to inform health care decisions at the patient care and policy levels.

220

Proceedings of the 10th Conference on Health Survey Research Methods 221
SESSION 5: Potential for Innovations with New Technology and Communication Tools
ORGANIZERS: David Dutwin (SSRS/Social Science Research Solutions), and Richard Kulka (Abt Associates)
CHAIR: David Dutwin

222

Proceedings of the 10th Conference on Health Survey Research Methods 223
The Social Media Opportunity in Health Research Reg Baker, Theo Downes‐Le Guin, and Erica Ruyle (Market Strategies International)
INTRODUCTION
As in the research industry as a whole, the model for federal health research over the last century has
been one that relies heavily on designing surveys and asking questions. Over about the last five years, the
emergence of interactive information‐sharing technologies (commonly called Web 2.0) and social media
applications has created the opportunity for several new approaches to research. These new approaches are
focused on observing or listening to people talk about their health and health issues in spontaneous
conversations on social networking sites rather than drawing subjects into structured surveys and asking
them questions. Our paper argues that although this type of research is not likely to replace surveys any
time soon, it might help us improve survey design and even yield insights that may be difficult to uncover
with traditional survey methods. We overview the three principal types of social media research now being
practiced and describe some ways health survey researchers might use them in their work.
SOCIAL MEDIA OVERVIEW
Kaplan and Haenlein (2010) define social media as “a group of Internet‐based applications that build on
the ideological and technological foundations of Web 2.0, which allows the creation and exchange of User
Generated Content” (p. 61). To put it another way, social media is a family of Web sites on which people can
share information and experiences with people they know or do not know. Sometimes those sites are so‐called
“walled gardens,” such as Facebook, where participants have control over with whom they interact and who
has access to content they post. Other sites, such as blogs and forums, are public or semi‐public (accessible
with a password, but once accessed, all content is discoverable), and users can post their own content and
comment on or simply read content posted by others. Although some private sites include one‐to‐one chat
features, content sharing on social media sites is mostly asynchronous and can be about anything and
everything. All sites, whether public or private, have varying Terms of Use that govern participant privacy
and appropriate use of posted information and content. These Terms can present both technical and ethical
restrictions on the aggregation and use of content by third parties. Nevertheless, the ability to capture and
analyze the content on social networking sites is at the heart of social media’s allure for researchers.
The growth of social networking sites and the popularity of social media has been the Internet story of
the last five years. For example, the digital marketing firm Econsultancy (2011) reports the following: the
professional networking site LinkedIn now has 100 million members; Twitter has over 175 million registered
users; YouTube averages about 300 million visitors per month; and over 5 billion images have been posted
to the photo sharing site Flickr. In one of the most oft‐cited examples of social media’s reach, enthusiasts
point out that if Facebook with its 640 million members (Pi Social Media, 2011) were a country, it would be
the third largest in the world after China and India. In the U.S., a recent Nielsen study (2010) estimated that
among adult Internet users in May 2010, 21% had started a blog and 55% had established a profile on a
social networking site, and they were spending an average of over six hours a month in social media. The
same study estimated the unique U.S. audience for social media Web sites at 148 million people.
Skeptics might argue that these numbers are not what they seem, that there is certain amount of hype in
some and that a closer look at their measurement methodologies raises legitimate questions about their
accuracy. Nonetheless, it is hard to argue against the rapid and widespread growth of social media of all

2
k
s
o
a
m
f
N
r
t
a
m
f
c
b
a
n
e
t
o
d
r
n
r
o
A
w
w
M
s
l
g
r
N
p
a
L
g
224
kinds. A more
something ca
only about 1%
and may com
more commo
This gene
for researcher
Nonetheless,
replacement m
the past centu
appearance o
media, answe
flows are rare
control to bei
but with a sli
a shift from a
new and grou
ethnographic
Google Fl
traditional da
over a six‐yea
diseases with
remarkable. T
no doubt are
research, Goo
online users t
Although not
with if not en
The gra
with flu‐like
early 2006,
METHODS
As the po
social networ
ikelihood tha
generated con
research goal
Nevertheless
provide an id
available rese
Leveraging o
generated in
e important c
lled The 1% R
% of social me
mment on, mo
nly and disp
eral murkine
rs accustome
social media
methodology
ury has been
of give‐and‐ta
ers to questio
ely one way.
ing just anoth
ightly differe
asking to liste
undbreaking
c principles to
lu Trends is
ata collection
ar period. It c
h flu‐like sym
The Google d
more accura
ogle Flu Tren
to create a va
t social medi
nhance health
aph plots cou
symptoms. B
late 2006 and
opularity of o
rks grows, th
at “organic”
ntent relevan
ls grows as w
, the Internet
dyllic land of
earch content
online conten
social media
criticism for a
Rule (Arthur,
edia users are
odify, or forw
aragingly, lu
ss of univers
ed to doing p
a research ha
y but as a com
n hierarchical
ake, creates a
ons sometime
In the social
her person w
ent objective.
ening, to hea
g, some resea
o online and
a useful exam
n methods. Th
compares the
mptoms. The
data are prod
ate, but the G
nds employs
alue for the re
a research pe
h research us
unts of Googl
Both measur
d early 2007,
online
he
user‐
nt to our
well.
t does not
f readily
t.
nt
a presents
anyone intere
, 2006). Also
e highly enga
ward someone
urkers) who a
se counts and
probability‐ba
as a useful an
mplement to
, with resear
a one‐way flo
es exist befor
l media conte
who observes,
The metaph
ring, and to c
rchers might
social media
mple of how
he figure bel
e volume of t
corresponde
duced in real
Google data a
data generat
esearcher tha
er se, it is a go
sing tradition
le searches ab
res show sign
early 2008, a
ested in using
known as the
aged and pos
e else’s conte
re passive pa
d extent of tru
ased research
nd important
o more traditi
chers asking
ow of inform
re we articula
ext, the resea
, has questio
hor for this m
conversing; w
t recognize th
a communitie
new Interne
ow shows an
those searche
ence between
time, while t
re an excelle
ted by a large
at is separate
ood example
nal methods.
bout flu and
nificant incre
and from the
g social medi
e 90:9:1 princ
st content; an
ent; and the re
articipants re
ue participat
h from high‐
t role to play
ional approa
g questions in
mation. With t
ate or ask tho
archer’s role s
ns, and some
model of resea
while this me
he basic tene
es.
et‐based meth
n aggregation
es with CDC
n searches an
the CDC dat
ent leading in
e (and in this
e and distinct
e of how Inter
CDC estima
ases in late 2
e early fall of
ia content as
ciple, this rule
nother 9% are
emaining 90%
ading what o
tion in social
‐quality samp
in health res
aches. The mo
n a way that,
the advent an
ose question
shifts away f
etimes partic
arch is freque
etaphor is of
ets as an adap
hods can exis
n of Google s
C estimates of
d flu prevale
ta come with
ndicator. Like
s case unconn
t from the us
rnet methodo
ates of the pre
2003, early 20
2008 until ab
a research so
e of thumb st
e moderately
% are observe
others post.
media is trou
ple frames.
search—not a
odel for resea
despite the
nd spread of
s, and inform
from a positio
cipates in dis
ently charact
ften character
ptation of
st alongside
search data a
f the prevalen
ence is quite
a lag. The C
e social medi
nected) grou
sers’ objective
ologies can c
evalence of d
005, late 2005
bout March o
ource is
tates that
engaged
ers (or,
ubling
as a
arch for
f social
mation
on of
scussions
terized as
rized as
about flu
nce of
CDC data
ia
up of
e.
coexist
diseases
5 through
of 2009.

Proceedings of the 10th Conference on Health Survey Research Methods 225
three challenges. The first is that we cannot always be present in all of the online discussions we might like
to research; the Internet never closes, and content creation occurs constantly and across the world. The
second is that the topics of interest to us as researchers may not be generating as much online content as we
would like or need; while people are talking, they may not be talking about our exact interests. And finally,
even when those topics of interest are being discussed, the content generated by users may be superficial or
not quite on mark for our research needs. Fortunately, there are methods and emerging best practices to
address all three of these issues.
Social Media Monitoring
The first method and most easily accessible form of social media research is the automated
monitoring of online conversations about health‐related issues in such naturally occurring online
communities as social networking sites, blogs, microblogs, forums, and chat rooms. Google Alerts
represents a basic but very common method for this type of monitoring; dozens of Web‐based
software tools known colloquially as “screen scrapers” allow the researcher to identify, aggregate,
and analyze content containing relevant keywords from a wide variety of social media sites. More
sophisticated platforms allow researchers to modify the basic search topics with related topics, as
well as add retrospective date filters and domain filters. Content then can be analyzed using
machine‐learning or natural language processing software capable of identifying broader themes
and, to a limited degree, even automating coding of slang, jargon, and irony. This software also can
help researchers understand the context of discussions, code it based on positive or negative
sentiment, and analyze key trends.
The first step in social media monitoring is to decide on a set of key search terms that define the
relevant content to be searched for and aggregated along with the time period during which the
monitoring will be active. The second step is to identify the types of online sources or even specific
sources to be targeted by the search. As noted above, these target sources mostly will be public sites
such as blogs, online forums, media sites, microblogs, open communities, and even semi‐private sites
(such as Facebook) where permission has been given. Depending on the topic, the researcher may
choose not to monitor some sites (such as mainstream media sites) because they already are only
reporting on online conversations and are not really part of the dialogue. Even this exclusion is far
from perfect since corporate (news release, Web site) and media (news site, editorial) content can be
widely repeated and adapted in “consumer conversation” sites such as forums. Furthermore,
mainstream media may be tagged as blogs or personal blogs depending on the content. At the analysis
stage, text processing and content analysis software charts the frequency, location, and context where
the search terms occur and attempts to assign a positive or negative sentiment to each. While
incredibly sophisticated compared to even a few years ago, monitoring platforms are viewed by most
as still in their technical infancy. Sentiment coding and thematic analyses, in particular, can be error
prone and misleading depending on the content (Wright, 2009). Currently, sarcasm and other
linguistic nuances can trip up these platforms and lead to incorrect sentiment coding.
As an example, for this paper, we engaged with a social media monitoring service to monitor
conversations that include the term “health care reform.” The search specifically excluded mainstream
media sites; however, no other filters or adjustments were added, creating what could be most
generously described as a broad, unrefined monitoring process. Over a 12‐month period from April
2010 through March of 2011, the service returned about 275,000 pieces of content. Roughly half of that
content came from blogs, with the remainder from online forums (17%), microblogs (14%), social

226
networks (10%), and news sites (7%). In terms of specific Web sites, the top three sources were Twitter,
Facebook, and the site for The Hill, a Washington‐based online newspaper focused on the U.S.
Congress. We conducted a sentiment analysis that showed net positive sentiment until August/
September of 2010, followed by negative sentiment up until the November elections and then a period
of up‐and‐down instability. In terms of specifics, the positive context for “health care reform” included
phases such as “reduce cost,” “save money,” “good thing,” “finest hour,” protect benefit,” and
“improve care.” Negative sentiment included phrases such as “repeal healthcare,” “worsen shortage,”
“not help Democrat,” “hurt Nevada,” and “hurt economy.”
Were this a “real” study, these initial results might cause us to do additional filtering of the sources
we targeted for inclusion, since the negative sentiment in particular seems to have an overemphasis
on the political implications of the health care debate. More importantly, despite starting our
analysis with an impressive 275,000 pieces of content, the software is only able to categorize less
than 1% of it accurately enough for us to report it with confidence. Further exploration of themes
and affect would require us to extract partial text of the content identified by the monitoring
platform, export that content into a more capable and unstructured text analysis application, and
devote considerable skilled resources to drawing further meaning from the content. We believe this
search demonstrates both the potential of social media monitoring as a research method as well as
the weaknesses of current software tools.
One such real study was done by Schillewaert and colleagues (2010). For their study, they selected 20 Web
sites that serve as forums where people with epilepsy and their caregivers can engage in spontaneous online
conversation about the disease. The researchers aggregated the content from these sites and looked at the
topics people discussed, the frequency of those topics, the sentiment and emotions that people have around
them, and the natural language patients and caregivers use when talking about seizures. The study results
have many uses. A key one for survey researchers is the need to carefully consider questionnaire wording so
interviewing is a more natural process that uses words and terminology to which epileptics can easily relate.
Netnography
A second method takes advantage of existing, naturally occurring online communities to understand a
topic in more detail than may be possible with other methods. Netnography, a termed coined by Kozinets
(2010), is a form of ethnography that adopts ethnographic methodologies to online. It is a technique in which
the researcher integrates into an existing community focused on a specific topic to learn about linguistic
conventions, motivations, and behaviors. Netnography is an inherently natural, unobtrusive way to study
social groups, eliciting deeply genuine and candid opinions on any given topic and observing group
interactions and behaviors as they take place. It capitalizes on the multidimensional nature of the online
experience to collect large amounts of information in less time than traditional ethnographies or surveys.
The first step in a netnography study is to locate and join an appropriate existing community or
communities. The netnographer settles in to understand how the community functions and what topics
members typically discuss. By carefully observing and participating in the community, the netnographer
builds rapport and trust, making it acceptable to ask direct research‐related questions. Through field notes,
entrenched experience, and a deep understanding of the online community, the netnographer emerges from
the field with rich observations and data. Not only does the netnographer pay attention to social relations
within the community but also to the connections among communities as well. In addition, just like an
ethnographer would pay attention to surroundings, the netnographer pays close attention to the layout of
the communities in question and uses that information to glean deeper insight.

Proceedings of the 10th Conference on Health Survey Research Methods 227
Analysis typically takes place throughout data collection in order to build on insights gained while in the
field. After the fieldwork is complete, all data are triangulated to understand the “native” point of view and
the meaning it has for the larger research issues. Netnography not only answers specific research questions but
also reveals new insights by following the natural flow of communication, sharing, and group interactions.
A potential opportunity in health studies might be an online community of sufferers of the same disease.
For example, the Web site www.patientslikeme.com offers a forum where people suffering from any one of
several chronic diseases discuss their symptoms, diagnoses, therapies, side effects, and the challenges of
living with the disease. Community members regularly update their profiles to note their conditions, the
drugs they are taking, and the quality of their lives. The site includes tools that make it possible to plot this
information over time. A netnographer might join the community, announce his or her presence, and
describe the research being undertaken. By observing over time the interaction among members and the
information they share, the netnographer gains insight into the patient journey—that is, the sequence of
experiences from the onset of symptoms through diagnosis, treatment, side effects, and learning to live with
the disease. In the process, the netnographer comes to understand more clearly how people talk about the
disease with one another and the sorts of questions that might be acceptable to ask to draw out thoughts
and feelings that otherwise might stay hidden.
Online Community
A third method makes it possible to study in detail topics that do not generate enough content on public
sites to drive meaningful analysis. This method relies on an artificial community created by the researcher
rather than a naturally occurring community of the sort used in monitoring and netnography. It is a more
proactive (and in a sense, traditional research) approach in which the researcher recruits individuals to join
an online community created for the specific purpose of engaging them on one or more research topics. The
researcher stimulates conversation within the community and prompts and listens while members give
direct feedback or interact and discuss issues amongst themselves. In some ways, this type of community is
like a focus group but with a good deal more interaction between and among community members and
over an extended period of time. Software tools have eased the burden of recruiting members, managing the
interaction, and reporting results.
Creating and then maintaining an effective online research community requires first and foremost an
authentic reason for the community to exist. A community can be centered around a shared experience such
as a disease, a brand that people love or hate, a topic of strong shared interest like video games, or just a
hobby. No form of community—whether private and built for researchers or public and organic—can
survive for long if community members don’t get something positive, engaging, or cathartic out of the
ongoing experience. In some instances, monetary incentives can sustain a short‐term community, but just as
in the physical world, social engagement with like‐minded individuals is a more compelling and enduring
basis for a community.
Online communities are built using software platforms that allow for all the bells and whistles of today’s
social media experience—a compelling home page or wall, group discussions, private discussions, private
moderator‐to‐participant interactions, multimedia posting, profiles and avatars, private online groups, polls
and surveys, and co‐creation sites including document sharing. The look and feel of communities is often
modeled after dominant social media sites like Facebook to provide an easy user experience. Members can be
recruited in any number of ways, both online and offline. Communities can last anywhere from a couple of
weeks to years and involve anywhere from a couple of dozen people to thousands. Regardless of size, many

228
communities are subject to the 1% Rule, so the community moderator(s) must work at engaging everyone
through such devices as asking members to confirm the ideas that active participants have put forth.
Once established, long‐term communities should take on a life of their own. A successful community
may be heavily moderated, but if lively and vital, it also will generate content and insights from direct
participant interaction. It’s important to create constant reasons for people to visit the community—fresh
questions, ideas, product previews, and so on. Longer‐term communities also will suffer attrition over time,
so ongoing recruiting and growth is a key part of maintenance on top of moderation.
A focused, short, small community is not unlike a focus group at the analysis stage. It produces a good
deal of raw material in the form of transcripts and short survey results along with the researcher’s own
memory of the types and tenor of interactions. The research synthesizes this down to key findings and
insights just as with a traditional focus group. A longer‐term larger community may end up looking more
like a broad social media monitoring engagement in that it can generate a large amount of content for
analysis. In this instance, the researcher may fall back on the same sort of text processing and sentiment
coding analytic tools that are typically used for monitoring.
CONCLUSIONS
In this paper, we have argued that social media analysis has long‐term potential for health research. We
also have described the three most popular social media research methods, all of which continue to develop
as does the social media framework itself. Social media monitoring can combine quantitative and qualitative
findings to provide leading indicators of health‐related trends. Online communities and netnography are
potential replacements/complements for traditional qualitative methods that help us explore issues in
greater depth. All are good tools for understanding health experiences over time. In some instances, they
may help provide access to otherwise hard‐to‐reach respondents.
While each of these methods may offer some opportunity for quantitative style analysis and reporting,
they are primarily qualitative techniques. Issues of coverage and data quality limit their utility for many
types of public sector quantitative research. Thus, the principal value of social media research methods at
this point in their evolution would seem to be the potential to deepen our understanding of how patients
and providers experience health issues so that we can design better surveys or to complement survey results
as a way to yield more compelling insights.
REFERENCES
Arthur, C. (2006, July 20). What is the 1% rule? The Guardian. Retrieved February 17, 2012, from
www.guardian.co.uk/technology/2006/jul/20/guardianweeklytechnologysection2
Econsultancy (2011). 20+ mind‐blowing social media statistics: One year later. Retrieved March 15, 2011, from
http://econsultancy.com/us/blog/7334‐social‐media‐statistics‐one‐year‐later
Kaplan, A. M., & Haenlein, M. (2010). Users of the world, unite! The challenges and opportunities of social media.
Business Horizons, 53, 59–68.
Kozinets, R. (2010). Netnography: Doing ethnographic research online. London: Sage.
The Nielsen Company. (2010). Internet and social media consumer insights. Retrieved March 11, 2011, from
www.nielsen.com/us/en/insights/press‐room/2010/nielsen_and_mckinsey.html
Pi Social Media. (2011). Some captivating social media stats—Now & then! Retrieved March 15, 2011, from
http://blog.pisocialmedia.com/some‐captivating‐social‐media‐stats‐%E2%80%93‐now‐then/

Proceedings of the 10th Conference on Health Survey Research Methods 229
Schillewaert, N., Verhaeghe, A., Van Campenout, R., and Hansen, R. (2010). Health 2.0: Social media as the central
nervous system for learning about epilepsy. Amsterdam: ESOMAR.
Wright, A. (2009, August 23). Mining the Web for feelings, not facts. New York Times. Retrieved February 17, 2012,
from http://www.nytimes.com/2009/08/24/technology/internet/24emotion.html?pagewanted=all

230

Proceedings of the 10th Conference on Health Survey Research Methods 231
Social Media, New Technologies, and the Future of Health Survey Research
Joe Murphy, Elizabeth Dean, Craig A. Hill, and Ashley Richards (RTI International)
This is an interesting time to conduct health surveys. The majority of our work to produce accurate and
current statistical information on health conditions, behaviors, and attitudes continues to be done using
telephone, mail, in‐person, and “traditional” Web survey techniques. Meanwhile, outside the realm of
survey research, much of the world has moved on to faster, newer, and more flexible means of
communication. Mobile technologies and social media platforms have outstripped more traditional
communication vehicles, outgrowing or supplanting, for example, old‐style telephones, radio, and
newsprint. For example, Facebook, the largest and most popular “social media” site, has over 500 million
registered users as of July 2010 (Facebook, 2011) and is now being used by 51% of all Americans age 12 and
over (51%), as compared to only 8% in 2008 (Webster, 2011).
For many reasons, it is increasingly difficult to efficiently collect high‐quality health survey data with
the “old” data collection methods. However, the “new” communication vehicles and platforms present both
promise and pitfalls as means by which to supplement, if not supplant, health survey data. It is, indeed, an
interesting time to conduct health surveys—and it is time to consider the role of new technologies and social
media in the future of health survey research.
TRADITIONAL METHODS IN TODAY’S SURVEY ENVIRONMENT
By now, virtually everyone in the survey research industry knows that response rates are in decline.
Scholars in the survey research field have been decrying that decline since at least the 1990s (de Heer, 1999;
Steeh, Kirgis, Cannon, & DeWitt, 2001; Tortora, 2004; Curtin, Presser, & Singer, 2005). Nonetheless, the
majority of major health surveys today are still conducted using traditional survey research techniques,
protocols, and modes. For example, most health survey data today are collected via in‐person, telephone, or
mail surveys, or through a Web survey formatted with the desktop user in mind. However, because of
declining response rates for these traditional modes and protocols, the validity of the data collected in such a
manner is increasingly suspect. One of the major concerns with traditional data collection modes is the threat
of nonresponse bias. The inability to reach respondents makes securing their response less likely and more
costly. Although the relationship between response rate and nonresponse bias is not straightforward, the
threat of nonresponse bias can increase when response rates decrease if the reason for nonresponse is
correlated with the key survey estimates (Groves, 2006). In addition, for better or worse, response rates are
sometimes seen, in the absence of other information, as a lone indication of quality. The Office of Management
and Budget (OMB) requires that surveys with a response rate under 80% conduct a nonresponse bias analysis
(OMB, 2006), which creates an additional concern for federally funded health surveys.
A variety of factors have been cited for declining response rates for health surveys, including increased
mistrust in requests for data from both government and corporations and increased reluctance to share
“personal data” with unknown persons or entities (e.g., Kim, Gerhenson, Glaser, & Smith, 2011). With the rise
of telemarketing prior to the advent of the Do Not Call list early in the 21st century, Americans were inundated
with calls that could be indiscernible at first from survey requests (Remington, 1992; Tourangeau, 2004). Junk
mail and spam e‐mail also were more prevalent than ever during this time (Kim, Jeong, Kim, & So, 2010;
Tynan, 2002). Technological advances, such as caller ID on both landlines and mobile phones, likely contribute
to declining cooperation and response rates (Kempf & Remington, 2007). Furthermore, the threat of computer
232
viruses from unknown sources and news stories about identity theft and stolen laptops containing individuals’
confidential information likely led to people becoming more protective of their personal information.
Challenges with nonresponse have not been limited to telephone surveys. In field surveys, controlled
access housing units with features such as gates, guards, and buzzer systems make it harder for individuals
to be contacted at their door thus producing higher rates of nonresponse (Cunningham et al., 2005). These
impediments must be overcome to successfully complete field data collection operations (Keesling, 2008).
Because individuals have restricted access in these ways, reaching them and collecting quality health survey
data has become more difficult and more costly (Curtin, Presser, & Singer, 2005).
Another major issue facing health survey data collection is the reduction in landline telephone coverage
(Blumberg & Luke, 2009). Surveys conducted by telephone, for example, run the risk of missing entire—but
important—segments of the population of interest if the “traditional” landline‐based telephone sampling
methods are not conjoined with (or replaced by) a cell phone frame. This is an especially important
consideration when conducting health surveys of young people or low‐income adults, for which landline
coverage is especially low. Holbrook, Green, and Krosnick (2003) suggest that telephone numbers can no
longer be relied upon for survey sampling.
ENTER THE NEW TECHNOLOGIES
To contemplate how new communication modes might improve health survey data collection,
understanding the nature of these systems is a prerequisite. Technologies that provide the most utility for
survey research are usually those already common in everyday life. With the decline in coverage (and
response) of traditional modes and the increase in coverage (and potential for response) with new modes,
numerous possibilities exist, including text message surveys, multimedia survey invitations sent to cell
phones, and surveys conducted through social networking sites. Paradoxically, while many people rely on
technologies like caller ID to avoid being contacted and sharing information about themselves in surveys,
they are simultaneously willing to share massive amounts of personal information on social networking
sites. Any given Facebook newsfeed, Twitter posting, or blog entry is likely to include reports of an
individual’s mood, health status, dietary intake, and physical activity—exactly the kinds of health‐related
information that survey researchers try to collect. Many of the new communication modes are based on
social networks, where individuals are connected as “friends” and share information, interests, and other
methods of interaction, and, at the extreme, the information being shared on these platforms can be utilized
with no survey interaction to answer health‐related questions. At the least, we should consider the role that
new technologies and social media, such as Facebook, Twitter, and Second Life, can play in supplementing
traditional survey research methods: sampling, tracing, and pretesting activities like focus groups and
cognitive interviews may benefit from new technologies.
Although there is a myriad of social networking systems available, we focus here on three diverse and
popular systems: Facebook, Twitter, and Second Life. We summarize what these systems are, who uses
them and how, emerging uses in survey research, and uses in adjacent fields that may be adapted for health
survey research purposes.
One of the most popular social networking services, Facebook is used to share information about
oneself, such as hometown, current city, education, employment, interests, and favorites. Users can post
photos, videos, notes, and status updates that are visible to other users. Facebook launched in February 2004

Proceedings of the 10th Conference on Health Survey Research Methods 233
and currently has over 500 million users (Facebook, 2011). A USA Today/Gallup Poll conducted with an
RDD sample of 1,487 adults in the U.S. found that Facebook is used by 43% of U.S. adults, but coverage is
highest among young adults: 73% of 18–29 year olds, 55% of 30–49 year‐olds, 33% of 50–64 year‐olds, and
17% of those 65 and older. It is used by 58% of college graduates but only 28% of those with a high school
degree or less. Of those with less than a $90,000 annual income, 41% use Facebook; 55% of those with an
income over $90,000 use it (Morales, 2011).
Facebook is already being used for tracing respondents on surveys such as The National Longitudinal
Study of Adolescent Health (Add Health) (Perkins, Granger, & Saleska, 2009) and the Longitudinal Studies
of Child Abuse and Neglect (LONGSCAN) (Nwadiuko, Isbell, Zolotor, Hussey, & Kotch, 2011). The process
for contacting panel members is not very different from searching telephone directories or change‐of‐
address databases and reaching out by traditional means. To obtain information, a survey researcher sets up
a Facebook page and searches for panel members using information such as name, location, and place of
education. The researcher does not “friend” the respondent but instead simply attempts to make positive
contact through Facebook’s private messaging system. There may be ethical concerns with this approach as
many view Facebook as a personal space, not to be violated by entities that are not personal acquaintances,
but studies to date have shown modest success with this approach.
Facebook currently lacks a sampling frame, meaning representative samples of its user population may be
infeasible at the moment. There have been efforts to compile and make available a frame of Facebook users
(Boges, 2010), but the quality and completeness of such data would require extensive evaluation before claims
of representation could be made. Some convenience sample surveys have been conducted on Facebook. For
example, MyType (2011) conducts personality tests and opinion surveys and has administered 700,000
completed interviews to date through self‐administered Web questionnaires on a third‐party application
within Facebook. Of those who have completed MyType surveys, 100,000 opted to publish their results on
their personal Facebook pages. Contrary to the traditional thinking about surveys and confidentiality, some
respondents may be motivated by the prospect of sharing their opinions with friends online. In fact, one study
of undergraduates found that even among those with a high level of concern about privacy, most have joined
online social networks (Acquisti & Gross, 2006). Part of the appeal of online social media is “empowering
exhibitionism”—the ability to reveal aspects of one’s personal life without shame (Koskela, 2004). It is a means
of counteracting top‐down vertical communication styles and rebelling against authoritarian sources of
information. Also empowering is the ability to construct one’s online identity through the choice of what to
share, including activities, beliefs, locations, preferences, etc. (Albrechtslund, 2008).
Facebook also may have utility for pretest recruitment. Prior research has discussed the utility of online
classified systems, such as Craigslist, for efficiently recruiting research subjects for pretesting activities such
as cognitive interviews (Murphy et al., 2007), and Facebook, with its expanding reach, may allow for
recruitment in similar ways. By advertising opportunities to participate in pretesting activities to individuals
with selected demographic characteristics, users would have the opportunity to simply click on an ad and
be put in touch with the survey organization.
The web of socially linked friends and acquaintances that comprise Facebook also lends itself well to
registry building, which is an important activity in many health studies. For instance, the World Trade
Center Health Registry aimed to contact approximately 400,000 individuals who were in the vicinity of the
World Trade Center in New York City during the attacks of September 11, 2001, or during the cleanup
operation (Murphy et al., 2007). Although a multifaceted approach was successful in compiling the registry
(Pulliam, Dolan, & Dean, 2010), it is likely that much of this work could have been streamlined by allowing
for respondent‐driven sample generation through spreading the word on Facebook. There is, for example, a

234
Transplant Registry developed by the government of Malaysia on Facebook, and the (US) National Cord
Blood Registry has over 15,000 “likes.”
In the adjacent field of market research, social media platforms like Facebook are used to measure
“buzz” about brands and to follow and track consumer behavior around the clock (Asberg, 2009; Jansen,
2009). One approach to tracking public opinion via Facebook is to analyze group wall posts using speech
content analysis (Casteleyen, Mottart, & Rutten, 2009). In addition to content analysis of wall posts, market
research data can be collected by engaging Facebook users in social media conversation. For example,
engaging Facebook users with brands is best driven by encouraging a community of consumers that is
focused around a particular brand (Smith, 2009).
Twitter is another emerging source of data on people’s health behaviors and attitudes. It is a widely
used micro‐blogging service, similar to the status update function of Facebook. Twitter users submit short
messages (“tweets”) of 140 characters or less. Tweets appear on the users’ profile pages and the profiles of
their followers. Most Twitter users tweet about personal life (72%), work life (62%), news (55%), and
“humorous or philosophical observations” (54%) (Smith & Rainie, 2010). Fewer, but significant numbers,
use Twitter to share photos (40%), videos (28%), or their location (24%).
Twitter launched in July 2006 and now has over 190 million users (Schonfeld, 2010). A 2010 survey of
2,257 adult Internet users that was conducted as part of The Pew Research Center’s Internet and American
Life Project revealed demographic characteristics of Twitter users. Twitter is used by 8% of U.S. adults who
use the Internet and is used at a higher rate by women (10% of Internet users) than men (7% of Internet
users). Among Internet users, Twitter is more likely to be used by young adults (14% of 18–29 year olds
compared to 7% of 30–49 year olds), by African Americans (13%) and Latinos (18%), and by urban dwellers
(11% compared to 8% suburban and 5% rural) (Smith & Rainie, 2010).
As opinion‐rich data sources like Twitter grow in popularity, they can be used to actively seek out and
understand public opinions. Opinion mining and sentiment analysis methods have been developed to
address the computational treatment of opinion, sentiment, and subjectivity in such information sources
(Pang & Lee, 2008). For instance, Chew and Eysenbach (2010) argued that while surveys are popular in
measuring public perceptions in emergencies, they can be costly and time consuming. They illustrated an
“infoveillance” approach that analyzed tweets using the terms “H1N1” and “swine flu” during the 2009
H1N1 pandemic. They conducted a content analysis of tweets and, through this process, validated Twitter
as a real‐time health‐trend tracking tool. They found that while H1N1‐related tweets were used primarily to
disseminate information from credible sources, they were also a source of attitudinal data and experiences.
The authors suggested that tweets can be used for real‐time content monitoring and may help health
authorities respond to public concerns.
Squiers et al. (2011) supplemented a survey of women age 40–74 with an analysis of social media posts
around the time of the controversy surrounding the U.S. Preventive Services Task Force (USPSTF) revised
breast cancer screening recommendations, developing a search syntax using keywords to identify relevant
blog posts and tweets. They found that, by this measure of public sentiment, the majority of mentions
related to the revised screening recommendations were either unsupportive or neutral about the new
USPSTF guidelines. Although this study did not compare tweet content and survey results directly, it did
demonstrate how the former can supplement the latter when investigating reactions to health guidelines.

Proceedings of the 10th Conference on Health Survey Research Methods 235
From adjacent fields of survey research, we find examples of utilizing social media to predict election
outcomes or match survey results. O’Connor and colleagues (2010) compared tweet sentiments with
consumer confidence and political opinion, and while the results varied, they found correlations are as high
as 80% for some comparisons. Tumasjan, Sprenger, Sandner, and Welpe (2010) found that the mere number
of tweets mentioning a political party reflected the election result in the 2010 German federal election. More
generally, a content analysis suggests that tweets can be used to measure political sentiment.
In addition to tracking trends and sentiments, Twitter can be used as a simple diary to track behaviors.
TweetWhatYouEat.com allows users to document their meals and caloric consumption. Alex Ressi, who
launched the Web site, suggests that tweeting is effective for improving behaviors because it adds a
“component of shame” by documenting behaviors and making them publicly available (Heussner, 2009).
Qwitter is a similar concept to TweetWhatYouEat. Launched in 2008 by Tobacco Free Florida, Qwitter users
tweet the number of cigarettes they smoke each day and view graphs of their use over time as they try to
quit (Heussner, 2009).
Researchers could benefit in several ways from conducting studies using Twitter diary methods. If the
sample members were already active Twitter users, respondents would presumably enjoy tweeting and
would be accustomed to using this method of reporting information about themselves. Thus, response rates
might be higher and responses more candid. Twitter responses would probably be less retrospective and
more accurate than paper‐and‐pencil diary responses because respondents could be prompted about how
they are feeling or what they are doing at a particular moment. Other advantages include access to
timestamp data for all entries, instant data transmission to researchers, and reduced equipment and training
costs. Twitter diaries would not be without limitation, however. Researchers would be limited by the
capabilities of Twitter, including the 140 character limit. In addition, because Twitter might not be novel to
respondents, it is possible that they would be more likely to forget to update their diary for the study.
However, this could be compensated for by having the researchers prompt users with reminder tweets.
Second Life
Advances in technology in recent years have introduced additional possibilities of survey modes and
methods of administration. One of the more futuristic possibilities is conducting interviews with embodied
conversational agents (ECAs), which are graphical depictions of humans that can interact with respondents
in human‐like ways. Though this method is feasible, it is rarely used for survey interviews because, as ECAs
become more human‐like, they become vulnerable to human‐like social influence, like social desirability
effects (Cassell & Miller, 2008).
Second Life (SL) is an online three‐dimensional environment in which users (“residents”) create avatars
through which they interact with the virtual world. SL residents are able to communicate via instant
messaging and voice chat, but compared with other social networking technologies, the purpose of SL is
more for entertainment than communication with persons known in real life. Unlike Facebook and Twitter,
which generally are used to augment one’s real‐life persona and relationships, SL users represent
themselves in ways that may be a complete departure from their real‐life appearance and personality.
SL launched in 2003; that year, 50,000 user hours were logged in‐world. User hours peaked at 481
million in 2009, and declined by 10% in 2010. Residents in Second Life come from more than 100 countries;
about 40% of SL avatars are from the United States. In November 2008, the most active users were 25–44
years old (64% of hours logged) and male (59% of hours logged) (Linden Lab, 2009).

236
Epidemiology was one of the first fields to start conducting research in virtual worlds. Since research
shows that people with avatars in virtual worlds tend to consider the avatar as part of their identity (Taylor,
2002), virtual worlds can provide a realm to understand people’s disease response behaviors. The outbreak
of the World of Warcraft “corrupted blood” virus validated and inspired the use of virtual worlds for
epidemiologic modeling (Balicer, 2007; Lofgren & Fefferman, 2007). Epidemics have broken out in virtual
worlds, and remarkably, avatar behavior in response to these virtual epidemics has been similar to human
behavior in real life epidemics: they try to avoid the infected. For this reason, Second Life is a useful tool for
modeling epidemics like HIV/AIDS (Gordon, Björklund, Smith, & Blyden, 2009).
Preliminary research indicates that Second Life may provide a context‐rich environment for conducting
cognitive interviews (Dean, Cook, Keating, & Murphy, 2009; Murphy, Dean, Cook, & Keating, 2010).
Advantages of both text‐based chat and voice chat could be harnessed. With a text‐based chat, full
transcripts of cognitive interviews could be generated. Using voice chat, respondents’ emotive cues could be
captured. The only element from an in‐person cognitive interview that would be missing would be the facial
and physical expressions, although Second Life users can manipulate these for their avatars to a certain
extent. An additional advantage of cognitive interviews in Second Life is the efficiency with which avatar
respondents are recruited in the virtual world (Dean et al., 2009).
And the Rest…
Other systems and technologies are being harnessed for health and survey research purposes, too.
Numerous fields adjacent to health survey methodology have begun developing methods for analyzing
data from social media and other new communication technologies. Epidemiologists, in particular, are
beginning to use social media and Internet search behavior to identify and respond to disease outbreaks. A
study of the 2008 flu season found that Google search trends mapped to flu outbreak patterns (Corley,
Mikler, Cook, & Singh, 2009; Corley, Cook, Mikler, & Singh, 2010).
In addition to simply blogging or sharing videos and pictures about what they are doing, social
networkers can share their current location by using GPS‐based services, such as Foursquare. Foursquare users
“check‐in” at their real‐life location using a Foursquare application on a mobile device (most often, a cell
phone). Users receive updates of their friends’ locations, receive tips about locations and discounts at
participating stores, unlock badges identifying them as having met particular check‐in milestones, and aim to
become the “mayor” of a location by checking in to that location more than anyone else.
It is worth noting that social network platforms increasingly are being accessed on mobile devices. The
percentage of Americans who can access the Internet using smart phones and other mobile devices is
expected to grow from 39% in 2010 to 59% in 2014, according to a study by Yahoo this year. Also by 2014,
more people will access the Internet on mobile devices than on desktop PCs, according to a study by
Morgan Stanley. Survey researchers have been experimenting with handheld devices well before they
became as ubiquitous as they are now (Peytchev & Hill, 2009).
EXPLORING NEW POSSIBILITIES WITH CREATIVITY & CAUTION
Our discipline aims to produce the most valid and accurate health estimates given the available
resources. Social media platforms and other new technologies offer opportunities to achieve this goal in new
ways and with more efficiency, but, in the rush to reap the benefits of these technologies and introduce new
survey modes, we need to be cautious so as not to inadvertently decrease the quality of the health data
being produced. This attention to quality must consider multiple perspectives. In the context of total survey

Proceedings of the 10th Conference on Health Survey Research Methods 237
error, we need to consider the impact of methods on sampling error (sampling scheme, sample size,
estimator choice) and nonsampling error (specification, nonresponse, frame, measurement, data processing)
(Biemer, 2011).
Ethical considerations for any type of health survey research also need to be considered when a new
mode is being evaluated. In our zeal to adopt and use new communications technologies and platforms, we
must be prudent and circumspect in thinking about research ethics as applied to these new venues.
Informed consent, of course, is a basic tenet of scientific research on human populations, and, in survey
research, we are continually cognizant of the need to offer both privacy and confidentiality with regard to
data offered by sample members.
Whether a researcher can “mine” or “scrape” data from social media sites like Facebook or other Web
2.0 applications like Second Life without obtaining a priori informed consent is a thorny issue, not yet
resolved. In practice, obtaining informed consent, especially for passive research methods, is nigh
impossible. And, even if one were able to obtain informed consent, doing so might well change the behavior
of the individuals being observed, thus spoiling the effort.
Nowadays, virtually all Web sites and social media platforms include a “privacy statement”—many of
which note that “data” posted on the site may be collected and analyzed in aggregate. Facebook’s privacy
statement, for example, has seen intense scrutiny for its changing nature and less‐than‐transparent approach
to protecting user privacy. Facebook produces revenue by selling aggregate data to advertisers who can
then better target market segments based on “likes” and the like.
WHERE DO WE GO FROM HERE?
We see the trend towards increased adoption of new technologies and forms of communication holding
promise for the future of survey research. These technologies could supplement traditional survey modes to
encourage participation from respondents who may well have a high level of comfort with new technologies.
Using several and varied new‐technology approaches may increase participation since people may appreciate
the ability to choose their preferred response mode (Dillman, 2000; Schaefer & Dillman, 1998).
At present, there are more questions than answers concerning the best methods for utilizing new
technologies and social media for health survey research methods. We intend to investigate several of these
issues, as described in the table on the following page.
As a next step in our research, we plan to address some of these questions head on, conducting studies
to advance the knowledge of new technologies and how they may impact health surveys. Specifically, we
plan to evaluate the effectiveness of techniques to trace, recruit, or sample respondents using resources such
as Facebook; conduct virtual cognitive interviews in Second Life; explore focus group and diary methods
that take advantage of the interactive opinion‐sharing nature of Twitter; pilot test a mobile micro‐survey
application that samples respondents based on their current geolocation; and evaluate the potential to
supplement health survey research information with secondary analysis of data from sources such as
Twitter and Internet search statistics.
Although new technologies and platforms—new ways of communicating—may not ultimately replace
traditional approaches, it is critical that we evaluate the potential of new technologies and social media tools
and their role in health survey research to stay current during a time of fast‐paced evolution in
communications. This is vitally important because by the time we conclude the current research, even newer
technologies will be presenting additional opportunities and concerns. Constant monitoring is something

238
that may soon be feasible, and we must address the fact that surveys are a form of surveillance (Marx, 2008).
This is an interesting time for health surveys; the future will be fascinating.
Questions for Investigation
QUALITY ISSUES ADJACENCIES COMMUNICATION PREFERENCES REPRESENTATIVENESS
Looking at the entire framework of total survey error, what data quality issues must we examine when considering survey work in these new technologies?
How reliable & valid are data collected through these platforms?
Furthermore, what tools & techniques are needed to be able to assess reliability & validity in these modes?
What additional research is being done on these new technologies in adjacent fields, such as marketing, media studies, health communications, & human‐computer interaction?
How can health survey researchers learn & benefit from this research?
What can or will survey respondents share with survey researchers via these new tools, & how can we best tailor the request for this information? Since most social media communication is two‐way or interactive, will survey researchers be expected to share information “back”?
How can we best make use of the interactive nature of many of these systems without sacrificing confidentiality or raising other concerns?
What information can we “share back” that attracts or motivates respondents and reduces survey error?
What modes of communication do different types of survey respondents prefer when being contacted for or when completing a survey?
Is there a difference between what respondents say they prefer & what methods they use to respond?
What are the demographic profiles of users of different systems or technologies, & how do users differ from benchmarks?
Can frame data be compiled & representative samples drawn?
REFERENCES
Acquisti, A., & Gross, R. (2006). Imagined communities awareness, information sharing, and privacy on the
Facebook. In G. Danezis (Ed.), Privacy Enhancing Technologies: 6th International Workshop, PET 2006, Cambridge,
UK, June 28–30, 2006, Revised Selected Papers (Lecture Notes in Computer Science/Security and Cryptology, pp.
36–58). Heidelberg, Germany: Springer.
Albrectslund, A. (2008). Online social networking as participatory surveillance. First Monday, 13(3). Retrieved
March 23, 2011, from http://firstmonday.org/article/view/2142/1949
Asberg, P. (2009). Using social media in brand research: How brand managers can evaluate brand performance during an
economic recession. Retrieved March 23, 2011, from
www.brandchannel.com/images/papers/433_Social_Media_Final.pdf
Balicer, D. (2007). Modeling infectious diseases dissemination through online role‐playing games. Epidemiology,
18, 260–261.
Biemer, P. (2011). Total survey error: Design, implementation, and evaluation. Public Opinion Quarterly, 74, 817–848.
Blumberg, S. J., & Luke, J. V. (2009). Reevaluating the need for concern regarding noncoverage bias in landline
surveys. American Journal of Public Health, 99, 1806–1810.
Boges, R. (2010). Followup to my Facebook research. Skullsecurity. Retrieved on March 23, 2011, from
www.skullsecurity.org/blog/2010/followup‐to‐my‐facebook‐research
Cassell, J., & Miller, P. (2008). Is it self‐administration if the computer gives you encouraging looks? In F. G.
Conrad & M. F. Schober (Eds.), Envisioning the survey interview of the future (pp. 161–178). Hoboken, NJ: John
Wiley & Sons.
Casteleyan, J., Mottart, A., & Rutten, K. (2009). How to use Facebook in your market research. International Journal
of Market Research, 51, 439–447.

Proceedings of the 10th Conference on Health Survey Research Methods 239
Chew, C., & Eysenbach, G. (2010) Pandemics in the age of Twitter: Content analysis of tweets during the 2009
H1N1 outbreak. PLoS ONE, 5(11), e14118.
Corley, C. D., Cook, D. J., Mikler, A. R., & Singh, K. P. (2010). Text and structural data mining of influenza
mentions in web and social media. International Journal of Environmental Research and Public Health, 7, 596–615.
Corley, C. D., Mikler, A. R., Cook, D. J., & Singh, K. P. (2009). Monitoring influenza trends through mining social
media. In Proceedings of the 2009 International Conference on Bioinformatics and Computational Biology
(BIOCOMP09), Las Vegas, NV. Retrieved March 23, 2011, from www.eecs.wsu.edu/~cook/pubs/biocomp09.pdf
Curtin, R., Presser, S., & Singer, E. (2005). Changes in telephone survey nonresponse over the past quarter
century. Public Opinion Quarterly, 69, 87–98.
Cunningham, D., Flicker, L., Murphy, J., Aldworth, W., Myers, S., et al. (2005). Incidence and impact of controlled
access situations on nonresponse. Paper presented at the annual conference of the American Association for
Public Opinion Research, Miami Beach, FL.
Dean, E. F., Cook, S. L., Keating, M. D., & Murphy, J. J. (2009). Does this avatar make me look fat? Obesity and
interviewing in Second Life. Journal of Virtual Worlds Research, 2(2). Retrieved March 23, 2011, from
http://journals.tdl.org/jvwr/article/view/621/495
de Heer, W. (1999). International response trends: Results of an international survey. Journal of Official Statistics,
15, 129–142.
Dillman, D. A. (2000). Mail and Internet surveys: The Tailored Design Method. New York, NY: Wiley.
Facebook. (2011). Facebook press room: Statistics. Retrieved March 23, 2011, from
https://www.facebook.com/press/info.php?statistics
Gordon, R., Björklund, N. K., Smith, R. J., & Blyden, E. R. (2009). Halting HIV/AIDS with avatars and havatars: A
virtual world approach to modelling epidemics. BMC Public Health, 9(Suppl 1), S13.
Groves, R. (2006). Nonresponse rates and nonresponse bias in household surveys. Public Opinion Quarterly, 70, 646.
Heussner, K. M. (2009, October 15). Digital confessionals: Tweeting away your vices. Retrieved March 13, 2011, from
http://abcnews.go.com/Technology/AheadoftheCurve/digital‐confessionals‐tweeting‐
vices/story?id=8830730&page=1
Holbrook, A. L., Green, M. C., & Krosnick, J. A. (2003). Telephone versus face‐to‐face interviewing of national
probability samples with long questionnaires. Public Opinion Quarterly, 67, 79–125.
Jansen, B. J. (2009). Understanding user‐Web interactions via Web analytics (Synthesis Lectures on Information Concepts,
Retrieval, and Services). San Rafael, CA: Morgan & Claypool.
Kempf, A. M., & Remington, P. L. (2007). New challenges for telephone survey research in the twenty‐first
century. Annual Review of Public Health, 28, 113–126.
Keesling, R. (2008). Controlled access. In P. Lavrakas (Ed.), Encyclopedia of survey research methods (2nd ed., Vol. 1,
pp. 147–148). Thousand Oaks, CA: Sage.
Kim, J., Gerhenson, C., Glaser, P., & Smith, T. (2011). Trends in surveys on surveys. Public Opinion Quarterly, 75,
165‐ 191.
Kim, W., Jeong, O.‐R., Kim, C., & So, J. (2010). The dark side of the Internet: Attacks, costs and responses.
Information Systems, 36, 675–705.
Koskela, H. (2004). Webcams, TV shows and mobile phones: Empowering exhibitionism. Surveillance & Society,
2(2/3), 199–215.
Linden Lab. (2009, April 16). The Second Life economy—First quarter 2009 in detail. Retrieved from
https://blogs.secondlife.com/community/features/blog/2009/04/16/the‐second‐life‐economy‐‐first‐quarter‐
2009‐in‐detail
Lofgren, E., & Fefferman, N. (2007). The untapped potential of virtual game worlds to shed light on real world
epidemics. Lancet: Infectious Diseases, 7, 625–629.
Marx, G. (2008). Surveys and surveillance. In F. G. Conrad & M. F. Schober (Eds.), Envisioning the survey interview
of the future (pp. 254–266). Hoboken, NJ: Wiley.

240
Morales, L. (2011). Google and Facebook users skew young, affluent, and educated. Retrieved March 23, 2011, from
www.gallup.com/poll/146159/facebook‐google‐users‐skew‐young‐affluent‐educated.aspx
Murphy, J. J., Sha, M., Flanigan, T. S., Dean, E. F., Morton, J. E., et al. (2007). Using Craigslist to recruit cognitive
interview respondents. Paper presented at the annual meeting of the Midwest Association for Public Opinion
Research, Chicago.
Murphy, J., Brackbill, R. M., Thalji, L., Dolan, M., Pulliam, P., et al. (2007). Measuring and maximizing coverage in
the World Trade Center Health Registry. Statistics in Medicine, 26, 1688–1701.
Murphy, J., Dean, E., Cook, S., & Keating, M. (2010). The effect of interviewer image in a virtual‐world survey (RTI
Press Publication No. RR‐0014‐1012). Research Triangle Park, NC: RTI Press.
MyType. (2011). Welcome to MyType. Retrieved March 23, 2011, from www.mytype.com/about
Nwadiuko, J., Isbell, P., Zolotor, A., Hussey, J., & Kotch, J. (2011). Using social networking sites in subject tracing.
Field Methods, 23, 77.
O’Connor, B., Balasubramanyan, R., Routledge, B., & Smith, N. (2010). From tweets to polls: Linking text
sentiment to public opinion time series. In Proceedings of the Fourth International AAAI Conference on Weblogs
and Social Media. Retrieved March 23, 2011, from
www.aaai.org/ocs/index.php/ICWSM/ICWSM10/paper/view/1536/1842
Office of Management and Budget. (2006). Standards and guidelines for statistical surveys. Retrieved March 23, 2011,
from www.whitehouse.gov/sites/default/files/omb/inforeg/statpolicy/standards_stat_surveys.pdf
Pang, B., & Lee, L. (2008). Opinion mining and sentiment analysis. Foundations and Trends in Information Retrieval,
2, (1–2), 1–135.
Perkins, J., Granger, R., & Saleska, E. (2009). Data security considerations when using social networking Web sites for
locating and contacting sample members. Paper presented at the International Field Directors and Technologies
Conference. Retrieved March 23, 2011, from www.rti.org/pubs/ifdtc09_perkins_pres.pdf
Peytchev, A., & Hill, C. A. (2010). Experiments in mobile Web survey design similarities to other modes and
unique considerations. Social Science Computer Review, 28, 319–335.
Pulliam, P., Dolan, M., & Dean, E. (2010). Methods to improve public health responses to disasters. In Proceedings
of the Ninth Conference Survey on Health Survey Research Methods. Retrieved March 23, 2011, from
www.cdc.gov/nchs/data/misc/proceedings_hsrm2010.pdf
Remington, T. (1992). Telemarketing and declining survey response rates. Journal of Advertising Research, 32, 6–8.
Schaefer, D. R., & Dillman, D. A. (1998). Development of a standard e‐mail methodology. Public Opinion Quarterly,
62, 378–397.
Schonfeld, E. (2010, June 8). Costolo: Twitter now has 190 million users tweeting 65 million times a day. Retrieved
March 23, 2011, from http://techcrunch.com/2010/06/08/twitter‐190‐million‐users/
Smith, A., & Rainie, L. (2010). Overview: The people who use Twitter. Retrieved March 23, 2011, from
www.pewinternet.org/Reports/2010/Twitter‐Update‐2010/Findings.aspx?view=all
Smith, T. (2009). Conference notes—The social media revolution. International Journal of Market Research, 51, 559–561.
Squiers, L., Holden, D. J., Doline, S., Kim, E., Bann, C. M.,& Renaud, J. M. (2011). The public’s response to the U.S.
Preventive Services Task Force’s 2009 recommendations on mammography screening. American Journal of
Preventive Medicine, 40, 497–504.
Steeh, C., Kirgis, N., Cannon, B., & DeWitt, J. (2001). Are they really as bad as they seem? Nonresponse rates at
the end of the twentieth century. Journal of Official Statistics, 17(2), 227–247.
Taylor, T. L. (2002). Living digitally: Embodiment in virtual worlds. In The Social life of avatars (pp. 40–62).
Springer: London.
Tortora, R. D. (2004). Response trends in a national random digit dial survey. Metodolski zvezki, 1(1), 21–32.
Tourangeau, R. (2004). Survey research and societal change. Annual Review of Psychology, 55, 775–801.
Tumasjan, A., Sprenger, T. O., Sandner, P. G., & Welpe, I. M. (2010). Predicting elections with Twitter: What 140
characters reveal about political sentiment. In Proceedings of the Fourth International AAAI Conference on

Proceedings of the 10th Conference on Health Survey Research Methods 241
Weblogs and Social Media (pp. 178–185). Retrieved March 23, 2011, from
www.aaai.org/ocs/index.php/ICWSM/ICWSM10/paper/view/1441/1852
Tynan, D. (2002, June 20). Spam Inc. PC World. Retrieved September 25, 2012, from
www.pcworld.com/article/101769/article.html
Webster, T. (2011, April). The infinite dial 2011—Navigating digital platforms. Retrieved September 25, 2012, from
www.edisonresearch.com/home/archives/2011/04/the_infinite_dial_2011.php

242

Proceedings of the 10th Conference on Health Survey Research Methods 243
The Feasibility of Using Handheld Computers to Conduct the Global Adult Tobacco Survey
Jeremy Morton, Krishna M. Palipudi, and Samira Asma (Centers for Disease Control and Prevention)
[On behalf of the Global Adult Tobacco Survey Collaborative Group]
INTRODUCTION
Electronic Data Capture (EDC) methodologies to conduct surveys has are now frequently used in
developed countries. Computer laptops have been used for many years to conduct in‐person household
surveys, and using handheld computers has become more common as well. The advantages of using
computer‐assisted interviewing (CAI) methods over paper‐and‐pencil interviewing (PAPI) have been well
documented in the survey research field (see Weeks [1992] for an overview).
It is less common for CAI surveys to be conducted in developing countries, and using handheld
computers is even less frequent. There have been recent published studies about using handheld computers
for survey data collection in developing countries—Yu et al. (2009) describe a field test study in Fiji of 120
participants to evaluate the development of a handheld survey vs. PAPI; Bernabe‐Ortiz et al. (2008)
conducted a similar evaluation of a handheld survey vs. PAPI using 200 participants in Lima, Peru; Shirima
et al. (2007) used handheld computers to collect survey data from over 21,000 rural households in southern
Tanzania; Seebregts et al. (2009) report on using handheld computers in South Africa for over 90,000
interviews in seven separate studies; and Gupta (1996) used handheld computers in Bombay, India, to
conduct a tobacco survey of over 99,000 persons. All of these studies had similar conclusions—using
handheld computers was a feasible and successful methodology for collecting field data in developing
countries. Note that these studies were not at a national level and were designed for sub‐ or specific
populations.
The Global Adult Tobacco Survey (GATS) provides an opportunity to implement nationally
representative household surveys in low‐ and middle‐income countries using handheld computers for data
collection. The development of GATS started in 2007 and the first phase of GATS was conducted between
2008 and 2010 in 14 countries: Bangladesh, Brazil, China, Egypt, India, Mexico, Philippines, Russian
Federation, Thailand, Turkey, Ukraine, Uruguay, and Vietnam.
This paper provides an overview of the initial implementation of GATS in these 14 countries while
assessing the feasibility of using handheld computers in low‐ and middle‐income countries to conduct
national surveys.
METHODOLOGY
Overview of GATS
The Global Adult Tobacco Survey (GATS), a component of the Global Tobacco Surveillance System
(GTSS, www.cdc.gov/tobacco/global/gtss/index.htm), is a global standard for systematically monitoring
adult tobacco use and tracking key tobacco control indicators. GATS is a nationally representative
household survey of adults, 15 years of age or older, using a standard core questionnaire, sample design,
and data collection and management procedures that have been reviewed and approved by international

244
experts. GATS is intended to enhance the capacity of countries to design, implement, and evaluate tobacco
control interventions.
GATS uses a geographically clustered, multistage sampling methodology. First, a country is divided
into Primary Sampling Units, segments within these Primary Sampling Units, and households within the
segments. Then, a random sample of households is selected to participate in GATS.
At each address in the sample, field interviewers administer the Household Questionnaire (HQ) to one
adult who resides in the household. The Household Questionnaire determines if the selected household
meets GATS eligibility requirements and rosters all eligible members of the household. Then one individual
(15 years of age or older) is randomly selected to complete the Individual Questionnaire (IQ). The Individual
Questionnaire includes core questions about background characteristics; tobacco smoking; smokeless
tobacco use; cessation; secondhand smoke exposure; economics; media; and knowledge, attitudes, and
perceptions about tobacco. Participating countries may add and/or adapt questions to the GATS Core
Questionnaire (Global Adult Tobacco Survey Collaborative Group, 2010) related to their country‐specific
situation. Once finalized, the country‐adapted questionnaire is translated into local languages, as applicable
before the survey administration.
GATS uses standard best practices such as pretesting questionnaires; reviewing survey proposals;
technical assistance and training on data collection and management; conducting workshops and
orientations; and providing consultation and technical feedback on data analysis and reporting. The GATS
Comprehensive Standard Protocol (CSP) contains a series of standardized manuals. (The CSP can be
accessed at the CDC’s Web site:
http://apps.nccd.cdc.gov/gtssdata/Ancillary/Documentation.aspx?SUID=4&DOCT=1)
GATS is conducted by each participating country by a consortium of partners. Typically the national
statistical organization will conduct the data collection while the Ministry of Health and other in‐country
partners provide support in design and analysis. Technical consultation and review is provided by various
GATS partners including the U.S. Centers for Disease Control and Prevention (CDC), the World Health
Organization (WHO), Johns Hopkins Bloomberg School of Public Health (JHBSPH), RTI International, and
the University of North Carolina Gillings School of Public Health (UNCSPH). Funding is provided by
Bloomberg Philanthropies through the CDC Foundation.
Handheld Computers
GATS was initially developed as a paper and pencil survey. However, during development, GATS
partners conducted a thorough evaluation of the use of EDC and concluded the use of CAI devices for
GATS was not only feasible but also highly recommended. Available hardware and software was evaluated
for incorporating into GATS based on ease of implementation and use at the in‐country field level.
Additional factors such as the ability to standardize both the data collection and data analysis process were
also considered during the evaluation. Based on recommendations, handheld computers—specifically
Hewlett Packard (HP) iPAQ©1 devices—were selected for GATS implementation. RTI International provided
technical support in developing their General Survey System (GSS) software for GATS.
1 Use of “Hewlett‐Packard (HP) iPAQ” is for identification only and does not imply endorsement by any of the GATS
collaborating organizations.

Proceedings of the 10th Conference on Health Survey Research Methods 245
General Survey System (GSS) Software
The GSS is a suite of software tools developed to facilitate the administration, collection, and
management of survey data on handheld computers, specifically a Microsoft Windows©2‐based platform
running Windows Mobile 5.0 or Mobile 6.0, often called Pocket PC systems. The software system is
designed to support field data collection activities where field interviewers collect data using handheld
computers. The systems have been developed and tested using Hewlett Packard (HP) iPAQ Pocket PC
systems. The software consists of six main programs, each dedicated to a specific function:
CMS: a case management system that allows users to manage the case load on the Pocket PC.
GSS Engine: a questionnaire development and presentation system engine that allows defining of
data collection forms on a standard desktop PC and execution of these data collection forms or
questionnaires on the Pocket PC.
Xmit: a data transmission program that allows bidirectional movement of data, program updates,
and control information to and from the Pocket PC over dialup, wireless, or wired Ethernet.
Developer’s Tool Set: a developer’s menu system that organizes the access to the PC‐based
components of GSS.
Designer: a questionnaire design program that provides a visual interface for preparing and/or
modifying a survey instrument. The Designer allows the creation, deletion, and modification of
questions in two languages at a time in the GSS.
Project Web site: a Web‐based suite of tools that facilitates survey management, survey monitoring,
and reporting, and brokers the data transmissions to and from the Pocket PC to back‐end database
servers.
Three of the major programs—CMS, GSS, and Xmit—run on the Microsoft Windows Mobile‐based
handheld that the field interviewer uses, and the Developer’s Tools Set runs on a Microsoft Windows‐based
laptop or desktop PC. The Project Web site runs on a centralized desktop or laptop Microsoft IIS Web Server
running ASP.net Web pages linked to a Microsoft SQL Server database for data storage.
RESULTS
Implementation of Handheld Computers
As implementation of GATS started in the initial 14 countries, GATS partners confirmed the anticipated
disparity of expertise and experience with using CAI methods. A few countries had experience with CAI
surveys, sometimes specifically with handhelds. For example, Thailand and Brazil did their own
programming of the GATS questionnaire using their own survey software (not GSS) for handheld
computers. On the other hand, for some countries (e.g., Bangladesh), GATS represented the first national
survey to be conducted by the country using an electronic mode of data collection. Thus, the amount of
experience and expertise dictated the required level of training and support the GATS partners gave to each
country. Implementation assistance included questionnaire programming, consultation on data
management plans, and training of country IT and data management staff.
2 Use of “Microsoft Windows” and “Windows Mobile” is for identification only and does not imply endorsement by any
of the GATS collaborating organizations.

246
Questionnaire Programming
Once the countries adapted the GATS Core Questionnaire for their specific needs, the country‐specific
questionnaires were programmed for use on the handheld computer. A core questionnaire program was
modified for each country’s specific questionnaire. This included the addition of questions or entire sections,
the deletion of questions or entire sections, and adapted question categories and response categories. The
amount and complexity of adaptations varied by country.
In planning for GATS implementation, the expectation was that GATS partners would program the
country‐specific questionnaires for the pretest and then provide training to countries. The hope was that
countries would then be able to make the changes to the questionnaire program for the main survey.
However, in most instances, GATS partners ended up programming for the main survey as well. The reason
was a combination of two issues: 1) countries’ need for further training and/or experience, and 2) a lack of
time or resources at the country level.
An important challenge was programming and setting up the handhelds for use with languages other
than English. Most of the iPAQs were purchased by the CDC Foundation in the United States and sent to
the countries for use in GATS. Since the operating system was in English, it was necessary to obtain and
load external language packs that provided the character set and keyboards for the given languages. Often
times, non‐western characters required additional visual adjustments for the handheld screens including
font size and text direction (e.g., right to left for Arabic).
Another challenge of using handhelds was the screen size (5 inches for iPAQ). It was important to
design the questionnaire program and CMS given the limitations of space. While this was not a major issue
for GATS, this could potentially be a limitation for other types of surveys.
Data Management Implementation
The GATS Data Management Implementation Plan (DMIP) manual (Global Adult Tobacco Survey
Collaborative Group, 2010) provides a description of the procedures, practices, and resource information for
GATS data management activities inclusive of data extraction, format, transfer, and aggregation, and chain
of custody from the field interviewer to PSU/regions to the country level national data center (NDC). The
DMIP outlines three models of data management:
Full Network—Web Model. Fully networked model provides a Web‐based system used for all of
the following: case assignment via network upload and download, survey monitoring, upload of
field data, and survey monitoring reports.
Partial Network—Some Field Phone/Internet Connectivity. Includes the following: in‐country
system hosts consolidated database at the NDC, case assignment performed by memory card,
interviewers export questionnaire data to memory cards, field supervisors or regional supervisors
collect cards and upload data to the NDC, NDC combines files across PSUs/Regions.
Card‐Based. Includes the following: in‐country system hosts consolidated database at NDC, case
assignment performed by memory card, interviewers export questionnaire data to memory cards,
NDC combines files from iPAQ‐level files.
GATS partners worked closely with each country to design a data management plan that was
appropriate given the country’s infrastructure, expertise, and experience. Country infrastructure included
internet coverage and access, as well urbanicity/ruralness. On one end of the spectrum, data management
was conducted by manually gathering memory cards from each interviewer (on a regular basis) in order to
collect interview data during data collection. On the other end, data management was conducted via the

Proceedings of the 10th Conference on Health Survey Research Methods 247
internet where interview data was transmitted by field interviewers on a nightly basis (which is often done
in the US and other developed countries).
Training and Technical Support
An overarching goal of GATS is not only to provide technical support but also provide capacity building
to participating GATS countries. Capacity building related to electronic data collection is provided in two
ways: 1) in‐depth IT and data management training for both software and hardware, and 2) purchasing the
iPAQs for the countries to keep. The goal is for countries to be able to conduct GATS again in the future and
conduct other surveys using the software and hardware.
As part of a country’s pretest training and preparation, an in‐country IT/data management training
workshop occurred where all IT preparations for the pretest were finalized, including the set‐up of iPAQ
handhelds. In addition, another in‐country IT/data management training workshop was conducted prior to
the main survey where country staff were provided additional in‐depth training on the GSS PC software. In
addition, GATS partners provided ongoing technical support throughout the entire implementation of
GATS.
Outcomes
GATS was successfully conducted using handheld computers in all of the initial 14 countries. Twelve of
these countries conducted GATS using the GATS GSS software while two countries (Brazil and Thailand)
conducted GATS using their own survey software.
In the 14 initial GATS countries, there were approximately 250,000 completed GATS individual surveys
using almost 3,000 handheld computers. The GATS questionnaire was programmed in nearly 40 languages.
The hardware failure rate was less than 1%, even though the survey was often conducted in poor
environmental conditions such as high altitudes, freezing temperatures, dry heat, high humidity, and
monsoon seasons. The electronic data collection system used in GATS resulted in an almost 0% data loss.
The implementation of a range of data management plans was also a success. Poland conducted GATS
entirely using a Web‐based model while other countries were able to successfully manage data using
memory cards and supervisor/regional aggregation and transmission.
After GATS was completed, a few countries (e.g., Bangladesh, China, Egypt, and India) have used the
iPAQs and GSS software to conduct other surveys besides GATS, proving the sustainability of the
methodology.
Lessons Learned
The success of using handheld computers to conduct GATS was not without shortcomings. Some of the
main lessons learned:
Preparation Time/Capacity Building. While the basic structure of GATS was in place, many details of
the standard protocol were still being finalized as the initial countries started implementing GATS. Thus, in
certain instances there was limited time for some of the IT/data management preparations. While the time
limitations did not affect overall data quality, they did have an effect on the ability to provide in‐depth
training for capacity building. Of the 14 initial GATS countries, the countries which conducted GATS later
certainly benefited from the experience and lessons learned from the first countries to implement. For future
GATS countries, time allotted for IT/data management preparations will be increased and the goal is to

248
provide more in‐depth training during the pretest training workshop which hopefully reduces the training
required at the main survey training workshop.
Enhancement of GATS GSS Questionnaire Program. There were no reports of major problems with
the GATS GSS questionnaire program and corresponding case management system. However, there were
many recommendations for enhancements of the program to help increase data quality. This included
adding additional consistency checks, modifying range checks, and adding additional automated processes
(e.g., auto coding field result codes). These enhancements have been incorporated for the next phase of
GATS implementation.
Enhancement of GATS GSS PC Software. Countries also requested additional enhancements to the
GATS GSS PC software suite, including enhanced reporting tools for improved monitoring of results and
data quality during data collection, and an enhanced data aggregation program for ease of creating a master
data set at the end of data collection.
CONCLUSION
Despite challenges in using electronic data collection methodologies in developing countries, the use of
handheld computers was very successful for the initial implementation of GATS. The advantages of using
CAI over paper and pencil to conduct surveys are well documented. However, there are potential obstacles
for using CAI in developing countries including the potential insufficiency of resources, expertise,
experience, and infrastructure. GATS proved that with resources and training, implementing surveys using
handhelds could be successful in any country.
For GATS, the handheld computers provided advantages over other forms of CAI because of their
portability and battery life compared to bulkier devices such as laptops. This was a distinct benefit for data
collection in the GATS countries, particularly in rural and remote areas where electricity and transportation
was often limited.
The use of handhelds improves the speed and quality of data collection and management for GATS. The
significant gains in data accuracy, availability, and management, justify the implementation of handheld
devices for GATS interviews and enhance the countries’ capacity in using these devices for future non‐
GATS surveys.
Furthermore, the initial implementation of GATS has provided us ample evidence that the methodology
of using handheld computers is sustainable for future GATS surveys and any other surveys. Adapting to
emerging hardware (e.g., smart phones, portable tablets) and software (e.g., Android operation system)
technologies will be key in sustainability.
REFERENCES
Bernabe‐Ortiz, A., Curioso, W. H., Gonzales, M. A., Evangelista, W., Castagnetto, J. M., et al. (2008). Handheld
computers for self‐administered sensitive data collection: A comparative study in Peru. BMC Medical
Informatics and Decision Making, 8, 11.
Global Adult Tobacco Survey Collaborative Group. (2010). Global Adult Tobacco Survey (GATS): Core questionnaire
with optional questions, Version 2.0. Atlanta: Centers for Disease Control and Prevention.
Global Adult Tobacco Survey Collaborative Group. (2010). Global Adult Tobacco Survey (GATS): Data management
implementation plan, Version 2.0. Atlanta: Centers for Disease Control and Prevention.

Proceedings of the 10th Conference on Health Survey Research Methods 249
Gupta, P. C. (1996). Survey of sociodemographic characteristics of tobacco use among 99,598 individuals in
Bombay, India using handheld computers. Tobacco Control, 5(2), 114–120.
Seebregts, C. J., Zwarenstein, M., Mathews, C., Fairall, L., Flisher, A. J., et al. (2009). Handheld computers for
survey and trial data collection in resource‐poor settings: Development and evaluation of PDACT, a Palm
Pilot interviewing system. International Journal of Medical Informatics, 78, 721–731.
Shirima, K., Mukasa, O., Schellenberg, J. A., Manzi, F., John, D., et al. (2007). The use of personal digital assistants
for data entry at the point of collection in a large household survey in southern Tanzania. Emerging Themes in
Epidemiology, 4, 5.
Weeks, M. F. (1992). Computer‐assisted survey information collection: A review of CASIC methods and their
implications for survey operations. Journal of Official Statistics, 8(4), 445–465.
Yu, P., de Courten, M., Pan, E., Galea, G., & Pryor, J. (2009). The development and evaluation of a PDA‐based
method for public health surveillance data collection in developing countries. International Journal of Medical
Informatics, 78(8), 532–542.

250

Proceedings of the 10th Conference on Health Survey Research Methods 251
“I Don’t Smoke but My Avatar Does!” Understanding the Unique Opportunities and Challenges When Collecting Health‐Related Data in Virtual Environments
Kelly N. Foster (College of Public Health, University of Georgia)
INTRODUCTION
Though commonly called “virtual worlds”, they are technically referred to as massively‐multiplayer
online role‐playing games (MMORPGs). These worlds are framed by different narrative environments and
are typically very sophisticated and elaborate worlds that evolve based on user interaction and imagination
(Wood, Griffiths et al. 2004). Some more popular examples of this type of environment include World of
Warcraft (WoW), Everquest, Neverwinter Nights, There, and Second Life (SL). Time spent in these types of
environments is quite extensive with millions of users each spending an average of 22 hours a week
interacting in these and many other virtual worlds (Yee, Bailenson et al., 2007).
Despite the seemingly unreal nature of these individuals and communities, the emotions and
connections of virtual worlds residents are, in some cases, as genuine as those experienced in the physical
world (Bell & Consalvo, 2009;Ikegami & Hut, 2008). As the largest virtual world of its kind, Second Life (SL)
boasts millions of participants each month—called “residents”—and has an economy that is active and
strong (LindenLabs, 2009). This has lead to significant interest in SL as a venue for health and education
programs, commerce, and research. Many of the pioneers of health education and intervention in the
physical world are experimenting with interventions in virtual worlds and early research seems to show
support for financially investing in virtual world intervention programs as a viable tool for health behavior
modification in the real world (Beard, Wilson et al., 2009; Krebs, Burkhalter et al., 2009; Norris, 2009).
Virtual worlds allow the researcher to change age, gender, ethnicity, or even the research environment
with the touch of a button. Public health advocates have the potential to design interventions that elicit
similar responses to those in a physical lab but they can quickly alter the scenario to match the needs of each
individual participant for a much more tailored treatment program. Virtual worlds are a complex series of
user‐defined settings that, if harnessed properly, have great potential for research, education, and
socialization.
BACKGROUND
MMORPG users typically interact with one another through the use of virtual representations of
themselves, most commonly known as “avatars.” The avatar is the self‐representation of the individual and,
in virtual worlds, is the primary identity cue for an individual (Yee & Bailenson, 2007) thereby being the
most critical part of an individual’s virtual identity. In some cases, the avatar may be human and closely
resemble the individual in appearance, speech, and behavior; but in other cases the avatar may be
completely nonhuman, such as a dwarf, elf, animal, or spirit. Although users typically gravitate towards
familiar embodiment, they do frequently engage in “gender swapping” with their avatar. That is, a user
who is gendered male in the physical world will present himself as a female avatar in the virtual world or
vice versa. While reasons vary, it seems that in action‐based virtual worlds, women tend to swap to male
characters in order to avoid harassment or undue attention whereas male characters tend to gender swap in
order to be treated better or to have easier social interactions (Hussain & Griffiths 2008). Because we, to

252
some degree, base our personal identity on what others see in us (Cooley, 1902), it is important to
understand the nature of the interactions in virtual worlds and how they may or may not differ from that of
the physical world.
HARNESSING VIRTUAL WORLDS FOR SOCIAL SCIENCE RESEARCH
Currently, the most widely discussed issue among virtual worlds researchers is how to conduct research
in virtual environments with the same degree of scientific rigor that is used in physical world research. In
order to do this, it is vital to understand the climate of education and research in virtual worlds and how
individuals interact and behave in these environments.
Health‐Related Research in Virtual Worlds
New technologies and their applications are growing and evolving as the “Net” generation—those who
were born around the time that PCs were becoming popular and have always known this type of
technology (Oblinger & Oblinger, 2005)—are entering adulthood. This connected generation does not draw
boundaries between human and avatar, real and virtual, in‐world and out‐of‐world in the same way that
the generation before them did. The boundaries between countries may be geographically limiting in the
physical world but through virtual worlds the individuals in these countries freely travel from world to
world and island to island where they interact with other individuals across the globe.
Virtual worlds are increasingly being used for education, research and support—particularly in health‐
related fields. Currently, in‐world research and demonstrations are being used to inform individuals about
various health‐related issues (Beard, Wilson, et al., 2009;CDC, 2009; WHC, 2009), to shape interventions
(Bordnick, Grapp et al., 2004; Baumann & Sayette, 2006), to enhance health‐related educational experiences
(Walker, 2009), or to support or further challenge research conclusions from studies conducted out‐of‐world
(Dean, Cook et al., 2009).
Represented in SL are many of the major names in health care and wellness in the United States. Virtual
facilities exist where residents can get health‐related information (CDC, 2009), participate in focus groups
(CDC, 2009; Dean, Cook et al., 2009), or simulate a virtual breast mammogram (Beard, Wilson et al., 2009). In
the realm of mental health support, the SL site called Virtual Hallucinations simulates the perceptual
abnormalities that schizophrenics often experience helping to educate users on the strain of daily living for
those with mental illness (Beard, Wilson et al., 2009; Schizophrenia.com, 2009). The hope is that these
innovative sites will help to bring often‐uncomfortable topics to an area where people can interact and
educate themselves with relative anonymity.
Changing Health Attitudes & Behaviors among Humans via Their Avatars
Researchers at RTI International found that individuals whose avatars engaged in health behaviors in‐
world were more likely themselves to engage in physical activities in the real world than were those
individuals with avatars who were less physically active (Dean, Cook et al., 2009). Further supporting this
was a recent experiment conducted by Fox and Balienson (2009) that showed that people who watched
“self‐representing avatars” (i.e., avatars whose physical characteristics are designed to look like the human
they represent) exercise on a treadmill were more likely to engage in some form of physical exercise in the
24 hours following the virtual exercise—indicating the real possibility of modifying behavior in the real
world through virtual world interaction. What is unclear from this research, and is an area of debate in the
literature, is whether the fit individual creates a fit avatar or if the creation of a fit avatar motivates the

Proceedings of the 10th Conference on Health Survey Research Methods 253
individual to act in a way that he/she believes is expected of him/her—a phenomenon called the “Proteus
Effect.” The extent to which this operates in virtual worlds and the impact of this effect has large
implications for research in terms of understanding how the individual and avatar work together or
separately and raises many questions. For instance, if an avatar engages in a virtual world based research
project, what impact, if any, does that have on the real person? Can researchers modify the health behaviors
of individuals by engaging their avatars in health behaviors?
Recent and emerging research that targets and engages a wider range of virtual worlds, such as Second
Life, is finding that while the user dictates the activities of the avatar there may be a reciprocal effect—
meaning that while the human drives the activities of the avatar, the avatar also drives the actions of the
human (Yee & Bailenson, 2007; Dean, Cook et al., 2009). The underlying theory for this is that humans are
likely to create avatars that are generally better representations of themselves (physically at least) (Dean,
Cook et al., 2009) and the expectations of those thinner, fitter, and healthier avatars begin to change the
behavior of the individual (Walther, 1996; Yee & Bailenson, 2007). In a sense, they begin to act the part of a
healthier or more attractive individual.
Finally, in a similarly set up experiment Yee and Bailenson (2007) manipulated the participant avatar’s
height and found that participants with taller avatars were more likely to behave in a confident manner and
negotiate for things more aggressively than were shorter avatars. Based on these findings, the researchers
concluded “the appearance of our avatars shape how we interact with others. As we choose our self‐
representations in virtual environments, our self‐representations shape our behaviors in turn. These changes
happen not over hours or weeks but within minutes” (Yee & Bailenson 2007, p. 287). Even simple clothing
changes, such as the color of the avatar’s robe, can impact the desired behaviors of the user (Merola, Penas
et al., 2006). Graphical avatars are the dominant way to represent one’s self in virtual worlds (Walther, 1996)
and as this form of representation increases so too will the interplay between the human and the avatar (Yee
& Bailenson, 2007). The fact that a person’s avatar changes their behavior, coupled with the speed at which
the change occurs, is especially encouraging for interventions aimed at changing health related attitudes and
behaviors.
HEALTH‐RELATED DATA COLLECTION IN VIRTUAL ENVIRONMENTS
Opportunities
Chief among the many benefits of collecting data in virtual environments is how “real” the virtual world
actually is to its residents (Blascovich, 2002) and how closely the behaviors in virtual environments mimic
those in physical environments (Yee, Bailenson, et al.,2007). Underlying the seemingly surrealistic virtual
environment is a true community that, in many ways, operates similarly to the physical world in its social
norms and behaviors (Yee, Bailenson et al., 2007; Ikegami & Hut, 2008). While the landscape and the avatars
that an individual interacts with may be virtual, the person behind the avatar is real, and the emotions that
he or she feels can be as real as those experienced in physical worlds (Ikegami & Hut 2008). The real
presence that an individual feels in a virtual environment allows that person to behave and interact in a way
that is familiar to social scientists thereby making it possible to create education and intervention programs
and to collect health related data.
Manipulating the research environment. In interacting in this environment, researchers have learned
that one of the biggest opportunities is the ability to manipulate virtually all aspects of the research
environment. This is important because research indicates that the physical attributes of the research avatar
can impact the responses from a participant. In a study manipulating interviewer characteristics, Dean et al.

254
found that avatars were more likely to report having a heavier SL body size and higher real life BMI to a
heavier avatar than they were to a thinner avatar (2009). With very little work, a researcher can change his
or her appearance in any number of different ways. Along the same lines, since an individual can
manipulate their virtual presence it provides a level of perceived anonymity in interactions that may
possibly result in more honest answers when responding to sensitive health questions (Foster, forthcoming).
Reduced cost. Another large opportunity in virtual environments is the relative cost of conducting
research. Conducting research in virtual environments is generally less expensive than in physical
environments because there are no brick and mortar buildings to build and maintain, no transportation
costs to account for, and the speed of collecting data is often quicker (thus lessening the general cost). In
addition to the cost savings of not having physical sites, there is a significant difference in the cost of
incentives in virtual worlds. In Second Life, the typical incentive for participation in a survey is $250 Linden
Dollars—about $1 U.S. dollar. This incentive amount has been proven to be highly effective at recruiting
participants for survey participation (Bell, Castronova et al., 2009; Dean et al., 2009; Foster, forthcoming) and
is significantly less than what most recruitment incentives used in the physical world.
Challenges
Interestingly enough, even though virtual worlds offer unparalleled advancements in technology,
teaching, and entertainment, they are not always terribly easy to work with for those wishing to conduct
serious research on virtual world residents. Well‐established educational and research institutes currently
are examining the necessary tools needed to engage virtual worlds residents in research that adds to the
body of knowledge particularly around methodological issues such as sampling (Bell, Castronova et al.,
2008; Bell Castronova et al, 2009) and interviewer effects (Dean, Cook et al., 2009). Wood, Griffiths, and
Eatough (2004) identified four key areas of methodological concern when conducting research in virtual
worlds—recruiting and utilizing research participants, viable methods of data collection, validity of data
collected, and ethical issues.
Sampling and Data Collection. One of the biggest issues facing researchers in general, and virtual
worlds in particular, is how to get individuals to participate in research projects and how to select them in a
manner that does not introduce any undue bias into the project—usually accomplished through sampling
(Wood, Griffiths et al., 2004). There are two broad categories in which most samples fall—those selected at
random and samples of convenience. The problem with samples of convenience is that there is usually no
known probability for each respondent, which means that any generalizations must be based on
nonstatistical grounds (Keppel & Wickens, 2004). This is in contrast to a random sample, in which
respondents are drawn from a known population such that each member has an known probability of
selection; and, if done randomly and appropriately, will ideally yield results very close to what would have
been achieved by interviewing each member of the population.
However, random sampling in virtual worlds is difficult because very few, if any, worlds share
information about their users. There is no phone book so they cannot be called, no permanent addresses to
send a letter, and no easy way to randomly identify individuals. Unfortunately, this makes it all but
impossible to design a random sample where each individual has an equal probability of selection. At
present, most research in virtual worlds relies on convenience samples, which can be problematic when
trying to generalize to a broader population (Keppel & Wickens, 2004).
At the present time are only two surveys completed in Second Life that can make a reasonable claim to
have randomly collected data (Bell, Castronova et al., 2009; Foster, forthcoming) and to examine those data

Proceedings of the 10th Conference on Health Survey Research Methods 255
with ones collected via convenience methods. There were no differences between the random and
convenience sample groups in the Foster study and the only real difference between the quasi‐random
sample and the other samples in the Bell, Castronova et al. study was age and income—both of which
showed a more spread out distribution in the quasi‐random protocol than they did in convenience protocol.
After reviewing the participation rates and analyzing data as well as comparing the relative cost of each
method both studies concluded that the differences between the random protocol and the convenience
protocol modes are not large enough to warrant the increased expense (Bell, Castronova et al., 2009; Foster,
forthcoming).
Data Validity. When collecting data from a resident of a virtual world, many of the visual and aural
cues that both researchers and participants rely on in the physical world are absent. For instance, a virtual
researcher can ask the gender of a resident but they have no way to verify the actual gender of the
individual behind the avatar whereas in the physical world they would be able to determine this with a
reasonable degree of certainty from seeing the participant or talking with them. Although the problem of
verification is highlighted in virtual world research, it is largely similar to any self‐reported data that is
administered remotely (such as a questionnaire by mail or telephone) and requires the researcher to build in
checks (such as follow‐up communications) to attempt to determine the validity of the data (Wood, Griffiths
et al., 2004).
Larger threats to data validity, and ones that are rarely addressed by researchers in their writings, are
technical and interference issues (such as hacking, harassing, and generally disrupting the process – also
broadly referred to as “griefing” in virtual worlds) that can immobilize the entire research project and
destroy or corrupt all the data collected. In the best of situations it is nearly impossible to conduct a research
project without some level of technical difficulties, whether that is making sure that your survey
participants understand the questions on paper, trying to minimize interviewer effects in telephone surveys,
or ensuring that all proctors administer exams with the same instructions. However, surveying in virtual
worlds brings a whole new host of technical issues that require specialized learning to address such as
server protection and security, programming, and general technical literacy. Another big issue is that the
environment in which the research is conducted is largely out of the researcher’s control (Bell, Castronova,
et al., 2009) such that if the host world experiences a glitch and is forced to shut down then so is the research
project.
In most virtual worlds there is a “general absence of law and some degree of social indifference” (Bell,
Castronova et al., 2009 P.6) that proves to be a breeding ground for organized crime groups and other lone
individuals who seek to disrupt the experiences of other residents (called “griefers”). In general, griefers are
individuals who are very skilled at virtual world play and online games but “what they most enjoy about
these games is making other players not enjoy them” (Dibbell, 2008, p. 2). Griefers have recently become an
issue to the research field as they attempt to hack into payment systems or fill out surveys in a manner that
indicates that the information was not true (Bell, Castronova et al., 2009; Foster, forthcoming). This
oftentimes forces the temporary suspension of research projects and can yield unusable data. These
individuals and groups can make conducting research unpredictable and put data collection and quality at
risk, but unfortunately there is not a great deal that a researcher can do to prevent these occurrences.
Generally they just have to be dealt with when or if they happen by taking steps to ensure that research
accounts are monitored and data is properly vetted and cleaned (Bell, Castronova et al., 2009).
Ethics. The ethical issues in virtual worlds research are not terribly different from that of the physical
world. Mckee and Porter (2009) suggest that most of the ethical issues under consideration for virtual
worlds—informed consent, respondent burden and stress, vulnerable populations—all have some

256
counterparts in the physical world. For instance, researchers know they must gain informed consent from a
person before beginning a research experiment. But, an avatar is not a human. Should it be afforded the
same protections as a human? What about private space? Is there such a thing as “private space” in a totally
open society such as Second Life? In 2004, researcher Malin Sveningsson argued that the public‐private
dichotomy is not sufficient to determine ethical judgments (Sveningsson, 2004) particularly in a virtual
world. Instead, she stated, one must consider both the issue of the public vs. private sphere as well as how
sensitive the information is to the respondent (Sveningsson, 2004).
Compared with traditional research participants, those in virtual environments may be at increased risk
for respondent stress due to the lack of verifiable non‐verbal cues (such as age, race, gender, inflection in
voice, and eye contact) (Woods, Griffiths et al., 2004). Additionally, researchers are able to modify their
appearance to mask their real age, ethnicity, or gender thereby conveying an identity that is not truly theirs
which can also increase respondent stress. In the absence of these indicators that convey unspoken meaning,
researchers should take great care to create environments and word questions in such a way as to ensure
clarity and meaning, avoid deception, and respect a participant’s right to privacy (Wood, Griffiths et al.,
2004). Along these same lines, they suggest that since there is no way to determine with certainty who is
behind the avatar participating in the study, it is important to consider the presence of typically vulnerable
populations (Wood, Griffiths et al., 2004) and to act accordingly.
DISCUSSION
The opportunities for collecting health related data are many as are the challenges. While it is certainly
difficult to design research projects that utilize conventional methods with regards to sampling and data
collection, the rewards for being able to “think outside the box” and develop new methods is vast.
Researchers are able to modify their gender, race, age, and environment in ways that could potentially
increase respondent comfort and reduce the desire to provide socially acceptable responses. By giving
respondents another layer of anonymity and protection, it is possible to obtain more truthful responses
which could lead to more effective health related education and interventions. Additionally, since the avatar
and the individual are one in the same, there is great potential for impacting the health of the real individual
through interventions that target the behavior of the avatar. Research in virtual worlds is a rapidly evolving
science that, while similar to research in the physical world, does have very different methodological and
ethical challenges that must be approached with the same degree of seriousness as research in the physical
world.
REFERENCES
Baumann, S. B., & Sayette, M. A. (2006). Smoking cues in a virtual world provoke craving in cigarette
smokers. Psychology of Addictive Behaviors, 20, 484–489.
Beard, L., Wilson, K., Morra, D., & Keelan, J. (2009). A survey of health‐related activities in Second Life.
Journal of Medical Internet Research, 11, e17.
Bell, M. W., Castronova, E. & Wagner, G. (2008). Virtual assisted self interviewing (VASI): An expansion of
survey data collection methods to the virtual worlds by means of VDCI. DIW Berlin, German Institute for
Economic Research, Data Documentation No. 37.
Bell, M. W., Castronova, E., & Wagner, G. (2009). Surveying the virtual world: A large scale survey in Second Life
using the Virtual Data Collection Interface (VDCI). DIW Berlin, German Institute for Economic Research,
Data Documentation No. 44.

Proceedings of the 10th Conference on Health Survey Research Methods 257
Bell, M. W., & Consalvo, M. (2009). Culture and virtual worlds: The not‐quite‐new experiences we study.
Journal of Virtual Worlds Research, 1, 3–5.
Bordnick, P. S., Graap, K. M., Copp, H., Brooks, J., Ferrer, M., & Logue, B. (2004). Utilizing virtual reality to
standardize nicotine craving research: A pilot study. Addictive Behaviors, 29, 1889–1894.
CDC. (2009). Virtual Worlds—eHealth Marketing. Retrieved August 8, 2009, from
www.cdc.gov/HealthMarketing/ehm/virtual.html.
Cooley, C. H. (1902). Human nature and the social order. New York: Scribner’s.
Dean, E., Cook, S., Keating, M., & Murphy, J. (2009). Does this avatar make me look fat? Obesity and
interviewing in Second Life. Journal of Virtual Worlds Research, 2, 3–11.
Dibbell, J. (2008). Mutilated furries, flying phalluses: Put the blame on griefers, the sociopaths of the virtual
world. Wired, 16, 90–97.
Hussain, Z., & Griffiths, M. D. (2008). Gender swapping and socializing in cyberspace: An exploratory
study. CyberPsychology and Behavior, 11, 47–53.
Ikegami, E., & Hut, P. (2008). Avatars are for real: Virtual communities and public spheres. Journal of Virtual
Worlds Research, 1, 1–18.
Keppel, G., & Wickens, T. D. (2004). Design and analysis: A researcher’s handbook (4th ed.). New Jersey: Pearson
& Prentice Hall.
Krebs, P., Burkhalter, J., Lewis, S., Hendrickson, T., Chiu, O., Fearn, P. et al. (2009). Development of a virtual
reality coping skills game to prevent post‐hospitalization smoking relapse in tobacco‐dependent
patients. Journal of Virtual Worlds Research, 2, 3–12.
LindenLabs. (2009, August 12). The Second Life economy—Second quarter in detail. Retrieved August 14,
2009, from https://blogs.secondlife.com/community/features/blog/2009/08/12/the‐second‐life‐economy‐‐
second‐quarter‐2009‐in‐detail.
McKee, H., & Porter, J. (2009). Playing a good game: Ethical issues in researching MMOGs and virtual
worlds. International Journal of Internet Research Ethics, 2, 5–37.
Merola, N., Penas, J., & Hancock, J. (2006). Avatar color and social identity effects: On attitudes and group
dynamics in virtual realities. Paper presented at the International Communication Association (ICA) 2006,
Dresden, Germany.
Norris, J. (2009). The growth and direction of healthcare support groups in virtual worlds. Journal of Virtual
Worlds Research, 2, 3–20.
Oblinger, D. G., & Oblinger, J. L. (Eds.). (2005). Educating the Net generation. Educause. Retrieved February
13, 2012, from www.educause.edu/educatingthenetgen
Robbins, S., & Bell, M. W. (2008). Second Life for dummies. Indianapolis: Wiley Publishing, Inc.
Schizophrenia.com (2009). Schizophrenia in a computer game. Retrieved August 8, 2009, from
www.schizophrenia.com/sznews/archives/001509.html.
Sveningsson, M. (2004). Ethics in Internet ethnography. Hershey, PA: Information Science.
Walker, V. (2009). 3D virtual learning in counselor education: Using Second Life in counselor skill
development. Journal of Virtual Worlds Research, 2(1).
Walther, J. (1996). Computer‐mediated communication: Impersonal, interpersonal, and hyperpersonal
interaction. Communication Research, 23, 460–487.
Wood, R., Griffiths, M. D., & Eatough, V. (2004). Online data collection from video game players:
Methodological issues. CyberPsychology and Behavior 7, 511–518.
Yee, N., & Bailenson, J. (2007). The Proteus effect: The effect of transformed self‐representation on behavior.
Human Communication Research, 33, 271–290.

258
Yee, N., Bailenson, J. N., Urbanek, M., Chang, F., & Merget, D. (2007). The unbearable likeness of being
digital: The persistence of nonverbal social norms in online virtual environments. CyberPsychology and
Behavior, 10, 115–121.

Proceedings of the 10th Conference on Health Survey Research Methods 259
HINTS‐GEM: Using Science 2.0 to Construct a National Health Survey through Community Engagement
Richard P. Moser (Behavioral Research Program, National Cancer Institute) Ellen Burke Beckjord (University of Pittsburgh)
Lila J. Finney Rutten (Clinical Research Directorate/CMRP, SAIC‐Frederick, Inc., NCI‐Frederick) Kelly Blake (Behavioral Research Program, National Cancer Institute)
Bradford W. Hesse (Behavioral Research Program, National Cancer Institute)
INTRODUCTION
With the rapid increase in the use of the Internet and its capabilities, scientists are taking advantage of
collaborative Web technology to accelerate discovery in a new participative environment, a phenomenon
referred to as Science 2.0 (Shneiderman, 2008). This builds off the idea of Web 2.0—defined by technologies
such as wikis, blogs, and other means for sharing information and collaborating with other users (e.g.,
seeing comments and ratings by users of Amazon.com) with specific application to the scientific arena.
These technologies can be seen as a way of creating a new collaborative environment of openness,
transparency, and crowd‐sourcing (i.e., wisdom of crowds; Surowiescki, 2004). Likewise, there is a recent
push within the Federal government toward openness and transparency, exemplified by the Open
Government Initiative (www.whitehouse.gov/open/), which seeks to “…establish a system of transparency,
public participation, and collaboration.” This movement extends to the Federal data system through sites
like Data.gov and Healthdata.gov, which provide—free to the public—a large number of data sets and data
tools for public consumption. This movement toward openness and transparency, in part, aims to increase
knowledge and engage and empower communities (broadly defined) to improve their health. The
Community Health Data Initiative (CHDI; www.hhs.gov/open/datasets/communityhealthdata.html) is a
Department of Health and Human Services (DHHS) program under the Open Government Initiative that
seeks to empower consumers and communities to get more value out of the myriad sets of health data that
exist in the U.S. This initiative provides data and tools in user‐friendly formats to increase disease
prevention, health promotion, and health care quality and performance. Now more than ever, the public has
access to quality data to inform their health decisions and empower their communities around wellness.
In addition to efforts to promote and enable use of existing data through initiatives like the CHDI,
communities increasingly are encouraged to collect their own data and use existing measures to ensure that
their results can be compared with existing data. In keeping with this idea, a 2010 Institute of Medicine
(IOM) report on the role of measurement in the Federal surveillance system states that communities need
data and indicators of health to make important decisions; however, it cautions against creating a plethora
of indicators that could create more confusion than clarity. One of the seven recommendations to come from
this report states that DHHS should create (a) a core standardized set of indicators that can be used to assess
the health of communities and (b) a core standardized set of health‐outcome indicators for national, state,
and local use. One effort to address the need for standardized indicators is the recently created Health
Indicators Warehouse (www.healthindicators.gov/), which provides a large number of indicators organized
by topic, geography, or initiative, with the goal of providing outcomes that can be harmonized and directly
compared across different levels. Thus, it is important to not only make data publicly available to empower
communities but also encourage the use of shared indicators of health outcomes to maximize the utility of
data collection efforts.

260
HINTS & HINTS‐GEM
Open data, data harmonization, and empowering communities are basic tenets underlying the National
Cancer Institute’s (NCI) Health Information National Trends Survey (HINTS). In this report, we describe a
Web‐based tool called HINTS‐GEM, which was created to leverage the collective intelligence of a large
group of researchers committed to using national surveillance as a means to improve cancer prevention and
control. HINTS‐GEM is an extension of another of NCI’s tools—the Grid‐Enabled Measures (GEM)
database—that contains behavioral and social science measures organized by theoretical constructs and is
designed to enable researchers to use common measures with the goal of exchanging harmonized data.
(Further detail on GEM is provided below.) Engaging a variety of researchers in the process of building a
HINTS instrument is not new; collaboration has been central to the HINTS program since its inception, and
the data collected by HINTS have always been publicly available (further details on the HINTS program are
provided below). However, for the current iteration of HINTS (HINTS 4), the NCI made a commitment to
build upon the Open Government Initiative and activities like the Community Data Health Initiative to
capitalize upon technology‐mediated social participation to enable a transparent process for the
development of content for HINTS 4, with the goals of increasing the breadth and depth of input from a
community of researchers and health advocates.
THE HEALTH INFORMATION NATIONAL TRENDS SURVEY (HINTS) PROGRAM
HINTS is a national health communication survey conducted by the NCI, which has the vital mission of
developing and implementing programs that prevent and reduce the incidence of cancer. HINTS was
designed to support the mission of the NCI’s Health Communication and Informatics Research Branch
(HCIRB) by providing a means to systematically evaluate the public’s knowledge, attitudes, and behaviors
relevant to health communication and cancer prevention and control, which have not adequately been
studied through other national data collection efforts prior to HINTS.
PURPOSE OF HINTS
The HINTS framework takes into account that the successful development and communication of public
messages about cancer prevention, detection, diagnosis, treatment, and survivorship require comprehensive
understanding of individuals’ access to cancer‐related information, perceived trust in information sources,
cancer‐ and health‐related knowledge, and in‐depth knowledge of the factors that facilitate or hinder
communication. HINTS aims to assess the public’s use of health information in an environment of rapidly
changing communication and informatics options and allows the intramural and extramural research
community access to the data to conduct research into the relationships between health information,
knowledge, attitudes, and behaviors. Prominent constructs and resultant item development for HINTS were
informed by the emerging theories of health communication (Glanz, Lewis, & Rimer, 1997), media usage
(Viswanath & Finnegan, 1996), risk information processing (Croyle & Lerman, 1999; Fischhoff, Bostrom, &
Quadrel, 1993), diffusion of innovations (Rogers, 1995), and behavior change (Weinstein, 1993). A more
detailed discussion of the conceptual framework underlying item selection is published elsewhere (Nelson
et al., 2004).

Proceedings of the 10th Conference on Health Survey Research Methods 261
HINTS‐GEM
For the first three HINTS data collection efforts, instrument development relied upon a collaborative
process involving relevant content including intramural staff at NCI and colleagues external to the
government, in academic and research settings. HINTS 4 will include four data collection cycles over the
course of three years, beginning in October 2011. The instrument for each data collection cycle will include a
core module of trended items in addition to special topic modules to be implemented in only some of the
cycles, increasing capacity of the HINTS instruments to include additional topics and measures.
RATIONALE & GOALS
The guiding framework for HINTS highlights the multiple factors that play a role in understanding the
role of health communication in cancer prevention and control. Given the variety of perspectives that must
be taken into account for successful instrument development, the HINTS program has always solicited
input for the HINTS instruments from a community of researchers. These researchers represent a number of
disciplines including behavioral science, clinical psychology, social psychology, communication science, and
health behavior. For HINTS 4, the NCI asked researchers who wanted to “help build a better HINTS” to use
HINTS‐GEM as a forum for their input.
The NCI had four goals in building HINTS‐GEM:
Increase the efficiency, organization, transparency, and success of building an item pool for the
HINTS 4 instruments;
Broaden participation in the instrument building process, both with respect to the number of
participants and the substantive content represented by participants’ areas of expertise;
Enhance the degree to which researchers are engaged with the HINTS Program—e.g., using HINTS
data or HINTS instruments in their own research—by increasing their opportunities to be a part of
the HINTS 4 process from the very start; and
Keep a community of researchers engaged and up‐to‐date with the HINTS 4 modular data collection
process over its three‐year administration period.
DESIGN
HINTS‐GEM copied the basic design and infrastructure of the NCI’s Grid‐Enabled Measures Database
(GEM; www.gem‐beta.org). Briefly, GEM is a grid‐enabled, interoperable Web site of behavioral and social
science measures. In GEM, researchers have the opportunity to search, download, and provide feedback on
measures as well as share data that result from use of the measures. In GEM, content is primarily divided
into constructs and measures, where constructs represent larger areas of inquiry (e.g., cancer information
seeking) and measures are scales or single items that assess a specific outcome (e.g., “During your last
search for cancer information, how concerned were you about the quality of the information?”). Each
measure is assigned to one construct, though each construct may contain several measures (a “one‐to‐many”
relationship; see Figure 1).
HINTS‐GEM development began in June 2010. At that time, 81 constructs appeared in GEM; these were
imported into HINTS‐GEM so that the site was initially populated with these 81 constructs. Next, HINTS‐
GEM was populated with measures, including every item that appeared on a previous iteration of HINTS
(the 2003, 2005, and 2008 instruments). These 526 items were assigned constructs by the HINTS
Management Team. As needed, new constructs were created.

2
i
t
o
n
“
u
a
H
c
p
a
b
d
G
i
a
“
l
o
G
f
c
G
w
M
C
d
f
c
p
G
t
v
s
v
C
262
The HINT
ncludes four
tabs: one for c
one for measu
news, and on
“About.” The
used to push
announcemen
HINTS‐GEM
community. (
posts usually
accompanied
blast to regist
directing them
GEM for mor
nformation a
announcemen
“About” tab i
inks to a Web
orientation to
GEM and a H
fact sheet.
The main
capabilities o
GEM are con
within the Co
Measures tab
Constructs ta
data spreadsh
four columns
construct. A c
prepopulated
GEM user). (S
The Meas
the measure;
value for this
source; and th
values: Recom
Consideration
Function
Users
consi
measu
requi
TS‐GEM site
r separate
constructs,
ures, one for
ne labeled
e news tab is
nts out to the
M user
(News tab
y are
d by an e‐mai
tered users,
m to HINTS‐
re
about the
nt.) The
includes
b‐based
o HINTS‐
HINTS‐GEM
n functional
of HINTS‐
ntained
onstruct and
bs. The
ab shows a
heet with
s: construct n
construct’s st
d into HINTS
See Figure 2.
sures (i.e., Ite
the measure
s column indi
he number o
mmended for
n. (See Figur
nal capabiliti
s can contribu
deration by t
ure—e.g., de
red to supply
e
il
‐
name, its defi
tatus could h
S‐GEM via G
)
ems) tab show
e text; the HIN
icates the me
of comments
r Inclusion in
re 1.)
es. Five func
ute content to
the user com
efinition, sou
y a definition
Figure 1. H
Figure 2.
inition, its sta
have one of tw
EM) or Unde
ws a data spr
NTS data set
easure was n
attached to t
n HINTS 4; R
ctional capab
o the data set
mmunity. Met
rce) are requ
n but are enc
HINTS‐GEM M
HINTS‐GEM Co
atus, and the
wo values: Im
er Considera
readsheet wi
t(s) in which
newly propos
the measure.
Recommende
ilities exist w
by adding n
ta‐data (infor
uired for both
couraged to e
Measures Page
onstructs Page
number of c
mported from
ation (if the c
ith six colum
the measure
sed for HINT
A measure’s
ed for Exclus
within HINTS
new construc
rmation that
h. When addi
enter other in
e
comments att
m GEM (if th
onstruct was
mns: The cons
e previously a
TS); the meas
s status could
sion from HIN
S‐GEM:
cts or measur
describes the
ing a new co
nformation su
tached to the
he construct w
s created by a
truct associa
appeared (a m
ure’s status;
d have one o
NTS 4; or Un
res (i.e., items
e construct o
onstruct, user
uch as theore
e
was
a HINTS‐
ated with
missing
its
f three
nder
s) for
or
rs are
etical

Proceedings of the 10th Conference on Health Survey Research Methods 263
foundation and synonymous constructs. When adding a new measure, users are required to assign
the measure a construct (and are given the option to create a new construct, if the one they are
looking for does not exist, as part of the process); to specify the measure’s response option(s); and to
indicate whether the measure is a trend measure (i.e., has appeared on a previous iteration of
HINTS); appears on another survey (and if so, which survey); is central to a theory of health
behavior (and if so, which theory); or appears in the Cancer Data Standards Registry and Repository
(caDSR).3 Finally, users are asked to provide a brief comment that explains their rationale for adding
the measure to HINTS‐GEM.
Users can comment on constructs or measures using free text.
Users can rate measures on a scale from one to five with five being the highest rating.
Users can propose alternatives to measures in lieu of creating a new measure, if what they want to
propose is substantively similar or related to a measure that already appears in HINTS‐GEM.
Users can sort the interface by any column header and can search HINTS‐GEM for specific content.
The meta‐data requirements for adding new measures to HINTS‐GEM were intended to encourage
users to consider factors related to measure standardization and data harmonization. While users were free
to add any measure they chose to HINTS‐GEM, by requiring meta‐data on a measure’s trend potential, its
appearance in another surveillance effort, its relationship to theory, and its status in the caDSR, the HINTS
Program aimed to encourage HINTS‐GEM users to propose new content for HINTS 4 commensurate with
one (or more) of these features. The hypothesis was that doing so would solicit new content from HINTS‐
GEM users that met these requirements and would therefore lead to the HINTS 4 data having good
potential for harmonization with other surveillance efforts at multiple levels (e.g., local, regional, national,
and global).
BUILDING A HINTS‐GEM COMMUNITY
Concurrent with the development of HINTS‐GEM, the NCI began work on building a community of
researchers to use the site. This work happened in two phases:
Enlisting Participation from HINTS Champions. Twenty‐one HINTS Champions (i.e., individuals who
had contributed to HINTS development in the past or who were known by NCI to be HINTS data users)
from the extramural research community and internal to NCI were initially invited to be the first HINTS‐
GEM users in August 2010. These Champions participated in an online HINTS‐GEM orientation in
September 2010. Champions were assigned content areas (i.e., constructs) based on their areas of substantive
expertise and/or content they had helped to develop in previous HINTS instruments. Champions were
charged with three tasks to complete by the end of October 2010. First, they were asked to review the
measures already contained within HINTS‐GEM (i.e., measures that had appeared in a previous iteration of
the survey) and assign the appropriate status to each. If a Champion wanted the measure to be considered
for HINTS 4, then they indicated a status of “Recommended for Inclusion in HINTS 4.” If they thought the
measure should be excluded from HINTS 4, they changed the status to “Recommended for Exclusion from
HINTS 4.” Finally, if they wanted a larger community to have input into the decision, they left the
measure’s status as “Under Consideration.” Second, Champions were asked to populate HINTS‐GEM with
new measures for consideration in HINTS 4. Finally, Champions helped to disseminate information about
3 The caDSR is a tool associated with the cancer biomedical informatics grid (caBIG); it creates and deploys common data
elements to be used by the cancer research community. For more information, see https://cabig.nci.nih.gov/concepts/caDSR/

264
HINTS‐GEM to a broader community of research using prepared e‐mail blasts and PowerPoint slides for
use at conferences or in communication with their respective professional societies.
Enlisting Participation from General Users. Concurrently, NCI prepared a larger HINTS‐GEM
promotion campaign for launch at the 2010 American Public Health Association (APHA) annual meeting
held in early November 2010 in Denver. HINTS Program staff was available on‐site during the meeting to
demonstrate HINTS‐GEM and to register new users to the site. HINTS‐GEM Fact Sheets were available at
the meeting, information about HINTS‐GEM was disseminated via the HINTS Web site
(http://hints.cancer.gov), and an e‐mail describing HINTS‐GEM (and directing potential users to an online
HINTS‐GEM orientation) was sent to all e‐mail addresses on record with the HINTS Program. These e‐mail
addresses represent individuals who had asked to download HINTS data in the past or who had reached
out to the HINTS Program for another reason. General HINTS‐GEM users had all the same functional
capabilities as HINTS Champions except that general users were unable to change the status of measures.
Periodic e‐mail announcements and HINTS‐GEM news items were sent and posted to encourage
continued participation in HINTS‐GEM after the official launch to a broad community of researchers at
APHA. The HINTS Program provided technical support to HINTS‐GEM users as needed. Communication
with the HINTS‐GEM community first emphasized adding measures to HINTS‐GEM (November 2010–
December 2010), moved to commenting on measures (January 2011), and finally focused on rating measures
in HINTS‐GEM (February 2011–March 2011). In March, 2011, all measures in HINTS‐GEM with a status of
“Recommended for Inclusion in HINTS 4” or “Under Consideration” were submitted—as required by all
public surveys—to the Office of Management and Budget (OMB) as an “over‐inclusive item pool.” This pool
represents the group of items that researchers will select from as they work with the HINTS Program to
build the HINTS 4 instruments. Final disposition by HINTS status can be seen in the table below.
Measure Disposition, by HINTS Status
Measure Disposition
Measures from Previous HINTS Iterations (n = 526)
Measures Newly Proposed for HINTS 4 (n = 647)
Recommended for inclusion 37.6% 41.7% Recommended for exclusion 36.5% 6.3% Under consideration 25.9% 51.9%
RESULTS
There were 51 HINTS‐GEM Champions and an additional 87 users who contributed to HINTS‐GEM.
Most users came from academia (52%) or government (30%), though the private sector (10%), advocacy
groups (4%), and HMO/medical centers (4%) also were represented. Although users were required to
register in order to participate (for tracking and accountability purposes), they only were asked for their
name and affiliation, so detailed information about them is limited.
HINTS‐GEM was initially seeded with 81 constructs from GEM and 526 measures from all three
previous iterations of HINTS. By the end of the campaign, four new constructs and 647 new measures had
been proposed, resulting in a total of 85 constructs and 1,173 measures in the HINTS‐GEM database. The
total number of measures (both existing and new) were spread across the constructs with several having a
large number of measures (tobacco use = 130; colorectal cancer = 75, use of technology = 69, health
information seeking = 60) and others having very few measures (for example, belief in a just world = 1,
religiosity and spirituality = 1). A total of 60 alternative measures were proposed as potential replacements
or alterations for existing measures.

Proceedings of the 10th Conference on Health Survey Research Methods 265
Across all measures, the number of comments ranged from 0–8 with 167 (14%) having no comments and
a majority (71%) having one or two comments. Regarding ratings, a large majority had no ratings (89%), and
for those that were rated, most had only one related comment (9%). The ratings themselves tended to be
negatively skewed such that 87% of measures with ratings had an average value of 4 or greater (range 1–5,
with 5 being the “best” measure). In regards to the reasons for including a new measure, out of the 647 new
measures proposed, the following results were seen: (1) This is a trends measure (4%), (2) This measure
appears on another survey (19%), (3) This measure is central to a theory of health behavior (9%), and (4) This
measure is designated in the Cancer Data Standards Registry and Repository (0%).
THE FUTURE OF SURVEY DESIGN: OPENNESS, DATA HARMONIZATION, & EMPOWERING COMMUNITIES
Now more than ever, researchers and survey methodologists have access to vast amounts of information
and data—it truly is the era of Big Data (Nature, 2008). However, a lack of resources to manage this data
deluge—including computer processing power, which is sorely lagging behind (King, 2011)—are
hampering our ability to move science forward quickly and efficiently. We need better tools so we can take
advantage of these data.
There is also a sense that in the Federal government surveillance system, we can do more with what we
have. Conducting more surveys does not seem to be the answer; conducting better surveys in a systematic
and coordinated fashion does. This means creating agreed‐upon health indicators and outcomes that can be
shared and used by others. If this can be accomplished more readily, the ability to compare across data
collection systems will be enhanced (IOM, 2010). It also means systematic planning across data collection
systems to avoid duplication of efforts or just as importantly, to identify gaps that need to be filled. This can
decrease costs, increase efficiency, and allow researchers to learn and build off each others’ work—that is,
build a cumulative science. Evidence of tools to enhance collaboration and harmonize data already are
available but primarily are focused on enhancing smaller‐scale research protocols, rather than on
capitalizing upon population‐level surveillance systems. These tools, such as PhenX (consensus measures
for Phenotypes and eXposures; https://www.phenx.org/), GEM (Grid‐Enabled Measures; www.gem‐
beta.org), the NIH Toolbox (www.nihtoolbox.org/default.aspx), and PROMIS (Patient Reported Outcome
Measurement Information System; www.nihpromis.org/), have similar goals of pushing for the use of
common measures that can be used by the research community. The overall idea is that if researchers can
agree a priori on which measures to use in their research, the ability to share resulting harmonized data and
build a cumulative science increases.
HINTS‐GEM was built to increase the HINTS Program’s commitment to and enablement of measure
sharing and data harmonization. The results presented here suggest that the NCI achieved success at several
levels through use of HINTS‐GEM. Not only did the number of researchers who engaged in the HINTS
development process greatly increase over years past, but the amount of new content proposed, as well as
consensus regarding existing HINTS content, increased as well. Additionally, the more than 100 HINTS‐
GEM users who engaged in the process of building the HINTS four‐item pool are now in a position to use
the consensus‐driven measures found in HINTS‐GEM in their own research, thus allowing for
harmonization between local and national surveillance efforts.
The HINTS Program already has engaged in this sort of partnership: in 2009, the NCI partnered with the
University of Puerto Rico to field a HINTS survey in the U.S. territory of Puerto Rico. Because there was a
conscious effort to reuse the same items from HINTS 2008, there now exists ways of making direct

266
comparisons in outcomes between the two surveys and associated geographic areas. The development of
similar partnerships is currently underway, and these future efforts will be able to make use of the HINTS‐
GEM infrastructure to increase the efficiency and effectiveness of these endeavors.
There are several next steps for using HINTS‐GEM. The site will be used to solicit further input to build
consensus around the items that are selected for the Cycle 1, 2, 3, and 4 HINTS 4 instruments. HINTS‐GEM
also will be used to communicate with the HINTS community about final item selections so researchers can
field local HINTS data collections in concert with the national‐level data collection if they so choose. Finally,
when HINTS 4 data are collected, the data will be made publicly available on HINTS‐GEM, with the
opportunity for researchers to share their own local HINTS data collections via the site.
CONCLUSION
Technology is now enabling access to vast amounts of data; it also provides new ways of collaborating
and conducting science. This new paradigm, referred to as Science 2.0, has the capability of moving science
forward in ways we are just starting to understand. This paradigm was utilized by the HINTS Program as it
took collaborative science regarding survey content to a new level. The data from the HINTS‐GEM
experiment suggest that the results of this elevation in changing the process of collaboration will lead to
better surveillance instruments, more actively engaged researchers, harmonized data across surveillance
efforts, and greater power to detect meaningful results that can be translated into policy and practice aimed
at improving health and wellness.
FUNDING
This project has been funded in whole or in part with funds from the National Cancer Institute, National
Institutes of Health, under Contract No. HHSN261200800001E. The content of this publication does not
necessarily reflect the views or policies of the Department of Health and Human Services, nor does mention
of trade names, commercial products, or organizations imply endorsement by the U.S. government.
REFERENCES
Croyle, R. T., & Lerman, C. (1999). Risk communication in genetic testing for cancer susceptibility. Journal of the
National Cancer Institute Monographs, 25, 59–66.
Fischoff, B., Bostrom, A., & Quandrel, M. J. (1993). Risk perception and communication. Annual Review of Public
Health, 14, 183–203.
Glanz, K., Lewis, M., & Rimer, B. K. (Eds.). (1997). Health behavior and health education: Theory, research and practice.
San Francisco: Jossey‐Bass.
Institute of Medicine (2010). For the public’s health: The role of measurement in action and accountability. Retrieved
June 21, 2011, from www.iom.edu/Reports/2010/For‐the‐Publics‐Health‐The‐Role‐of‐Measurement‐in‐Action‐
and‐Accountability.aspx
King, G. (2011). Ensuring the data‐rich future of the social sciences. Science, 331, 719–721.
Nature. (2008). Big data. Retrieved September 28, 2012, from www.nature.com/news/specials/bigdata/index.html
Nelson, D. E., Kreps, G. L., Hesse, B. W., Croyle, R. T., Willis, G., et al. (2004). The Health Information National
Trends Survey: Development, design, dissemination. Journal of Health Communication, 9, 433–460.
Rogers, E. M. (1995). Diffusion of innovations. New York: The Free Press.
Shneiderman, B. (2008, March). Science 2.0. Science, 319, 1349–1350.

Proceedings of the 10th Conference on Health Survey Research Methods 267
Surowiescki, J. (2004). The wisdom of crowds: Why the many are smarter than the few and how collective wisdom shapes
business, economics, societies, and nations. New York: Doubleday.
Viswanath, K., & Finnegan, J. R., (1996). The knowledge gap hypothesis: Twenty five years later. In B. Burleson
(Ed.), Communication yearbook 19. Thousand Oaks, CA: Sage Publications.
Weinstein, N. D. (1993). Testing four competing theories of health‐protective behavior. Health Psychology, 12, 324–
333.

268

Proceedings of the 10th Conference on Health Survey Research Methods 269
SESSION 5 DISCUSSION: Why Aren’t Survey Researchers Better at Leveraging New Technologies?
Michael W. Link4 (The Nielsen Company)
Advances in survey methodology over the past 30 years largely have been the result of or were
facilitated by the adoption of new data collection technologies. Innovations in computer‐assisted
interviewing, personal computers, and software development to facilitate automated data editing and
sophisticated analyses, and new platforms such as the Internet that now allow respondents to participate at
the time of their choosing have all contributed to the advancement and refinement of what we might call
“classic” or “traditional” survey research (i.e., the administration of a questionnaire for the purpose of
obtaining information from a respondent). Over the past decade, the growth and development of innovative
technologies that can be used to collect information from publics of interest has grown exponentially.
Smartphones with their associated applications and audio/video/GPS capabilities, social networking,
techniques for obtaining data from Web pages, and virtual reality environments are just some of the new
potential tools at the disposal of survey researchers. In fact, the potential has never been greater to make real
and significant advances in data collection methods, offering researchers, policy makers, the public, and
other data consumers new insights into health‐related behaviors and attitudes. As the papers presented in
this section attest, there are a wide array of potential new frontiers to explore (see Baker, 2011; Foster, 2011;
Morton, Palipudi, & Asma, 2011; Moser, Beckjord, Rutten, Blake, & Hesse, 2011; Murphy, Dean, Hill, &
Richards, 2011).
Yet, while the potential is great, the level of research among traditional survey researchers in these areas
is quite anemic. What is missing is the research and development engine that was so powerful in moving
the field forward in the 1970s and 1980s. While there are some obvious reasons for the dearth of research
with these new technologies, such as the severe tightening (or complete lack, in some instances) of resources
and funding as well as the closing of many university‐based survey laboratories, there are likely other
factors at work as well. Given the potential transformative impact ready adoption of new techniques and
approaches could have on our industry, it’s important that we ask ourselves a basic question: Why aren’t
survey researchers in this day and age better at leveraging new technologies?
TECHNOLOGY: THE PROMISE & THE RUB
Survey researchers often talk about new technologies as having four key advantages. First, technology
can help to increase the speed of data collection. This is certainly true when we consider the move from
paper‐based questionnaires to computer‐assisted questionnaires. With the former, the tasks of data entry
and data cleaning/editing/quality control can considerably reduce the time it takes between data collection
and data analysis. With computer‐assisted approaches, the recording of data into an analyzable data set is
nearly instantaneous. Second, computerized systems facilitate greater data accuracy via built‐in checks—such
as valid data range checks and response verifications—that can be shown on a screen so that incorrect
responses can be quickly addressed. There are also numerous “back‐end” data quality checks that can be
automated, thereby increasing the quality of the final data output. Third, technology facilitates the
4 The thoughts and views expressed here are solely those of the author and do not necessarily represent the official views
of The Nielsen Company.
270
administration of more complex questionnaires, with more complicated skip patterns and dependency
questions, and longer overall questionnaires with multiple paths. As a result, researcher typically can collect
more data with computerized systems than is usually possible with manual methods. Finally, use of
technology is often discussed in terms of greater cost‐efficiencies. This may or may not be the case depending
on many factors, not the least of which are design, capital costs, and the level of resources required.
What is instructive, however, are the types of advantages offered by technology that survey researchers
typically do not discuss. These include the potential for direct measurement of behaviors (and potentially
attitudes inferred from behaviors) rather than reliance on self‐reports. Such approaches, if executed
properly, could provide a significant boost to data accuracy, reducing the biases and measurement error
inherent in a typical recall survey design. Second, technology can facilitate in‐the‐moment measurement of
behaviors and attitudes—that is, provide measures that coincide with a behavior rather than depending on
respondent recall to capture the activity. The standard survey design is very dependent upon respondent
recall. For example, consider questions such as “In the past 30 days, how many times have you had one or
more drinks of alcohol?”, “In the past year, how many times have you visited a doctor?”, “In the past week,
how often did you dine at a fast food restaurant?” These are data elements that could be captured as they
occur—either through a device used by the respondent to record the event or a passive system based on
GPS coordinates. Finally, there is seldom talk among survey researchers about how new technologies might
provide new types of data and fresh insights—data that could augment or even replace traditional survey
data. For example, the use of Web “spidering” techniques to determine Internet “buzz” (i.e., the recurrence
in postings and blogs of particular key words, concepts, or phrases) on a particular topic could serve as an
indicator of public sentiment on a particular topic. Smartphones, pad‐technology (such as the iPad or
Galaxy), collection of visual data, GPS information, and customized metering technologies are all critical
technologies in other industries but not widely researched or used within more traditional survey research
circles. The low visibility and discussion of these types of benefits of technology raise concerns about how
survey researchers view and therefore use new technologies more generally.
A critical question we need to ask ourselves (e.g., the traditional survey research industry) is “What’s
impeding us from making more rapid progress in the development and use of new technologies?” As
strange as this might seem, perhaps the paradigm that facilitated a golden age in survey research is actually
the framework that holds us back. In other words, is our thinking about new technologies constrained by or
trapped within a well‐established “Survey Paradigm,” one that defines (a) how we think about the world,
(b) how we measure phenomena of interest, (c) how we go about designing our work and (d) how we think
about ourselves in terms of our professional identities? This is not to say that the “Survey Paradigm” is
“bad” or “flawed” per se, but rather that when it comes to viewing (and perhaps even imagining) uses for
new technologies, the overarching dominant paradigm tends to constrain our thoughts and limit our ability
to maximize the full potential of many technologies.
How might we accelerate this process? It requires that we think differently about technology. Both
providing a fresh perspective on how we look at technologies as tools and data sources, and therein
redefining what we want out of new technologies. This will require that we have a willingness to expand
(but not abandon) our current views of “quality data” and “useful data”—adopting instead a view that
different data needs do not have the same demands in terms of level or characteristics of “quality.” We need
also to break the mold in terms of our approaches to problem‐solving. Finding solutions to current and
future problems need not always be a linear process. In fact, some of the best research and development can
occur in the absence of a particular problem at hand that requires solution. Finally, we need to evolve in

Proceedings of the 10th Conference on Health Survey Research Methods 271
terms of our professional self‐image, thinking in a broader manner about our professional mission and how
we view our role in the world of measurement.
THINKING ABOUT TECHNOLOGY & DATA CAPTURE
As survey researchers, we often view new technologies first as potential “survey‐enabling” tools, rather
than as data collection vehicles in their own right. We view the technologies as potential platforms for
hosting surveys rather than as foundations for collecting new forms of information. Often when confronted
with the opportunity to use a new technology we ask ourselves “How can we use technology to conduct a
(traditional) survey?” or “How can we use technology to extend or augment a (traditional) survey?” Instead,
we should ask ourselves “What are the questions / data elements we need to answer / collect to provide
insights into phenomena of interest and how can technology be utilized to acquire that understanding /
those data?” In asking the question in this manner, we might well look to utilize various technologies in
much different ways.
Framework for Thinking about New Technologies
Step Nature of Technology for
Measurement Nature of
Measurement
Nature of Respondent Involvement Technology Examples
HSRM Panelist Studies
1 Collection of data by an interviewer/data collector
Recall/ retrospective
Active CATI, CAPI J. Morton et al.K. Foster C. Hill
2 Reporting of survey data by a respondent (recall/ retrospective)
Recall/ retrospective
Active Web surveys; TACASI; mobile surveys (retrospective reporting)
C. Hill R. Moser
3 Reporting of data by a respondent in real‐time (active involvement)
Coincidental/ concurrent
Active
Mobile surveys (coincidental reporting); meters/monitors/ applications requiring manual intervention
R. Baker
4 Direct measurement of respondent behaviors in real‐time (passive involvement)
Coincidental/ concurrent
Passive Meters/monitors/applications (running in background); spidering/social media mining
R. Baker
We also need to have a goal in mind for where we want technology to take us. Here we’re not talking
about a specific technology—such as social media or smartphones, per se—but rather more conceptually
from the standpoint of behavior measurement. What are our longer‐range goals for measurement and how
does technology allow us to reach these goals?
One example of a potential framework is provided in the table on the previous page. Here technology
use is viewed as an evolutionary process, with emphasis on who in the interviewer‐respondent interaction is
aided by technology, the nature of the measurement (recall/retrospective versus concurrent/coincidental)
and the type of respondent involvement in the measurement (active versus passive participation). This
framework allows us to examine how technologies have been utilized in the past and highlights areas where
continued development is required.
According to this schema, the first level of technology use for data collection involves platforms and
devices that assist interviewers in the conduct of their tasks. Typically this is the administration of a
traditional survey, in which most measurements ask respondents to recall and report on behaviors and
attitudes. In this sense, the respondent is required to be an active participant in the measurement process.

272
Examples of such technology are most forms of computer‐assisted interviewing, such as computer‐assisted
telephone interviewing (CATI) and computer‐assisted personalized interviewing (CAPI). The Morton (2011)
paper in this section highlights this type of technology utilization, using handheld devices to assist in the
conduct of personal interviews in emerging countries. This view of technology use can also apply, however,
to more nascent technology platforms, such as Second Life. By utilizing virtual reality gaming environment
to conduct interviews or focus group (as is the case with the Foster 2011 paper in this section), technology is
put to use to assist the interviewer in reaching and interacting with respondents in a quicker and more cost
effective means than via traditional methods.
At the second level, technology is placed in the hands of respondents, assisting them in the conduct of a
more traditional survey or data gathering activity. Again the respondent is required to be an active
participant in order for data to be captured and the nature of the information collected is usually standard
survey questions emphasizing recall. Web surveys, use of computer‐assisted self‐interviewing (CASI), and
even surveys sent to respondents via a smartphone are examples. The Moser et al. (2011) use of a Web‐based
tool for allowing stakeholders input into the development of the questionnaire for the Health Information
National Trends Survey (HINTS) is an example of this type of technology use.
With the third level of technology use, the emphasis shifts to collecting behavioral and attitudinal data
at the time it occurs. Rather than asking a respondent to recall their prior behavior, technology can be used
to capture these data in‐the‐moment, concurrent with the activity. The approach still requires active
involvement by the participant to record the information, but it allows us to move away from recall‐based
data capture to more concurrent data collection. Use of Smartphones and customized metering devices for
capturing repeated measures throughout the day are examples of such approaches.
Finally, the fourth level of technology involves passive data collection, measuring attitudes and
behaviors as they occur but doing so without the need for active respondent involvement. This form of
measurement strives to produce the most accurate (by measuring behaviors coincidental to their occurrence)
and least biased (by reducing or eliminating the need for respondent action to record the information) data.
Meters or applications that run in the background and certain Internet data collection techniques, such as
spidering are examples.
Both the Baker (2011) and Murphy et al. (2011) papers highlight potential advances in level 3 and level 4
technologies. But the examples they cite come primarily from outside of the traditional survey research field
(e.g., from market or commercial research), a testament to the dearth of research in these areas within
traditional survey methods circles. While survey researchers have made substantial progress with level 1
and to some degree level 2 technologies, far less work has been done with level 3 and level 4 technologies.
Why is this the case?
THE PROBABILITY PARADIGM
The “classic” survey research approach is built upon the foundation that probability‐based samples are
required to produce “quality data.” Yet, one could argue that while the approach has served survey
researchers well in many areas, advancing technology adoption is not one of them. Using a strict
“probability‐based sample viewpoint,” we automatically assess potential technology use within a classic
framework of concerns: sample frame, sample coverage, and sample response. In doing so, we allow other
design considerations—not necessarily those related to the pros and cons of the technology itself—to drive
the decision about whether to use technology and, if so, the types of technology deployed. In other words,
we “edit” our thinking about the potential utility of an approach or in thinking about new approaches if we

Proceedings of the 10th Conference on Health Survey Research Methods 273
cannot first determine how to get technology into the hands of an “appropriate sample.” For example, we
often refrain from deploying a technology where we cannot achieve full or widespread sample coverage.
While this may make sense from an individual project perspective, it has the effect of slowing our ability to
learn about and harness new technologies in optimal ways. If we are always finding reasons why not to
deploy a new technology, how can we ever learn about the potential (positive and negative) of these new
approaches?
For technology to advance, we need to identify under what conditions a less than optimal sample might
suffice. Put another way, we need to develop a “Science of Convenience”—a set of standards and
approaches that allow us to move beyond probability samples when it makes sense and when such samples
simply are not an option. Rather than view probability/nonprobability in dichotomous terms, we need to
bridge the gap by applying scientific rigor where we can and gain a good understanding of when non‐
probability data can be put to good purpose. The argument here is not to dispense with probability‐
sampling, but rather to find a way to extend many of the scientific aspects of survey research to improve the
quality and reliability of non‐probability approaches such that we can continue to deploy, test and learn to
optimize new technologies in our data collection efforts.
APPROACHING OUR WORK
How we go about tackling problems can also have an effect on how we view and use technology.
Typically, survey researchers are very linear in their approach to problem‐solving. Problems are identified
first, and then solutions are crafted to meet the challenge or solve the problem. Technology development is,
therefore, a captive of this process. For example, most “problems” in the survey world are presented in the
form of a request for proposal or identification of an area where data are required. Often there are time and
resource considerations guiding the response to this issue or problem. Unless there is a fairly ready‐made
technology solution available to fill the gap, new technology use is often considered but ultimately
dismissed due to cost or time considerations and more “tried‐and‐true” methods are deployed (or the
innovative approach is proposed as an “option”).
However, what if we were to break this linear “problem‐solution” cycle and take a nonlinear approach.
John Kingdon (1995) notes that in the world of public policy, “problems” and “solutions” are often
independent of each other. Under certain conditions “windows of opportunity” open and the two can be
linked to resolve an issue or set of issues. The survey world can be viewed much the same. When it comes to
new technologies, perhaps researchers should look at these in terms of “solutions” even in the absence of an
immediate “problem” to solve. With this approach, research focuses on identifying and leveraging the
strengths and weaknesses of new technologies such that when a “window” opens there are new technology
solutions at hand that can be fitted to the problem. In the end, isn’t this the nature of true “research and
development”? This not to say that such work occurs in a vacuum. Certainly researchers are aware of the
general issues and problems within their field, even if a specific research problem is not the immediate
focus. In the classical sense, R&D involves detailed research on solutions (just as much as on problems) in
order to understand how best to deploy and optimize the use of various solutions.
R&D in the survey world, however, is becoming an endangered activity. The funding that drove much
of the development work in the 1970s and 1980s is now far harder to come by, and when it does, it is usually
tied to a very specific need or project. Likewise, the closing of many university‐based survey laboratories
over the past 10 years has considerably narrowed the range and ability of researchers to conduct pure R&D

274
efforts. As an industry, it is imperative that we find ways to reignite a broader emphasis on R&D efforts
within our field.
We also need to recognize that “innovation” is not an easy enterprise. Why is it that when we ask folks
to “think innovatively” or “develop an innovative approach,” what we often get are different “flavors” of
current approaches? Part of this may be the process we typically use as survey researchers. We often try to
“innovate” using the same approaches we use for more routine problem solving. That is, we gather the right
“experts,” white board the issues and potential solutions, button‐up details, cost the project, and propose it
to a funder. Companies making true innovative advances—such as Google and Facebook—often do things
very differently to help promote innovative thought and approaches. Google, for instance, offers some
employees a regularly scheduled set‐aside day during which they are relieved of their daily tasks and
allowed to indulge in more creative pursuits. Facebook promotes a quick turnaround culture in which
employees are encouraged to “fail harder”—that is, unless you’ve experienced some large failures (and not
the kind due to simple incompetence), you’re not pushing yourself hard enough. They also take a “think it;
program it; modify it” approach to getting new technologies in the field faster. Those that work get
modified and optimized; those that do not are dropped, their learnings applied to the next endeavor. To be
creative in our uses of technology, we need to adopt more creative solutions to how we think and go about
developing such solutions.
WHO WE ARE
Finally, how we drive innovation and utilize new technologies may be, in part, due to how we view
ourselves. If our perspective is that of a classical “survey methodologist” or “survey researcher,” we may in
fact be limiting ourselves to the degree that the “survey” component of those titles drives our self‐
perception. Perhaps a broader concept—such as “measurement scientist”—would be more applicable and
foster a broader sense of purpose within the industry. “Measurement” allows us to focus on what we do
best—developing ways of capturing data—but within a broader context. Measurement can be a survey
offered via a traditional mode or via a new technology platform, but it can also entail “measurement”
through a broader array of new approaches as well. Emphasis on “science” recognizes that we do have
certain sets of approaches, guiding principles, and ways of assessing quality that should not be abandoned
but rather strengthened and applied within these new realms of data collection.
In the end, we do not need to “change” per se, but we do need to expand our reach and in so doing
“evolve” our self‐perception and the ways in which we go about our roles within the broader industry.
CONCLUSION
That the world continues to change is obvious. However, what might not be so apparent to some is the
speed at which this change is taking place. The societies we measure, the tools we use, and even the
expectations for the data we gather and insights we provide are changing rapidly. To retain leadership (and
some may go so far as to say “relevance”) in the area of behavioral and attitudinal measurement, we need to
evolve as well. This is not a call to abandon what we know, but rather to find ways to expand into new areas
and in so doing broaden the nature of the tools we use. We need to think differently about the world,
measurement, our processes, and ourselves. If we are successful, we will open a new set of frontiers in both
research technology innovation and health insights.

Proceedings of the 10th Conference on Health Survey Research Methods 275
REFERENCES
Baker, R. (2011, April). The social media opportunity in health research. Paper presented at the 10th Conference on
Health Survey Research Methods, Peachtree City, GA.
Foster, K. (2011, April). I don’t smoke but my avatar does! Paper presented at the 10th Conference on Health Survey
Research Methods, Peachtree City, GA.
Kingdon, J. (1995). Agendas, alternatives, and public policies (2nd ed.). New York: Addison‐Wesley Educational
Publishers.
Moser, R., Beckjord, E., Rutten, L., Blake, K., & Hesse, B. (2011, April). HINTS‐GEM: Using Science 2.0 to construct a
national health survey through community engagement. Paper presented at the 10th Conference on Health Survey
Research Methods, Peachtree City, GA.
Morton, J., Palipudi, K., & Asma, S. (2011, April). The feasibility of using handheld computers to conduct the Global
Adult Tobacco Survey. Paper presented at the 10th Conference on Health Survey Research Methods, Peachtree
City, GA.
Murphy, J., Dean, E., Hill, C., & Richards, A. (2011, April). Social media, new technologies, and the future of health survey
research. Paper presented at the 10th Conference on Health Survey Research Methods, Peachtree City, GA.

276

Proceedings of the 10th Conference on Health Survey Research Methods 277
SESSION 5 SUMMARY Vicki Puneau (NORC) and Courtney Kennedy (Abt SRBI)
URGENCY
In 2004, Tourangeau noted that survey research was something of a bellwether for technological and
societal change. Researchers adopted technology fairly quickly to more efficiently conduct traditional
surveys (e.g., CATI and CAPI software development and adoption). That is no longer the case. Survey
researchers are lagging when it comes to understanding and using new technology and communication
platforms. It appears that survey researchers generally have not embraced recent technological tools and
platforms. There is a danger that we are not keeping current with how the general population, especially
younger generations, communicate. For example, many teenagers use Facebook instead of e‐mail. Even if
some new methodologies are not implemented immediately and technologies continue to morph (which is
inevitable), there is value in better understanding new communication platforms and continuously updating
our knowledge and methods to utilize them in appropriate and timely ways.
BARRIERS TO DEVELOPMENT/ADOPTION
Funding of research and development of new technology is a major barrier. Most federal grant processes
are too slow for funding research on emerging technologies: the technology is out of date before the grant is
awarded. As a consequence, work that is done is generally internally funded. When technologies have been
developed, they typically have not been adopted by the federal statistical agencies. One contributing factor
seems to be a generally conservative approach due to the official nature of the data being collected/reported.
Government agencies need strong proof of concept and impact prior to adoption of new technologies and
methods. These conditions make it difficult for organizations that want to innovate to do so.
SELF‐CONCEPTUALIZATION: “SURVEY RESEARCHER” VS. “MEASUREMENT SPECIALIST”
Another barrier that was discussed is self‐conceptualization as “survey researchers” as opposed to
“measurement scientists.” The survey paradigm defines what we view as the scope of our work, the design
options we consider, and how we think about our mission. The fact that many survey researchers define
their role in these traditional terms may preclude exploration of new technologies, such as passive data
collection (e.g., screen scraping) and social networking tools. There is also a continued general resistance
within the health survey research community to consider nonprobability approaches.
In the discussion, audience members also reflected on the respective roles of the commercial versus
academic and federal sectors with respect to adoption of new technology. Commercial researchers often are
perceived as the innovators due to the heady competition within the industry. More timely or efficient use
of new technologies can help companies distinguish themselves. Academic and federal researchers, by
contrast, are seen as providing the necessary scientific foundations for the adoption of new technologies. For
example, the scientific community embraced list‐assisted sampling, but appears to have been resistant to
most technological innovations since then. Over 10 years ago, Couper (2000) challenged the survey research
community to investigate appropriate applications of nonprobability samples, and session members
remarked that this mission has not been adequately fulfilled.

278
CONNECTING INNOVATION & SCIENCE
The audience and presenters noted that new technology and media tools are not appropriate, at least not
yet, for population inference. But they may be used for interviewer training, questionnaire design,
substantive research, anecdotal data, etc. Previously, health survey researchers have been successful in
integrating technology as data collection tools within the standard survey design framework, such as using
the Web as a supplemental data collection mode. The private sector, by contrast, is undergoing a more
extensive adoption of new technologies as both sampling frames and data collection vehicles. Presenters
stressed that new technologies are not a replacement of traditional probability‐based surveys but need to be
embraced and coordinated with traditional methods.
MULTIPLE USES OF SOCIAL MEDIA
As measurement scientists (not just survey researchers), we may be able to identify opportunities for
utilizing social media for sampling purposes (frames), passive data collection, contacting respondents,
providing information about surveys, and enhancing health outcome measurement by leveraging social
network data. Currently, social media vehicles appear less promising for traditional sample frame
development than as tools for gleaning new nonprobability‐based insights into health‐related attitudes and
behaviors.
QUESTIONS ABOUT THE QUALITY OF DATA GATHERED FROM NEW MEDIA
Audience members raised a number of questions about the quality of data gleaned from new media.
With respect to Second Life research, for example, there are questions about whether people respond as
themselves or as the persona of their avatar. On Facebook, some people create social media profiles for
nonhumans, particularly their pets. There are also questions about how much Web content collected via
screen scrapping is “person generated” versus marketing generated. These kinds of data quality issues need
to be addressed so that researchers can better understand the fitness of the data for addressing their research
questions.
NONPROBABILITY VS. PROBABILITY SAMPLING
The discussant offered that we need a set of standards and approaches that move us beyond probability‐
based samples when appropriate. A “science of convenience” would help us to keep pace with technologies
that are evolving at “light speed.” We need to evolve—not abandon what we know but focus on merging
science and new technology.
Members of the audience expressed concerns about moving too quickly towards nonprobability
sampling. “Evolution” in this direction generally is seen as being a better model than “revolution.” There is
skepticism as to whether nonprobability samples can truly serve the needs of federal health survey
consumers. Nonprobability samples may not be replicable and are not projectable to a general population.
In a probability‐based context, researchers have a framework for understanding the various error sources,
whereas in the nonprobability context, in a sense, “we don’t know what we don’t know.” In light of these
factors, many urge caution in our use and adoption of nonprobability methods.
The discussant challenged the audience to assess what makes convenience samples unreliable, possibly
develop calibration solutions, and solve the problems. Even our standard probability approaches have

Proceedings of the 10th Conference on Health Survey Research Methods 279
coverage, nonresponse, and measurement issues to some degree. Recent research by Jon Krosnick and
colleagues shows differences between probability and nonprobability methods. Rather than focus on the fact
that there are differences, we should evaluate how they are different and improve the nonprobability
approaches or, at minimum, identify their fitness for use.
CONCERNS ABOUT PRIVACY, CONSENT, AND ETHICS
The audience also raised concerns about the implications of new media for confidentiality, privacy,
informed consent, and data security. For example, can researchers simply collect and analyze Facebook
postings, or are additional consent and privacy measures needed? According to one presenter, the market
research industry is acutely aware of the gravity of these issues, as companies do not want to provoke
legislation that bans data collection of this nature. The industry has a precedent of self‐regulation that may
ultimately help overcome these issues, but many important privacy and consent details currently are
unresolved.
RESEARCH AGENDA
The session discussion pointed to several avenues for future research related to the development and
adoption of new technology and communication tools in the health survey research community.
R&D Funding. Innovation would be strengthened and accelerated with fast‐track funding
opportunities in both the private and public sectors.
Promoting a Framework for Fitness for Use. We recommend that a task force of private sector,
public sector, and academic researchers be convened to develop a framework to guide researchers in
applying Fitness for Use principles to data collection with new technology and communication tools.
This may involve the following:
o Developing criteria for applying Fitness for Use to research questions
o Developing evaluation tools to validate Fitness of Use and inform data quality
o Highlight examples of new technology yielding data that are fit for use on a particular research
question and examples of new technology yielding data that are unfit for use
Social Network Analysis. Researchers are encouraged to leverage social media to obtain social
network data, which can be used to generate new insights on the links between social connectedness
and health status and change.
Issue of Replicability in Social Networks. For studies conducted using a social network where
results will be tracked/repeated, researchers may want to consider replicating their methods on
multiple networks in order to understand the reliability of the results.
Use of Social Media in Early Stages of Survey Design. There appear to be a number of ways in
which new technology, especially social media, can be used to enhance the early stages of the survey
process. In particular, researchers are encouraged to explore these media as a way to inform
questionnaire design, interviewer training, and possibly their own substantive understanding of the
survey topic (e.g., from the patient’s perspective).
Nonprobability Sampling Frames. We encourage continued research on how nonprobability
sample sources can be used to supplement and/or fill coverage gaps in probability‐based designs.
These investigations may want to consider the implications of such designs for sampling, coverage,
and nonresponse errors.

280
REFERENCES
Couper, M. P. (2000). Web surveys: a review of issues and approaches. Public Opinion Quarterly, 64, 464–494.
Tourangeau, R. (2004). Survey research and societal change. Annual Review of Psychology, 55, 775–801.

Proceedings of the 10th Conference on Health Survey Research Methods 281
10th Conference on Health Survey Research Methods Participant List Reg Baker Market Strategies International 17430 College Parkway Livonia, MI 48152 734‐542‐7600 [email protected]
Martin Barron NORC at the University of Chicago 55 E Monroe, Suite 3000 Chicago, IL 60603 312‐759‐4247 Barron‐[email protected]
Michael Battaglia Abt Associates 55 Wheeler St. Cambridge, MA 02138 617‐349‐2425 [email protected]
Kirsten Becker RAND Corporation 1776 Main St., P.O. Box 2138 Santa Monica, CA 90407 310‐393‐0411, x6480 [email protected]
Timothy Beebe Mayo Clinic College of Medicine 200 First St. SW Rochester, MN 55905 507‐538‐4606 [email protected]
Stephen Blumberg NCHS 3311 Toledo Rd., Room 2112 Hyattsville, MD 20782 301‐458‐4107 [email protected]
Karen Bogen Mathematica 955 Massachusetts Ave., Suite 801 Cambridge, MA 02139 617‐674‐8355 Kbogen@Mathematica‐mpr.com
John Boyle Abt SRBI 8403 Colesville Rd., Suite 820 Silver Spring, MD 20910 301‐608‐3883 [email protected]
Norman Bradburn NORC at the University of Chicago 4359 East‐West Highway, 8th Floor Bethesda, MD 20814 301‐634‐9331 bradburn‐[email protected]
Julie Brown RAND Corporation 1776 Main St., P.O. Box 2138 Santa Monica, CA 90407 310‐393‐0411, x6212 [email protected]
Tamara Bruce Westat RE 355, 1600 Research Blvd. Rockville, MD 20850 301‐294‐2879 [email protected]
Diane Burkom Battelle Centers for Public Health Research & Evaluation 6115 Falls Rd., 2nd Floor Baltimore, MD 21209 410‐372‐2702 [email protected]

282
Vicki Burt NCHS 3311 Toledo Rd., Room 4211 Hyattsville, MD 20782 301‐458‐4127 [email protected] Kathleen Call University of Minnesota 420 Delaware St. SE, MMC 729 Minneapolis, MN 55455 671‐699‐6347 [email protected] Adam Carle University of Cincinnati 3333 Burnet Ave., MLC 7014 Cincinnati, OH 45229 513‐803‐1650 [email protected]
Anne Ciemnecki Mathematica Policy Research 600 Alexander Park Princeton, NJ 08540 609‐275‐2323 aciemnecki@mathematica‐mpr.com
Karen CyBulski Mathematica Policy Research P.O. Box 2393 Princeton, NJ 08543 609‐936‐2797 kcybulski@mathematica‐mpr.com
Michael Davern NORC at the University of Chicago 55 E. Monroe, Suite 3000 Chicago, IL 60603 312‐357‐3770 Davern‐[email protected]
Jamie Dayton ICF/Macro International 126 College St. Burlington, VT 05401 802‐264‐3723 [email protected]
Linda Dimitropoulos RTI International 230 W. Monroe St., Suite 2100 Chicago, IL 60606 312‐456‐5246 [email protected]
Charles DiSogra KnowledgeNetworks 1350 Willow Rd., Suite 102 Menlo Park, CA 94025 650‐289‐2185 [email protected]
David Dutwin SSRS / Social Science Research Solutions 53 West Baltimore Pike Media, PA 19063 484‐840‐4406 [email protected]
Jennifer Dykema University of Wisconsin Survey Center 475 N. Charter St. Madison, WI 53706 608‐262‐8385 [email protected]
Brad Edwards Westat 1600 Research Blvd. Rockville, MD 20850 301‐251‐1500 [email protected]
Kelly Foster University of Georgia 104A Visual Arts Bldg. Athens, GA 30602 706‐542‐9332 [email protected]
Jack Fowler University of Massachusetts Boston 100 Morrissey Blvd. Boston, MA 02125 617‐287‐7200 [email protected]

Proceedings of the 10th Conference on Health Survey Research Methods 283
Patricia Gallagher University of Massachusetts Boston 100 Morrissey Blvd. Boston, MA 02125 617‐287‐7200 [email protected]
Jane Gentleman NCHS 3311 Toledo Rd., Room 2218 Hyattsville, MD 20782 301‐458‐4233 [email protected]
Erika Gordon ICF/Macro International 11875 Beltsville Dr., Suite 300 Calverton, MD 20705 301‐572‐0881 [email protected]
David Grant UCLA 10960 Wilshire Blvd., Suite 1550 Los Angeles, CA 90024 310‐794‐0916 [email protected]
Peter Graven University of Minnesota 2221 University Ave. SE, Suite 345 Minneapolis, MN 55414 612‐298‐3072 [email protected]
Ofer Harel University of Connecticut Dept. of Statistics, 215 Glenbrook Rd., Unit 4120 Storrs, CT 06269 860‐486‐6989 [email protected]
Craig Hill RTI International 3040 Cornwallis Rd., P.O. Box 12194 919‐541‐6327 Research Triangle Park, NC 27709 919‐541‐6327 [email protected]
Angela Jaszczak NORC at the University of Chicago 55 E. Monroe, Suite 3000 Chicago, IL 60603 312‐759‐4236 [email protected]
Timothy Johnson Survey Research Laboratory University of Illinois at Chicago 412 S. Peoria, 6th Floor Chicago, IL 60607 312‐996‐5310 [email protected]
Graham Kalton Westat 1600 Research Blvd. Rockville, MD 20850 301‐251‐8253 [email protected]
Judith Kasper Johns Hopkins 624 N. Broadway, Room 641 Baltimore, MD 21205 410‐614‐4016 [email protected]
Lisa Kelly‐Wilson Survey Research Laboratory University of Illinois at Chicago 505 E. Green St., Suite 3 Champaign, IL 61820 217‐333‐7109 [email protected]
Courtney Kennedy Abt SRBI 55 Wheeler St. Cambridge, MA 02138 617‐386‐2600, x2804 [email protected]
Richard Kulka Abt Associates 4620 Creekstone Dr., Suite 190 Durham, NC 27703 919‐294‐7710 [email protected]

284
Sunghee Lee University of Michigan ISR, 426 Thompson St. Ann Arbor, MI 48104 734‐615‐5264 [email protected] Michael Link The Nielsen Company 3784 Ardsley Ct. Marietta, GA 30062 678‐401‐3753 [email protected]
John Loft RTI International 230 W. Monroe St., Suite 2100 Chicago, IL 60606 312‐456‐5241 [email protected]
Victoria Lynch The Urban Institute 3715 Woodley Rd. NW Washington, DC 20016 202‐210‐4536 [email protected]
Carlos Mendes de Leon University of Michigan 1415 Washington Heights Ann Arbor, MI 48109 734‐615‐2134 [email protected]
Lisa Mirel NCHS 3311 Toledo Rd., Room 4214 Hyattsville, MD 20782 301‐458‐4745 [email protected]
Judie Mopsik The Lewin Group 3130 Fairview Park Dr., #800 Falls Church, VA 22042 703‐269‐5641 [email protected]
Jeremy Morton CDC (McKing contractor) 14627 Pinto Lane Rockville, MD 20850 404‐545‐0666 [email protected]
Rick Moser NCI 6130 Executive Blvd., MSC 7326, EPN 4052 Bethesda, MD 20892 301‐496‐0273 [email protected]
Kristin Olson University of Nebraska‐Lincoln Dept. of Sociology, 703 Oldfather Hall Lincoln, NE 68588 402‐472‐6057 [email protected]
Diane O’Rourke O’Rourke Associates 511 S. Willis Ave. Champaign, IL 61821 217‐840‐7180 [email protected]
Beth‐Ellen Pennell University of Michigan ISR, 426 Thompson St. Ann Arbor, MI 48104 734‐647‐2247 [email protected]
Andy Peytchev RTI International 3040 Cornwallis Rd. Research Triangle Park, NC 27709 919‐485‐5604 [email protected]
Vicki Pineau NORC at the University of Chicago 5005 Ashurst Dr. Roswell, GA 30075 678‐242‐8352 Pineau‐[email protected]

Proceedings of the 10th Conference on Health Survey Research Methods 285
Jeffrey Rhoades AHRQ 540 Gaither Rd. Rockville, MD 20850 [email protected]
Todd Rockwood University of Minnesota 420 Delaware St. SE, MMC 729 Minneapolis, MN 55455 612‐625‐3993 [email protected]
Dianne Rucinski University of Illinois at Chicago 1747 W. Roosevelt, Room 558 Chicago, IL 60608 312‐355‐2769 [email protected]
Barbara Schaan Mannheim Research Institute for the Economics of Aging University of Mannheim, L13, 7 68131 Mannheim, Germany 49 (0) 621 181 2774 [email protected]‐mannheim.de
Frederic Shaw CDC Century Center 2500, Room 3204, Mailstop E‐97 1600 Clifton Rd., NE Atlanta, GA 30333 404‐498‐6364 [email protected]
Alicia Baines Simon Center for Chronic Disease Outcomes Research Minneapolis VAHCS 152/2E, One Veteran's Dr. Minneapolis, MN 55417 612‐467‐1424 [email protected]
James Singleton CDC 1600 Clifton Rd. NE, Mail Stop E‐62 Atlanta, GA 30333 404‐639‐8560 [email protected]
Edward Sondik NCHS 3311 Toledo Rd., Room 7204 Bethesda, MD 20892 301‐458‐4500 [email protected] Ed Spar COPAFS 2121 Eisenhower Ave., Suite 200 Alexandria, VA 22314 703‐836‐0404 [email protected] Zeynep Tuba Suzer‐Gurtekin University of Michigan 426 Thompson St., Room 4050 Ann Arbor, MI 48104 734‐763‐0421 [email protected]
Joanna Turner University of Minnesota – SHADAC 2221 University Ave. SE, Suite 345 Minneapolis, MN 55414 612‐624‐1632 [email protected]
Michael Von Korff Group Health Research Institute 1730 Minor Ave., Suite 1600 Seattle, WA 98101 206‐287‐2874 [email protected]
Nancy Walczak The Lewin Group MN002‐0261m 12125 Technology Dr. Eden Prairie, MN 55344 952‐833‐7556 [email protected] Gordon Willis NCI 6130 Executive Blvd., MSC 7334, EPN 4005 Bethesda, MD 20892 301‐594‐6652 [email protected]

286
Rebekah Young Pennsylvania State University 211 Oswald Tower University Park, PA 16802 206‐303‐9909 [email protected]
Jeanette Ziegenfuss Mayo Clinic 200 First St. SW Rochester, MN 55905 507‐538‐1191 [email protected]