tensile/tension test – advanced topics
TRANSCRIPT

Tensile/Tension Test – Advanced Topics –
Tzuyang Yu Associate Professor, Ph.D.
Structural Engineering Research Group (SERG) Department of Civil and Environmental Engineering
University of Massachusetts Lowell Lowell, Massachusetts
CIVE.3110 Engineering Materials Laboratory Fall 2016

• Strain rate – Rapid stress application, as in an impact test, measures the ability of the material to absorb energy as it fails.
• Temperature effect – At high temperatures, materials deform continuously under an applied stress, as measured by the creep test.
• Repeated application of stresses below the failure stress determined in a tensile test can cause fatigue failure.
• Strain/work hardening (cold working) – Dislocation movements and dislocation generation within the crystal structure of metals increase the strength of metals.
• Necking – Ductile materials exhibit necking before ultimate fracture. • Statistical significance – Tensile test result varies from one to
another even for same material. Test result should be interpreted statistically.
• Fracture toughness – The materials response to the presence of cracks and flaws that act as stress concentrators is measured by fracture toughness.
Tensile Test
2

Influence of Strain Rate
3

Temperature Effect
4

Strain Hardening
• Phenomenon – In the plastic region, the true stress increases continuously. This implies that the metal is becoming stronger as the strain increases.
• The relationship between true stress σ and true strain ε i.e. the flow curve can be expressed using the power law:
where K is called the strength coefficient and n the strain hardening exponent.
5
σ = Kε n

Strain Hardening
• The plastic portion of the true stress-strain curve (or flow stress curve) plotted on a log-log scale gives the n value as the slope and the K value as the value of true stress at true strain of one.
• For materials following the
power law, the true strain at the UTS is equal to n.
Strain Hardening:
6
log σ( ) = log K( )+ n log ε( )

Strain Hardening
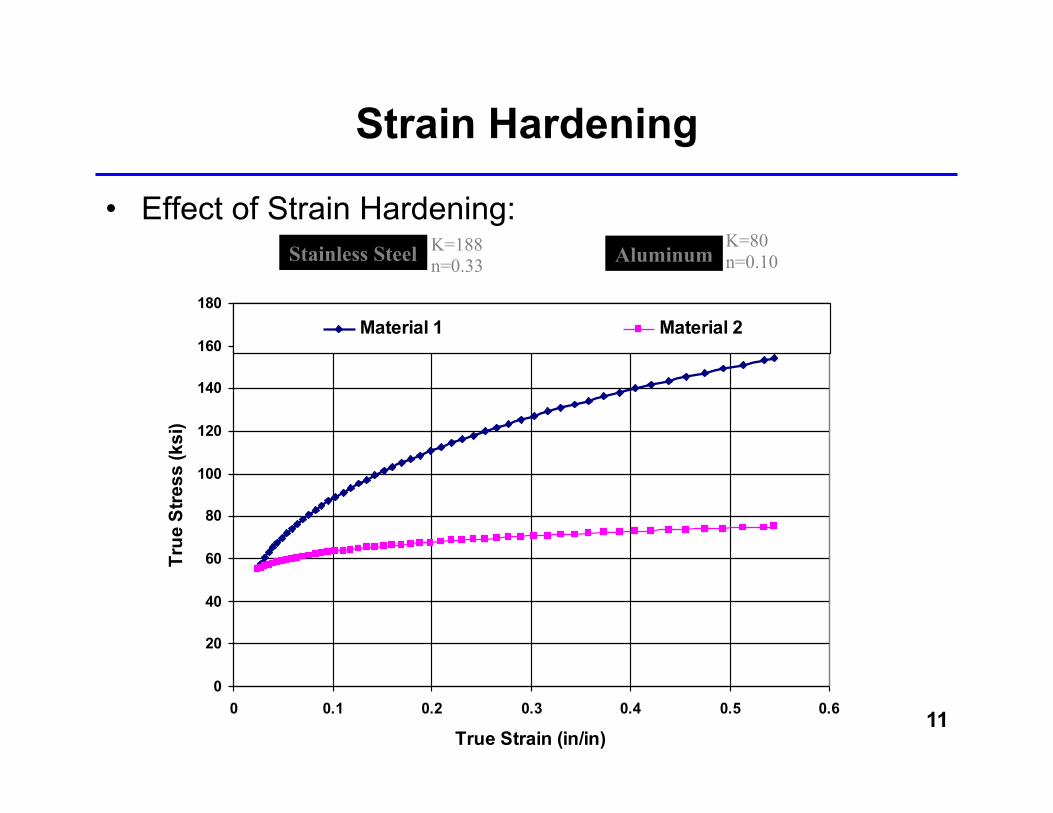
Effect of Strain Hardening – • The influence of work/strain hardening on the load vs.
elongation during the tensile test can be demonstrated using finite element (FE) analysis.
• Consider two materials with the following flow stress data: – Stainless Steel: K = 188 ksi; n = 0.33 – Aluminum Alloy: K = 80 ksi ; n = 0.10.
• The tensile test simulations for these two materials show the effect of strain hardening on the load required for deformation and the uniform elongation prior to the onset of necking.
7

Strain-hardening Coefficient
• The response of different metals to plastic deformation depends on their crystal structure.
• The shape of the stress-strain curve shows how much increase in strength can be gained by strain hardening. For this purpose, the true-stress vs. true-strain curve is more useful than the conventional engineering stress-strain diagram. The expression defines the strain hardening coefficient n.
8

• The true-stress vs. true-strain curve is a plot of the stress in the sample at its minimum diameter, after necking has begun, vs the local elongation.
• This more accurately reflects the physical processes happening in the material, but is much more difficult to measure than the engineering stress and strain, which divide the applied load by the original cross-sectional area, and the total elongation by the original length.
Strain-hardening Coefficient
9

Strain-hardening Coefficient
tt
mtt
mKK
εσ
εσ
+=
=
lnln
Small m
Large m
10
Strain, ε
Stre
ss, σ
Strain Hardening
• Effect of Strain Hardening:
0
20
40
60
80
100
120
140
160
180
0 0.1 0.2 0.3 0.4 0.5 0.6
True Strain (in/in)
True
Stre
ss (k
si)
Material 1 Material 2
Stainless Steel Aluminum K=188 n=0.33
K=80 n=0.10
11

Strain Hardening
Note: when you plot the log-log plot, use datapoints after the yield point (to avoid elastic points) and before instability (necking). • A material that does not show any strain-hardening (n=0)
is designated as perfectly plastic. Such a material would show a constant flow stress irrespective of strain.
• K can be found from the y-intercept or by substituting n
and a datapoint (from the plastic region) in the power law.
12

Tensile Test Example
Load vs. Elongation (Data obtained from the tensile test): Material Data: Al 6061 Y = 40 ksi TS = 49 ksi
Load Vs. Elongation
0
2000
4000
6000
8000
10000
12000
0 0.05 0.1 0.15 0.2 0.25 0.3 0.35 0.4
Elongation (in.)
Load
(lb)
13

Tensile Test Example
Engineering Stress vs. Strain (calculated from Load vs. Elongation data): Material Data: Al 6061 Y = 40 ksi TS = 49 ksi
Engineering Stress vs. Engineering Strain
0
10000
20000
30000
40000
50000
60000
0 0.02 0.04 0.06 0.08 0.1 0.12 0.14 0.16 0.18 0.2
Engineering Strain (in/in)
Engi
neer
ing
Stre
ss (p
si)
14
σ e =FA0
e = L − L0L0
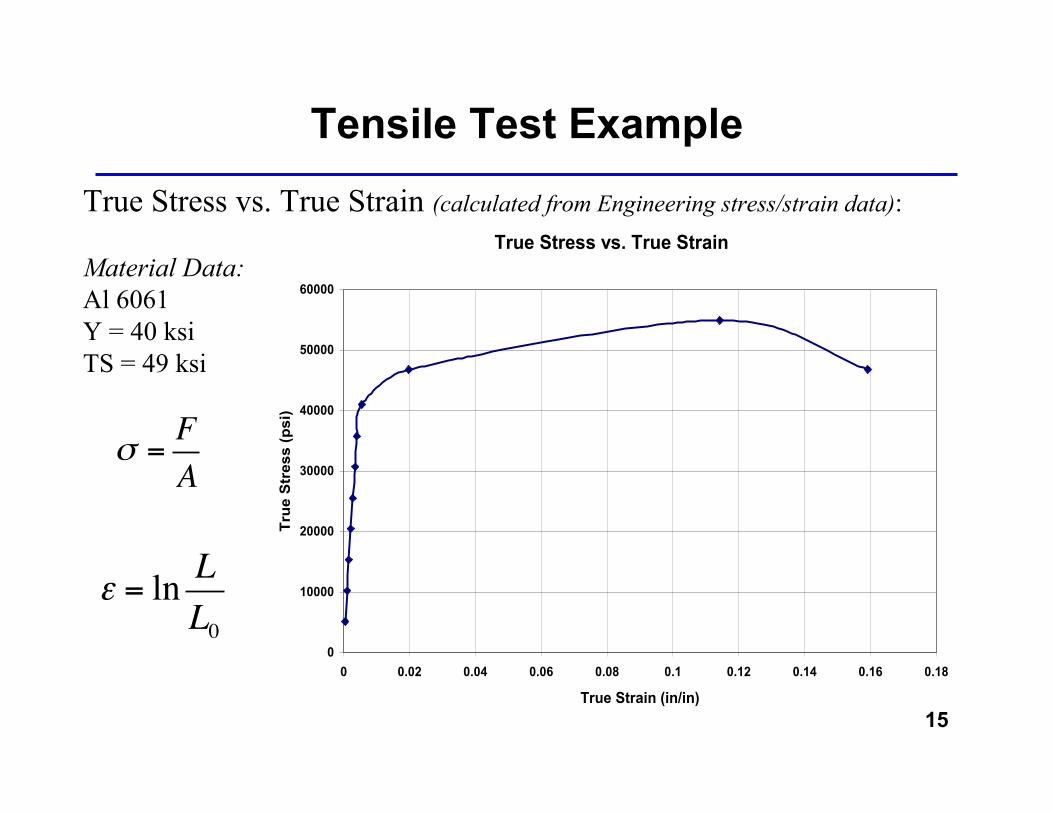
Tensile Test Example True Stress vs. True Strain (calculated from Engineering stress/strain data): Material Data: Al 6061 Y = 40 ksi TS = 49 ksi
True Stress vs. True Strain
0
10000
20000
30000
40000
50000
60000
0 0.02 0.04 0.06 0.08 0.1 0.12 0.14 0.16 0.18
True Strain (in/in)
True
Str
ess
(psi
)
15
ε = ln LL0
σ =FA
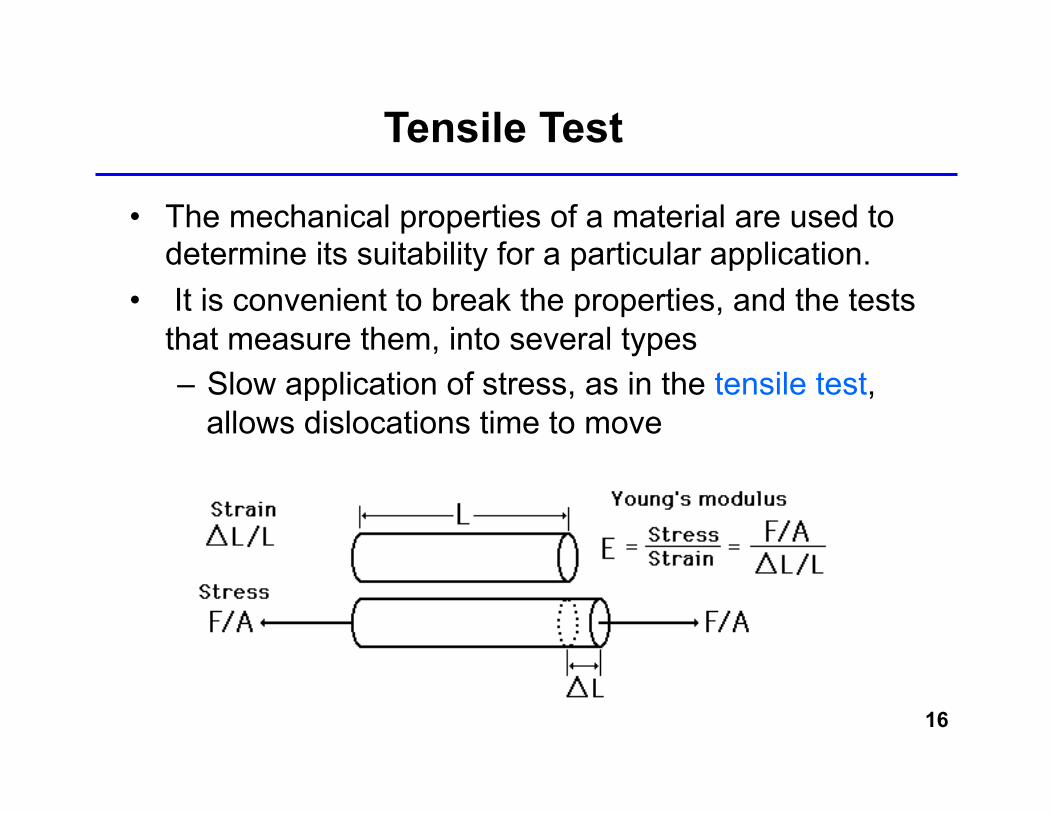
• The mechanical properties of a material are used to determine its suitability for a particular application.
• It is convenient to break the properties, and the tests that measure them, into several types – Slow application of stress, as in the tensile test,
allows dislocations time to move
Tensile Test
16

Ductile Tension Test Specimens
Ductile material from a standard tensile test apparatus. (a) Necking; (b) failure.
Can you tell how we can elongate the bar without breaking in manufacturing process?
17

Ductile Materials
• %EL = (lf-l0)/lo *100% • Ductile material à%EL > 5%
– Low carbon 37% – Medium carbon 30% – High carbon 25%
• Ductile material can be brittle under dynamic load.
18

Brittle Tension Test Specimen
Failure of a brittle material from a standard tensile test apparatus.
19

• Plotting the applied stress versus the strain or elongation of the specimen shows the initial elastic response of the material, followed by yielding, plastic deformation and finally necking and failure
• Several measurements are taken from the plot, called the Engineering Stress-Strain Diagram/Curve.
Stress-Strain Diagram/Curve
20

• Students are sometimes confused by the elastic contraction that occurs when the applied stress is released, either by reversing the test machine or when the specimen breaks. The contraction follows the same slope as the linear elastic portion of the stress-strain curve, defined by the modulus of elasticity of the specimen. It is the result of the atoms moving back to their equilibrium separation distance. Hence it is shown on the diagram as a line parallel to the elastic portion of the curve. Any net strain remaining after the stress is released is plastic deformation.
21
Definitions

Necking
• The engineering stress-strain curve of a ductile material usually drops past the tensile strength point. This is because the cross-sectional area of the material decreases because of slip along atom planes that are oriented at an angle to the applied force (since the slip occurs by dislocation motion). This local deformation is called a necking.
22

Necking
• Internal stress distribution of necking:
23

Facture
24
Brittle fracture
Ductile fracture
Ductile fracture
The presence of necking indicates ductility.

Fracture
25

Fracture
26
• Internal temperature distribution during facture:

Facture
27
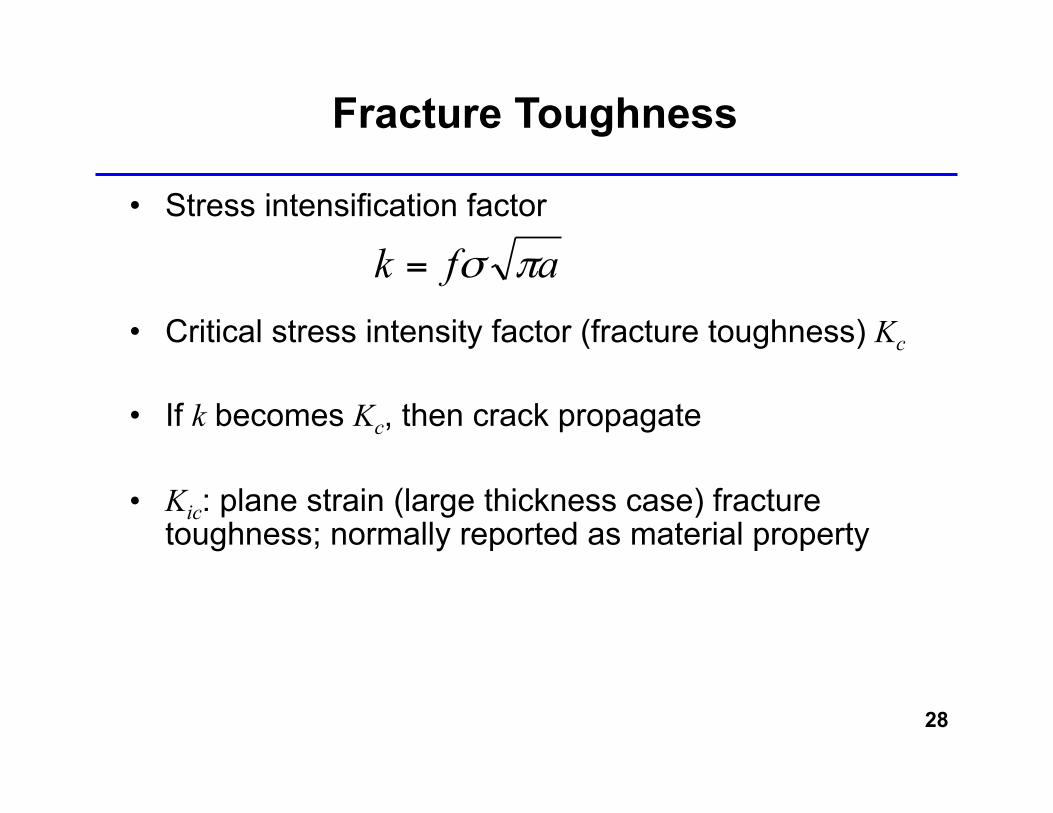
Fracture Toughness
• Stress intensification factor
• Critical stress intensity factor (fracture toughness) Kc
• If k becomes Kc, then crack propagate
• Kic: plane strain (large thickness case) fracture toughness; normally reported as material property
afk πσ=
28

• The geometry factor f is 1.0 for the case of a small surface crack in a very thick plate.
• The KIc value is a material constant, the same as other mechanical properties. It includes both strength and ductility characteristics of the material. The f and a values on the right side of the equation are the failure stress and the crack depth (or half the crack length for an internal crack), and it is their interrelationship that is important.
Fracture Toughness
29

• As the crack size increases the failure stress drops.
• To achieve a design failure stress, it must be possible to detect and prevent any cracks larger than a certain size.
• In addition to surface cracks that are present accidentally in materials, any hole or notch acts as a stress concentrator. Rivet holes in the aluminum skin of airplanes may act to start fractures.
• There is a direct relationship between the energy absorbed in impact and the toughness measured as the area under the stress strain curve. Materials with a high toughness value absorb more energy in fracture, which may provide a margin of safety in real structures in the event of failure.
Fracture Toughness
30

Unloading and reloading Diagram
31

Unloading and reloading Diagram
32

Statistical Significance
• If we test more specimens, we will find different strength measurements during tensile tests. à Specimens are not perfectly homogeneous and not made of identical material (or materials of identical quality).
• Statistical (stochastic) interpretation is necessary. • Probability density function of the normal distribution –
f(x) = e−12z2
σ̂ x 2π ( ) xxz σµ ˆ/−=
33
σ̂ x = standard deviation = (variance)1/2
µ = mean/expectation
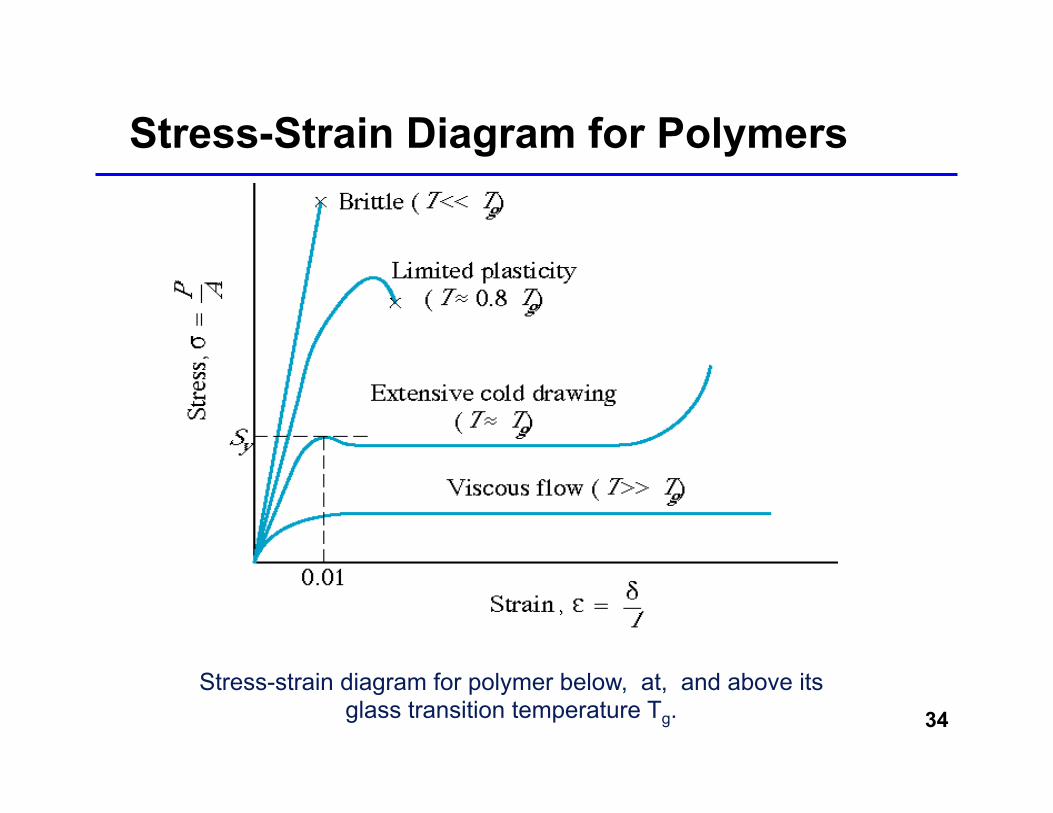
Stress-Strain Diagram for Polymers
Stress-strain diagram for polymer below, at, and above its glass transition temperature Tg. 34

Strength/Density Comparison
Strength/density for various materials. 35
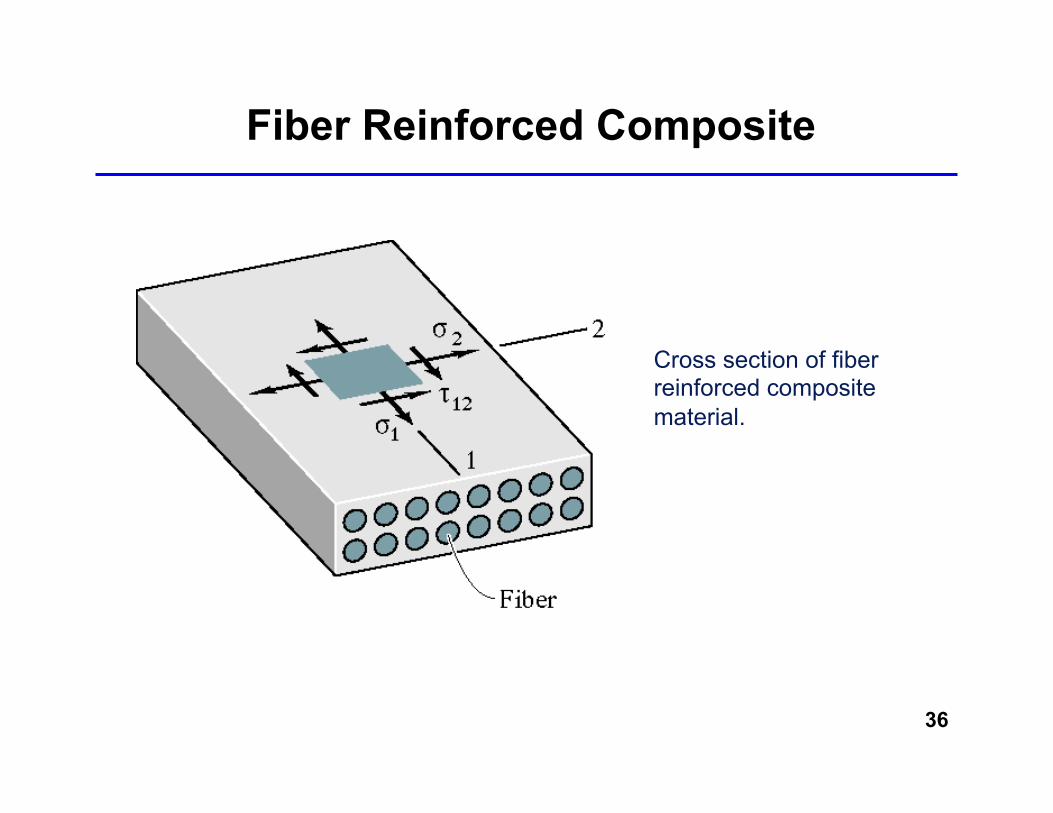
Fiber Reinforced Composite
Cross section of fiber reinforced composite material.
36

Composite
• The smaller the diameter, the more stronger.
• Fibers are very small in diameter
• Fibers are brittle; the matrix provides toughness – Lightweight – you can tailor to the need; strengthen to various
angles – Corrosion resistance
37

38