tenology ch connects - investors.normagroup.com/media/files/n... · equity ratio % 41.7 39.5 2.2...
TRANSCRIPT
aN
Nu
al
rE
po
rt
20
12N
or
Ma
Gro
upa
G
aNNual rEport 2012
TeChnology ConneCTs
NORMA Group is an international market and technology leader in advanced engineered joining technology. We offer about 30,000 high-quality products and solutions to approximately 10,000 customers. We manufacture a wide range of innovative engineered joining technology solutions in three product categories: Clamp, Connect and Fluid. Headquartered in Maintal, we operate a worldwide network with 19 manufacturing centres and numerous sales and distribution sites across Europe, the Americas and Asia-Pacific.
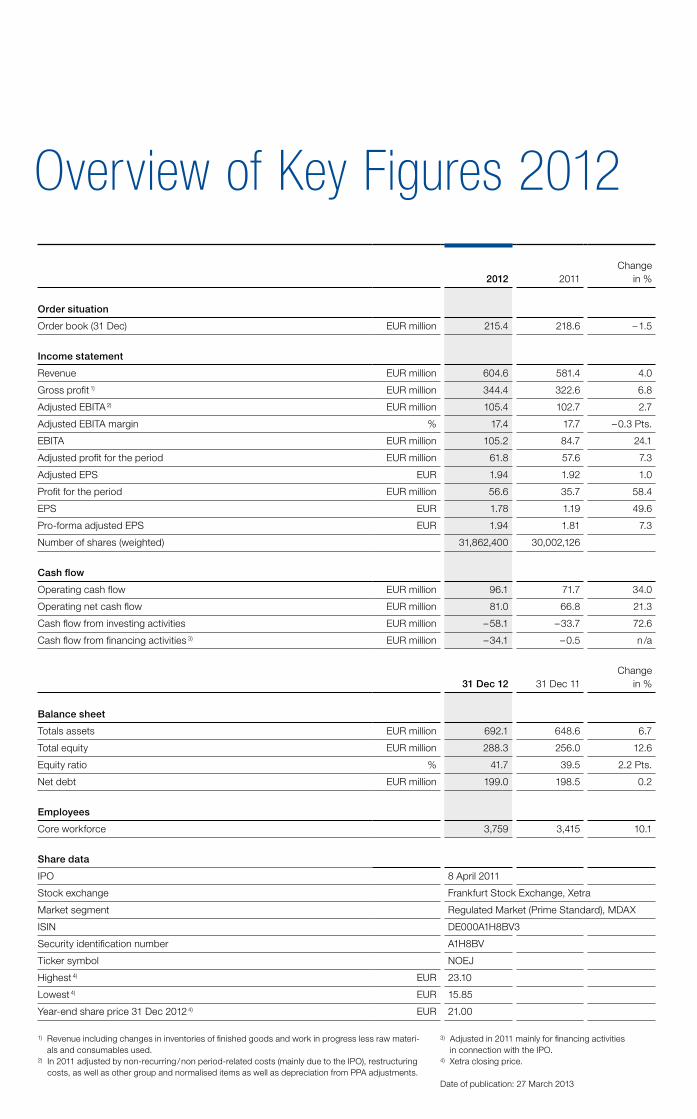
overview of Key Figures 2012
2012 2011Change
in %
order situation
Order book (31 Dec) EUR million 215.4 218.6 – 1.5
income statement
Revenue EUR million 604.6 581.4 4.0
Gross profit 1) EUR million 344.4 322.6 6.8
Adjusted EBITA 2) EUR million 105.4 102.7 2.7
Adjusted EBITA margin % 17.4 17.7 – 0.3 Pts.
EBITA EUR million 105.2 84.7 24.1
Adjusted profit for the period EUR million 61.8 57.6 7.3
Adjusted EPS EUR 1.94 1.92 1.0
Profit for the period EUR million 56.6 35.7 58.4
EPS EUR 1.78 1.19 49.6
Pro-forma adjusted EPS EUR 1.94 1.81 7.3
Number of shares (weighted) 31,862,400 30,002,126
Cash flow
Operating cash flow EUR million 96.1 71.7 34.0
Operating net cash flow EUR million 81.0 66.8 21.3
Cash flow from investing activities EUR million – 58.1 – 33.7 72.6
Cash flow from financing activities 3) EUR million – 34.1 – 0.5 n /a
31 dec 12 31 Dec 11Change
in %
Balance sheet
Totals assets EUR million 692.1 648.6 6.7
Total equity EUR million 288.3 256.0 12.6
Equity ratio % 41.7 39.5 2.2 Pts.
Net debt EUR million 199.0 198.5 0.2
Employees
Core workforce 3,759 3,415 10.1
Share data
IPO 8 April 2011
Stock exchange Frankfurt Stock Exchange, Xetra
Market segment Regulated Market (Prime Standard), MDAX
ISIN DE000A1H8BV3
Security identification number A1H8BV
Ticker symbol NOEJ
Highest 4) EUR 23.10
Lowest 4) EUR 15.85
Year-end share price 31 Dec 2012 4) EUR 21.00
1) Revenue including changes in inventories of finished goods and work in progress less raw materi-als and consumables used.
2) In 2011 adjusted by non-recurring / non period-related costs (mainly due to the IPO), restructuring costs, as well as other group and normalised items as well as depreciation from PPA adjustments.
3) Adjusted in 2011 mainly for financing activities in connection with the IPO.
4) Xetra closing price.
Date of publication: 27 March 2013
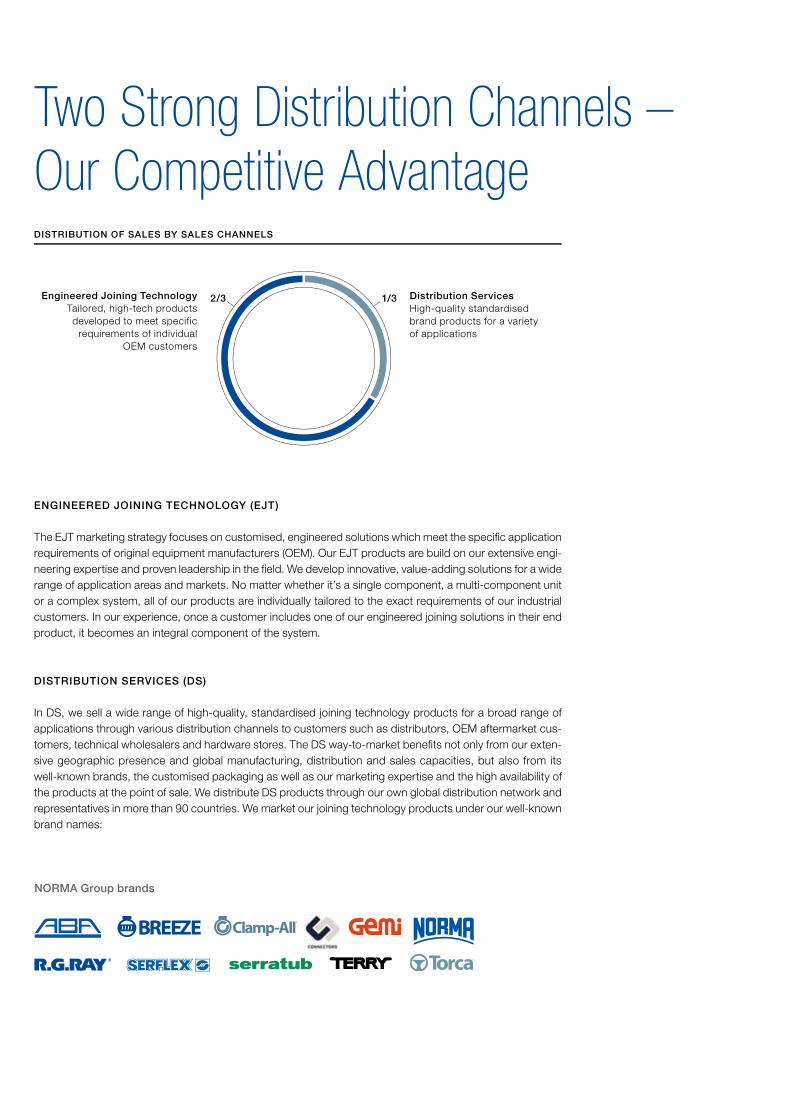
Two Strong Distribution Channels – Our Competitive Advantage
Engineered Joining TechnologyTailored, high-tech productsdeveloped to meet specific
requirements of individualOEM customers
Distribution ServicesHigh-quality standardisedbrand products for a varietyof applications
2/3 1/3
ENGINEERED JOINING TECHNOLOGY (EJT)
The EJT marketing strategy focuses on customised, engineered solutions which meet the specific application requirements of original equipment manufacturers (OEM). Our EJT products are build on our extensive engi-neering expertise and proven leadership in the field. We develop innovative, value-adding solutions for a wide range of application areas and markets. No matter whether it’s a single component, a multi-component unit or a complex system, all of our products are individually tailored to the exact requirements of our industrial customers. In our experience, once a customer includes one of our engineered joining solutions in their end product, it becomes an integral component of the system.
DISTRIBUTION SERVICES (DS)
In DS, we sell a wide range of high-quality, standardised joining technology products for a broad range of applications through various distribution channels to customers such as distributors, OEM aftermarket cus-tomers, technical wholesalers and hardware stores. The DS way-to-market benefits not only from our exten-sive geographic presence and global manufacturing, distribution and sales capacities, but also from its well-known brands, the customised packaging as well as our marketing expertise and the high availability of the products at the point of sale. We distribute DS products through our own global distribution network and representatives in more than 90 countries. We market our joining technology products under our well-known brand names:
NORMA Group brands
DISTRIBUTION OF SALES BY SALES CHANNELS

NORMA Group has been defining the direction of the market with its cleverly engineered innovations for over 60 years. Our inventory of industrial property rights in nearly 200 patent families, high standards for quality and the personal commitment of our approximately 4,500 employees make us the world’s leader in the area of engineered joining technology. We feel at home in many different industries.
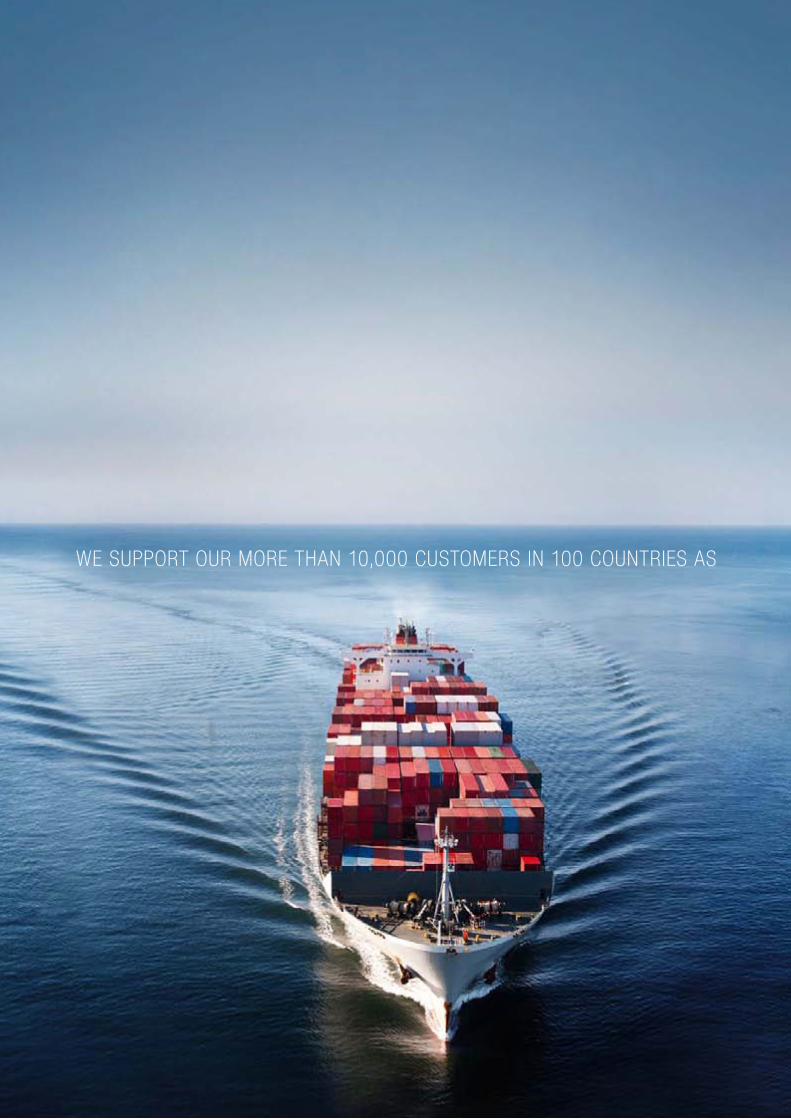
WE SUPPORT OUR MORE THAN 10,000 CUSTOMERS IN 100 COUNTRIES AS

A STRATEGIC DEVELOPMENT PARTNER

AND MAINTAIN AN INTEGRATED

DISTRIBUTION SERVICES NETWORK FOR OUR PRODUCT SOLUTIONS.

WE MANUFACTURE AND MARKET OVER 30,000 TOP-QUALITY

JOINING PRODUCTS FOR USE IN VARIOUS FIELDS

IN THE THREE PRODUCT CATEGORIES CLAMPS,

CONNECTING ELEMENTS AND FLUID SYSTEMS.
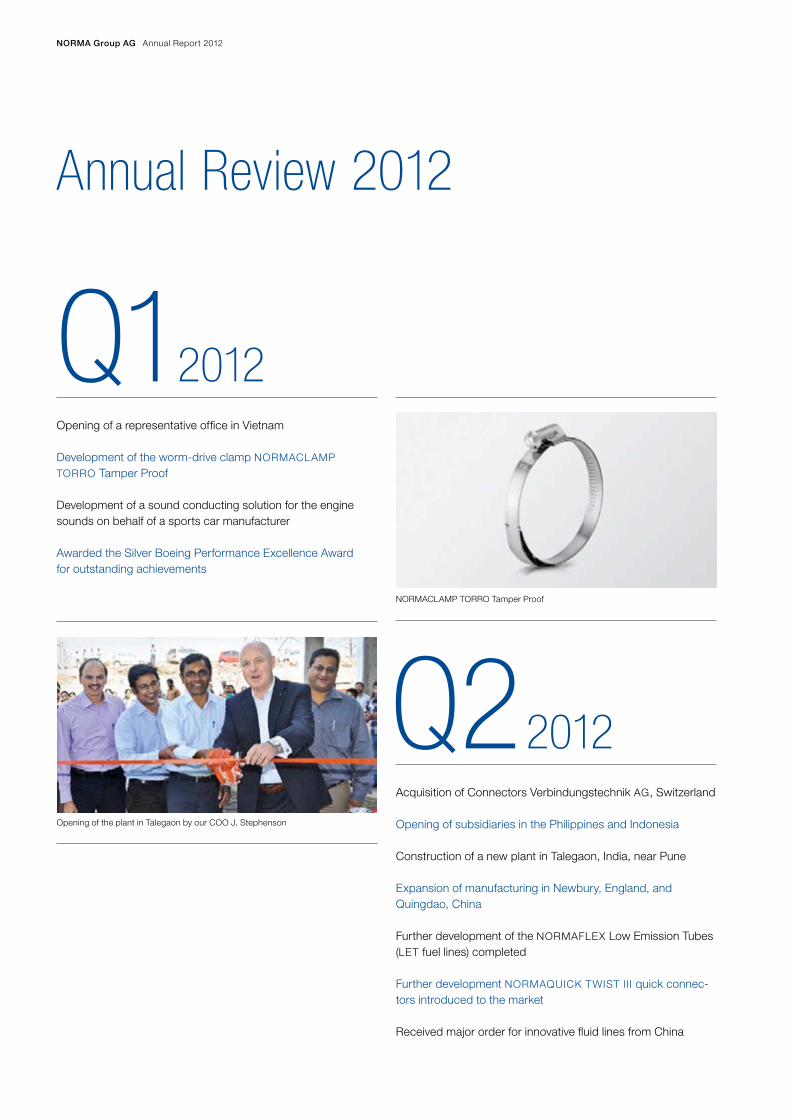
Annual Review 2012
Q12012Opening of a representative office in Vietnam
Development of the worm-drive clamp NORMACLAMP TORRO Tamper Proof
Development of a sound conducting solution for the engine sounds on behalf of a sports car manufacturer
Awarded the Silver Boeing Performance Excellence Award for outstanding achievements
Opening of the plant in Talegaon by our COO J. Stephenson
Acquisition of Connectors Verbindungstechnik AG, Switzerland
Opening of subsidiaries in the Philippines and Indonesia
Construction of a new plant in Talegaon, India, near Pune
Expansion of manufacturing in Newbury, England, and Quingdao, China
Further development of the NORMAFLEX Low Emission Tubes (LET fuel lines) completed
Further development NORMAQUICK TWIST III quick connec-tors introduced to the market
Received major order for innovative fluid lines from China
Q22012
NORMACLAMP TORRO Tamper Proof
NORMA Group AG Annual Report 2012

Annual Review 2012
Q32012
Q42012
Acquisition of Nordic Metalblok S.r.l., Italy
Opening of a new distribution centre in Moscow and expansion of sales activities in Russia
A new assembly system for the joining elements for exhaust pipes put into operation at the plant in Gerbershausen, Germany
Patented NORMACONNECT V PP profile clamp introduced to the market
Awarded “Best Supplier in Stable Business Relationship” hon-ours by Würth Industrie Services, Bad Mergentheim
Increase in the free float to 83.3% as part of the sale of shares by 3i and MABA Cyprus Limited
Acquisition of 85 % of the shares in Chien Jin Plastic Sdn. Bhd., Malaysia
Acquisition of a further 60% in Groen Bevestigingsmaterialen B.V., Netherlands
Opening of the new manufacturing site in Talegaon, India
Acquisition of DavyDick & Co. Pty. Ltd., Australia
Increase in the free float to 100% through the sale of shares by 3i
Inclusion in the MDAX
Q12013Assembly system for the joining elements for exhaust pipes in Gerbershausen

12 NORMA Group AG Annual Report 2012
18
34
26
44
13Contents
Overview of key figures 2012 Two strong distribution channels NORMA Group – Technology connects Highlights 2012
15 Letter from the Management Board
22 To our Shareholders 22 NORMA Group on the Stock Market 30 Supervisory Board Report 38 Corporate Governance Report
with Declaration of Conformity
49 Consolidated Management Report 50 Business and operating environment 56 Overview of business development 62 Financial performance, financial
position and cash flows 68 Segment reporting 70 Research and development 73 Employees 76 Production and supply chain management 78 Purchasing and supplier management 79 Sales and marketing 80 Sustainability 82 Risk and opportunity report 91 Forecast 96 Other legally required disclosures 99 Supplementary report
101 Consolidated Financial Statements 102 Consolidated statement of financial position 104 Consolidated statement of comprehensive
income 105 Consolidated statement of cash flows 106 Consolidated statement of changes in equity 108 Segment reporting 110 Notes to the consolidated financial statements 161 Appendix to the notes to the consolidated
financial statements 163 Responsibility statement 164 Auditor’s report
165 Further Information 165 Glossary 169 Overview by quarter 2012 170 Multi-year overview
Financial calendar 2013 Contact Imprint
Contents

NORMA Group AG Annual Report 201214
Bernd KleinhensBusiness Development
The Management Board of NORMA
Group pays a visit to manufacturing at company headquarters in Maintal.
Dr. Othmar BelkerChief Financial Officer (CFO)
Werner DeggimChief Executive Officer (CEO)
John StephensonChief Operating Officer (COO)

15Management Board Letter Consolidated Management Report Consolidated Financial Statements Further InformationTo Our Shareholders 15
Letter from the Management Board
Although 2012 was a rather challenging year for us as well, we managed to top our extremely suc-cessful financial year 2011, the best year in the history of the company to date.
In light of the difficult conditions we faced, the operational figures turned out to be quite satisfactory. We succeeded in increasing sales by 4.0% to EUR 604.6 million. EBITDA rose by 3.3% to EUR 120.8 million and thus exceeded last year’s high level. We increased our adjusted operational results (EBITA)by 2.7% to EUR 105.4 million and also managed to maintain our adjusted operational EBITA margin at a very high level of 17.4%.
Due to our solid net profit, we will be proposing to you, dear shareholders, at the Annual General Meet-ing to be held on 22 May 2013 that we pay out a dividend of EUR 0.65 for the fiscal year 2012. This equates to a dividend yield of 3.1% based on the year-end share price. By doing so, we would like you to participate in the economic success of the company, yet make sure we still have the financial re-sources we will need to pursue further growth.
We will continue to see to it that we maintain a strong balance sheet and remain in a solid financial position in the future as well. Our goal is to ensure sufficient equity capital and liquidity. During the last financial year, we managed to lower our net financial debt to EUR 174.2 million despite having to pay for four acquisitions and the dividend.
The year 2012 clearly showed that our multi-branch strategy is one of the strengths of NORMA Group. Our broad diversification that spans various types of customers and regional markets enabled us to compensate for negative trends in specific markets at least to some extent. Furthermore, we took advantage of the opportunity to improve our market position by making acquisitions in Switzerland, Italy and Malaysia, but also by increasing our shareholding in the Netherlands.
Last year, we managed to make significant progress in many of the areas we mentioned in our 2011 Annual Report.
For example, we have expanded our production capacities in Great Britain and China and are now able to implement the same quality standards simultaneously at both sites due to their close coop-eration. We also inaugurated a new plant in Talegaon, India, that is equipped with state-of-the-art production technology. The large order for fluid lines we received from a Chinese truck manufacturer
Dear shareholders, customers and business partners,
16 NORMA Group AG Annual Report 2012
for which production in China started in 2013 represents an important reference for us in the Chinese market. Our new representative offices in Vietnam, Indonesia and the Philippines allow us to expand our sales and marketing capacities in existing markets.
Now that we managed to put our Russian assembly plant for fluid products in Togliatti into operation in 2011, we are also planning to supply customers in Belarus and Kazakhstan from our new distribution centre located near Moscow in the future.
And not to forget: we also strengthened our home base in Germany by putting a new assembly line into operation in Gerbershausen.
All in all, our company thus continues to rest on a strong and sustainable foundation. And we plan to keep it that way. So, let’s look ahead to the future.
Many of the problems caused by the financial and debt crisis have yet to be solved. Therefore, the economic environment will remain challenging in 2013. We expect our operational business to pick up slowly before a noticeable upswing takes place, but not before the second half of the year. This will be supported by the introduction of the EURO 6 standard for trucks, among other things. Therefore, we are optimistic that 2013 will be yet another good financial year with a slight increase in sales and a good operational result.
Growth abroad will continue to come from various sources. On the one hand, we will continue to benefit from the high dynamics of the economies in the Asia-Pacific region, in particular. For this reason, we intend to continue expanding our sales activities. And, last but not least, we will continue to pursue our goal of strengthening our presence in the domestic and foreign markets and further diversifying our product portfolio by engaging in reasonable long-term acquisitions.
We already took the next step toward expanding our product range by acquiring DavyDick in Austra-lia in January 2013.
Due to the high Asian demand, we will be expanding our production capacities by adding yet another plant in China. This will also strengthen our cooperation with our local Chinese customers.
We intend to strengthen our presence in Brazil as well by setting up our own production capacities in the foreseeable future. As a result, we will be present with our own sales, engineering and manufactur-ing in all global regional segments.
We continue to face the challenges created by increased environmental consciousness, more stringent emission regulations and rising energy costs, today perhaps more than ever before.
16
17Management Board Letter Consolidated Management Report Consolidated Financial Statements Further InformationTo Our Shareholders
Our success will continue to be based on our customer-specific system solutions from a single source, increasingly strong presence in the most important economic regions of the world and our leading market and technology position in the field of engineered joining technology. We intend to continue the growth of NORMA Group in the years to come based on this.
Here, we are counting on our employees’ expertise and strong commitment. We would like to express our sincere thanks to all our employees for contributing to the fact that NORMA Group continues to operate successfully on the market and has been able to continue its growth.
We would also like to thank our customers, suppliers and investors for their confidence in our com-pany. And of course you, too, our dear shareholders, for your loyalty. We will continue pursuing our strategy in a resolute manner to justify your confidence in us.
Sincerely,
17
Werner Deggim CEO
Dr. Othmar BelkerCFO
John StephensonCOO
Bernd KleinhensBusiness Development


With nearly 60 years of experience in product development, we understand our customers’ needs and the technical demands of the avia-tion industry.Thomas Kraus, Vice President Business Development EMEA Engineered Joining Technology
Brian Ignaczak, Director Product Development Americas
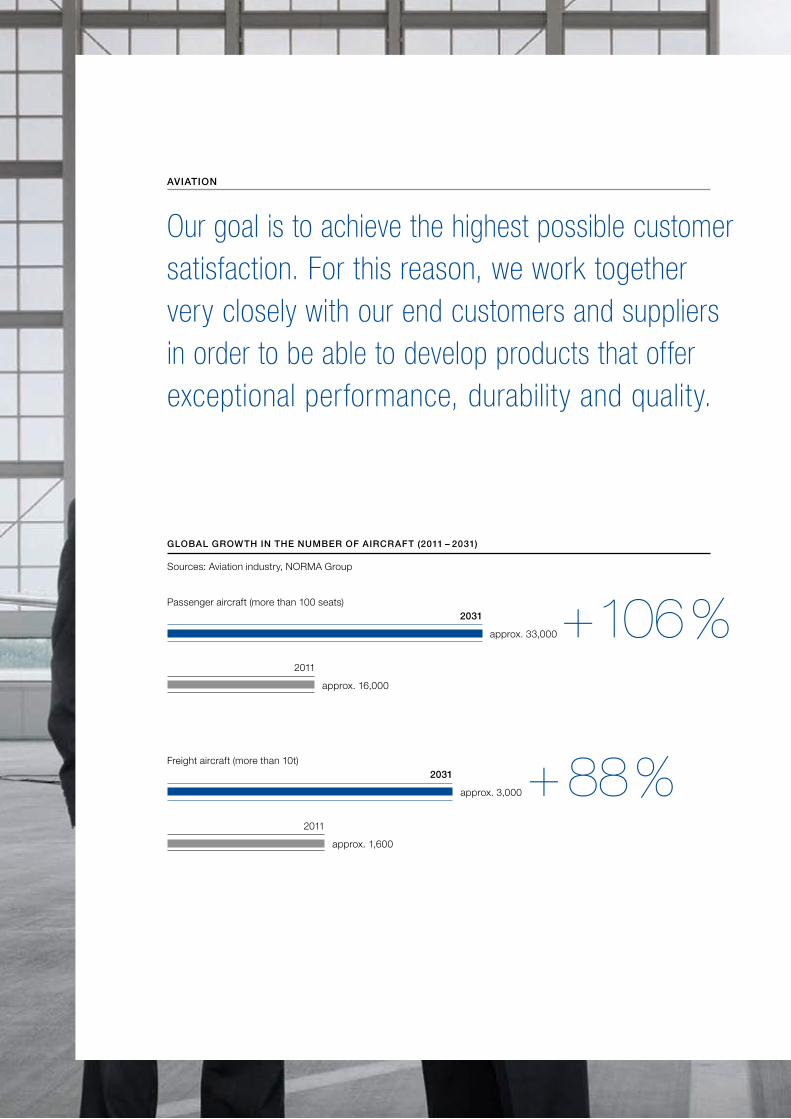
Sources: Aviation industry, NORMA Group
GLOBAL GROWTh IN The NuMBeR OF AIRCRAFT (2011 – 2031)
Passenger aircraft (more than 100 seats)
Freight aircraft (more than 10t)
approx. 16,000
approx. 1,600
approx. 33,000 + 106 %
approx. 3,000 + 88 %
2011
2011
2031
2031
AvIATION
Our goal is to achieve the highest possible customer satisfaction. For this reason, we work together very closely with our end customers and suppliers in order to be able to develop products that offer exceptional performance, durability and quality.

NORMAFIX® Red Grip
NORMA Group AG Annual Report 2012
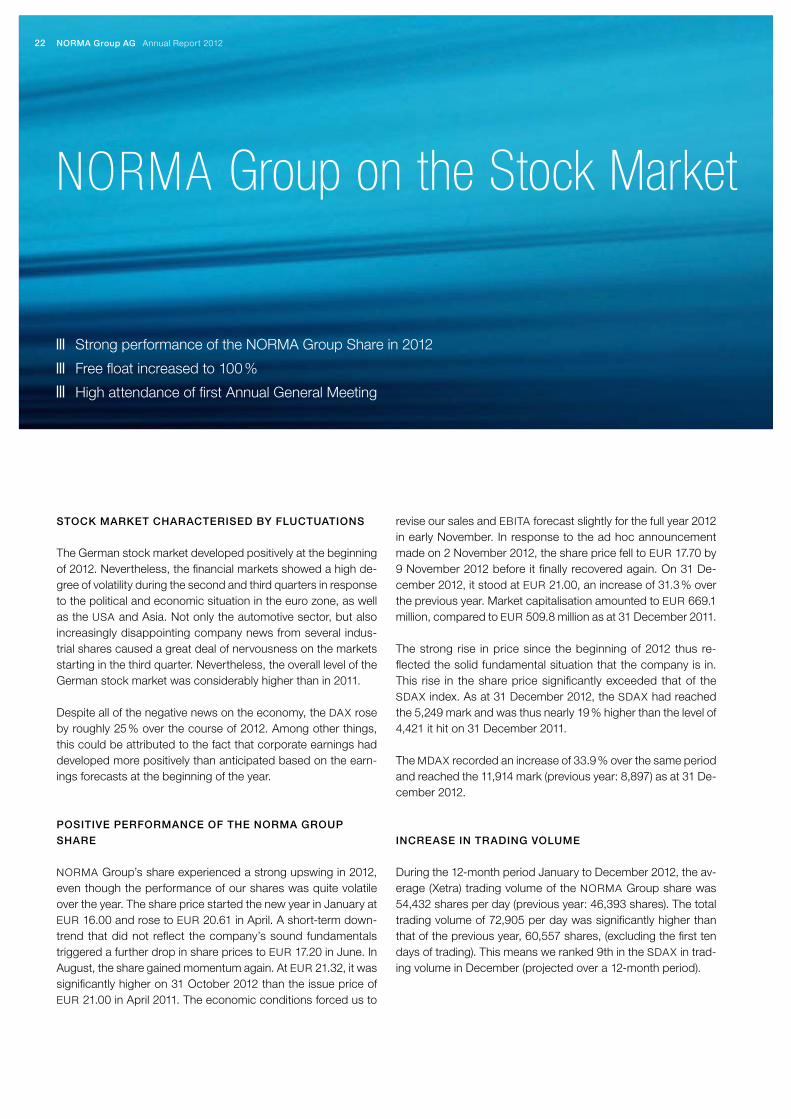
NORMA Group on the Stock Market
Strong performance of the NORMA Group Share in 2012
Free float increased to 100 %
High attendance of first Annual General Meeting
STOCK MARKeT ChARACTeRISeD By FLuCTuATIONS
The German stock market developed positively at the beginning of 2012. Nevertheless, the financial markets showed a high de-gree of volatility during the second and third quarters in response to the political and economic situation in the euro zone, as well as the USA and Asia. Not only the automotive sector, but also increasingly disappointing company news from several indus-trial shares caused a great deal of nervousness on the markets starting in the third quarter. Nevertheless, the overall level of the German stock market was considerably higher than in 2011.
Despite all of the negative news on the economy, the DAX rose by roughly 25 % over the course of 2012. Among other things, this could be attributed to the fact that corporate earnings had developed more positively than anticipated based on the earn-ings forecasts at the beginning of the year.
POSITIve PeRFORMANCe OF The NORMA GROuP
ShARe
NORMA Group’s share experienced a strong upswing in 2012, even though the performance of our shares was quite volatile over the year. The share price started the new year in January at EUR 16.00 and rose to EUR 20.61 in April. A short-term down-trend that did not reflect the company’s sound fundamentals triggered a further drop in share prices to EUR 17.20 in June. In August, the share gained momentum again. At EUR 21.32, it was significantly higher on 31 October 2012 than the issue price of EUR 21.00 in April 2011. The economic conditions forced us to
22
revise our sales and EBITA forecast slightly for the full year 2012 in early November. In response to the ad hoc announcement made on 2 November 2012, the share price fell to EUR 17.70 by 9 November 2012 before it finally recovered again. On 31 De-cember 2012, it stood at EUR 21.00, an increase of 31.3 % over the previous year. Market capitalisation amounted to EUR 669.1 million, compared to EUR 509.8 million as at 31 December 2011.
The strong rise in price since the beginning of 2012 thus re-flected the solid fundamental situation that the company is in. This rise in the share price significantly exceeded that of the SDAX index. As at 31 December 2012, the SDAX had reached the 5,249 mark and was thus nearly 19 % higher than the level of 4,421 it hit on 31 December 2011.
The MDAX recorded an increase of 33.9 % over the same period and reached the 11,914 mark (previous year: 8,897) as at 31 De-cember 2012.
INCReASe IN TRADING vOLuMe
During the 12-month period January to December 2012, the av-erage (Xetra) trading volume of the NORMA Group share was 54,432 shares per day (previous year: 46,393 shares). The total trading volume of 72,905 per day was significantly higher than that of the previous year, 60,557 shares, (excluding the first ten days of trading). This means we ranked 9th in the SDAX in trad-ing volume in December (projected over a 12-month period).

23
NORMA Group on the Stock Market
Management Board Letter Consolidated Management Report Consolidated Financial Statements Further InformationTo Our Shareholders
ChANGeS IN ShARehOLDeR STRuCTuRe Due TO
hIGheR FRee FLOAT
The main shareholder 3i Group plc and funds managed by 3i still held 11.3 million shares (35.5 %) as at 31 December 2011. Ac-cording to the voting right notifications we received, the share-holding dropped to 5.3 million shares (16.7 %) over the course of 2012. At the beginning of January 2013, 3i Group sold all of its remaining shares in NORMA Group, thus share ownership has dropped to 0 %.
MABA CYPRUS Limited, a major shareholder at the time of the IPO, also reduced its share ownership in 2012 based on the vot-ing right notifications made available to us. As at 31 December 2011, it still held 2.6 million shares (8.3 %). According to the voting right notifications we received, 0.8 million shares (2.5 %) were held as at 1 October 2012.
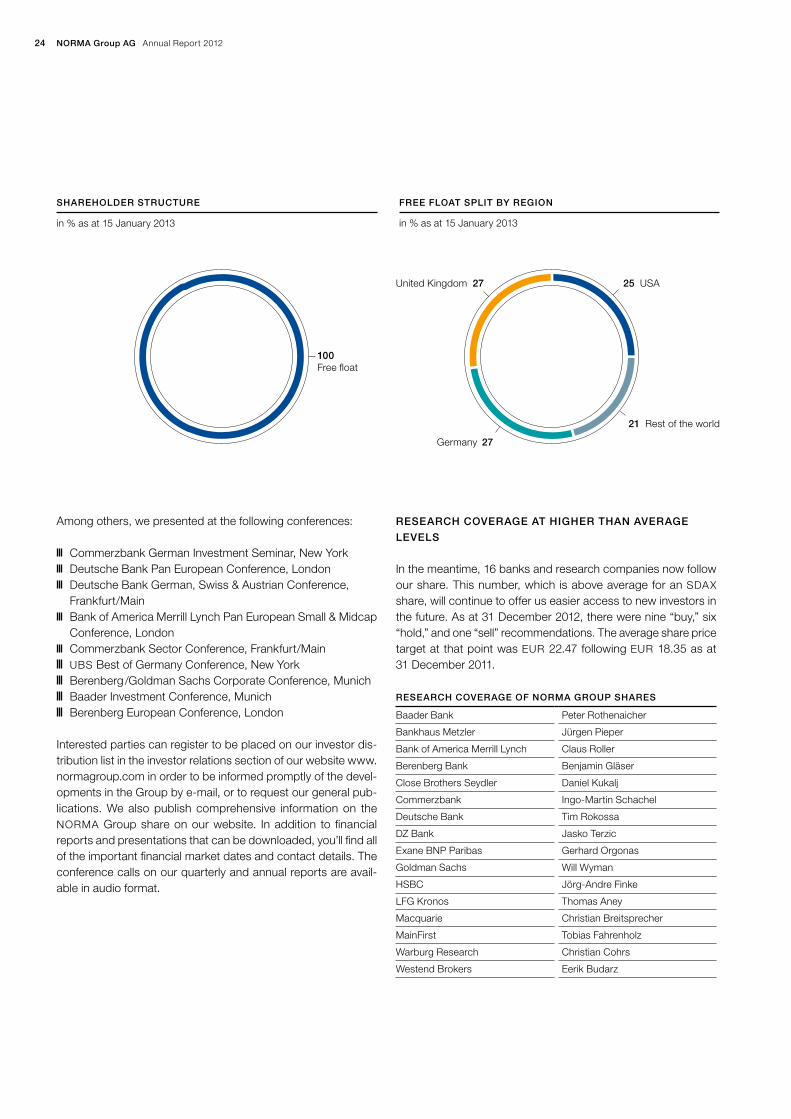
The free float increased to 100 % as a result.
According to further voting right notifications, NORMA Group shares that can be attributed to free float were held by Thread-needle (10.82 %), Allianz Global Investors Europe GmbH (5.75 %), Mondrian Investment Partners Ltd. (5.34 %), DWS Investment GmbH (4.44 %), ODDO & Cie. (3.39 %) and T. Rowe Price (3.025 %).
The Management and Supervisory Boards of NORMA Group AG hold roughly 3 % of the shares in total.
In December, we came in 4th place in the SDAX category “free float market capitalisation.”
The regional distribution to institutional shareholders in free float has changed due to the international placement of the shares by 3i at the end of 2012 and the beginning of 2013. 25 % (previ-ously 15 %) of our shares were held in the USA, 27 % (previously 40 %) in the UK and 27 % (previously 23 %) in Germany.
SuSTAINeD INveSTOR ReLATIONS ACTIvITIeS
We continued to pursue our goal of increasing awareness of the NORMA Group all over the world and reinforcing and expanding perception of the NORMA Group share as an attractive growth stock. We engage in regular, transparent and reliable communi-cation with analysts and institutional and private investors to sup-port the strategic direction of NORMA Group that is based on sustainable growth and high margins. In doing so, we seek to improve investor confidence in the NORMA Group share and to ensure that the share price is valued realistically and fairly.
We had numerous meetings with institutional investors, financial analysts and private investors in 2012 and also attended capital market conferences and roadshows in the main financial centres of Europe and the USA. On many occasions, the members of our Management Board attended in person to answer questions from capital market participants.
in % NORMA Group AG SDAX MDAX
40
30
20
10
0
-10
ShARe PRICe PeRFORMANCe INDeXeD TO 100 IN COMPARISON TO The SDAX AND MDAX
FebJan March April May June July Aug Sep Oct Nov Dec
24 NORMA Group AG Annual Report 2012
Among others, we presented at the following conferences:
Commerzbank German Investment Seminar, New York Deutsche Bank Pan European Conference, London Deutsche Bank German, Swiss & Austrian Conference,
Frankfurt/Main Bank of America Merrill Lynch Pan European Small & Midcap
Conference, London Commerzbank Sector Conference, Frankfurt/Main UBS Best of Germany Conference, New York Berenberg /Goldman Sachs Corporate Conference, Munich Baader Investment Conference, Munich Berenberg European Conference, London
Interested parties can register to be placed on our investor dis-tribution list in the investor relations section of our website www.normagroup.com in order to be informed promptly of the devel-opments in the Group by e-mail, or to request our general pub-lications. We also publish comprehensive information on the NORMA Group share on our website. In addition to financial reports and presentations that can be downloaded, you’ll find all of the important financial market dates and contact details. The conference calls on our quarterly and annual reports are avail-able in audio format.
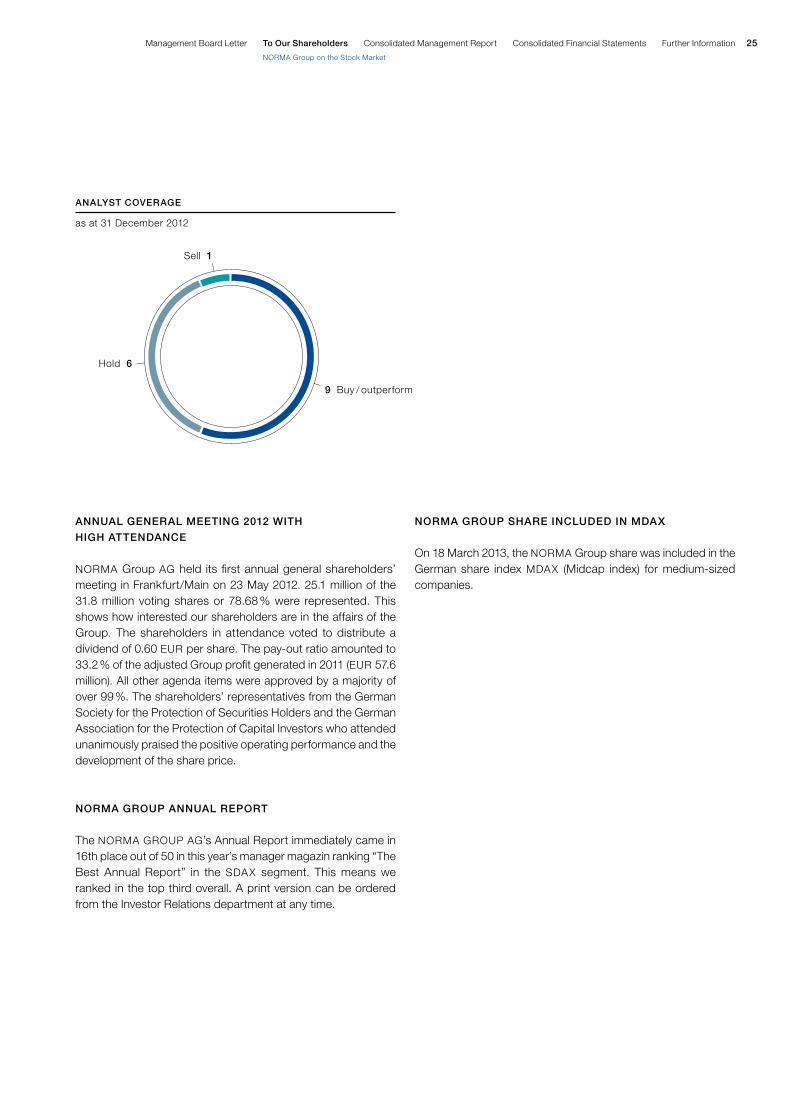
ReSeARCh COveRAGe AT hIGheR ThAN AveRAGe
LeveLS
In the meantime, 16 banks and research companies now follow our share. This number, which is above average for an SDAX share, will continue to offer us easier access to new investors in the future. As at 31 December 2012, there were nine “buy,” six “hold,” and one “sell” recommendations. The average share price target at that point was EUR 22.47 following EUR 18.35 as at 31 December 2011.
ReSeARCh COveRAGe OF NORMA GROuP ShAReS
Baader Bank Peter Rothenaicher
Bankhaus Metzler Jürgen Pieper
Bank of America Merrill Lynch Claus Roller
Berenberg Bank Benjamin Gläser
Close Brothers Seydler Daniel Kukalj
Commerzbank Ingo-Martin Schachel
Deutsche Bank Tim Rokossa
DZ Bank Jasko Terzic
Exane BNP Paribas Gerhard Orgonas
Goldman Sachs Will Wyman
HSBC Jörg-Andre Finke
LFG Kronos Thomas Aney
Macquarie Christian Breitsprecher
MainFirst Tobias Fahrenholz
Warburg Research Christian Cohrs
Westend Brokers Eerik Budarz
100 Free float
in % as at 15 January 2013
ShARehOLDeR STRuCTuRe
United Kingdom 27
in % as at 15 January 2013
Germany 27
25 USA
21 Rest of the world
FRee FLOAT SPLIT By ReGION
25
NORMA Group on the Stock Market
Management Board Letter Consolidated Management Report Consolidated Financial Statements Further InformationTo Our Shareholders
ANNuAL GeNeRAL MeeTING 2012 WITh
hIGh ATTeNDANCe
NORMA Group AG held its first annual general shareholders’ meeting in Frankfurt/Main on 23 May 2012. 25.1 million of the 31.8 million voting shares or 78.68 % were represented. This shows how interested our shareholders are in the affairs of the Group. The shareholders in attendance voted to distribute a dividend of 0.60 EUR per share. The pay-out ratio amounted to 33.2 % of the adjusted Group profit generated in 2011 (EUR 57.6 million). All other agenda items were approved by a majority of over 99 %. The shareholders’ representatives from the German Society for the Protection of Securities Holders and the German Association for the Protection of Capital Investors who attended unanimously praised the positive operating performance and the development of the share price.
NORMA GROuP ANNuAL RePORT
The NORMA GROUP AG’s Annual Report immediately came in 16th place out of 50 in this year’s manager magazin ranking “The Best Annual Report” in the SDAX segment. This means we ranked in the top third overall. A print version can be ordered from the Investor Relations department at any time.
9 Buy / outperform
as at 31 December 2012
Hold 6
Sell 1
ANALyST COveRAGe
NORMA GROuP ShARe INCLuDeD IN MDAX
On 18 March 2013, the NORMA Group share was included in the German share index MDAX (Midcap index) for medium-sized companies.

NORMA Group AG Annual Report 2012

We develop joining elements to realize higher engine efficiency in close cooperation with leading automotive and truck manufacturers.Our products are indispensable in terms of their performance, quality and reliability.Stephan Mann, Director Product Development EMEA
Tan Hang, Research Engineer

We leverage the automobile industry’s innovation dynamics and transfer our profound know-how to other industries. In doing so, we strengthen our position as one of the world’s leading companies in the area of engineered joining technology.
REDUCTION IN GLOBAL CO2 EMISSIONS *
AUTOMOTIVE
Sources: DieselNet, NORMA Group
* Planned emission regulations for passenger vehicles
Europe
NAFTA
Japan
Brazil
Russia
India
China
2000 2004 2006 2008 2010 2012 2012 2014 2016 2018 2019
EURO 3 EURO 4 EURO 5 EURO 6
EPA ’00
JPN ’98
EURO 1
EURO 1 EURO 3 EURO 4 EURO 5EURO 2
EURO 3EURO 2 EURO 5 EURO 6
JPN ’02 JPN ’05 JPN ’09 JPN ’14 J. ’19
EPA ’04 EPA ’07 EPA ’10 EPA ’15
EURO 1
EURO 2 EURO 3 EURO 4 EURO 5 EURO 6
EURO 2 EURO 3 EURO 4 EURO 5

NORMAQuICK® Twist III
30 NORMA Group AG Annual Report 2012
NORMA Group AG Supervisory Board Report 2012
The Supervisory Board of NORMA Group AG has monitored and advised on the activities of the Management Board in accor-dance with the rules of the German Stock Corporation Act, the German Corporate Governance Code and NORMA Group AG’s Articles of Association.
The Management Board provides the Supervisory Board with regular written reports on a monthly basis. These reports cover the state of the economy, the business development of NORMA Group AG and the Group as well as the forecast for the current financial year, and give a detailed account of incoming orders, the order book and the development of both sales and earnings compared to the previous year and current targets.
The Supervisory Board convened at four scheduled meetings in financial year 2012. In addition, the board held a teleconference and one other meeting on short notice.
The Management Board provided extensive information about the current course of business at the Supervisory Board’s regu-lar meetings. In particular, all key figures for the Group and the Company were discussed at these meetings and compared to the previous year’s figures and current targets. At every meeting, the Management Board provided the Supervisory Board with information concerning the order situation as well as their as-sessment of the economic outlook, market developments and NORMA Group’s competitors. At each regular meeting of the Supervisory Board, the Management Board also presents a risk report in which the probability of occurrence and potential effects of all relevant risks are assessed. This regular risk reporting pro-vides the Supervisory Board with a clear picture of which pos-sible risks could have a negative impact on the Company’s cash flows and financial performance. The Supervisory Board worked together with the Management Board to develop measures to avoid the risk that was considered highly relevant and likely to occur. In addition, the Supervisory Board and Management
Board discussed NORMA Group’s long-term strategic orienta-tion and current M&A projects. In addition to the regularly recur-ring topics, the Supervisory Board also dealt with the following issues in financial year 2012:
TeLeCONFeReNCe heLD ON 10 FeBRuARy 2012
ReGARDING The ACQuISITION OF CONNeCTORS
veRBINDuNGSTeChNIK AG
The Supervisory Board and Management Board discussed the acquisition of Connectors Verbindungstechnik AG during a tele-conference. The Supervisory Board approved the acquisition.
SuPeRvISORy BOARD MeeTING heLD ON 27 MARCh
2012 IN MAINTAL
The 2011 annual financial statements and management report of NORMA Group AG as well as the corresponding consolidated financial statements and group management report presented by the Management Board were discussed in detail by the Supervi-sory Board with the auditors in attendance from the engaged auditing firm, PriceWaterhouse Coopers AG. This discussion fo-cused, among other things, on the internal control system and risk identification systems both in the legal units, including the NORMA Group AG, as well as in the regions and the Group as a whole. The members of the Audit Committee reported on their in-depth discussion with the auditors on 26 March 2012 regarding the annual financial statements.
The consolidated financial statements of NORMA Group AG were prepared in accordance with section 315a of the German Com-mercial Code (Handelsgesetzbuch, HGB) on the basis of Interna-tional Financial Reporting Standards (IFRS). The auditor issued an unqualified opinion for the 2011 annual financial statements

31Management Board Letter Consolidated Management Report Consolidated Financial Statements Further InformationTo Our Shareholders
Supervisory Board Report
and management report of NORMA Group AG as well as for the consolidated financial statements and group management report. The documents pertaining to the financial statements, the Man-agement Board’s proposal for the appropriation of net profit and both auditor’s reports were submitted to the Supervisory Board. The Supervisory Board accepted the auditor’s findings and had no objections.
The Supervisory Board then approved and adopted the annual financial statements of NORMA Group AG as well as the 2011 consolidated financial statements along with the associated man-agement reports. The Supervisory Board also approved the Man-agement Board’s recommendation on the utilisation of unappro-priated net profits.
The Supervisory Board dealt with NORMA Group’s compliance programme, for which current drafts of the code of conduct, the anti-corruption policy and anti-corruption compliance procedures and the conflict of interest review policy were presented, among other things.
The Supervisory Board decided on a long-term lease for the planned expansion of production in Newbury (UK) as well as a simplification of the Management Board’s by-laws such that com-panies in which NORMA Group AG holds more than 50% interest are treated as full-fledged subsidiaries in the provisions of the by-laws.
The Management Board presented a project for the establish-ment of a long-term strategic orientation, which was approved by the Supervisory Board.
The Supervisory Board’s examination of the efficiency of its ac-tivities specified in the German Corporate Governance Code was carried out in the Supervisory Board meeting held on 27 March 2012 after the Supervisory Board had worked together for one year. In accordance with the German Corporate Governance
Code, the examination of efficiency will take place every year in March when the Supervisory Board meets to adopt the financial statements.
SuPeRvISORy BOARD MeeTING heLD ON 23 MAy 2012
IN FRANKFuRT AM MAIN
The Supervisory Board meeting began immediately following the first annual shareholders’ meeting of NORMA Group AG with a review of the successfully concluded annual shareholders’ meeting.
The detailed discussion of current business developments in-cluded the supply shortage of specific plastics and the develop-ment of personnel expenses in the Group as well as the status of expansion in the APAC region.
The Management Board reported on the completion of the ac-quisition of Connectors Verbindungstechnik AG and the status of post-merger integration measures under the agenda item ‘strategic projects and acquisitions’. The Management Board also presented the Supervisory Board with other possible M&A projects. The discussion centred in particular on evaluation pa-rameters for determining an appropriate purchase price as well as on possible measures to minimise specific acquisition risks. The Supervisory Board authorised the Management Board to implement these projects on the basis of the upper limit set by the Supervisory Board.
The responsible partner of a reputable international consulting firm presented the Supervisory Board with a project outline to draw up a long-term strategic orientation for NORMA Group that included, in particular, the strategic definition and assessment of NORMA Group’s medium-term growth markets. The Supervi-sory Board approved the project after discussing it at greater length.
Dr. Stefan WolfChairman of the Supervisory Board

32 NORMA Group AG Annual Report 2012
SuPeRvISORy BOARD MeeTING heLD ON 14 SePTeM-
BeR 2012 IN KRONBeRG IM TAuNuS.
The Management Board explained the reasons for the planned transformation of NORMA Group AG in an SE (Societas Euro-paea). The Supervisory Board approved this project based on the Group’s European and global orientation. In addition, the Management Board presented a simplification of the Group’s organisational structure with a legal subgroup ‘Americas’. The Supervisory Board approved this recommendation.
Furthermore, the Management Board reported on the positive development of the APAC region. The Supervisory Board ap-proved the construction of a second plant in South China to meet production capacities required in subsequent years after a de-tailed discussion. The Supervisory Board also approved the ac-quisition of Chien Jin Plastic Sdn. Bhd., Malaysia, which will strengthen the water supply business in Asia. The detailed plan presented on the construction of a plant in Brazil was approved.
The Management Board presented the 2012 financial strategy with which the terms of the existing syndicate agreement are to be augmented. Additional debt or equity capital measures are to be presented to the Supervisory Board if necessary.
The renewal of the leases at the sites in Michigan and Melbourne was approved by the Supervisory Board.
Following the meeting, Dr. von Haacke resigned from his position as a member of the Supervisory Board and thus also as Deputy Chairman of the Supervisory Board and member of the General and Nomination Committee.
SuPeRvISORy BOARD MeeTING heLD ON 22 NOveM-
BeR 2012 IN MAINTAL
The Management Board presented the 2013 plan to the Super-visory Board along with the medium-term plan for 2014-2017. The anticipated market developments, NORMA Group’s busi-ness development and significant cost items were discussed in detail. Due to the weak European economy, especially in the fourth quarter of 2012, the growth targets were adjusted to the expected market trend in the budget process.
The 2013 budget and the medium-term plan for 2014-2017 were approved unanimously by the Supervisory Board.
The Management Board informed the Supervisory Board about the current status of various M&A projects. The Supervisory Board approved the increase of an equity investment in the Netherlands as well as the acquisition of the operating activities of DavyDick & Co. Pty. Limited – a trading firm in Australia – following an in-depth discussion of the acquisition terms and conditions.
The exercise of preemptive rights for the site in St. Clair, USA, was approved by the Supervisory Board.
The Management Board and the partner of a reputable interna-tional consulting firm presented the results of the long-term stra-tegic orientation project for NORMA Group to the Supervisory Board. Potential acquisitions were discussed in addition to the definition and assessment of medium-term growth markets. Fur-ther strategic steps were reviewed with the Supervisory Board following a lively discussion.
The Management Board presented a euro crisis scenario that analyses the potential effects of a worsening of the euro crisis on the Group. No risks to the company as a going concern would be expected, even if the euro zone were to break up.
SuPeRvISORy BOARD MeeTING heLD ON 20 DeCeM-
BeR 2012 IN FRANKFuRT AM MAIN
The Supervisory Board convened without the members of the Management Board and discussed the status of the search for a new candidate to fill the vacant seat on the Supervisory Board. The Supervisory Board also met with qualified female candidates during this meeting.
All members of the Supervisory Board attended the meetings held on 27 March, 23 May and 14 September 2012 in person with Dr. Stefan Wolf, Lars Berg, Dr. Ulf von Haacke, Dr. Günter Hauptmann, Knut Michelberger and Dr. Christoph Schug. Dr. Stefan Wolf, Lars Berg, Dr. Günter Hauptmann, Knut Michel-berger and Dr. Christoph Schug attended the Supervisory Board meeting held on 22 November 2012 in person. Dr. Stefan Wolf, Lars Berg, Knut Michelberger and Dr. Christoph Schug attended the Supervisory Board meeting held on 20 December 2012. Dr. Günter Hauptmann was unable to attend.
The General and Nomination Committee convened once in 2012. The Supervisory Board approved the preparation of contract documents extending the term of service of a member of the Management Board as the president of the APAC region on 23 May 2012.
There were no conflicts of interest between the members of the Supervisory Board and the Company in the 2012 financial year.
In addition to the regular monthly reporting and the Supervisory Board meetings, the Chairman of the Supervisory Board re-mained in constant contact with the Chairman of the Manage-ment Board by telephone and e-mail in the 2012 financial year. This communication dealt with assessments of the Company’s economic situation, important transactions and events and the progress of ongoing projects. The Chairman of the Supervisory

33Management Board Letter Consolidated Management Report Consolidated Financial Statements Further InformationTo Our Shareholders
Supervisory Board Report
Board informed the other members of the Supervisory Board of the important and relevant issues discussed by the Chairman of the Supervisory Board and the Chairman of the Management Board by e-mail and by phone.
The Management Board promptly alerted the Supervisory Board of all transactions requiring its approval in the 2012 financial year. The Supervisory Board made all of its decisions on the basis of detailed and well-founded documents.
As the Chairman of the Audit Committee, Dr. Schug regularly reported on the committee’s meetings in several Supervisory Board meetings.
The Audit Committee of NORMA Group AG convened three times in the financial year just ended. In addition, it held one detailed telephone conference with the auditors concerning the annual audit. Lars Berg, Knut Michelberger and Dr. Christoph Schug as the Chairman participated in all meetings of the Audit Committee. Knut Michelberger was unable to attend the tele-phone conference. Dr. Othmar Belker from the Management Board attended the meetings, as did officers of the second man-agement level to advise on technical issues in their areas of re-sponsibility. The auditors from PricewaterhouseCoopers AG, Dr. Ulrich Störk and Stefan Hartwig, also attended two meetings. The Audit Committee accompanied the audit of the annual finan-cial statements in numerous meetings and discussed core con-trols and areas of audit emphasis as well as the preliminary and final results of the audit with the auditors. In addition to an in-depth discussion of the process and results of the audit of the consolidated financial statements as well as the Company’s separate financial statements and individual accounting issues, the Audit Committee dealt regularly with the risk reporting (in-cluding specific individual risks in the area of procurement and pension obligations), the compliance system and individual com-pliance topics, the internal auditing department, the Treasury department and financing, focusing on amending the existing syndicate agreement and the integration of newly acquired com-panies based on the example of Nordic Metalblok, Italy.
In addition to the Audit Committee meetings, the Chairman of the Audit Committee was in regular personal and telephone contact with the CFO as well as held a separate meeting with the auditors and the CFO to discuss possible areas of emphasis for the audit of the 2012 annual financial statements.
The 2012 annual financial statements for NORMA Group AG pre-sented by the Management Board were audited by the auditing firm PricewaterhouseCoopers AG along with the management report and the corresponding consolidated financial statements and group management report. The auditors were engaged on 1 October 2012.
The consolidated financial statements of NORMA Group AG were prepared in accordance with section 315a of the German Commercial Code (Handelsgesetzbuch, HGB) on the basis of International Financial Reporting Standards (IFRS). The auditor issued an unqualified opinion for the 2012 annual financial state-ments and management report of NORMA Group AG as well as for the consolidated financial statements and group manage-ment report. The documents pertaining to the financial state-ments, the Management Board’s proposal for the appropriation of net profit and both auditor’s reports were submitted to the Supervisory Board. The Audit Committee and the Supervisory Board in its entirety thoroughly examined the reports and dis-cussed and scrutinised them in detail together with the auditor. The Supervisory Board accepted the auditor’s findings and had no objections.
The Supervisory Board approved the annual financial statements of NORMA Group AG and the 2012 consolidated financial state-ments together with their respective management reports at its meeting on 26 March 2013. NORMA Group AG’s annual financial statements are thereby adopted in accordance with section 172 of the German Stock Corporation Act (Aktiengesetz, AktG). The Supervisory Board approved the Management Board’s recom-mendation on the utilisation of unappropriated net profits at the same meeting.
The Supervisory Board dealt with the declaration of conformity with the Corporate Governance Code and issued the version on 9 March 2012. In March 2013 the Supervisory Board issued the current version on 4 March 2013. NORMA Group AG’s declara-tion of conformity is available on the Company’s website at www.normagroup.de.
The Supervisory Board would like to thank the Management Board and all employees of NORMA Group AG as well as the Group companies all around the world for their successful efforts in the 2012 financial year. The solid performance would not have been possible without the commitment of all employees. The Supervisory Board sees this as motivation for all of the Group’s employees to remain committed to the course in 2013 and con-tribute to NORMA Group’s continued profitable growth.
Dettingen/Erms, 26 March 2013
Dr. Stefan WolfChairman of the Supervisory Board

NORMA Group AG Annual Report 2012
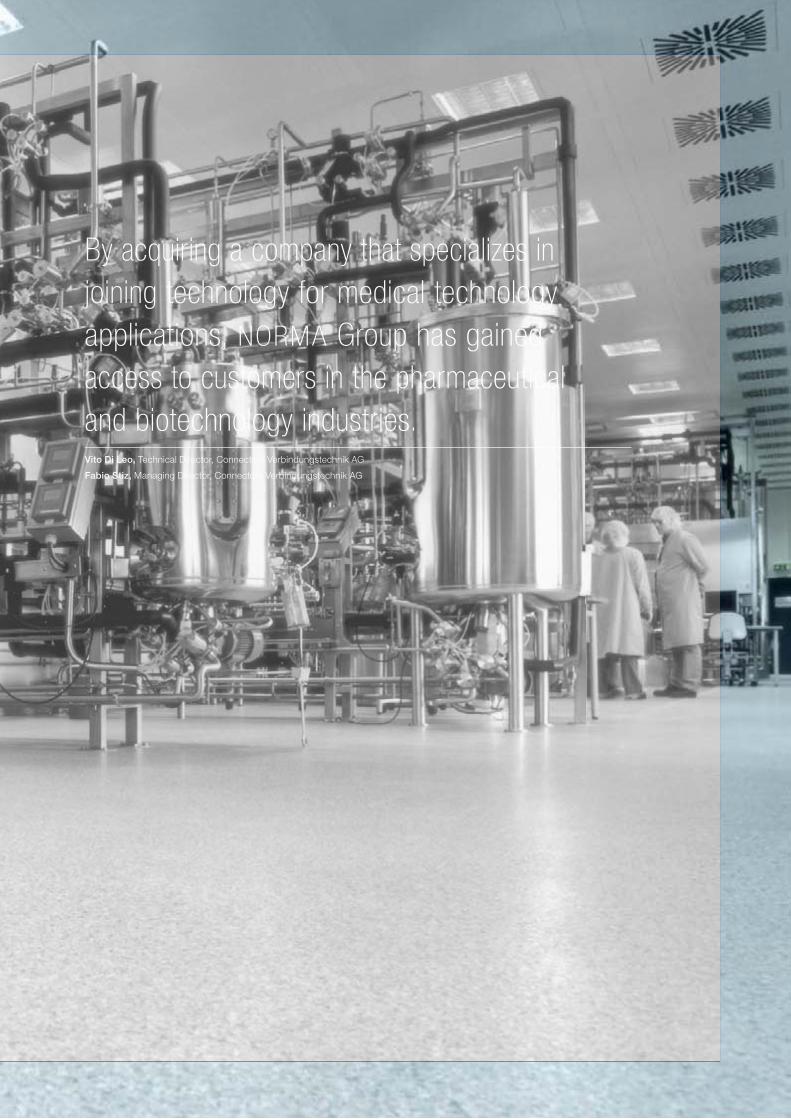
By acquiring a company that specializes in joining technology for medical technology applications, NORMA Group has gained access to customers in the pharmaceutical and biotechnology industries.Vito Di Leo, Technical Director, Connectors Verbindungstechnik AG
Fabio Stiz, Managing Director, Connectors Verbindungstechnik AG
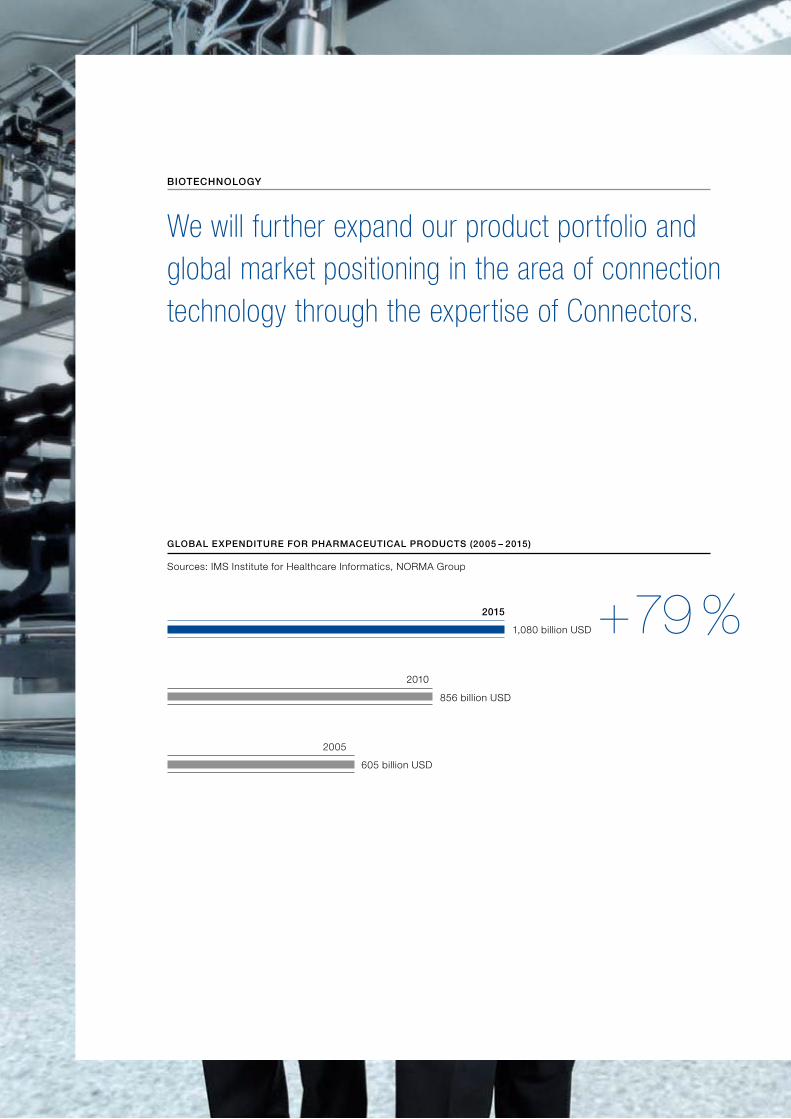
Sources: IMS Institute for Healthcare Informatics, NORMA Group
GLOBAL eXPeNDITuRe FOR PhARMACeuTICAL PRODuCTS (2005 – 2015)
BIOTeChNOLOGy
We will further expand our product portfolio and global market positioning in the area of connection technology through the expertise of Connectors.
605 billion USD
856 billion USD
1,080 billion USD +79 %
2005
2010
2015
Connectors Connlock
38 NORMA Group AG Annual Report 2012
Corporate governance ensures the long-term development of NORMA Group and the permanent growth of our Group. We are aware of our economic and social responsibility to our share-holders, employees, business partners and our social environ-ment. Therefore, our corporate management is based on sus-tainability and transparency.
The following is the Management Board’s declaration of confor-mity in accordance with Section 289a of the German Commer-cial Code (Handelsgesetzbuch, HGB) and section 3.10 of the German Corporate Governance Code. The declaration is part of the group management report.
1. DeCLARATION OF CONFORMITy WITh The GeRMAN
CORPORATe GOveRNANCe CODe
The Supervisory Board and Management Board thoroughly ex-amined which of the German Corporate Governance Code’s recommendations and suggestions NORMA Group AG should follow and explains deviations from the recommendations and the reasons for deviating from the Code. The current declaration dated 4 March 2013 as well as the first declaration dated 4 Au-gust 2011 and the second declaration dated 9 March 2012 are published on NORMA Group’s website.
The declaration dated 4 March 2013 is presented below:
NORMA Group AG corresponds in financial year 2013 with the recommendations of the Government Commission of the German Corporate Governance Code (the “Code”) in the version dated 15 May 2012 published by the Federal Ministry of Justice in the of-ficial section of the electronic Federal Gazette with the following exceptions and will continue to correspond in the future:
1. The invitation to the Annual General Meeting is not sent by electronic means (section 2.3.2 of the Code)
For organisational reasons, NORMA Group does not cur-rently comply with the German Corporate Governance Code’s recommendation to also make invitations to the Annual Gen-eral Meeting available by electronic means. Because the com-pany does not have e-mail addresses for the majority of its shareholders, sending additional invitations by electronic means would entail an unreasonable amount of time and effort on the part of the Company without providing our sharehold-ers with any real benefit. The invitation to the Annual General Meeting was and is also available for download on the Com-pany’s website.
2. Explicit goals for the composition of the Supervisory Board are not established and accordingly not published in the Corporate Governance Report. There is no age limit for Su-pervisory Board members (section 5.4.1 of the Code)
All members of the Supervisory Board will continue to comply with all pertinent legislation related to Supervisory Board nom-inations for new Supervisory Board members and take the professional and personal qualifications of candidates into ac-count, regardless of their gender. Special attention will be paid to the number of independent Supervisory Board members, potential conflicts of interest, the Company’s international ac-tivities and the diversity of the Supervisory Board. In light of this, the Company does not see the need to establish spe-cific goals or introduce an age limit.
2. ReLevANT INFORMATION ABOuT CORPORATe
GOveRNANCe PRACTICeS
Our goal is to promote a culture of responsibility, honesty and mutual respect among management and our employees. We ex-pect our managers and employees to always meet high standards of integrity.
Corporate Governance Report with Declaration of Conformity

39Management Board Letter Consolidated Management Report Consolidated Financial Statements Further InformationTo Our Shareholders
Corporate Governance Report
In addition to training and direct communications, our compliance documents are our most important means of making our employ-ees aware of their ethical and legal obligations. The central compli-ance documents, the Code of Conduct and the two fundamental guidelines “Conflicts of Interest” and “Anti-corruption” are binding for all employees of NORMA Group. The guidelines can be found on the NORMA Group website at http://www.normagroup.com/kunden/norma/ttw.nsf/id/EN_Code_of_Conduct?OpenDocument&ccm=010 and are also avail-able on the intranet for management and employees. They are periodically updated and adjusted to reflect changes in legal re-quirements and current topics. We are aware that our compliance documents and guidelines only provide general instructions and cannot cover every individual case. In addition, we expect every member of the management and our employees to demonstrate proper ethical and legal behaviour in every situation.
The Supervisory Board monitors the Management Board’s adher-ence to compliance rules. The Compliance Officer of NORMA Group AG performs this function for NORMA Group AG’s employ-ees. In the other Group companies, the Chief Compliance Officer of NORMA Group Holding GmbH is responsible for the obser-vance and administration of the above-mentioned Code for all employees of NORMA Group Holding GmbH and its associated companies. Furthermore, every operational Group company has its own Compliance Officer who reports to one of the three re-gional Compliance Officers for the regions EMEA, Americas and APAC, who in turn reports to the Compliance Officer of NORMA Group Holding GmbH. Among other things, the local Compliance Officers organise on-site compliance training measures for the employees. They are also responsible for ensuring that potential violations of compliance rules are reported, investigated, sanc-tioned, rectified and prevented in the future. We encourage our employees to report violations of regulations and internal guide-lines – skipping the chain of command if necessary – and to rec-ommend measures for improvement.
3. MANAGeMeNT BOARD AND SuPeRvISORy
BOARD FuNCTIONS
Like every German stock corporation, NORMA Group AG has a dual management system in which the management, i.e. the Management Board, is monitored by a separate Supervisory Board. The Management Board manages the Company under its own responsibility and determines the strategy, while the Su-pervisory Board appoints, advises and monitors the Manage-ment Board.
The Management Board provides the Supervisory Board with regular updates about business policies and the position of the Company – in particular the development of sales and transactions that could have a significant impact on profitability or liquidity.
The Chairman of the Supervisory Board and the Chairman of the Management Board coordinate the collaboration of the two boards. They also stay in regular contact between Supervisory Board meetings and discuss current corporate governance is-sues. All members of the Management Board participate in Su-pervisory Board meetings unless they are closed to the Manage-ment Board. The members of the Management Board report in these meetings on the current business development and pro-vide an outlook on the expected further development of NORMA Group on the basis of written documents provided in advance to the Supervisory Board members. In addition to monthly and quarterly figures, risk analysis and measures to minimise identi-fied risks are discussed at all Supervisory Board meetings and each committee chairman reports on the preceding meetings. In addition, the Management Board and Supervisory Board dis-cussed ongoing M&A projects and NORMA Group’s long-term acquisition strategy throughout 2012. The Management Board submits monthly reports to the Supervisory Board on the most important key figures of the Group and its current business de-velopment, in particular with respect to the published statements on the expected development of the Company.
39

40 NORMA Group AG Annual Report 2012
In accordance with the by-laws of the Management Board, the Supervisory Board must approve certain important transactions. This applies not only for measures at NORMA Group AG, but also for measures at its subsidiaries. In order to ensure that the Management Board is promptly informed of corresponding mat-ters involving subsidiaries so that it can request the approval of the Supervisory Board, a hierarchical system of approval require-ments organised by functional areas, levels of responsibility and countries applies worldwide at NORMA Group.
4. MANAGeMeNT BOARD
The Management Board of NORMA Group AG has four mem-bers. Werner Deggim is Chairman of the Management Board (Chief Executive Officer), Dr. Othmar Belker is Chief Financial Officer, Bernd Kleinhens is Managing Director Business Develop-ment and John Stephenson is Chief Operating Officer.
The allocation of responsibilities and internal order of the Man-agement Board are based on relevant legislation, NORMA Group AG’s Articles of Association and the Management Board by-laws enacted by the Supervisory Board as well as the internal guide-lines, including compliance documents. As a general rule, Man-agement Board resolutions are passed by simple majority. The Chairman has the deciding vote if the vote is tied. However, the members of the Management Board are obliged to make an ef-fort to reach unanimous decisions. If a member of the Manage-ment Board cannot participate in a vote, his vote will be obtained at a later date.
The entire Management Board is responsible in matters of par-ticular importance. In accordance with the Management Board by-laws, these include producing the Management Board re-ports for the purpose of informing the Supervisory Board and the quarterly and half-yearly reports, fundamental organisational measures, including the acquisition or disposal of significant
parts of companies and strategic and business planning issues, measures related to the implementation and supervision of a monitoring system pursuant to section 91(2) of the German Stock Corporation Act (Aktiengesetz, AktG), issuing the declaration of conformity pursuant to section 161(1) AktG, preparing the con-solidated and annual financial statements and similar reports, convening the Annual General Meeting and inquiries and recom-mendations by the Management Board that are to be handled and resolved by the Annual General Meeting. In addition, every Management Board member can request that a specific issue be dealt with by the entire Management Board.
Local presidents in the three regions EMEA, Americas and APAC are responsible for carrying out business on a daily basis. The Chief Operating Officer of NORMA Group AG, John Stephenson, performs this function for the APAC region. He currently works on a regular basis in Singapore and is, in particular, locally in charge of the expansion of NORMA Group in the growth region APAC. The entire Management Board of NORMA Group AG meets at least once a year with the presidents and their manag-ers at both local headquarters – Singapore for the APAC region and Auburn Hills (Michigan) for the Americas. In addition, indi-vidual members of the Management Board meet regularly with the local teams. This way, we ensure that our corporate gover-nance rules are observed in all regions and subsidiaries.
5. SuPeRvISORy BOARD
The Supervisory Board has six members. In 2012, its members comprised the Chairman of the Supervisory Board Dr. Stefan Wolf, Dr. Ulf von Haacke, Dr. Christoph Schug, Günter Haupt-mann, Knut J. Michelberger and Lars M. Berg. Dr. Ulf von Haacke resigned from his position as a member of the Supervisory Board, Deputy Chairman of the Supervisory Board and member of the General and Nomination Committee at the end of the Supervisory Board meeting held on 14 September 2012 effective

41
NORMA Group on the Stock Market
Management Board Letter Consolidated Management Report Consolidated Financial Statements Further InformationTo Our Shareholders
Corporate Governance Bericht
immediately with the approval of the Chairman of the Supervi-sory Board. On 8 February 2013, the Supervisory Board elected Lars Berg as Deputy Chairman of the Supervisory Board. On 18 February 2013, Mrs Erika Schulte was appointed a member of the Supervisory Board by court order at the recommendation of the Management Board in liaison with the Supervisory Board until the next Annual General Meeting on 22 May 2013. The other five members are appointed until the 2016 Annual General Meeting. The Supervisory Board can pass resolutions by simple majority. The Chairman has the deciding vote if a vote is tied. In addition to the Supervisory Board’s four scheduled meetings, a teleconference and one other meeting took place in financial year 2012 in which candidates for the Supervisory Board position vacated by Dr. von Haacke presented themselves.
The Chairman of the Supervisory Board represents the Super-visory Board externally. He organises the work of the Supervi-sory Board and chairs its meetings. The Supervisory Board formed two committees: the Audit Committee and the General and Nomination Committee. Both committees have three mem-bers.
The Audit Committee deals in particular with monitoring the ac-counting process and the effectiveness of the internal control and risk management systems as well as the audit of the annual financial statements, in particular the independence of the audi-tor, the additional services rendered by the auditor, engaging the auditor, determining areas of audit emphasis and agreeing to the auditor’s fees. The Audit Committee accompanies the collabora-tion between NORMA Group AG and the auditors and ensures that opportunities for improvement identified during the audit are promptly implemented. It is responsible for preparing the ac-counting documents and adopting the Supervisory Board’s resolution on the consolidated and separate financial statements. Moreover, it is responsible for compliance and reviews the com-pliance with statutory provisions and the internal guidelines.
The Chairman of the Audit Committee is Dr. Christoph Schug and the other members are Lars M. Berg and Knut J. Michel-berger. The Chairman of the Audit Committee has special knowl-edge and experience in the application of accounting policies and internal control processes due, in particular, to his many years of work as Chief Financial Officer, managing director and consultant. He is an independent financial expert within the meaning of section 100(5) AktG.
As a rule, the Audit Committee convenes immediately prior to Supervisory Board meetings as well as whenever necessary. It convened four times in financial year 2012, dealing in particular with the risk reporting and internal control system. Other topics included the treasury system and financing contracts as well as the integration of newly acquired companies. In addition, the Audit Committee was presented with the current status of the compliance system. The responsible employees presented the current status of each item on the agenda and provided an out-look on pending issues.
The General and Nomination Committee prepares personnel-related decisions and monitors the Management Board’s compli-ance with its by-laws. This committee has the following specific responsibilities: preparing Supervisory Board resolutions regard-ing the completion, change and termination of employment con-tracts with members of the Management Board in accordance with the remuneration system approved by the Supervisory Board, preparing Supervisory Board resolutions regarding legal applications to reduce the remuneration of a Management Board member pursuant to section 87(2) AktG, preparing Supervisory Board resolutions regarding the structure of the remuneration system for the Management Board, acting as representatives of the company to Management Board members who have left the company pursuant to section 112 AktG, approving secondary employment and external activities for Management Board members pursuant to section 88 AktG, granting loans to the persons specified in section 89 AktG (loans to members of the
42 NORMA Group AG Annual Report 2012
Management Board) and section 115 AktG (loans to members of the Supervisory Board), approving contracts with members of the Supervisory Board pursuant to section 114 AktG and pro-posing suitable candidates to the Annual General Meeting when there is a vote on Supervisory Board members. This committee convened once in 2012 in order to prepare the contracts to send Mr. Stephenson to Singapore. In 2012, the Chairman of the Gen-eral and Nomination Committee was Chairman of the Supervi-sory Board Dr. Stefan Wolf and the other members were Dr. Christoph Schug and Dr. Ulf von Haacke until he stepped down from the Supervisory Board. On 8 February 2013, Lars Berg was elected to succeed Dr. von Haacke as the other member of the General and Nomination Committee.
6. ANNuAL GeNeRAL MeeTING
The shareholders of a stock corporation decide on the compa-ny’s important and fundamental matters. Shareholders are en-titled to vote if they are registered in the shareholders’ register of NORMA Group AG and provide NORMA Group AG or another location specified in the invitation with written notice, in German or English, at least six days before the Annual General Meeting that they will be attending. Each share entitles the bearer to one vote. The shareholders exercise their voting rights at the Annual General Meeting, which takes place at least once every year.
NORMA Group AG publishes the invitation and all documents made available at the Annual General Meeting promptly on its website. Information regarding the number of attendees and the voting results are published there following the Annual General Meeting.
7. ShARehOLDINGS OF The MANAGeMeNT BOARD
AND SuPeRvISORy BOARD
On 31 December 2012, the Management Board and Supervi-sory Board together held 2.8% of the shares of NORMA Group AG, whereby 2.5% can be attributed to members of the Manage-ment Board and 0.3% to members of the Supervisory Board.
The members of the Supervisory Board and Management Board acquired most of these shares prior to the initial public offering, because they held interest in the former NORMA Group GmbH, which was transformed into NORMA Group AG prior to the initial public offering in 2011. These acquisitions were not required to be disclosed as directors’ dealings.
8. DIReCTORS’ DeALINGS
According to section 15a of the German Securities Trading Act (Wertpapierhandelsgesetz, WpHG), members of the Manage-ment Board and the Supervisory Board and related parties are obliged to disclose directors’ dealings in NORMA Group AG shares if the value of these transactions reaches EUR 5,000 within a calendar year.
The following transaction was reported in connection with Direc-tors’ Dealings in 2012:

43
NORMA Group on the Stock Market
Management Board Letter Consolidated Management Report Consolidated Financial Statements Further InformationTo Our Shareholders
Corporate Governance Bericht
9. STOCK OPTION PLANS AND eQuITy-BASeD
INCeNTIve PROGRAMMeS
Please see the remuneration report for information about the contracts of the members of the Management Board.
In financial year 2012, there were no employee participation pro-grammes based on the Company’s share price.
10. SeATS ON The MANAGeMeNT BOARDS AND SuPeR-
vISORy BOARD COMMITTeeS OF OTheR LISTeD
COMPANIeS
In financial year 2012, the members of NORMA Group’s Super-visory Board sat on the supervisory boards or comparable su-pervisory committees of other companies:
Buyer/seller
Type of
transaction
Date of
transaction
Price per
share in EUR
Number
of shares
Total
value in EUR
Lars M. Berg Sale 26.11.2012 19.673 3,000 59,019.00
Supervisory Board member
Seats on other Supervisory Boards
Dr. Stefan Wolf Member of the Supervisory Board of Fielmann AG,Hamburg, GermanyMember of the Board of Directors of Micronas Semiconductor Holding AG, Zurich, Switzerland
Dr. Ulf von Haacke (until 14 September 2012)
No seats on other supervisory boards
Lars M. Berg Chairman of the Supervisory Board of Net Insight AB, Stockholm, SwedenChairman of the Supervisory Board of KPN OnePhone Holding B.V., Düsseldorf, GermanyMember of the Supervisory Board of Ratos AB, Stockholm, SwedenMember of the Supervisory Board of Tele2 AB, Stockholm, Sweden
Günter Hauptmann Member of the Supervisory Board of Geka GmbH, Bechhofen, Germany
Knut J. Michelberger Chairman of the Advisory Board of Dematic GmbH, Offenbach, Germany
Dr. Christoph Schug Member of the Supervisory Board of Tom Tailor Holding AG, Hamburg, GermanyMember of the Supervisory Board of Baden-Baden Cosmetics AG, Baden-Baden, Germany


We supply a large number of customer industries through our Distribution Services division. For instance, we support our sales partners in the area of infrastructure by offering a broad product line including solutions in the area of water and wastewater technology.Jennifer Langlois, Product Development Manager Distribution Services
Ernest Muratet, Vice President EMEA Distribution Services
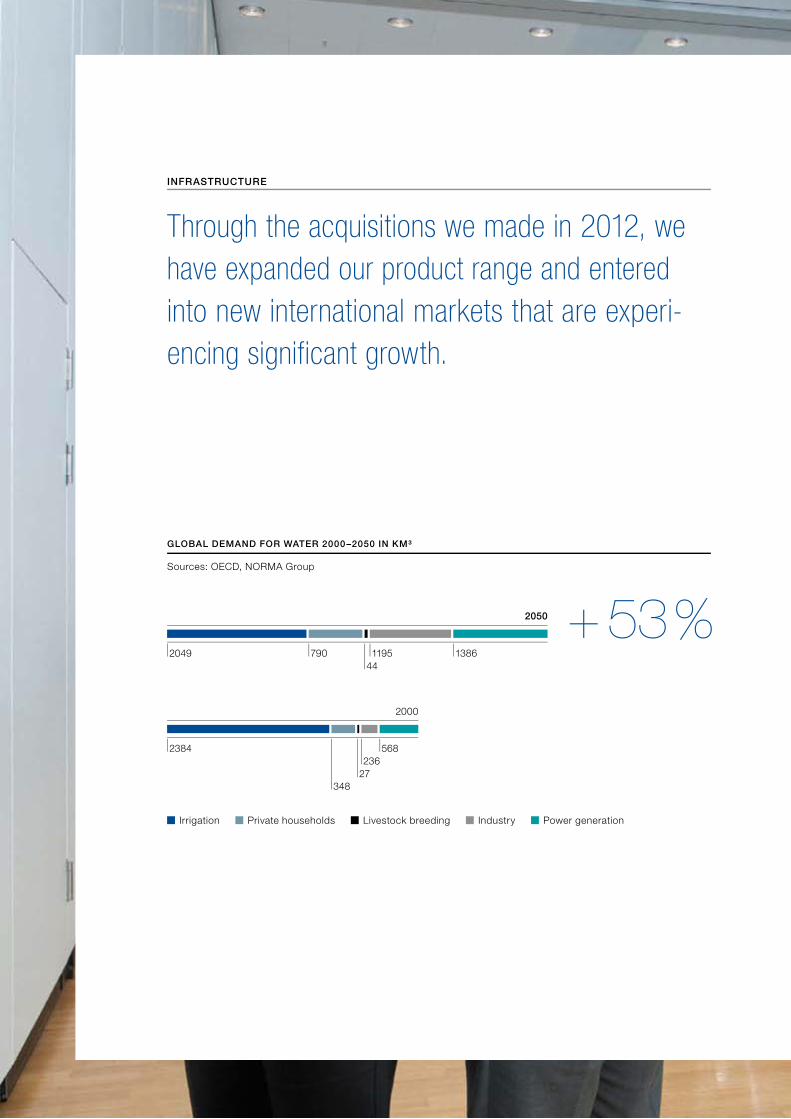
INFRASTRUCTURE
Through the acquisitions we made in 2012, we have expanded our product range and entered into new international markets that are experi-encing significant growth.
Sources: OECD, NORMA Group
GLOBAL DEMAND FOR WATER 2000–2050 IN KM³
Irrigation Private households Livestock breeding Industry Power generation
+ 53 %2000
2049
2384
2050
790
348
44
27
1195
236
1386
568

NORMACONNeCT® Vario-Pipe

NORMA Group AG Annual Report 201248
Successful expansion of international activities in the Asia-Pacific region. 4 successful acquisitions. Sustainable dividend policy with dividend proposal of EUR 0.65.
Consolidated Management Report
50 Business and operating environment 50 Group structure and operations 54 Corporate strategy and management 56 Strategic financing measures
56 Overview of business development 56 Economic environment 58 Industry-specific environment 59 Significant events for business development 60 Actual business development compared to the forecast 61 General statement by the Management Board on the
course of business and economic situation
62 Financial performance, financial position and cash flows
62 Sales and earnings performance 64 Financial position and cash flows 67 Financial management
68 Segment reporting
70 Research & development
73 Employees
76 Production and supply chain management
78 Purchasing and supplier management
79 Sales and marketing
80 Sustainability 80 Corporate responsibility (CR) 81 Occupational health and safety 81 Group-wide Environmental Management System
49
82 Risk and opportunity report 82 Risk management system 84 Risks 88 Opportunities 90 Assessment of the overall risk profile 90 Internal control and risk management system and their
relation to the Group accounting process
91 Forecast 91 General economic conditions 93 NORMA Group’s focus 93 Future development of NORMA Group 95 General statement by the Management Board on
anticipated development
96 Other legally required disclosures 96 Additional information required under the German
Takeover Directive Implementation Act (Übernahmerich-tlinie-Umsetzungsgesetz, ÜbernRLUG)
97 Remuneration report for the Management and Super-visory Boards
99 Report on transactions with related parties
99 Supplementary report
Further InformationConsolidated Financial StatementsConsolidated Management ReportManagement Board Letter To Our Shareholders
50 NORMA Group AG Annual Report 2012
Consolidated Management Report
Sales growth of 4.0 % in face of difficult economic environment
Good cash flows result in stable net debt despite acquisitions and dividend payment
Successful acquisitions in Europe and Asia-Pacific
Sustained expansion of international business
Business and operating environment
GROuP StRuCtuRE ANd OPERAtiONS
Leading global full-service provider to attractive high-tech niche markets We are an international market and technology leader in the at-tractive niche markets for advanced engineered joining technol-ogy. We manufacture and market more than 30,000 high-quali-ty and often mission-critical joining products and solutions to over 10,000 customers all over the world in the three product categories clamps (CLAMP), joining elements (CONNECT) and fluid systems/connectors (FLUID).
NORMA Group is respected in the marketplace for its many years of expertise, customer-specific system solutions and global avail-ability of products and reliable quality and delivery. This combina-tion provides the basis for high customer satisfaction and forms the foundation of our continued business success. Our products and solutions account for only a small share of the costs and prices of our customers’ end products, yet are often mission-critical to how they function with respect to the quality, perfor-mance and operational reliability of the final product. They there-fore offer important added value for our customers. Global megatrends such as the reduction of emissions, leakages, weight and size and increased modularization of manufacturing processes continue to present challenges to OEM companies when it comes to developing new products. Here, we support our customers proactively by offering our own broad range of established brand products as well as innovative customized joining products and solutions. Together we contribute to more environmentally friendly, sustainable and efficient usage of our natural resources.
Legal structure of the Group
NORMA Group was formed in 2006 as a result of the merger of the German Rasmussen Group and the Swedish ABA Group. In 2011, NORMA Group took on the legal structure of a stock cor-poration under German law based in Maintal. This entity holds shares either directly or indirectly in the 42 companies that be-long to NORMA Group. In 2012 we acquired Connectors Verbindungstechnik AG, Nordic Metalblok S.r.l., a 85 % stake in Chien Jin Plastic Sdn. Bhd., and 60 % of Groen Bevestigingsma-terialen B.V. All of these companies are consolidated in the Group financial statement. We do no longer consolidate SCI Seran and Jiangyin NORMA Automotive Products Co.
Over the course of 2012, we modified the Group structure of our international business by integrating all of the holding companies in the Asia-Pacific region except for the Chinese company into the APAC Holding in Singapore. We intend to do the same thing with our holdings in America. The legal structure of the Group would then mainly correspond to regional segment reporting. To simplify the structure of the Group, we are also considering merging NORMA Beteiligungs GmbH with NORMA Group Hold-ing GmbH.
The Management Board plans to propose that NORMA Group AG be transformed into the legal form of a European company (Societas Europaea, “SE”) at the Annual General Meeting. The transformation into an SE represents a consistent follow-up step and embodies European values in a corporate sense and, at the same time, underscores the international direction of NORMA Group. The transformation of a stock corporation into an SE rep-

51Further InformationConsolidated Financial StatementsConsolidated Management ReportManagement Board Letter To Our Shareholders
Business and operating environment
resents a change in legal form that essentially has no effect on the legal identity of the company and its admission to listing on the stock exchange. The legal position of the shareholders in the SE remains unchanged in all major respects. The SE regime provides for slight differences in some aspects compared to a German stock corporation. For example, the length of time re-quired to hold the stock before requesting that an annual share-holders’ meeting be convened or that additional items be placed on the agenda does not apply in an SE. In order to prepare the general meeting that is to decide on the transformation in an SE,a detailed transformation report is being drafted in which, among other things, the legal position of the shareholders in the stock corporation and the SE is compared and discussed in detail. Even though the transformation would allow for a different struc-ture, we intend to retain the two-tier structure consisting of Man-agement Board and Supervisory Board.
Management and control
NORMA Group AG has a dual management system consisting of a Management Board and a Supervisory Board as required by the German Stock Corporation Act (AktG). The Management Board composed of four members served for the entire financial year 2012. There was one personal change on the Supervisory Board, however. Dr. Ulf von Haacke resigned from this office on 14 September 2012. His successor, Erika Schulte, took office on 18 February 2013.
Active strategic management holding with a decentralised structure in direct proximity to its local customers NORMA Group AG, the parent company of NORMA Group, serves as the formal legal holding of the Group. As the company that manages the Group, NORMA Group AG is responsible for defining the corporate strategy and overriding strategic control
ALLOCATION OF RESPONSIBILITIES WITHIN THE MANAGEMENTBOARD
Werner Deggim Chairman Compliance Personnel Legal & M&A Group development Public relations Internal audit Corporate responsibility / sustainability
Dr. Othmar Belker CFO Finance & controlling Investor relations Treasury IT
Bernd Kleinhens Business development Sales Product development Marketing
John Stephenson COO Production Purchasing Supply chain management Global Excellence Programme Quality management
Parent company under company law
Segments
Way to market
NORMA Group AG
EMEA
Engineered Joining Technology (EJT)
Distribution Services (DS)
Americas Asia-Pacific
CORPORATE STRUCTURE

NORMA Group AG Annual Report 201252
as well as communications with the company’s important target audiences, in particular the stock market and its shareholders. The operational companies are managed by their own manage-ment teams, which, at the same time, are part of the extended Group management team and are evaluated on the basis of agreed targets. Specific goals are defined at the Group, region-al and operational level and reviewed on a regular basis. Func-tional Group management departments like Group Accounting, IT, Internal Audit or Treasury have been assigned to the subsid-iary NORMA Group Holding GmbH.
Operational segmentation by regionTo execute our successful growth strategy, our Group business is displayed in the three regional segments EMEA (Europe, Mid-dle East, Africa), Americas and Asia-Pacific. Our vision focuses, among other things, on achieving regional growth targets. Re-gional and local focuses are defined in the area of distribution services. All three regions have networked regional and cross-company organisations that carry out various functions. For this reason, our management’s internal Group reporting and control system is organised strictly by region.
Remuneration of the Management Board and Supervisory Board Remuneration of the Management Board includes both fixed and variable components. The main features of the remuneration system for the Management Board and Supervisory Board are outlined in the Remuneration report on pages 97 to 99 of the Management Report.
Statement on Corporate GovernanceThe statement on Corporate Governance that is to be issued in accordance with § 289a of the German Commercial Code (HGB)is found on pages 38 to 43 of the Corporate Governance report and is also part of the Management Report. It contains infor-mation on how the Management Board and Supervisory Board operate, the declaration of conformity pursuant to § 161 AktG and information on the main corporate policies.
important products, services, business processes and sales markets
we produce added value with our experience, technological expertise and power of innovation Our clamp products and solutions are manufactured from unal-loyed steels or stainless steel and are generally used to join or seal elastomer hoses. The connection products include connec-tors made of unalloyed steels or stainless steel that are partly equipped with elastomer or metal seals and used as the joining and sealing elements of metal and thermoplastic pipes. Our fluid products are either single or multiple layer thermoplastic
plug-in connectors for liquid systems that reduce installation times, ensure reliable flow of liquids or gases and occasionally replace conventional products like elastomer hoses. Our prod-ucts are often mission-critical because the quality of the end product depends on our solutions’ abilities to perform properly. The intellectual property portfolio of more than 800 patents and utility patents in nearly 200 patent families underscores our high power of innovation and protects our leading technological posi-tion in the global marketplace.
As a strategic development partner for our industrial customers, we provide customised solutions that match their application requirements. In the process, we rely on our technological ex-pertise and profound understanding of customer requirements. Furthermore, we offer an integrated service network with joining products and product solutions for many different areas of ap-plication. This equipment is used in farming, engines, commer-cial vehicles and passenger cars, the aviation industry and con-struction machines as well as household appliances, irrigation plants, the drinking water supply, pharmaceuticals and biotech-nology. With our 19 production sites and additional sales and distribution centres in Europe, North, Central and South America and the Asia-Pacific region, we maintain a global presence in 100 countries.
two sales channels for meeting the diverse needs of our customers as effectively as possibleWhen it comes to supplying our customers, we employ a variety of different sales strategies quite successfully: Engineered Join-ing Technology (EJT) and Distribution Services (DS). This ap-proach that gives us a much better understanding of the various needs of the market enables us to stand out from our manufac-turing competitors.
In the area of EJT, we provide industrial OEM customers with individually developed, customised products and solutions de-signed to meet their specific application requirements. Once our engineered joining solutions have been installed in a customer’s product, they normally remain part of the final design of that product. Our products and solutions can be used in many differ-ent areas of application, including emission controls, cooling systems, air intake and induction, assistive systems and infra-structure. This area accounts for approximately two-thirds of NORMA Group’s sales.
In the area of DS, we market a broad range of high-quality, stan-dardised brand products for a broad spectrum of applications via our own sales network as well as sales representatives, retail-ers and importers. Our customers are distributors, specialised wholesalers, OEM customers in the aftermarket segment and do-it-yourself stores. Our DS marketing strategy benefits not only from our broad geographical presence, but also our well-known
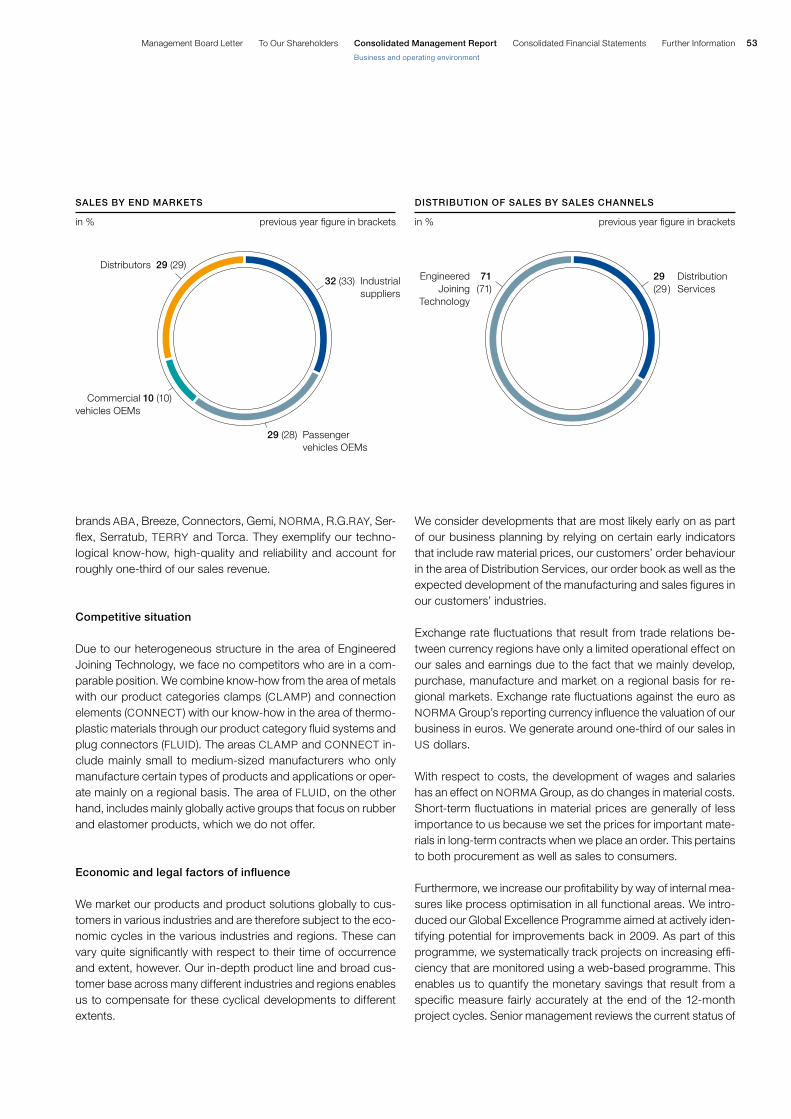
53Further InformationConsolidated Financial StatementsConsolidated Management ReportManagement Board Letter To Our Shareholders
Business and operating environment
brands ABA, Breeze, Connectors, Gemi, NORMA, R.G.RAY, Ser-flex, Serratub, TERRY and Torca. They exemplify our techno-logical know-how, high-quality and reliability and account for roughly one-third of our sales revenue.
Competitive situation
Due to our heterogeneous structure in the area of Engineered Joining Technology, we face no competitors who are in a com-parable position. We combine know-how from the area of metals with our product categories clamps (CLAMP) and connection elements (CONNECT) with our know-how in the area of thermo-plastic materials through our product category fluid systems and plug connectors (FLUID). The areas CLAMP and CONNECT in-clude mainly small to medium-sized manufacturers who only manufacture certain types of products and applications or oper-ate mainly on a regional basis. The area of FLUID, on the other hand, includes mainly globally active groups that focus on rubber and elastomer products, which we do not offer.
Economic and legal factors of influence
We market our products and product solutions globally to cus-tomers in various industries and are therefore subject to the eco-nomic cycles in the various industries and regions. These can vary quite significantly with respect to their time of occurrence and extent, however. Our in-depth product line and broad cus-tomer base across many different industries and regions enables us to compensate for these cyclical developments to different extents.
We consider developments that are most likely early on as part of our business planning by relying on certain early indicators that include raw material prices, our customers’ order behaviour in the area of Distribution Services, our order book as well as the expected development of the manufacturing and sales figures in our customers’ industries.
Exchange rate fluctuations that result from trade relations be-tween currency regions have only a limited operational effect on our sales and earnings due to the fact that we mainly develop, purchase, manufacture and market on a regional basis for re-gional markets. Exchange rate fluctuations against the euro as NORMA Group’s reporting currency influence the valuation of our business in euros. We generate around one-third of our sales in US dollars.
With respect to costs, the development of wages and salaries has an effect on NORMA Group, as do changes in material costs. Short-term fluctuations in material prices are generally of less importance to us because we set the prices for important mate-rials in long-term contracts when we place an order. This pertains to both procurement as well as sales to consumers.
Furthermore, we increase our profitability by way of internal mea-sures like process optimisation in all functional areas. We intro-duced our Global Excellence Programme aimed at actively iden-tifying potential for improvements back in 2009. As part of this programme, we systematically track projects on increasing effi-ciency that are monitored using a web-based programme. This enables us to quantify the monetary savings that result from a specific measure fairly accurately at the end of the 12-month project cycles. Senior management reviews the current status of
Engineered Joining
Technology
71 (71)
29 (29 )
Distribution Services
diStRiButiON OF SALES By SALES ChANNELS
in % previous year figure in brackets
Distributors
Commercial vehicles OEMs
29 (29)
10 (10)
32 (33) Industrial suppliers
29 (28) Passenger vehicles OEMs
SALES By ENd MARkEtS
in % previous year figure in brackets
NORMA Group AG Annual Report 201254
all projects once a month and a steering committee does so once a quarter. Our goal is to ensure that we offset or even lower any inflationary increases in costs with the help of this programme.
Because we are globally active, different legal and tax-related policies often play a role and must be taken into consideration with our business operations. Among others, these include prod-uct safety and product liability laws, construction, environmental and employment-related regulations as well as foreign trade and patent laws. To the extent that these pose a risk to our business, they are presented in the Risk report on pages 82 to 91.
The growing degrees of regulation in the area of environmental law affect our product strategy quite significantly and generate additional demand. For example, more stringent regulations on emissions and the introduction of new emission standards mean that the motor vehicle industry is in need of new solutions for building engines that meet these requirements.
CORPORAtE StRAtEGy ANd MANAGEMENt
Our strategic goal is to sustainably extend our business activities in Germany and abroad to achieve growth in sales that is higher than the market average. Furthermore, we also focus closely on high profitability and stable cash flows. Compared to the previ-ous year, there were no significant changes in our objectives and strategies.
The core of our Group strategy is broad diversification with re-spect to products, regions and end markets. On the one hand, this strengthens the stability of our business operations and, on the other, puts us in a position to be able to capitalise on attrac-tive growth potentials out of the many relevant growth trends with our customers and their end products.
Megatrends permanently support greater use of our high-quality joining products and system solutions Customer demands in the respective markets for engineered joining technology are constantly changing. This is driven by technological megatrends on the one hand, for instance higher engine efficiency as a reaction to more stringent emission regu-lations, weight reduction and modularisation of production pro-cesses. On the other hand, global megatrends such as increased environmental consciousness, rising fuel costs and growing cost pressure for manufacturers also play a key role. For this reason, we expect to see demand for engineered joining technologies in the end products of our customers increase more quickly than our customers’ end markets themselves. After all, both the num-ber and the value of engineered joining elements in an end prod-uct continue to increase. Supported by external market studies,
we expect the use of engineered joining technology in vehicles, construction machines and engines, for instance, to increase by 3 % to 15 % annually from 2010 through 2015 depending on the core industry and technical application. We intend to capitalise on these growth opportunities by focusing on innovative solu-tions for mission-critical connections that add value and thus assist our customers in lowering emissions, leakages, weight, space and installation time.
unique position and synergies thanks to unrivalled, customer-oriented sales strategy We distinguish ourselves from our manufacturing competitors through our two separate ways to the market: Engineered Join-ing Technology (EJT) and Distribution Services (DS). Both are designed to meet the unique needs of the respective customers. Thanks to this special combination of comprehensive expertise and skills in developing customised solution approaches for in-dustrial customers (EJT) and offering high-quality standard brand products and solutions via global sales (DS), we benefit from various synergies. These include significant economies of scale in manufacturing, unique close proximity to international EJT customers and the transfer of know-how from the area of EJT to high-quality, standardised products in the DS area. This approach allows us to consistently strengthen the diversification and stability of our business.
Our parameters for success are global presence, size, power of innovation and strong brandsOur goal is to extend our presence in existing markets and de-velop new emerging markets that offer attractive growth poten-tial. We intend to offer our existing customers solutions for these types of applications that do not yet include our joining solutions, for example by replacing alternative solutions due to higher prod-uct performance capabilities or quality. By doing so, we will in-crease the number of products used per customer end product and encourage the implementation of our existing products. We see growth opportunities in emerging countries that result from the increase in industrial manufacturing and the rising demand for mature joining technology. In the process, we leverage the manufacturing and sales presence that we have established in these markets in recent years. Our main focus in emerging coun-tries is on Brazil, Russia, India and China, among others. Our activities in recent years will enable us to further strengthen our sites in Asia and South America in the short to medium term.
We address attractive markets with respect to margins, sophis-ticated markets with respect to products and fragmented niche markets with fast-growing sales with respect to competition. Areas of application for EJT joining solutions include emission controls, cooling systems, air intake and induction, assistive sys-tems and infrastructure, for example. The relevant end markets cover the spectrum of agricultural machines to the aviation in-
55Further InformationConsolidated Financial StatementsConsolidated Management ReportManagement Board Letter To Our Shareholders
Business and operating environment
dustry, commercial vehicles, construction machines and en-gines, but also water management, passenger cars and rail ve-hicles. By identifying additional end markets that offer high growth potential and are related to the end markets of relevance to us that we currently serve, we will generate further growth possibilities. Our entry into the drainage end market is but one example of successful knowledge transfer in which we adapted existing joining products to meet the demands of new areas of application and efficiently introduced high-performance prod-ucts to the market. Through this type of expansion, we achieve further diversification and thus strengthen our defensive earnings profile with respect to end market presence. In the EJT area, we have achieved a market share that is significantly higher than that of our next largest competitor. This enables us to provide our customers all over the world with customised, high-quality prod-ucts and system solutions. Furthermore, we will continue to strengthen our power of innovation and rely on research and development (R &D). Each year, we intend to invest around 4 % of EJT’s sales to R&D activities.
In the DS sales channel, we have a number of strong, well-known brands. Here, we intend to strengthen and extend the respective success parameters. DS customers are industrial companies (OEM and Aftermarket), maintenance and repair companies, but also sales companies, expert wholesalers and do-it-yourself stores. Our goal is to achieve a global presence by systemati-cally expanding our sales network, increasing the earnings share with our existing customers and gaining new customers. We intend to expand our DS network in those regions in which we currently have a strong market position. Furthermore, we plan to continue our expansion in regions in which we see strong poten-tial for future growth, such as Brazil, Russia or Southeast Asia. Moreover, we plan to extend our offerings to cover additional groups of customers and end markets. These include, for in-stance, the construction industry, the exhaust gas system after-market segment, the area of infrastructure or the biotechnology and pharmaceutical industries.
Successful organic growth and selective acquisitions that create added value We pursue a strategy of organic growth and strategic acquisi-tions. To strengthen our organic growth, we rely on constantly expanding application solutions with existing EJT customers, identifying and signing up new EJT customers, extending and deepening our customer base in the area of Distribution Service and entering into new end markets for engineered joining tech-nology that create added value, such as the drainage market.
Select acquisitions that complement our internal growth are also a permanent component of our long-term growth strategy. We observe the market for advanced joining technology very close-ly. We set strict criteria in identifying and evaluating acquisition
possibilities. We have a solid balance sheet with respect to the acquisition and integration of companies that create added val-ue. Future acquisitions will continue to strengthen the regional presence of the Group, complement its product portfolio, im-prove access to customers and allow for synergies to be realised. We are well-positioned to benefit from the fragmentation of the market and be a leader in its consolidation.
we constantly improve our production processes and cost structures We support and control our strategic goals of achieving high profitability and strengthening our cash flow through various measures. These include cost discipline, continuous improve-ment of processes in all functions and regions and successful supply chain management. We already completed comprehen-sive optimisation of our manufacturing structure in 2010. As part of our optimisation efforts, we bundle high-volume automated and essentially standardised production processes on specific high-tech manufacturing lines. This allows us to take advantage of considerable economies of scale. We have set up production processes that require a higher degree of manual assembly work mainly in low-wage countries. Furthermore, we have continually been able to generate significant cost savings with our “Global Excellence Programme” that we introduced in 2009. The im-provement initiatives we identified and introduced as part of this programme will enable us to realise even greater cost advan-tages by maximising flexibility in the future.
Continuous monitoring of specific financial and non-financial control parameters When it comes to managing NORMA Group, our Group manage-ment bases its decisions mainly on financial control parameters. These are essentially sales, EBITDA and EBITA parameters, op-erating net cash flow and capital commitment to investments and working capital (inventories and trade receivables less trade pay-ables), liquidity, capital structure and risks that result from inter-est, currencies and material costs.
Achieving high profitability is one of the main target and measure-ment parameters for our Group management. EBITDA and EBI-
TA serve as parameters here. We calculate a target EBITDA margin and a target EBITA margin on the basis of our historical performance and the planning of our divisions as the weighted average of the divisions and adjust the amortisation effects from the purchase price allocation of acquired companies. In 2012, our target EBITA margin was at the level of previous years of 17.4 % or 17.7 %. We reached this goal by achieving 17.4 %.
Operating net cash flow is yet another target figure. By focusing on this value, we ensure that the financial solidity of the Group is also maintained in the future. Our operating net cash flow is significantly affected by our EBITDA, changes in working capital

NORMA Group AG Annual Report 201256
and investments at the operational level. We seek to achieve a clearly positive value on average here. Each year, this mainly depends on the financial performance and investments planned. The goal for 2012 was to achieve a positive operating net cash flow that was at least as high as the previous year’s level (EUR 66.8 million). Thanks to our strong EBITDA, this value came in at EUR 81.0 million and thus above plan in 2012.
All financial control values are planned and continuously moni-tored at the Group, regional and Group company levels. We measure deviations between forecast targets and what we actu-ally achieve on a monthly basis inside all local companies. Key figures are analysed on a monthly and quarterly basis. At the same time, we evaluate our detailed business plans and make projections on specific business developments that perhaps in-clude various scenarios on the basis of existing monthly and quarterly results.
Non-financial control parameters include market penetration, power of innovation, the progress being made on productivity, problem-solving behaviour and our sustainable overall develop-ment. You will find more detailed information on non-financial performance indicators on pages 70 to 82.
StRAtEGiC FiNANCiNG MEASuRES
We have improved our ability to take action for the benefit of the further continued strategic development of NORMA Group by working closely with our banks. Our existing medium-term re-volving credit facility is still EUR 125 million. As to the allocation of resources the annual limit to acquisitions has been eliminated and the total acquisition limit has been extended to EUR 200 million during the term of our loan. Furthermore, we have reached an agreement on extending the available financing instruments.
This means we are now in a position to borrow funds through an external foreign capital market in excess of our existing loan con-tracts of up to EUR 125 million. In addition, the collateral guaran-tees we had given for our existing loan have been fully released due to the continued positive development of our company. The Group’s financing contracts still include normal credit line condi-tions (financial covenants). For further information, please refer to the section entitled “Financial management” on pages 67 to 68.
Overview of business development
ECONOMiC ENviRONMENt
the global economy ground to a halt in 2012 as a result of the sovereign debt crisis. Also in 2012, the global economy was impacted by the Euro-pean sovereign debt crisis and uncertainties in financial markets as well as by high commodity prices. The International Monetary Fund (IMF) calculated another weakening of global economic growth to 3.2 % for 2012. In previous years, global economic output still rose by 3.9 % (2011) and 5.1 % (2010).
The beginning of 2012 was still characterised by a strong eco-nomic recovery. However, the economic climate and important early indicators worsened over the course of the year. The mood at companies and in many regions as well as the mood of con-sumers deteriorated so that the economy lost momentum early in the year. The real economy even came to a standstill starting in late summer. According to the IMF, global trade growth for the full year fell from 5.9 % in the previous year to 2.8 %. Major export countries were hit particularly hard by this. Economic growth also
OPERAtiNG NEt CASh FLOw
in EUR million
2012
2011
2010
EBITDA* 120.8 117.0 99.2
Change in working capital – 9.8 – 19.5 – 26.4
Investments from operational business – 30.0 – 30.7 – 21.1
Operating net cash flow * 81.0 66.8 51.7
* in 2010 and 2011 mainly adjusted for IPO costs

57Further InformationConsolidated Financial StatementsConsolidated Management ReportManagement Board Letter To Our Shareholders
Business and operating environment
Overview of business development
weakened noticeably in Germany at the end of 2012. Dynamic developing and emerging economies recorded an increase in real gross domestic product (GDP) of only 5.1 % after 6.3 % in the previous year. In established economies, GDP growth de-creased from 1.6 % in the previous year to 1.3 %.
China may have recorded the strongest growth (7.8 %) among the major economic regions, but the pace of expansion fell con-siderably short of its momentum in recent years. In prior years, growth in China was as least 9 %, sometimes even in the double-digits. The economy also stalled in India with GDP growth of merely 4.5 % after 7.9 % in the previous year. Japan’s economy may have recovered from the prior year’s tsunami and nuclear catastrophes, growing at a rate of 2.0 % for the full year, but economic output fell noticeably at the beginning of the second half of the year. Growth in the USA accelerated slightly to a mod-erate 2.3 % in 2012 (previous year: 1.8 %), supported by a robust domestic economy and the improvement in the domestic hous-ing market. The situation in particular in Western Europe deterio-rated with the significant economic collapses in Southern Eu-rope. The eurozone as a whole slid into recession in 2012, whereby development in individual countries diverged even more sharply.
weak economic growth in Europe – eurozone in recessionEurostat, the statistical office of the European Union, put the decrease in economic output in 2012 for the 27 countries of the EU at real 0.3 % after an increase of 1.5 % in the previous year. The United Kingdom was caught up in the weak development of continental Europe and the global economy and its economy stagnated (0.0 % after 0.9 %). The large economies of Italy (-2.3 % after +0.4 %) and Spain (-1.4 % after +0.4 %) slid into recession. The economy in the Netherlands (-0.3 % after +1.0 %) and Bel-gium (-0.2 % after +1.8 %) also shrank. The economic weakness in Portugal (-3.0 % after -1.6 %) and Greece (-6.0 % after -7.1 %)
continued. Growth in France was barely above stagnation at 0.2 % after 1.7 % in the previous year. In the eurozone, the neces-sary measures to reduce sovereign debt and the deteriorating economic climate resulted in reluctant investors and increasing unemployment. As at the end of 2012, Germany also recorded a noticeable weakening; GDP growth slowed from 3.0 % in the previous year to only 0.7 %. Thus, the eurozone slid as a whole into recession in 2012. According to estimates by Eurostat, eco-nomic output in the eurozone fell by 0.5 % in 2012.
Europe’s poor economic state is also reflected in declining indus-trial production. Industrial production (excluding the construction industry) decreased in each month from December of the prior year up to and including November 2012, both at the level of the European Union (EU 27) as well as in the eurozone (EU 17) com-pared to the previous year. Industrial production for the full year decreased by more than 2 % (EU 27: -2.1 %; eurozone: -2.4 %). The trend was clearly downward also for Germany starting in July after fluctuating up and down in the first half of the year. German industry recorded in part significant production setbacks in Oc-tober (-3.2 %), November (-3.3 %) and December (-0.7 %). The utilisation of capacities in the eurozone dropped accordingly to 77.2 % at the end of 2012 (previous year: 79.9 %) and in Ger-many 81.0 % (previous year: 85.3 %).
Germany’s growth initially insusceptible, with a sharp downturn at the end of the yearConsidering its strong domestic economy supported by private consumer spending and investments in residential construction, and thanks initially to higher exports to countries outside the European Union, the German economy was able to avoid the maelstrom of the economic downturn for a comparatively long time. Nevertheless, following a robust start to the year (Q1: GDP +1.7 %), important early indicators worsened successively along with companies’ incoming orders and their expectations; exports
GdP GROwth RAtES
in %
2012
2011
2010
World + 3.2 + 3.9 + 5.1
USA + 2.3 + 1.8 + 2.4
China + 7.8 + 9.3 + 10.4
Eurozone – 0.5 + 1.4 + 2.0
Germany + 0.7 + 3.0 + 4.2
Sources: OECD, IMF, Eurostat
NORMA Group AG Annual Report 201258
also gradually lost momentum. Investments in machinery and equipment were scaled back. Thus, the effects of the slowdown were already apparent in the second (+0.5 %) and third quarter (+0.4 %). Economic output even fell in the final quarter of 2012 as a result of the downturn in industrial production. Eurostat puts the decrease in GDP at 0.6 % quarter-on-quarter. With expected real growth of 0.7 %, the German economy grew noticeably slower in 2012 than in the previous year. The labour market re-mained strong in 2012, even though the positive development came to a standstill at the end of the year. According to calcula-tions by the German Bundesbank, 41.6 million individuals were gainfully employed and the unemployment rate remained at a low 6.9 % at the end of 2012.
iNduStRy-SPECiFiC ENviRONMENt
2012 a successful year for German engineering For the German engineering and plant construction industry, 2012 was successful and better than expected overall. The in-dustry completely recovered from the setbacks of the last finan-cial crisis, supported by high competitiveness and the excellent order situation. The industry association VDMA estimates that the previous record level of 2008 was reestablished in 2012 with real growth of 2 % to a production value of EUR 196 billion. With an expected EUR 209 billion, sales in 2012 reached a new his-torical peak value. The German engineering and plant construc-tion industry was also caught in the deterioration of the global economy over the course of the year. After starting off the year dynamically, the industry recorded a downward trend in growth rates, even negative rates in some cases. The strongest impuls-es for the industry’s growth in 2012 came once again from abroad. Exports increased in particular to Latin America (by Oc-tober 2012: 10.7 %), Southeast Asia (+21.4 %), USA (+20.1 %) and also in the EU as a whole (+7.5 %) In contrast, exports to Italy (-2.6 %), Spain (-2.8 %) and the largest importer China (-8.6 %) fell short of the previous year’s values.
A portion of the previous significant decline in orders – in par-ticular domestic orders – was recovered with a sharp rise in in-coming orders in autumn and in December 2012 (real +4 %; domestic +1 %; international +5 %). Incoming orders decreased by 3 % overall for the full year 2012 (domestic -8 %; international +0 %).
Global automotive industry on growth course – downturn in EuropeThe automotive industry remained on its growth course in 2012, despite the severe market slump in Western Europe, thanks to sustained strong demand in the USA and BRIC countries. The market research institute Polk calculated an 8.8 % increase world-
wide in new registrations for light vehicles (automobiles, light trucks) to 71.75 million vehicles. According to information pro-vided by the German industry association VDA, the number of new registrations in the USA (the largest single market with 14.4 million vehicles) rose by 13.4 %. The second-largest market, Chi-na, expanded by 8.4 % to 13.2 million vehicles. Brazil (+6.1 %), Russia (+10.6 %) and India (+10.3 %) also recorded significant in-creases in new registrations. Japan recovered from the prior year’s production standstills and reached 4.6 million vehicles (+29.7 %). German manufacturers continued their successful growth in foreign markets in 2012 and further increased their mar-ket shares, in particular in the USA, China and Russia.
The West German automobile market shrank for the third year in a row in 2012 – most recently with increasing momentum – under the influence of the sovereign debt crisis and the pronounced economic weakness in particular in Southern Europe. In particu-lar the high-volume manufacturers with a strong orientation on Southern Europe recorded double-digit decreases in sales. The European association ACEA puts the decrease in new automobile registrations in the EU for 2012 at 8.2 % (12.05 million vehicles). The sharpest losses in high-volume markets were suffered by Italy (-19.9 %), Spain (-13.4 %) and France (-13.9 %). In contrast, sales were strong in the United Kingdom, with an increase of 5.3 %. In Germany, new automobile registrations fell to 3.08 mil-lion vehicles (-2.9 %). German automobile manufacturers curbed production by 4 % to 5.39 million vehicles.
The European market for commercial vehicles collapsed in 2012, plunging 23.4 % in December alone. In total, new registrations of lorries and buses fell by 12.4 % in the EU to 1.70 million vehicles. In contrast to the United Kingdom (-5.7 %) and Germany (-7.0 %), the commercial vehicle markets in France, Italy and Spain even recorded double-digit declines. The market for lorries up to 3.5 tons was disproportionately weak (-13.3 %). The subsegment of heavy trucks (over 16 tons), dominated by German manufactur-ers, shrank by 9.4 %. Only new registrations of buses increased in the EU (+1.4 %).
Construction industry in Europe weak, in Germany robustIn 2012, the construction industry shrank for the fifth year in a row in Western Europe – in every single month year-on-year, ac-cording to information provided by Eurostat. The decrease in December was 4.8 % in the eurozone and 8.5 % in the European Union (EU 27). The United Kingdom, Portugal and the Nether-lands recorded double-digit losses, while Spain’s construction industry recovered slightly from October to December. In 2012, the construction industry decreased by 5.4 % in the eurozone and by 5.8 % in the European Union. Building construction fell by 6.2 % (EU -8.3) and civil engineering by 2.9 % (EU 11.2 %) with respect to the eurozone.
59Further InformationConsolidated Financial StatementsConsolidated Management ReportManagement Board Letter To Our Shareholders
Overview of business development
Although incoming orders for the German construction industry in November 2012 were at their lowest level in two years with a real decline of -8.3 % due to the reluctance to invest in the man-ufacturing industry, 2012 was a satisfactory year for the industry. Incoming orders grew by real 5.1 % (nominal +7.7 %) and sales by 1.6 % for the first eleven months, according to information provided by the Federal Statistical Office of Germany. The two largest construction associations, ZDB and HDB, estimate that construction revenues grew slightly by nominal 1 % to just under EUR 93 billion in 2012. The growth driver was residential con-struction with an increase of 5 % to EUR 32.5 billion. Commercial construction also continued to grow in 2012, despite the de-crease in production and investments on the part of the industry in the second half of the year (revenues +1.5 % to EUR 34.2 bil-lion). In contrast, public construction revenues fell by 4.5 % to EUR 26.4 billion.
SiGNiFiCANt EvENtS FOR BuSiNESS dEvELOPMENt
Acquisition of the Swiss pharmaceutical supplier Connectors verbindungstechnik AGWe acquired the Swiss company Connectors Verbindungstech-nik AG on 19 April 2012. The company specialises in connection systems for the pharmaceutical and biotechnology industries. It has produced and sold connection elements for over 25 years that correspond to the highest sterile technology standards in the medical area. The product range includes, among other things, clamps, valves, hoses and joining solutions for the trans-port of liquids and gases for medical applications. In addition, the company offers advisory and planning services for pharma-ceutical process plants. The acquisition of Connectors Verbind-ungstechnik AG provides us with access to customers in the pharmaceutical and biotech industries. We will further expand our product portfolio and global market positioning in joining technology with the company’s expertise. In financial year 2011, the company recorded sales of around EUR 14 million. Connec-tors Verbindungstechnik AG was included in the consolidated group of NORMA Group as at 19 April 2012 and accordingly already contributed to sales and earnings starting the second quarter of 2012.
Acquisition of the italian clamp manufacturer Nordic Metalblok S.r.l.On 12 July 2012, we acquired Nordic Metalblok S.r.l., based in Italy. The company has been active in the market for over 40 years and produces clamps for various applications, in particular for the heating, ventilation and air conditioning industry as well as for the agricultural and construction industry. In addition, it manufactures metal bands and the associated tools. Nordic Met-
alblok distributes its products to retailers and wholesalers as well as to manufacturing companies all over the world. We are ex-panding our global presence with this acquisition. The compa-ny’s expertise, in particular in heating, ventilation and air condi-tioning technology, is an ideal complement to our product portfolio. In financial year 2011, the company recorded sales of around EUR 6 million. It was included in the consolidated group of NORMA Group as at 12 July 2012.
Acquisition of the majority of interest in Chien Jin Plastic Sdn. Bhd.On 30 November 2012, we acquired an 85 % interest in the manufacturer of thermoplastic connectors Chien Jin Plastic Sdn. Bhd. in Malaysia and included the company in the consolidation group of NORMA Group. Furthermore, we have the right to ac-quire the remaining 15 % interest by 2015. The company has been active on the market for 20 years and produces joining elements for plastic and cast iron pipe systems that are used in various applications, in particular in drinking water and industrial water supply as well as in sprinkler systems. The company also manufactures components for sanitation products and distrib-utes its products under the “Fish” brand to over 200 distributors in approximately 30 countries worldwide. Chien Jin Plastic Sdn. Bhd. recorded sales of around EUR 7 million in financial year 2011. With this acquisition, we are expanding our product range in the area of infrastructure and also expanding our distribution network in the Asia-Pacific region.
increase in shareholding in dutch distributor Groen Bevestigingsmaterialen B.v.On 31 December 2012, we acquired an additional 60 % interest in Groen Bevestigingsmaterialen B.V. and consolidated it in NOR-
MA Group. ABA Group had already acquired 30 % of the Dutch distributor in 1999. Thus, we now hold a total of 90 % of the shares. Along with the increase in equity interest, we also ac-quired the call option to purchase the remaining 10 % within the next 5 years. Groen is family-operated and sells hose and pipe clamps as well as couplers to industrial companies, the agricul-tural and construction industry, sanitation manufacturers and hardware retailers in Belgium, the Netherlands and Luxembourg. In addition, it offers a comprehensive product portfolio of traffic sign clamps. It also offers tools for assembly and disassembly. Sales were around EUR 5 million in 2012, around 60 % of which were generated with NORMA Group products. We further ex-panded our distribution network in the Benelux countries by ac-quiring additional shares of this company. In addition, we are expanding our product portfolio to include traffic sign clamps. This provides us with access to new customers in this area.
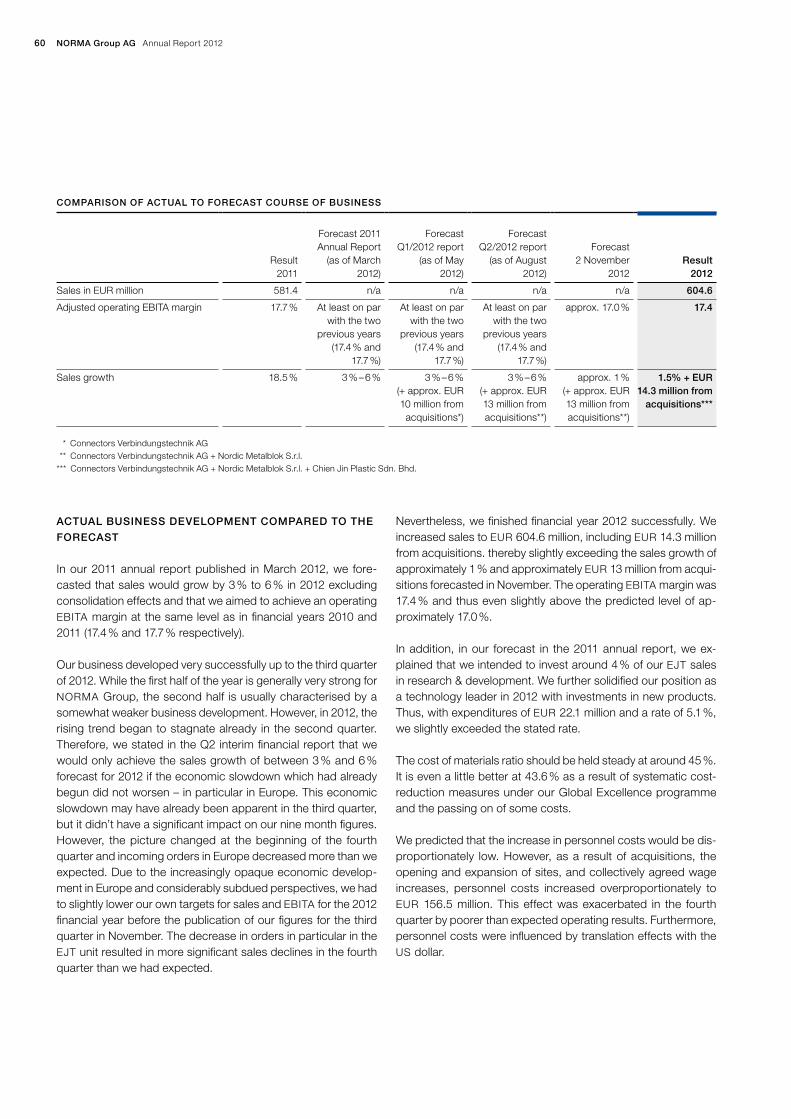
NORMA Group AG Annual Report 201260
ACtuAL BuSiNESS dEvELOPMENt COMPAREd tO thE
FORECASt
In our 2011 annual report published in March 2012, we fore-casted that sales would grow by 3 % to 6 % in 2012 excluding consolidation effects and that we aimed to achieve an operating EBITA margin at the same level as in financial years 2010 and 2011 (17.4 % and 17.7 % respectively).
Our business developed very successfully up to the third quarter of 2012. While the first half of the year is generally very strong for NORMA Group, the second half is usually characterised by a somewhat weaker business development. However, in 2012, the rising trend began to stagnate already in the second quarter. Therefore, we stated in the Q2 interim financial report that we would only achieve the sales growth of between 3 % and 6 % forecast for 2012 if the economic slowdown which had already begun did not worsen – in particular in Europe. This economic slowdown may have already been apparent in the third quarter, but it didn’t have a significant impact on our nine month figures. However, the picture changed at the beginning of the fourth quarter and incoming orders in Europe decreased more than we expected. Due to the increasingly opaque economic develop-ment in Europe and considerably subdued perspectives, we had to slightly lower our own targets for sales and EBITA for the 2012 financial year before the publication of our figures for the third quarter in November. The decrease in orders in particular in the EJT unit resulted in more significant sales declines in the fourth quarter than we had expected.
Nevertheless, we finished financial year 2012 successfully. We increased sales to EUR 604.6 million, including EUR 14.3 million from acquisitions. thereby slightly exceeding the sales growth of approximately 1 % and approximately EUR 13 million from acqui-sitions forecasted in November. The operating EBITA margin was 17.4 % and thus even slightly above the predicted level of ap-proximately 17.0 %.
In addition, in our forecast in the 2011 annual report, we ex-plained that we intended to invest around 4 % of our EJT sales in research & development. We further solidified our position as a technology leader in 2012 with investments in new products. Thus, with expenditures of EUR 22.1 million and a rate of 5.1 %, we slightly exceeded the stated rate.
The cost of materials ratio should be held steady at around 45 %. It is even a little better at 43.6 % as a result of systematic cost-reduction measures under our Global Excellence programme and the passing on of some costs.
We predicted that the increase in personnel costs would be dis-proportionately low. However, as a result of acquisitions, the opening and expansion of sites, and collectively agreed wage increases, personnel costs increased overproportionately to EUR 156.5 million. This effect was exacerbated in the fourth quarter by poorer than expected operating results. Furthermore, personnel costs were influenced by translation effects with the US dollar.
COMPARiSON OF ACtuAL tO FORECASt COuRSE OF BuSiNESS
Result 2011
Forecast 2011 Annual Report
(as of March 2012)
Forecast
Q1/2012 report (as of May
2012)
Forecast
Q2/2012 report (as of August
2012)
Forecast 2 November
2012
Result 2012
Sales in EUR million 581.4 n/a n/a n/a n/a 604.6
Adjusted operating EBITA margin 17.7 % At least on par with the two
previous years (17.4 % and
17.7 %)
At least on par with the two
previous years (17.4 % and
17.7 %)
At least on par with the two
previous years (17.4 % and
17.7 %)
approx. 17.0 % 17.4
Sales growth 18.5 % 3 % – 6 % 3 % – 6 % (+ approx. EUR 10 million from
acquisitions*)
3 % – 6 % (+ approx. EUR 13 million from acquisitions**)
approx. 1 % (+ approx. EUR 13 million from acquisitions**)
1.5% + EuR 14.3 million from
acquisitions***
* Connectors Verbindungstechnik AG ** Connectors Verbindungstechnik AG + Nordic Metalblok S.r.l.*** Connectors Verbindungstechnik AG + Nordic Metalblok S.r.l. + Chien Jin Plastic Sdn. Bhd.

61Further InformationConsolidated Financial StatementsConsolidated Management ReportManagement Board Letter To Our Shareholders
Overview of business development
Other operating expenses should stabilise. At EUR – 76.6 million, they are at the adjusted level of the 2011 financial year.
We expected a significant increase in net financial income of around EUR – 15 million excluding derivative measurement ad-justments. At EUR – 13.3 million, the result was considerably bet-ter than expected.
Adjusted earnings per share increased as planned. This was EUR 1.94 in financial year 2012 and thus up 1.0 % year-on-year. Pro-forma adjusted earnings per share increased by 7.3 % based on the same number of ordinary shares (31,862,400).
At 30.3 % of net income before tax, the tax rate was on the lower end of the target range of 30 % to 32 %.
We were aiming for an investment rate of 4.5 % of consolidated sales. This should finance both maintenance investments as well as investments for the purpose of expanding our business. Ad-justed for acquisitions, our investment rate was 5.0 % and thus slightly above the target value. Including acquisitions, the invest-ment rate was 9.6 %.
Operating net cash flow should be at least stable and at or above the adjusted level in 2011 of EUR 66.8 million. We significantly exceeded this amount with EUR 81.0 million.
We promised a sustainable dividend policy with a distribution rate of approximately 30 % to a maximum of 35 % of consoli-dated net profit for the financial year as long as the economic situation permitted. In the Annual General Meeting for financial year 2012, the Management Board and Supervisory Board will propose a dividend of EUR 0.65 per share. This corresponds to 33.5 % of the adjusted consolidated net profit.
GENERAL StAtEMENt By thE MANAGEMENt BOARd
ON thE COuRSE OF BuSiNESS ANd ECONOMiC
SituAtiON
Financial year 2012 was essentially in line with the Management Board’s expectations. Unfortunately, the positive trends at the beginning of the year did not continue up to the end of the year. Due to the economic slowdown in particular in Europe, we were not able to meet the targets we set at the beginning of 2012 and had to lower them slightly at the beginning of November. Weak demand in the European economy continued to a certain degree into 2013, albeit not to the same extent as at the end of 2012.
At EUR 604.6 million, including acquisitions, sales at the end of financial year 2012 were only slightly above our adjusted forecast from November 2012. Despite the difficult economic situation, we were able to increase EBITA and the EBITA margin of 17.4 % was at the lower limit of our original forecast from the beginning of 2012.
Development in the individual segments varied. While the EMEA region struggled with the economic conditions, the situation was considerably more positive in the Americas and the Asia-Pacific region.
Our investments were within the expected range. The number of employees increased significantly, among other things, as a re-sult of the acquisitions and our strong expansion in particular in the Asia-Pacific region. For this reason, personnel costs were also higher than planned. Research and development expenses were somewhat higher than we had forecasted.
Our net debt without derivative financial instruments as at 31 December 2012 decreased, despite the dividends paid for 2011 and the acquisitions.
Total assets increased due to the slight growth and acquisitions. We increased the equity ratio to 41.7 %, despite the dividends paid and the increase in total assets as a result of the good net profits.
Considering the economic situation, in particular in the fourth quarter of 2012, the Management Board is satisfied overall with the development of the business in 2012. We were not able to achieve all of the goals that we set for ourselves. However, we expanded and strengthened our market position with the four acquisitions and the further expansion of our capacities, in par-ticular in the Asia-Pacific region. The development of new prod-ucts helped to underpin our market leadership. The acquisition of Australian DavyDick & Co. Pty. Ltd. in January 2013 also con-tributes to further expanding our market position (also refer to our Supplementary Report on page 99).
The Management Board views NORMA Group’s economic posi-tion as stable and sustainable. This assessment is based on the results of the 2012 consolidated financial statements and sepa-rate financial statements and reflects the business development up to when the 2012 group management report was prepared. The business trend at the beginning of 2013 was in line with the Management Board’s expectations when this annual report was prepared.

NORMA Group AG Annual Report 201262
Financial performance, financial position and cash flows
SALES ANd EARNiNGS PERFORMANCE
Slowing growth momentum hardly had an effect on the order book The deteriorating economic situation in the second half of the year increased the reluctance of our customers to place orders. Nevertheless, the order book of EUR 215.4 million as at 31 De-cember 2012 was only slightly lower than at year-end 2011 of EUR 218.6 million.
Solid sales growth despite economic weakness in EuropeNevertheless, we finished financial year 2012 successfully with consolidated sales of EUR 604.6 million and thus a 4.0 % in-crease over the previous strong year’s consolidated sales of EUR 581.4 million. This increase can be attributed to the suc-cessfully integrated acquisitions (+2.5 %) and positive currency effects (+3.4 %) despite an organic decrease in sales of 1.9 %.
The companies acquired in 2012 contributed EUR 14.3 million overall to sales growth, although their individual contributions varied depending on when they were acquired. Connectors Verbindungstechnik was consolidated as at 19 April 2012, Nordic Metalblok as at 12 July 2012 and Chien Jin Plastic as at 1 De-cember 2012. The consolidation of Groen Bevestigingsmateri-alen B.V. at the end of financial year 2012 did not increase con-solidated sales.
OvERviEw OF thE ACquiREd CONtRiButiON tO SALES iN 2012
Company
Contribution to
sales in EUR million
Connectors Verbindungstechnik AG, Switzerland 11.5
Nordic Metalblok S.r.l., Italy 2.3
Chien Jin Plastic Sdn. Bhd., Malaysia* 0.5
Groen Bevestigingsmaterialen B.V., Netherlands** 0
total 14.3
* acquisition of 85% interest** increase in interest from 30% to 90%
We meet the demand in our business with our global network of production plants with highly-developed joining technology. Our manufacturing facilities are mostly located in the markets that they serve. Accordingly, costs are incurred in the same currency in which we realise our sales revenues. Currency effects, in par-ticular the correlating development of both the US dollar and the euro, had a positive impact on sales in 2012. Since we generate a large portion of our sales in the USA and the eurozone, an ap-preciation on the part of the US dollar is advantageous from a balance sheet perspective, since we report in euros and the profits generated in US dollars result in a higher computed euro value (translation effect). As a rule, the currency relationship also reflects the differences in regional economic momentum. The average exchange rate of the euro to the US dollar was 1.28 in 2012 and thus significantly lower than the previous year’s aver-age exchange rate of 1.39.
NORMA Group’s business development is subject to a certain seasonal fluctuation and is typically characterised by a strong first half of the year compared to the second half. The economic situation reinforced this trend in 2012. At EUR 159.7 million, the first quarter was the strongest, followed by a very good EUR 158.0 million in the second quarter. But we were not able to fully reach this high level of sales in the third quarter. In addition to the effect of holidays with fewer business days in the summer, the increas-ing uncertainty regarding the further economic development increased the reluctance of our customers to place orders. Sales amounted to EUR 149.6 million. With EUR 137.3 million, the fourth quarter was the weakest and, in addition to the seasonal business development, also clearly reflected the economic downturn.
different growth momentum in the two distribution channels EJt and dSWe generated total sales of EUR 427.6 million in the EJT unit. This represents an increase of 3.9 % over the previous year’s sales of EUR 411.5 million. Whilst the 8.7 % growth in two first quarters of 2012 was still highly satisfactory, the economic downturn in the second half of the year had a negative impact in various countries that resulted in a weaker order situation and led to a decrease in sales in the fourth quarter.
The DS unit developed satisfactorily as a result of the acquisitions. Sales increased from EUR 170.3 million in 2011 to EUR 174.5 million in the current financial year and therefore grew by 2.5 %, whereby Groen Bevestigingsmaterialen B.V. did not contribute to sales due to the timing of its consolidation. Adjusted for the acquisitions, DS sales were EUR 160.2 million and thus down 5.9 % year-on-year. The significantly deteriorated economic situ-ation was apparent in important customer industries in Europe, in particular in engineering and the construction industry.
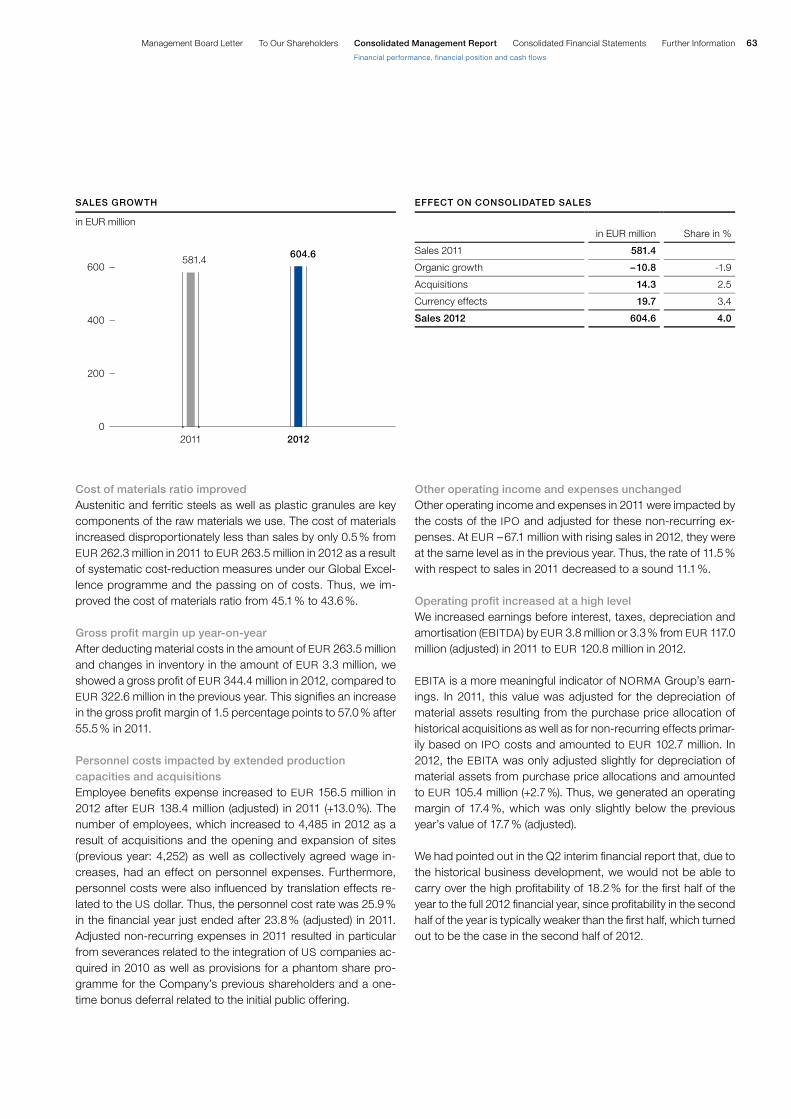
63Further InformationConsolidated Financial StatementsConsolidated Management ReportManagement Board Letter To Our Shareholders
Financial performance, financial position and cash flows
Cost of materials ratio improvedAustenitic and ferritic steels as well as plastic granules are key components of the raw materials we use. The cost of materials increased disproportionately less than sales by only 0.5% from EUR 262.3 million in 2011 to EUR 263.5 million in 2012 as a result of systematic cost-reduction measures under our Global Excel-lence programme and the passing on of costs. Thus, we im-proved the cost of materials ratio from 45.1% to 43.6%.
Gross profit margin up year-on-yearAfter deducting material costs in the amount of EUR 263.5 million and changes in inventory in the amount of EUR 3.3 million, we showed a gross profit of EUR 344.4 million in 2012, compared to EUR 322.6 million in the previous year. This signifies an increase in the gross profit margin of 1.5 percentage points to 57.0% after 55.5% in 2011.
Personnel costs impacted by extended production capacities and acquisitions Employee benefits expense increased to EUR 156.5 million in 2012 after EUR 138.4 million (adjusted) in 2011 (+13.0%). The number of employees, which increased to 4,485 in 2012 as a result of acquisitions and the opening and expansion of sites (previous year: 4,252) as well as collectively agreed wage in-creases, had an effect on personnel expenses. Furthermore, personnel costs were also influenced by translation effects re-lated to the US dollar. Thus, the personnel cost rate was 25.9%in the financial year just ended after 23.8% (adjusted) in 2011. Adjusted non-recurring expenses in 2011 resulted in particular from severances related to the integration of US companies ac-quired in 2010 as well as provisions for a phantom share pro-gramme for the Company’s previous shareholders and a one-time bonus deferral related to the initial public offering.
Other operating income and expenses unchangedOther operating income and expenses in 2011 were impacted by the costs of the IPO and adjusted for these non-recurring ex-penses. At EUR –67.1 million with rising sales in 2012, they were at the same level as in the previous year. Thus, the rate of 11.5%with respect to sales in 2011 decreased to a sound 11.1%.
Operating profit increased at a high levelWe increased earnings before interest, taxes, depreciation and amortisation (EBITDA) by EUR 3.8 million or 3.3% from EUR 117.0 million (adjusted) in 2011 to EUR 120.8 million in 2012.
EBITA is a more meaningful indicator of NORMA Group’s earn-ings. In 2011, this value was adjusted for the depreciation of material assets resulting from the purchase price allocation of historical acquisitions as well as for non-recurring effects primar-ily based on IPO costs and amounted to EUR 102.7 million. In 2012, the EBITA was only adjusted slightly for depreciation of material assets from purchase price allocations and amounted to EUR 105.4 million (+2.7%). Thus, we generated an operating margin of 17.4%, which was only slightly below the previous year’s value of 17.7% (adjusted).
We had pointed out in the Q2 interim financial report that, due to the historical business development, we would not be able to carry over the high profitability of 18.2% for the first half of the year to the full 2012 financial year, since profitability in the second half of the year is typically weaker than the first half, which turned out to be the case in the second half of 2012.
EFFECT ON CONSOLIDATED SALES
in EUR million Share in %
Sales 2011 581.4
Organic growth –10.8 -1.9
Acquisitions 14.3 2.5
Currency effects 19.7 3.4
Sales 2012 604.6 4.0
SALES GROWTH
in EUR million
2012
604.6
2011
581.4600
400
200
0

NORMA Group AG Annual Report 201264
Sharp increase in net financial income We generated net financial income of EUR –13.3 million in 2012. This is an increase of EUR 16.3 million or 55.2% compared to EUR –29.6 million in 2011. However, the value in the first half of 2011 was heavily influenced by preparations for the initial public offering and the subsequent refinancing.
Net income after taxWe increased our adjusted net income after tax from EUR 57.6 million by 7.3% to EUR 61.8 million in 2012.
The adjusted income taxes in the financial year just ended amounted to EUR –26.8 million. The adjusted tax rate of 30.3%was at the adjusted level of 2011 of 30.0% and therefore at the lower end of our forecast.
Adjusted earnings per share increased significantlyto EUR 1.94 Earnings per share amounted to EUR 1.78 and were thus 49.6%higher than the previous year’s earnings per share of EUR 1.19.
Adjusted earnings per share were EUR 1.94 (previous year: EUR 1.92). This is based on the weighted number of shares as at 31 December 2012 of 31,862,400 (previous year: 30,002,126 shares). Pro-forma earnings per share for 2011 amounted to EUR 1.81 based on the number of shares in circulation as at 31 December 2012 (31,862,400 shares). This represents an increase of 7.3% or EUR 0.13 in 2012.
FINANCIAL POSITION AND CASH FLOWS
Total assets reflect growth and acquisitions Total assets increased to EUR 692.1 million and were thus 6.7%higher than on the last day of 2011 (EUR 648.6 million). This in-crease can be attributed in particular to the acquisitions and additions to non-current assets and to some extent also to cur-rency effects, above all due to the higher transaction volume in US dollars.
The first-time inclusion of the four acquisitions in NORMA Group’s consolidated group is reflected in the Group’s statement of finan-cial position. The effects of these acquisitions on NORMA
Group’s assets and liabilities are presented under Note 39 on pages 154 to 159.
Non-current assets mainly influenced by acquisitionsNon-current assets amounted to EUR 445.5 million or around 64% of total assets at the end of the year. They increased by 8.6% compared to EUR 410.2 million at the end of 2011. The increase can be mainly explained by the increase in goodwill as a result of the acquisitions as well as by the increase in other intangible assets and property, plant and equipment.
Goodwill amounted to EUR 235.3 million as at 31 December 2012 and was thus EUR 10.5 million or 4.6% higher than the previous year’s amount of EUR 224.8 million. This includes EUR 6.9 million from Connectors Verbindungstechnik AG,EUR 1.0 million from Nordic Metalblok S.r.l., EUR 1.3 million from Chien Jin Plastic Sdn. Bhd. and EUR 2.7 million from Groen Bevestigingsmaterialen B.V.
DEVELOPMENT OF THE DISTRIBUTION CHANNELS
EJT DS
2012 2011 2012 2011
Sales in EUR million 427.6 411.5 174.5 170.3
Growth in % 3.9 2.5
Share of sales in % 71.0 70.7 29.0 29.3
ADJUSTED EBITA AND EBITA MARGIN
in EUR million
2012
105.4
17.4%
2011
102.7
17.7%150
100
50
0

65Further InformationConsolidated Financial StatementsConsolidated Management ReportManagement Board Letter To Our Shareholders
Financial performance, financial position and cash flows
The increase in other intangible assets by EUR 13.6 million or 17.2 % to EUR 92.5 million (31 December 2011: EUR 78.9 million) can also be attributed to these acquisitions.
Property, plant and equipment increased in particular due to the acquisitions as well as capital expenditures in property, plant and equipment by EUR 11.9 million or 12.2 % from EUR 97.2 million as at 31 December 2011 to EUR 109.1 million as at 31 December 2012.
Current assets positively impacted by the increase in cash and cash equivalents Current assets amounting to EUR 246.7 million as at 31 Decem-ber 2012 were only slightly above the level as at 31 December 2011 (EUR 238.4 million). Thus, they amounted to around 36 % of total assets.
On the one hand, inventories increased to EUR 74.3 million com-pared to EUR 66.8 million as at 31 December 2011; on the other, cash and cash equivalents increased to EUR 72.4 million com-pared to EUR 67.9 million in 2011. Trade receivables and other receivables totalling EUR 79.3 million were slightly lower than the previous year’s amount of EUR 80.8 million. As at 30 June 2012, they amounted to EUR 101.8 million. The decrease in this line item starting at the second half of the year primarily reflects the business’ typical development over the course of the year.
The increase in inventories by EUR 7.6 million or 11.3 % was mostly due to the acquisitions. The increase in cash and cash equivalents can be mainly attributed to the cash flow, which was positive despite the payments for the acquisitions and the divi-dends paid out for financial year 2011.
Group equity base further increased to 41.7 %Consolidated equity as at 31 December 2012 increased by EUR 32.3 million or 12.6 % to EUR 288.3 million compared to EUR 256.0 million at 31 December 2011. This increase resulted mostly from the net profit for the period of EUR 56.6 million. In contrast, the dividends paid in the second quarter in the amount of EUR 19.1 million reduced the equity. Thus, equity expressed as a percentage of assets was 41.7 % after 39.5 % as at 31 De-cember 2011.
Net debt stable despite acquisitions and dividends At EUR 199.0 million, net debt in 2012 was almost at the same level as 2011 (EUR 198.5 million), despite our acquisitions and the payment of dividends. Gearing (net debt in relation to equity) of 0.7 was significantly below the level of 0.8 as at the end of 2011. Net financial debt included derivative (non-cash) liabilities totalling EUR 24.8 million (31 December 2011: EUR 21.8 million).
Capital commitment in (trade) working capital remains low despite growth(Trade) working capital (inventories plus receivables minus liabil-ities, both primarily from trade payables and trade receivables) was EUR 115.9 million as at 31 December 2012 (31 December 2011: EUR 106.2 million) and thus reflected the satisfactory busi-ness development as well as effects from the acquisitions with an unchanged low relative capital commitment in relation to sales.
Non-current liabilities reducedNon-current liabilities amounted to EUR 268.7 million as at 31 December 2012 and were thus around 39 % of total assets. Since we were able to systematically reduce our loan liabilities, non-current liabilities decreased by EUR 15.3 million or 5.4 % compared to 2011 (EUR 284.0 million).
Two opposing effects had an impact. On the one hand, non-current loans payable decreased by 10.7 % or EUR 22.8 million from EUR 213.5 million as at 31 December 2011 to EUR 190.7 million as at 31 December 2012. On the other, non-current de-rivative financial liabilities increased by EUR 2.9 million or 13.1 % from EUR 21.8 million as at 31 December 2011 to EUR 24.7 mil-lion in 2012. The European Central Bank once again reduced interest rates as a result of the effects of the European debt crisis. Consequently, the negative fair value of NORMA Group’s deriva-tive interest rate hedges further increased.
Current liabilities increased due to acquisitions Current liabilities increased as at 31 December 2012 by EUR 26.6 million or 24.5 % to EUR 135.1 million (31 December 2011: EUR 108.5 million) and thus amounted to around 20 % of total assets.
This can be mainly attributed to the EUR 22.1 million increase in current loans payable (+76.3 %) from EUR 28.9 million as at 31 December 2011 to EUR 51.0 million at the reporting date. Cred-it lines available on short notice were utilised, among other things, to finance acquisitions, the growth of working capital in current assets, and the dividend payments. Please refer to Note 30 on page 150.
Accounting treatment of carrying amountsAs a rule, we recognise the carrying amounts of assets and lia-bilities at amortised cost, whereby we adhere to the lower-of-cost-or-market principle. Derivative financial instruments, avail-able-for-sale financial assets and cash and cash equivalents are measured at fair value. Note 5.3 on page 129 includes comments on the determination of the carrying amount of financial instru-ments.
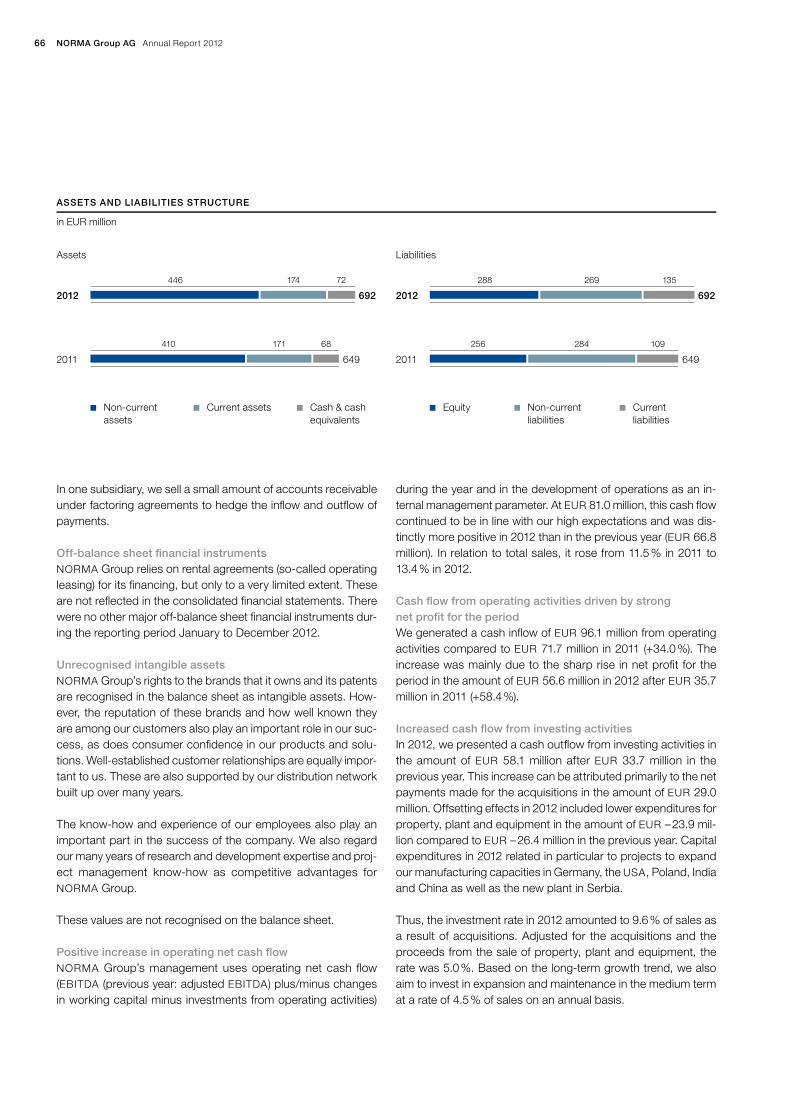
NORMA Group AG Annual Report 201266
In one subsidiary, we sell a small amount of accounts receivable under factoring agreements to hedge the inflow and outflow of payments.
Off-balance sheet financial instrumentsNORMA Group relies on rental agreements (so-called operating leasing) for its financing, but only to a very limited extent. These are not reflected in the consolidated financial statements. There were no other major off-balance sheet financial instruments dur-ing the reporting period January to December 2012.
Unrecognised intangible assetsNORMA Group’s rights to the brands that it owns and its patents are recognised in the balance sheet as intangible assets. How-ever, the reputation of these brands and how well known they are among our customers also play an important role in our suc-cess, as does consumer confidence in our products and solu-tions. Well-established customer relationships are equally impor-tant to us. These are also supported by our distribution network built up over many years.
The know-how and experience of our employees also play an important part in the success of the company. We also regard our many years of research and development expertise and proj-ect management know-how as competitive advantages for NORMA Group.
These values are not recognised on the balance sheet.
Positive increase in operating net cash flowNORMA Group’s management uses operating net cash flow (EBITDA (previous year: adjusted EBITDA) plus/minus changes in working capital minus investments from operating activities)
during the year and in the development of operations as an in-ternal management parameter. At EUR 81.0 million, this cash flow continued to be in line with our high expectations and was dis-tinctly more positive in 2012 than in the previous year (EUR 66.8 million). In relation to total sales, it rose from 11.5% in 2011 to 13.4% in 2012.
Cash flow from operating activities driven by strong net profit for the period We generated a cash inflow of EUR 96.1 million from operating activities compared to EUR 71.7 million in 2011 (+34.0%). The increase was mainly due to the sharp rise in net profit for the period in the amount of EUR 56.6 million in 2012 after EUR 35.7 million in 2011 (+58.4%).
Increased cash flow from investing activitiesIn 2012, we presented a cash outflow from investing activities in the amount of EUR 58.1 million after EUR 33.7 million in the previous year. This increase can be attributed primarily to the net payments made for the acquisitions in the amount of EUR 29.0 million. Offsetting effects in 2012 included lower expenditures for property, plant and equipment in the amount of EUR –23.9 mil-lion compared to EUR –26.4 million in the previous year. Capital expenditures in 2012 related in particular to projects to expand our manufacturing capacities in Germany, the USA, Poland, India and China as well as the new plant in Serbia.
Thus, the investment rate in 2012 amounted to 9.6% of sales as a result of acquisitions. Adjusted for the acquisitions and the proceeds from the sale of property, plant and equipment, the rate was 5.0%. Based on the long-term growth trend, we also aim to invest in expansion and maintenance in the medium term at a rate of 4.5% of sales on an annual basis.
ASSETS AND LIABILITIES STRUCTURE
in EUR million
2012 2012
2011 2011
Assets Liabilities
692 692
649 649
446 288
410 256
174 269
171 284
72 135
68 109
Non-current assets
Equity Current assets Non-current liabilities
Cash & cashequivalents
Current liabilities
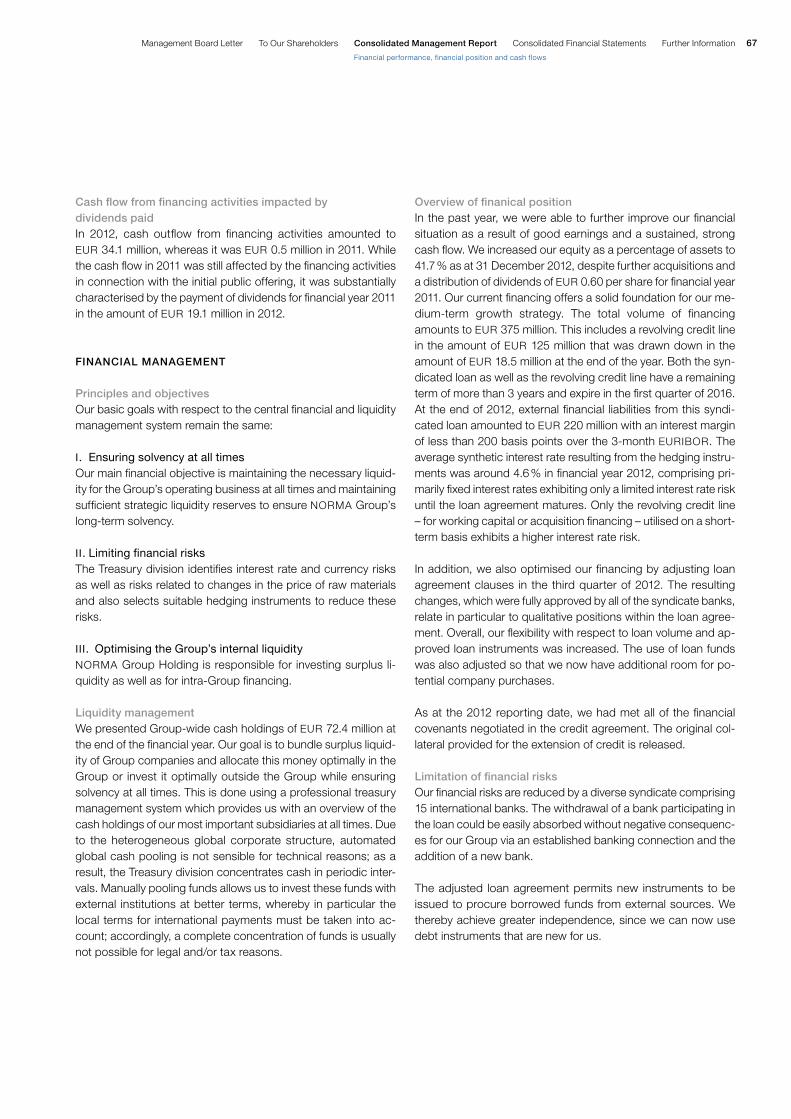
67Further InformationConsolidated Financial StatementsConsolidated Management ReportManagement Board Letter To Our Shareholders
Financial performance, financial position and cash flows
Cash flow from financing activities impacted by dividends paidIn 2012, cash outflow from financing activities amounted to EUR 34.1 million, whereas it was EUR 0.5 million in 2011. While the cash flow in 2011 was still affected by the financing activities in connection with the initial public offering, it was substantially characterised by the payment of dividends for financial year 2011 in the amount of EUR 19.1 million in 2012.
FiNANCiAL MANAGEMENt
Principles and objectivesOur basic goals with respect to the central financial and liquidity management system remain the same:
I. Ensuring solvency at all timesOur main financial objective is maintaining the necessary liquid-ity for the Group’s operating business at all times and maintaining sufficient strategic liquidity reserves to ensure NORMA Group’s long-term solvency.
II. Limiting financial risksThe Treasury division identifies interest rate and currency risks as well as risks related to changes in the price of raw materials and also selects suitable hedging instruments to reduce these risks.
III. Optimising the Group’s internal liquidityNORMA Group Holding is responsible for investing surplus li-quidity as well as for intra-Group financing.
Liquidity managementWe presented Group-wide cash holdings of EUR 72.4 million at the end of the financial year. Our goal is to bundle surplus liquid-ity of Group companies and allocate this money optimally in the Group or invest it optimally outside the Group while ensuring solvency at all times. This is done using a professional treasury management system which provides us with an overview of the cash holdings of our most important subsidiaries at all times. Due to the heterogeneous global corporate structure, automated global cash pooling is not sensible for technical reasons; as a result, the Treasury division concentrates cash in periodic inter-vals. Manually pooling funds allows us to invest these funds with external institutions at better terms, whereby in particular the local terms for international payments must be taken into ac-count; accordingly, a complete concentration of funds is usually not possible for legal and/or tax reasons.
Overview of finanical positionIn the past year, we were able to further improve our financial situation as a result of good earnings and a sustained, strong cash flow. We increased our equity as a percentage of assets to 41.7 % as at 31 December 2012, despite further acquisitions and a distribution of dividends of EUR 0.60 per share for financial year 2011. Our current financing offers a solid foundation for our me-dium-term growth strategy. The total volume of financing amounts to EUR 375 million. This includes a revolving credit line in the amount of EUR 125 million that was drawn down in the amount of EUR 18.5 million at the end of the year. Both the syn-dicated loan as well as the revolving credit line have a remaining term of more than 3 years and expire in the first quarter of 2016. At the end of 2012, external financial liabilities from this syndi-cated loan amounted to EUR 220 million with an interest margin of less than 200 basis points over the 3-month EURIBOR. The average synthetic interest rate resulting from the hedging instru-ments was around 4.6 % in financial year 2012, comprising pri-marily fixed interest rates exhibiting only a limited interest rate risk until the loan agreement matures. Only the revolving credit line – for working capital or acquisition financing – utilised on a short-term basis exhibits a higher interest rate risk.
In addition, we also optimised our financing by adjusting loan agreement clauses in the third quarter of 2012. The resulting changes, which were fully approved by all of the syndicate banks, relate in particular to qualitative positions within the loan agree-ment. Overall, our flexibility with respect to loan volume and ap-proved loan instruments was increased. The use of loan funds was also adjusted so that we now have additional room for po-tential company purchases.
As at the 2012 reporting date, we had met all of the financial covenants negotiated in the credit agreement. The original col-lateral provided for the extension of credit is released.
Limitation of financial risksOur financial risks are reduced by a diverse syndicate comprising 15 international banks. The withdrawal of a bank participating in the loan could be easily absorbed without negative consequenc-es for our Group via an established banking connection and the addition of a new bank.
The adjusted loan agreement permits new instruments to be issued to procure borrowed funds from external sources. We thereby achieve greater independence, since we can now use debt instruments that are new for us.

NORMA Group AG Annual Report 201268
The entire syndicated loan was originally extended completely on a variable euro basis. Thus, the interest expenses related to the syndicated loan depend on the amount drawn down, par-ticularly from the revolving line of credit, as well as the general changes in money market rates, specifically the 3-month EURI-
BOR rate. In order to reduce this risk and meet the requirements of our Group’s earnings and financial performance, the majority of the loan amount was already paid out in 2011 in our three main currencies, the US dollar, Swedish krona and British pound ster-ling and hedged by means of derivative structures. This mini-mised currency and interest rate risks. The changes in value of the instruments selected for this purpose are recognised direct-ly in equity as part of our hedge accounting.
In addition to these hedging instruments, we use forward trans-actions and options primarily to limit the Group’s currency risk. We are not currently using any other hedging instruments or derivative structures. We regularly review whether there are suit-able hedging instruments to sensibly reduce our risk, in particu-lar in the area of commodities. We periodically analyse and evaluate net open positions across the Group. We constantly monitor the latest developments in hedging instruments and le-gal hedging opportunities to see how they compare with risk positions so that we can quickly react to changes in risk param-eters.
We also expanded the possibilities for internal financing in the past year through various projects in the Treasury division, whereby we are pursuing the goal of placing our Group-wide financing on an even broader and more balanced foundation in order to further optimise the Group’s strong cash flow.
Key components of our policy to limit financial risks include clear-ly defining process responsibilities, multi-level approval process-es and risk reviews that we have fixed in a Treasury guideline.
investment analysisWe invest the funds from our operating cash flow in our growth. In the past year, we further expanded the plant we established in Serbia in 2011. In Asia, both internal as well as external growth was augmented by the construction of new production plants and strategic purchases. In the Netherlands, we considerably increased the interest in our sales partners. With the acquisition of Connectors Verbindungstechnik in Switzerland, we not only entered a new geographical market, but also developed a new customer segment from the pharmaceutical industry for the NORMA Group. We also gained new products and sales part-ners with the purchase of Chien Jin Plastic in Malaysia. We en-hanced our market position in the joining technology market for water and sewage in Asia. We strengthened our distribution network in Southern Europe with the purchase of Nordic Metal-blok in Italy.
In addition, we invested in existing plants worldwide in order to automate and optimise production.
The economic efficiency of operating investments in the Group is monitored in the controlling department of the respective op-erationally legal unit.
Segment reporting
different development in the three operating segmentsWe further increased the share of sales realised internationally from 61.7 % in 2011 to 67.4 % in the financial year just ended by developing new markets and customers, thereby continuing our strategy of internationalisation.
We measure the profitability of our segments based on EBITDA. In 2011, this was adjusted primarily for non-recurring expenses from the preparation and execution of the initial public offering as well as other non-recurring expenses. Further information on this can be found under Note 36 “Segment reporting” on page 153.
Business development in our three regional segments EMEA (Europe, Middle East, Africa), Americas and Asia-Pacific varied significantly with respect to sales and EBITDA in 2012.
Only slight decline in sales trend in the EMEA region despite flagging economyDespite the general economic development in the EMEA region, sales only decreased slightly to EUR 367.5 million including ac-quisitions compared to EUR 372.7 million in 2011 (-1.4 %). In ad-dition to the sales growth from acquisitions, this can also be attributed to the fact that the decrease in sales, which continued to deteriorate in the first three quarters, did not continue in the fourth quarter, but instead stabilised. We see here positive ef-fects from the new Euro 6 emission standards, whose implemen-tation has already been carried out in part by automobile manu-facturers. The share of the EMEA region fell in relation to total sales due to the increased expansion in the Americas and Asia-Pacific region from 64 % in 2011 to 61 % in 2012.
EBITDA fell from EUR 89.8 million (adjusted) in 2011 to EUR 79.3 million in 2012 and thus by 11.7 %. The EBITDA margin fell from 24.1 % only to 21.6 % as a result of cost-savings from the Global Excellence programme.

69Further InformationConsolidated Financial StatementsConsolidated Management ReportManagement Board Letter To Our Shareholders
Financial performance, financial position and cash flows
Segment reporting
Assets increased from EUR 417.1 million in 2011 to EUR 457.4 million mainly due to the acquisitions of Connectors Verbindung-stechnik and Nordic Metalblok as well as the acquisition of ad-ditional shares of Groen Bevestigingsmaterialen.
We already described in detail other projects that were imple-mented in 2012 in our interim financial reports in 2012.
For example, we opened a new distribution centre in Moscow. We have distributed our joining products and solutions to local distributors since July 2012, thereby continuing our course of expansion and strengthening the local customer relationships. Our customers benefit from the shorter delivery times and in-creased product availability.
Furthermore, we placed a new assembly system for the manu-facture of exhaust pipe connectors into operation in the German plant in Gerbershausen in September. We manufacture the new “Euro Coupler” joining element in this plant, which supports the automotive industry’s need to build lighter automobiles, avoid leakage and reduce CO2 emission values.
The construction of the new assembly plant at the site in New-bury, United Kingdom, to manufacture NORMACONNECT V profile clamps on which we reported in the half-yearly report is nearly completed.
Sales trend in the Americas very positiveThe Americas segment generated EUR 193.3 million in sales compared to EUR 173.0 million in the previous year and thus rose by 11.8 % also due to the positive currency development in 2012. The political uncertainties leading up to the US presidential elec-
tion and the impending “fiscal cliff” at the end of the year had an impact on the economy in the fourth quarter of 2012. Therefore, we were unable to maintain the strong increase in sales of +18.3 % in the first nine months until the end of the year. This region’s share of sales in relation to total sales increased to 32 % after 30 % in the previous year.
EBITDA increased from EUR 34.3 million (adjusted) in 2011 by 25.4 % to EUR 43.0 million. The EBITDA margin was 19.8 % in the previous year and 22.2 % in 2012. We were also able to re-duce the cost basis in the Americas segment as a result of mea-sures from the Global Excellence programme.
Assets decreased from EUR 223.9 million in 2011 to EUR 209.9 million mainly due to higher exchange rates on the reporting date.
Strong sales growth in the Asia-Pacific regionThe significance of the Asia-Pacific region for our growth poten-tial remains high. The improved standard of living in the region’s emerging markets has also led to increased demand for high-quality products. Sales were EUR 35.7 million in 2011 and in-creased by 22.6 % to EUR 43.8 million in 2012. Thus the share of sales was 7 % after 6 % in the previous year. Observing the share of sales with respect to the region of destination, i.e. includ-ing the imported sales from other regions, it was around 10 % and thus at the same level as in the previous year.
EBITDA rose from EUR 3.1 million in 2011 to EUR 5.2 million and thus by 68.9 %. The EBITDA margin was 11.8 % after 8.6 % in 2011. The reason for the strong improvement is the ever increas-ing utilisation of capacities, which had a positive effect on the cost basis.
dEvELOPMENt OF thE SEGMENtS
EMEA
Americas
Asia-Pacific
in EUR million
2012
2011
Change
2012
2011
Change
2012
2011
Change
External sales 367.5 372.7 – 1.4 % 193.3 173.0 + 11.8 % 43.8 35.7 + 22.6 %
Contribution to consolidated sales 61 % 64 % 32 % 30 % 7 % 6 %
Adjusted EBITDA 79.3 89.8 – 11.7 % 43.0 34.3 + 25.4 % 5.2 3.1 + 68.9 %
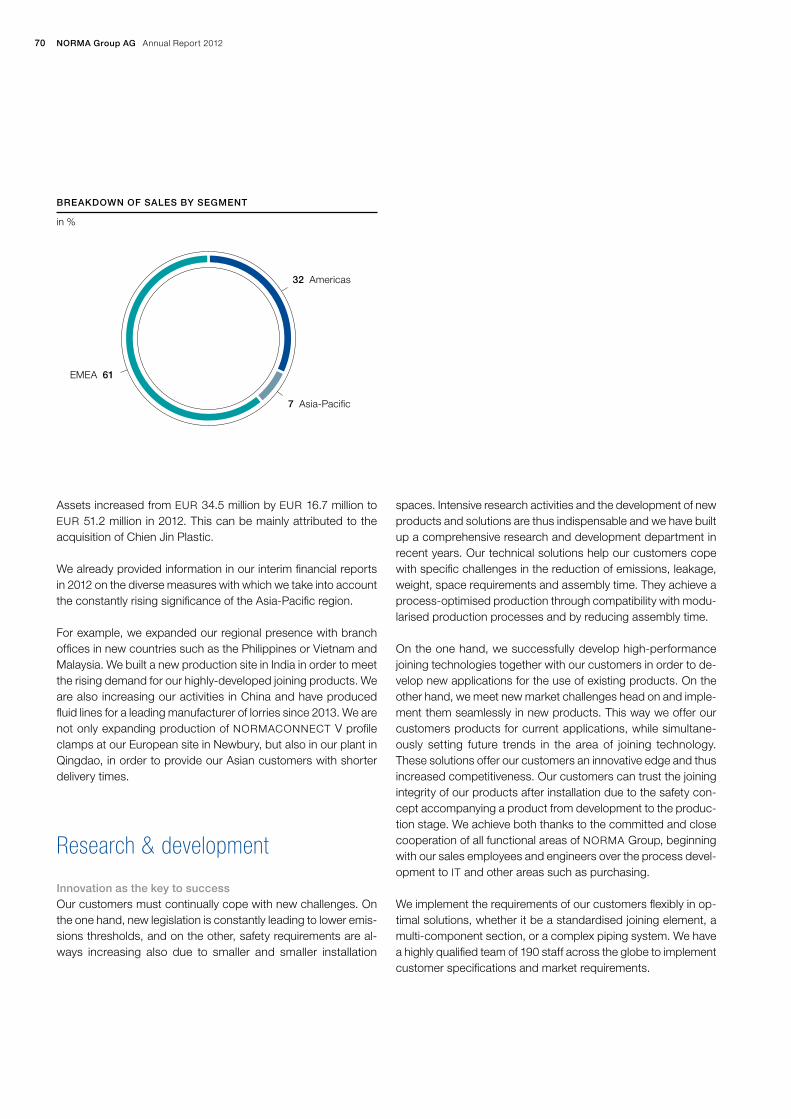
NORMA Group AG Annual Report 201270
Assets increased from EUR 34.5 million by EUR 16.7 million to EUR 51.2 million in 2012. This can be mainly attributed to the acquisition of Chien Jin Plastic.
We already provided information in our interim financial reports in 2012 on the diverse measures with which we take into account the constantly rising significance of the Asia-Pacific region.
For example, we expanded our regional presence with branch offices in new countries such as the Philippines or Vietnam and Malaysia. We built a new production site in India in order to meet the rising demand for our highly-developed joining products. We are also increasing our activities in China and have produced fluid lines for a leading manufacturer of lorries since 2013. We are not only expanding production of NORMACONNECT V profile clamps at our European site in Newbury, but also in our plant in Qingdao, in order to provide our Asian customers with shorter delivery times.
Research & development
innovation as the key to successOur customers must continually cope with new challenges. On the one hand, new legislation is constantly leading to lower emis-sions thresholds, and on the other, safety requirements are al-ways increasing also due to smaller and smaller installation
spaces. Intensive research activities and the development of new products and solutions are thus indispensable and we have built up a comprehensive research and development department in recent years. Our technical solutions help our customers cope with specific challenges in the reduction of emissions, leakage, weight, space requirements and assembly time. They achieve a process-optimised production through compatibility with modu-larised production processes and by reducing assembly time.
On the one hand, we successfully develop high-performance joining technologies together with our customers in order to de-velop new applications for the use of existing products. On the other hand, we meet new market challenges head on and imple-ment them seamlessly in new products. This way we offer our customers products for current applications, while simultane-ously setting future trends in the area of joining technology. These solutions offer our customers an innovative edge and thus increased competitiveness. Our customers can trust the joining integrity of our products after installation due to the safety con-cept accompanying a product from development to the produc-tion stage. We achieve both thanks to the committed and close cooperation of all functional areas of NORMA Group, beginning with our sales employees and engineers over the process devel-opment to IT and other areas such as purchasing.
We implement the requirements of our customers flexibly in op-timal solutions, whether it be a standardised joining element, a multi-component section, or a complex piping system. We have a highly qualified team of 190 staff across the globe to implement customer specifications and market requirements.
BREAkdOwN OF SALES By SEGMENt
in %
EMEA 61
7 Asia-Pacific
32 Americas

71Further InformationConsolidated Financial StatementsConsolidated Management ReportManagement Board Letter To Our Shareholders
Segment reporting
Research & development
Our cutting-edge testing laboratory is set up to perform service life tests for all relevant application areas. We use our laboratory to test joining technology for cooling water and fuel lines, charge air and other air and gas applications, among other things. These outstanding test facilities help us to develop new products, set their specifications and test them. We are also able to run tests in accordance with relevant customer specifications. In the finan-cial year just ended, a testing facility was placed into operation to test the service life of SCR fluid lines.
two-pillar development structureOur product development and application development in our Engineered Joining Technology (EJT) unit is set up as a two-pillar process. We create new basic products in product develop-ment in close cooperation with our customers. The application development process alters these basic products to meet the customers’ specific needs.
Our product developers design new products or product groups for the entire EJT unit. This process involves testing new prod-ucts in collaboration with our production division and other func-tional areas, but also developing new materials to suit the future requirements of our customers. Our teams test the products and develop internal product and test specifications which confirm that our products are reliable. The innovations are reviewed on a regular basis by the Management Board.
Our application developers modify our existing and newly devel-oped products based on the specific requirements of our cus-tomers or local conditions.
Global megatrends that, for example, trace back to climate change are a challenge for many customers and their finished products and offer excellent growth prospects. Our product de-velopment concentrates on these innovation opportunities. This also allows us to increase profitability as well as our technical and entrepreneurial success. This improves the speed at which we can bring product innovations to market, gives us a large number of customer-specific customisations and makes us stand out from our direct competitors, the majority of which have a local focus. We have created a standardised innovation process through our two-pillar structure. This allows us to utilise our re-sources at a global level with a sharp focus on growth and prof-itable markets.
Strategic collaboration with customers and research institutesMany of our projects require a close and continuing on-site col-laboration with our customers. Therefore, the application devel-opment teams represent an active link to many of our largest
customers. They work in close collaboration with our EJT cus-tomers as well as NORMA Group’s product developers and other functional areas that are required to successfully bring customer projects to completion.
Our competence centres in the USA, China, India and Europe focus on clearly defined innovation tasks designed to develop solutions for various products and product groups in the different customer groups and adjust them to regional characteristics.
We also work with research and higher education institutions such as material and other testing institutes. However, for com-petitive reasons we do not publish the specific nature of these research partnerships.
AwardsIn March 2012, we received the Performance Excellence Award in Silver from Boeing for our above-average performance in 2011. The company purchases worm drive hose clamps from us, which it uses in various types of commercial aircraft.
Significant developments in 2012The Distribution Services unit is purely a commercial unit; the market does not require the same type of technological research as conducted in the Engineered Joining Technology unit. More-over, these customers expect a strong brand image and the most complete product range possible with the corresponding mar-keting measures. Therefore, we continuously drive development in this unit with sensible additions to the product range. In 2012, we expanded our product range to include products from the biotechnology and pharmaceutical areas and the heating, venti-lation and air conditioning industry as well as products related to drinking and industrial water supply and sprinkler systems through three acquisitions in Switzerland, Italy and Malaysia. This allowed us to make our product range even more attractive for consumers in the retail sector.
In the EJT unit, we introduced further innovations to the market that help our customers to meet challenges in the area of weight and emission reduction, the minimisation of leaks and assembly optimisation and safety.
The tamper-proof secure worm drive hose clamp NORMA-
CLAMP TORRO Tamper Proof comes with a special bolt head that can only be mounted and removed with a matching tool. This helps avoid errors in the assembly of components such as pre-assembled tank, air induction or cooling systems. This re-sults in simpler processes, increased installation safety and helps to reduce costs.

NORMA Group AG Annual Report 201272
The latest development of NORMAFLEX Low Emission Tubes (LET fuel lines) is a new generation of lines that meet the Low Emission Vehicle (LEV) III Standards for evaporative emissions for fuel with a high alcohol content in accordance with the Cali-fornia Air Resource Board (CARB). This permits the development of cost-optimised solutions for the fuel system that also make a crucial contribution to meeting the new emission requirements for future generations of vehicles.
NORMAQUICK TWIST III are connectors in the area of charge air and cooling water systems and can be used, among other things, in turbocharged gasoline engines. A new, self-locking mechanism guarantees correct assembly, which in turn prevents leaks. The connectors can be opened from any position and are therefore suited for tight engine spaces and spin weld applica-tions. Little force is required due to an optimised axial to radial ratio – even when assembling larger elements. These advan-tages simplify assembly significantly and permit our customers to meet strict emission requirements. The connectors comprise four completely recyclable components and are distinguished by excellent chemical and thermal resistance.
The NORMACONNECT V PP (pressed profile) profile clamp is an especially easy to assemble V-profile clamp that can be used in tight spaces. It is a patented joining element for flanged pipes that can be used in various applications such as exhaust gas, cooling and filter systems, or in turbochargers and charged air applications. This new profile clamp is distinguished by an inte-grated bracket that enables the position of the clamp to be fixed during assembly and – in contrast to a conventional V-profile
clamp – ensures that the screw maintains the proper angle dur-ing assembly. This decreases assembly time and lowers the risk of improper assembly. Another advantage is the low weight of the clamp, which has a positive impact on the total system weight.
We developed the innovative, high-performance clamp NORMA-
FIX Red Grip for a major customer in the aviation industry over the course of a pilot project in 2012. This corresponds to the increased safety requirements of the aviation industry and also resulted in more than a 30 % reduction in weight for the part. At a technical level, the previously used metal parts of the clamp were replaced with a new and improved thermoplastic material. The resulting improvement also led to a significant economic benefit for consumers due to the high number of parts installed in an airplane (e.g. in electrical, hydraulic, air ducts, galleys, drain-ages).
high significance of innovations in the GroupWe use patents to protect our innovations. In 2012, we registered intellectual property rights in more than 20 patent families.
As at 31 December 2012, we had 190 employees worldwide in our R&D division. Approximately 44 % were involved in applica-tion development, 24 % in product development and around 32 % in process development. We offer our employees a broad spectrum of advanced training possibilities, from project man-agement to Six Sigma techniques. For brainstorming, we con-duct “think tank” meetings in the area of product development with the participation of all disciplines.
MOSt iMPORtANt PROduCtS iNtROduCEd iN 2012
Product
Application
Industry
NORMACLAMP TORRO Tamper Proof Tank, air induction and cooling systems Agriculture, automotive industry, shipbuilding, construction industry
NORMAFLEX Low Emission Tubes Fuel systems Automotive industry
NORMAQUICK TWIST III Charge air and cooling water systems Agriculture, automotive industry, shipbuilding, construction industry
NORMACONNECT V PP profile clamp Flanged pipes, exhaust gas, cooling and filter systems
Agriculture, automotive industry, shipbuilding, construction industry
NORMAFIX Red Grip Electrical, hydraulics, air ducts, drainages Aviation industry
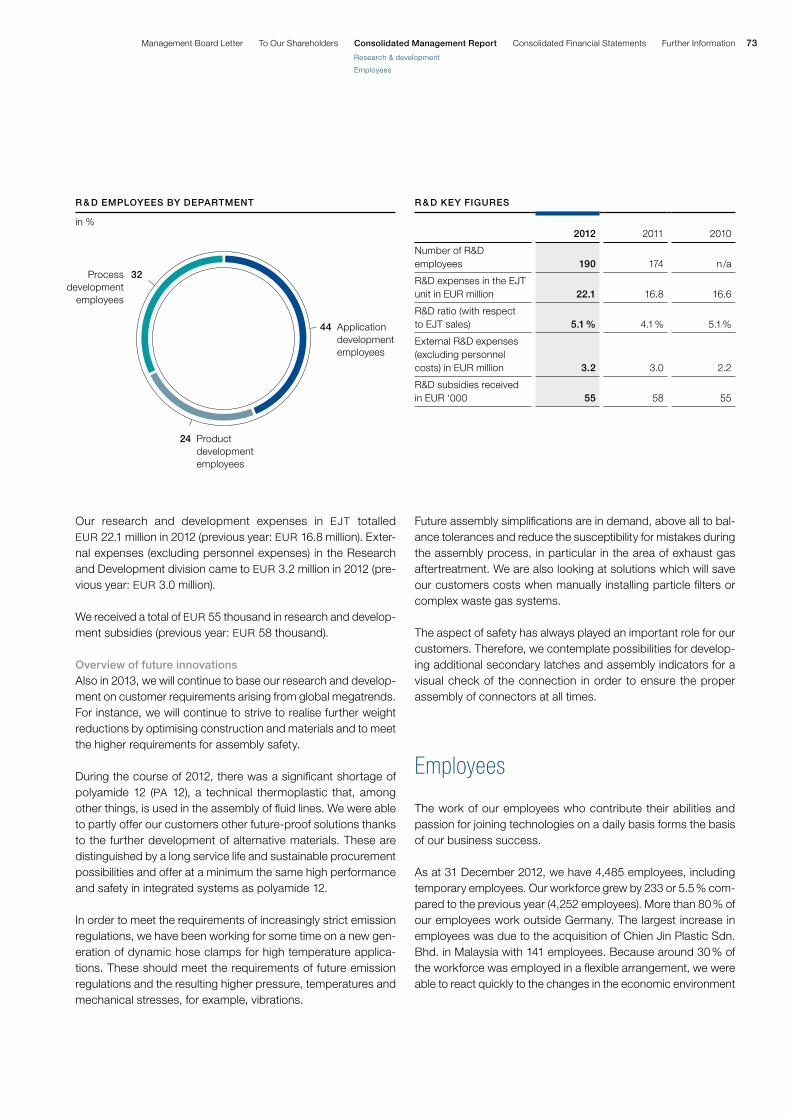
73Further InformationConsolidated Financial StatementsConsolidated Management ReportManagement Board Letter To Our Shareholders
Research & development
Employees
Our research and development expenses in EJT totalled EUR 22.1 million in 2012 (previous year: EUR 16.8 million). Exter-nal expenses (excluding personnel expenses) in the Research and Development division came to EUR 3.2 million in 2012 (pre-vious year: EUR 3.0 million).
We received a total of EUR 55 thousand in research and develop-ment subsidies (previous year: EUR 58 thousand).
Overview of future innovations Also in 2013, we will continue to base our research and develop-ment on customer requirements arising from global megatrends. For instance, we will continue to strive to realise further weight reductions by optimising construction and materials and to meet the higher requirements for assembly safety.
During the course of 2012, there was a significant shortage of polyamide 12 (PA 12), a technical thermoplastic that, among other things, is used in the assembly of fluid lines. We were able to partly offer our customers other future-proof solutions thanks to the further development of alternative materials. These are distinguished by a long service life and sustainable procurement possibilities and offer at a minimum the same high performance and safety in integrated systems as polyamide 12.
In order to meet the requirements of increasingly strict emission regulations, we have been working for some time on a new gen-eration of dynamic hose clamps for high temperature applica-tions. These should meet the requirements of future emission regulations and the resulting higher pressure, temperatures and mechanical stresses, for example, vibrations.
Future assembly simplifications are in demand, above all to bal-ance tolerances and reduce the susceptibility for mistakes during the assembly process, in particular in the area of exhaust gas aftertreatment. We are also looking at solutions which will save our customers costs when manually installing particle filters or complex waste gas systems.
The aspect of safety has always played an important role for our customers. Therefore, we contemplate possibilities for develop-ing additional secondary latches and assembly indicators for a visual check of the connection in order to ensure the proper assembly of connectors at all times.
Employees
The work of our employees who contribute their abilities and passion for joining technologies on a daily basis forms the basis of our business success.
As at 31 December 2012, we have 4,485 employees, including temporary employees. Our workforce grew by 233 or 5.5 % com-pared to the previous year (4,252 employees). More than 80 % of our employees work outside Germany. The largest increase in employees was due to the acquisition of Chien Jin Plastic Sdn. Bhd. in Malaysia with 141 employees. Because around 30 % of the workforce was employed in a flexible arrangement, we were able to react quickly to the changes in the economic environment
R & d kEy FiGuRES
2012
2011
2010
Number of R&D employees
190
174
n /a
R&D expenses in the EJT unit in EUR million
22.1
16.8
16.6
R&D ratio (with respect to EJT sales)
5.1 %
4.1 %
5.1 %
External R&D expenses (excluding personnel costs) in EUR million
3.2
3.0
2.2
R&D subsidies received in EUR ‘000
55
58
55
R & d EMPLOyEES By dEPARtMENt
in %
Process development
employees
32
44 Application development employees
24 Product development employees
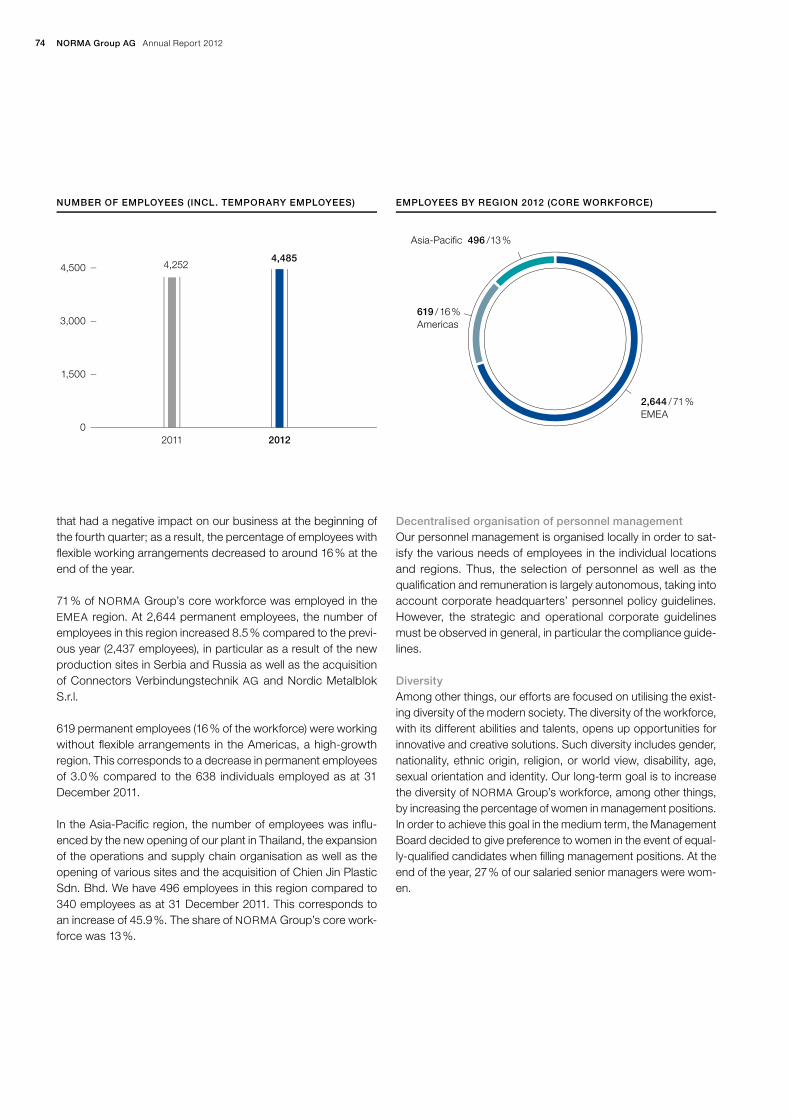
NORMA Group AG Annual Report 201274
that had a negative impact on our business at the beginning of the fourth quarter; as a result, the percentage of employees with flexible working arrangements decreased to around 16% at the end of the year.
71% of NORMA Group’s core workforce was employed in the EMEA region. At 2,644 permanent employees, the number of employees in this region increased 8.5% compared to the previ-ous year (2,437 employees), in particular as a result of the new production sites in Serbia and Russia as well as the acquisition of Connectors Verbindungstechnik AG and Nordic Metalblok S.r.l.
619 permanent employees (16% of the workforce) were working without flexible arrangements in the Americas, a high-growth region. This corresponds to a decrease in permanent employees of 3.0% compared to the 638 individuals employed as at 31 December 2011.
In the Asia-Pacific region, the number of employees was influ-enced by the new opening of our plant in Thailand, the expansion of the operations and supply chain organisation as well as the opening of various sites and the acquisition of Chien Jin Plastic Sdn. Bhd. We have 496 employees in this region compared to 340 employees as at 31 December 2011. This corresponds to an increase of 45.9%. The share of NORMA Group’s core work-force was 13%.
Decentralised organisation of personnel managementOur personnel management is organised locally in order to sat-isfy the various needs of employees in the individual locations and regions. Thus, the selection of personnel as well as the qualification and remuneration is largely autonomous, taking into account corporate headquarters’ personnel policy guidelines. However, the strategic and operational corporate guidelines must be observed in general, in particular the compliance guide-lines.
DiversityAmong other things, our efforts are focused on utilising the exist-ing diversity of the modern society. The diversity of the workforce, with its different abilities and talents, opens up opportunities for innovative and creative solutions. Such diversity includes gender, nationality, ethnic origin, religion, or world view, disability, age, sexual orientation and identity. Our long-term goal is to increase the diversity of NORMA Group’s workforce, among other things, by increasing the percentage of women in management positions. In order to achieve this goal in the medium term, the Management Board decided to give preference to women in the event of equal-ly-qualified candidates when filling management positions. At the end of the year, 27% of our salaried senior managers were wom-en.
Asia-Pacific 496 /13%
2,644 /71% EMEA
619 /16%Americas
EMPLOYEES BY REGION 2012 (CORE WORKFORCE) NUMBER OF EMPLOYEES (INCL. TEMPORARY EMPLOYEES)
2012
4,485
2011
4,2524,500
3,000
1,500
0
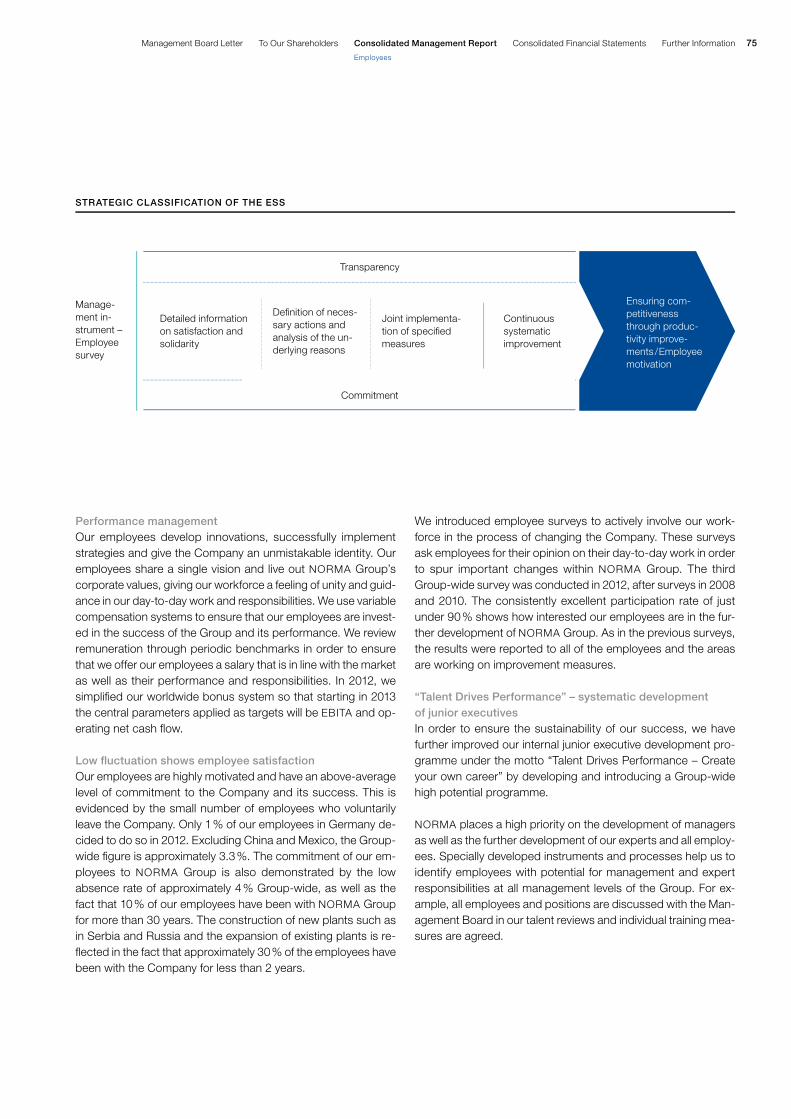
75Further InformationConsolidated Financial StatementsConsolidated Management ReportManagement Board Letter To Our Shareholders
Employees
Performance managementOur employees develop innovations, successfully implement strategies and give the Company an unmistakable identity. Our employees share a single vision and live out NORMA Group’s corporate values, giving our workforce a feeling of unity and guid-ance in our day-to-day work and responsibilities. We use variable compensation systems to ensure that our employees are invest-ed in the success of the Group and its performance. We review remuneration through periodic benchmarks in order to ensure that we offer our employees a salary that is in line with the market as well as their performance and responsibilities. In 2012, we simplified our worldwide bonus system so that starting in 2013 the central parameters applied as targets will be EBITA and op-erating net cash flow.
Low fluctuation shows employee satisfaction Our employees are highly motivated and have an above-average level of commitment to the Company and its success. This is evidenced by the small number of employees who voluntarily leave the Company. Only 1% of our employees in Germany de-cided to do so in 2012. Excluding China and Mexico, the Group-wide figure is approximately 3.3%. The commitment of our em-ployees to NORMA Group is also demonstrated by the low absence rate of approximately 4% Group-wide, as well as the fact that 10% of our employees have been with NORMA Group for more than 30 years. The construction of new plants such as in Serbia and Russia and the expansion of existing plants is re-flected in the fact that approximately 30% of the employees have been with the Company for less than 2 years.
We introduced employee surveys to actively involve our work-force in the process of changing the Company. These surveys ask employees for their opinion on their day-to-day work in order to spur important changes within NORMA Group. The third Group-wide survey was conducted in 2012, after surveys in 2008 and 2010. The consistently excellent participation rate of just under 90% shows how interested our employees are in the fur-ther development of NORMA Group. As in the previous surveys, the results were reported to all of the employees and the areas are working on improvement measures.
“Talent Drives Performance” – systematic development of junior executivesIn order to ensure the sustainability of our success, we have further improved our internal junior executive development pro-gramme under the motto “Talent Drives Performance – Create your own career” by developing and introducing a Group-wide high potential programme.
NORMA places a high priority on the development of managers as well as the further development of our experts and all employ-ees. Specially developed instruments and processes help us to identify employees with potential for management and expert responsibilities at all management levels of the Group. For ex-ample, all employees and positions are discussed with the Man-agement Board in our talent reviews and individual training mea-sures are agreed.
STRATEGIC CLASSIFICATION OF THE ESS
Manage-ment in-strument – Employee survey
Continuous systematic improvement
Ensuring com-petitiveness through produc-tivity improve-ments /Employee motivation
Transparency
Commitment
Detailed information on satisfaction and solidarity
Definition of neces-sary actions and analysis of the un-derlying reasons
Joint implementa-tion of specified measures

NORMA Group AG Annual Report 201276
The succession planning is also discussed and potential succes-sors for critical positions are identified and systematically pre-pared for the subsequent managing responsibilities.
All high potential individuals identified during the talent reviews who have the potential to replace their supervisors and are pre-pared to relocate around the world also participate in a manager development programme that includes special training units, mentoring by a senior manager and selected foreign assign-ments (bubble assignments).
Currently, 17 employees from all regions are participating in this programme.
We have set up local and regional programmes for employees who have the potential for further development, but are not avail-able for international assignments, and taken these employees into account in the local succession planning.
Apprenticeship as elementary component of personnel managementWe see ourselves as a socially responsible employer. There were 43 apprentices employed in 8 trainee professions at our largest production site in Germany in 2012. Thus, the trainee ratio in Germany (number of trainees in proportion to the total workforce in Germany) was 6%. In addition to the business management and technical trainee professions, there is the possibility of com-pleting one of four dual study programmes. In 2012, 14 appren-tices were accepted in permanent positions upon completion of their training.
Systematic training to promote development potentialThe qualification and commitment of our employees is crucial for our success. In 2012, every employee was provided with an av-erage of 30 hours of advanced training (excluding the newly ac-quired companies). In order to assess and document the perfor-mance, skills and development potential of each individual, all supervisors conduct personal assessment and qualification meetings with each of their employees at least once every year. In these meetings, the responsibilities and personal goals for the coming year are documented and training requirements are de-termined. In 2012, these meetings were held for approximately 85% of our employees without taking into account the compa-nies acquired in 2012. This percentage is lower than in the previ-ous year, because the integration of some sites had not yet been completed.
Production and supply chain management
PRODUCTION
We have organised our production essentially according to our product categories CLAMP and CONNECT, which are metal-based, as well as FLUID with plastic-based products. The two product categories are based on different production processes, technical expertise and sterility requirements. There are rela-
GROUP PARTICIPATION RATE IN EMPLOYEE SURVEYS
in %
2012
89.6
2008 2010
81.9 80.4
100
75
50
25
0

77Further InformationConsolidated Financial StatementsConsolidated Management ReportManagement Board Letter To Our Shareholders
Employees
Production and supply chain management
tively few synergies between the production processes. There-fore, we produce either metal-based or plastic-based products at our production sites. In most instances we have strictly imple-mented this approach in developed markets such as Europe or the USA. In contrast, in emerging economies in which we main-tain plants, production covers both product categories.
Due to our organic growth and our acquisition strategy, we are confronted with the task of continually having to further develop and optimise our production sites.
We measure the utilisation of capacity in all plants, in order to be able to invest early enough in new equipment or new plants. We continually optimise our production through direct deliveries and our Global Excellence Programme. This leads to higher produc-tion capacities in existing plants.
We comply with the OHSAS 18001 standard for occupational health and safety management systems as well as the ISO 9001 and TS 16949 quality management and environmental stan-dards. All of our older plants are certified according to these standards, and certification is planned for newly constructed and/or acquired plants that do not meet these standards.
SuPPLy ChAiN MANAGEMENt
Our goal is to produce in the region in which customers are lo-cated. This way, we keep our working capital, production costs and delivery risks as low as possible. This relates mainly to devel-oped markets in which capital expenditures in production mate-rial and plants are justified by a high volume of demand. In emerg-
ing economies, we import our products until demand reaches a level that economically justifies extensive capital expenditures.
In 2010, we implemented an export control programme to ensure that our supply chain fully corresponds to the legal requirements. We conduct reviews at least once every year at all NORMA Group sites in order to rule out that we supply legally sanctioned third parties. These reviews have so far all confirmed our compli-ance.
Since our plants in Europe export a considerable amount of mer-chandise, we have optimised our customs processes and been certified as an Authorised Economic Operator (AEO). We already obtained an Authorised Economic Operator – Customs Simplifi-cations certificate (AEO-C) for our German plants in 2010/2011. In December 2012, we applied for a full Authorised Economic Operator – Customs Simplifications/Security and Safety certifi-cate (AEO-F) for our plant in the Czech Republic. In 2013, we will apply for AEO-F certificates for our Polish, French, Swedish and British plants. Furthermore, our plant in Michigan, USA, will sub-mit a Customs and Trade Partnerships against Terrorism (C-TPAT) application in 2013.
We are constantly working to reduce delivery times and optimise our supply chain and freight and customs costs as well as to minimise the effects on the environment. We strictly implement-ed the principle of direct delivery in the last three years, focusing on:
relocating production to plants near our customers direct deliveries to customers, bypassing additional shipping
points.
PROJECtS iN 2012
Newbury, United Kingdom Begin of expanding our capacities
Tagelswangen, Switzerland Additional capacities due to the acquisition
Riese Pio X, Italy Additional capacities due to the acquisition
Moscow, Russia Completion of our externally operated distribution centre
Juarez, Mexico Outsourcing the production of certain clamps from the USA
Wujin, China Start with the construction of a new plant
Quingdao, China Outsourcing the production of certain clamps from the USA
Pune, India Completion and relocation to our new plant
Ipoh, Malaysia Additional capacities due to the acquisition

NORMA Group AG Annual Report 201278
The volumes and destinations of our exports both to customers as well as to NORMA Group sites are subject to ongoing chang-es that we regularly analyse. These can be traced back to cus-tomer activities as well as programmes such as direct delivery. Therefore, we enter into annual agreements with freight and lo-gistics service providers that process the deliveries in the best possible manner for us and thereby help us to optimise our costs and delivery times.
Purchasing and supplier management
Organisation of a global group purchasing structureWe have built up an efficient, worldwide group purchasing struc-ture in the past year in order to supply the most important prod-uct areas with steel, metal components, polyamides and rubber materials as competitively as possible, taking advantage of the Group’s corresponding economies of scale while taking the im-portance of material costs for NORMA Group into account.
Various material price trendsPrice development varied considerably for our most important raw materials in 2012. The base prices of steel and metal were stable or we were able to secure slight price reductions. The alloy surcharges for stainless steel decreased successively after re-maining steady in the first quarter of 2012, only to stabilise again during the last quarter. In contrast, granulated material (polyam-ides) for our injection-moulded and extruded products continued to be characterised by rising cost prices. This can be attributed in particular to the rising price of raw materials to manufacture polyamide granules.
Our granule and fluid group purchasing programme was also confronted with major challenges as a result of an accident with far-reaching consequences at one of our input material suppliers of high-performance polyamides starting at the end of March 2012. As a result of a fire at a primary materials production facil-ity for PA12 granule manufacturing, the availability of an input material for PA12 granule production was severely limited world-wide. We were able to bridge the PA12 suppliers’ force majeure situation, which lasted for months, without impacting our ability to supply our customers thanks to immediately implemented countermeasures with release of alternative materials, long-term supply contracts and the faithful and cooperative collaboration with our most important granule suppliers.
In total, material costs increased from EUR 262.3 million in 2011 to EUR 263.5 in 2012. This increase can also be explained by the integration of the companies acquired in 2012 and by new cus-tomer orders. In fact, the cost of materials ratio dropped from 45.1% in 2011 to 43.6% in 2012 as a result of the improved worldwide purchasing organisation and falling raw materials prices, in particular the alloy surcharges.
Expansion of global procurement and increased localisation of materials purchasesIn 2012, we continuously worked on a competitive expansion of our supplier basis on the global procurement markets. For in-stance, we identified new suppliers in important product seg-ments, then developed and successively integrated them in our series production. This ensures the long-term international com-petitiveness of our material costs. We follow the BLC approach (Best Landed Cost) when choosing new suppliers, which also takes logistics and changes in inventory costs into account. Our
Other 31
49 Steel & stainless steel
Granules, plastic & rubber
20
UTILISATION OF RAW MATERIALS BASED ON THE MOST IMPORTANT PRODUCT GROUPS
in %
MATERIAL COSTS WITH COST OF MATERIALS RATIO
in EUR million
2012
263.5
2011
262.3300
200
100
0
43.6%45.1%

79Further InformationConsolidated Financial StatementsConsolidated Management ReportManagement Board Letter To Our Shareholders
Production and supply chain management
Purchasing and supplier management
Sales and marketing
Asian subsidiaries, in particular, were successful in increasing the localisation of materials procurement, since they were able to reduce logistics costs and currency risks (natural hedging).
By setting up an intensive and periodic reporting and communi-cation system between Group and local purchasing teams, the qualification of local, highly competitive sources of materials can represent the first step in a supplier development process that will subsequently also be used for other NORMA Group compa-nies (Best Practice Approach).
Security through long-term contractsIn the area of energy, we have secured the majority of our en-ergy requirements at competitive prices (gas, electricity) for our German branch offices and most of our European companies by entering into appropriate, long-term contracts.
At the beginning of the year, the area of packaging materials was characterised by the rising commodity price trend, but we were able to avoid this trend by optimising our supplier structure and drawing up long-term supplier contracts.
Sales and marketing
SALES
In total, we supply more than 10,000 customers around the world. In the EJT unit, we work together with approximately 900 customers with whom we generally also conduct mutual devel-
opment projects. Please refer to the Section on research and development starting on page 70. However, we only generate approximately 19 % of our sales with our Top 5 customers; as a result, we are not dependent on any one customer.
While our EJT customers primarily work together with our sales engineers and our application development department, we serve our customers in the DS unit either through our own sales employees in the respective subsidiaries and/or distribution cen-tres or in some cases also through sales representatives.
We have had trusting and cooperative relationships with many of our customers for many years. For example, we were award-ed with the supplier prize of Würth Industrie Service GmbH & Co. KG in the category of “Stable Business Relationship” in 2012.
We have introduced the new customer management system eCRM as part of a project to increase the efficiency of our sales department. With the help of this system, we intend to improve our assessment of market information and internal processes and utilise the resulting increased transparency to focus even more closely on our customers and their requirements.
MARkEtiNG
Our marketing activities serve to support our product sales and further bolster our brand image worldwide. In 2012, our market-ing expenses amounted to EUR 2.1 million and were thus flat compared to 2011. Around 50 % can be attributed to general marketing activities and brand communication and around 50 % to product communication.
50general
marketing + brand communication
50 product communication
MARkEtiNG ACtivitiES
in %

NORMA Group AG Annual Report 201280
In 2012, we were represented at 17 trade fairs with our own booth and presented our products and joining solutions for the various industries that we supply. Among other things, we participated for the first time in the ILA Berlin Air Show, where we presented our latest developments for the aviation industry.
One of our most important marketing campaigns centred on the second generation of our SCR fluid lines (Selective Catalytic Re-duction) to reduce emissions, which we introduced to the market in 2011.
Sustainability
CORPORAtE RESPONSiBiLity (CR)
We regard bringing the effects of our operations in line with the expectations and needs of the Company as a core responsibil-ity. Therefore, we base our decisions on the principles of respon-sible corporate governance and sustainable action.
The global megatrends resulting from climate change present us with a special challenge as a manufacturer of innovative joining technology and the business partner of companies from various industries. We are meeting this challenge with solutions that pro-vide ways to increase the efficiency of resources and energy. Together with our business partners, we are making a contribu-tion to increase the Company’s social and ecological sustain-ability. This is both a challenge and an incentive for us.
New CR strategyIn 2012, we initiated a process to integrate corporate responsibil-ity into the business strategy. We intend thereby to evaluate all business decisions based on their effects on the environment, the Company and future generations. A strategy for corporate responsibility is also a tool for us to secure our excellent market position and technological leadership for the long term.
For this purpose, a CR steering committee was established and is headed by the CEO Werner Deggim. Its objective is to establish the Company’s basic philosophy and set long-term corporate responsibility goals. The CR steering committee developed an initial approach to corporate responsibility in the autumn of 2012. A CR roadmap will guide the implementation of CR measures within NORMA Group. It is to be resolved in the first half of 2013.
Five CR fields of actionNORMA Group has systematised CR measures in five fields of action. The relevant departments are responsible for their imple-mentation. Two CR coordinators who report directly to the CEO were appointed for cross-departmental functions.
Responsible business practices: Corporate responsibility must be practiced by all of NORMA Group’s employees. This requires clear instructions and guidelines. Our compliance is an essential principal. Please refer to the Corporate Gover-nance report, in particular our comments on compliance start-ing on page 38.
Products and services: We offer our business partners prod-uct solutions that make the use of liquid and gaseous sub-stances cleaner, safer and more efficient. In this manner, we help to reduce the consumption of energy and emissions that are harmful to the climate. You can find more details on this in the Section entitled “Group structure and operations” on pag-es 50 to 56.
Employees: Our employees enable and drive our business success. We consider health promotion and occupational safety to be core areas of responsibility. We intend to strength-en our position as a top employer through a supportive cor-porate culture. Please refer to the Section entitled “Occupa-tional health and safety” below as well as the Section entitled “Employees” on page 73 for more information.
Environment: We take our dependency on the environment into account. Therefore, we improve the efficient use of en-ergy and other natural resources at our sites and in our logis-tics activities. We help our business partners meet future en-vironmental standards with our joining technology. We present our Group-wide environmental policy and management sys-tem on the pages below.
Company: NORMA Group benefits from a local environment that is dynamic and worth inhabiting. In 2013, we will develop a corporate citizenship programme to be implemented inter-nationally. This programme is intended to systematically strengthen the local neighbourhoods and contribute to re-gional development.
dialogue and transparencyWe understand that our responsibility includes a continuous dia-logue with interest groups that influence our business activities or are influenced by them. This includes in particular our employ-ees and shareholders, customers and suppliers, our sites and the society as a whole. We wish to transparently present informa-tion regarding our CR activities. Suggestions to further develop our CR strategy are to be gathered through a dialogue process.
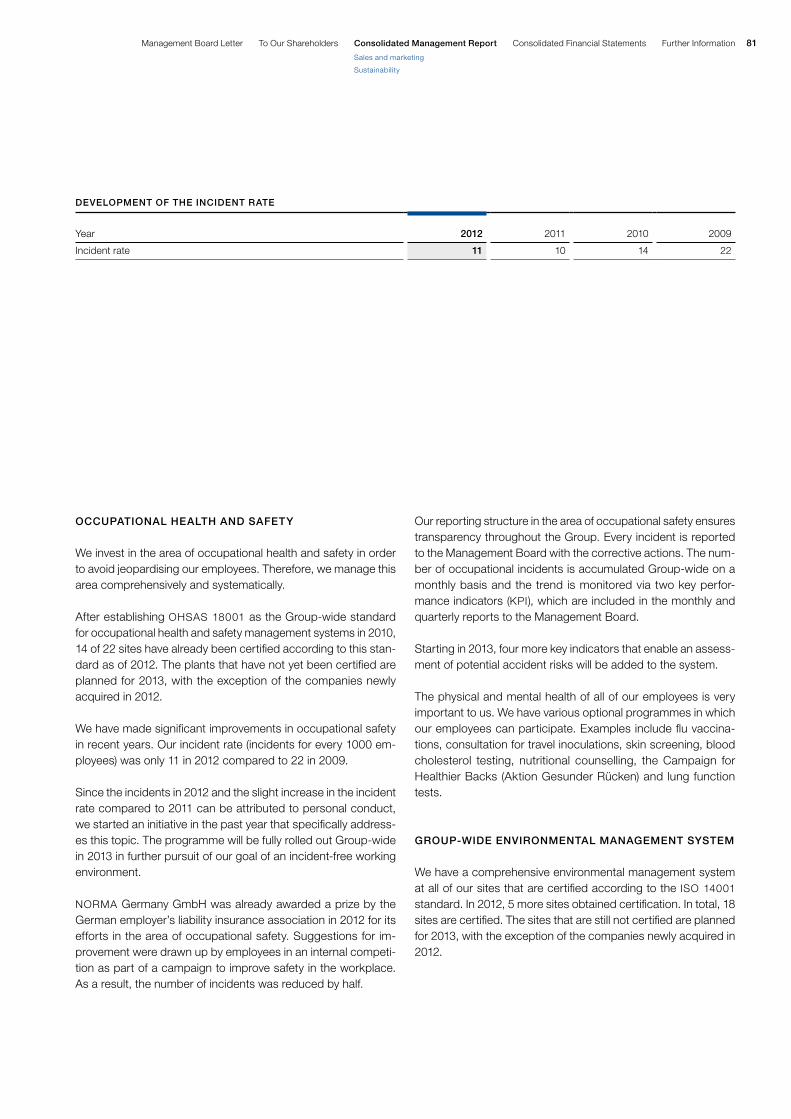
81Further InformationConsolidated Financial StatementsConsolidated Management ReportManagement Board Letter To Our Shareholders
Sales and marketing
Sustainability
OCCuPAtiONAL hEALth ANd SAFEty
We invest in the area of occupational health and safety in order to avoid jeopardising our employees. Therefore, we manage this area comprehensively and systematically.
After establishing OHSAS 18001 as the Group-wide standard for occupational health and safety management systems in 2010, 14 of 22 sites have already been certified according to this stan-dard as of 2012. The plants that have not yet been certified are planned for 2013, with the exception of the companies newly acquired in 2012.
We have made significant improvements in occupational safety in recent years. Our incident rate (incidents for every 1000 em-ployees) was only 11 in 2012 compared to 22 in 2009.
Since the incidents in 2012 and the slight increase in the incident rate compared to 2011 can be attributed to personal conduct, we started an initiative in the past year that specifically address-es this topic. The programme will be fully rolled out Group-wide in 2013 in further pursuit of our goal of an incident-free working environment.
NORMA Germany GmbH was already awarded a prize by the German employer’s liability insurance association in 2012 for its efforts in the area of occupational safety. Suggestions for im-provement were drawn up by employees in an internal competi-tion as part of a campaign to improve safety in the workplace. As a result, the number of incidents was reduced by half.
Our reporting structure in the area of occupational safety ensures transparency throughout the Group. Every incident is reported to the Management Board with the corrective actions. The num-ber of occupational incidents is accumulated Group-wide on a monthly basis and the trend is monitored via two key perfor-mance indicators (KPI), which are included in the monthly and quarterly reports to the Management Board.
Starting in 2013, four more key indicators that enable an assess-ment of potential accident risks will be added to the system.
The physical and mental health of all of our employees is very important to us. We have various optional programmes in which our employees can participate. Examples include flu vaccina-tions, consultation for travel inoculations, skin screening, blood cholesterol testing, nutritional counselling, the Campaign for Healthier Backs (Aktion Gesunder Rücken) and lung function tests.
GROuP-widE ENviRONMENtAL MANAGEMENt SyStEM
We have a comprehensive environmental management system at all of our sites that are certified according to the ISO 14001 standard. In 2012, 5 more sites obtained certification. In total, 18 sites are certified. The sites that are still not certified are planned for 2013, with the exception of the companies newly acquired in 2012.
dEvELOPMENt OF thE iNCidENt RAtE
Year
2012
2011
2010
2009
Incident rate 11 10 14 22

NORMA Group AG Annual Report 201282
In order to protect the environment, we invest in the reduction of harmful emissions and resource utilisation, among other things, in product development, for building construction and work pro-cesses.
Many of our products contribute to the reduction of emissions from engines and vehicles. Examples include the second gen-eration of our fluid systems to reduce nitrogen oxides in exhaust in combustion engines, and the latest generation of V-band clamps, which provide even greater sealing integrity for flanged joints in exhaust systems ahead of the catalytic converter.
We are constantly working to further optimise our production processes and reduce our local energy needs through waste prevention and productivity initiatives. For example, in 2012, we were able to significantly reduce power consumption at our 10 largest production facilities compared to 2011. Among other things, the use of more energy efficient assembly machines and lighting in the production plants was an important factor. Plans have been initiated to use more efficient lighting at other sites.
By reprocessing detergent solutions that are used to clean pro-duction components, we significantly reduced not only waste but also the use of new detergents in our plant in Pennsylvania. The same applies for cooling fluids and machine oils.
With respect to sustainability, we also focus on areas that are not core to manufacturing. The existing company car guidelines in Germany, which take fuel consumption into consideration, are being updated. Products destined for maritime transport are car-ried to harbour by train. We were able to offset 8.6 tons of CO2 in Germany within 8 months through the use of a carbon dioxide-neutral parcel service.
Sustainability is an important element of our future company strategy. This includes our suppliers, who are required to set up an environmental management system or further develop their existing system. Our goal is to minimise the effects on the envi-ronment through efficient products and processes. A Group-wide reporting tool to record and track our use of resources, emissions and waste to be activated in 2013 will support us in our efforts to promptly record and track results.
Risk and opportunity report
All entrepreneurial activity involves opportunities and risks. Be-cause of this, we use an effective opportunity and risk manage-ment system to increase long-term shareholder value.
NORMA Group’s corporate group is exposed to a wide variety of risks and opportunities which can have a positive or negative short-term or long-term impact on its financial position and per-formance. We define risks as the possibility of disadvantageous future developments, changes, or events that could have a neg-ative impact on the Group’s ability to meet its targets and achieve its business objectives.
Entrepreneurial opportunities are identified during annual opera-tional planning and monitored throughout the year within the framework of periodic reporting and regular forecasts. Moreover, under the Global Excellence programme, opportunities and pos-sibilities for improvement are identified early, consolidated and managed globally. This enables us to realise consistent increas-es in productivity and cost-savings, thereby systematically in-creasing the value of the business. We define opportunities as the possibility of advantageous future developments, changes, or events that could have a positive impact on the Group’s abil-ity to meet its targets and achieve its business objectives.
RiSk MANAGEMENt SyStEM
The Management Board of NORMA Group AG is responsible for maintaining an effective Group risk management system, which has essentially not changed since the previous year. The Super-visory Board is responsible for monitoring the effectiveness of the Group risk management system. Checking compliance with the Group’s internal risk management rules is also integrated in the internal audit department’s periodic reviews.
NORMA Group’s risk management system is a Group-wide re-sponsibility that starts with the expertise of each local business unit. In addition, risks across the Group are identified and as-sessed separately. The elements used to ensure that NORMA Group has an effective risk management system include:
Risk identification and risk assessment Risks are identified early by monitoring and analysing the eco-
nomic climate and the markets that are relevant for NORMA Group, and through the early identification and assessment of developments that could lead to risks.
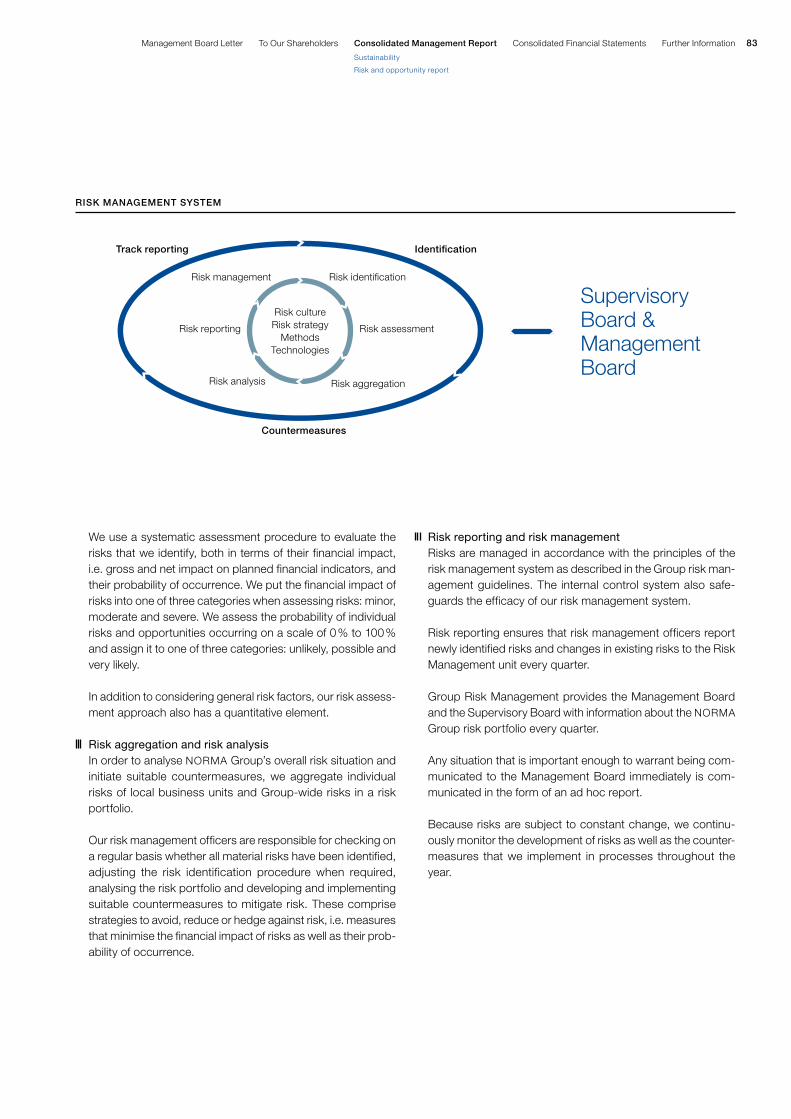
83Further InformationConsolidated Financial StatementsConsolidated Management ReportManagement Board Letter To Our Shareholders
Sustainability
Risk and opportunity report
We use a systematic assessment procedure to evaluate the risks that we identify, both in terms of their financial impact, i.e. gross and net impact on planned financial indicators, and their probability of occurrence. We put the financial impact of risks into one of three categories when assessing risks: minor, moderate and severe. We assess the probability of individual risks and opportunities occurring on a scale of 0 % to 100 % and assign it to one of three categories: unlikely, possible and very likely.
In addition to considering general risk factors, our risk assess-ment approach also has a quantitative element.
Risk aggregation and risk analysis In order to analyse NORMA Group’s overall risk situation and
initiate suitable countermeasures, we aggregate individual risks of local business units and Group-wide risks in a risk portfolio.
Our risk management officers are responsible for checking on a regular basis whether all material risks have been identified, adjusting the risk identification procedure when required, analysing the risk portfolio and developing and implementing suitable countermeasures to mitigate risk. These comprise strategies to avoid, reduce or hedge against risk, i.e. measures that minimise the financial impact of risks as well as their prob-ability of occurrence.
Risk reporting and risk management Risks are managed in accordance with the principles of the
risk management system as described in the Group risk man-agement guidelines. The internal control system also safe-guards the efficacy of our risk management system.
Risk reporting ensures that risk management officers report newly identified risks and changes in existing risks to the Risk Management unit every quarter.
Group Risk Management provides the Management Board and the Supervisory Board with information about the NORMA Group risk portfolio every quarter.
Any situation that is important enough to warrant being com-municated to the Management Board immediately is com-municated in the form of an ad hoc report.
Because risks are subject to constant change, we continu-ously monitor the development of risks as well as the counter-measures that we implement in processes throughout the year.
RiSk MANAGEMENt SyStEM
Risk cultureRisk strategy
MethodsTechnologies
Risk management
track reporting
Countermeasures
identification
Risk reporting
Risk identification
Risk assessment
Risk aggregationRisk analysis
Supervisory Board & Management Board

NORMA Group AG Annual Report 201284
RiSkS
Strategic and operating risksRisks to the national and global economy The corporate group’s business environment is affected by inse-curity in the global political and economic environment. At the beginning of 2013, the macroeconomic environment is still char-acterised by uncertainty and volatility, which in turn can have a negative effect on NORMA Group’s operations. Although the positive signals for a stabilisation and moderate recovery of the global economy are increasing, the unresolved sovereign debt crisis in Europe as well as the budget discussions in the USA continue to impact the economy. Therefore, we still expect eco-nomic output to decrease, in particular in Europe. Nevertheless, we expect the global economy to grow in 2013 – albeit barely – compared to the previous year, although growth will vary from region to region. As a result of the continuous expansion of our global presence, in particular in emerging markets, which con-tinue to grow robustly, and the increasingly regional production (see Section entitled “Production and supply chain manage-ment” on page 76) as well as a result of our continuous efforts to optimise costs (Global Excellence), we can limit the risk of a regional decrease in demand. Therefore, we consider it possible for unfavourable macroeconomic developments and declines in demand for economic reasons to have a negative impact on NORMA Group’s business; the resulting financial effects would be moderate.
Industry-specific and technological risksIndustry-specific risks can arise for NORMA Group in particular due to technological and competitive changes. The increasing importance of new technologies, such as environmentally friend-ly drivetrain technologies, could also lead to increased compet-itive pressure and greater price pressure. We counter these risks with continuous initiatives to safeguard and expand our position as a technological and innovative leader as well as by focusing on customers and markets. This way we can effectively support our customers in the reduction of emissions, leakage, weight, space and installation time and help them achieve a process-optimised production through compatibility with modularised production processes as well as by reducing installation time (see Section on research and development on pages 70 to 73). Our strong diversification in terms of customers in different in-dustries is another element of our risk minimisation strategy. We attempt to minimise long-term industry-specific and technologi-cal risks with a consistent policy of innovation and regular mon-itoring of the market. As a result, we consider it unlikely that in-dustry-specific or technological risks will occur. We consider the potential financial effects to be minor.
Strategic risksMisjudgement with respect to the corporate group’s strategic orientation and its market potential or customer rejection of newly developed products can have a negative effect on NORMA Group’s competitive position and sales volume. In order to avoid strategic risks, we work closely together with our customers across all business processes. New products are created al-ready in the product and application development phases in constant coordination with our customers. Our two distribution channels, Engineered Joining Technology and Distribution Ser-vices, are also oriented on the special needs of our customers. At the same time, we observe our market environment and our competitors and conduct customer and supplier surveys for con-tinual improvement. In individual cases, market studies are also commissioned. Therefore, we consider strategic risks to be un-likely to occur, whereas the potential financial effects are regard-ed as severe.
Customer risksCustomer risks result from a company being dependent on im-portant buyers for a significant proportion of its sales. They could take advantage of their bargaining power, which can lead to in-creased pressure on our margins. Decreases in demand from these customers or the loss of these customers can have a negative impact on NORMA Group’s earnings. For this reason, we continuously monitor incoming orders and customer behav-iour so as to identify customer risks early. We also have a diver-sified customer portfolio, which reduces the financial repercus-sions of customer risks. Accordingly, no single customer generated more than 6 % of our sales in the 2012 financial year. Therefore, it is possible that customer risks could have a negative impact on our business, but the financial effects would be minor due to our diversified customer structure.
Quality risksOur products are often function-critical with respect to the qual-ity, performance and reliability of the final product. Thus, product quality is a key factor to ensuring NORMA Group’s long-term success, so that our products provide crucial added value for our customers. Maintaining the right balance between cost lead-ership and quality assurance is a constant challenge. We use far-reaching quality assurance measures and Group-wide qual-ity standards to reduce this risk, and also focus on innovative and value added joining solutions tailored to meet customer require-ments. For this reason, we believe that it is possible for quality risks to occur, while the potential financial repercussions would be minor due to our existing insurance coverage.

85Further InformationConsolidated Financial StatementsConsolidated Management ReportManagement Board Letter To Our Shareholders
Risk and opportunity report
Risks from commodity price increasesThe materials we use, in particular the raw materials steel and plastics, are subject to the risk of price fluctuations. The price trend is also influenced indirectly by the further development of the debt crisis as well as by institutional investors. NORMA Group limits the risk of rising commodity prices through systematic ma-terial and supplier management. In this context, an efficient, group purchasing structure was built up around the world in order to utilise the Group’s economies of scale in the procure-ment of the most important product areas of steel, metal com-ponents, polyamides and rubber materials and to procure them as competitively as possible. We also constantly strive to secure permanently competitive procurement prices by continuously optimising our selection of suppliers and applying the BLC ap-proach (see Section on purchasing and supplier management on page 78). We also try to reduce dependency on individual materials through constant technological advances and tests of alternative materials. We protect ourselves against commodity price volatility by forming procurement contracts with a term of up to 12 months, whereby material supply risks are minimised and price fluctuations can be better calculated. We may con-sider it possible for procurement prices to rise, but this would only have a minor financial effect as a result of the countermea-sures initiated in the financial year just ended.
Risks related to loss of supplier and dependence on key sup-pliersThe loss of suppliers and increasing dependency on suppliers can lead to material shortages and thus to negative impacts on the Group’s activities. In order to minimise this risk, we only work with reliable and innovative suppliers who meet our quality re-quirements. We visit and evaluate our main suppliers on a regu-lar basis for quality management purposes. If the loss of a sup-plier appears imminent, we evaluate alternatives immediately. In financial year 2012, we maintained our ability to deliver, despite the shortage of an important input product for PA12 granule manufacturing by immediately initiating countermeasures. As a result, we consider it possible that we may lose suppliers and continue to regard the potential financial impact as moderate.
Personnel risksOur success is largely dependent on our employees’ enthusi-asm, commitment to innovation, expertise and integrity. The Group’s personnel management serves to retain and expand this core expertise. The exit of employees with crucial skills as well as a shortage of suitable workers can have a negative impact on our operations. The competition for the most talented employees as a result of demographic developments and the shortage of skilled labour in Western industrial nations is becoming more and more intense. We counter these risks with far-reaching basic and
advanced training as well as employee development pro-grammes. We also encourage our employees to focus on the Company’s success through variable remuneration systems. Our employees can also be involved in the continuous improvement of NORMA Group by participating in employee surveys. For this reason, we believe that it is possible for personnel risks to occur, while the potential financial repercussions would be minor as a result of the implemented countermeasures.
IT risksMaintaining and exchanging complete, timely and appropriate information as well as being able to utilise functional and power-ful IT systems are of central importance for an innovative and global company such as NORMA Group. An extensive com-puter system failure could disrupt our operations or expose sen-sitive corporate information. Therefore, we have implemented appropriate measures to avoid and reduce this type of risk. These measures are collectively embedded in our IT risk man-agement process and are adjusted in this context to changing conditions. NORMA Group counters identifiable IT risks, for ex-ample, by mirroring the database, maintaining decentralised data and outsourcing data archiving to a certified external provider. The Group’s data processing centre in Frankfurt / Main is also used by other Group companies for their ERP systems. Another data centre is located in the USA, with smaller backup systems in Asia, which were transferred to a regional data centre in Sin-gapore in 2012. The step-by-step transition from older ERP sys-tems to new systems used throughout the Group can also con-tribute to increasing the efficiency of NORMA Group’s processes. In order to minimise implementation risk as well as due to the complexity, we only rely on partners that are certified by the manufacturer to introduce the new ERP systems. The access of employees to sensitive information is ensured by means of au-thorisation systems customised for the respective positions, tak-ing into account the principle of separation of functions. IT sys-tems used in the area of production are being doubled in order to reduce risks. Potential risks are also taken into account through early planning as well as by creating suitable transition solutions. For this reason, we believe it is possible for IT risks to occur and still consider the potential financial repercussions to be minor.
Legal risksSocial and environmental risksViolating social and environmental standards could damage the reputation and the efficiency of NORMA Group. Therefore, we have implemented corporate responsibility as an integral part of our Group strategy. In this context, a systematic environmental management system was introduced in NORMA Group so that corporate decisions can always be evaluated also considering

NORMA Group AG Annual Report 201286
the goal of avoiding emissions and conserving resources. We also invest in the area of occupational health and safety (see Section on Sustainability on pages 80 to 82). Consequently, we believe that negative developments remain unlikely to occur as a result of social and environmental risks and that the potential financial effects would be moderate.
Risks related to violations of intellectual property rightsNORMA Group’s position as a technology and innovation leader means that violations of our intellectual property rights could lead to lost sales and reputation. For this reason, we ensure that our technologies and innovations are legally protected. We also mi-nimise the potential impact by developing customer-specific so-lutions and through the speed of our innovation. Therefore, we consider it possible for our intellectual property to be violated. Due to the countermeasures that we have implemented, we be-lieve that the potential impact of an intellectual property violation would be minor.
Risks related to violations of standardsFuture changes to legislation and requirements in general com-mercial law, liability law, environmental law, tax law, customs law and labour law, as well as changes in related standards, could have a negative impact on NORMA Group’s development. We use our existing compliance and risk management systems to ensure that we comply with constantly changing laws and regu-lations. Please refer to the comments on compliance in the cor-porate governance report on page 38 for more information. Con-sequently, we consider risks related to violations of intellectual property rights as unlikely to occur and the potential financial impact to be moderate.
Any legal risks of which we are aware are taken into account through provisions recognised in the consolidated financial state-ments. We are not aware of any other significant risks.
Financial risksDue to the nature of our business, we are exposed to an array of financial risks, including default, liquidity and market risks. Due to the unpredictability of the financial markets, the Group’s finan-cial risk management strategy concentrates on the identification, evaluation and mitigation of risks, focusing on minimising the potential negative impact on the Company’s financial perfor-mance. We use derivative financial instruments to hedge par-ticular risk items. The financial risk management strategy is im-plemented by Group Treasury. Group management defines the areas of responsibility and necessary controls related to the risk management strategy. Group Treasury is responsible for defin-ing, evaluating and hedging financial risks in close consultation with the Group’s operating units.
Capital risk managementNORMA Group’s objectives when it comes to managing its cap-ital are the long-term servicing of its debts and remaining finan-cially stable. We are obliged to maintain certain financial indica-tors (financial covenants), such as interest cover ratio, total net debt cover (debt divided by adjusted consolidated EBITDA) and consolidated equity as a percentage of assets, which is continu-ously monitored.
As part of our capital risk management, we monitor net debt in all our accounts, which are managed in accordance with ac-cepted accounting principles.
Default risksDefault risk is the risk of our contractual partners not meeting their obligations arising from business and financial transactions. Default risk results from deposits and other transactions con-cluded with credit and financial institutions, and primarily from the risk of customers defaulting on outstanding receivables or confirmed transactions. We review the creditworthiness of new customers to minimise the risk of default on trade receivables. In addition, we generally only supply customers whose credit rat-ings are below Group standards or who have defaulted on pay-ment if they pay in advance. We have a diversified customer portfolio, which reduces the financial repercussions of default risks. For this reason, we believe that it is possible for default risks to occur, while the potential financial repercussions would be minor due to the implemented countermeasures.
Liquidity risksPrudent liquidity risk management requires us to hold sufficient cash funds and marketable securities, have sufficient financing from committed lines of credit and be able to close out market positions. Due to the dynamic nature of the underlying business, Group Treasury aims to maintain flexibility in financing by keeping committed credit lines available. Therefore, our primary objective is to ensure the uninterrupted solvency of all Group companies. Group Treasury is responsible for liquidity management and therefore for minimising liquidity risks. As at 31 December 2012, NORMA Group’s liquid assets amounted to EUR 72.4 million (31 December 2011: EUR 67.9 million). We also have a high level of financial flexibility thanks to a total of EUR 125 million in commit-ted revolving credit lines with national and international credit institutions. These lines were drawn down in the amount of EUR 18.5 million as at 31 December 2012.
In addition, the operational flexibility for NORMA Group’s strate-gic further development was further optimised in collaboration with our banks at the beginning of the fourth quarter of 2012. In this context, a total acquisition limit of EUR 200 million was agreed during the loan period. Furthermore, an expansion of the
87Further InformationConsolidated Financial StatementsConsolidated Management ReportManagement Board Letter To Our Shareholders
Risk and opportunity report
possible financing instruments was agreed. NORMA Group is now in a position to raise funds also outside the existing loan agreements of up to EUR 125 million via the external capital market. The original collateral concept was cleared for this.
The Group’s financing agreements still contain typical terms for credit lines (financial covenants). If we do not adhere to these terms, the banks would be entitled to re-evaluate the agreements and demand early repayment.
For this reason, we continuously monitor our compliance with the financial covenants, so that we can implement suitable mea-sures in advance to prevent the terms from being violated.
We were able to further minimise the likelihood of liquidity risks negatively impacting NORMA Group’s operations by increasing our financial flexibility compared to the previous year. In our view, non-compliance with financial covenants remains unlikely due to our high profitability and strong operating cash flow. Failure to comply with these financial covenants would have severe poten-tial financial repercussions.
Market risks(i) Currency risks As an international company, we are active in 100 different
countries, which exposes us to foreign currency risks. We regard our main risky currency positions to be the US dollar, British pound, Chinese renminbi, Polish zloty, Czech koruna and Swedish krona.
The acquisition of Connectors Verbindungstechnik, Switzer-land, as well as Chien Jin Plastic, Malaysia, which execute their operations largely in their local currency, increases the influence of changes in the exchange rate of the Swiss franc and Malaysian ringgit to the euro on NORMA Group’s operat-ing activities. However, due to the expected contribution to NORMA Group’s total sales, we expect that the resulting for-eign currency effects will be comparatively moderate.
Foreign currency risks that cannot be offset against each other are hedged using futures and options whenever neces-sary (including the US dollar, Swedish krona, Japanese yen and British pound). The high volatility of many major currencies and the particular influence of the US dollar on the Group’s financial position and performance represent a significant risk that can only be partially hedged for a short-term period. We reduce the medium-term risk through continuous cost optimi-sation initiatives (Global Excellence programme) and an in-creasingly regional approach to production.
Because the Group’s subsidiaries operate in the most impor-tant countries with currencies other than the euro, it has suf-ficient cash-in and cash-out capabilities to absorb short-term exchange rate fluctuations via targeted income and expendi-ture management, i.e. our operating business gives us suffi-cient capability to control foreign currency flows.
The net assets of the Group’s foreign companies are also ex-posed to currency risks. Translation effects from items in the statement of financial position and income statement of sub-sidiaries in foreign currency areas on the consolidated state-ment of financial position prepared in euros are unavoidable.
Currency risks are very likely to occur due to the ongoing ex-change rate volatility as a result of the sovereign debt crisis. In addition, the expected rising share of our business activities in foreign currency areas, in particular in emerging markets, signifies additional currency risk for NORMA Group. Conse-quently, we believe the currency risk has increased. We regard the potential financial effects of currency risks to be severe.
(ii) Interest change risk Changes in global market interest rates affect future interest
payments for variable-interest liabilities and can therefore have an adverse effect on the Group’s financial position, financial performance and cash flows. NORMA Group’s interest change risk arises in particular from long-term loans.
As a result of the considerable reduction in financial liabilities in recent years, interest change risk has also decreased no-ticeably. Variable interest rate commitments are hedged by means of derivative interest rate instruments. Due to the per-sistently low interest rate level, the portion of financial liabilities hedged via an interest rate cap was completely fixed at more favourable terms by means of interest rate swaps in the first quarter of 2012. As a result, NORMA Group’s interest change risk further decreased compared to the end of 2011.
In order to further reduce interest change risks, we intend to use excess cash flow from operating activities in the medium term to limit the debt/equity ratio or to reduce our net financial liabilities. We will aim to hedge approximately 80 % of the inter-est change risk arising from future medium-term utilisation of the committed revolving credit facility.
Due to the currently low interest rate level, we consider the likelihood that interest rates will rise in the medium-term to be very high; however, the financial effects will be minor and de-creasing year-on-year due to NORMA Group’s significantly optimised financing structure.

NORMA Group AG Annual Report 201288
OPPORtuNitiES
Beneficial economic developmentsThe sales and profitability of the Group are influenced by the economic and political climate. If the economic recovery is better than expected or there are advantageous changes to legislation, this can have a positive impact on NORMA Group’s sales and profitability. Because we serve customers from a wide range of industrial sectors, we have an opportunity as a result of this high diversification to participate in the growth of various industries.
technological change and climate protectionGlobal megatrends, for example “green” technologies, present a challenge to many of our customers and their finished products and offer excellent growth prospects for NORMA Group. There-
fore, we concentrate our product development on these innova-tion opportunities. The automotive industry is also putting more and more emphasis on both low-emission engines and alterna-tive power concepts, such as hybrid and electric engines. We expect additional political regulatory measures and incentive programmes to be drafted in some countries, which will lead to higher demand for environmentally friendly technologies and products. We have already secured additional order potential and thus participate in the development of these markets as a result of the challenging developments in these areas. In addi-tion, the transfer of alternative or low-emission power concepts to other regions and markets (e.g. shipbuilding, stationary gen-erators, construction equipment) offers additional opportunities for growth.
RiSk ASSESSMENt ANd RiSk CONSEquENCES
Risk
Probability of occurring
Financial effects
Unlikely
Possible
Very likely
Change
compared to 2011
Minor
Moderate
Severe
Change
compared to 2011
Strategic and operating risks
Risks related to national and global economy
• •
Industry-specific and technological risks • •
Strategic risks • •
Customer risks • •
Quality risks • •
Risks from rising commodity prices • •
Risks related to loss of supplier • •
Personnel risks • •
IT risks • •
Legal risks
Social and environmental risks • •
Risks related to violations of intellectual property rights
• •
Risks related to violations of standards • •
Financial risks
Default risks • •
Liquidity risks • •
Currency risks • •
Interest change risk • •
unchanged higher lower
89Further InformationConsolidated Financial StatementsConsolidated Management ReportManagement Board Letter To Our Shareholders
Risk and opportunity report
Growth potential in emerging marketsEmerging markets are also expected to continue to grow con-siderably faster than industrialised nations in coming years. In order to be able to participate in these growth opportunities, NORMA Group has already taken additional corresponding steps in the financial year just ended. These include expanding production capacities in China and India and opening a distribu-tion centre in Russia. In the future, we also want to take corre-sponding steps to continuously expand our sales, market share and market presence in the BRIC countries (Brazil, Russia, India and China) and other emerging markets.
Consistent optimisation of production processes and cost structuresWe take every opportunity to realise cost advantages to improve our competitive position. We develop and implement initiatives focused on cost discipline, the continuous improvement of pro-cesses in all functions and regions and optimisation of supply chain management and production processes. We expect these initiatives to have a positive impact on our business.
Growth opportunities through increased commitment to innovationWe invest around 4 % of EJT sales in research and development every year. We are consolidating our competitive position as a technology leader and increasing NORMA Group’s innovative capacity as a result of this focus on developing new technolo-gies, products and solutions, as well as on improving existing ones, and can thereby realise cost advantages in the medium term. At the same time, this also opens up new growth oppor-tunities.
Growth opportunities through acquisitions, openings and expansionNORMA Group’s global presence is an essential factor contribut-ing to its success, as it allows us to participate in global growth opportunities. The goal is to expand our presence in existing markets as well as to develop new emerging markets with attrac-tive growth potential. In this context, we are pursuing a strategy of organic growth and targeted acquisitions. As a result of our global orientation, we can also locate production processes that entail a more labour-intensive assembly to countries with lower wage costs, thereby securing or further increasing our profit-ability.
As a result of the acquisition of Connectors Verbindungstechnik AG, Switzerland, on 19 April 2012, we expect to develop new market potential in the traditional pharmaceutical and biotechnol-ogy segment with its comparatively stable profit margins and expand our product portfolio in this area.
With the acquisition of Nordic Metalblok S.r.l., based in Riese Pio X in Northern Italy, on 12 July 2012, we can further expand our commercial presence and optimally serve the needs of our cus-tomers in Europe. The expertise of Nordic Metalblok S.r.l., in particular with respect to heating, ventilation and air conditioning technology, supplements NORMA Group’s product portfolio.
In November 2012, we acquired an 85 % interest in the manu-facturer of thermoplastic joining systems Chien Jin Plastic Sdn. Bhd. in Malaysia. The company has been active on the market for 20 years and produces joining elements for plastic and cast iron pipe systems that are used in various applications, in par-ticular in drinking water and industrial water supply as well as in sprinkler systems. The company also manufactures components for sanitation products and distributes its products under the “Fish” brand to over 200 distributors in approximately 30 coun-tries worldwide. With this acquisition we are expanding our prod-uct range in the area of infrastructure and also expanding our distribution network in the Asia-Pacific region.
In December 2012, we acquired an additional 60 % interest in Groen Bevestigingsmaterialen B.V., Purmerend, Netherlands. With the 30 % of the Dutch distributor already acquired in 1999, NORMA Group now holds a 90 % interest in Groen. Groen is family-operated and sells hose and pipe clamps as well as cou-plers to industrial companies, the agricultural and construction industry, sanitation manufacturers, the automotive industry and hardware retailers in Belgium, the Netherlands and Luxembourg. In addition, Groen offers a comprehensive product portfolio of traffic sign clamps as well as tools for assembly and disassembly. We increased our interest in Groen in order to further expand our distribution network in the Benelux countries. In addition, the portfolio of traffic sign clamps expands our product range and provides us with access to new customers in this segment.
On 10 January 2013, we acquired the distribution company DavyDick & Co. Pty. Limited (“DavyDick”) in Goulburn, Australia. DavyDick has distributed various elements for the transport of water in irrigation and sprinkler systems for over 20 years. The company supplies over 700 customers in Australia with joining products for irrigation and sprinkler systems as well as valves and pumps under the PUMPMASTER brand, in particular in the agricultural industry as well as in the areas of sanitation and household appliances. The acquisition of DavyDick represents another step towards expanding our operations in the area of water management and improves our infrastructure product portfolio and distribution network, in particular in the areas of agriculture and irrigation in the Asia-Pacific region. Please refer to our Supplementary report on page 99.

NORMA Group AG Annual Report 201290
We also continue to constantly observe the markets for oppor-tunities for strategic acquisitions or equity holdings to comple-ment our organic growth. We use targeted acquisitions to con-tinuously strengthen our position as a technology leader, exploit market opportunities and improve the services we offer our cus-tomers or expand our product range.
NORMA Group placed its production plants in India (Talegaon near Pune) into operation in financial year 2012. We are expand-ing our production capacities with the new 6,500 m² plant to meet the demand for joining elements in India and Asia.
NORMA Group is continuing its course of expansion with a new distribution centre in Moscow and strengthening its distribution network in Russia and Eastern Europe. NORMA Group has dis-tributed its joining products and solutions to local distributors over the distribution centre in Moscow since July 2012. The Company is strengthening its customer relationships in the Rus-sian and Eastern European market with the new site, since the customers benefit from shorter delivery times and greater prod-uct availability.
New capacities to produce V profile clamps were built up at the sites in Newbury in the United Kingdom and Qingdao in China in financial year 2012. The close cooperation between Newbury and Qingdao enables the transfer of know-how in this product segment, thereby providing a global guarantee of the highest quality standards. Our customers in Asia also benefit from short-er delivery times as a result of the increasing regionalisation of our production.
At the beginning of 2012, we opened a new representative office in Ho Chi Minh City (formerly Saigon) in Vietnam. Vietnam quali-fies as one of the next major growth markets in Asia. In the mid-dle of the year, we also opened branch offices in Manila in the Philippines and in Jakarta, Indonesia. With our new representa-tive offices, we are developing new markets in the region in order to introduce our brands there and build up nationwide distribu-tion partnerships.
Our expansions will continue to focus on the Asia-Pacific region and other emerging economies in which we want to significant-ly boost our activities in the future.
Consistent working capital managementOur commitment to growth, the related acquisitions and the in-crease in production volumes as a result of the rise in global demand increase our need for working capital. In addition to guaranteed financing from external banks, we also consistently implement measures to optimise trade working capital in order to improve our liquidity situation.
Beneficial changes on the financial markets Beneficial exchange rate and interest rate changes can have a positive impact on NORMA Group’s financial result. For this rea-son, Group Treasury keeps a close eye on financial market de-velopments. Group Treasury is strictly forbidden from engaging in speculative transactions. Derivative financial instruments may only be entered into if there is a corresponding underlying trans-action.
ASSESSMENt OF thE OvERALL RiSk PROFiLE
The Group’s overall risk situation results from the aggregation of individual risks from all risk categories of the business units and functions. After assessing the likelihood of risks occurring and their potential financial impact as well as in light of the current business outlook, NORMA Group’s management does not be-lieve that there is any individual risk or group of risks with the potential to jeopardise the company’s continued existence as a going concern. In fact, we are well positioned to continue ex-panding our market position and growing globally in the medium to long term. This assessment is reinforced by the good oppor-tunities to cover our financing requirements. Therefore, NORMA Group has not made any effort to obtain a rating from a leading rating agency.
Considerable general economic risks remain, which is why set-backs on the way towards long-term realisation of our growth and profitability targets cannot be ruled out. Compared to the previous year, currency risks and the risk of losing suppliers have increased due to events in the past financial year. In contrast, liquidity risks and interest change risks have further decreased slightly compared to the previous year’s assessment. All other risks have not changed since the previous year.
However, the changes in individual risks do not have a significant impact on NORMA Group’s overall risk profile. Therefore, in our opinion, the Group’s overall risk profile has not changed since the previous year.
iNtERNAL CONtROL ANd RiSk MANAGEMENt SyStEM
ANd thEiR RELAtiON tO thE GROuP ACCOuNtiNG
PROCESS
The relationship between our internal control and risk manage-ment system and NORMA Group’s accounting and external fi-nancial reporting can be described using the following main characteristics. The purpose of this system is to identify, analyse, evaluate and manage risks as well as monitor these activities.

91Further InformationConsolidated Financial StatementsConsolidated Management ReportManagement Board Letter To Our Shareholders
Risk and opportunity report
Forecast
The Management Board is responsible for ensuring that this sys-tem meets the Company’s specific requirements. Based on the allocation of responsibilities within the Company, the CFO is re-sponsible for our Finance and Accounting divisions, which are, in turn, responsible for accounting. These functional areas define and review the Group-wide accounting standards within the Group and compile the information used to produce the con-solidated financial statements. The need to provide accurate and complete information within predefined timeframes represents a significant risk for the accounting process. Because of this, re-quirements must be clearly communicated and the affected units must be put in a position to meet these requirements.
The internal control system of the accounting process is de-signed to provide reasonable assurance that the consolidated financial statements are prepared according to regulations, de-spite the risks identified in the financial reporting process. The Internal Audit department reviews the accounting processes on a regular basis to ensure that the internal control and risk man-agement system is effective. Internal audit measures are also assigned to specialised auditors in order to guarantee their qual-ity. The auditor conducts audit procedures during the audit of the annual financial statements based on the risk-driven audit approach, whereby material errors and violations are to be un-covered with reasonable assurance.
The IFRS accounting system is defined in an accounting manu-al. All companies in the Group must base their accounting pro-cesses on the standards described in the accounting manual. The accounting manual contains binding definitions of important measurement methods, such as those used in the measurement of inventories, tools and receivables in accordance with IFRS. The Group also has system-supported reporting mechanisms to ensure that identical situations are handled in a standardised way across the Group.
The consolidated financial statements and group management report are prepared according to a uniform time schedule for all companies. Each company in the Group prepares its separate financial statements in accordance with the applicable local ac-counting guidelines and IFRS. Intra-Group clearing accounts are balanced by means of balance confirmations. The companies in the Group use the COGNOS reporting system for reporting, which in addition to financial data also contains information that is particularly useful for the notes to the consolidated financial statements. The data and information are subjected to audit pro-cedures by an external auditor prior to submission and consoli-dation, taking into account the associated risk.
Local financial accounting uses a variety of different IT systems. We intend to standardise this in the future and have already be-gun implementing the process.
All systems have tiered access authorisation systems. The type and design of these access authorisations and authorisation policies are decided by local management in coordination with the Head of IT for the NORMA Group.
Posting transactions too early or too late or failing to comply with accounting regulations are some situations that can result in risks that could potentially impact the accounting process. In order to avoid errors, the accounting process is based on the separation of responsibilities and plausibility checks for reporting. Calcula-tions are regularly monitored. Comprehensive and detailed checklists must be completed before the respective financial statement deadlines. The accounting process is fully integrated into NORMA Group’s risk management system. This ensures that accounting risks are identified early, allowing us to implement risk provisioning and countermeasures without delay.
Forecast
GENERAL ECONOMiC CONditiONS
Signs of a slight revival of the global economy – eurozone remains in recession in 2013 The global economy is in an overall weak and continued pre-carious state at the beginning of 2013. Despite the progress made in the fight against the sovereign debt crisis in the euro-zone, the economic impacts have not yet been surmounted. The necessary budget consolidations limit the fiscal possibilities of stimulating growth. In addition, the budget dispute in the USA has not yet been resolved despite the last minute compromise. In the meantime, there are more and more positive signals of a stabilisation and moderate revival of the global economy, sup-ported by central banks’ sustained expansionary monetary policies. The International Monetary Fund (IMF) emphasizes in its latest World Economic Outlook that the political measures in the eurozone, the USA and some emerging economies have re-duced the risks and that the financing terms for national budgets have improved. The rise of various early indicators supports the hope for a moderate economic turnaround.
The IMF expects the global economy to continue to grow in 2013, albeit only moderately, with global GDP growth at 3.5 % in 2013. That would be only a slight increase compared to the rate of

NORMA Group AG Annual Report 201292
3.2 % in the previous year. The main reason is, above all, the lack of momentum in Europe also in 2013. A recovery in the eurozone will be delayed until 2014. The economic divide between the member states will not be bridged for the time being. Global trade volume will increase by 3.8 % in 2013 (previous year: 2.8 %). This benefits in particular emerging markets for which the IMF assumes an economic growth rate of 5.5 % (previous year: 5.1 %). China’s growth will once again top 8 % (IMF forecast: 8.2 %), while India’s growth looks to be 5.9 % after 4.5 % in the previous year. At 1.4 %, economic activity in the developed econ-omies is barely picking up speed (previous year: 1.3 %). The IMF expects further moderate GDP growth of 2.0 % for the USA (pre-vious year: 2.3 %). Despite the stimulus package, it only expects weak growth of 1.2 % for Japan (previous year: 2.0 %). The eu-rozone remains in recession also in 2013 with its economy shrinking by 0.2 % (previous year -0.5 %). Once again, slightly weakened growth is expected for Germany.
This overall economic backdrop is the foundation for NORMA Group’s forecast and outlook.
For 2014, the IMF assumes that the eurozone will return to a growth trajectory. Global growth will increase to 4.1 %, whereby the established national economies should grow by 2.2 % and thus more robustly than in the previous three years. The USA is expected to grow by 3.0 %. The eurozone will overcome the reces-sion in 2014 with a moderate 1.0 % increase in GDP. A plus of 1.4 % is expected for the German economy and therefore somewhat stronger growth than the average for the currency area. In addition to the economic recovery in France (+0.9 %), Italy (+0.5 %) and Spain (+0.8 %) will also see growth again. The IMF expects emerg-ing economies to grow by 5.9 % in 2014, with a further increase in growth in China to 8.5 %, in India to 6.4 % and in Brazil to 4.0 %.
Robust operating environment for important customer industries of NORMA GroupThe tentative revival of the global economy over the course of 2013 and the further improved prospects for 2014 form a solid basis for important customer industries of NORMA Group.
The German engineering and plant construction industry is look-ing optimistically ahead considering the high order book. The industry association VDMA is heading for a new record level for 2013 with a real increase in production of 2 %. Sales revenues should grow by just under 4 % to EUR 217 billion. The stimulus is coming in particular from growth in the USA and the release of pent-up demand in China. Both countries together count for more than one-fifth of the industry’s exports.
The previous picture in the automotive industry will continue in 2013. Worldwide, the industry is on a growth course. The weak-ness in Western Europe will persist. The research institute Polk expects the global automobile market to grow by 2.5 % in 2013. The NAFTA area and China will experience above-average ex-pansion. In 2013, new registrations will decline in Western Europe by more than 3 % to 11.4 million automobiles and in Germany by more than 2 % to approximately 3 million automobiles according to the German industry association VDA. German domestic pro-duction and exports should remain stable in 2013. For 2014, Polk forecasts an increase in global growth to 5.6 % in the automobile segment.
In its current forecast for the European construction industry, the European construction association Euroconstruct does not ex-pect a recovery before 2015. Production will fall by 1.5 % in 2013. In Germany, the industry situation remains better. Both trade associations (HDB, ZDB) are expecting a 2 % increase in sales
FORECAStS FOR GdP GROwth
in %
2012
2013e
2014e
World + 3.2 + 3.5 + 4.1
USA + 2.3 + 2.0 + 3.0
China + 7.8 + 8.2 + 8.5
Eurozone – 0.5 – 0.2 + 1.0
Germany + 0.9 + 0.6 + 1.4
Source: IWF, Eurostat
93Further InformationConsolidated Financial StatementsConsolidated Management ReportManagement Board Letter To Our Shareholders
Forecast
in a forecast for 2013. In real terms, this corresponds to stagna-tion. The development will continue to be carried by residential construction (+3.5 %). The associations are cautiously optimistic for commercial construction (+1 %). The expected recovery in public construction is welcome, since the federal government is planning to increase construction measures based on higher tax revenue. Sales in this market segment will increase by 1.5 % in 2013.
NORMA GROuP’S FOCuS
We have continuously improved our sales and earnings figures in the past and remain committed to our fundamental corporate strategy. We intend to continue to grow faster than the market through our two distribution channels EJT and DS, international expansion and continuous innovation.
We will continue to foster our international approach by expanding our distribution network and our production sites and continuing to build on our local development expertise. In the medium term, this will include, in particular, expanding our sites in China, India and Brazil. This will allow us to exploit opportunities in these im-portant growth markets.
FutuRE dEvELOPMENt OF NORMA GROuP
Moderate sales growth expected for 2013 For 2013, NORMA Group’s Management Board currently ex-pects (Maintal, 13 March 2013) that the global economy will con-tinue to grow at approximately the same rate as in 2012, albeit in a volatile environment in European countries. We expect the main growth drivers to be the BRIC countries and other emerging economies.
Despite the global economy’s meagre rate of growth compared to the 2012 financial year, business development with NORMA Group’s key customers so far continues to be gratifying on the whole. Our broad diversification in terms of products, regions and end markets also gives us a relatively robust business model.
Thanks to solid growth in China, the expansion of our activities in some Asian markets and improved market shares, we are once again planning strong sales growth of more than 10 % for the Asia-Pacific region. After the previous year’s solid growth, the North American market has still not reached the historical peak level; the market is expected to grow in local currency in 2013. However, business growth will be neutral to slight in the Americas
measured in euros, due to a typically stronger US dollar. The situation in the EMEA region will vary. While production volume in individual industries will decrease due to the persistent uncer-tainty of the sovereign debt crisis, we expect a higher number of joining elements of greater value in particular as a result of the planned introduction of the Euro 6 emission standards in 2014 and the associated ramp-up of new motor generations in 2013. Whereas we still expect a decline in Europe for the first half of 2013, the positive effect of more and higher quality interfaces should more than offset the decreasing production figures by the end of the year. Overall, growth in the EMEA region should be at least neutral to weak for the full year compared to the previous year.
We expect that the two ways to the market – EJT and DS – will develop similarly; as a result, the breakdown of sales between units will be similar to the previous year. EJT continues to repre-sent approximately 70 % of sales and DS approximately 30 %. The expected moderate sales growth will play a significant role in the EJT unit, whereas the DS unit will be strengthened in par-ticular by the acquisitions from 2012.
Overall, we expect consolidated sales to grow moderately in 2013 compared to 2012. This also assumes that the economy will not experience a significant slowdown.
Moreover, there will be a year-on-year increase in sales of around EUR 20 million due to consolidation from the acquisition of Con-nectors Verbindungstechnik AG in Switzerland in April 2012, Nordic Metalblok S.r.l. in Italy in July 2012, Chien Jin Plastic Sdn. Bhd. in Malaysia in November 2012, the distribution business of DavyDick & Co in Australia in January 2013 and the increase in interest in the Dutch distributor Groen Bevestigingsmaterialen B.V. in December 2012.
Research & development to remain at around 4 % of EJt salesWe intend to continue investing around 4 % of EJT sales in re-search and development. We can realise cost advantages in the medium term by expanding our local development activities.The focus of our research and development efforts remains on find-ing innovative solutions to meet such customer requirements as weight reduction, increased engine efficiency and the modulari-sation of production processes. This ensures our competitive edge, which is rewarded by our customers, particularly in our EJT unit. Developments from this unit also frequently end up being used by our customers in the Distribution Services unit. We intend to register new patents again in 2013.
NORMA Group AG Annual Report 201294
Cost of materials ratio planned at a stable percentage of salesWe negotiate fixed purchase contracts for steel and engineering plastics during the year, making us largely immune to price fluc-tuations on the commodities markets during the financial year. Our contracts allow us to pass on the majority of demand-relat-ed price fluctuations for additional materials during the financial year to our customers. We thereby achieve a largely stable cost of materials ratio in the Group in combination with the measures from the worldwide Global Excellence cost-optimisation pro-gramme, which should be around the same level as in the previ-ous year (2012: 43.6 %).
Further optimisation of other cost itemsDue to the continuous growth of the Group and the expansion of our activities in the Asia-Pacific region, we expect personnel expenses to grow by a disproportionately low rate in comparison to sales. This will lead to a gradual and continuous improvement in our personnel cost rate. Expenses related to our growth and the expansion of our activities in emerging economies will lead to a stabilisation in other operating expenses.
EBitA margin expected at the previous years’ levelDue to moderate year-on-year sales growth, the expansion of operations in particular in the Asia-Pacific region and the acqui-sitions carried out in 2012 and 2013, we are aiming for a sustain-able EBITA margin for 2013. In 2013, the EBITA margin is ex-pected to be at the same level as the past three years of more than 17 %. This is based on the Company’s moderate sales growth and the effects of the Group-wide Global Excellence cost reduction programme.
Net financial income expected to be around EuR – 15 million Assuming no further acquisitions, net financial income will show lower interest expenses in the current financial year due to the consistent reduction of debt. Moreover, net financial income can be both positively as well as negatively impacted by possible fi-nancing measures and changes in the hedging positions. Overall, we expect net financial income of around EUR – 15 million.
Earnings per share to riseEarnings per share will further increase moderately in financial year 2013. Sales growth and a sustainable margin also contribute as well as the earnings contributions from the acquisitions made in 2012. The tax rate is anticipated to continue to be around 30 % to 32 % of earnings before taxes.
target investment rate of around 4.5 %We intend to invest around 4.5 % of consolidated sales over the course of the 2013 financial year. This will be used for both main-tenance investments and investments for the purpose of expand-ing our business. Our expansions will focus on the Asia-Pacific region and other emerging markets in which we want to signifi-cantly boost our activities in the future. Investment can peak as a result of the expansion of manufacturing capacities in China and India as well as the market entry in Brazil.
Financial and liquidity situation: Stable operating net cash flowWe expect operating cash flow to remain positive in 2013. We intend to use this cash flow to finance short-term operating cap-ital requirements as well as current investments and dividend payments. We intend to use the majority of the excess cash flow for investments in growth measures, particularly in emerging markets, and to finance possible acquisitions.
Due to our high net operating income and planned investment expenses, we are once again anticipating high positive free cash flow (before acquisitions) in 2013. The operating net cash flow should be near the previous year’s adjusted level (2012: EUR 81.0 million). This is based on the assumption that cash inflows will be typical for our business, in particular in the fourth quarter of the financial year.
Acquisitions remain a fundamental part of our growth in futureOur current financing structure gives us the flexibility we need for the external growth, whereby we will focus on acquiring compa-nies that produce and distribute products that complement our own product range as well as companies in regions in which we do not yet have a share of the market. We will also focus on consolidating the industry and markets as well as finding suitable regional distributor organisations in the DS unit. Usually, these are owner-managed private companies, which makes it difficult to plan acquisitions and their timing.
we pursue a sustainable dividend policyAs long as the future economic situation permits, we aim to fol-low a sustainable dividend policy that is based on a payout rate of approximately 30 % to a maximum of 35 % of the adjusted consolidated net income for the year, which will be proposed accordingly to the shareholders for approval at the Annual Gen-eral Meeting.
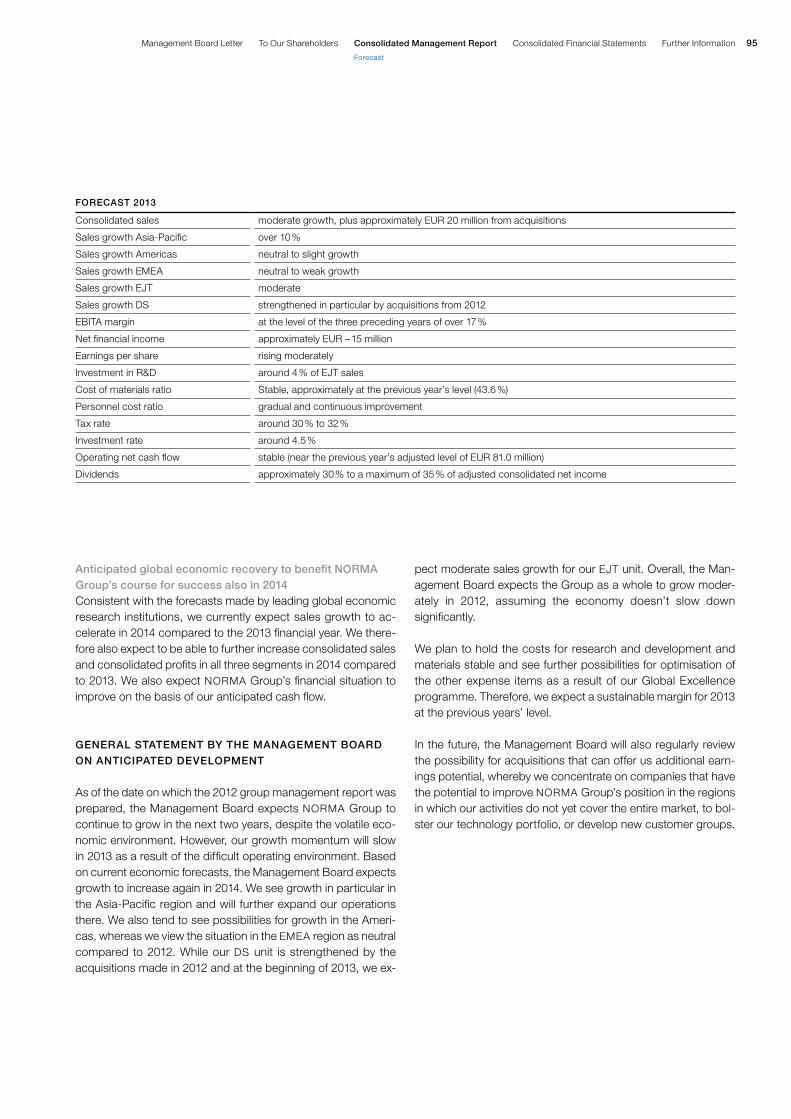
95Further InformationConsolidated Financial StatementsConsolidated Management ReportManagement Board Letter To Our Shareholders
Forecast
Anticipated global economic recovery to benefit NORMA Group’s course for success also in 2014Consistent with the forecasts made by leading global economic research institutions, we currently expect sales growth to ac-celerate in 2014 compared to the 2013 financial year. We there-fore also expect to be able to further increase consolidated sales and consolidated profits in all three segments in 2014 compared to 2013. We also expect NORMA Group’s financial situation to improve on the basis of our anticipated cash flow.
GENERAL StAtEMENt By thE MANAGEMENt BOARd
ON ANtiCiPAtEd dEvELOPMENt
As of the date on which the 2012 group management report was prepared, the Management Board expects NORMA Group to continue to grow in the next two years, despite the volatile eco-nomic environment. However, our growth momentum will slow in 2013 as a result of the difficult operating environment. Based on current economic forecasts, the Management Board expects growth to increase again in 2014. We see growth in particular in the Asia-Pacific region and will further expand our operations there. We also tend to see possibilities for growth in the Ameri-cas, whereas we view the situation in the EMEA region as neutral compared to 2012. While our DS unit is strengthened by the acquisitions made in 2012 and at the beginning of 2013, we ex-
pect moderate sales growth for our EJT unit. Overall, the Man-agement Board expects the Group as a whole to grow moder-ately in 2012, assuming the economy doesn’t slow down significantly.
We plan to hold the costs for research and development and materials stable and see further possibilities for optimisation of the other expense items as a result of our Global Excellence programme. Therefore, we expect a sustainable margin for 2013 at the previous years’ level.
In the future, the Management Board will also regularly review the possibility for acquisitions that can offer us additional earn-ings potential, whereby we concentrate on companies that have the potential to improve NORMA Group’s position in the regions in which our activities do not yet cover the entire market, to bol-ster our technology portfolio, or develop new customer groups.
FORECASt 2013
Consolidated sales moderate growth, plus approximately EUR 20 million from acquisitions
Sales growth Asia-Pacific over 10 %
Sales growth Americas neutral to slight growth
Sales growth EMEA neutral to weak growth
Sales growth EJT moderate
Sales growth DS strengthened in particular by acquisitions from 2012
EBITA margin at the level of the three preceding years of over 17 %
Net financial income approximately EUR – 15 million
Earnings per share rising moderately
Investment in R&D around 4 % of EJT sales
Cost of materials ratio Stable, approximately at the previous year’s level (43.6 %)
Personnel cost ratio gradual and continuous improvement
Tax rate around 30 % to 32 %
Investment rate around 4.5 %
Operating net cash flow stable (near the previous year’s adjusted level of EUR 81.0 million)
Dividends approximately 30 % to a maximum of 35 % of adjusted consolidated net income

NORMA Group AG Annual Report 201296
Other legally required disclosures
AdditiONAL iNFORMAtiON REquiREd uNdER thE
GERMAN tAkEOvER diRECtivE iMPLEMENtAtiON ACt
(ÜBERNAhMERiChtLiNiE-uMSEtzuNGSGESEtz,
ÜBERNRLuG)
An overview of the information required under section 315(4) of the German Commercial Code (Handelsgesetzbuch, HGB) is presented below:
Section 315(4) no. 1 hGBNORMA Group AG’s share capital totalled EUR 31,862,400.00 on 31 December 2012. This is divided into 31,862,400 registered shares with no par value. Each share entitles the bearer to one vote. There are no other classes of shares. NORMA Group AG holds no treasury shares.
Section 315(4) no. 2 hGBThe Management Board of NORMA Group AG is not aware of any restrictions affecting voting rights or the transfer of shares or any agreements between shareholders which could result in such restrictions.
Section 315(4) no. 3 hGBThere are no direct or indirect capital holdings exceeding one tenth of the voting rights other than those voting rights listed in the Notes to the consolidated financial statements.
Section 315(4) no. 4 hGBThere are no shares in NORMA Group AG that confer special control rights to the holder.
Section 315(4) no. 5 hGBThere are no employee share schemes through which employ-ees can acquire shares of NORMA Group AG. Employees with shareholdings in NORMA Group AG exercise control rights in the same way as other shareholders in accordance with applicable legislation and the Articles of Association.
Section 315(4) no. 6 hGBManagement Board members are appointed and dismissed in accordance with section 84 et seq. of the German Stock Cor-poration Act (Aktiengesetz, AktG). The Articles of Association of NORMA Group AG do not contain any provisions related to this issue that contradict the applicable legislation. The Supervisory Board is responsible for determining the actual number of mem-bers on the Management Board. It can nominate a Chairman and Deputy Chairman of the Management Board or a Management Board spokesperson and a deputy spokesperson.
Changes to the Articles of Association are made by the Annual General Meeting in accordance with section 179(1) AktG. In ac-cordance with section 179(1) sentence 2 AktG, the Annual Gen-eral Meeting can authorise the Supervisory Board to make changes which affect only the wording of the Articles of Asso-ciation. The Annual General Meeting of NORMA Group AG has chosen to do so: According to Article 13(2) of the Articles of Association, the Supervisory Board is authorised to make chang-es to the Articles of Association which only affect their wording. In accordance with Article 19(2) of the Articles of Association, a simple majority of the capital represented at the meeting is suf-ficient to make changes to the Articles of Association, wherever permitted by law.
If the Management Board exercises its right to retire treasury shares without a capital decrease and thereby increases the proportion of the share capital represented by the remaining shares, it is authorised to alter the number of shares in the Arti-cles of Association. The Supervisory Board is authorised to alter the wording of the Articles of Association after capital increases from authorised capital 2011/II or following the expiry of the au-thorisation period if this authorised capital is not used.
Section 315(4) no. 7 hGBAuthorised capital 2011/IIWith the approval of the Supervisory Board, the Annual General Meeting held on 6 April 2011 authorised the Management Board to increase the company’s share capital to a total of EUR 15,931,200.00 until 5 April 2016 through the issue of up to 15,931,200 new registered, no-par-value shares in exchange for cash or non-cash contributions (authorised capital 2011/II).
The Management Board is authorised, subject to the Supervi-sory Board’s approval, to disapply the pre-emptive rights of shareholders for one or more capital increases in connection with the authorised capital for fractional amounts resulting from the shareholders’ subscription ratio, for capital increases in ex-change for non-cash contributions, in particular to acquire com-panies, for capital increases in exchange for cash contributions limited to a maximum of 10 % of the share capital, provided the issue price is not significantly lower than the stock market price (simplified disapplication of pre-emptive rights in accordance with section 186(3) sentence 4), to fulfil obligations resulting from conversion and option rights or profit participation rights or par-ticipating bonds.
Contingent capitalThe share capital was contingently increased by up to EUR 12,505,000.00 by issuing up to 12,505,000 new registered, no-par-value shares with dividend rights from the beginning of the financial year in which they were issued (contingent capital

97Further InformationConsolidated Financial StatementsConsolidated Management ReportManagement Board Letter To Our Shareholders
Other legally required disclosures
2011). With the approval of the Supervisory Board, the Manage-ment Board is authorised to issue bonds with warrants or con-vertible bonds and convertible profit participation rights one or more times until the end of 5 April 2016 and to grant the bond-holders or creditors of the bonds conversion or option rights on up to 12,505,000 new shares of NORMA Group AG with a pro-portionate interest in the share capital of up to EUR 12,505,000.00.
The purpose of the contingent capital increase is to grant shares to the holders or creditors of bonds with warrants or convertible bonds and profit participation rights with warrants or conversion rights which are issued by the Company or any company in which the Company owns a majority interest or which depends on the Company until the end of 5 April 2016 in accordance with the resolution of the Annual General Meeting held on 6 April 2011. The contingent capital increase is only carried out to the extent that holders of the aforementioned bonds with warrants or con-vertible bonds or profit participation rights with option or conver-sion rights exercise these options or conversion rights, or conver-sion obligations arising from such bonds are fulfilled and that the Company’s treasury shares or new shares from the authorised capital are used for this purpose.
Authorisation to acquire treasury sharesThe Annual General Meeting held on 6 April 2011 authorised NORMA Group AG to acquire treasury shares up to a total of 10 % of the share capital existing when the resolution was passed over the stock market or by means of a purchase offer extended to all of NORMA Group AG’s shareholders in accordance with section 71(1) no. 8 AktG. This authorisation may be exercised as a whole or in partial amounts on one or several occasions until 5 April 2016. The acquisition price (excluding transaction costs) may not deviate by more than 10 % from the arithmetic average of the closing price of the shares of NORMA Group AG in XETRA trading or a successor system of the Frankfurt Stock Exchange over the five trading days immediately preceding the acquisition or the assumption of an obligation to acquire shares over the stock market or the publication of a public offer.
The authorisation may be exercised for any purpose permitted by law. The Management Board is authorised to retire all or part of the acquired shares with the approval of the Supervisory Board, whereby the Management Board may require the shares to be retired without a capital decrease, but is under no obliga-tion to do so. Other than selling them on the stock market or offering them to all shareholders while partially or completely disapplying pre-emptive rights, the Management Board is also specifically authorised to use shares acquired on the basis of the aforementioned authorisation for any of the following purposes with the approval of the Supervisory Board: to disapply frac-tional amounts resulting from the subscription ratio from share-holders’ pre-emptive rights, for sale in exchange for non-cash contributions, in particular as part of the acquisition of compa-
nies, for sale in exchange for cash contributions, provided the price is not significantly lower than the stock market price (simpli-fied disapplication of pre-emptive rights in accordance with sec-tion 186(3) sentence 4 and section 71(1) no. 8 sentence 5 half-sentence 2 AktG, limited to a maximum of 10 % of the share capital), to fulfil obligations resulting from conversion and option rights or conversion obligations.
The Management Board of NORMA Group AG has yet to make use of this authorisation.
Cancellation of authorised capitalThe Annual General Meeting held on 6 April 2011 passed a res-olution to cancel the authorised capital that was created in con-nection with the transformation of NORMA Group GmbH’s legal form to NORMA Group AG on 9 March 2011.
Section 315(4) no. 8 hGBNORMA Group AG has no material agreements that take effect in the event of a change of control following a takeover bid.
Section 315(4) no. 9 hGBNORMA Group AG has no agreements in place that provide compensation for members of the Management Board or em-ployees in the event of a takeover bid. Please see the remunera-tion report for further details.
REMuNERAtiON REPORt FOR thE MANAGEMENt ANd
SuPERviSORy BOARdS
Remuneration of the Management Board
Outline of the remuneration system for members of the Management BoardThe purpose of NORMA Group AG’s remuneration system is to provide the members of the Management Board with adequate remuneration for their activities and area of responsibility as well as their personal performance in accordance with applicable legislation and provide them with a long-term incentive to commit themselves to the success of the Company. In addition to the criteria of the Company’s performance and future prospects, the decision as to what level of remuneration is appropriate is also based on the general levels of remuneration paid by comparable companies and NORMA Group AG’s remuneration structure.
In accordance with the recommendations of the German Cor-porate Governance Code in the version dated 15 May 2012, the remuneration comprises a fixed element and variable elements.

NORMA Group AG Annual Report 201298
The basic remuneration is a fixed cash payment for the entire year based on the respective Management Board member’s area of responsibility. This basic remuneration is paid in the form of a monthly salary.
The variable element comprises multiple components.
1. The annual bonus is a variable cash payment calculated on the basis of the quantifiable performance of the Company in the previous financial year. The parameters taken into consid-eration are whether or not the Company reaches its target for an earnings component (EBITA) and a liquidity component (operating free cash flow before external use).
Each of the two key indicators is calculated for a financial year based on figures taken from the Company’s consolidated fi-nancial statements and compared to the targets set in ad-vance by the Supervisory Board. The annual salary of the Management Board member is multiplied by a percentage between 0 % and 200 %, depending on the extent to which the targets for the components were met. The range limits the annual bonus to 50 % of the member’s annual salary. It can be reduced to EUR 0 if the company performs poorly.
2. The Company’s long term incentive (LTI) plan is a component of a variable remuneration element designed to maximise the Company’s long-term performance. The LTI plan also com-prises an EBITA component and an operating free cash flow before external use (FCF) component, each of which are ob-served over a period of three years (performance period). A new three year performance period begins every year.
Both components are calculated by multiplying the average annual EBITA and FCF values actually achieved in the perfor-mance period by the EBITA and FCF bonus percentages specified in the employment contract. In the second step, the actual value of a component is compared to the medium-term plan approved by the Supervisory Board to evaluate the Com-pany’s performance and adjustments are made to the LTI plan. The LTI plan is limited to two and a half times the amount that would be arrived at on the basis of the figures in the Company’s medium-term plan. If the actual value is lower than the planned value, the LTI plan is reduced on a straight-line basis down to a minimum of EUR 0 if the three year targets are missed by a significant amount.
3. The matching stock programme (MSP) provides a share price-based long-term incentive to commit to the success of the Company. The MSP is a stock option programme.
To this end, the Supervisory Board specifies a number of stock options to be allotted each financial year with the pro-viso that the Management Board member makes a corre-sponding personal investment in the company.
The MSP is split into five tranches. The first tranche was allot-ted on the day of the initial public offering (8 April 2011). The other tranches will be allotted on 31 March each following year. The stock options relate to those shares allotted or ac-quired and qualified under the MSP as specified in the Man-agement Board contract. The number of stock options is calculated by multiplying the qualified shares (for 2011 and 2012: 108,452 shares) held at the allotment date by the option factor specified by the Supervisory Board. The option factor is re-determined for each tranche and amounts to 1.5 for each of the tranches in 2011 and 2012. Therefore, 162,679 share options are to be taken into account in both financial year 2011 as well as financial year 2012.
The vesting period is four years and ends on 31 March in 2015 and 2016 respectively for the 2011 and 2012 tranches. The exercise price for the 2011 tranche is the issue price at the time of the Company’s IPO. The exercise price for the other tranch-es will be the weighted average of the closing price of the Company’s share on the 60 trading days immediately preced-ing the allotment of the respective tranche. The value of the stock option is calculated on the basis of generally accepted valuation models.
Each tranche is recalculated, taking changes in influencing factors into account, and recognised proportionally over the vested period.
The options of a tranche can only be exercised within a period of two years following the expiry of the vesting period. In order for an option to be exercised, the exercise price must be at least 1.2 times the issue price (basis: weighted average of the last ten trading days). When the option is exercised, the Company can decide at its own discretion whether to settle the option in shares or cash. The 2011 and 2012 tranches are expected to be settled in equity instruments (no cash settlement).
The members of the Management Board are additionally com-pensated with a company car which they can also use for per-sonal purposes. In addition, Management Board members are also reimbursed for any expenses and travel costs incurred when performing their duties for the Company in accordance with the Company’s respectively applicable guidelines. The members of the Management Board arrange private insurance or are person-ally responsible for the statutory deductible of 10 % of the loss for the D&O insurance policy carried for the managing directors of NORMA Group.

99Further InformationConsolidated Financial StatementsConsolidated Management ReportManagement Board Letter To Our Shareholders
Other legally required disclosures
Supplementary report
Remuneration of the Management Board in the 2012 financial yearThe remuneration for the Management Board totalled EUR 2.4 million in the 2012 financial year (2011: EUR 3.2 million). This figure comprises EUR 1.4 million in fixed elements and EUR 1.0 million in variable elements.
The variable elements comprise the short-term performance-based annual bonus and the two long-term performance-based LTI and MSP schemes.
A provision was recognised for the variable compensation ele-ments. The stock options associated with the MSP scheme were reported as reserves in accordance with IFRS 2.
The Annual General Meeting held on 6 April 2011 resolved not to disclose the remuneration for individual Management Board mem-bers between 2011 and 2015 in accordance with sentences 5 to 9 of section 314(1) no. 6 letter a) HGB.
Remuneration of the Supervisory Board
The remuneration for the Chairman and the Deputy Chairman of the Supervisory Board was calculated separately in accordance with the recommendations of the German Corporate Gover-nance Code in the version dated 15 May 2012. The Chairman is paid double the remuneration of the other members of the Su-pervisory Board, and Deputy Chairman is paid one and a half times this amount. In addition, the Chairman and members of the Supervisory Board’s committees are remunerated sepa-rately.
The Supervisory Board members will be remunerated for their activities on the day after the 2013 Annual General Meeting as follows:
Supervisory Board member
Committee membership/ chair
Remu-
neration in EUR
Dr. Stefan Wolf Chairman of the Supervisory BoardChairman of the General and Nomination Committee
110,000.00
Dr. Ulf von Haacke (resigned on 14 September 2012)
Deputy Chairman of the Super-visory BoardMember of the General and Nomination Committee
59,918.03
Lars M. Berg Member of the Audit Committee 60,000.00
Günter Hauptmann (not a member of any committee) 50,000.00
Knut J. Michelberger Member of the Audit Committee 60,000.00
Dr. Christoph Schug Chairman of the Audit CommitteeMember of the General and Nomination Committee
95,000.00
No remuneration was paid to Supervisory Board members in financial year 2012 for services personally rendered (in particular advisory and brokerage services).
The Supervisory Board members are reimbursed for any ex-penses and travel costs incurred when performing their duties for the Company in accordance with the Company’s respec-tively applicable guidelines. The members of the Supervisory Board arrange private insurance or are personally responsible for the statutory deductible of 10 % of the loss for the D&O insur-ance policy carried for the Management Board and the Super-visory Board of NORMA Group.
REPORt ON tRANSACtiONS with RELAtEd PARtiES
There were no significant transactions with related parties in fi-nancial year 2012. Please refer to Note 40 on page 159.
Supplementary report
We acquired the distribution business of DavyDick & Co. in Aus-tralia on 10 January 2013. The company has sold various ele-ments for the transport of water in irrigation and sprinkler sys-tems for over 20 years. It supplies over 700 customers in Australia with joining products for irrigation and sprinkler systems as well as valves and pumps under the PUMPMASTER brand, in particular in the agricultural industry as well as in the areas of sanitation and household appliances. With this acquisition, we are expanding our operations in the area of water management and also expanding our range of infrastructure products and the distribution network, in particular in the areas of agriculture and irrigation. DavyDick & Co. recorded sales of around EUR 4 million in financial year 2012. It is included in the consolidated group of NORMA Group as at January 2013 and has only limited influence on its earnings, financials and net asset position.

NORMA Group AG Annual Report 2012100
Adjusted EBITA margin of 17.4 % at a sustained high level. Operating net cash flow of EUR 81.0 million. Strong adjusted profit for the period of EUR 61.8 million.

Further InformationConsolidated Financial StatementsConsolidated Management ReportTo Our ShareholdersManagement Board Letter 101
Consolidated Financial Statements
102 Consolidated statement of financial position
104 Consolidated statement of comprehensive income
105 Consolidated statement of cash flows
106 Consolidated statement of changes in equity
108 Segment reporting
110 Notes to the consolidated financial statements
161 Appendix to the notes to the consolidated financial statements
161 Notifications of voting rights 162 Corporate bodies
163 Responsibility statement
164 Auditor’s report
165 Further Information 165 Glossary 169 Overview by quarter 2012 170 Multi-year overview

102 NORMA Group AG Annual Report 2012
Consolidated statement of financial position
ASSetS
in EUR ’000
Notes
31 Dec 2012
31 Dec 2011
Non-current assets
Goodwill (19) 235,262 224,841
Other intangible assets (19) 92,478 78,940
Property, plant and equipment (20) 109,079 97,179
Other financial assets (22) 0 397
Derivative financial assets (23) 0 44
Income tax assets (17) 2,253 2,038
Deferred income tax assets (18) 6,403 6,744
445,475 410,183
Current assets
Inventories (25) 74,313 66,755
Other non-financial assets (26) 7,787 9,792
Derivative financial assets (23) 103 0
Income tax assets (17) 12,778 13,141
Trade and other receivables (24) 79,293 80,817
Cash and cash equivalents (35) 72,389 67,891
246,663 238,396
total assets
692,138
648,579

103Further InformationConsolidated Financial StatementsConsolidated Management ReportTo Our ShareholdersManagement Board Letter
Consolidated statement of financial position
equIty AND lIAbIlItIeS
in EUR ’000
Notes
31 Dec 2012
31 Dec 2011
equity attributable to equity holders of the parent
Subscribed capital (27) 31,862 31,862
Capital reserve (27) 213,559 212,252
Other reserves (27) – 8,550 – 2,668
Retained earnings (27) 50,450 14,112
equity attributable to shareholders 287,321 255,558
Non-controlling interests (27) 1,021 444
total equity 288,342 256,002
liabilities
Non-current liabilities
Retirement benefit obligations (28) 10,319 8,407
Provisions (29) 5,739 4,615
Borrowings (30) 190,727 213,457
Other non-financial liabilities (31) 1,589 1,310
Other financial liabilities (32) 2,666 676
Derivative financial liabilities (23) 24,675 21,809
Deferred income tax liabilities (18) 32,940 33,775
268,655 284,049
Current liabilities
Provisions (29) 6,743 6,359
Borrowings (30) 50,969 28,917
Other non-financial liabilities (31) 19,600 21,877
Other financial liabilities (32) 2,225 1,527
Derivative financial liabilities (23) 114 18
Income tax liabilities (17) 17,827 8,457
Trade payables (33) 37,663 41,373
135,141 108,528
total liabilities 403,796 392,577
total equity and liabilities
692,138
648,579

104 NORMA Group AG Annual Report 2012
in EUR ’000
Notes
q4 2012
Q4 2011
2012
2011
Revenue (8) 137,354 139,612 604,613 581,356
Changes in inventories of finished goods and work in progress
35
1,064
3,259
3,500
Raw materials and consumables used (9) – 58,510 – 64,770 – 263,489 – 262,282
Gross profit 78,879 75,906 344,383 322,574
Other operating income (10) 3,547 1,960 9,536 9,561
Other operating expenses (7, 11) – 18,752 – 17,887 – 76,626 – 88,208
Employee benefits expense (7, 12) – 37,281 – 34,568 – 156,468 – 143,716
Depreciation and amortisation (19, 20) – 8,493 – 6,677 – 26,414 – 23,577
Operating profit 17,900 18,734 94,411 76,634
Financial income (7, 13) – 1,010 1,254 800 4,409
Financial costs (7, 13) – 4,250 – 4,309 – 14,069 – 34,024
Financial costs – net – 5,260 – 3,055 – 13,269 – 29,615
Profit before income tax 12,640 15,679 81,142 47,019
Income taxes (16) – 3,252 – 2,452 – 24,569 – 11,309
Profit for the period 9,388 13,227 56,573 35,710
Other comprehensive income for the period, net of tax
Exchange differences on translation of foreign operations (27) – 1,168 372 – 2,570 – 149
Cash flow hedges, net of tax (27) – 243 1,176 – 3,085 – 1,155
Actuarial gains/losses on defined benefit plans, net of tax (27, 28) – 1,039 258 – 1,039 258
Other comprehensive income for the period, net of tax – 2,450 1,806 – 6,694 – 1,046
total comprehensive income for the period 6,938 15,033 49,879 34,664
Profit attributable to
Shareholders of the parent 9,392 13,219 56,573 35,685
Non-controlling interests – 4 8 0 25
9,388 13,227 56,573 35,710
total comprehensive income attributable to
Shareholders of the parent 6,875 15,025 49,652 34,639
Non-controlling interests 63 8 227 25
6,938 15,033 49,879 34,664
undiluted earnings per share (in euR)
(15)
0.30
0.43
1.78
1.19
Diluted earnings per share (in euR) (15) 0.30 0.43 1.78 1.19
Consolidated statement of comprehensive income

105Further InformationConsolidated Financial StatementsConsolidated Management ReportTo Our ShareholdersManagement Board Letter
Consolidated statement of comprehensive income
Consolidated statement of cash flows
in EUR ’000
Notes
q4 2012
Q4 2011
2012
2011
Operating activities
Profit for the period 9,388 13,227 56,573 35,710
Depreciation and amortisation (19, 20) 8,493 6,677 26,414 23,577
Gain (–) / loss (+) on disposal of property, plant and equipment 317 – 131 – 386 – 328
Change in provisions (29) – 614 1,963 – 611 3,142
Change in deferred taxes (18) – 278 678 – 4,056 – 2,473
Change in inventories, trade receivables and other receivables
(24, 25, 26)
13,134
5,371
11,009
– 21,103
Change in trade and other payables (31, 33) 1,008 9,041 2,591 7,104
Interest paid 1,798 4,085 11,630 23,289
Other non-cash expenses/income – 98 – 1,168 – 7,040 2,827
Net cash provided by operating activities 33,148 39,743 96,124 71,745
thereof interest received 55 1,097 1,736 2,159
thereof income taxes – 3,772 – 5,015 – 16,232 – 14,409
Investing activities
Purchase of former non-controlling interests (27) 0 0 0 – 4,677
Net payments for acquisitions of subsidiaries (39) – 7,248 0 – 28,976 0
Investments in property, plant and equipment (19, 20) – 8,749 – 5,872 – 23,892 – 26,383
Proceeds from sale of property, plant and equipment – 112 642 924 1,710
Investments in intangible assets (19, 20) – 2,340 – 3,347 – 6,143 – 4,301
Net cash used in investing activities – 18,449 – 8,577 – 58,087 – 33,651
Financing activities
Proceeds from capital increase (27) 0 0 0 147,000
Payments for the issuance of new shares (27) 0 0 0 – 6,544
Reimbursement IPO costs from shareholder (27) 0 6,602 0 6,602
Reimbursement OPICP from shareholder (27) – 1 0 1,307 388
Interest paid – 1,798 – 4,085 – 11,630 – 23,289
Dividends paid to shareholders (27) 0 0 – 19,125 0
Dividends paid to non-controlling interests 0 0 – 11 0
Refinancing costs (13) 0 0 0 – 7,859
Proceeds from borrowings (30) 0 4,883 18,500 293,675
Repayment of borrowings (30) – 10,236 – 19,816 – 23,173 – 410,513
Net cash used in financing activities – 12,035 – 12,416 – 34,132 – 540
Net decrease (-)/increase (+) in cash and cash equivalents
2,664
18,750
3,905
37,554
Cash and cash equivalents at beginning of the year 70,082 48,919 67,891 30,426
Exchange gains/losses on cash – 357 222 593 – 89
Cash and cash equivalents at end of the period 72,389 67,891 72,389 67,891
Consolidated statement of cash flows
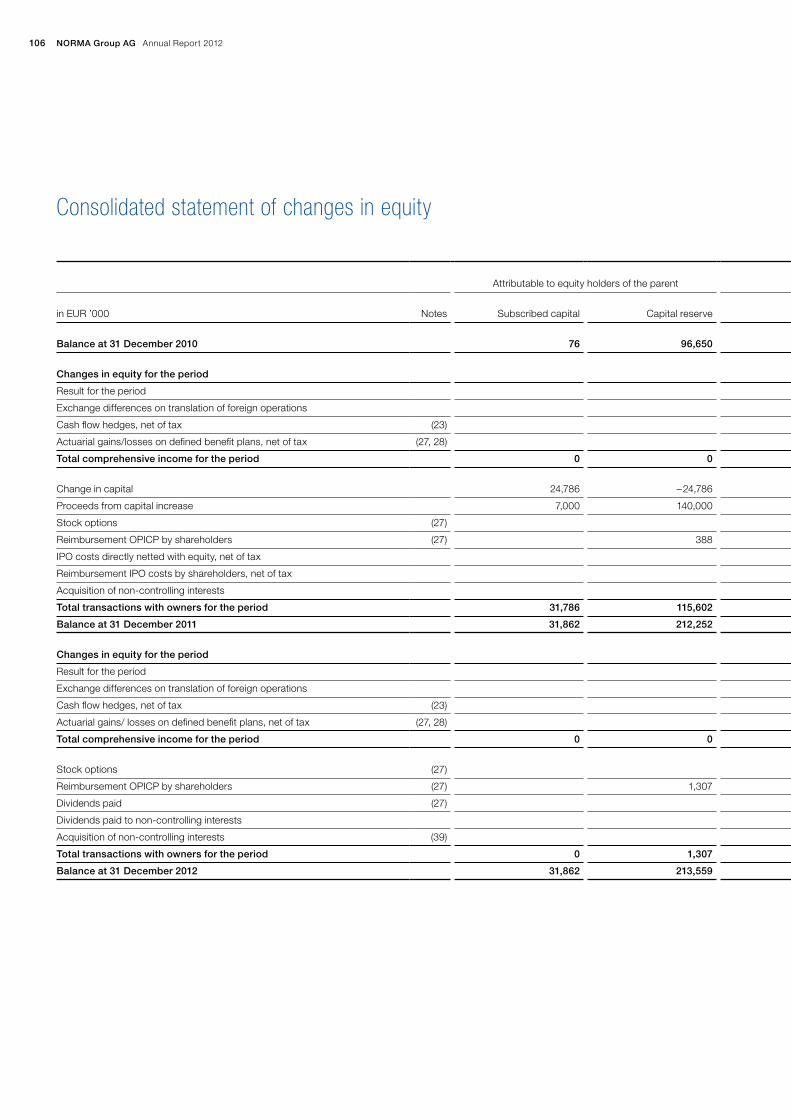
106 NORMA Group AG Annual Report 2012
Consolidated statement of changes in equity
Attributable to equity holders of the parent
Attributable to equity holders of the parent
in EUR ’000
Notes
Subscribed capital
Capital reserve
Other reserves
Retained earnings
total
Non-controlling interests
total equity
balance at 31 December 2010
76
96,650
– 1,364
– 20,116
75,246
3,156
78,402
Changes in equity for the period
Result for the period 35,685 35,685 25 35,710
Exchange differences on translation of foreign operations – 149 – 149 0 – 149
Cash flow hedges, net of tax (23) – 1,155 – 1,155 0 – 1,155
Actuarial gains/losses on defined benefit plans, net of tax (27, 28) 258 258 0 258
total comprehensive income for the period 0 0 – 1,304 35,943 34,639 25 34,664
Change in capital
24,786
– 24,786
0
0
0
Proceeds from capital increase 7,000 140,000 147,000 0 147,000
Stock options (27) 184 184 0 184
Reimbursement OPICP by shareholders (27) 388 388 0 388
IPO costs directly netted with equity, net of tax – 4,640 – 4,640 0 – 4,640
Reimbursement IPO costs by shareholders, net of tax 4,681 4,681 0 4,681
Acquisition of non-controlling interests – 1,940 – 1,940 – 2,737 – 4,677
total transactions with owners for the period 31,786 115,602 0 – 1,715 145,673 – 2,737 142,936
balance at 31 December 2011 31,862 212,252 – 2,668 14,112 255,558 444 256,002
Changes in equity for the period
Result for the period 56,573 56,573 0 56,573
Exchange differences on translation of foreign operations – 2,797 – 2,797 227 – 2,570
Cash flow hedges, net of tax (23) – 3,085 – 3,085 0 – 3,085
Actuarial gains/ losses on defined benefit plans, net of tax (27, 28) – 1,039 – 1,039 0 – 1,039
total comprehensive income for the period 0 0 – 5,882 55,534 49,652 227 49,879
Stock options
(27)
418
418
0
418
Reimbursement OPICP by shareholders (27) 1,307 1,307 0 1,307
Dividends paid (27) – 19,125 – 19,125 0 – 19,125
Dividends paid to non-controlling interests 0 – 11 – 11
Acquisition of non-controlling interests (39) – 489 – 489 361 – 128
total transactions with owners for the period 0 1,307 0 – 19,196 – 17,889 350 – 17,539
balance at 31 December 2012 31,862 213,559 – 8,550 50,450 287,321 1,021 288,342
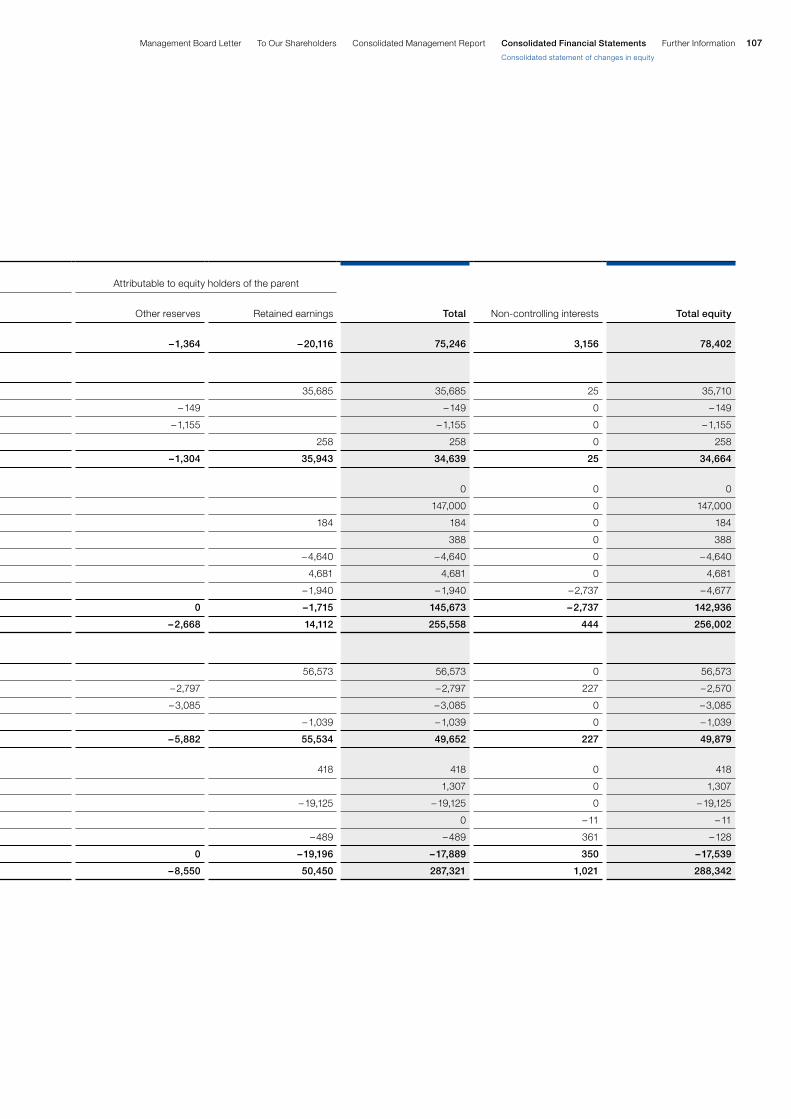
107Further InformationConsolidated Financial StatementsConsolidated Management ReportTo Our ShareholdersManagement Board Letter
Consolidated statement of changes in equity
Attributable to equity holders of the parent
Attributable to equity holders of the parent
in EUR ’000
Notes
Subscribed capital
Capital reserve
Other reserves
Retained earnings
total
Non-controlling interests
total equity
balance at 31 December 2010
76
96,650
– 1,364
– 20,116
75,246
3,156
78,402
Changes in equity for the period
Result for the period 35,685 35,685 25 35,710
Exchange differences on translation of foreign operations – 149 – 149 0 – 149
Cash flow hedges, net of tax (23) – 1,155 – 1,155 0 – 1,155
Actuarial gains/losses on defined benefit plans, net of tax (27, 28) 258 258 0 258
total comprehensive income for the period 0 0 – 1,304 35,943 34,639 25 34,664
Change in capital
24,786
– 24,786
0
0
0
Proceeds from capital increase 7,000 140,000 147,000 0 147,000
Stock options (27) 184 184 0 184
Reimbursement OPICP by shareholders (27) 388 388 0 388
IPO costs directly netted with equity, net of tax – 4,640 – 4,640 0 – 4,640
Reimbursement IPO costs by shareholders, net of tax 4,681 4,681 0 4,681
Acquisition of non-controlling interests – 1,940 – 1,940 – 2,737 – 4,677
total transactions with owners for the period 31,786 115,602 0 – 1,715 145,673 – 2,737 142,936
balance at 31 December 2011 31,862 212,252 – 2,668 14,112 255,558 444 256,002
Changes in equity for the period
Result for the period 56,573 56,573 0 56,573
Exchange differences on translation of foreign operations – 2,797 – 2,797 227 – 2,570
Cash flow hedges, net of tax (23) – 3,085 – 3,085 0 – 3,085
Actuarial gains/ losses on defined benefit plans, net of tax (27, 28) – 1,039 – 1,039 0 – 1,039
total comprehensive income for the period 0 0 – 5,882 55,534 49,652 227 49,879
Stock options
(27)
418
418
0
418
Reimbursement OPICP by shareholders (27) 1,307 1,307 0 1,307
Dividends paid (27) – 19,125 – 19,125 0 – 19,125
Dividends paid to non-controlling interests 0 – 11 – 11
Acquisition of non-controlling interests (39) – 489 – 489 361 – 128
total transactions with owners for the period 0 1,307 0 – 19,196 – 17,889 350 – 17,539
balance at 31 December 2012 31,862 213,559 – 8,550 50,450 287,321 1,021 288,342

108 NORMA Group AG Annual Report 2012
EMEA
Americas
Asia-Pacific
Total segments
Central functions
Consolidation
Consolidated group
in EUR ’000
2012
2011
2012
2011
2012
2011
2012
2011
2012
2011
2012
2011
2012
2011
Total revenue 392,588 395,821 200,946 180,118 44,745 36,791 638,279 612,730 44,206 25,389 – 77,872 – 56,763 604,613 581,356
thereof inter-segment revenue 25,047 23,122 7,618 7,130 1,001 1,122 33,666 31,374 44,206 25,389 – 77,872 – 56,763 0 0
Revenue from external customers
367,541
372,699
193,328
172,988
43,744
35,669
604,613
581,356
0
0
0
0
604,613
581,356
Contribution to consolidated group sales
61 %
64 %
32 %
30 %
7 %
6 %
100 %
100 %
Adjusted EBITDA 1) 79,350 89,821 42,981 34,272 5,175 3,064 127,506 127,157 – 5,078 – 9,102 – 1,603 – 1,036 120,825 117,019
Depreciation without PPA depreciation
– 10,013
– 9,620
– 4,087
– 3,736
– 1,028
– 930
– 15,128
– 14,286
– 264
– 50
0
0
– 15,392
– 14,336
Adjusted EBITA 1) 69,337 80,201 38,894 30,536 4,147 2,134 112,378 112,871 – 5,342 – 9,152 – 1,603 – 1,036 105,433 102,683
Assets 2) 457,426 417,079 209,894 223,939 51,240 34,540 718,560 675,558 131,680 131,869 – 158,102 – 158,848 692,138 648,579
Liabilities 3) 185,155 202,474 138,118 164,310 36,536 14,853 359,809 381,637 171,693 149,020 – 127,706 – 138,080 403,796 392,577
CAPEX 15,153 20,833 6,683 3,389 5,752 3,142 27,588 27,364 4,118 3,320 0 0 31,706 30,684
Number of employees 4) 2,468 2,336 644 616 367 335 3,479 3,287 98 43 0 0 3,577 3,330
1) For details regarding the adjustments refer to Note 35. 2) Including allocated goodwills, taxes are shown in reconciliation.3) Taxes are shown in reconciliation.4) Number of employees (average headcount).
Segment reporting

109Further InformationConsolidated Financial StatementsConsolidated Management ReportTo Our ShareholdersManagement Board Letter
Segment reporting
EMEA
Americas
Asia-Pacific
Total segments
Central functions
Consolidation
Consolidated group
in EUR ’000
2012
2011
2012
2011
2012
2011
2012
2011
2012
2011
2012
2011
2012
2011
Total revenue 392,588 395,821 200,946 180,118 44,745 36,791 638,279 612,730 44,206 25,389 – 77,872 – 56,763 604,613 581,356
thereof inter-segment revenue 25,047 23,122 7,618 7,130 1,001 1,122 33,666 31,374 44,206 25,389 – 77,872 – 56,763 0 0
Revenue from external customers
367,541
372,699
193,328
172,988
43,744
35,669
604,613
581,356
0
0
0
0
604,613
581,356
Contribution to consolidated group sales
61 %
64 %
32 %
30 %
7 %
6 %
100 %
100 %
Adjusted EBITDA 1) 79,350 89,821 42,981 34,272 5,175 3,064 127,506 127,157 – 5,078 – 9,102 – 1,603 – 1,036 120,825 117,019
Depreciation without PPA depreciation
– 10,013
– 9,620
– 4,087
– 3,736
– 1,028
– 930
– 15,128
– 14,286
– 264
– 50
0
0
– 15,392
– 14,336
Adjusted EBITA 1) 69,337 80,201 38,894 30,536 4,147 2,134 112,378 112,871 – 5,342 – 9,152 – 1,603 – 1,036 105,433 102,683
Assets 2) 457,426 417,079 209,894 223,939 51,240 34,540 718,560 675,558 131,680 131,869 – 158,102 – 158,848 692,138 648,579
Liabilities 3) 185,155 202,474 138,118 164,310 36,536 14,853 359,809 381,637 171,693 149,020 – 127,706 – 138,080 403,796 392,577
CAPEX 15,153 20,833 6,683 3,389 5,752 3,142 27,588 27,364 4,118 3,320 0 0 31,706 30,684
Number of employees 4) 2,468 2,336 644 616 367 335 3,479 3,287 98 43 0 0 3,577 3,330
1) For details regarding the adjustments refer to Note 35. 2) Including allocated goodwills, taxes are shown in reconciliation.3) Taxes are shown in reconciliation.4) Number of employees (average headcount).

110 NORMA Group AG Annual Report 2012
1. GeNeRAl INFORMAtION
NORMA Group AG is the parent company of NORMA Group. Its headquarter is located at 63477 Maintal, Edisonstr. 4 in the vicin-ity of Frankfurt, Germany and is registered in the commercial register of Hanau, under the number HRB 93582. NORMA Group AG and its affiliated Group subsidiaries operate in the market as ‘ NORMA Group.’
NORMA Group has been listed in the Prime Standard of Frank-furt Stock Exchange’s Regulated Market since 8 April 2011. The majority shareholder at the time of the IPO, 3i Group plc and funds managed by 3i, held 35.5 % or 11.31 million shares at 31 December 2011 and at 31 December 2012 16.7 % or 5.3 mil-lion shares. MABA CYPRUS Limited held a further 8.3 % stake, or 2.6 million shares at 31 December 2011, at 31 December 2012 the share was 2.5 % or 0.8 million shares. Furthermore, at 31 De-cember 2012 Threadneedle (10.82 %), Mondrian Investment Partners Ltd. (5.34 %), DWS GmbH (4.44 %), ODDO & Cie. (3.39 %) and T. Rowe Price (3.025 %) held major shares.
NORMA Group AG, in the following referred to as “ NORMA Group,” was established in 2006 as a result of the merger of Rasmussen GmbH and the ABA Group. Rasmussen was found-ed in 1949 as Rasmussen GmbH in Germany. It manufactured connecting and retaining elements as well as fluid conveying conduits such as monolayer and multilayer tubes and corru-gated tubes. All products are marketed globally under the NORMA brand. ABA Group was founded in 1896 in Sweden. The Group has since developed into a leading multi-national com-pany specialising in the design and production of hose and pipe clamps, as well as connectors for many world-wide applications.
In 2007, NORMA Group acquired Breeze Industrial Products Corporation (USA) to strengthen its foothold in the Americas. Breeze had expanded its product offering to include a wide range of worm-drive, T-bolt and V-clamps for the commercial and pas-senger vehicle, heavy-duty vehicle, aircraft and industrial mar-kets. In 2010, NORMA Group acquired two further companies in America, R.G. RAY Corporation and Craig Assembly Inc., to
become one of the country’s leading suppliers of fastening and fixing products. In 2012, NORMA Group acquired four further companies. Connectors Verbindungstechnik AG in Switzerland is specialised in connector systems for the pharmaceutical and biotechnology industry. Nordic Metalblok S.r.l. in Italy produces clamps for various applications particularly for the heating, ven-tilation and air conditioning industry and the agricultural and construction sectors. Chien Jin Plastic Sdn. Bhd. in Malaysia was the first company NORMA Group acquired in Asia and is special-ized in joining elements for plastic and iron pipe systems. NORMA Group also acquired further 60 % of Groen Bevestigingsmateri-alen B.V. in the Netherlands (before 30 %), a wholesale supplier of hose and pipe clamps as well as couplings to the industrial, construction, agriculture, plumbing, hardware, and automotive sector throughout Belgium, the Netherlands and Luxembourg. Moreover, Groen Bevestigingsmaterialen B.V. has an extensive supply program of traffic sign brackets and offers the necessary mounting tools.
In past decades, NORMA Group has, driven by its successful acquisitions and continuous technological innovation of products and operations, developed into a group of companies of global importance. Today NORMA Group markets its products to its customers via two different market channels: Distribution Ser-vices (DS) and Engineered Joining Technologies (EJT).
For DS customers, NORMA Group offers a wide range of stan-dard fastening and fixing products. Furthermore, NORMA Group offers a broad technological and innovative product portfolio which includes brands like NORMA©, ABA©, Breeze©, R.G. RAY©, Serflex©, Serratub©, Terry©, and Torca©.
For EJT customers, NORMA Group offers tailor-made solutions and special engineered joining systems. To effectively meet spe-cial requirements, NORMA Group builds on extensive industry and application knowledge, a successful track record of innova-tion and long-standing relationships with all its key customers. As a result, many joining systems and fluid conveying conduits have been developed in close cooperation with global OEM s and NORMA Group.
Notes to the consolidated financial statements

111Further InformationConsolidated Financial StatementsConsolidated Management ReportTo Our ShareholdersManagement Board Letter
Notes to the consolidated financial statements
Permanent technological and customer-oriented innovations have brought NORMA Group products a superior position in many markets. User-friendly connecting and retaining elements have set a global standard in quality. Today, NORMA Group op-erates in 100 countries, encompassing 19 manufacturing facili-ties and various distribution centres. NORMA Group offers to its customers in excess of 30,000 products.
2. bASIS OF PRePARAtION
The principal accounting policies applied in the preparation of these consolidated financial statements are set out below. These policies have been consistently applied to all the years present-ed, unless otherwise stated.
The consolidated financial statements of NORMA Group have been prepared in accordance with International Financial Report-ing Standards (IFRS) as adopted by the EU as well as with the regulations under commercial law as set forth in Section 315a of the German Commercial Code (HGB) for the year ended 31 De-cember 2012.
The consolidated statement of comprehensive income has been prepared according to the total cost method.
The consolidated financial statements of NORMA Group are be-ing filed with and published in the German Federal Gazette (Bundesanzeiger).
The preparation of financial statements in conformity with IFRS requires the use of certain critical accounting estimates. It also requires management to exercise its judgement in the process of applying the Group’s accounting policies. The areas involving a higher degree of judgement or complexity or areas where as-sumptions and estimates are significant to the consolidated fi-nancial statements are disclosed in section 3.
New and amended standards adopted by the Group for the first time in 2012The following amendments to standards which are applied for the first time for the financial year beginning 1 January 2012 did not have a material impact on NORMA Group consolidated financial statements.
IFRS 7 (amendments), Financial Instruments: Disclosures, was published in October 2010. These amendments will allow the readers of financial statements to improve their understanding of transfer transactions of financial assets. Entities shall apply the amendments for reporting periods beginning on or after 1 July 2011. In the first year of application, comparative informa-tion is not required.
IAS 12 (amendments), Income Tax, Deferred tax: Recognition of Underlying Assets (effective for reporting periods beginning on or after 1 January 2012), was published in December 2010. This introduces an exception to the normal rule in IAS 12 that measurement of deferred taxes in respect to an asset de-pends on the asset’s expected manner of recovery (that is through use or sale or a combination of both). The exception applies to investment properties measured using the fair value model in IAS 40 and introduces a rebuttable presumption that such investment property is recovered entirely through sale. This presumption is rebutted if the investment property is de-preciable and is held within a business model whose objective is to consume the investment property’s economic benefits over time, rather than through sale. Therefore, the IAS 12 guid-ance previously contained in SIC 21 will be accordingly with-drawn.
Standards, amendments and interpretations of existing stan-dards that are not yet effective and have not been adopted early by the GroupThe following standards and amendments to existing standards have been published and application is mandatory for all Group accounting periods beginning on or after 1 January 2013. The company has decided against an early adoption.
1) Standards, amendments and interpretations to existing standards that have already been endorsed by the EU (with reference to each respective EU effective date)
IAS 19 (amendments), Employee Benefits, (effective for report-ing periods beginning on or after 1 July 2013, earlier applica-tion is permitted), was published in June 2011. The Company early adopted the amendment as of December 31, 2012. The amendment was applied retrospective in accordance with IAS
19.173 (2011) and IAS 8. Prior to the amendment, IAS 19 per-mitted a choice on how to account for actuarial gains and losses on pensions and similar items. The Exposure Draft eliminates the use of the ‘corridor’ approach, which resulted in the deferral of gains and losses. All actuarial gains and losses thus have to be recognised in other comprehensive
112 NORMA Group AG Annual Report 2012
The new standards and the consequential amendments are pre-sented in detail below:
IFRS 10, CONSOlIDAteD FINANCIAl StAteMeNtS,
IAS 27, (CONSOlIDAteD AND) SePARAte FINANCIAl
StAteMeNtS
IFRS 10 superseded the requirements relating to consolidated financial statements in IAS 27, Consolidated and Separate Finan-cial Statements (amended 2008) and SIC-12, Consolidation – Special Purpose Entities. IFRS 10 builds on the existing princi-ples by identifying the concept of control as the determining factor in whether or not an entity should be included in the con-solidated financial statements of the parent company. The stan-dard provides additional guidance to assist in the determination of control where this is difficult to assess. IAS 27 (amended 2011) now only contains requirements relating to separate financial statements as a result of the issuance of the new standard IFRS10.
IFRS 11 JOINt ARRANGeMeNtS
IFRS 11 provides guidance for the accounting of joint arrange-ments. The core principle of IFRS 11 is to determine the account-ing of joint ventures on the rights and obligations of the arrange-ment, rather than its legal form. Basically the standard classifies joint arrangements into two types, joint operations and joint ventures, which differ in the way of accounting for joint arrange-ments. A joint operation is a joint arrangement whereby the par-ties that have joint control of the arrangement have rights to the assets, and obligations for the liabilities, relating to the arrange-ment. A joint venture is a joint arrangement whereby the parties that have joint control of the arrangement have rights to the net assets of the arrangement. IFRS requires a joint operator to rec-ognise and measure the assets and liabilities in relation to its interest in the arrangement applicable to the particular assets, liabilities, revenues and expenses. A joint venture is required to recognise an investment and to account for that investment us-ing the equity method according to IAS 28.
IFRS 12 DISClOSuRe OF INteReStS IN OtheR eNtItIeS
IFRS 12 unifies the disclosure requirements of IAS 27 and IFRS
10, IAS 31 and IFRS 11 and IAS 28 in one comprehensive stan-dard. The standard provides guidance for disclosure require-ments for any kind of interests in other entities, including joint arrangements, associates, structured entities, special purpose vehicles and off-balance-sheet activities. The objective of IFRS
12 is to require disclosures that enable users of financial state-
income. These changes will have no impact on the company because NORMA Group does not apply the corridor approach and already recognises changes in actuarial gains and losses in other comprehensive income. In addition, the amended IAS
19 replaces the expected return on assets and interest costs on the defined benefit obligation with a single net interest component that is calculated by applying the discount rate to the net defined benefit liability (asset). Past service costs will be recognised fully in the period of the related plan amend-ment. The amendments to IAS 19 also include enhanced pre-sentation and disclosure requirements.
The amendment of IAS 19 contains further a change of the requirements for termination benefits also. The definition of termination benefits was clarified so that benefits that have future-service obligations are not termination benefits and have to be classified as “Other Long-Term Employee Benefits” or as “Post-Employment Benefits.” This clarification has a di-rect impact on the accounting of provisions for retirement obligations and the corresponding expenses. Top-up pay-ments which result from retirement agreements are no longer classified as “Termination Benefits,” in accordance with the amendments to IAS 19, they have to be classified as “Other Long-Term Employee Benefits” in terms of IAS 19.08 seqq. and IAS 19.153 seqq. The recognition of those top-up pay-ments has to be made in accordance with IAS 19.155 (2011) seqq. in conjunction with IAS 19.56 (2011) seqq., thus they must be accumulated in return for services. The final determi-nation of the impact arising from the amendment has not yet been completed. However, NORMA Group expects no sig-nificant impact on comprehensive income and total equity.
In May 2011, the IASB published its improvements to the accounting and disclosure requirements for consolidation, off-balance-sheet activities and joint agreements by issuing IFRS 10, Consolidated Financial Statements, IFRS 11, Joint Arrangements, IFRS 12, Disclosure of Interests in Other Entities, consequential amendments to IAS 27, (Consoli-dated and) Separate Financial Statements (amended 2011) and IAS 28, Investments in Associates and Joint Ventures (amended 2011). IFRS 10, 11, 12 and the consequential amendments to IAS 27 and IAS 28 are effective for annual periods beginning on or after 1 January 2014. An early adoption is possible, but must be adopted as a package, that is, all as of the same date, with the exception of IRFS 12. The Group does not expect a material impact on its Con-solidated Financial Statements from these standards.
113Further InformationConsolidated Financial StatementsConsolidated Management ReportTo Our ShareholdersManagement Board Letter
Notes to the consolidated financial statements
The International Accounting Standard Board (IASB) has pub-lished amendments to IAS 32, Financial Instruments: Presen-tation, and to IFRS 7, Financial Instruments: Disclosure in December 2011. The amendments introduce additional ap-plication guidance under IFRS in applying the current offset-ting principles. It clarifies that an entity currently has a legally enforceable right to set-off if that right is enforceable both in the normal course of business and in the event of default, in-solvency of the entity and all counterparties. The amendments to IFRS 7 require an entity to disclose information about rights of set-off and related arrangements. The new disclosures are required for all recognised financial instruments that are set off in accordance with IAS 32. These disclosures also apply to recognised financial instruments that are subject to an en-forceable master netting arrangement or similar agreement, irrespective of whether they are set-off in accordance with IAS
32. The amendments to IAS 32 are to be retrospectively ap-plied for annual periods beginning on or after 1 January 2014, the amendments to IFRS 7 are to be retrospectively applied for annual periods beginning on or after 1 January 2013. The Group does not expect a material impact on its Consolidated Financial Statements from these amendments.
2) Standards, amendments and interpretations to existing standards that have not yet been endorsed by the EU
IFRS 9, Financial Instruments, a project of the International Accounting Standards Board (IASB) to replace and sim-plify the current standard IAS 39 Financial Instruments: Recognition and Measurement. The project was divided into three phases:
Phase 1: Classification and measurement Phase 2: Amortised cost and impairment of financial asset Phase 3: Hedge accounting
Financial Instruments (effective from 1 January 2013, ear-lier application is permitted), was published in November 2009 and covers the classification and measurement of fi-nancial assets. The various classification and measurement models in IAS 39 are replaced by a single model with only two classification categories. Thus, upon initial recognition financial assets are either classified as measured at amor-tized cost or at fair value. Further changes introduced by IFRS 9 concern the accounting of embedded derivatives and the measurement of equity instruments not held for trading. In October 2010, the IASB followed the publication of IFRS 9 in November 2009 with an update to IFRS 9, Fi-nancial Instruments, to include guidance on financial liabil-
ments to evaluate the nature of, and risks associated with, its interest in other entities and the effects on its financial position, financial performance and cash flows.
IAS 28 INveStMeNtS IN ASSOCIAteS AND JOINt
veNtuReS
According to the amendment of IAS 28, an entity shall account for an investment, or for a portion of an investment, in an associ-ate or joint venture held for sale if it meets the relevant criteria. Any retained portion of an investment in an associate or joint venture that has not been classified as held for sale shall be ac-counted for using the equity method until the disposal of the portion that is classified as held for sale takes place.
IFRS 13, Fair Value Measurement, (effective for reporting pe-riods beginning on or after 1 January 2013, earlier application is permitted), was published in May 2011. IFRS 13 aims to improve consistency and reduce complexity. IFRS 13 provides a precise definition of fair value and a single source of fair value measurement and disclosure requirements for use across IFRSs. The requirements do not extend to the use of fair value accounting but rather provide guidance on how it should be applied where its use is already required or permit-ted by other standards within IFRSs. IFRS 13 requires an en-tity to disclose information that helps readers of its financial statements to assess the valuation techniques and inputs used to develop those measurements and the effects of the measurements on profit or loss or other comprehensive in-come for the period. Regarding financial instruments, the ma-jority of changes required by IFRS 13 have already been intro-duced, mainly by amendments to IFRS 7, Financial Instruments: Disclosures. The Group does not expect a material impact on its Consolidated Financial Statements from these amend-ments.
IAS 1 (amendments), Presentation of Financial Statements, (effective for reporting periods beginning on or after 1 July 2012), was published in June 2011. The amendments to IAS 1 retain the ’one or two statement’ approach at the choosing of the entity and only revise the way other comprehensive in-come is presented. The presentation of other comprehensive income requiring separate subtotals for those elements which may be ‘recycled’ (e.g. cash-flow hedging, foreign currency translation), and those elements that will not (e.g. fair value through OCI items under IFRS 9). The Group does not expect a material impact on its Consolidated Financial Statements from these amendments.
114 NORMA Group AG Annual Report 2012
IFRS 3 buSINeSS COMbINAtIONS
Amends IFRS 3 to exclude from its scope the accounting for the formation of all types of joint arrangements as defined in IFRS 11 Joint Arrangements, including those involving the contribution of a business to a joint arrangement, and clarifies that the scope exclusion in paragraph 2(a) of IFRS 3 only addresses the ac-counting in the financial statements of the joint venture or the joint operation itself, and not the accounting by the parties to the joint arrangement for their interests in the joint arrangement.
IFRS 13 FAIR vAlue MeASuReMeNt
The amendment clarifies that the portfolio exception in para-graph 52 of IFRS 13 applies to all contracts accounted for with-in the scope of IAS 39 Financial Instruments: Recognition and Measurement or IFRS 9 Financial Instruments, even if they do not meet the definition of financial assets or financial liabilities as defined in IAS 32 Financial Instruments: Presentation, such as certain contracts to buy or sell non-financial items that can be settled net in cash or another financial instrument.
IAS 40 INveStMeNt PROPeRty
The amendment clarifies that IFRS 3 and IAS 40 are not mutu-ally exclusive. Determining whether a specific transaction meets the definition of a business combination as defined in IFRS 3 requires judgement based on the guidance in IFRS 3. Determin-ing whether or not property is owner-occupied property or in-vestment property requires application of paragraphs 7-15 of IAS 40.
The amendments are intended to clarify the requirements and not to change the accounting practice. The Group is currently assessing the impact arising from the amendments on the con-solidated financial statements.
ED/2012/3 Equity Method: Share of Other Net Asset Changes – Proposed amendments to IAS 28
In December 2012, the International Accounting Standards Board (IASB) published for public comment exposure draft ED/2012/3 of the proposed amendments to IAS 28 Invest-ments in Associates and Joint Ventures to specify that an in-vestor should recognise, in the investor’s equity, its share of the changes in the net assets of the investee that are not recognised in profit or loss or other comprehensive income (OCI) of the investee, and that are not distributions received (‘other net asset changes’).
ities and the derecognition of financial instruments. The accounting and presentation of financial liabilities and for derecognising financial instruments has been adopted from IAS 39, ‘Financial Instruments: Recognition and Measure-ment,’ without change, except for financial liabilities that are measured at fair value through profit or loss. In November 2012, the IASB published an exposure draft proposing lim-ited amendments to IFRS 9 ‘Financial Instruments (2010)’ (the ‘ED’). The significant changes from IFRS 9 in the ED include the introduction of a third classification category for debt instruments (fair value through other comprehensive income), clarification of the business model for the existing amortised cost category, clarification of the contractual cash flow test, consequential changes as a result of the limited amendments and revised transition guidance.
In December 2011, the IASB deferred the mandatory effec-tive date from annual reporting periods beginning on or after January 1, 2013 to annual reporting periods beginning on or after January 1, 2015; early application is permitted. The Company is currently assessing the impacts of adopt-ing IFRS 9 on the Company’s Consolidated Financial State-ments.
In November 2012, as part of its annual improvements proj-ect, the International Accounting Standards Board (IASB) issued for public comment exposure draft ED/2012/2 An-nual Improvements to IFRSs: 2011-2013 Cycle (‘the ED’), which proposes amendments to four International Financial Reporting Standards (IFRSs). The proposed effective date for the amendments is for annual periods beginning on or after 1 January 2014. Early adoption is proposed to be per-mitted for all of the amendments.
The new standards and consequential amendments are pre-sented in detail below:
IFRS 1 FIRSt-tIMe ADOPtION OF INteRNAtIONAl
FINANCIAl RePORtING StANDARDS
The amendment clarifies that an entity, in its first IFRS financial statements, has the choice between applying an existing and currently effective IFRS or to apply early a new or revised IFRS that is not yet mandatorily effective, provided that the new or revised IFRS permits early application. An entity is required to apply the same version of the IFRS throughout the periods cov-ered by those first IFRS financial statements.

115Further InformationConsolidated Financial StatementsConsolidated Management ReportTo Our ShareholdersManagement Board Letter
Notes to the consolidated financial statements
ture only apply to sale or the contribution of assets that do not constitute a business, as defined in IFRS 3 Business Combi-nation.
ED/2012/7 Acquisition of an Interest in a Joint Operation The IFRS do not provide guidance on the accounting by a joint
operator for the acquisition of an interest in a joint operation in which the activity of the joint operation constitutes a busi-ness. As a result of the lack of guidance, significant diversity has arisen in practice in accounting for acquisition of interests in jointly controlled operations or assets that are businesses. For example, a premium that is paid in addition to the fair value of the identifiable net assets is either recognised as a separate asset, i.e. goodwill, or allocated to the identifiable assets on the basis of their relative fair values, and the acqui-sition-related costs are either capitalised or recognised as an expense.
The Exposure Draft ED/2012/7 Acquisition of an Interest in a Joint Operation (Proposed amendment to IFRS 11) was pub-lished for public comment by the International Accounting Standards Board (IASB). The objective of the proposed amendment is to introduce guidance on the accounting, by a joint operator, for the acquisition of an interest in a joint op-eration, as defined in IFRS 11 Joint Arrangements, in which the activity of the joint operation constitutes a business, as defined in IFRS 3 Business Combinations. In the future, a joint operator accounting for the acquisition of an interest in a joint operation in which the activity of the joint operation constitutes a business should apply the relevant principles on business combinations accounting in IFRS 3 and other Standards, and disclose the relevant information required by those Standards for business combinations. The proposed amendments apply to both acquisition of an interest in an existing joint operation and acquisition of an interest in a joint operation on its forma-tion, unless the formation of the joint operation coincides with the formation of the business.
The IASB issued various other pronouncements. These recent-ly adopted pronouncements as well as pronouncements not yet adopted do not have a material impact on NORMA Group’s Con-solidated Financial Statements.
3. SuMMARy OF SIGNIFICANt ACCOuNtING
PRINCIPleS
1. CONSOlIDAtION
(a) SubsidiariesSubsidiaries are all entities (including special purpose entities) over which NORMA Group has the power to govern the financial and operating policies. This generally accompanies a sharehold-ing of more than half of the voting rights. The existence and effect
ED/2012/5 Clarification of Acceptable Methods of Deprecia-tion and Amortisation (Proposed amendments to IAS 16 and IAS 38)
The International Accounting Standards Board (IASB) pub-lished for public comment exposure draft ED/2012/5 of the proposed amendments to IAS 16 Property, Plant and Equip-ment and IAS 38 Intangible Assets in December. This amend-ment proposes to clarify that a revenue-based method should not be used to calculate the charge for depreciation and/or amortisation, because that method reflects a pattern of eco-nomic benefits being generated from the asset, rather than the expected pattern of consumption of the future economic benefits embodied in the asset. The IASB also proposes to clarify that expected future reductions in the unit selling price of the product or service output of the asset could be an indi-cator of the diminution of the future economic benefits of the asset as a result of technical or commercial obsolescence, and thereby relevant when applying the diminishing balance method.
ED/2012/6 Sale or Contribution of Assets between an Investor and its Associate or Joint Venture
Exposure Draft ED/2012/6 Sale or Contribution of Assets be-tween an Investor and its Associate or Joint Venture (Pro-posed amendments to IFRS 10 and IAS 28) was published for public comment by the International Accounting Standards Board (IASB). The Exposure Draft proposes narrow-scope amendments to IFRS 10 Consolidated Financial Statements and IAS 28 Investments in Associates and Joint Ventures (2011) to address an acknowledged inconsistency between the requirements in IFRS 10 and those in IAS 28 (2011), in dealing with the sale or contribution of a subsidiary to a joint venture (as defined in IFRS 11 Joint Arrangements), or an as-sociate. In accordance with IAS 28 (2011) (which incorporated SIC-13 Jointly Controlled Entities – Non-monetary Contribu-tions by Venturers), gain or loss resulting from the contribution of a non-monetary asset to a jointly controlled entity in ex-change for an equity interest in that jointly controlled entity is restricted to the extent of the interests attributable to the un-related equity holders in the jointly controlled entity. However, IFRS 10/IAS 27 Consolidated and Separate Financial State-ments (as revised in 2008) requires full recognition of a gain/loss on loss of control of a subsidiary. The proposed amend-ments require gain or loss arising from the loss of control of a business (whether it is housed in a subsidiary or not), to be recognised in full including cases in which the investor retains joint control of, or significant influence over the investee. The current requirement of partial gain or loss recognition for transaction between an investor and its associate or joint ven-

116 NORMA Group AG Annual Report 2012
iaries have been changed where necessary to ensure consis-tency with the policies adopted by the Group.
(b) Transactions and non-controlling interestsNon-controlling interests in the shareholders’ equity of subsidiar-ies are calculated separately from the equity of the Group.
The Group treats transactions with non-controlling interests that do not result in a loss of control as transactions with equity own-ers of the Group. For purchases from non-controlling interests, the difference between any consideration paid and the relevant share acquired of the carrying value of net assets of the subsid-iary is recorded in equity. Gains or losses on disposals of non-controlling interests are also recorded in equity.
When the Group ceases to have control or significant influence, any retained interest in the entity is remeasured at its fair value, with the change in the carrying amount recognised in profit or loss. The initial carrying amount is the fair value for the purposes of subsequently accounting for the retained interest as an as-sociate, joint venture or financial asset. In addition, any amounts previously recognised in other comprehensive income in respect of that entity are accounted for as if the Group had directly dis-posed of the related assets or liabilities. This may mean that amounts previously recognised in other comprehensive income are reclassified to profit or loss.
of potential voting rights that are currently exercisable or convert-ible are considered when assessing whether the Group controls another entity. Subsidiaries are fully consolidated from the date on which control is transferred to the Group. They are de-con-solidated from the date that control ceases.
The Group uses the acquisition method of accounting to account for business combinations. The initial value for the acquisition of a subsidiary is recognised at fair value of the assets transferred, the liabilities incurred and the equity interests issued by the Group. The initial value recognised includes the fair value of any asset or liability resulting from a contingent consideration ar-rangement. At the acquisition date, the fair value of contingent consideration is recognised as part of the consideration trans-ferred in exchange for the acquiree. Acquisition-related costs are expensed as incurred. Identifiable assets acquired and liabilities and contingent liabilities assumed in a business combination are measured initially at their fair value at the acquisition date. Ac-cording to IFRS 3 (revised), for each business combination, the acquirer shall measure any non-controlling interest in the ac-quiree either at fair value (full goodwill method) or at the non-controlling interest’s proportionate share of the acquiree’s net assets. The Group measures the non-controlling interest in the acquiree at the non-controlling interest’s proportionate share of the acquiree’s net assets.
The excess of the consideration transferred, the amount of any non-controlling interest in the acquiree and the acquisition date fair value of any previous equity interest in the acquiree over the fair value of the Group’s share of the identifiable net assets ac-quired, is recorded as goodwill. If this is less than the fair value of the net assets of the subsidiary acquired in the case of a bargain purchase, the difference is recognised directly in the statement of comprehensive income.
In a business combination achieved in stages, the Group remea-sures its previously held equity interest in the acquiree at its ac-quisition date fair value and recognises the resulting gain or loss, if any, in profit or loss.
Inter company transactions, balances and unrealised gains on transactions between Group companies are eliminated. Unre-alised losses are also eliminated. Accounting policies of subsid-
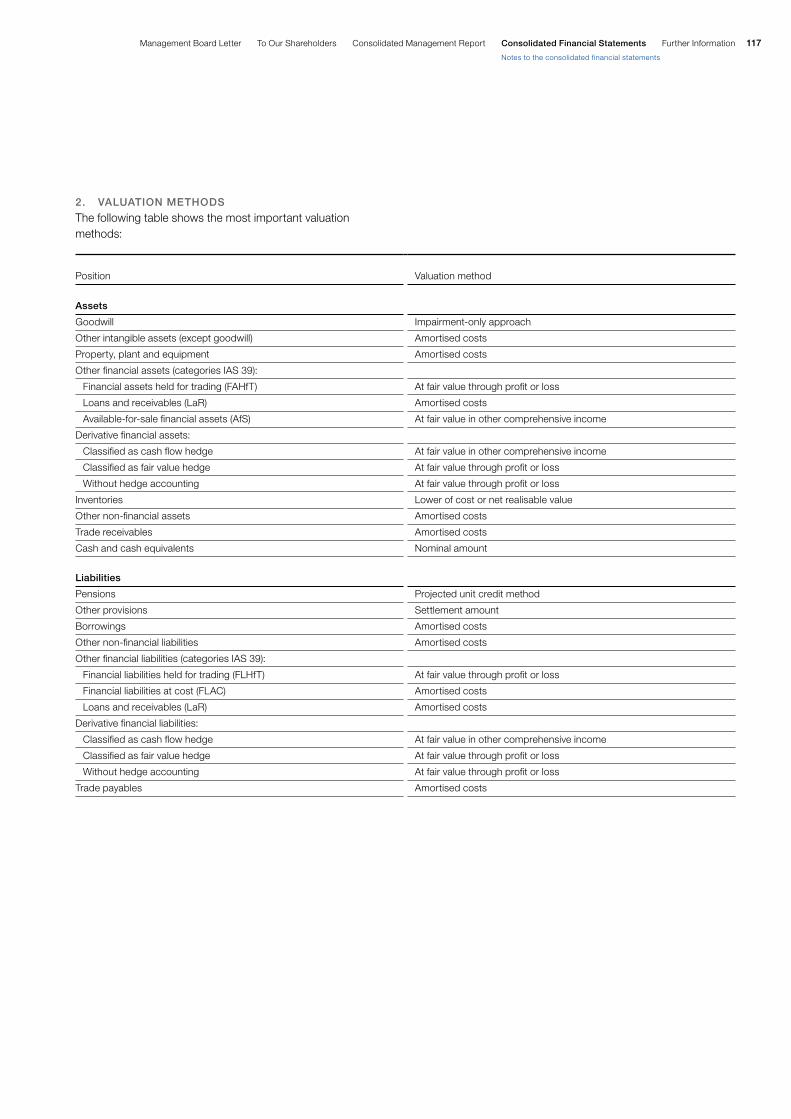
117Further InformationConsolidated Financial StatementsConsolidated Management ReportTo Our ShareholdersManagement Board Letter
Notes to the consolidated financial statements
2. vAluAtION MethODS
The following table shows the most important valuation methods:
Position
Valuation method
Assets
Goodwill Impairment-only approach
Other intangible assets (except goodwill) Amortised costs
Property, plant and equipment Amortised costs
Other financial assets (categories IAS 39):
Financial assets held for trading (FAHfT) At fair value through profit or loss
Loans and receivables (LaR) Amortised costs
Available-for-sale financial assets (AfS) At fair value in other comprehensive income
Derivative financial assets:
Classified as cash flow hedge At fair value in other comprehensive income
Classified as fair value hedge At fair value through profit or loss
Without hedge accounting At fair value through profit or loss
Inventories Lower of cost or net realisable value
Other non-financial assets Amortised costs
Trade receivables Amortised costs
Cash and cash equivalents Nominal amount
liabilities
Pensions Projected unit credit method
Other provisions Settlement amount
Borrowings Amortised costs
Other non-financial liabilities Amortised costs
Other financial liabilities (categories IAS 39):
Financial liabilities held for trading (FLHfT) At fair value through profit or loss
Financial liabilities at cost (FLAC) Amortised costs
Loans and receivables (LaR) Amortised costs
Derivative financial liabilities:
Classified as cash flow hedge At fair value in other comprehensive income
Classified as fair value hedge At fair value through profit or loss
Without hedge accounting At fair value through profit or loss
Trade payables Amortised costs
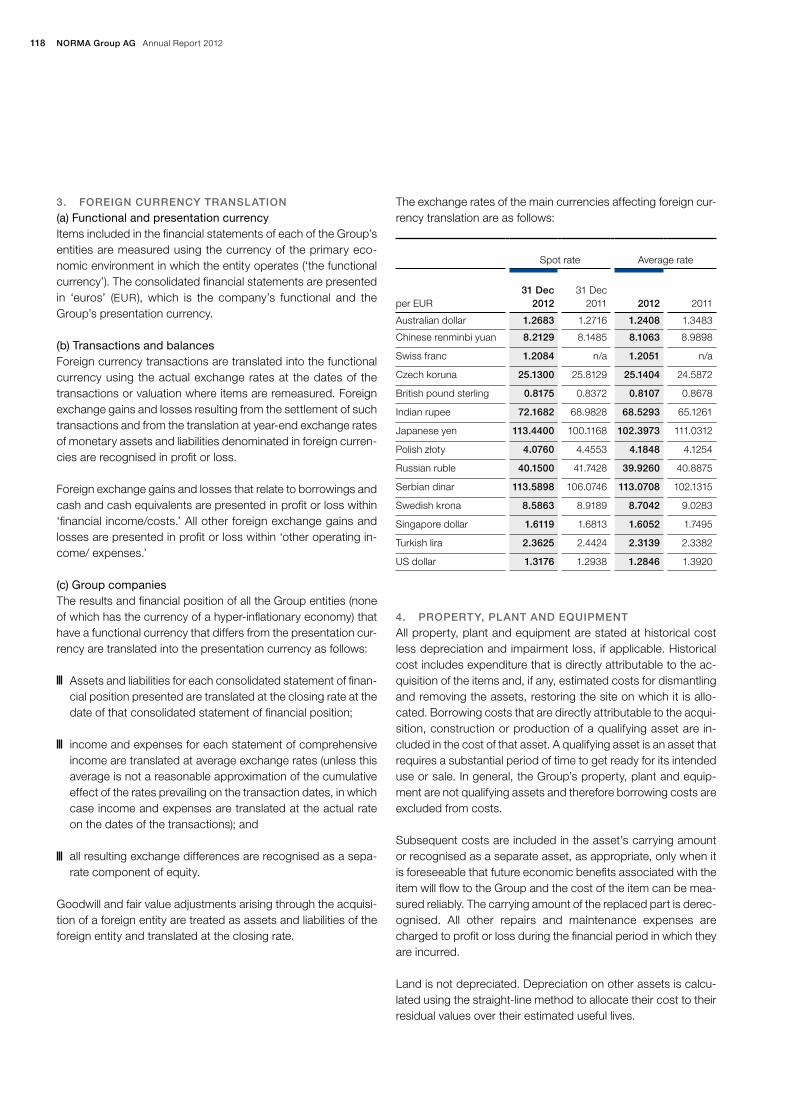
118 NORMA Group AG Annual Report 2012
The exchange rates of the main currencies affecting foreign cur-rency translation are as follows:
4. PROPeRty, PlANt AND equIPMeNt
All property, plant and equipment are stated at historical cost less depreciation and impairment loss, if applicable. Historical cost includes expenditure that is directly attributable to the ac-quisition of the items and, if any, estimated costs for dismantling and removing the assets, restoring the site on which it is allo-cated. Borrowing costs that are directly attributable to the acqui-sition, construction or production of a qualifying asset are in-cluded in the cost of that asset. A qualifying asset is an asset that requires a substantial period of time to get ready for its intended use or sale. In general, the Group’s property, plant and equip-ment are not qualifying assets and therefore borrowing costs are excluded from costs.
Subsequent costs are included in the asset’s carrying amount or recognised as a separate asset, as appropriate, only when it is foreseeable that future economic benefits associated with the item will flow to the Group and the cost of the item can be mea-sured reliably. The carrying amount of the replaced part is derec-ognised. All other repairs and maintenance expenses are charged to profit or loss during the financial period in which they are incurred.
Land is not depreciated. Depreciation on other assets is calcu-lated using the straight-line method to allocate their cost to their residual values over their estimated useful lives.
Spot rate
Average rate
per EUR
31 Dec
2012
31 Dec
2011
2012
2011
Australian dollar 1.2683 1.2716 1.2408 1.3483
Chinese renminbi yuan 8.2129 8.1485 8.1063 8.9898
Swiss franc 1.2084 n/a 1.2051 n/a
Czech koruna 25.1300 25.8129 25.1404 24.5872
British pound sterling 0.8175 0.8372 0.8107 0.8678
Indian rupee 72.1682 68.9828 68.5293 65.1261
Japanese yen 113.4400 100.1168 102.3973 111.0312
Polish złoty 4.0760 4.4553 4.1848 4.1254
Russian ruble 40.1500 41.7428 39.9260 40.8875
Serbian dinar 113.5898 106.0746 113.0708 102.1315
Swedish krona 8.5863 8.9189 8.7042 9.0283
Singapore dollar 1.6119 1.6813 1.6052 1.7495
Turkish lira 2.3625 2.4424 2.3139 2.3382
US dollar 1.3176 1.2938 1.2846 1.3920
3. FOReIGN CuRReNCy tRANSlAtION
(a) Functional and presentation currencyItems included in the financial statements of each of the Group’s entities are measured using the currency of the primary eco-nomic environment in which the entity operates (‘the functional currency’). The consolidated financial statements are presented in ‘euros’ (EUR), which is the company’s functional and the Group’s presentation currency.
(b) Transactions and balancesForeign currency transactions are translated into the functional currency using the actual exchange rates at the dates of the transactions or valuation where items are remeasured. Foreign exchange gains and losses resulting from the settlement of such transactions and from the translation at year-end exchange rates of monetary assets and liabilities denominated in foreign curren-cies are recognised in profit or loss.
Foreign exchange gains and losses that relate to borrowings and cash and cash equivalents are presented in profit or loss within ‘financial income/costs.’ All other foreign exchange gains and losses are presented in profit or loss within ‘other operating in-come/ expenses.’
(c) Group companiesThe results and financial position of all the Group entities (none of which has the currency of a hyper-inflationary economy) that have a functional currency that differs from the presentation cur-rency are translated into the presentation currency as follows:
Assets and liabilities for each consolidated statement of finan-cial position presented are translated at the closing rate at the date of that consolidated statement of financial position;
income and expenses for each statement of comprehensive income are translated at average exchange rates (unless this average is not a reasonable approximation of the cumulative effect of the rates prevailing on the transaction dates, in which case income and expenses are translated at the actual rate on the dates of the transactions); and
all resulting exchange differences are recognised as a sepa-rate component of equity.
Goodwill and fair value adjustments arising through the acquisi-tion of a foreign entity are treated as assets and liabilities of the foreign entity and translated at the closing rate.
119Further InformationConsolidated Financial StatementsConsolidated Management ReportTo Our ShareholdersManagement Board Letter
Notes to the consolidated financial statements
development costs can be measured reliably, the product or process is
technically and commercially feasible, future economic benefits are probable
Furthermore, NORMA Group intends, and has sufficient resourc-es, to complete development and use or sell the asset. The costs capitalized include the cost of materials, direct labour and other directly attributable expenditure that serves to prepare the asset for use. Such capitalized costs are included in line item ‘patents & technology.’ Capitalized development costs are stated at cost less accumulated amortisation and impairment losses with an amortisation period of generally three to five years. Development costs which did not meet the requirements are expensed as incurred.
(c) Other intangible assetsSeparately acquired other intangible assets are shown at his-torical cost. Intangible assets acquired in a business combination are recognised at fair value at the acquisition date. All other in-tangible assets have a finite useful life and are carried at cost less accumulated amortisation and impairment loss, if applicable. Amortisation is calculated using the straight-line method to al-locate their cost.
Borrowing costs that are directly attributable to the acquisition or production of a qualifying asset are included in the cost of that asset. A qualifying asset is an asset that requires a substantial period of time to get ready for its intended use or sale. In gen-eral, the Group’s other intangibles are not qualifying assets and borrowing costs are therefore excluded from costs.
The useful lives of other intangible assets acquired in a business combination are estimates based on the economics of each spe-cific asset which were determined in the process of the purchase price allocation.
The estimated useful lives for other intangible assets are as fol-lows:
Patents: 5 to 10 years Certificates: 4 to 10 years Technology: 10 to 20 years Licences, rights: 3 to 5 years Trademarks: 20 years Software: 3 to 5 years Development costs: 3 to 5 years
The assets’ residual values and useful lives are reviewed, and adjusted if appropriate, at each balance sheet date.
An asset’s carrying amount is written down immediately to its recoverable amount if the asset’s carrying amount is greater than its estimated recoverable amount.
Gains and losses on disposals are determined by comparing the proceeds with the carrying amount and are recognised within ‘other operating income/expenses’ in profit or loss.
The estimated useful lives for property, plant and equipment are as follows:
Buildings: 8 to 33 years Machinery and technical equipment: 3 to 18 years Tools: 3 to 8 years Other equipment: 2 to 20 years Land is not depreciated
5. INtANGIble ASSetS
(a) GoodwillGoodwill represents the excess of the cost of an acquisition over the fair value of the Group’s share of the net identifiable assets of the acquired subsidiary at the date of acquisition. Goodwill on acquisitions of subsidiaries is included in ‘intangible assets.’ Goodwill is tested annually for impairment and carried at cost less accumulated impairment losses. Impairment losses on goodwill are not reversed. Gains and losses on the disposal of an entity include the carrying amount of goodwill relating to the entity sold.
Goodwill is allocated to cash-generating units for the purpose of impairment testing. The allocation is made to those cash-gener-ating units or groups of cash-generating units that are expected to benefit from the business combination in which the goodwill arose.
(b) Development costsCosts of research activities undertaken with the prospect of gain-ing new scientific or technical knowledge and understanding are expensed as incurred. Costs for development activities, whereby research findings are applied to a plan or design for the produc-tion of new or substantially improved products and processes, are capitalized if

120 NORMA Group AG Annual Report 2012
(c) Available-for-sale financial assetsAvailable-for-sale financial assets are non-derivatives that are either designated in this category or not classified in any of the other categories. They are included in non-current assets unless management intends to dispose of the investment within 12 months of the balance sheet date.
Recognition and measurement Regular purchases and sales of financial assets are recognised on the trade-date – the date on which the Group commits to purchase or sell the asset. Investments are initially recognised at fair value plus transaction costs for all financial assets not carried at fair value through profit or loss. Financial assets carried at fair value through profit or loss are initially recognised at fair value and transaction costs are expensed in the statement of compre-hensive income. Financial assets are derecognised when the rights to receive cash flows from the investments have expired or have been transferred and the Group has transferred substan-tially all risks and rewards of ownership. Financial assets at fair value through profit or loss are subsequently carried at fair value. Loans and receivables are carried at amortised cost using the effective interest method. Available-for-sale financial assets are subsequently carried at fair value unless the fair value cannot be determined, in which case the available-for-sale financial asset is carried at cost.
Dividends on available-for-sale equity instruments are recog-nised in the statement of comprehensive income as part of finan-cial income when the Group’s right to receive payments is es-tablished.
Impairment of financial assets(a) Assets carried at amortised costThe Group assesses at the end of each reporting period wheth-er there is objective evidence that a financial asset or group of financial assets is impaired. A financial asset or a group of finan-cial assets is impaired and impairment losses are incurred only if there is objective evidence of impairment as a result of one or more events that occurred after the initial recognition of the asset (a ‘loss event’) and that loss event (or events) has (have) an im-pact on the estimated future cash flows of the financial asset or group of financial assets that can be reliably estimated.
The criteria that the Group uses to determine if there is objective evidence of an impairment loss include:
Financial difficulty of the issuer or obligor;
A breach of contract, such as a default or delinquency in inter-est or principal payments;
6. IMPAIRMeNt OF NON-FINANCIAl ASSetS
Assets that have an indefinite useful life, for example goodwill, are not subject to amortisation and are tested annually for impair-ment, as well as whenever there are indications that the carrying amount of the cash generating unit (CGU) is impaired. If the im-pairment loss recognised for the CGU exceeds the carrying amount of the allocated goodwill, the additional amount of the impairment loss is recognised through a pro-rata reduction of the carrying amount of the assets allocated to the CGU. Assets that are subject to amortisation are reviewed for impairment whenever events or changes in circumstances indicate that the carrying amount may not be recoverable. An impairment loss is recognised for the amount by which the asset’s carrying amount exceeds its recoverable amount. The recoverable amount is the higher of an asset’s fair value less costs to sell and value in use. For the purposes of assessing impairment, assets are grouped at the lowest levels for which there are separately identifiable cash flows (cash-generating units). Non-financial assets other than goodwill that suffered an impairment are reviewed for pos-sible reversal of the impairment at each reporting date.
7. FINANCIAl ASSetS
ClassificationThe Group classifies its financial assets in the following catego-ries: at fair value through profit or loss, loans and receivables, and available-for-sale. The classification depends on the purpose for which the financial assets were acquired. Management de-termines the classification of its financial assets at initial recogni-tion.
(a) Financial assets at fair value through profit or lossFinancial assets at fair value through profit or loss are financial assets held for trading. A financial asset is classified in this cat-egory if acquired principally for the purpose of selling in the short-term. Derivatives are also categorised as held for trading unless they are designated as hedges. Assets in this category are clas-sified as current assets if expected to be settled within 12 months; otherwise they are classified as non-current.
(b) Loans and receivablesLoans and receivables are non-derivative financial assets with fixed or determinable payments that are not quoted in an active market. They are included in current assets, except for maturities greater than 12 months after the balance sheet date. These are classified as non-current assets. The Group’s loans and receiv-ables comprise ‘trade and other receivables’ and cash and cash equivalents in the statement of financial position.

121Further InformationConsolidated Financial StatementsConsolidated Management ReportTo Our ShareholdersManagement Board Letter
Notes to the consolidated financial statements
covered. The Group assesses at the end of each reporting pe-riod whether there is objective evidence that a financial asset or group of financial assets is impaired. Such impairment losses are not reversed.
8. OFFSettING FINANCIAl INStRuMeNtS
Financial assets and liabilities are offset and the net amount is reported in the consolidated statement of financial position when there is a legally enforceable right to offset the recognised amounts and there is an intention to settle on a net basis, or realise the asset and settle the liability simultaneously.
9. DeRIvAtIve FINANCIAl INStRuMeNtS AND heDGING
ACtIvItIeS
Derivatives are initially recognised at fair value on the date a de-rivative contract is entered into and are subsequently re-mea-sured at their fair value. The method of recognising the resulting gain or loss depends on whether the derivative is designated as a hedging instrument, and if so, the nature of the item being hedged. Gains and losses from trading derivatives are recog-nised in profit or loss.
Derivatives included in hedge accounting are generally desig-nated as either:
Hedges of the fair value of recognised assets or liabilities or a firm commitment (fair value hedge);
Hedges of a particular risk associated with a recognised asset or liability or a highly probable forecast transaction (cash flow hedge); or
Hedges of a net investment in a foreign operation (net invest-ment hedge).
At NORMA Group, only cash flow hedges are used.
At the inception of the transaction, the relationship between the hedging instrument and hedged item is documented, as well as the risk management objectives and the strategy for undertaking the hedging transaction. The Group also documents its assess-ment, both at hedge inception and on an ongoing basis, of wheth-er the derivatives that are used in hedging transactions are highly effective in offsetting changes in the cash flows of hedged items.
The effective portion of changes in the fair value of derivatives that are designated and qualify as cash flow hedges is recog-nised in other comprehensive income. The gain or loss relating to the ineffective portion is recognised immediately in the state-ment of comprehensive income within ‘financial income/costs.’ Amounts accumulated in other comprehensive income are re-classified to profit or loss in the periods when the hedged item affects profit or loss.
The Group, for economic or legal reasons relating to the bor-rower’s financial difficulty, granting to the borrower a conces-sion that the lender would not otherwise consider;
It becomes probable that the borrower will enter bankruptcy or other financial reorganisation;
Observable data indicating that there is a measurable de-crease in the estimated future cash flows from a portfolio of financial assets since the initial recognition of those assets, although the decrease cannot yet be identified with the indi-vidual financial assets in the portfolio, including:
(i) Adverse changes in the payment status of borrowers in the portfolio; and
(ii) National or local economic conditions that correlate with defaults on the assets in the portfolio.
The Group first assesses whether objective evidence of impair-ment exists.
The amount of the loss is measured as the difference between the asset’s carrying amount and the present value of estimated future cash flows (excluding future credit losses that have not been incurred) discounted at the financial asset’s original effec-tive interest rate. The asset’s carrying amount is reduced and the amount of the loss is recognised in profit or loss. If a loan has a variable interest rate, the discount rate for measuring any impair-ment loss is the current effective interest rate determined under the contract.
If, in a subsequent period, the amount of the impairment loss decreases and the decrease can be related objectively to an event occurring after the impairment was recognised (such as an improvement in the debtor’s credit rating), the reversal of the previously recognised impairment loss is recognised in profit or loss.
Impairment testing of trade receivables is described in section 3.11.
(b) Assets classified as available-for-saleThe Group carries its available-for-sale financial assets at cost. To assess whether there is objective evidence that an available-for-sale financial asset or a group of financial assets is impaired, refer to the criteria and methods mentioned in (a) above. In ad-dition to these criteria and methods, objective evidence of impair-ment for an investment in an equity instrument includes informa-tion about significant changes with an adverse effect that have taken place in the technological, market, economic or legal en-vironment in which the issuer operates, and indicates that the cost of the investment in the equity instrument may not be re-
122 NORMA Group AG Annual Report 2012
12. CASh AND CASh equIvAleNtS
Cash and cash equivalents includes cash in hand, deposits held at call with banks, and other short-term highly liquid investments with original maturities of three months or less. Bank overdrafts are shown within borrowings in current liabilities on the consoli-dated statement of financial position.
13. tRADe PAyAbleS
Trade payables are obligations to pay for goods or services that have been acquired in the ordinary course of business from sup-pliers. Accounts payable are classified as current liabilities if pay-ment is due within one year or less. If not, they are presented as non-current liabilities.
Trade payables are recognised initially at fair value and subse-quently measured at amortised cost using the effective interest method.
14. bORROwINGS
Borrowings are recognised initially at fair value, net of transaction costs incurred. Borrowings are subsequently stated at amortised cost; any difference between the proceeds (net of transaction costs) and the redemption value is recognised in profit or loss over the period of the borrowings using the effective interest method.
Fees paid on the establishment of loan facilities are recognised as transaction costs of the loan to the extent that it is probable that some or all of the facility will be drawn down. In this case, the fee is deferred until the draw-down occurs. To the extent that there is no evidence that it is probable that some or all of the facility will be drawn down, the fee is capitalised as a pre-pay-ment for liquidity services and amortised over the period of the facility to which it relates.
Borrowings are classified as current liabilities unless the Group has an unconditional right to defer settlement of the liability for at least 12 months after the balance sheet date.
15. CuRReNt AND DeFeRReD INCOMe tAx
The tax expenses for the period are comprised of current and deferred tax. Tax is recognised in profit or loss, except to the extent that it relates to items recognised in other comprehensive income or directly in equity. In this case, the tax is also recog-nised in other comprehensive income or directly in equity, re-spectively.
The current income tax charge is calculated on the basis of the tax laws enacted or substantively enacted at the balance sheet date in the countries where the company’s subsidiaries operate and generate taxable income. Management periodically evalu-ates positions taken in tax returns with respect to situations in
The full fair value of a hedging derivative is classified as a non-current asset or liability when the remaining maturity of the hedged item is more than 12 months and as a current asset or liability when the remaining maturity of the hedged item is less than 12 months. Trading derivatives are classified as non-current assets or liabilities in accordance with IAS 1.68 and 1.71 if they are due after more than one year; otherwise they are classified as current.
The fair values of derivative financial instruments used for hedg-ing purposes and of those held for trading are disclosed in Note 23. Movements on the hedging reserve in equity are shown in Note 27.
10. INveNtORIeS
Inventories are stated at the lower of cost and net realisable value. Net realisable value is the estimated selling price in the ordinary course of business, less applicable variable selling ex-penses. Cost is determined using the weighted-average-meth-od. The cost of finished goods and work in progress comprises of design costs, raw materials, direct labour, other direct costs and related production overheads (based on normal operating capacity). Borrowing costs that are directly attributable to the acquisition, construction or production of a qualifying asset are included in the cost of that asset. A qualifying asset is an asset that necessarily takes a substantial period of time to prepare it for its intended use or sale. In general, the Group’s inventories are not qualifying assets, and borrowing costs are therefore ex-cluded from costs.
11. tRADe ReCeIvAbleS
Trade receivables are amounts due from customers for merchan-dise sold or services performed in the ordinary course of busi-ness. If collection is expected within one year or less, they are classified as current assets. If not, they are presented as non-current assets.
Trade receivables are recognised initially at fair value and subse-quently measured at amortised cost using the effective interest method, less provision for impairment. An allowance of doubtful accounts of trade receivables is established when there is objec-tive evidence that the Group will not be able to collect all amounts due according to the original terms of the receivables. Significant financial difficulties of the debtor, the probability that the debtor will enter bankruptcy or financial reorganisation, and default or delinquency in payments are considered indicators that the trade receivable is impaired. The amount of the allowance is the differ-ence between the asset’s carrying amount and the present value of estimated future cash flows, discounted at the original effective interest rate.

123Further InformationConsolidated Financial StatementsConsolidated Management ReportTo Our ShareholdersManagement Board Letter
Notes to the consolidated financial statements
date less the fair value of plan assets, if any, together with adjust-ments for unrecognised past-service costs. The defined benefit obligation is calculated annually by independent actuaries using the projected unit credit method. The present value of the de-fined benefit obligation is determined by discounting the esti-mated future cash outflows using interest rates of high-quality corporate bonds that are denominated in the currency in which the benefits will be paid and that have terms to maturity ap-proximating the terms of the related pension liability.
According to IAS 19, actuarial gains and losses arising from ex-perience adjustments and changes in actuarial assumptions can be either recognised using the corridor approach or the SORIE method. To avoid volatility in profit or loss, NORMA Group uses the SORIE method where actuarial gains and losses are charged or credited to retained earnings in other comprehensive income in the period in which they arise.
Past-service costs are recognised immediately in income, unless the changes to the pension plan are conditional on the employ-ees remaining in service for a specified period of time (the vesting period). In this case, the past service costs are amortised on a straight-line basis over the vesting period.
For defined contribution plans, the Group pays contributions to publicly or privately administered pension insurance plans on a mandatory, contractual or voluntary basis. The Group has no further payment obligations once the contributions have been paid. The contributions are recognised as employee benefits expense when they are due. Prepaid contributions are recog-nised as an asset to the extent that a cash refund or a reduction in the future payments is available.
(b) Termination benefitsTermination benefits are payable when employment is termi-nated by the Group before the normal retirement date, or when-ever an employee accepts voluntary redundancy in exchange for these benefits. The Group recognises termination benefits when it is demonstrably committed to either terminating the employ-ment of current employees according to a detailed formal plan without a realistic possibility of withdrawal, or providing termina-tion benefits as a result of an offer made to encourage voluntary redundancy. Benefits falling due more than 12 months after the balance sheet date are discounted to their present value.
17. ShARe-bASeD PAyMeNt
Share-based payment plans issued in the NORMA Group are accounted for in accordance with IFRS 2 “Share-based pay-ment” (see also Note 27). All share-based payment transactions fall within the scope of IFRS 2, unless the transaction is clearly for a purpose other than payment for goods or services supplied to the entity receiving them. The objective of IFRS 2 is that an
which applicable tax regulation is subject to interpretation. It es-tablishes provisions where appropriate on the basis of amounts expected to be paid to the tax authorities.
Deferred income tax is recognised using the liability method on temporary differences arising between the tax bases of assets and liabilities and their carrying amounts in the consolidated fi-nancial statements and on tax losses carried forward. However, the deferred income tax is not accounted for if it arises from initial recognition of an asset or liability in a transaction other than a business combination that at the time of the transaction affects neither accounting nor taxable profit or loss. Deferred income tax is determined using tax rates (and laws) that have been en-acted or substantially enacted by the balance sheet date and are expected to apply when the related deferred income tax asset is realised or the deferred income tax liability is settled.
Deferred income tax assets are recognised only to the extent that it is probable that future taxable profit will be available against which the temporary differences can be utilised.
Deferred income tax is provided on temporary differences arising on investments in subsidiaries and associates, except where the timing of the reversal of the temporary difference is controlled by the Group and it is probable that the temporary difference will not reverse in the foreseeable future.
Deferred income tax assets and liabilities are offset when there is a legally enforceable right to offset current tax assets against current tax liabilities and when the deferred income tax assets and liabilities relate to income taxes levied by the same taxation authority on either the taxable entity or different taxable entities where there is an intention to settle the balances on a net basis.
16. eMPlOyee beNeFItS
(a) Pension obligationsGroup companies operate different pension schemes. NORMA Group has both defined benefit and defined contribution plans. A defined contribution plan is a pension plan under which the Group pays fixed contributions to a separate entity. The Group has no legal or constructive obligations to pay further contribu-tions if the fund does not hold sufficient assets to pay all employ-ees the benefits relating to employee service in the current and prior periods. A defined benefit plan is a pension plan that is not a defined contribution plan. The major defined benefit plan is the German benefit plan which defines the amount of pension ben-efit that an employee will receive upon retirement to depend on years of service and compensation.
The liability recognised in the consolidated statement of financial position with respect to defined benefit pension plans is the pres-ent value of the defined benefit obligation at the balance sheet

124 NORMA Group AG Annual Report 2012
The Group recognises revenue when the amount of revenue can be reliably measured, it is probable that future economic benefits will flow to the entity and when specific criteria have been met for each of the Group’s activities as described below. The amount of revenue is not considered to be reliably measurable until all contingencies relating to the sale have been resolved. The Group bases its estimates on historical results, taking into consideration the type of customer, the type of transaction and the specifics of each arrangement.
20. leASeS
Leases in which a significant portion of the risks and rewards of ownership are retained by the lessor are classified as operating leases. Payments made under operating leases (net of any incen-tives received from the lessor) are charged to profit or loss on a straight-line basis over the period of the lease.
The Group leases certain property, plant and equipment. Leas-es of property, plant and equipment where the Group has sub-stantially all the risks and rewards of ownership are classified as finance leases. Finance leases are capitalised at the lease’s com-mencement at the lesser of the fair value of the leased property and the present value of the minimum lease payments.
Each lease payment is allocated between the liability and finance charges so as to achieve a constant rate on the finance balance outstanding. The corresponding rental obligations, net of finance charges, are included in other long-term payables. The interest element of the finance cost is charged to profit or loss over the lease period so as to produce a constant periodic rate of interest on the remaining balance of the liability for each period. The property, plant and equipment acquired under finance leases is depreciated over the shorter of the useful life of the asset and the lease term.
21. GOveRNMeNt GRANtS
Government grants are not recognised until there is reasonable assurance that the conditions attached to them are complied with and that the grants will be received. Government grants for the compensation of expenses incurred are recognised in profit or loss on a systematic basis over the periods in which the re-lated costs are expensed for which the grants are intended to compensate. Grants related to non-depreciable assets are rec-ognised in profit or loss over the periods that bear the cost of meeting the obligations.
entity should recognise all goods or services it obtains, regard-less of the form of consideration. Where goods or services are obtained for cash or other financial assets, the accounting is generally straightforward. IFRS 2 starts from the premise that goods or services obtained in a share-based payment transac-tion should be recognised and measured in a similar way.
In accordance with IFRS 2, NORMA Group distinguishes be-tween equity-settled and cash-settled plans. The financial inter-est from equity-settled plans granted at grant date is generally allocated over the expected vesting period against equity until the exit event occurs. Expenses from cash-settled plans are gen-erally also allocated over the expected vesting period until the exit event occurs, but against accruals.
18. PROvISIONS
Provisions are recognised when: the Group has a present legal or constructive obligation to third parties as a result of past events; it is probable that an outflow of resources will be required to settle the obligation; and the amount has been reliably esti-mated. Provisions are not recognised for future operating losses.
Where there are a number of similar obligations, the likelihood that an outflow will be required in settlement is determined by considering the class of obligations as a whole. A provision is recognised even if the likelihood of an outflow with respect to any one item included in the same class of obligations may be small.
Provisions are measured at the present value of the expenditures expected to be required to settle the obligation taking into ac-count all identifiable risks. Provisions are discounted using a pre-tax rate that reflects current market assessments of the time value of money and the risks specific to the obligation. The in-crease in the provision due to passage of time is recognised as interest expense.
19. ReveNue ReCOGNItION
Revenue comprises the fair value of the consideration received or receivable for the sale of goods and services in the ordinary course of the Group’s activities. Revenue is shown net of value-added tax, returns, rebates and discounts and after eliminating sales within the Group. It is recognised in the accounting period in which they are earned in accordance with the realisation prin-ciple.
125Further InformationConsolidated Financial StatementsConsolidated Management ReportTo Our ShareholdersManagement Board Letter
Notes to the consolidated financial statements
5. FINANCIAl RISk MANAGeMeNt
1. FINANCIAl RISk FACtORS
The Group’s activities expose it to a variety of financial risks, comprising of market risk, credit risk and liquidity risk. The Group’s financial risk management focuses on the unpredict-ability of financial markets and seeks to minimise its potential adverse effects on the Group’s financial performance. The Group uses derivative financial instruments to hedge certain risk expo-sures.
Financial risk management is carried out by a central treasury department (Group Treasury). The necessary responsibilities and controls associated with risk management are determined by Group management. Group Treasury identifies, evaluates and hedges financial risks in close co-operation with the Group’s operating units.
Market risk(i) Foreign exchange risk NORMA Group operates internationally in 100 different countries and is exposed to foreign exchange risk arising from the expo-sure to various currencies – primarily with respect to the US-dollar, the British pound sterling, the Chinese renminbi yuan, the Polish zloty and the Swedish krona.
Foreign exchange risk at 31 December 2012 arises from future commercial transactions net long USD position of EUR 1.2 million (31 December 2011: EUR 0.8 million), net long GBP position of EUR 3.4 million (31 December 2011: EUR 1.3 million), net short CNY position of EUR – 2.5 million (31 December 2011: EUR 0.03 million), net long PLN position of EUR of 9.1 million (31 December 2011: EUR 7.8 million) and net long SEK position of EUR 1.1 mil-lion (31 December 2011: EUR 0.6 million).
The effects of changes in foreign exchange rates are analysed below for financial assets and liabilities denominated in foreign currencies.
If the US dollar had weakened/strengthened by 10 % against the euro, NORMA Group would show a post-tax profit for the year 2012 of EUR 102 thousand lower/ EUR 125 thousand higher (2011: EUR 76 thousand lower/ EUR 93 thousand higher).
If the British pound Sterling had weakened/ strengthened by 10 % against the euro, NORMA Group would show a post-tax profit for the year 2012 of EUR 309 thousand lower/ EUR 378 thousand higher (2011: EUR 115 thousand lower/ EUR 141 thousand higher).
4. SCOPe OF CONSOlIDAtION
With NORMA Group AG, the consolidated financial statements contain all German and foreign companies which NORMA Group AG controls directly or indirectly. Investments in associates for which NORMA Group has no significant influence are accounted for in accordance with IAS 39. At 31 December 2012, NORMA Group did account no company in accordance with IAS 39 (31 December 2011: 30 % share in Groen Bevestigingsmaterialen B.V.).
The consolidated financial statements of 2012 include eight Ger-man (31 December 2011: eight) and 35 foreign (31 December 2011: 33) companies.
The composition of the Group changed as follows:
In 2012, NORMA Group acquired Connectors Verbindung-stechnik AG (Switzerland), Nordic Metalblok S.rl. (Italy) and Chien Jin Plastic Sdn. Bhd. (Malaysia). In addition, 60 % of the shares of Groen Bevestigingsmaterialen B.V. (Netherlands) were acquired, of which NORMA Group already held 30 %. Groen Bevestigingsmaterialen B.V. was accounted for in ac-cordance with IAS 39 in 2011 and is now fully consolidated.
For further details, refer to Note 39 business combinations.
In 2012, the inactive companies SCI Seran and Jiangyin Auto-motive Products Co. Ltd. left the basis of consolidation. No material effects occurred on the financial position, financial performance and cash flows of NORMA Group.
For a detailed overview regarding the shareholdings of NORMA Group, please refer to the chart on the next page. Due to busi-ness relationships between the subsidiaries and the different allocation of research and development activities, the results of the single entities have only limited significance on the result of the segments.
2012
2011
At 1 January 41 38
Additions 4 3
of which newly founded 0 3
of which acquired 4 0
Disposals 2 0
of which no longer consolidated 2 0
of which mergers 0 0
At 31 December 43 41

126 NORMA Group AG Annual Report 2012
lISt OF GROuP COMPANIeS OF NORMA GROuP AS At 31 DeCeMbeR 2012
Share in %
No.
Company
Registered address
held by
Direct parent
company
of NORMA
Group AG
Cur-rency
Equity 1)
Result 1)
Central Functions
01 NORMA Group AG Maintal, Germany
02 NORMA Group APAC Holding GmbH Maintal, Germany 01 100.00 100.00 TEUR 46 – 3
03 NORMA Group Holding GmbH Maintal, Germany 01 100.00 100.00 TEUR 95,900 17,902
04 NORMA Beteiligungs GmbH Maintal, Germany 03 100.00 100.00 TEUR 9,291 9,507
Segment eMeA
05 NORMA Distribution Center GmbH Marsberg, Germany 03 94.80 100.00 TEUR 2,174 5)
06 DNL GmbH & Co KG Maintal, Germany 03 100.00 100.00 TEUR 6,543 – 1
07 NORMA Germany GmbH Maintal, Germany 03 94.90 100.00 TEUR 56,306 5)
08 NORMA Türkei Verwaltungs GmbH Munich, Germany 04 100.00 100.00 TEUR 17 – 3
09 DNL France S.A.S Briey, France 04 100.00 100.00 TEUR 13,496 1,271
10 NORMA Distribution France S.A.S. La Queue En Brie, France 09 100.00 100.00 TEUR 3,023 533
11 NORMA France S.A.S. Briey, France 09 100.00 100.00 TEUR 5,958 743
12 DNL UK Ltd. Newbury, UK 04 100.00 100.00 TGBP 4,119 – 393
13 NORMA UK Ltd. Newbury, UK 12 100.00 100.00 TGBP 13,779 4,110
14 Nordic Metalblok S.r.l. Riese Pio X, Italy 04 100.00 100.00 TEUR 770 – 133
15 NORMA Italia SpA Gavardo, Italy 20 100.00 100.00 TEUR 5,670 906
16 Groen Bevestigingsmaterialen B.V. Pumerend, Netherlands 03 60.00 90.00 TEUR 1,681 4)
17 NORMA Netherlands B.V. Ter Apel, Netherlands 20 100.00 100.00 TEUR 4,908 2,758
18 NORMA Polska Sp. z o.o. Slawniów, Poland 04 100.00 100.00 TPLN 115,840 32,616
19 NORMA Group CIS LLC Togliatti, Russia 04 99.50 100.00 TRUR – 14,703 – 18,606
20 DNL Sweden AB Stockholm, Sweden 04 100.00 100.00 TSEK 60,327 – 250
21 NORMA Sweden AB Anderstorp, Sweden 20 100.00 100.00 TSEK 97,268 26,500
22 Connectors Verbindungstechnik AG Tagelswangen, Switzerland 04 100.00 100.00 TCHF 8,942 2,621
23 NORMA Group South East Europe d.o.o Belgrade, Serbia 04 100.00 100.00 TRSD 1,487,808 – 100,731
24 Fijaciones NORMA S.A. Barcelona, Spain 04 100.00 100.00 TEUR 4,910 632
25 NORMA Czech, s.r.o. Hustopece, Czech Republic 20 99.90 100.00 TCZK 242,997 28,460
26
NORMA Turkey Baglanti ve Birlestirme Teknolojileri Sanayi ve Ticaret Limited Sirketi
Besiktas, Istanbul, Turkey
08
99.00
100.00
TTRL
682
139
Segment Americas
27 Craig Assembly Inc. St. Clair, USA 30 100.00 100.00 TUSD 15,061 2,127
28 NORMA Michigan Inc. (former Torca Products Inc.) Auburn Hills, USA 30 100.00 100.00 TUSD 53,665 11,322
29 NORMA US Holding LLC (former BIPC LLC) Saltsburg, USA 30 100.00 100.00 TUSD 27,940 – 1,150
30 NORMA Pennsylvania Inc. (former Breeze I.P.C.) Saltsburg, USA 04 100.00 100.00 TUSD 46,416 4,612
31 R.G. RAY Corporation Buffalo Grove, USA 30 100.00 100.00 TUSD 63,376 8,694
32 NORMA do Brasil Sistemas De Conexão Ltda. São Paulo, Brasil 30 99.90 100.00 TBRL – 288 – 402
33 NORMA Group México S. de R.L. de C.V. Monterrey, Mexico 28 99.50 100.00 2) 2)
Segment Asia-Pacific
34 NORMA Pacific Pty. Ltd. Melbourne, Australia 41 100.00 100.00 TAUD 15,849 9,357
35 NORMA China Co., Ltd. Qingdao, China 03 100.00 100.00 TCNY 72,303 16,765
36 NORMA Group Products India Pvt. Ltd. Pune, India 41 99.99 100.00 TINR 260,942 – 73,288
37 NORMA Japan Inc. Osaka, Japan 41 60.00 60.00 TJPY 119,356 119
38 Chien Jin Plastic Sdn. Bhd. Ipoh, Malysia 41 85.00 100.00 TMYR 21,441 334
39 NORMA Pacific (Malaysia) SDN. BHD. Kuala Lumpur, Malaysia 41 100.00 100.00 3) 3)
40 NORMA Korea Inc. Seoul, Republik Korea 41 100.00 100.00 TKRW – 884 – 78,528
41 NORMA Group Asia Pacific Holding Pte. Ltd Singapore, Singapore 01 100.00 100.00 TSGD 16,641 2,748
42 NORMA Pacific Asia Pte. Ltd. Singapore, Singapore 41 100.00 100.00 TSGD 212 – 529
43 NORMA Pacific (Thailand) Ltd. Chonburi, Thailand 41 100.00 100.00 TTHB 53,056 37,658
1) Reported values according to IFRS as at 31 December 2012, except NORMA Group Holding GmbH, NORMA Beteiligungs GmbH, NORMA Germany GmbH, NORMA Distribution Center GmbH and DNL GmbH & Co. KG.; these values are according to preliminary German GAAP results.
2) Included in NORMA Michigan Inc.3) Included in NORMA Pacific Pty. Ltd.4) The company was acquired as at 31 December 2012.5) A profit-pooling-contract exists.

127Further InformationConsolidated Financial StatementsConsolidated Management ReportTo Our ShareholdersManagement Board Letter
Notes to the consolidated financial statements
Credit riskThe credit risk incurred by the Group is the risk that counterpar-ties fail to meet their obligations arising from operating activities and from financial transactions. Credit risk arises from cash and cash equivalents and deposits with banks and financial institu-tions, as well as credit exposures to customers, including out-standing receivables and committed transactions.
Credit risk is monitored on a Group basis. To minimise credit risk from operating activities and financial transactions, each coun-terparty is assigned a credit limit, the use of which is regularly monitored. Default risks are continuously monitored in the oper-ating business.
The aggregate carrying amounts of financial assets represent the maximum default risk. For an overview of past-due receivables, please refer to Note 24 ‘Trade and other receivables.’ Given the Group’s heterogeneous customer structure, there is no risk con-centration.
liquidity riskPrudent liquidity risk management implies maintaining sufficient cash and marketable securities, the availability of funding through an adequate amount of committed credit facilities and the ability to close out market positions. Due to the dynamic nature of the underlying businesses, Group Treasury maintains flexibility in funding by maintaining availability under committed credit lines.
With the IPO of NORMA Group in April 2011, all bank borrowings were refinanced. The new syndicated bank facilities amounted to EUR 250 million, of which EUR 30 million had been repaid before 31 December 2012. In addition, a borrowing facility in the amount of EUR 125 million is available for future operating ac-tivities and to settle capital commitments of which EUR 18.5 mil-lion was drawn at 31 December 2012 (31 December 2011: EUR 0 million).
Liquidity is monitored on an on-going basis with regard to the Group’s business performance, planned investment and re-demption of capital.
The amounts disclosed in the table are the contractual, undis-counted cash flows. Financial liabilities denominated in foreign currencies are translated at the closing rate at the balance sheet date. Interest payments on financial instruments with variable interest rates are calculated on the basis of the interest rates applicable as of the reporting date.
If the Chinese renminbi yuan had weakened/strengthened by 10 % against the euro, NORMA Group would show a post-tax profit for the year 2012 of EUR 225 thousand higher/ EUR 275 thousand lower. There were no material effects in 2011.
If the Polish złoty had weakened / strengthened by 10 % against the euro, NORMA Group would show a post-tax profit for the year 2012 of EUR 830 thousand lower/ EUR 1,014 thousand higher (2011: EUR 707 thousand lower/ EUR 865 thousand higher).
If the Swedish krona had weakened / strengthened by 10 % against the euro, NORMA Group would show a post-tax profit for the year 2012 of EUR 101 thousand lower / EUR 123 thousand higher (2011: EUR 56 thousand lower / EUR 68 thousand higher).
The Group treasury’s risk management policy is to hedge about 80 % or more of anticipated operational cash flows in US dollar, British Pound sterling and Swedish krona.
NORMA Group has certain investments in foreign operations whose net assets are exposed to foreign currency translation risks. This translation risk is primarily managed through borrow-ings in the relevant foreign currency.
(ii) Interest rate risk NORMA Group’s interest rate risk arises from long-term borrow-ings. Borrowings issued at variable interest rates expose the Group to cash flow interest rate risk which is partially offset by hedges (interest rate swaps). The Group’s policy is to maintain approximately 80 % of its medium-term borrowings in fixed rate instruments.
Below, the effects of changes in interest rates are analysed for bank borrowings, which bear variable interest rates, and for inter-est rate swaps included in hedge accounting. Borrowings that bear fixed interest rates are excluded from this analysis.
At 31 December 2012, if interest rates on euro-denominated bor-rowings had been 100 basis points higher/lower with all other variables held constant, post-tax profit for the year would have been EUR 185 thousand lower/EUR 185 thousand higher (2011: EUR 2,259 thousand lower/EUR 2,262 higher) and other com-prehensive income would have been EUR 2,317 thousand high-er/EUR 862 thousand lower (2011: EUR 753 thousand higher/EUR 825 thousand lower).
(iii) Other price risksAs NORMA Group is not exposed to any other material eco-nomic price risks, like stock exchange prices or commodity prices, an increase or decrease in the relevant market prices within reasonable margins would not have an impact on the Group’s profit or equity. Hence, the Group’s exposure to other price risks is regarded as not material.

128 NORMA Group AG Annual Report 2012
2. CAPItAl RISk MANAGeMeNt
The Group’s objectives when managing capital are to ensure that it will continue to be able to repay its debt and remain financially sound. The Group is subject to certain financial covenants, total interest cover, total net debt cover, and equity ratio, which are monitored on an on-going basis. These financial covenants are based on the Group’s consolidated financial statements as well as on spe-cial definitions of the bank facilities agreements.
According to the covenants agreement, total net debt cover, which is defined as Total net debt / Adjusted consolidated EBITDA, should not exceed the value of 3.0 (2011: 3.5). The ratio is not included in the International Financial Reporting Standards and is calculated according to bank definitions. There were no cov-enant breaches in 2012 and 2011.
In the case of a covenant breach, the Facility Agreement includes several ways to remedy a potential breach by rules of exemption or shareholder actions. If a covenant breach occurs and is not remedied, the syndicated loans may, but are not required to be, withdrawn.
31 DeCeMbeR 2011
in EUR ’000
Less than 1 year
Between
1 and 2 years
Between
2 and 5 years
Over 5 years
Derivative receivables – net settlement
Cash inflows 44
Derivative liabilities – gross settlement
Cash outflows – 309
Cash inflows 291
Derivative liabilities – net settlement
Cash outflows – 21,809
– 18 44 – 21,809 0
The maturity structure of the derivative financial instruments based on cash flows is as follows:
31 DeCeMbeR 2012
in EUR ’000
Less than 1 year
Between
1 and 2 years
Between
2 and 5 years
Over 5 years
Borrowings 60,215 90,645 127,291 0
Trade payables 37,663 0 0 0
Finance lease liabilities 450 553 32 0
Other financial liabilities
1,820
1,792
489
0
100,148 92,990 127,812 0
31 DeCeMbeR 2011
in EUR ’000
Less than 1 year
Between
1 and 2 years
Between
2 and 5 years
Over 5 years
Borrowings 30,686 32,541 208,182 0
Trade payables 41,373 0 0 0
Finance lease liabilities 431 343 391 0
Other financial liabilities
1,145
0
0
0
73,635 32,884 208,573 0
31 DeCeMbeR 2012
in EUR ’000
Less than 1 year
Between
1 and 2 years
Between
2 and 5 years
Over 5 years
Derivative receivables - gross settlement
Cash outflows – 2,658
Cash inflows 2,761
Derivative liabilities - gross settlement
Cash outflows – 2,561
Cash inflows 2,447
Derivative liabilities - net settlement
Cash outflows – 24,675
– 11 0 – 24,675 0
129Further InformationConsolidated Financial StatementsConsolidated Management ReportTo Our ShareholdersManagement Board Letter
Notes to the consolidated financial statements
estimated impairment of goodwill NORMA Group tests annually whether goodwill has suffered any impairment, in accordance with the accounting policy stated in section 3.5. The recoverable amounts of cash-generating units have been determined based on fair-value-less-costs-to-sell cal-culations. These calculations are based on discounted cash flow models, which require the use of estimates (Note 19).
In 2012 and 2011, no impairment of goodwill, which amounted to EUR 235,262 thousand at 31 December 2012 (31 December 2011: EUR 224,841 thousand), was necessary. Even if the dis-count rate would increase by + 2 % and the terminal value growth rate would be 0 %, the change of the key assumptions would not cause the carrying amount to exceed its recoverable amount in any CGU.
Income taxesThe Group is subject to income taxes in numerous jurisdictions. Significant judgements are required in determining the worldwide provision for income taxes. There are many transactions and calculations for which the ultimate tax determination is uncertain. The Group recognises liabilities for anticipated tax audit issues based on estimates of whether additional taxes will be due. Where the final tax outcome of these matters is different from the amounts that were initially recorded, such differences will impact the current and deferred income tax assets and liabilities in the period in which such determination is made. At 31 December 2012, income tax liabilities were EUR 17,827 thousand (31 De-cember 2011: EUR 8,457 thousand) and deferred tax liabilities were EUR 32,940 thousand (31 December 2011: EUR 33,775 thousand).
Pension benefitsThe present value of the pension obligations depends on a num-ber of factors that are determined on an actuarial basis using a number of assumptions. The assumptions used in determining the net cost (income) for pensions include the discount rate. Any changes in these assumptions will impact the carrying amount of pension obligations.
The Group determines the appropriate discount rate at the end of each year. This is the interest rate that should be used to de-termine the present value of estimated future cash outflows ex-pected to be required to settle the pension obligations. In deter-mining the appropriate discount rate, the Group considers the interest rates of high-quality corporate bonds that are denomi-nated in the currency in which the benefits will be paid, and that have terms to maturity approximating the terms of the related pension liability.
3. FAIR vAlue eStIMAtION
The amendment to IFRS 7 for financial instruments that are mea-sured in the statement of financial position at fair value requires disclosure of fair value measurements by level using the following fair value measurement hierarchy:
Level 1: Quoted prices (unadjusted) in active markets for identical assets or liabilitiesLevel 2: Inputs other than quoted prices included within Level 1 that are observable for the asset or liability, either directly (that is, as prices) or indirectly (that is, derived from prices)Level 3: Inputs for the asset or liability that are not based on observable market data (that is, unobservable inputs).
The level in the fair value hierarchy within which the fair value measurement is categorised in total is determined on the basis of the lowest level input that is significant to the fair value mea-surement in total. The different hierarchy levels demand different amounts of disclosure.
At 31 December 2012 and 2011, the Group’s financial instru-ments carried in the statement of financial position at fair value (i.e. trading derivatives and derivatives used for hedging) are cat-egorised in total within level 2 of the fair value hierarchy.
The fair value of interest rate swaps and cross-currency-swaps is calculated as the present value of the estimated future cash flows. The fair value of forward foreign exchange contracts is determined using a present value model based on forward ex-change rates.
6. CRItICAl ACCOuNtING eStIMAteS AND JuDGeMeNtS
Estimates and judgments are continually evaluated and are based on historical experience and other factors, including expectations of future events that are believed to be reasonable under the circumstances.
The Group makes estimates and assumptions concerning the future. The resulting accounting estimates will, by definition, sel-dom equal the respective actual results. The estimates and as-sumptions that have a significant risk of causing a material adjust-ment to the carrying amounts of assets and liabilities within the next financial year are addressed below.

130 NORMA Group AG Annual Report 2012
Notes to the consolidated statement of comprehensive income
7. ADJuStMeNtS
Particularly due to costs in connection with the initial public of-fering (IPO) of NORMA Group in April of 2011, the result for the period was influenced by non-recurring expenses and restructur-ing costs. In the financial year 2012, only depreciation and am-ortisation from purchase price allocations were adjusted.
The following table shows profit and loss net of these expenses:
in EUR ’000
Notes
2012
2011
Revenue (8) 604,613 581,356
Changes in inventories of finished goods and work in progress
3,259
3,500
Raw materials and consumables used (9) – 263,489 – 262,282
Gross profit 344,383 322,574
Other operating income and expenses (in 2011 adjusted)
(10, 11)
– 67,090
– 67,118
Employee benefits expense (in 2011 adjusted)
(12)
– 156,468
– 138,437
ebItDA (in 2011 adjusted) 120,825 117,019
Depreciation without PPA depreciation – 15,392 – 14,336
Adjusted ebItA 105,433 102,683
Amortisation without PPA amortisation – 3,538 – 2,991
Adjusted operating profit (ebIt) 101,895 99,692
Financial costs - net (in 2011 adjusted) (13) – 13,269 – 17,392
Adjusted profit before income tax 88,626 82,300
Adjusted income taxes – 26,835 – 24,688
Adjusted profit for the period 61,791 57,612
Non-controlling interests 0 25
Adjusted profit attributable to shareholders of the parent
61,791
57,587
Adjusted earnings per shares (in euR)
1.94
1.92
Adjusted earnings per share (in euR) pro forma (unweighted shares at 31 December 2012)
1.94
1.81
Other key assumptions for pension obligations are based in part on current market conditions. Additional information is disclosed in section 3.16.
Pension liabilities amounted to EUR 10,319 thousand at 31 De-cember 2012 (31 December 2011: EUR 8,407 thousand). If the discount rate used were to differ by +0.25 %/ -0.25 % from man-agement’s estimates, the defined benefit obligation for pension benefits would be an estimated EUR 203 thousand lower or EUR 213 thousand higher. If the future pension increase used were to differ by +0.25 %/-0.25 % from management’s estimates, the defined benefit obligation for pension benefits would be an estimated EUR 186 thousand lower or EUR 194 thousand higher.
useful lives of property, plant and equipment and intangi-bles assetsThe Group’s management determines the estimated useful lives and related depreciation/amortisation charges for its property, plant and equipment and intangibles assets. This estimate is based on projected lifecycles. These could change as a result of technical innovations or competitor actions in response to severe industry cycles. Management will increase the depreciation charge where useful lives are less than previously estimated lives, or it will write-off or write-down technically obsolete or non-stra-tegic assets that have been abandoned or sold.

131Further InformationConsolidated Financial StatementsConsolidated Management ReportTo Our ShareholdersManagement Board Letter
Notes to the consolidated financial statements
10. OtheR OPeRAtING INCOMe
Other operating income comprised the following:
The position ‘others’ includes a one-time effect from the full con-solidation of Groen Bevestigingsmaterialen B.V. amounting to EUR 1,296 thousand. For details, please refer to Note 39 ‘Busi-ness combinations.’
Furthermore, the position ‘others’ includes mainly reversals from accruals as well as price changes.
11. OtheR OPeRAtING exPeNSeS
Other operating expenses comprised the following:
in EUR ’000
2012
2011
Currency gains operational 3,105 5,418
Reversal of provisions 367 533
Grants related to employee benefits expense
381
432
Reimbursement of vehicle costs 468 264
Other income from disposal of fixed assets 467 43
Foreign exchange derivatives 68 0
Government grants 437 0
Others 4,243 2,871
9,536 9,561
in EUR ’000
2012
2011
Consulting and marketing – 12,467 – 19,805
Expenses for temporary workforce and other personnel-related costs
– 12,045
– 13,228
Freights – 7,854 – 7,714
Other administrative expenses – 4,304 – 7,923
Rentals and other building costs – 6,063 – 6,290
Currency losses operational – 4,359 – 4,394
Travel and entertainment – 5,359 – 4,943
Research & development – 3,247 – 2,987
Vehicle costs – 2,445 – 1,948
Maintenance (external) – 1,884 – 3,010
Commission payable – 2,584 – 1,835
Non-income-related tax – 1,529 – 1,497
Insurances – 1,614 – 1,702
IT and telecommunication – 7,372 – 5,452
Others – 3,500 – 5,480
– 76,626 – 88,208
8. ReveNue
Revenue recognised during the period related to the following:
Revenue for 2012 (EUR 604,613 thousand) was 4.0 % above rev-enue for 2011 (EUR 581,356 thousand).
The sales figures for 2012 include sales of EUR 14,315 thousand from the companies acquired in 2012. Connectors Verbindung-stechnik AG (Switzerland), which was acquired in the second quarter, contributed EUR 11,535 thousand, Nordic Metalblok S.r.l. (Italy), which was acquired in the third quarter, contributed EUR 2,308 thousand and Chien Jin Plastic Sdn. Bhd. (Malaysia), which was acquired in the fourth quarter, contributed EUR 472 thousand.
For the analysis of sales by region, please refer to the segment reporting.
9. RAw MAteRIAlS AND CONSuMAbleS uSeD
Raw materials and consumables used comprised the following:
The material costs decreased in relation to revenue from 45.1 % in 2011 to 43.6 % in 2012.
The companies acquired in 2012 contributed EUR 7,067 thou-sand to the material costs.
in EUR ’000
2012
2011
Engineered Joining Technologies 427,638 411,535
Distribution Services 174,505 170,301
Other revenue 6,319 4,002
Deductions – 3,849 – 4,482
604,613 581,356
in EUR ’000
2012
2011
Material costs third parties – 237,986 – 231,639
Cost of purchased services – 25,503 – 30,643
– 263,489 – 262,282
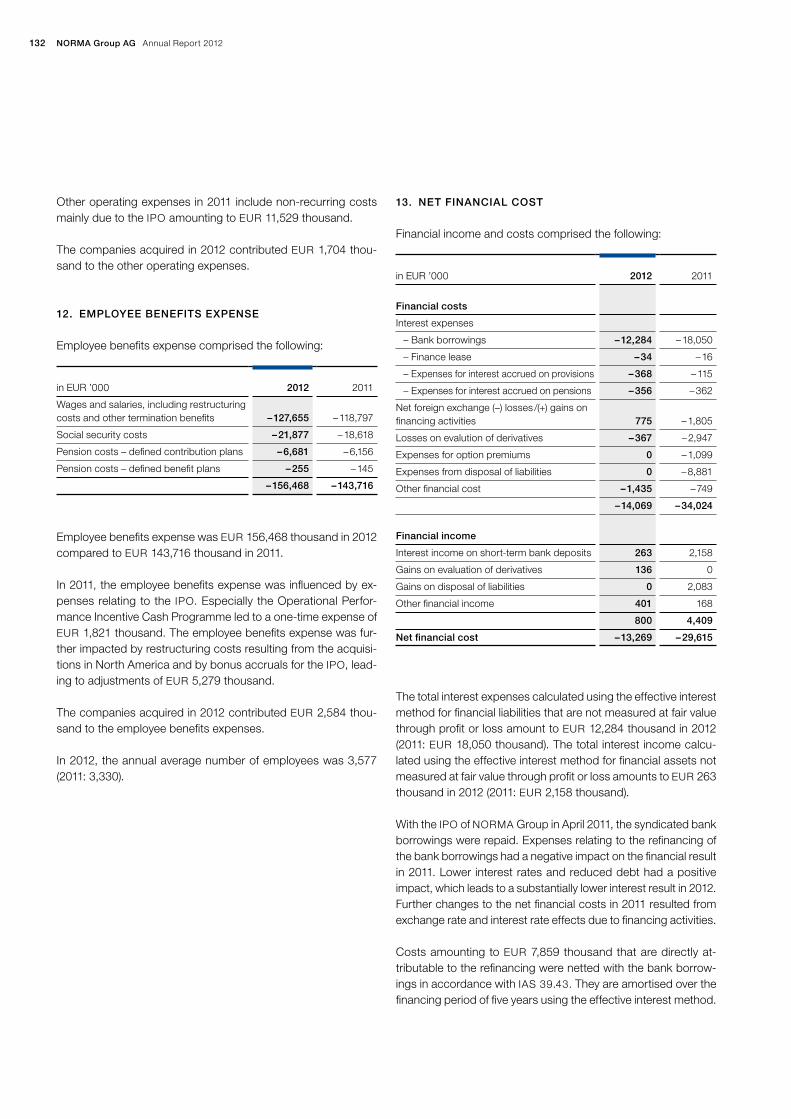
132 NORMA Group AG Annual Report 2012
13. Net FINANCIAl COSt
Financial income and costs comprised the following:
The total interest expenses calculated using the effective interest method for financial liabilities that are not measured at fair value through profit or loss amount to EUR 12,284 thousand in 2012 (2011: EUR 18,050 thousand). The total interest income calcu-lated using the effective interest method for financial assets not measured at fair value through profit or loss amounts to EUR 263 thousand in 2012 (2011: EUR 2,158 thousand).
With the IPO of NORMA Group in April 2011, the syndicated bank borrowings were repaid. Expenses relating to the refinancing of the bank borrowings had a negative impact on the financial result in 2011. Lower interest rates and reduced debt had a positive impact, which leads to a substantially lower interest result in 2012. Further changes to the net financial costs in 2011 resulted from exchange rate and interest rate effects due to financing activities.
Costs amounting to EUR 7,859 thousand that are directly at-tributable to the refinancing were netted with the bank borrow-ings in accordance with IAS 39.43. They are amortised over the financing period of five years using the effective interest method.
in EUR ’000
2012
2011
Financial costs
Interest expenses
– Bank borrowings – 12,284 – 18,050
– Finance lease – 34 – 16
– Expenses for interest accrued on provisions – 368 – 115
– Expenses for interest accrued on pensions – 356 – 362
Net foreign exchange (–) losses /(+) gains on financing activities
775
– 1,805
Losses on evalution of derivatives – 367 – 2,947
Expenses for option premiums 0 – 1,099
Expenses from disposal of liabilities 0 – 8,881
Other financial cost – 1,435 – 749
– 14,069 – 34,024
Financial income
Interest income on short-term bank deposits 263 2,158
Gains on evaluation of derivatives 136 0
Gains on disposal of liabilities 0 2,083
Other financial income 401 168
800 4,409
Net financial cost – 13,269 – 29,615
Other operating expenses in 2011 include non-recurring costs mainly due to the IPO amounting to EUR 11,529 thousand.
The companies acquired in 2012 contributed EUR 1,704 thou-sand to the other operating expenses.
12. eMPlOyee beNeFItS exPeNSe
Employee benefits expense comprised the following:
Employee benefits expense was EUR 156,468 thousand in 2012 compared to EUR 143,716 thousand in 2011.
In 2011, the employee benefits expense was influenced by ex-penses relating to the IPO. Especially the Operational Perfor-mance Incentive Cash Programme led to a one-time expense of EUR 1,821 thousand. The employee benefits expense was fur-ther impacted by restructuring costs resulting from the acquisi-tions in North America and by bonus accruals for the IPO, lead-ing to adjustments of EUR 5,279 thousand.
The companies acquired in 2012 contributed EUR 2,584 thou-sand to the employee benefits expenses.
In 2012, the annual average number of employees was 3,577 (2011: 3,330).
in EUR ’000
2012
2011
Wages and salaries, including restructuring costs and other termination benefits
– 127,655
– 118,797
Social security costs – 21,877 – 18,618
Pension costs – defined contribution plans – 6,681 – 6,156
Pension costs – defined benefit plans – 255 – 145
– 156,468 – 143,716
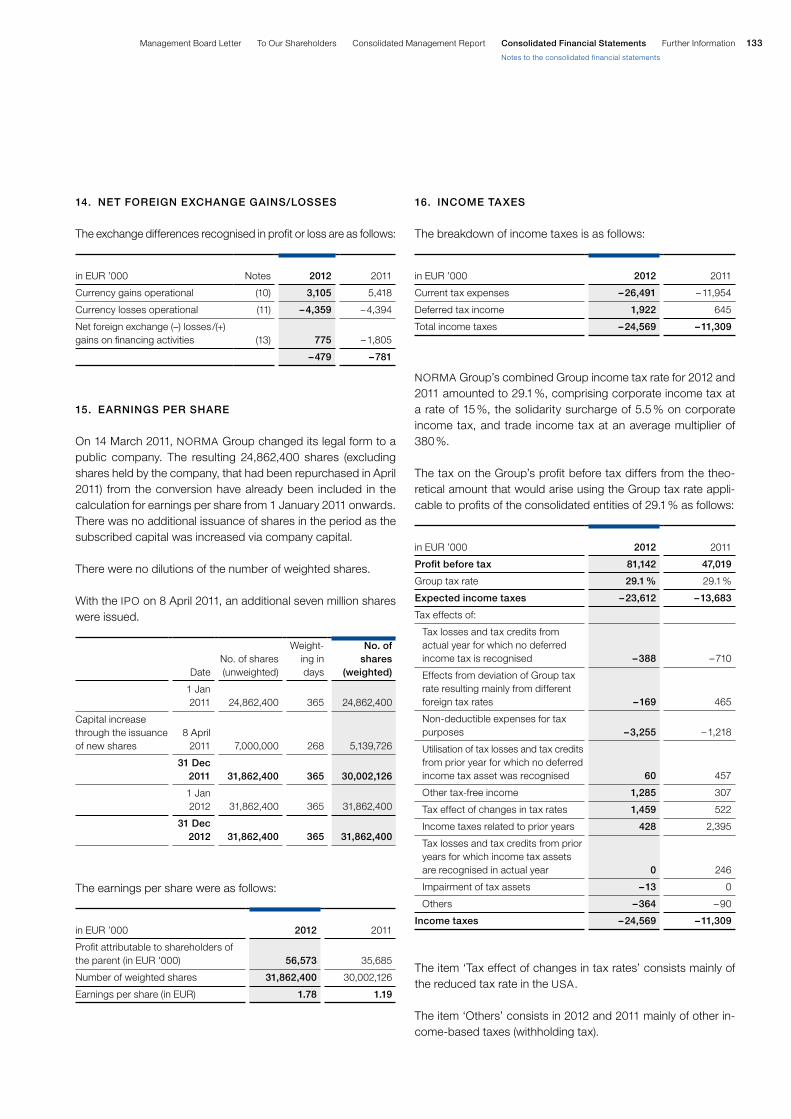
133Further InformationConsolidated Financial StatementsConsolidated Management ReportTo Our ShareholdersManagement Board Letter
Notes to the consolidated financial statements
16. INCOMe tAxeS
The breakdown of income taxes is as follows:
NORMA Group’s combined Group income tax rate for 2012 and 2011 amounted to 29.1 %, comprising corporate income tax at a rate of 15 %, the solidarity surcharge of 5.5 % on corporate income tax, and trade income tax at an average multiplier of 380 %.
The tax on the Group’s profit before tax differs from the theo-retical amount that would arise using the Group tax rate appli-cable to profits of the consolidated entities of 29.1 % as follows:
The item ‘Tax effect of changes in tax rates’ consists mainly of the reduced tax rate in the USA.
The item ‘Others’ consists in 2012 and 2011 mainly of other in-come-based taxes (withholding tax).
in EUR ’000
2012
2011
Current tax expenses – 26,491 – 11,954
Deferred tax income 1,922 645
Total income taxes – 24,569 – 11,309
in EUR ’000
2012
2011
Profit before tax 81,142 47,019
Group tax rate 29.1 % 29.1 %
expected income taxes – 23,612 – 13,683
Tax effects of:
Tax losses and tax credits from actual year for which no deferred income tax is recognised
– 388
– 710
Effects from deviation of Group tax rate resulting mainly from different foreign tax rates
– 169
465
Non-deductible expenses for tax purposes
– 3,255
– 1,218
Utilisation of tax losses and tax credits from prior year for which no deferred income tax asset was recognised
60
457
Other tax-free income 1,285 307
Tax effect of changes in tax rates 1,459 522
Income taxes related to prior years 428 2,395
Tax losses and tax credits from prior years for which income tax assets are recognised in actual year
0
246
Impairment of tax assets – 13 0
Others – 364 – 90
Income taxes – 24,569 – 11,309
14. Net FOReIGN exChANGe GAINS/lOSSeS
The exchange differences recognised in profit or loss are as follows:
15. eARNINGS PeR ShARe
On 14 March 2011, NORMA Group changed its legal form to a public company. The resulting 24,862,400 shares (excluding shares held by the company, that had been repurchased in April 2011) from the conversion have already been included in the calculation for earnings per share from 1 January 2011 onwards. There was no additional issuance of shares in the period as the subscribed capital was increased via company capital.
There were no dilutions of the number of weighted shares.
With the IPO on 8 April 2011, an additional seven million shares were issued.
The earnings per share were as follows:
in EUR ’000
Notes
2012
2011
Currency gains operational (10) 3,105 5,418
Currency losses operational (11) – 4,359 – 4,394
Net foreign exchange (–) losses /(+) gains on financing activities
(13)
775
– 1,805
– 479 – 781
Date
No. of shares (unweighted)
Weight-ing in days
No. of shares
(weighted)
1 Jan 2011
24,862,400
365
24,862,400
Capital increase through the issuance of new shares
8 April
2011
7,000,000
268
5,139,726
31 Dec 2011
31,862,400
365
30,002,126
1 Jan 2012
31,862,400
365
31,862,400
31 Dec 2012
31,862,400
365
31,862,400
in EUR ’000
2012
2011
Profit attributable to shareholders of the parent (in EUR '000) 56,573 35,685
Number of weighted shares 31,862,400 30,002,126
Earnings per share (in EUR) 1.78 1.19
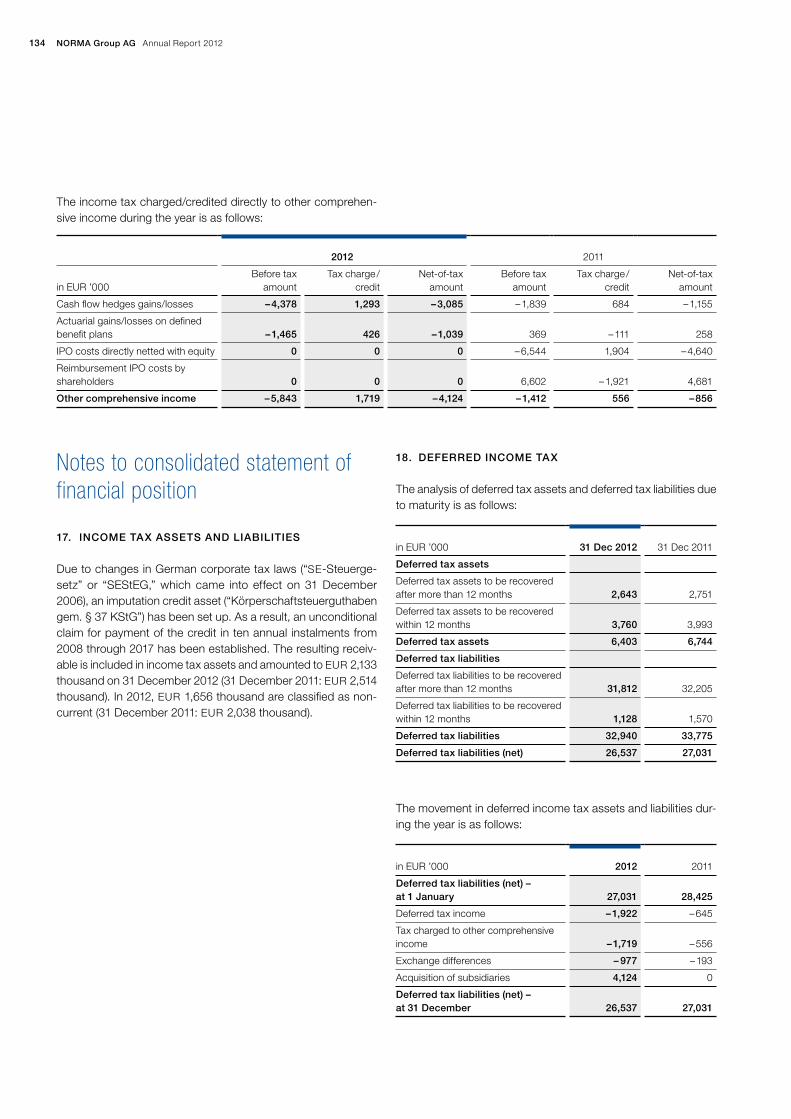
134 NORMA Group AG Annual Report 2012
18. DeFeRReD INCOMe tAx
The analysis of deferred tax assets and deferred tax liabilities due to maturity is as follows:
The movement in deferred income tax assets and liabilities dur-ing the year is as follows:
in EUR ’000
31 Dec 2012
31 Dec 2011
Deferred tax assets
Deferred tax assets to be recovered after more than 12 months
2,643
2,751
Deferred tax assets to be recovered within 12 months
3,760
3,993
Deferred tax assets 6,403 6,744
Deferred tax liabilities
Deferred tax liabilities to be recovered after more than 12 months
31,812
32,205
Deferred tax liabilities to be recovered within 12 months
1,128
1,570
Deferred tax liabilities 32,940 33,775
Deferred tax liabilities (net) 26,537 27,031
in EUR ’000
2012
2011
Deferred tax liabilities (net) – at 1 January
27,031
28,425
Deferred tax income – 1,922 – 645
Tax charged to other comprehensive income
– 1,719
– 556
Exchange differences – 977 – 193
Acquisition of subsidiaries 4,124 0
Deferred tax liabilities (net) – at 31 December
26,537
27,031
The income tax charged/credited directly to other comprehen-sive income during the year is as follows:
Notes to consolidated statement of financial position
17. INCOMe tAx ASSetS AND lIAbIlItIeS
Due to changes in German corporate tax laws (“SE-Steuerge-setz” or “SEStEG,” which came into effect on 31 December 2006), an imputation credit asset (“Körperschaftsteuerguthaben gem. § 37 KStG”) has been set up. As a result, an unconditional claim for payment of the credit in ten annual instalments from 2008 through 2017 has been established. The resulting receiv-able is included in income tax assets and amounted to EUR 2,133 thousand on 31 December 2012 (31 December 2011: EUR 2,514 thousand). In 2012, EUR 1,656 thousand are classified as non-current (31 December 2011: EUR 2,038 thousand).
2012
2011
in EUR ’000
Before tax amount
Tax charge / credit
Net-of-tax amount
Before tax amount
Tax charge / credit
Net-of-tax amount
Cash flow hedges gains/losses – 4,378 1,293 – 3,085 – 1,839 684 – 1,155
Actuarial gains/losses on defined benefit plans
– 1,465
426
– 1,039
369
– 111
258
IPO costs directly netted with equity 0 0 0 – 6,544 1,904 – 4,640
Reimbursement IPO costs by shareholders
0
0
0
6,602
– 1,921
4,681
Other comprehensive income – 5,843 1,719 – 4,124 – 1,412 556 – 856

135Further InformationConsolidated Financial StatementsConsolidated Management ReportTo Our ShareholdersManagement Board Letter
Notes to the consolidated financial statements
Deferred income tax assets are recognised for all deductible temporary differences to the extent that it is probable that future taxable profits will be available against which the deductible tem-porary difference can be utilised. The Group did not recognise deferred income tax assets amounting to EUR 38 thousand in respect of deductible temporary differences amounting to EUR 116 thousand at 31 December 2012; in 2011, the Group did not recognise deferred income tax assets amounting to EUR 68 thousand in respect of deductible temporary differences amount-ing to EUR 201 thousand.
In 2012 and prior years, the Group had tax losses at several subsidiaries in several countries. After offsetting the deferred tax assets with deferred tax liabilities, the deferred tax assets not subject to valuation allowances amounted to EUR 167 thousand for those foreign subsidiaries (31 December 2011: EUR 1,475 thousand). NORMA Group believes it is more likely than not that due to future taxable income, deferred tax assets which are not subject to valuation allowances can be utilised.
Deferred income tax assets are recognised for tax losses carry-forwards to the extent that the realisation of the related tax ben-efit through future taxable profits is probable.
The Group did recognise the following tax losses:
The Group did not recognise deferred income tax assets in re-spect of losses amounting to EUR 7,328 thousand at 31 Decem-ber 2012 (31 December 2011: EUR 4,227 thousand) that can be carried forward against future taxable income. The deferred tax assets on not recognised tax losses would theoretically be EUR 1,814 thousand at 31 December 2012 (31 December 2011: EUR 1,200 thousand).
The unrecognised losses expire as follows:
in EUR ’000
31 Dec 2012
31 Dec 2011
Expiry within 1 year 0 120
Expiry in 2 – 5 years 894 2,731
Expiry later than 5 years 3,465 0
Unlimited carry forward 687 2,299
total 5,046 5,150
in EUR ’000
31 Dec 2012
31 Dec 2011
Expiry within 1 year 285 74
Expiry in 2 – 5 years 1,643 1,116
Expiry later than 5 years 806 2,681
Unlimited carry forward 4,594 356
total 7,328 4,227
In 2011, a deferred tax liability of EUR 2,795 thousand resulting from 2007 was adjusted resulting in an increase of the equity. Without this adjustment, the Group tax rate in 2011 was 30 %.
The analysis of deferred income tax assets and deferred income tax liabilities, without taking into consideration the offsetting of balances within the same tax jurisdiction, is as follows:
DeFeRReD tAx ASSetS
in EUR ’000
31 Dec 2012
31 Dec 2011
Intangible assets 2,152 2,146
Property, plant and equipment 249 133
Other assets 202 434
Inventories 901 780
Trade receivables 470 481
Retirement benefit obligations/ pension liabilities
1,081
664
Provisions 1,013 1,085
Borrowings 796 159
Other liabilities, incl. derivatives 9,222 9,264
Trade payables 68 86
Tax losses and tax credits 772 1,411
Deferred tax assets (before valuation allowances)
16,926
16,643
Valuation allowance – 13 0
Deferred tax assets (before offsetting)
16,913
16,643
Offsetting effects – 10,510 – 9,899
Deferred tax assets 6,403 6,744
DeFeRReD tAx lIAbIlItIeS
in EUR ’000
31 Dec 2012
31 Dec 2011
Intangible assets 27,843 26,528
Property, plant and equipment 9,100 9,917
Other assets 1,201 1,436
Inventories 156 5
Trade receivables 96 85
Borrowings 4,219 4,657
Provisions 14 593
Other liabilities, incl. derivatives 137 118
Trade payables 9 0
Untaxed reserves 675 335
Deferred tax liabilities (before offsetting)
43,450
43,674
Offsetting effects – 10,510 – 9,899
Deferred tax liabilities 32,940 33,775
Deferred tax liabilities (net) 26,537 27,031

136 NORMA Group AG Annual Report 2012
ticably computed, could become subject to additional tax if they were remitted as dividends or if the Group were to sell its share-holdings in the subsidiaries.
19. GOODwIll AND OtheR INtANGIble ASSetS
The acquisition costs as well as accumulated amortisation and impairment of intangible assets consisted of the following:
in EUR ’000
At 1 Jan 2012
Additions
Deductions
Transfers
Changes in
consolidation
Currency
effects
At
31 Dec 2012
Acquisition costs
Goodwill 256,287 0 0 0 11,905 – 1,896 266,296
Certificates 44,049 120 0 0 13,966 – 733 57,402
Licenses, rights 849 334 – 5 121 882 – 3 2,178
Trademarks 20,189 0 0 0 1,086 – 372 20,903
Patents & technology 29,444 1,303 0 – 1 354 – 499 30,601
Intangible assets, other 19,442 6,057 – 6 – 120 1,146 192 26,711
total 370,260 7,814 – 11 0 29,339 – 3,311 404,091
Amortisation and Impairment
Goodwill 31,446 0 0 0 0 – 412 31,034
Certificates 8,472 3,162 0 0 0 – 133 11,501
Licenses, rights 655 128 – 5 0 0 – 1 777
Trademarks 3,360 1,015 0 0 0 – 85 4,290
Patents & technology 12,678 2,457 0 0 0 – 267 14,868
Intangible assets, other 9,868 3,987 – 5 0 0 31 13,881
total 66,479 10,749 – 10 0 0 – 867 76,351
Taxable temporary differences amounting to EUR 69,451 thou-sand at 31 December 2012 (31 December 2011: EUR 34,482 thousand) associated with investments in subsidiaries are not recognised as deferred tax liabilities, since the respective parent is able to control the timing of the reversal of the temporary dif-ference and it is probable that the temporary difference will not reverse in the foreseeable future. These unremitted earnings of non-German subsidiaries, the amount of which cannot be prac-

137Further InformationConsolidated Financial StatementsConsolidated Management ReportTo Our ShareholdersManagement Board Letter
Notes to the consolidated financial statements
In 2012 and 2011, no impairment for intangible assets was rec-ognised.
At 31 December 2012 and 2011, the intangible assets are unse-cured.
Impairment tests for goodwillGoodwill is allocated to the Group’s cash-generating units (CGUs) identified according to geographical areas. A summary of the goodwill allocation is presented below.
in EUR ’000
31 Dec 2012
31 Dec 2011
CGU EMEA 153,993 143,386
CGU Americas 76,904 78,319
CGU Asia-Pacific 4,365 3,136
235,262 224,841
in EUR ’000
At 1 Jan 2011
Additions
Deductions
Transfers
Changes in
consolidation
Currency
effects
At
31 Dec 2011
Acquisition costs
Goodwill 252,332 0 0 0 0 3,955 256,287
Certificates 42,740 0 0 0 0 1,309 44,049
Licenses, rights 1,678 77 0 – 906 0 0 849
Trademarks 19,513 0 0 0 0 676 20,189
Patents & technology 27,064 474 0 969 0 937 29,444
Intangible assets, other 14,449 3,750 – 76 1,272 0 47 19,442
total 357,776 4,301 – 76 1,335 0 6,924 370,260
Amortisation and Impairment
Goodwill 30,628 0 0 0 0 818 31,446
Certificates 6,090 2,129 0 0 0 253 8,472
Licenses, rights 986 114 0 – 446 0 1 655
Trademarks 2,326 886 0 0 0 148 3,360
Patents & technology 9,704 2,050 0 446 0 478 12,678
Intangible assets, other 7,023 2,893 – 34 0 0 – 14 9,868
total 56,757 8,072 – 34 0 0 1,684 66,479
The item ‘Patents & technology’ at 31 December 2012 consists of patents worth EUR 3,960 thousand (31 December 2011: EUR 4,009 thousand) and technology worth EUR 11,773 thou-sand (31 December 2011: EUR 12,757 thousand).
The item ‘Intangible assets, other’ consists mainly of software and prepayments. Software is amortised over the useful life of three to five years.
Carrying amounts
in EUR ’000
31 Dec 2012
31 Dec 2011
Goodwill 235,262 224,841
Certificates 45,901 35,577
Licenses, rights 1,401 194
Trademarks 16,613 16,829
Patents & technology 15,733 16,766
Intangible assets, other 12,830 9,574
total 327,740 303,781
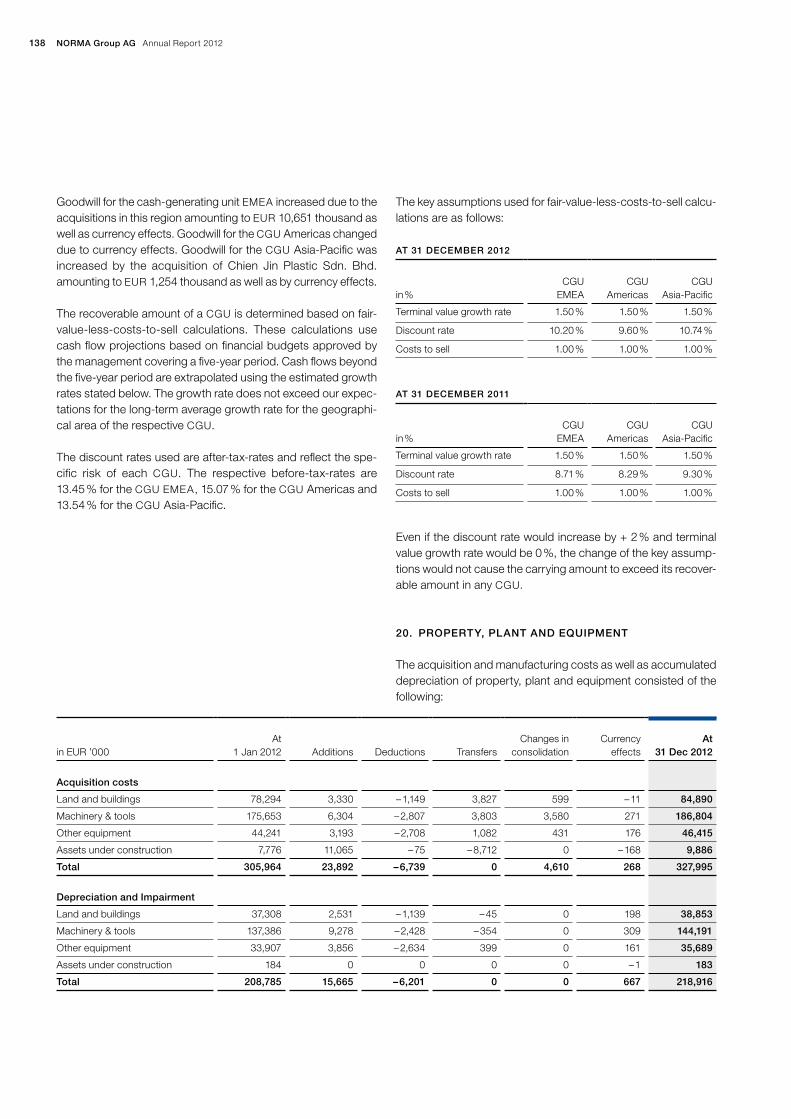
138 NORMA Group AG Annual Report 2012
The key assumptions used for fair-value-less-costs-to-sell calcu-lations are as follows:
Even if the discount rate would increase by + 2 % and terminal value growth rate would be 0 %, the change of the key assump-tions would not cause the carrying amount to exceed its recover-able amount in any CGU.
20. PROPeRty, PlANt AND equIPMeNt
The acquisition and manufacturing costs as well as accumulated depreciation of property, plant and equipment consisted of the following:
At 31 DeCeMbeR 2012
in %
CGU
EMEA
CGU
Americas
CGU
Asia-Pacific
Terminal value growth rate 1.50 % 1.50 % 1.50 %
Discount rate 10.20 % 9.60 % 10.74 %
Costs to sell 1.00 % 1.00 % 1.00 %
At 31 DeCeMbeR 2011
in %
CGU
EMEA
CGU
Americas
CGU
Asia-Pacific
Terminal value growth rate 1.50 % 1.50 % 1.50 %
Discount rate 8.71 % 8.29 % 9.30 %
Costs to sell 1.00 % 1.00 % 1.00 %
in EUR ’000
At
1 Jan 2012
Additions
Deductions
Transfers
Changes in
consolidation
Currency
effects
At
31 Dec 2012
Acquisition costs
Land and buildings 78,294 3,330 – 1,149 3,827 599 – 11 84,890
Machinery & tools 175,653 6,304 – 2,807 3,803 3,580 271 186,804
Other equipment 44,241 3,193 – 2,708 1,082 431 176 46,415
Assets under construction 7,776 11,065 – 75 – 8,712 0 – 168 9,886
total 305,964 23,892 – 6,739 0 4,610 268 327,995
Depreciation and Impairment
Land and buildings 37,308 2,531 – 1,139 – 45 0 198 38,853
Machinery & tools 137,386 9,278 – 2,428 – 354 0 309 144,191
Other equipment 33,907 3,856 – 2,634 399 0 161 35,689
Assets under construction 184 0 0 0 0 – 1 183
total 208,785 15,665 – 6,201 0 0 667 218,916
Goodwill for the cash-generating unit EMEA increased due to the acquisitions in this region amounting to EUR 10,651 thousand as well as currency effects. Goodwill for the CGU Americas changed due to currency effects. Goodwill for the CGU Asia-Pacific was increased by the acquisition of Chien Jin Plastic Sdn. Bhd. amounting to EUR 1,254 thousand as well as by currency effects.
The recoverable amount of a CGU is determined based on fair-value-less-costs-to-sell calculations. These calculations use cash flow projections based on financial budgets approved by the management covering a five-year period. Cash flows beyond the five-year period are extrapolated using the estimated growth rates stated below. The growth rate does not exceed our expec-tations for the long-term average growth rate for the geographi-cal area of the respective CGU.
The discount rates used are after-tax-rates and reflect the spe-cific risk of each CGU. The respective before-tax-rates are 13.45 % for the CGU EMEA, 15.07 % for the CGU Americas and 13.54 % for the CGU Asia-Pacific.
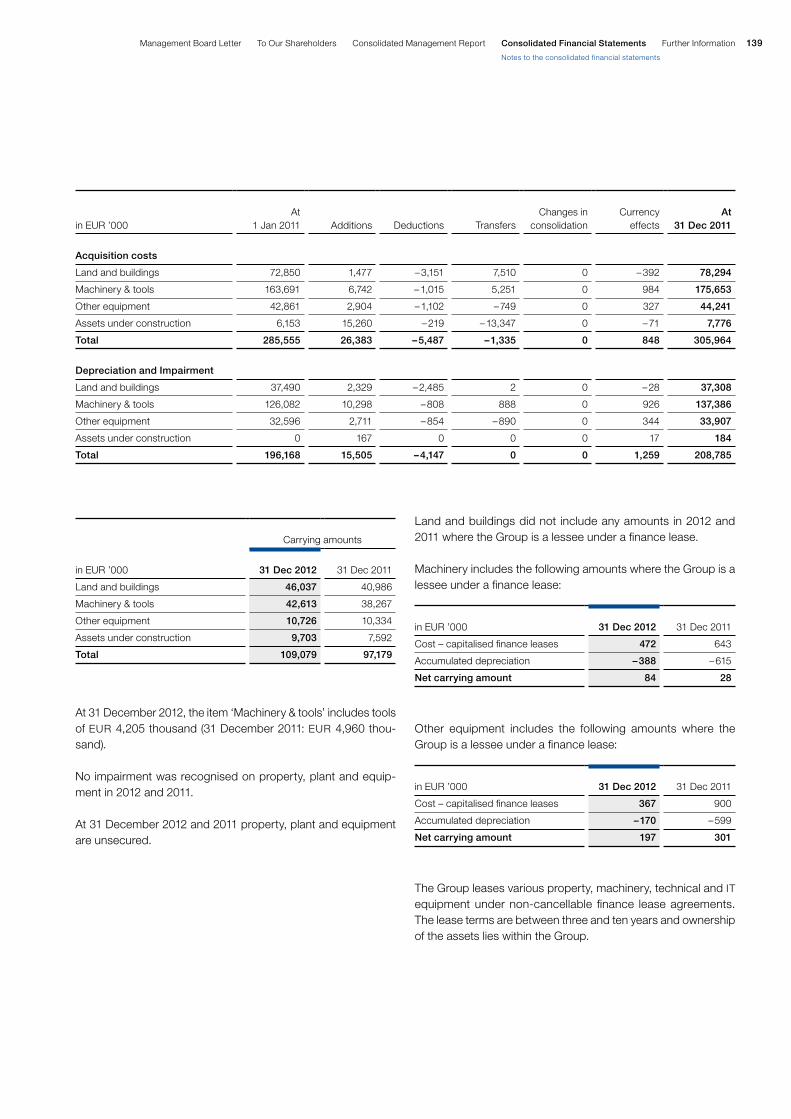
139Further InformationConsolidated Financial StatementsConsolidated Management ReportTo Our ShareholdersManagement Board Letter
Notes to the consolidated financial statements
Land and buildings did not include any amounts in 2012 and 2011 where the Group is a lessee under a finance lease.
Machinery includes the following amounts where the Group is a lessee under a finance lease:
Other equipment includes the following amounts where the Group is a lessee under a finance lease:
The Group leases various property, machinery, technical and IT equipment under non-cancellable finance lease agreements. The lease terms are between three and ten years and ownership of the assets lies within the Group.
in EUR ’000
31 Dec 2012
31 Dec 2011
Cost – capitalised finance leases 472 643
Accumulated depreciation – 388 – 615
Net carrying amount 84 28
in EUR ’000
31 Dec 2012
31 Dec 2011
Cost – capitalised finance leases 367 900
Accumulated depreciation – 170 – 599
Net carrying amount 197 301
At 31 December 2012, the item ‘Machinery & tools’ includes tools of EUR 4,205 thousand (31 December 2011: EUR 4,960 thou-sand).
No impairment was recognised on property, plant and equip-ment in 2012 and 2011.
At 31 December 2012 and 2011 property, plant and equipment are unsecured.
in EUR ’000
At
1 Jan 2011
Additions
Deductions
Transfers
Changes in
consolidation
Currency
effects
At
31 Dec 2011
Acquisition costs
Land and buildings 72,850 1,477 – 3,151 7,510 0 – 392 78,294
Machinery & tools 163,691 6,742 – 1,015 5,251 0 984 175,653
Other equipment 42,861 2,904 – 1,102 – 749 0 327 44,241
Assets under construction 6,153 15,260 – 219 – 13,347 0 – 71 7,776
total 285,555 26,383 – 5,487 – 1,335 0 848 305,964
Depreciation and Impairment
Land and buildings 37,490 2,329 – 2,485 2 0 – 28 37,308
Machinery & tools 126,082 10,298 – 808 888 0 926 137,386
Other equipment 32,596 2,711 – 854 – 890 0 344 33,907
Assets under construction 0 167 0 0 0 17 184
total 196,168 15,505 – 4,147 0 0 1,259 208,785
Carrying amounts
in EUR ’000
31 Dec 2012
31 Dec 2011
Land and buildings 46,037 40,986
Machinery & tools 42,613 38,267
Other equipment 10,726 10,334
Assets under construction 9,703 7,592
total 109,079 97,179
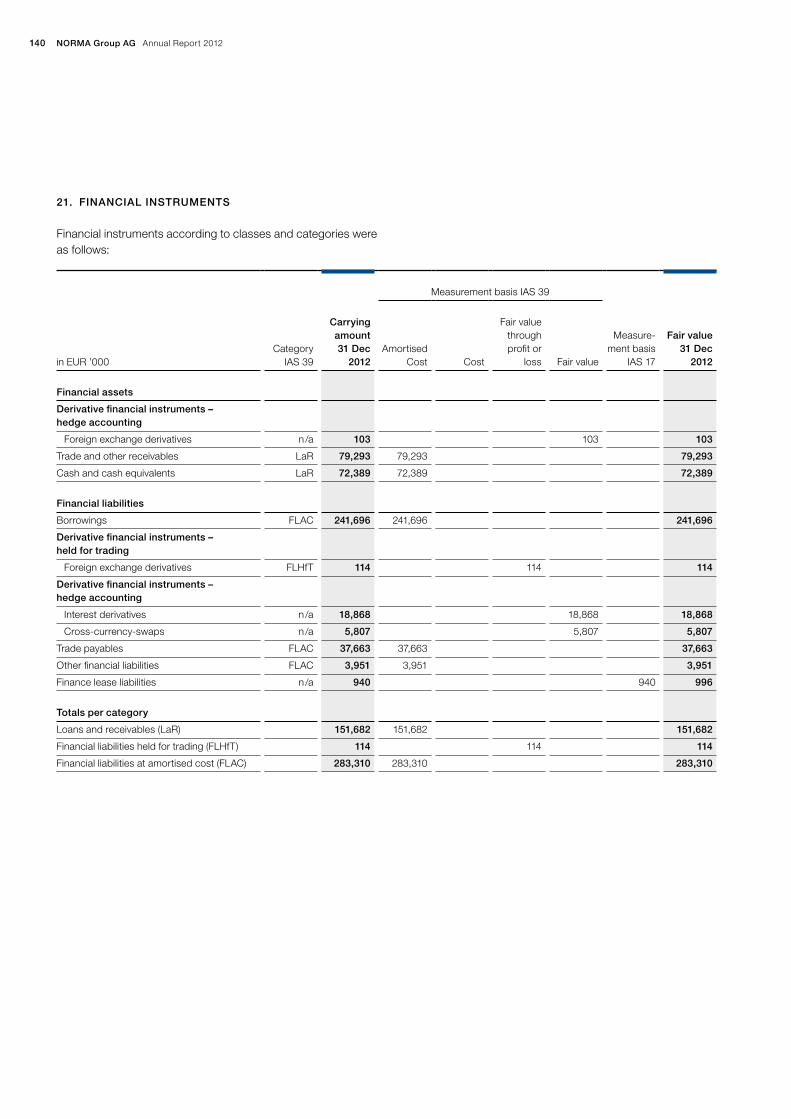
140 NORMA Group AG Annual Report 2012
21. FINANCIAl INStRuMeNtS
Financial instruments according to classes and categories were as follows:
Measurement basis IAS 39
in EUR ’000
Category IAS 39
Carrying amount 31 Dec
2012
Amortised Cost
Cost
Fair value
through profit or
loss
Fair value
Measure-ment basis
IAS 17
Fair value 31 Dec
2012
Financial assets
Derivative financial instruments – hedge accounting
Foreign exchange derivatives n /a 103 103 103
Trade and other receivables LaR 79,293 79,293 79,293
Cash and cash equivalents LaR 72,389 72,389 72,389
Financial liabilities
Borrowings FLAC 241,696 241,696 241,696
Derivative financial instruments – held for trading
Foreign exchange derivatives FLHfT 114 114 114
Derivative financial instruments – hedge accounting
Interest derivatives n /a 18,868 18,868 18,868
Cross-currency-swaps n /a 5,807 5,807 5,807
Trade payables FLAC 37,663 37,663 37,663
Other financial liabilities FLAC 3,951 3,951 3,951
Finance lease liabilities n /a 940 940 996
totals per category
Loans and receivables (LaR) 151,682 151,682 151,682
Financial liabilities held for trading (FLHfT) 114 114 114
Financial liabilities at amortised cost (FLAC) 283,310 283,310 283,310

141Further InformationConsolidated Financial StatementsConsolidated Management ReportTo Our ShareholdersManagement Board Letter
Notes to the consolidated financial statements
Trade payables and other financial liabilities have short times to maturity; therefore the carrying amounts reported approximate the fair values. At 31 December 2012, EUR 2,720 thousand in liabilities resulting from the acquisitions of Chien Jin Plastic Sdn. Bhd. and Groen Bevestigingsmaterialen B.V. are included in the other financial liabilities. For details, please refer to Note 39 ‘Busi-ness combinations.’
Trade and other receivables and cash and cash equivalents have short-term maturities. Their carrying amounts at the reporting date equal their fair values, as the impact of discounting is not significant.
Available-for-sale financial assets that were held in 2011 were recognised at cost. There is no active market for these instru-ments. Since no future cash flows can be reliably measured, the fair value cannot be determined using valuation techniques.
Measurement basis IAS 39
in EUR ’000
Category IAS 39
Carrying amount 31 Dec
2011
Amortised Cost
Cost
Fair value
through profit or
loss
Fair value
Measure-ment basis
IAS 17
Fair value 31 Dec
2011
Financial assets
Available-for-sale financial assets AfS 397 397 –
Derivative financial instruments – held for trading
Interest derivatives FAHfT 44 44 44
Trade and other receivables LaR 80,817 80,817 80,817
Cash and cash equivalents LaR 67,891 67,891 67,891
Financial liabilities
Borrowings FLAC 242,374 242,374 242,374
Derivative financial instruments – held for trading
Foreign exchange derivatives FLHfT 18 18 18
Derivative financial instruments – hedge accounting
Interest derivatives n /a 18,478 18,478 18,478
Cross-currency-swaps n /a 3,331 3,331 3,331
Trade payables FLAC 41,373 41,373 41,373
Other financial liabilities FLAC 1,145 1,145 1,145
Finance lease liabilities n /a 1,058 1,058 1,039
totals per category
Available-for-sale financial assets (AfS) 397 397 –
Financial assets held for trading (FAHfT) 44 44 44
Loans and receivables (LaR) 148,708 148,708 148,708
Financial liabilities held for trading (FLHfT) 18 18 18
Financial liabilities at amortised cost (FLAC) 284,892 284,892 284,892
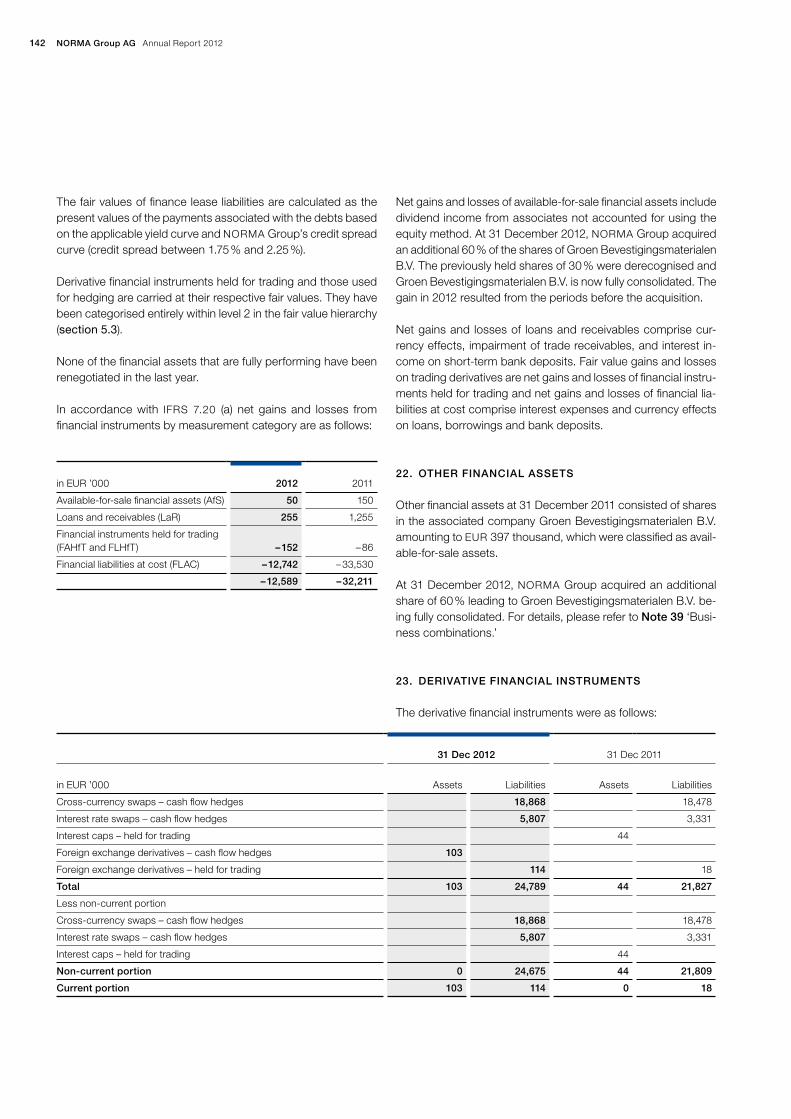
142 NORMA Group AG Annual Report 2012
Net gains and losses of available-for-sale financial assets include dividend income from associates not accounted for using the equity method. At 31 December 2012, NORMA Group acquired an additional 60 % of the shares of Groen Bevestigingsmaterialen B.V. The previously held shares of 30 % were derecognised and Groen Bevestigingsmaterialen B.V. is now fully consolidated. The gain in 2012 resulted from the periods before the acquisition.
Net gains and losses of loans and receivables comprise cur-rency effects, impairment of trade receivables, and interest in-come on short-term bank deposits. Fair value gains and losses on trading derivatives are net gains and losses of financial instru-ments held for trading and net gains and losses of financial lia-bilities at cost comprise interest expenses and currency effects on loans, borrowings and bank deposits.
22. OtheR FINANCIAl ASSetS
Other financial assets at 31 December 2011 consisted of shares in the associated company Groen Bevestigingsmaterialen B.V. amounting to EUR 397 thousand, which were classified as avail-able-for-sale assets.
At 31 December 2012, NORMA Group acquired an additional share of 60 % leading to Groen Bevestigingsmaterialen B.V. be-ing fully consolidated. For details, please refer to Note 39 ‘Busi-ness combinations.’
23. DeRIvAtIve FINANCIAl INStRuMeNtS
The derivative financial instruments were as follows:
31 Dec 2012
31 Dec 2011
in EUR ’000
Assets
Liabilities
Assets
Liabilities
Cross-currency swaps – cash flow hedges 18,868 18,478
Interest rate swaps – cash flow hedges 5,807 3,331
Interest caps – held for trading 44
Foreign exchange derivatives – cash flow hedges 103
Foreign exchange derivatives – held for trading 114 18
total 103 24,789 44 21,827
Less non-current portion
Cross-currency swaps – cash flow hedges 18,868 18,478
Interest rate swaps – cash flow hedges 5,807 3,331
Interest caps – held for trading 44
Non-current portion 0 24,675 44 21,809
Current portion 103 114 0 18
The fair values of finance lease liabilities are calculated as the present values of the payments associated with the debts based on the applicable yield curve and NORMA Group’s credit spread curve (credit spread between 1.75 % and 2.25 %).
Derivative financial instruments held for trading and those used for hedging are carried at their respective fair values. They have been categorised entirely within level 2 in the fair value hierarchy (section 5.3).
None of the financial assets that are fully performing have been renegotiated in the last year.
In accordance with IFRS 7.20 (a) net gains and losses from financial instruments by measurement category are as follows:
in EUR ’000
2012
2011
Available-for-sale financial assets (AfS) 50 150
Loans and receivables (LaR) 255 1,255
Financial instruments held for trading (FAHfT and FLHfT)
– 152
– 86
Financial liabilities at cost (FLAC) – 12,742 – 33,530
– 12,589 – 32,211
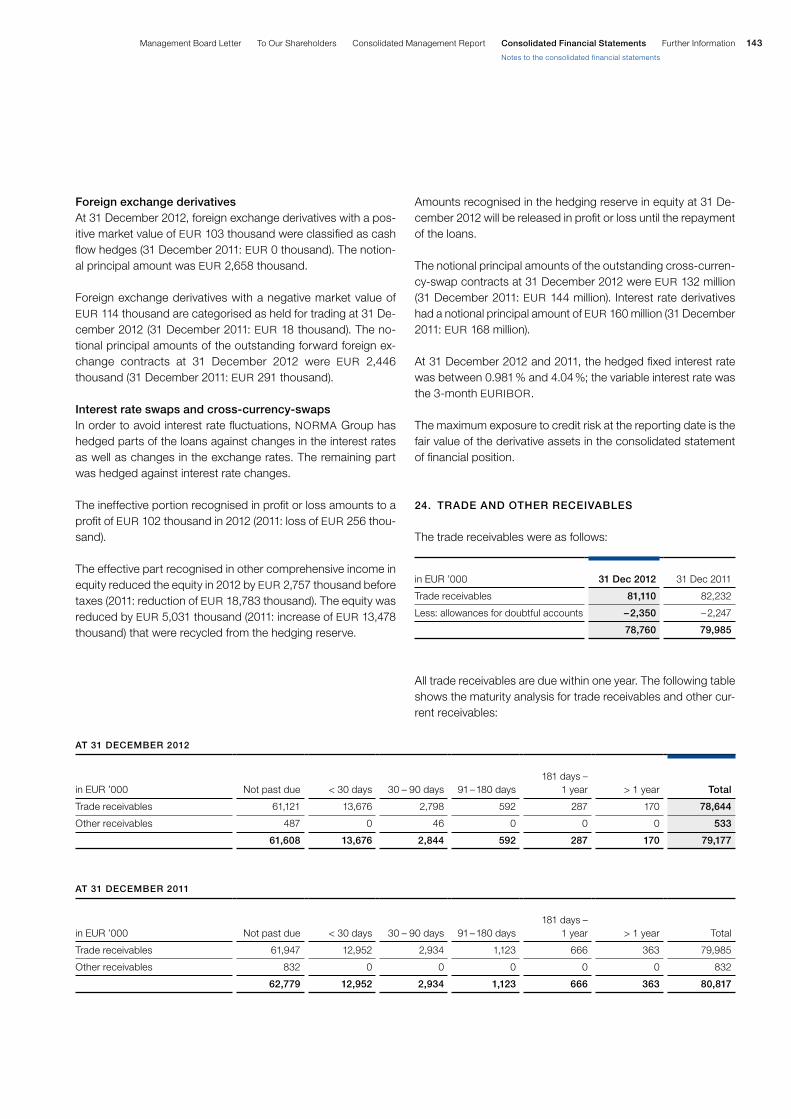
143Further InformationConsolidated Financial StatementsConsolidated Management ReportTo Our ShareholdersManagement Board Letter
Notes to the consolidated financial statements
Amounts recognised in the hedging reserve in equity at 31 De-cember 2012 will be released in profit or loss until the repayment of the loans.
The notional principal amounts of the outstanding cross-curren-cy-swap contracts at 31 December 2012 were EUR 132 million (31 December 2011: EUR 144 million). Interest rate derivatives had a notional principal amount of EUR 160 million (31 December 2011: EUR 168 million).
At 31 December 2012 and 2011, the hedged fixed interest rate was between 0.981 % and 4.04 %; the variable interest rate was the 3-month EURIBOR.
The maximum exposure to credit risk at the reporting date is the fair value of the derivative assets in the consolidated statement of financial position.
24. tRADe AND OtheR ReCeIvAbleS
The trade receivables were as follows:
All trade receivables are due within one year. The following table shows the maturity analysis for trade receivables and other cur-rent receivables:
in EUR ’000
31 Dec 2012
31 Dec 2011
Trade receivables 81,110 82,232
Less: allowances for doubtful accounts – 2,350 – 2,247
78,760 79,985
At 31 DeCeMbeR 2012
in EUR ’000
Not past due
< 30 days
30 – 90 days
91 – 180 days
181 days –
1 year
> 1 year
total
Trade receivables 61,121 13,676 2,798 592 287 170 78,644
Other receivables 487 0 46 0 0 0 533
61,608 13,676 2,844 592 287 170 79,177
At 31 DeCeMbeR 2011
in EUR ’000
Not past due
< 30 days
30 – 90 days
91 – 180 days
181 days –
1 year
> 1 year
Total
Trade receivables 61,947 12,952 2,934 1,123 666 363 79,985
Other receivables 832 0 0 0 0 0 832
62,779 12,952 2,934 1,123 666 363 80,817
Foreign exchange derivativesAt 31 December 2012, foreign exchange derivatives with a pos-itive market value of EUR 103 thousand were classified as cash flow hedges (31 December 2011: EUR 0 thousand). The notion-al principal amount was EUR 2,658 thousand.
Foreign exchange derivatives with a negative market value of EUR 114 thousand are categorised as held for trading at 31 De-cember 2012 (31 December 2011: EUR 18 thousand). The no-tional principal amounts of the outstanding forward foreign ex-change contracts at 31 December 2012 were EUR 2,446 thousand (31 December 2011: EUR 291 thousand).
Interest rate swaps and cross-currency-swapsIn order to avoid interest rate fluctuations, NORMA Group has hedged parts of the loans against changes in the interest rates as well as changes in the exchange rates. The remaining part was hedged against interest rate changes.
The ineffective portion recognised in profit or loss amounts to a profit of EUR 102 thousand in 2012 (2011: loss of EUR 256 thou-sand).
The effective part recognised in other comprehensive income in equity reduced the equity in 2012 by EUR 2,757 thousand before taxes (2011: reduction of EUR 18,783 thousand). The equity was reduced by EUR 5,031 thousand (2011: increase of EUR 13,478 thousand) that were recycled from the hedging reserve.

144 NORMA Group AG Annual Report 2012
The creation and release of allowances for doubtful accounts have been included in ‘other operating income/ expenses’ in the consolidated statement of comprehensive income. Amounts charged to the allowance account are generally written off, when there is no expectation of recovering additional cash.
The other classes within trade and other receivables do not con-tain impaired assets.
The maximum exposure to credit risk at the reporting date is the carrying amount of each class of receivables mentioned above. The Group does not hold any collateral as security.
At 31 December 2012 and 2011, the trade and other receivables are unsecured.
Receivables of EUR 1,296 thousand were sold in a factoring contract.
25. INveNtORIeS
The inventories were as follows:
At 31 December 2012, inventories amounting to EUR 2,044 thou-sand (31 December 2011: EUR 547 thousand) were reduced to their net realisable value.
At 31 December 2012 and 2011, the inventories are unsecured.
in EUR ’000
31 Dec 2012
31 Dec 2011
Raw materials 25,018 21,873
Work in progress 7,123 6,683
Finished goods and goods for resale 42,172 38,199
74,313 66,755
At 31 December 2012 and 2011, there was no indication that trade receivables that were neither past due nor impaired could not be collected.
The amount of receivables that were impaired and provided for was as follows:
The carrying amounts of the Group’s trade and other receivables are denominated in the following currencies:
All trade receivable were impaired by specific valuation allow-ances. There have been no general allowances. Movements on the Group’s provision for impairment of trade receivables are as follows:
in EUR ’000
31 Dec 2012
31 Dec 2011
Trade receivables impaired and provided for
2,466
2,387
Allowances for doubtful accounts – 2,350 – 2,247
in EUR ’000
31 Dec 2012
31 Dec 2011
Euro 40,211 41,737
US dollar 24,717 27,916
Chinese renminbi yuan 3,237 3,466
British pound sterling 2,155 1,874
Australian dollar 1,434 1,682
Swedish krona 1,228 1,286
Swiss franc 1,136 n/a
Indien rupee 982 884
Malaysian ringgit 1,137 68
Thai baht 700 181
Russian ruble 1,014 212
Other currencies 1,342 1,511
79,293 80,817
in EUR ’000
2012
2011
At 1 January 2,247 1,676
Additions 913 859
Amounts used – 671 – 295
Reversals – 454 – 42
Allowances acquired in a business combination
327
0
Currency effects – 12 49
At 31 December 2,350 2,247
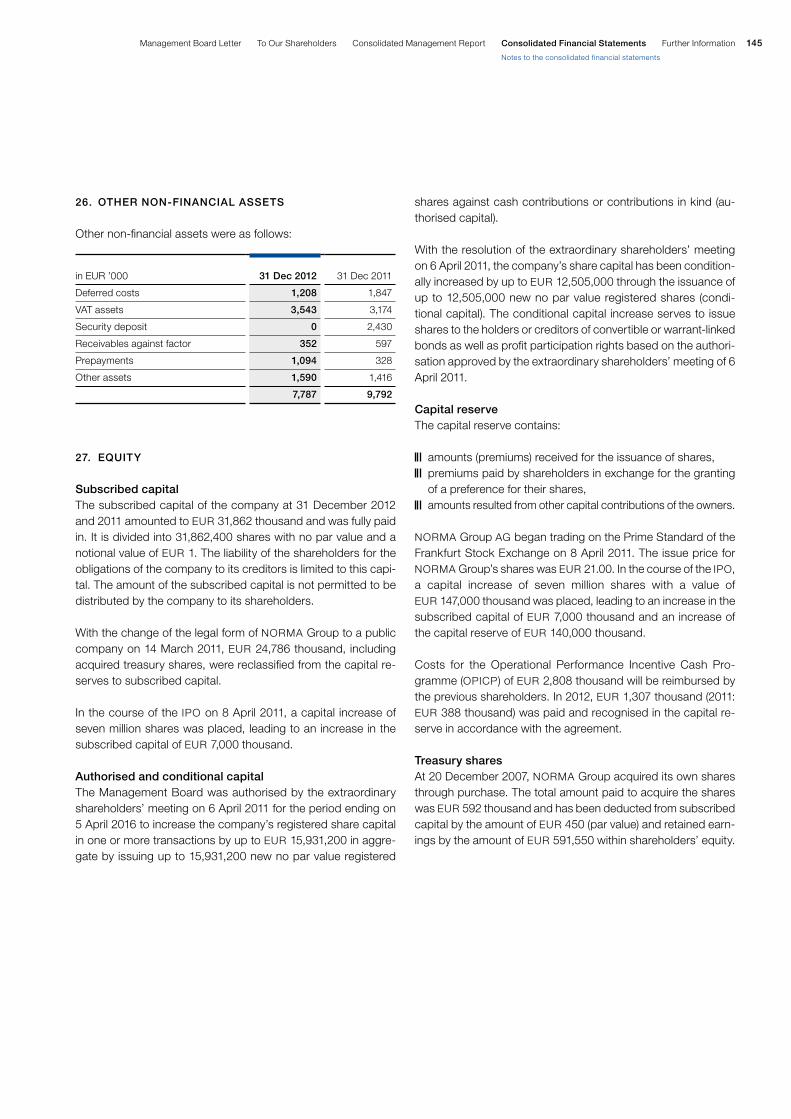
145Further InformationConsolidated Financial StatementsConsolidated Management ReportTo Our ShareholdersManagement Board Letter
Notes to the consolidated financial statements
shares against cash contributions or contributions in kind (au-thorised capital).
With the resolution of the extraordinary shareholders’ meeting on 6 April 2011, the company’s share capital has been condition-ally increased by up to EUR 12,505,000 through the issuance of up to 12,505,000 new no par value registered shares (condi-tional capital). The conditional capital increase serves to issue shares to the holders or creditors of convertible or warrant-linked bonds as well as profit participation rights based on the authori-sation approved by the extraordinary shareholders’ meeting of 6 April 2011.
Capital reserveThe capital reserve contains:
amounts (premiums) received for the issuance of shares, premiums paid by shareholders in exchange for the granting
of a preference for their shares, amounts resulted from other capital contributions of the owners.
NORMA Group AG began trading on the Prime Standard of the Frankfurt Stock Exchange on 8 April 2011. The issue price for NORMA Group’s shares was EUR 21.00. In the course of the IPO, a capital increase of seven million shares with a value of EUR 147,000 thousand was placed, leading to an increase in the subscribed capital of EUR 7,000 thousand and an increase of the capital reserve of EUR 140,000 thousand.
Costs for the Operational Performance Incentive Cash Pro-gramme (OPICP) of EUR 2,808 thousand will be reimbursed by the previous shareholders. In 2012, EUR 1,307 thousand (2011: EUR 388 thousand) was paid and recognised in the capital re-serve in accordance with the agreement.
treasury sharesAt 20 December 2007, NORMA Group acquired its own shares through purchase. The total amount paid to acquire the shares was EUR 592 thousand and has been deducted from subscribed capital by the amount of EUR 450 (par value) and retained earn-ings by the amount of EUR 591,550 within shareholders’ equity.
26. OtheR NON-FINANCIAl ASSetS
Other non-financial assets were as follows:
27. equIty
Subscribed capitalThe subscribed capital of the company at 31 December 2012 and 2011 amounted to EUR 31,862 thousand and was fully paid in. It is divided into 31,862,400 shares with no par value and a notional value of EUR 1. The liability of the shareholders for the obligations of the company to its creditors is limited to this capi-tal. The amount of the subscribed capital is not permitted to be distributed by the company to its shareholders.
With the change of the legal form of NORMA Group to a public company on 14 March 2011, EUR 24,786 thousand, including acquired treasury shares, were reclassified from the capital re-serves to subscribed capital.
In the course of the IPO on 8 April 2011, a capital increase of seven million shares was placed, leading to an increase in the subscribed capital of EUR 7,000 thousand.
Authorised and conditional capitalThe Management Board was authorised by the extraordinary shareholders’ meeting on 6 April 2011 for the period ending on 5 April 2016 to increase the company’s registered share capital in one or more transactions by up to EUR 15,931,200 in aggre-gate by issuing up to 15,931,200 new no par value registered
in EUR ’000
31 Dec 2012
31 Dec 2011
Deferred costs 1,208 1,847
VAT assets 3,543 3,174
Security deposit 0 2,430
Receivables against factor 352 597
Prepayments 1,094 328
Other assets 1,590 1,416
7,787 9,792

146 NORMA Group AG Annual Report 2012
The shares involved in the share options are those shares allo-cated or acquired and qualified as part of the MSP defined in the Management Board contract. The number of share options is calculated by multiplying the qualified shares (2012: 108,452) held at the time of allotment by the option factor specified by the Supervisory Board. A new option factor is set for every tranche (the option factor for 2012 is 1.5). The MSP is split into five tranch-es. The first tranche was allocated on the day of the IPO. The other tranches will be allocated on 31 March each following year. There are therefore 162,679 share options in the 2012 financial year.
The holding period is four years (on 31 March 2016 for the 2012 tranche and on 31 March 2015 for the 2011 tranche). The exer-cise price for the 2011 tranche is the issue price at the time of the company’s IPO. The exercise price for the other tranches will be the weighted average of the closing price of the company’s share on the 60 trading days directly preceding the allocation of each tranche. The value of the share option is calculated using the Black-Scholes method. The company used the volatility of the NORMA Group share of the last six months and a surcharge of 2 % to determine the volatility of 2012.
Retained earningsThe retained earnings consisted of the following:
A dividend of EUR 19,125 thousand was paid to the shareholders of NORMA Group after the Annual General Meeting in May 2012, which reduced the retained earnings.
With the acquisition of 60% of Groen Bevestigingsmaterialen B.V., a purchase option for the remaining 10 % was agreed upon. Due to the definition in the contract, a financial liability amounting to EUR 489 thousand was recognised, which reduces the re-tained earnings. For details, please refer to Note 39 “Business combinations”.
The matching stock programme (MSP) for the Management Board provides a long-term incentive to commit to the success of the company. The MSP is a share-based option.
To this end, the Supervisory Board specifies a number of share options to be allotted each financial year with the proviso that the Management Board member makes a corresponding personal investment in the company.
in EUR ’000
Retained earnings
Actuarial
gains/losses on post em-
ployment ben-efit obligations
Stock options
IPO costs directly netted
with equity
Reimburse-ment IPO-
costs by shareholders
Acquisition of non-controlling
interests
Total
balance at 31 December 2010 – 20,023 – 93 0 0 0 0 – 20,116
Profit for the year 35,685 35,685
Stock options 184 184
Acquisition of non-controlling interests
– 1,940
– 1,940
Effect before taxes 369 – 6,544 6,602 427
Tax effect – 111 1,904 – 1,921 – 128
balance at 31 December 2011 15,662 165 184 – 4,640 4,681 – 1,940 14,112
Profit for the year 56,573 56,573
Dividends paid – 19,125 – 19,125
Stock options 418 418
Acquisition of non-controlling interests
– 489
– 489
Effect before taxes – 1,465 – 1,465
Tax effect 426 426
balance at 31 December 2012 53,110 – 874 602 – 4,640 4,681 – 2,429 50,450
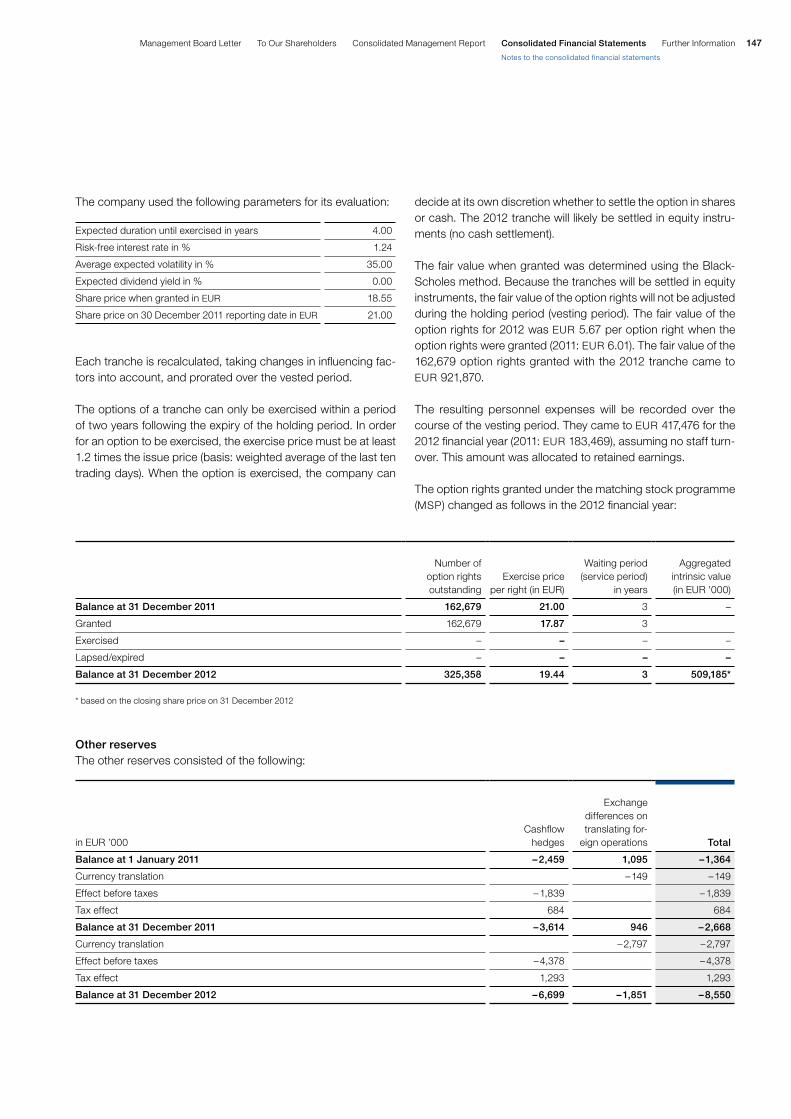
147Further InformationConsolidated Financial StatementsConsolidated Management ReportTo Our ShareholdersManagement Board Letter
Notes to the consolidated financial statements
decide at its own discretion whether to settle the option in shares or cash. The 2012 tranche will likely be settled in equity instru-ments (no cash settlement).
The fair value when granted was determined using the Black-Scholes method. Because the tranches will be settled in equity instruments, the fair value of the option rights will not be adjusted during the holding period (vesting period). The fair value of the option rights for 2012 was EUR 5.67 per option right when the option rights were granted (2011: EUR 6.01). The fair value of the 162,679 option rights granted with the 2012 tranche came to EUR 921,870.
The resulting personnel expenses will be recorded over the course of the vesting period. They came to EUR 417,476 for the 2012 financial year (2011: EUR 183,469), assuming no staff turn-over. This amount was allocated to retained earnings.
The option rights granted under the matching stock programme (MSP) changed as follows in the 2012 financial year:
Number of
option rights outstanding
Exercise price per right (in EUR)
Waiting period
(service period) in years
Aggregated
intrinsic value (in EUR '000)
balance at 31 December 2011 162,679 21.00 3 –
Granted 162,679 17.87 3
Exercised – – – –
Lapsed/expired – – – –
balance at 31 December 2012 325,358 19.44 3 509,185*
* based on the closing share price on 31 December 2012
in EUR ’000
Cashflow hedges
Exchange
differences on translating for-
eign operations
total
balance at 1 January 2011 – 2,459 1,095 – 1,364
Currency translation – 149 – 149
Effect before taxes – 1,839 – 1,839
Tax effect 684 684
balance at 31 December 2011 – 3,614 946 – 2,668
Currency translation – 2,797 – 2,797
Effect before taxes – 4,378 – 4,378
Tax effect 1,293 1,293
balance at 31 December 2012 – 6,699 – 1,851 – 8,550
The company used the following parameters for its evaluation:
Each tranche is recalculated, taking changes in influencing fac-tors into account, and prorated over the vested period.
The options of a tranche can only be exercised within a period of two years following the expiry of the holding period. In order for an option to be exercised, the exercise price must be at least 1.2 times the issue price (basis: weighted average of the last ten trading days). When the option is exercised, the company can
Expected duration until exercised in years 4.00
Risk-free interest rate in % 1.24
Average expected volatility in % 35.00
Expected dividend yield in % 0.00
Share price when granted in EUR 18.55
Share price on 30 December 2011 reporting date in EUR 21.00
Other reservesThe other reserves consisted of the following:
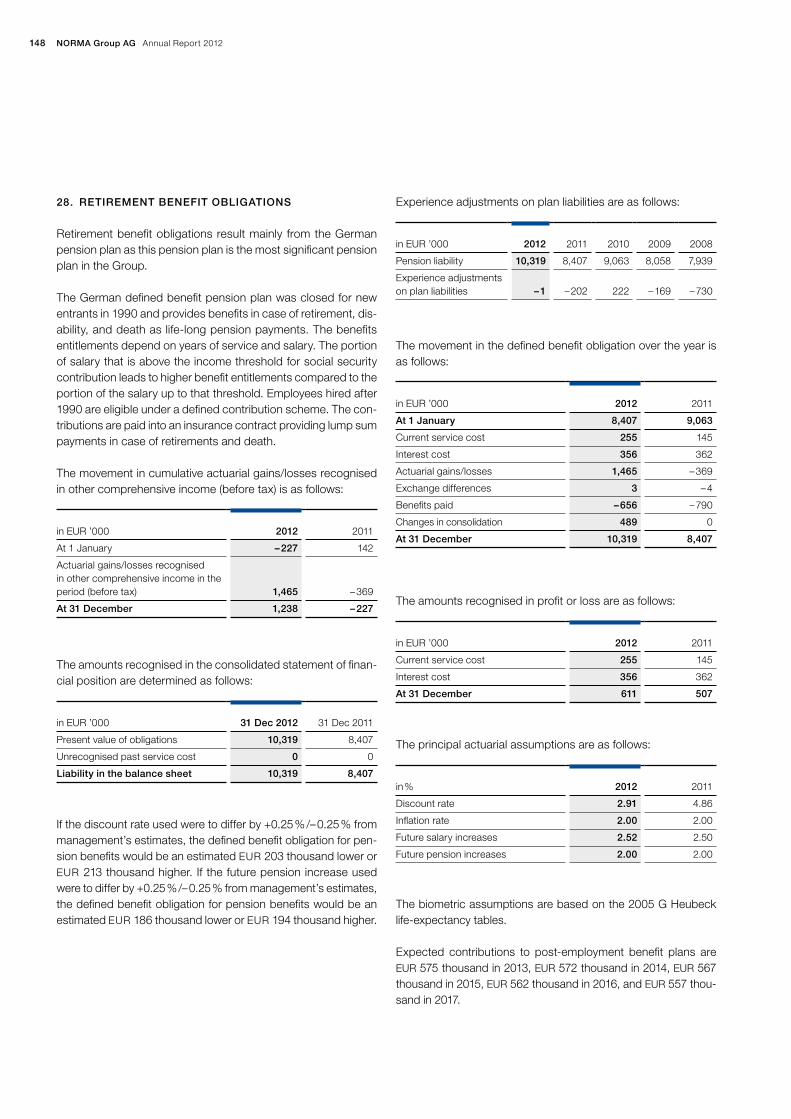
148 NORMA Group AG Annual Report 2012
Experience adjustments on plan liabilities are as follows:
The movement in the defined benefit obligation over the year is as follows:
The amounts recognised in profit or loss are as follows:
The principal actuarial assumptions are as follows:
The biometric assumptions are based on the 2005 G Heubeck life-expectancy tables.
Expected contributions to post-employment benefit plans are EUR 575 thousand in 2013, EUR 572 thousand in 2014, EUR 567 thousand in 2015, EUR 562 thousand in 2016, and EUR 557 thou-sand in 2017.
in EUR ’000
2012
2011
2010
2009
2008
Pension liability 10,319 8,407 9,063 8,058 7,939
Experience adjustments on plan liabilities
– 1
– 202
222
– 169
– 730
in EUR ’000
2012
2011
At 1 January 8,407 9,063
Current service cost 255 145
Interest cost 356 362
Actuarial gains/losses 1,465 – 369
Exchange differences 3 – 4
Benefits paid – 656 – 790
Changes in consolidation 489 0
At 31 December 10,319 8,407
in EUR ’000
2012
2011
Current service cost 255 145
Interest cost 356 362
At 31 December 611 507
in %
2012
2011
Discount rate 2.91 4.86
Inflation rate 2.00 2.00
Future salary increases 2.52 2.50
Future pension increases 2.00 2.00
28. RetIReMeNt beNeFIt OblIGAtIONS
Retirement benefit obligations result mainly from the German pension plan as this pension plan is the most significant pension plan in the Group.
The German defined benefit pension plan was closed for new entrants in 1990 and provides benefits in case of retirement, dis-ability, and death as life-long pension payments. The benefits entitlements depend on years of service and salary. The portion of salary that is above the income threshold for social security contribution leads to higher benefit entitlements compared to the portion of the salary up to that threshold. Employees hired after 1990 are eligible under a defined contribution scheme. The con-tributions are paid into an insurance contract providing lump sum payments in case of retirements and death.
The movement in cumulative actuarial gains/losses recognised in other comprehensive income (before tax) is as follows:
The amounts recognised in the consolidated statement of finan-cial position are determined as follows:
If the discount rate used were to differ by +0.25 % /– 0.25 % from management’s estimates, the defined benefit obligation for pen-sion benefits would be an estimated EUR 203 thousand lower or EUR 213 thousand higher. If the future pension increase used were to differ by +0.25 % /– 0.25 % from management’s estimates, the defined benefit obligation for pension benefits would be an estimated EUR 186 thousand lower or EUR 194 thousand higher.
in EUR ’000
2012
2011
At 1 January – 227 142
Actuarial gains/losses recognised in other comprehensive income in the period (before tax)
1,465
– 369
At 31 December 1,238 – 227
in EUR ’000
31 Dec 2012
31 Dec 2011
Present value of obligations 10,319 8,407
Unrecognised past service cost 0 0
liability in the balance sheet 10,319 8,407

149Further InformationConsolidated Financial StatementsConsolidated Management ReportTo Our ShareholdersManagement Board Letter
Notes to the consolidated financial statements
29. PROvISIONS
The development of provisions is as follows:
in EUR ’000
At 1 Jan 2012
Additions
Amounts used
Unused
amounts reversed
Interest accrued
Changes in consolidation
Foreign
currency translation
At 31 Dec 2012
Guarantees 1,507 222 – 837 0 0 758 2 1,652
Restructuring 782 455 – 586 – 34 0 1 3 621
Early retirement 3,902 1,840 – 2,059 0 253 0 0 3,936
Other personnel-related obligations
1,790
1,113
– 548
0
115
122
19
2,611
Outstanding credit notes 2,541 695 – 1,300 – 319 0 0 36 1,653
Outstanding invoices 99 746 – 283 0 0 276 1 839
Others 353 738 – 135 – 14 0 229 – 1 1,170
total provisions 10,974 5,809 – 5,748 – 367 368 1,386 60 12,482
in EUR ’000
At 1 Jan 2011
Additions
Amounts used
Unused
amounts reversed
Interest accrued
Changes in consolidation
Foreign
currency translation
At 31 Dec 2011
Guarantees 532 950 – 20 0 0 0 45 1,507
Restructuring 361 586 – 73 – 94 0 0 2 782
Early retirement 4,041 1,069 – 1,298 0 90 0 0 3,902
Operational Performance Cash Programme
987
0
– 987
0
0
0
0
0
Other personnel-related obligations
555
1,386
– 93
– 96
24
0
14
1,790
Outstanding credit notes 978 1,735 – 54 – 157 0 0 39 2,541
Outstanding invoices 0 99 0 0 0 0 0 99
Others 385 216 – 76 – 186 1 0 13 353
total provisions 7,839 6,041 – 2,601 – 533 115 0 113 10,974
31 December 2012
31 December 2011
in EUR ’000
Total
thereof current
thereof
non-current
Total
thereof current
thereof
non-current
Guarantees 1,652 1,354 298 1,507 1,507 0
Restructuring 621 621 0 782 782 0
Early retirement 3,936 0 3,936 3,902 0 3,902
Other personnel-related obligations
2,611
1,155
1,456
1,790
1,087
703
Outstanding credit notes 1,653 1,653 0 2,541 2,541 0
Outstanding invoices 839 839 0 99 99 0
Others 1,170 1,121 49 353 343 10
total provisions 12,482 6,743 5,739 10,974 6,359 4,615
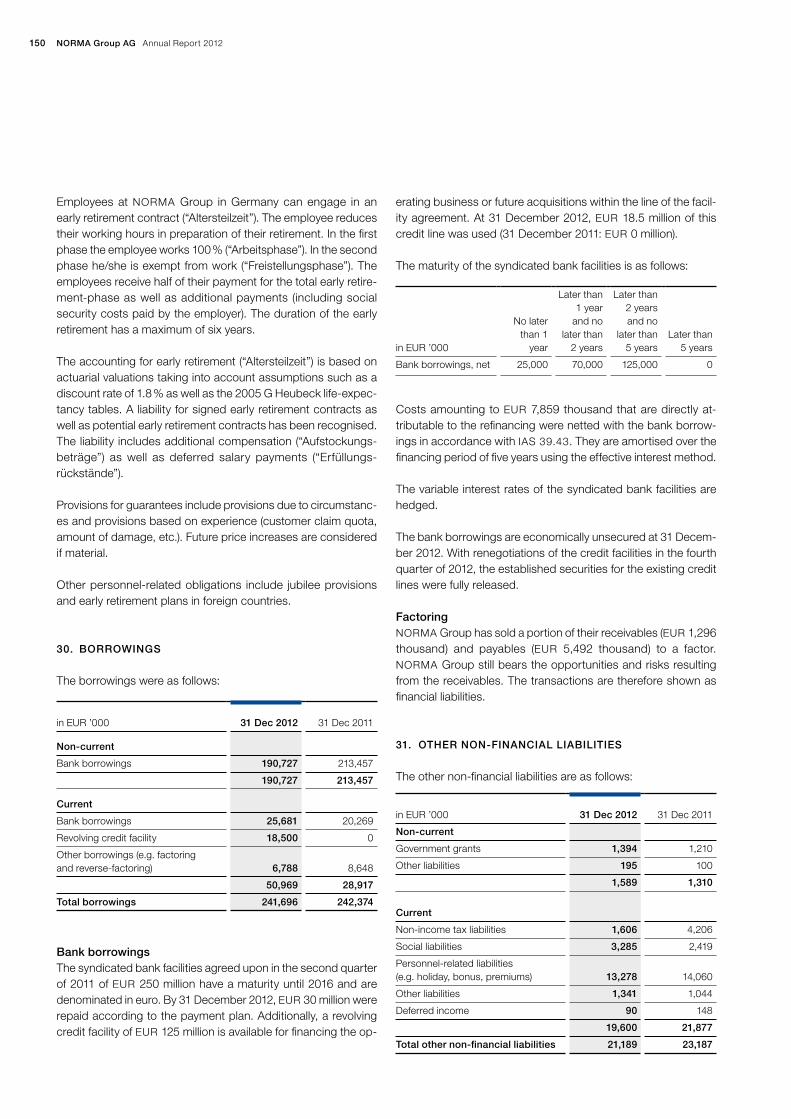
150 NORMA Group AG Annual Report 2012
erating business or future acquisitions within the line of the facil-ity agreement. At 31 December 2012, EUR 18.5 million of this credit line was used (31 December 2011: EUR 0 million).
The maturity of the syndicated bank facilities is as follows:
Costs amounting to EUR 7,859 thousand that are directly at-tributable to the refinancing were netted with the bank borrow-ings in accordance with IAS 39.43. They are amortised over the financing period of five years using the effective interest method.
The variable interest rates of the syndicated bank facilities are hedged.
The bank borrowings are economically unsecured at 31 Decem-ber 2012. With renegotiations of the credit facilities in the fourth quarter of 2012, the established securities for the existing credit lines were fully released.
Factoring NORMA Group has sold a portion of their receivables (EUR 1,296 thousand) and payables (EUR 5,492 thousand) to a factor. NORMA Group still bears the opportunities and risks resulting from the receivables. The transactions are therefore shown as financial liabilities.
31. OtheR NON-FINANCIAl lIAbIlItIeS
The other non-financial liabilities are as follows:
in EUR ’000
No later than 1
year
Later than 1 year
and no later than
2 years
Later than 2 years and no
later than 5 years
Later than 5 years
Bank borrowings, net 25,000 70,000 125,000 0
in EUR ’000
31 Dec 2012
31 Dec 2011
Non-current
Government grants 1,394 1,210
Other liabilities 195 100
1,589 1,310
Current
Non-income tax liabilities 1,606 4,206
Social liabilities 3,285 2,419
Personnel-related liabilities (e.g. holiday, bonus, premiums)
13,278
14,060
Other liabilities 1,341 1,044
Deferred income 90 148
19,600 21,877
total other non-financial liabilities 21,189 23,187
Employees at NORMA Group in Germany can engage in an early retirement contract (“Altersteilzeit”). The employee reduces their working hours in preparation of their retirement. In the first phase the employee works 100 % (“Arbeitsphase”). In the second phase he/she is exempt from work (“Freistellungsphase”). The employees receive half of their payment for the total early retire-ment-phase as well as additional payments (including social security costs paid by the employer). The duration of the early retirement has a maximum of six years.
The accounting for early retirement (“Altersteilzeit”) is based on actuarial valuations taking into account assumptions such as a discount rate of 1.8 % as well as the 2005 G Heubeck life-expec-tancy tables. A liability for signed early retirement contracts as well as potential early retirement contracts has been recognised. The liability includes additional compensation (“Aufstockungs-beträge”) as well as deferred salary payments (“Erfüllungs-rückstände”).
Provisions for guarantees include provisions due to circumstanc-es and provisions based on experience (customer claim quota, amount of damage, etc.). Future price increases are considered if material.
Other personnel-related obligations include jubilee provisions and early retirement plans in foreign countries.
30. bORROwINGS
The borrowings were as follows:
bank borrowingsThe syndicated bank facilities agreed upon in the second quarter of 2011 of EUR 250 million have a maturity until 2016 and are denominated in euro. By 31 December 2012, EUR 30 million were repaid according to the payment plan. Additionally, a revolving credit facility of EUR 125 million is available for financing the op-
in EUR ’000
31 Dec 2012
31 Dec 2011
Non-current
Bank borrowings 190,727 213,457
190,727 213,457
Current
Bank borrowings 25,681 20,269
Revolving credit facility 18,500 0
Other borrowings (e.g. factoring and reverse-factoring)
6,788
8,648
50,969 28,917
total borrowings 241,696 242,374

151Further InformationConsolidated Financial StatementsConsolidated Management ReportTo Our ShareholdersManagement Board Letter
Notes to the consolidated financial statements
33. tRADe PAyAbleS
All trade payables are due to third parties within one year. For information regarding trade payables, please refer to section 3.13.
34. FINANCIAl lIAbIlItIeS AND Net Debt
The financial liabilities of NORMA Group have the following ma-turity:
31 DeCeMbeR 2012
in EUR ’000
Less than 1 year
Between
1 and 2 years
Between
2 and 5 years
Over 5 years
Borrowings 50,969 28,971 161,756 0
Trade payables 37,663 0 0 0
Finance lease liabilities 405 340 195 0
Other financial liabilities
1,820
758
1,373
0
90,857 30,069 163,324 0
31 DeCeMbeR 2011
in EUR ’000
Less than 1 year
Between
1 and 2 years
Between
2 and 5 years
Over 5 years
Borrowings 28,917 23,326 190,131 0
Trade payables 41,373 0 0 0
Finance lease liabilities 382 310 366 0
Other financial liabilities
1,145
0
0
0
71,817 23,636 190,497 0
NORMA Group received government grants in 2012 and 2011 amounting to EUR 1,394 thousand. They consist of grants in cash as well as land. The grants are bound to capital expenditure and employees. NORMA Group recognises the government grants as income over the period in which related expenses oc-cur. In 2012, EUR 139 thousand were recognised as income.
32. OtheR FINANCIAl lIAbIlItIeS
The other financial liabilities are as follows:
The future aggregate minimum lease payments under non-can-cellable finance leases and their respective present values are as follows:
Lease liabilities are effectively secured because the rights to the leased assets will revert to the lessor in the event of default.
in EUR ’000
31 Dec 2012
31 Dec 2011
Non-current
Lease liabilities 535 676
Acquisition liabilities 2,131 0
2,666 676
Current
Lease liabilities 405 382
Outstanding credit notes 225 761
Acquisition liabilities 589 0
Other liabilities 1,006 384
2,225 1,527
total other financial liabilities 4,891 2,203
in EUR ’000
31 Dec 2012
31 Dec 2011
Gross finance lease liabilities – minimum lease payments
No later than 1 year 450 431
Later than 1 year and no later than 5 years
585
734
Later than 5 years 0 0
1,035 1,165
Future finance charges on finance lease
95
107
Present value of finance lease liabilities
No later than 1 year 405 382
Later than 1 year and no later than 5 years
535
676
Later than 5 years 0 0
940 1,058

152 NORMA Group AG Annual Report 2012
Cash flows resulting from interest paid (2012: EUR – 11,630 thou-sand; 2011: EUR – 23,289 thousand) are disclosed as cash flows from financing activities.
Cash flows from investing activities include the cash effects of the purchases of Connectors Verbindungstechnik AG (Switzer-land), Nordic Metalblok S.r.l. (Italy), Chien Jin Plastic Sdn. Bhd. (Malaysia) and Groen Bevestigingsmaterialen B.V. (Netherlands) in 2012. In 2011, the cash effects of the purchase of non-control-ling interest of EUR 4,677 thousand are recognised. Furthermore, cash flows from investing activities include transactions relating to the acquisition and disposal of non-current assets. Cash flows from the acquisition of non-current assets of EUR 30,035 thou-sand include cash flows for growth of EUR 18,548 thousand and cash flows for maintenance of EUR 11,487 thousand.
The net payments for acquisitions of subsidiaries were as follows:
Cash flows from financing activities comprise proceeds from bor-rowings (2012: EUR 18,500 thousand, 2011: EUR 293,675 thou-sand), repayments of borrowings (2012: EUR – 23,173 thousand; 2011: EUR – 410,513 thousand), payment of the dividend (2012: EUR – 19,125 thousand, 2011: EUR 0 thousand), reimbursement of OPICP by shareholders (2012: EUR 1,307 thousand, 2011: EUR 388 thousand) as well as cash flows resulting from interest paid (2012: EUR – 11,630 thousand, 2011: EUR – 23,289 thou-sand).
In 2011, cash flow from financing activities also included IPO costs netted with equity (EUR – 6,544 thousand), reimbursement of IPO costs by shareholders (EUR 6,602 thousand), refinancing costs (EUR – 7,859 thousand) and proceeds from capital in-crease (EUR 147,000 thousand).
Cash is comprised of cash on hand and demand deposits of EUR 72,389 thousand at 31 December 2012 (31 December 2011: EUR 67,891 thousand). As at 31 December 2012 and 2011, liquid funds did not comprise any cash equivalents. Cash from China, Serbia, Brazil and Malaysia (31 December 2012: EUR 4,963 thousand, 31 December 2011: EUR 982 thousand) cannot be distributed due to capital transaction controls.
in EUR ’000
Consideration 37,564
Fair value of previously held non-controlling interests – 1,773
Acquired cash and cash equivalents – 4,584
Acquisition liability – 2,231
Net payments for acquisitions of subsidiaries 28,976
Net debt of the NORMA Group is as follows:
Other notes
35. INFORMAtION ON the CONSOlIDAteD StAteMeNt
OF CASh FlOwS
In the statement of cash flows, a distinction is made between cash flows from operating activities, investing activities and fi-nancing activities.
Cash flows from operating activities represent the cash effects of transactions and other events relating to the principal revenue-producing activities. The Group participates in a reverse-factor-ing-programme. The payments to the factor are included in cash flows from operating activities, since this best represents the economic substance of the transaction. Other non-cash expens-es and revenues in financial year 2012 mainly include the non-cash valuation of interest rate swaps amounting to EUR – 3,085 thousand (2011: EUR – 1,155 thousand), the non-cash evaluation of bank borrowings, including net foreign exchange valuation on financing activities as well as non-cash interest expenses amounting to EUR 1,694 thousand (2011: EUR 6,539 thousand), in equity recognised foreign exchange rate evaluation effects and actuarial gains/losses amounting to EUR – 3,833 thousand (2011: EUR 109 thousand) as well as own work capitalized amounting to EUR – 1,671 thousand (2011: EUR 0 thousand). In 2012, a one-time-income of EUR 1,296 thousand resulting from the fair-value-evaluation of the 30 %-share in Groen Bevestigingsmaterialen B.V. is also recognised in this item.
in EUR ’000
31 Dec 2012
31 Dec 2011
Bank borrowings, net 234,908 233,726
Derivative financial liabilities – hedge accounting
24,675
21,809
Derivative financial liabilities – held for trading
114
18
Other borrowings (e.g. factoring and reverse factoring)
6,788
8,648
Lease liabilities 940 1,058
Other financial liabilities 3,951 1,145
Financial debt 271,376 266,404
Cash and cash equivalents 72,389 67,891
Net debt 198,987 198,513
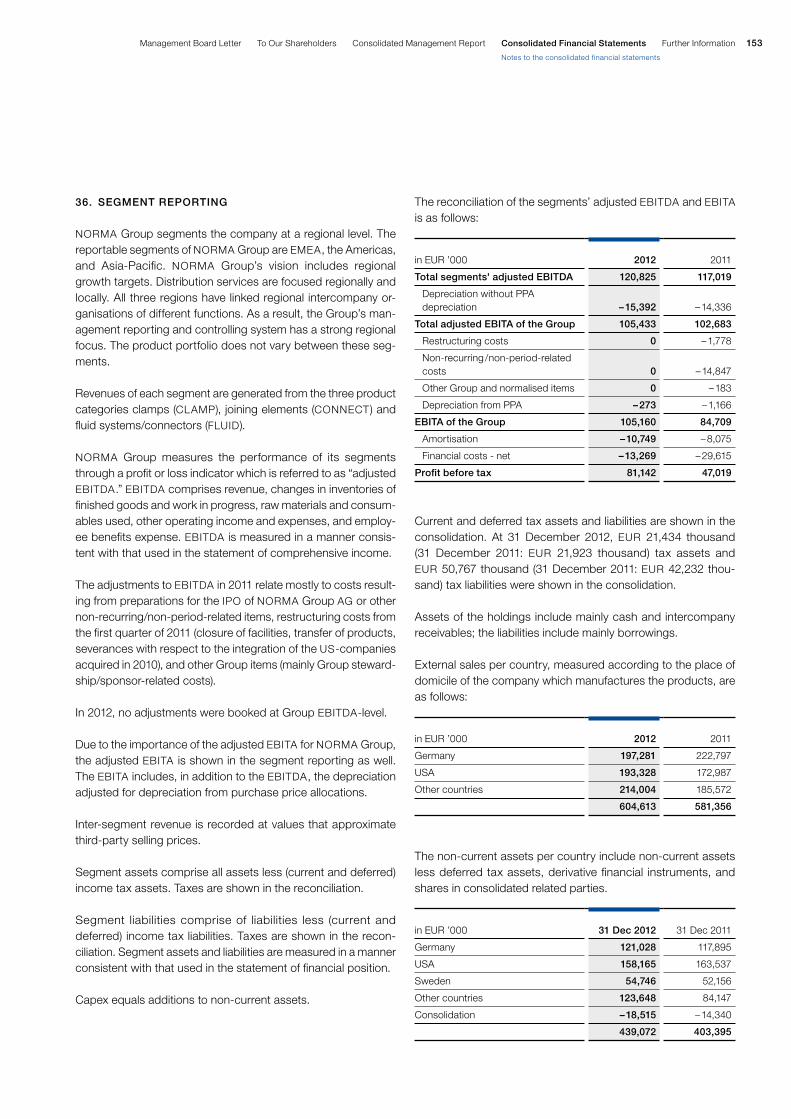
153Further InformationConsolidated Financial StatementsConsolidated Management ReportTo Our ShareholdersManagement Board Letter
Notes to the consolidated financial statements
The reconciliation of the segments’ adjusted EBITDA and EBITA is as follows:
Current and deferred tax assets and liabilities are shown in the consolidation. At 31 December 2012, EUR 21,434 thousand (31 December 2011: EUR 21,923 thousand) tax assets and EUR 50,767 thousand (31 December 2011: EUR 42,232 thou-sand) tax liabilities were shown in the consolidation.
Assets of the holdings include mainly cash and intercompany receivables; the liabilities include mainly borrowings.
External sales per country, measured according to the place of domicile of the company which manufactures the products, are as follows:
The non-current assets per country include non-current assets less deferred tax assets, derivative financial instruments, and shares in consolidated related parties.
in EUR ’000
2012
2011
total segments' adjusted ebItDA 120,825 117,019
Depreciation without PPA depreciation
– 15,392
– 14,336
total adjusted ebItA of the Group 105,433 102,683
Restructuring costs 0 – 1,778
Non-recurring / non-period-related costs
0
– 14,847
Other Group and normalised items 0 – 183
Depreciation from PPA – 273 – 1,166
ebItA of the Group 105,160 84,709
Amortisation – 10,749 – 8,075
Financial costs - net – 13,269 – 29,615
Profit before tax 81,142 47,019
in EUR ’000
2012
2011
Germany 197,281 222,797
USA 193,328 172,987
Other countries 214,004 185,572
604,613 581,356
in EUR ’000
31 Dec 2012
31 Dec 2011
Germany 121,028 117,895
USA 158,165 163,537
Sweden 54,746 52,156
Other countries 123,648 84,147
Consolidation – 18,515 – 14,340
439,072 403,395
36. SeGMeNt RePORtING
NORMA Group segments the company at a regional level. The reportable segments of NORMA Group are EMEA, the Americas, and Asia-Pacific. NORMA Group’s vision includes regional growth targets. Distribution services are focused regionally and locally. All three regions have linked regional intercompany or-ganisations of different functions. As a result, the Group’s man-agement reporting and controlling system has a strong regional focus. The product portfolio does not vary between these seg-ments.
Revenues of each segment are generated from the three product categories clamps (CLAMP), joining elements (CONNECT) and fluid systems/connectors (FLUID).
NORMA Group measures the performance of its segments through a profit or loss indicator which is referred to as “adjusted EBITDA.” EBITDA comprises revenue, changes in inventories of finished goods and work in progress, raw materials and consum-ables used, other operating income and expenses, and employ-ee benefits expense. EBITDA is measured in a manner consis-tent with that used in the statement of comprehensive income.
The adjustments to EBITDA in 2011 relate mostly to costs result-ing from preparations for the IPO of NORMA Group AG or other non-recurring/non-period-related items, restructuring costs from the first quarter of 2011 (closure of facilities, transfer of products, severances with respect to the integration of the US-companies acquired in 2010), and other Group items (mainly Group steward-ship/sponsor-related costs).
In 2012, no adjustments were booked at Group EBITDA-level.
Due to the importance of the adjusted EBITA for NORMA Group, the adjusted EBITA is shown in the segment reporting as well. The EBITA includes, in addition to the EBITDA, the depreciation adjusted for depreciation from purchase price allocations.
Inter-segment revenue is recorded at values that approximate third-party selling prices.
Segment assets comprise all assets less (current and deferred) income tax assets. Taxes are shown in the reconciliation.
Segment liabilities comprise of liabilities less (current and deferred) income tax liabilities. Taxes are shown in the recon-ciliation. Segment assets and liabilities are measured in a manner consistent with that used in the statement of financial position.
Capex equals additions to non-current assets.
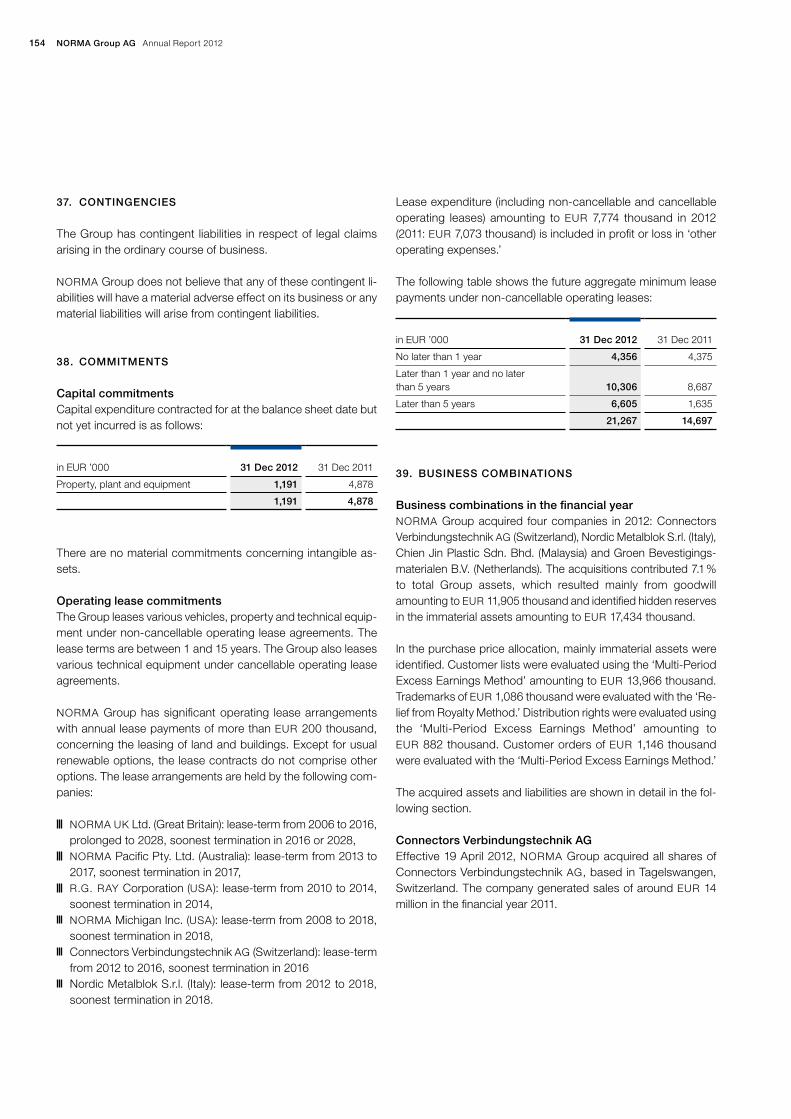
154 NORMA Group AG Annual Report 2012
Lease expenditure (including non-cancellable and cancellable operating leases) amounting to EUR 7,774 thousand in 2012 (2011: EUR 7,073 thousand) is included in profit or loss in ‘other operating expenses.’
The following table shows the future aggregate minimum lease payments under non-cancellable operating leases:
39. buSINeSS COMbINAtIONS
business combinations in the financial year NORMA Group acquired four companies in 2012: Connectors Verbindungstechnik AG (Switzerland), Nordic Metalblok S.rl. (Italy), Chien Jin Plastic Sdn. Bhd. (Malaysia) and Groen Bevestigings-materialen B.V. (Netherlands). The acquisitions contributed 7.1 % to total Group assets, which resulted mainly from goodwill amounting to EUR 11,905 thousand and identified hidden reserves in the immaterial assets amounting to EUR 17,434 thousand.
In the purchase price allocation, mainly immaterial assets were identified. Customer lists were evaluated using the ‘Multi-Period Excess Earnings Method’ amounting to EUR 13,966 thousand. Trademarks of EUR 1,086 thousand were evaluated with the ‘Re-lief from Royalty Method.’ Distribution rights were evaluated using the ‘Multi-Period Excess Earnings Method’ amounting to EUR 882 thousand. Customer orders of EUR 1,146 thousand were evaluated with the ‘Multi-Period Excess Earnings Method.’
The acquired assets and liabilities are shown in detail in the fol-lowing section.
Connectors verbindungstechnik AGEffective 19 April 2012, NORMA Group acquired all shares of Connectors Verbindungstechnik AG, based in Tagelswangen, Switzerland. The company generated sales of around EUR 14 million in the financial year 2011.
in EUR ’000
31 Dec 2012
31 Dec 2011
No later than 1 year 4,356 4,375
Later than 1 year and no later than 5 years
10,306
8,687
Later than 5 years 6,605 1,635
21,267 14,697
37. CONtINGeNCIeS
The Group has contingent liabilities in respect of legal claims arising in the ordinary course of business.
NORMA Group does not believe that any of these contingent li-abilities will have a material adverse effect on its business or any material liabilities will arise from contingent liabilities.
38. COMMItMeNtS
Capital commitmentsCapital expenditure contracted for at the balance sheet date but not yet incurred is as follows:
There are no material commitments concerning intangible as-sets.
Operating lease commitmentsThe Group leases various vehicles, property and technical equip-ment under non-cancellable operating lease agreements. The lease terms are between 1 and 15 years. The Group also leases various technical equipment under cancellable operating lease agreements.
NORMA Group has significant operating lease arrangements with annual lease payments of more than EUR 200 thousand, concerning the leasing of land and buildings. Except for usual renewable options, the lease contracts do not comprise other options. The lease arrangements are held by the following com-panies:
NORMA UK Ltd. (Great Britain): lease-term from 2006 to 2016, prolonged to 2028, soonest termination in 2016 or 2028,
NORMA Pacific Pty. Ltd. (Australia): lease-term from 2013 to 2017, soonest termination in 2017,
R.G. RAY Corporation (USA): lease-term from 2010 to 2014, soonest termination in 2014,
NORMA Michigan Inc. (USA): lease-term from 2008 to 2018, soonest termination in 2018,
Connectors Verbindungstechnik AG (Switzerland): lease-term from 2012 to 2016, soonest termination in 2016
Nordic Metalblok S.r.l. (Italy): lease-term from 2012 to 2018, soonest termination in 2018.
in EUR ’000
31 Dec 2012
31 Dec 2011
Property, plant and equipment 1,191 4,878
1,191 4,878

155Further InformationConsolidated Financial StatementsConsolidated Management ReportTo Our ShareholdersManagement Board Letter
Notes to the consolidated financial statements
Of the total acquisition-related costs amounting to EUR 1,028 thou-sand, EUR 305 thousand were recognised in 2011; the remaining amount was recognised in 2012 in the other operating expenses in the consolidated statement of comprehensive income.
The fair value of trade and other receivables is EUR 3,552 thou-sand and includes trade receivables with a fair value of EUR 3,141 thousand. The gross contractual amount for trade receivables due is EUR 3,340 thousand, of which EUR 199 thousand are expected to be uncollectible.
The fair value of the acquired identifiable intangible assets of EUR 11,811 thousand (including patents, trademarks, customer relationships and non-current customer orders) is provisional pending receipt of the final valuations for those assets due to the acquisition of Connectors Verbindungstechnik AG on 19 April 2012.
The provisions relate to warranty provisions in the ordinary course of business.
A contingent liability of EUR 208 thousand has been recognised for sales-related risks which should be settled within one year.
The revenue included in the consolidated statement of compre-hensive income since 19 April 2012 contributed by Connectors Verbindungstechnik AG was EUR 11,535 thousand. Connectors also contributed profit of EUR 1,117 thousand over the same period.
Had Connectors Verbindungstechnik AG been consolidated from 1 January 2012, the consolidated statement of comprehen-sive income would show revenue of EUR 16,801 thousand. The profit for this period cannot be shown due to the previously dif-ferent financial year.
Nordic Metalblok S.r.l.Effective 12 July 2012, NORMA Group acquired all shares of Nordic Metalblok S.r.l., based in Riese Pio X in Northern Italy. The company generated sales of around EUR 6 million in the financial year 2011.
Connectors Verbindungstechnik AG specializes in connector systems for the pharmaceutical and biotechnology industry. With the acquisition, NORMA Group will gain better access to custom-ers in these sectors.
The goodwill of EUR 6,948 thousand arising from the acquisition is attributable to the access to the pharmaceutical and biotech-nological market segments as well as the expansion of the NORMA Group product portfolio by sterile connecting technol-ogy, engineered valves and sterile silicon hoses.
The consideration of EUR 21,230 thousand was paid in cash.
None of the goodwill recognised is expected to be deductible for income tax purposes.
The following table summarises the consideration paid for Con-nectors Verbindungstechnik AG and the amounts of the assets acquired and liabilities assumed recognised at the acquisition date.
in EUR ’000
q2 2012
Consideration at 19 April 2012 21,230
Acquisition-related costs (included in other operating expenses in the consolidated statement of comprehen-sive income in H1 2012 and 2011)
1,028
Recognised amounts of identifiable assets acquired and liabilities assumed
Cash and cash equivalents 2,081
Property, plant and equipment 293
Patents 354
Trademarks 595
Customer lists 9,762
Customer orders 1,100
Inventory 3,456
Trade and other receivables 3,552
Trade payables – 2,382
Other liabilities – 885
Provisions – 282
Contingent liabilities – 208
Income tax liabilities – 588
Deferred tax assets 71
Deferred tax liabilities – 2,637
total identifiable net assets 14,282
Goodwill 6,948
21,230
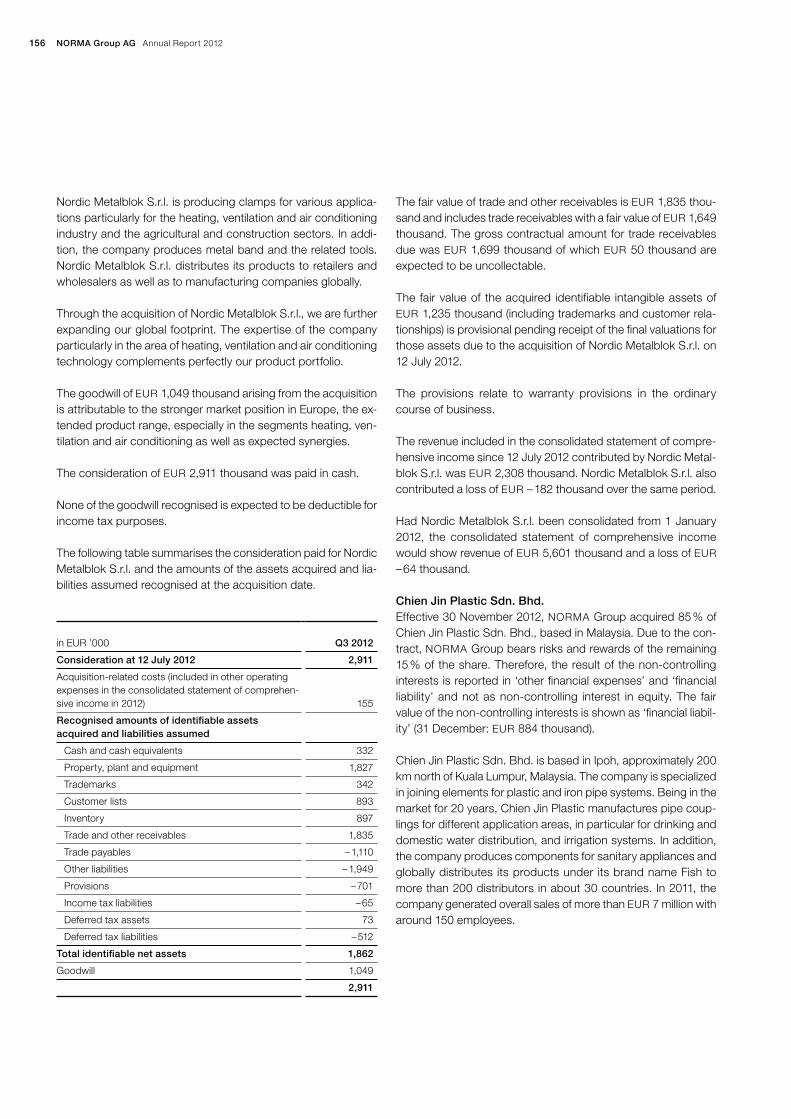
156 NORMA Group AG Annual Report 2012
The fair value of trade and other receivables is EUR 1,835 thou-sand and includes trade receivables with a fair value of EUR 1,649 thousand. The gross contractual amount for trade receivables due was EUR 1,699 thousand of which EUR 50 thousand are expected to be uncollectable.
The fair value of the acquired identifiable intangible assets of EUR 1,235 thousand (including trademarks and customer rela-tionships) is provisional pending receipt of the final valuations for those assets due to the acquisition of Nordic Metalblok S.r.l. on 12 July 2012.
The provisions relate to warranty provisions in the ordinary course of business.
The revenue included in the consolidated statement of compre-hensive income since 12 July 2012 contributed by Nordic Metal-blok S.r.l. was EUR 2,308 thousand. Nordic Metalblok S.r.l. also contributed a loss of EUR – 182 thousand over the same period.
Had Nordic Metalblok S.r.l. been consolidated from 1 January 2012, the consolidated statement of comprehensive income would show revenue of EUR 5,601 thousand and a loss of EUR – 64 thousand.
Chien Jin Plastic Sdn. bhd.Effective 30 November 2012, NORMA Group acquired 85 % of Chien Jin Plastic Sdn. Bhd., based in Malaysia. Due to the con-tract, NORMA Group bears risks and rewards of the remaining 15 % of the share. Therefore, the result of the non-controlling interests is reported in ‘other financial expenses’ and ‘financial liability’ and not as non-controlling interest in equity. The fair value of the non-controlling interests is shown as ‘financial liabil-ity’ (31 December: EUR 884 thousand).
Chien Jin Plastic Sdn. Bhd. is based in Ipoh, approximately 200 km north of Kuala Lumpur, Malaysia. The company is specialized in joining elements for plastic and iron pipe systems. Being in the market for 20 years, Chien Jin Plastic manufactures pipe coup-lings for different application areas, in particular for drinking and domestic water distribution, and irrigation systems. In addition, the company produces components for sanitary appliances and globally distributes its products under its brand name Fish to more than 200 distributors in about 30 countries. In 2011, the company generated overall sales of more than EUR 7 million with around 150 employees.
Nordic Metalblok S.r.l. is producing clamps for various applica-tions particularly for the heating, ventilation and air conditioning industry and the agricultural and construction sectors. In addi-tion, the company produces metal band and the related tools. Nordic Metalblok S.r.l. distributes its products to retailers and wholesalers as well as to manufacturing companies globally.
Through the acquisition of Nordic Metalblok S.r.l., we are further expanding our global footprint. The expertise of the company particularly in the area of heating, ventilation and air conditioning technology complements perfectly our product portfolio.
The goodwill of EUR 1,049 thousand arising from the acquisition is attributable to the stronger market position in Europe, the ex-tended product range, especially in the segments heating, ven-tilation and air conditioning as well as expected synergies.
The consideration of EUR 2,911 thousand was paid in cash.
None of the goodwill recognised is expected to be deductible for income tax purposes.
The following table summarises the consideration paid for Nordic Metalblok S.r.l. and the amounts of the assets acquired and lia-bilities assumed recognised at the acquisition date.
in EUR ’000
q3 2012
Consideration at 12 July 2012 2,911
Acquisition-related costs (included in other operating expenses in the consolidated statement of comprehen-sive income in 2012)
155
Recognised amounts of identifiable assets acquired and liabilities assumed
Cash and cash equivalents 332
Property, plant and equipment 1,827
Trademarks 342
Customer lists 893
Inventory 897
Trade and other receivables 1,835
Trade payables – 1,110
Other liabilities – 1,949
Provisions – 701
Income tax liabilities – 65
Deferred tax assets 73
Deferred tax liabilities – 512
total identifiable net assets 1,862
Goodwill 1,049
2,911

157Further InformationConsolidated Financial StatementsConsolidated Management ReportTo Our ShareholdersManagement Board Letter
Notes to the consolidated financial statements
The fair value of trade and other receivables is EUR 1,593 thou-sand and includes trade receivables with a fair value of EUR 1,575 thousand. The gross contractual amount for trade receivables due was EUR 1,650 thousand of which EUR 75 thousand are expected to be uncollectable.
The fair value of the acquired identifiable intangible assets of EUR 1,725 thousand (including trademarks and customer rela-tionships) is provisional pending receipt of the final valuations for those assets due to the acquisition of Chien Jin Plastic Sdn. Bhd. on 30 November 2012.
The provisions relate mainly to legal issues.
The revenue included in the consolidated statement of compre-hensive income since 30 November 2012 contributed by Chien Jin Plastic Sdn. Bhd. was EUR 472 thousand. Chien Jin Plastic Sdn. Bhd. also contributed profit of EUR 48 thousand over the same period.
Had Chien Jin Plastic Sdn. Bhd. been consolidated from 1 Jan-uary 2012, the consolidated statement of comprehensive income would show revenue of EUR 7,679 thousand and profit of EUR 1,050 thousand.
Groen bevestigingsmaterialen b.v.Effective 31 December 2012, NORMA Group acquired an addi-tional 60 % of Groen Bevestigingsmaterialen B.V., based in Pu-merend, Netherlands. NORMA Group already held 30 % in Groen Bevestigingsmaterialen B.V. which were accounted for at cost. NORMA Group now holds 90 % of the shares and therefore fully consolidates Groen Bevestigingsmaterialen B.V.
With the acquisition of a further 60 % of the shares, the previ-ously held shares of 30 % amounting to EUR 477 thousand were evaluated at fair value amounting to EUR 1,773 thousand. The resulting income of EUR 1,296 thousand is recognised in ‘other operating income’ in the consolidated statement of comprehen-sive income. The fair value was evaluated using the discounted cash flow method and verified with other evaluation methods.
Groen Bevestigingsmaterialen B.V. is based in Pumerend, about 20 kilometres North of Amsterdam in the Netherlands. The com-pany is a wholesale supplier of hose and pipe clamps as well as couplings to the industrial, construction, agriculture, plumbing, hardware, and automotive sector throughout Belgium, the Neth-
The acquisition of Chien Jin Plastic Sdn. Bhd. is a milestone for NORMA Group in expanding its business activities into South-east Asia. The company extends the product range in infrastruc-ture and the distribution network in this dynamically growing region.
The goodwill of EUR 1,254 thousand arising from the acquisition is attributable to the expansion of the business activities into Southeast Asia, an extended product range in the segment in-frastructure and the expansion of the distribution network in this dynamically growing region.
Of the consideration of EUR 7,535 thousand, EUR 6,419 thou-sand were paid in cash and EUR 1,116 thousand consist of in-curred liabilities.
None of the goodwill recognised is expected to be deductible for income tax purposes.
The following table summarises the consideration paid for Chien Jin Plastic Sdn. Bhd. and the amounts of the assets acquired and liabilities assumed recognised at the acquisition date.
in EUR ’000
q4 2012
Consideration at 30 November 2012 7,535
Acquisition-related costs (included in other operating expenses in the consolidated statement of comprehen-sive income in 2012)
234
Recognised amounts of identifiable assets acquired and liabilities assumed
Cash and cash equivalents 2,110
Property, plant and equipment 2,322
Trademarks 149
Customer lists 1,545
Customer orders 31
Inventory 1,220
Trade and other receivables 1,593
Income tax assets 59
Borrowings – 479
Trade payables – 287
Other liabilities – 495
Provisions – 649
Income tax liabilities – 357
Deferred tax assets 117
Deferred tax liabilities – 598
total identifiable net assets 6,281
Goodwill 1,254
7,535
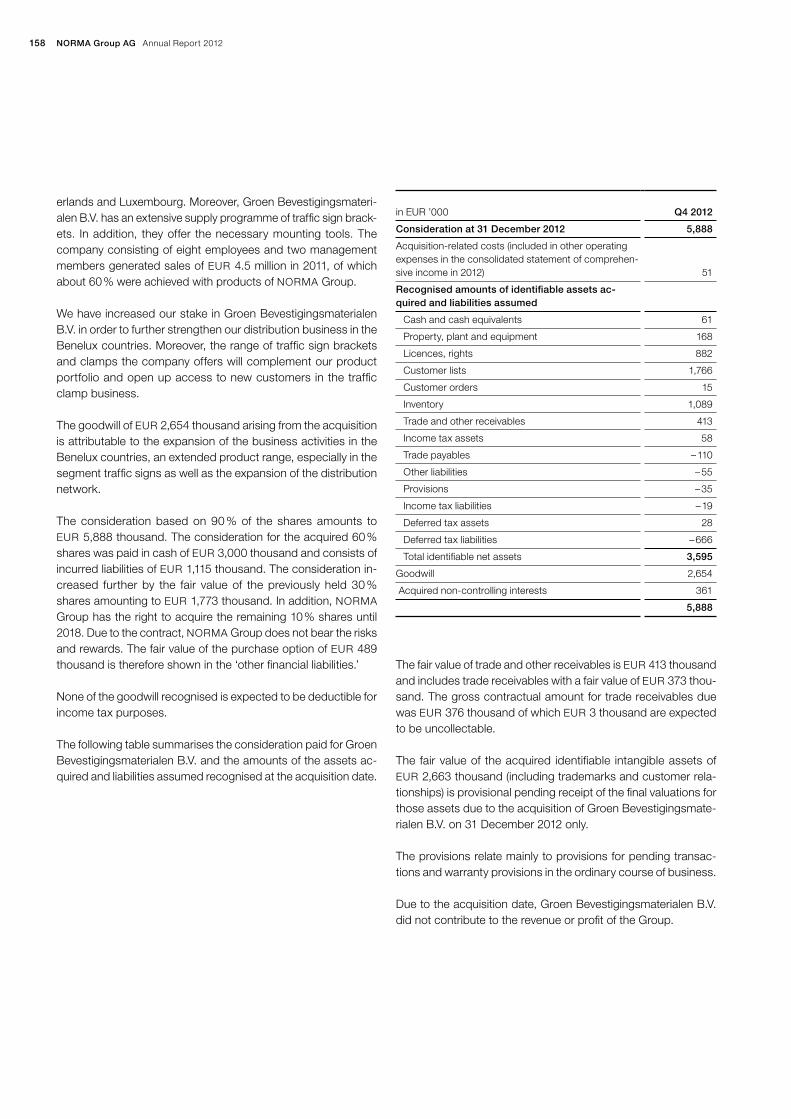
158 NORMA Group AG Annual Report 2012
The fair value of trade and other receivables is EUR 413 thousand and includes trade receivables with a fair value of EUR 373 thou-sand. The gross contractual amount for trade receivables due was EUR 376 thousand of which EUR 3 thousand are expected to be uncollectable.
The fair value of the acquired identifiable intangible assets of EUR 2,663 thousand (including trademarks and customer rela-tionships) is provisional pending receipt of the final valuations for those assets due to the acquisition of Groen Bevestigingsmate-rialen B.V. on 31 December 2012 only.
The provisions relate mainly to provisions for pending transac-tions and warranty provisions in the ordinary course of business.
Due to the acquisition date, Groen Bevestigingsmaterialen B.V. did not contribute to the revenue or profit of the Group.
in EUR ’000
q4 2012
Consideration at 31 December 2012 5,888
Acquisition-related costs (included in other operating expenses in the consolidated statement of comprehen-sive income in 2012)
51
Recognised amounts of identifiable assets ac-quired and liabilities assumed
Cash and cash equivalents 61
Property, plant and equipment 168
Licences, rights 882
Customer lists 1,766
Customer orders 15
Inventory 1,089
Trade and other receivables 413
Income tax assets 58
Trade payables – 110
Other liabilities – 55
Provisions – 35
Income tax liabilities – 19
Deferred tax assets 28
Deferred tax liabilities – 666
Total identifiable net assets 3,595
Goodwill 2,654
Acquired non-controlling interests 361
5,888
erlands and Luxembourg. Moreover, Groen Bevestigingsmateri-alen B.V. has an extensive supply programme of traffic sign brack-ets. In addition, they offer the necessary mounting tools. The company consisting of eight employees and two management members generated sales of EUR 4.5 million in 2011, of which about 60 % were achieved with products of NORMA Group.
We have increased our stake in Groen Bevestigingsmaterialen B.V. in order to further strengthen our distribution business in the Benelux countries. Moreover, the range of traffic sign brackets and clamps the company offers will complement our product portfolio and open up access to new customers in the traffic clamp business.
The goodwill of EUR 2,654 thousand arising from the acquisition is attributable to the expansion of the business activities in the Benelux countries, an extended product range, especially in the segment traffic signs as well as the expansion of the distribution network.
The consideration based on 90 % of the shares amounts to EUR 5,888 thousand. The consideration for the acquired 60 % shares was paid in cash of EUR 3,000 thousand and consists of incurred liabilities of EUR 1,115 thousand. The consideration in-creased further by the fair value of the previously held 30 % shares amounting to EUR 1,773 thousand. In addition, NORMA Group has the right to acquire the remaining 10 % shares until 2018. Due to the contract, NORMA Group does not bear the risks and rewards. The fair value of the purchase option of EUR 489 thousand is therefore shown in the ‘other financial liabilities.’
None of the goodwill recognised is expected to be deductible for income tax purposes.
The following table summarises the consideration paid for Groen Bevestigingsmaterialen B.V. and the amounts of the assets ac-quired and liabilities assumed recognised at the acquisition date.
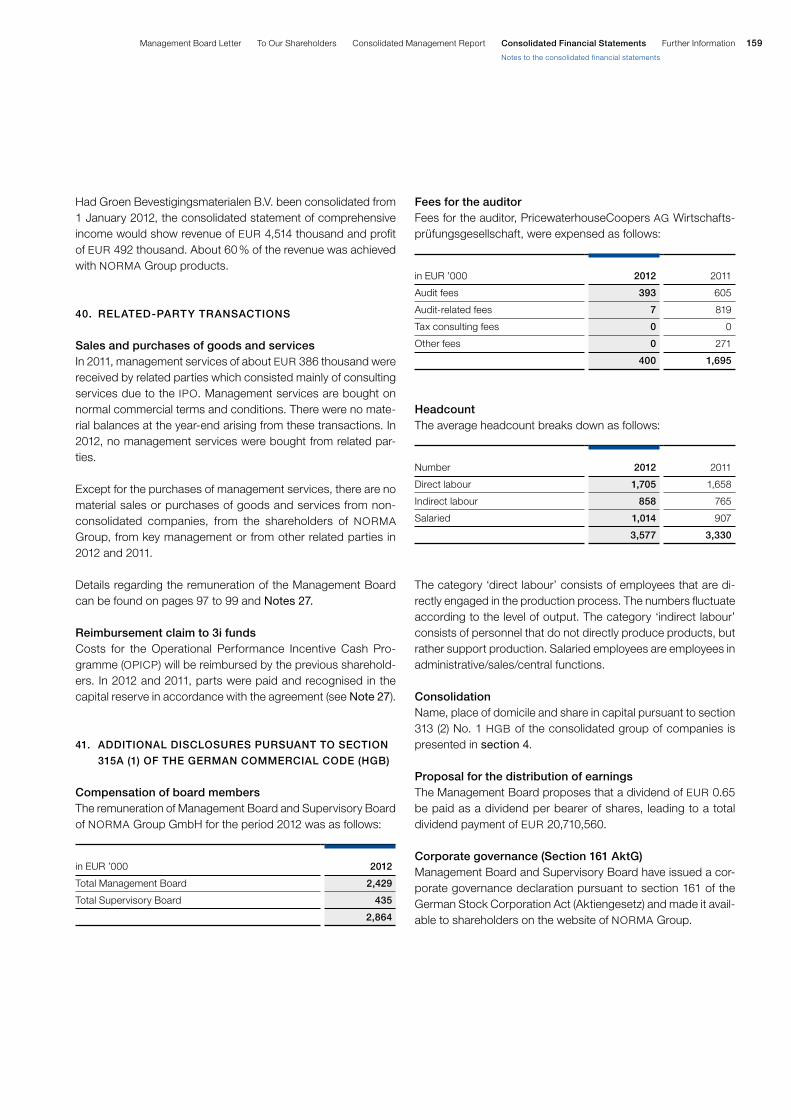
159Further InformationConsolidated Financial StatementsConsolidated Management ReportTo Our ShareholdersManagement Board Letter
Notes to the consolidated financial statements
Fees for the auditorFees for the auditor, PricewaterhouseCoopers AG Wirtschafts-prüfungsgesellschaft, were expensed as follows:
headcountThe average headcount breaks down as follows:
The category ‘direct labour’ consists of employees that are di-rectly engaged in the production process. The numbers fluctuate according to the level of output. The category ‘indirect labour’ consists of personnel that do not directly produce products, but rather support production. Salaried employees are employees in administrative/sales/central functions.
ConsolidationName, place of domicile and share in capital pursuant to section 313 (2) No. 1 HGB of the consolidated group of companies is presented in section 4.
Proposal for the distribution of earningsThe Management Board proposes that a dividend of EUR 0.65 be paid as a dividend per bearer of shares, leading to a total dividend payment of EUR 20,710,560.
Corporate governance (Section 161 AktG)Management Board and Supervisory Board have issued a cor-porate governance declaration pursuant to section 161 of the German Stock Corporation Act (Aktiengesetz) and made it avail-able to shareholders on the website of NORMA Group.
in EUR ’000
2012
2011
Audit fees 393 605
Audit-related fees 7 819
Tax consulting fees 0 0
Other fees 0 271
400 1,695
Number
2012
2011
Direct labour 1,705 1,658
Indirect labour 858 765
Salaried 1,014 907
3,577 3,330
Had Groen Bevestigingsmaterialen B.V. been consolidated from 1 January 2012, the consolidated statement of comprehensive income would show revenue of EUR 4,514 thousand and profit of EUR 492 thousand. About 60 % of the revenue was achieved with NORMA Group products.
40. RelAteD-PARty tRANSACtIONS
Sales and purchases of goods and servicesIn 2011, management services of about EUR 386 thousand were received by related parties which consisted mainly of consulting services due to the IPO. Management services are bought on normal commercial terms and conditions. There were no mate-rial balances at the year-end arising from these transactions. In 2012, no management services were bought from related par-ties.
Except for the purchases of management services, there are no material sales or purchases of goods and services from non-consolidated companies, from the shareholders of NORMA Group, from key management or from other related parties in 2012 and 2011.
Details regarding the remuneration of the Management Board can be found on pages 97 to 99 and Notes 27.
Reimbursement claim to 3i fundsCosts for the Operational Performance Incentive Cash Pro-gramme (OPICP) will be reimbursed by the previous sharehold-ers. In 2012 and 2011, parts were paid and recognised in the capital reserve in accordance with the agreement (see Note 27).
41. ADDItIONAl DISClOSuReS PuRSuANt tO SeCtION
315A (1) OF the GeRMAN COMMeRCIAl CODe (hGb)
Compensation of board membersThe remuneration of Management Board and Supervisory Board of NORMA Group GmbH for the period 2012 was as follows:
in EUR ’000
2012
Total Management Board 2,429
Total Supervisory Board 435
2,864
160 NORMA Group AG Annual Report 2012
42. eveNtS AFteR the bAlANCe Sheet DAte
NORMA Group signed an agreement on 10 January 2013 to acquire the distribution business of DavyDick & Co. Pty. Limited (“DavyDick”) in Australia.
DavyDick, based in Goulburn, approximately 150 km southwest of Sydney, has been a distributor of various elements for the transportation of water in irrigation systems for more than 20 years. The company is specialised in supplying a comprehensive range of rural irrigation fittings, valves, and pumps under its brand name PUMPMASTER to around 700 customers through-out Australia in the agricultural, hardware and plumbing markets. DavyDick maintains branches in Melbourne, Adelaide and Bris-bane. In the past fiscal year, the company generated overall sales of around EUR 4 million.
With the acquisition of the distribution business of DavyDick, NORMA Group builds on its water platform and complements its product range in the infrastructure business area. The company expands its distribution network with a focus on agriculture and irrigation. NORMA Group has already been present in Australia since 1992.
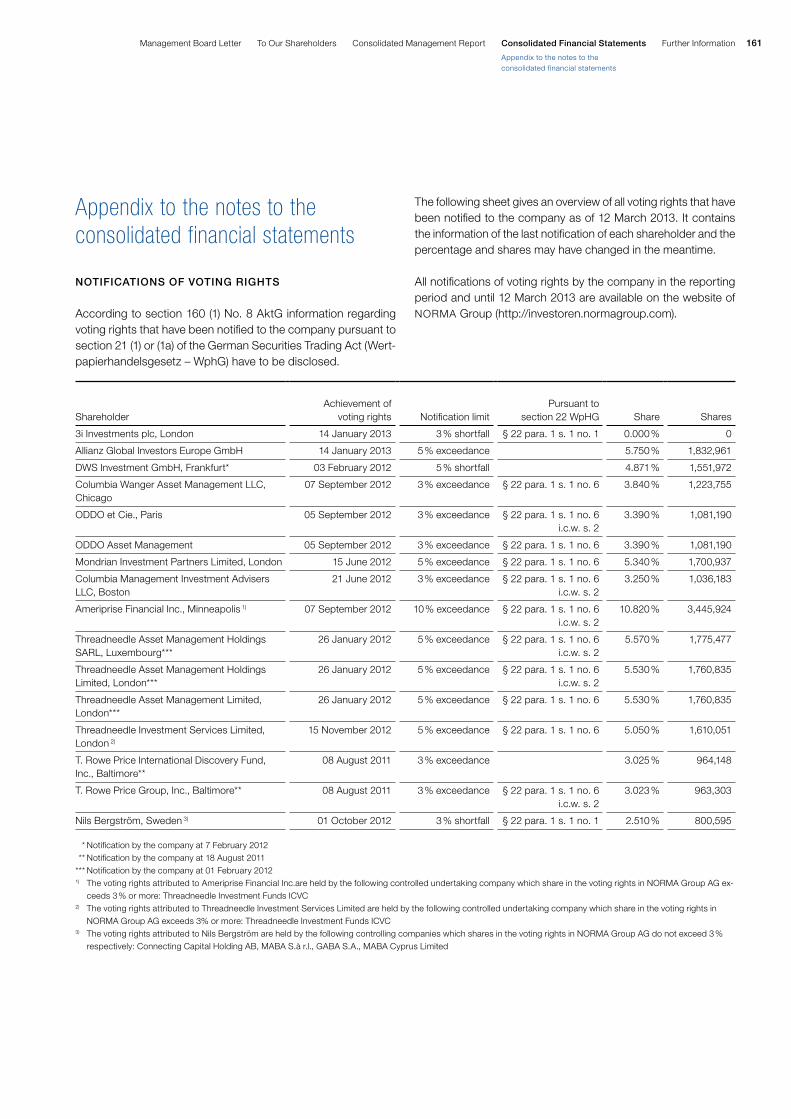
161Further InformationConsolidated Financial StatementsConsolidated Management ReportTo Our ShareholdersManagement Board Letter
Appendix to the notes to the consolidated financial statements
Appendix to the notes to the consolidated financial statements
NotificatioNs of votiNg rights
According to section 160 (1) No. 8 AktG information regarding voting rights that have been notified to the company pursuant to section 21 (1) or (1a) of the German Securities Trading Act (Wert-papierhandelsgesetz – WphG) have to be disclosed.
The following sheet gives an overview of all voting rights that have been notified to the company as of 12 March 2013. It contains the information of the last notification of each shareholder and the percentage and shares may have changed in the meantime.
All notifications of voting rights by the company in the reporting period and until 12 March 2013 are available on the website of NORMA Group (http://investoren.normagroup.com).
Shareholder
Achievement of
voting rights
Notification limit
Pursuant to
section 22 WpHG
Share
Shares
3i Investments plc, London 14 January 2013 3 % shortfall § 22 para. 1 s. 1 no. 1 0.000 % 0
Allianz Global Investors Europe GmbH 14 January 2013 5 % exceedance 5.750 % 1,832,961
DWS Investment GmbH, Frankfurt* 03 February 2012 5 % shortfall 4.871 % 1,551,972
Columbia Wanger Asset Management LLC, Chicago
07 September 2012 3 % exceedance § 22 para. 1 s. 1 no. 6 3.840 % 1,223,755
ODDO et Cie., Paris 05 September 2012 3 % exceedance § 22 para. 1 s. 1 no. 6 i.c.w. s. 2
3.390 % 1,081,190
ODDO Asset Management 05 September 2012 3 % exceedance § 22 para. 1 s. 1 no. 6 3.390 % 1,081,190
Mondrian Investment Partners Limited, London 15 June 2012 5 % exceedance § 22 para. 1 s. 1 no. 6 5.340 % 1,700,937
Columbia Management Investment Advisers LLC, Boston
21 June 2012 3 % exceedance § 22 para. 1 s. 1 no. 6 i.c.w. s. 2
3.250 % 1,036,183
Ameriprise Financial Inc., Minneapolis 1) 07 September 2012 10 % exceedance § 22 para. 1 s. 1 no. 6 i.c.w. s. 2
10.820 % 3,445,924
Threadneedle Asset Management Holdings SARL, Luxembourg***
26 January 2012 5 % exceedance § 22 para. 1 s. 1 no. 6 i.c.w. s. 2
5.570 % 1,775,477
Threadneedle Asset Management Holdings Limited, London***
26 January 2012 5 % exceedance § 22 para. 1 s. 1 no. 6 i.c.w. s. 2
5.530 % 1,760,835
Threadneedle Asset Management Limited, London***
26 January 2012 5 % exceedance § 22 para. 1 s. 1 no. 6 5.530 % 1,760,835
Threadneedle Investment Services Limited, London 2)
15 November 2012 5 % exceedance § 22 para. 1 s. 1 no. 6 5.050 % 1,610,051
T. Rowe Price International Discovery Fund, Inc., Baltimore**
08 August 2011 3 % exceedance 3.025 % 964,148
T. Rowe Price Group, Inc., Baltimore** 08 August 2011 3 % exceedance § 22 para. 1 s. 1 no. 6 i.c.w. s. 2
3.023 % 963,303
Nils Bergström, Sweden 3) 01 October 2012 3 % shortfall § 22 para. 1 s. 1 no. 1 2.510 % 800,595
* Notification by the company at 7 February 2012 ** Notification by the company at 18 August 2011*** Notification by the company at 01 February 20121) The voting rights attributed to Ameriprise Financial Inc.are held by the following controlled undertaking company which share in the voting rights in NORMA Group AG ex-
ceeds 3 % or more: Threadneedle Investment Funds ICVC2) The voting rights attributed to Threadneedle Investment Services Limited are held by the following controlled undertaking company which share in the voting rights in
NORMA Group AG exceeds 3% or more: Threadneedle Investment Funds ICVC3) The voting rights attributed to Nils Bergström are held by the following controlling companies which shares in the voting rights in NORMA Group AG do not exceed 3 %
respectively: Connecting Capital Holding AB, MABA S.à r.l., GABA S.A., MABA Cyprus Limited

162 NORMA Group AG Annual Report 2012
MeMbeRS OF the MANAGeMeNt bOARD:
werner DeggimDipl.-Ingenieur, Chief Exceutive Officer (CEO)
Dr. Othmar belkerDipl.-Volkswirt, Chief Financial Officer (CFO)
bernd kleinhensDipl.-Ingenieur, Managing Director Business Development
John StephensonMaster of Science, Chief Operating Officer (COO)
The members of the Management Board are present in various Supervisory Boards of NORMA Group companies.
MeMbeRS OF the SuPeRvISORy bOARD:
Dr. Stefan wolf (Chairman)Chief Exceutive Officer (CEO) of ElringKlinger AG
Member of the Supervisory Board of Fielmann AG, Hamburg, GermanyMember of the Supervisory Board of Micronas Semiconductor Holding AG, Zurich, Switzerland
Dr. ulf von haacke (Deputy Chariman, until 14 September 2012)Managing Director, Partner
lars Magnus berg (Deputy Chariman)ConsultantChairman of the Supervisory Board of Net Insight AB, Stockholm, SwedenChairman of the Supervisory Board of KPN OnePhone Holding B.V., Düsseldorf, GermanyMember of the Supervisory Board of Ratos AB, Stockholm, SwedenMember of the Supervisory Board of Tele2, AB, Stockholm, Sweden
Günter hauptmannConsultantMember of the Supervisory Board of Geka GmbH, Bechhofen
knut J. MichelbergerChief Financial Officer (CFO) of Dematic Group and independent consultantChairman of the Advisory Board of Dematic GmbH
Dr. Christoph SchugEntrepreneurMember of the Supervisory Board of Tom Tailor Holding AG, Hamburg, Germany Member of the Supervisory Board of Baden-Baden Cosmetics AG, Baden-Baden, Germany
erika Schulte (from 18 February 2013)Managing Director of Hanau Wirtschaftsförderung GmbH, of Brüder-Grimm-Berufsakademie Hanau GmbH and of Technologie- und Gründerzentrum Hanau GmbH
163Further InformationConsolidated Financial StatementsConsolidated Management ReportTo Our ShareholdersManagement Board Letter
Appendix to the notes to the consolidated financial statements
Responsibility statement
Responsibility statement
To the best of our knowledge, and in accordance with the applicable reporting principles, the con-solidated financial statements give a true and fair view of the assets, liabilities, financial position and profit or loss of the Group, and the Group Management Report includes a fair review of the develop-ment and performance of the business and the position of the Group, together with a description of the principal opportunities and risks associated with the expected development of the Group.
Maintal, 13 March 2013
NORMA Group AG
Management Board
Werner Deggim CEO
Dr. Othmar BelkerCFO
John StephensonCOO
Bernd KleinhensBusiness Development
164 NORMA Group AG Annual Report 2012
Auditor’s report
We have audited the consolidated financial statements prepared by the NORMA Group AG, Maintal, comprising the statement of financial position, the statement of comprehensive income, statement of changes in equity, cash flow statement and the notes to the consolidated financial statements, to-gether with the group management report for the business year from January 1, 2012 to December 31, 2012. The preparation of the consolidated financial statements and the group management report in accordance with the IFRSs, as adopted by the EU, and the additional requirements of German com-mercial law pursuant to § (Article) 315a Abs. (paragraph) 1 HGB ("Handelsgesetzbuch": German Com-mercial Code) is the responsibility of the parent Company's Board of Managing Directors. Our respon-sibility is to express an opinion on the consolidated financial statements and on the group management report based on our audit.
We conducted our audit of the consolidated financial statements in accordance with § 317 HGB and German generally accepted standards for the audit of financial statements promulgated by the Institut der Wirtschaftsprüfer (Institute of Public Auditors in Germany) (IDW). Those standards require that we plan and perform the audit such that misstatements materially affecting the presentation of the net assets, financial position and results of operations in the consolidated financial statements in accor-dance with the applicable financial reporting framework and in the group management report are detected with reasonable assurance. Knowledge of the business activities and the economic and legal environment of the Group and expectations as to possible misstatements are taken into account in the determination of audit procedures. The effectiveness of the accounting-related internal control system and the evidence supporting the disclosures in the consolidated financial statements and the group management report are examined primarily on a test basis within the framework of the audit. The audit includes assessing the annual financial statements of those entities included in consolidation, the determination of the entities to be included in consolidation, the accounting and consolidation principles used and significant estimates made by the Company’s Board of Managing Directors, as well as evaluating the overall presentation of the consolidated financial statements and the group management report. We believe that our audit provides a reasonable basis for our opinion.
Our audit has not led to any reservations.
In our opinion based on the findings of our audit, the consolidated financial statements comply with the IFRSs as adopted by the EU and the additional requirements of German commercial law pursuant to § 315a Abs. 1 HGB and give a true and fair view of the net assets, financial position and results of operations of the Group in accordance with these requirements. The group management report is consistent with the consolidated financial statements and as a whole provides a suitable view of the Group's position and suitably presents the opportunities and risks of future development.
Frankfurt am Main, March 13, 2013
PricewaterhouseCoopersAktiengesellschaftWirtschaftsprüfungsgesellschaft
Dr. Ulrich Störk ppa. Benjamin HesselWirtschaftsprüfer Wirtschaftsprüfer(German Public Auditor) (German Public Auditor)
165
Glossary
Further Information
Technical terms
AFteRMARket SeGMeNt
The market concerned with the maintenance/repair of invest-ment goods (e.g. machines) or long-life final goods (e.g. vehicles) or the sale of replacement parts or complementary parts for the goods. This involves the sale of services and/or parts that are directly related to the previous sale of the goods.
AuSteNItIC SteelS
Austenitic steel is a stainless steel that normally contains an alloy of 15 – 20 % chromium and 5 – 15 % nickel. Other alloy compo-nents can have an impact on these figures. Austenitic steels cannot be hardened by way of heat treatment and are usually not magnetisable. They can be used in environments with high chloride levels. Please note that “chloride” is not a precise term. There are several types of chloride in technical chemistry, all of which vary in terms of their impact on austenitic steels.
CO2
Carbon dioxide, a chemical compound of carbon and oxygen.
DIStRIbutION SeRvICeS (DS)
One of NORMA Group’s two ways to market, which provides a wide range of high-quality, standardised joining products for a broad range of applications and customers.
elAStOMeRS
Elastomers are stable but elastic plastics which are used at a temperature above their glass transition temperature. The plas-tics can deform under tensile load or compressive load, but then return to their original undeformed shape.
eNGINeeReD JOINING teChNOlOGy (eJt)
One of NORMA Group’s two ways to market. It provides custom-ised, highly engineered joining technology products primarily, but not exclusively, for industrial OEM customers.
FeRRItIC SteelS
Ferritic chromium steel is a stainless steel that normally cannot be hardened. It is magnetisable and is used in environments containing little or no chloride.
FluID PRODuCtS/SySteMS
Single or multiple-layer thermoplastic fluid systems/connections.
hybRID vehICleS
Generally a vehicle powered by a combination of different drive systems or energy sources, usually an electric motor and a com-bustion engine.
INDuCtION
The production of an electric current in a conductor using vary-ing magnetic fields.
INSOuRCING
The reincorporation of processes and functions into a company.
ISO 14001
An international environmental management standard that spec-ifies the internationally accepted requirements for an environ-mental management system
It
Information technology, an umbrella term for information and data processing.
leAkAGe
A leak is an unwanted hole in a product or technical system, through which solids, liquids or gases can enter or exit. A leak can lead to the failure of an entire technical system. The size of a leak is measured by the leak rate.
OhSAS 18001
Abbreviation for Occupational Health and Safety Assessment Series; used in many countries as a basis for certification of oc-cupational health and safety management systems. The struc-ture is closely linked to the ISO 9001 and ISO 14001 standards.
Glossary
Consolidated Financial StatementsConsolidated Management ReportTo Our ShareholdersManagement Board Letter
Auditor’s report

166 NORMA Group AG Annual Report 2012
NItROGeN OxIDe
Nitrogen oxide is the generic term for oxygen and nitrogen com-pounds (generic formula: NOx). The main examples are nitric oxide and nitrogen dioxide. These are gaseous compounds with low solubility in water. Nitrogen oxides are hazardous for people and the environment and are a waste gas produced by combus-tion engines.
ORIGINAl equIPMeNt MANuFACtuReR (OeM)
A company that retails products under its own name.
SuPPly ChAIN MANAGeMeNt
Supply chain management is the planning and management of all activities involved in supplier selection, procurement and con-version, as well as all logistical activities. It refers particularly to the coordination and collaboration of the partners involved (sup-pliers, vendors, logistics service providers, customers).
theRMOPlAStICS
Also known as plastomers. These are plastics which become elastic (thermoplastic) in a particular temperature range. This process is reversible, i.e. it can be cooled and heated back to a molten state as often as required unless thermal decomposition sets in due to the material being overheated. This is how ther-moplastics differ from thermosetting polymers and elastomers. Another unique characteristic of thermoplastics is that they can be welded.
Financial Terms
ACquISItION
Acquisition of companies or parts of companies for strategic purposes.
beSt lANDeD COSt APPROACh
Takes all logistics and storage costs for the procurement of a purchased part into consideration and thus ensures that the most competitive suppliers are selected.
beSt PRACtICe APPROACh
Also known as a success method; comes from Anglo-American economics and refers to proven, good or exemplary methods, practices or procedures within a company.
bRIC StAteS
An acronym that refers to the emerging markets of Brazil, Russia, India and China.
CODe OF CONDuCt
A set of policies which can / should be applied in a wide range of contexts and environments depending on the situation. In con-trast to a rule, the target audience is not obliged to always com-ply with the code of conduct. For this reason, you will often hear the term “voluntaryself-control.” A code of conduct is more of a personal commitment to follow or abstain from certain patterns of behaviour and ensure that nobody gains an unfair advantage by circumventing these patterns.
COMPlIANCe
Conforming to rules: companies adhering to codes of conduct, laws and guidelines.
CORPORAte GOveRNANCe
Generally speaking, corporate governance is the set of all inter-national and national rules, regulations, values and principles which apply to companies and determine how these companies are managed and monitored.
COveRAGe
The regular assessment of the economic and financial situation of a listed company by banks or financial research institutions.
eARNINGS beFORe INteReSt, tAxeS AND AMORtISA-
tION (ebItA)
Earnings before interest, taxes and amortisation of intangible assets. Practically speaking, however, EBITA means “earnings before net financial result, extraordinary earnings, taxes and am-ortisation of goodwill.” Extraordinary (one-off) expenses and costs are ignored, as are interest, other financing costs or in-come, taxes and amortisation of goodwill.
eARNINGS beFORe INteReSt, tAxeS, DePReCIAtION
AND AMORtISAtION (ebItDA)
Earnings before interest, taxes, depreciation (of property, plant and equipment)and amortisation (of intangible assets). It is a measure of a company’s operating performance before invest-ment expenses.
eCONOMIeS OF SCAle
Defined in business economics’ production theory and micro-economics as the connection between the scale of a company’s output and the number of factors of production that it uses.
eMeA
An Anglo-American abbreviation for the economic area of Europe (made up of Western and Eastern Europe), the Middle East and Africa .
167Management Board Letter To Our Shareholders Consolidated Management Report Consolidated Financial Statements Further Information
Glossary
FRee CASh FlOw
Indicates the amount of money that is available to pay dividends to shareholders and/or repay loans.
GlObAl exCelleNCe PROGRAMMe
A cost optimisation programme that was started in 2009. It co-ordinates and manages all of NORMA Group’s sites and busi-ness units.
INteRNAtIONAl SeCuRItIeS IDeNtIFICAtION NuMbeR
(ISIN)
A 12-digital alphanumerical code used to identify a security traded on the stock market.
INveStOR RelAtIONS
Maintaining contact with shareholders, investors, analysts and the financial media.
JOINt veNtuRe
A joint subsidiary held by at least two legally and economically independent companies.
lIStING
Stock market listing. When a security is traded on the stock market.
MDAx
(derived from Mid-Cap-DAX) was introduced by Deutsche Börse on 19 January 1996. It includes the 50 Prime Standard shares from sectors excluding technology that rank immediately below the companies included in the DAX index. The company size is based on terms of order book volume and market capitalization. Thus it reflects the share price development of mid cap German companies or companies that are predominantly active in Ger-many. The companies that make up the index are reviewed twice a year in March and September and if necessary inbetween , e.g. mergers or larger IPOs. The 60 / 60 rule states that only listed companies which are among the 60 largest below the DAX in the categories market capitalisation and turnover can be included in the MDAX index. Companies can be removed from the MDAX index if they fail to meet these criteria by a large margin or a sustained period of time.
MezzANINe CAPItAl
A generic term for types of financing which are a mixture of equity and debt in their legal and economic structure.
MeRGeR
The combining of two companies of roughly equal value, regard-less of the legal nature of the combination, i.e. including mergers resulting from a takeover that was originally designated as an acquisition. For this reason, the English term “Mergers & Acqui-sitions” and its abbreviation “M&A” in particular has established itself in German-speaking countries.
NAtuRAl heDGING
An Anglo-American term from the area of business administra-tion that has found its way into the specialised German vocabu-lary. The objective is to lower the difference between income and expenses in a given currency and thus minimise transaction risks. Hedging takes place by designing the real economic con-ditions within a company.
Buying goods and components in the same currency in which one’s own services to the customer are to be invoiced helps minimise risks, for example.
PhANtOM ShARe PROGRAMMe
A phantom share programme is a modern variable method of compensation, in which an employee is paid with imaginary stock based on performance.
All phantom share schemes are based on the principle that the shares received by the beneficiary are purely fictitious. These shares represent an imaginary stake in the value of the company.
PRIMe StANDARD
A segment of the regulated stock market with higher inclusion requirements than the General Standard. It is the private law segment of the Frankfurt Stock Exchange with the highest trans-parency standards. All companies listed in the DAX, MDAX, TecDAX and SDAX have to be in the Prime Standard.
ROADShOw
A series of corporate presentations made to investors by an is-suer at various financial locations to attract investment in the company.
SDAx
Small-Cap-DAX: A German share index that was introduced by Deutsche Börse AG on 21 June 1999. It is a select index of 50 small-sized companies, also known as small caps, that rank be-low the MDAX in terms of trading volume and market capitalisa-tion. The 110/110 rule states that only listed companies which are

168 NORMA Group AG Annual Report 2012
among the 110 largest below the DAX in these categories can be included in the SDAX index. Companies can be removed from the SDAX index if they fail to meet these criteria by a large margin or a sustained period of time. The companies that make up the index are reviewed on a quarterly basis at the beginning of March, June, September and December.
SyNeRGIeS
Working together to produce mutual benefits.
weRtPAPIeRkeNNNuMMeR (wkN) (SeCuRItIeS ID
NuMbeR)
A six-character combination of numbers and letters used in Germany to identify securities.
wORkING CAPItAl
Represents the net current assets of a company. Working capi-tal is equal to current assets less current liabilities. This difference and the ratio (current assets divided by current liabilities), known as the working capital ratio, are used as indicators of the liquid-ity situation of a company and are particularly important for credit analyses.
xetRA
An electronic trading system operated by Deutsche Börse AG for the spot market.
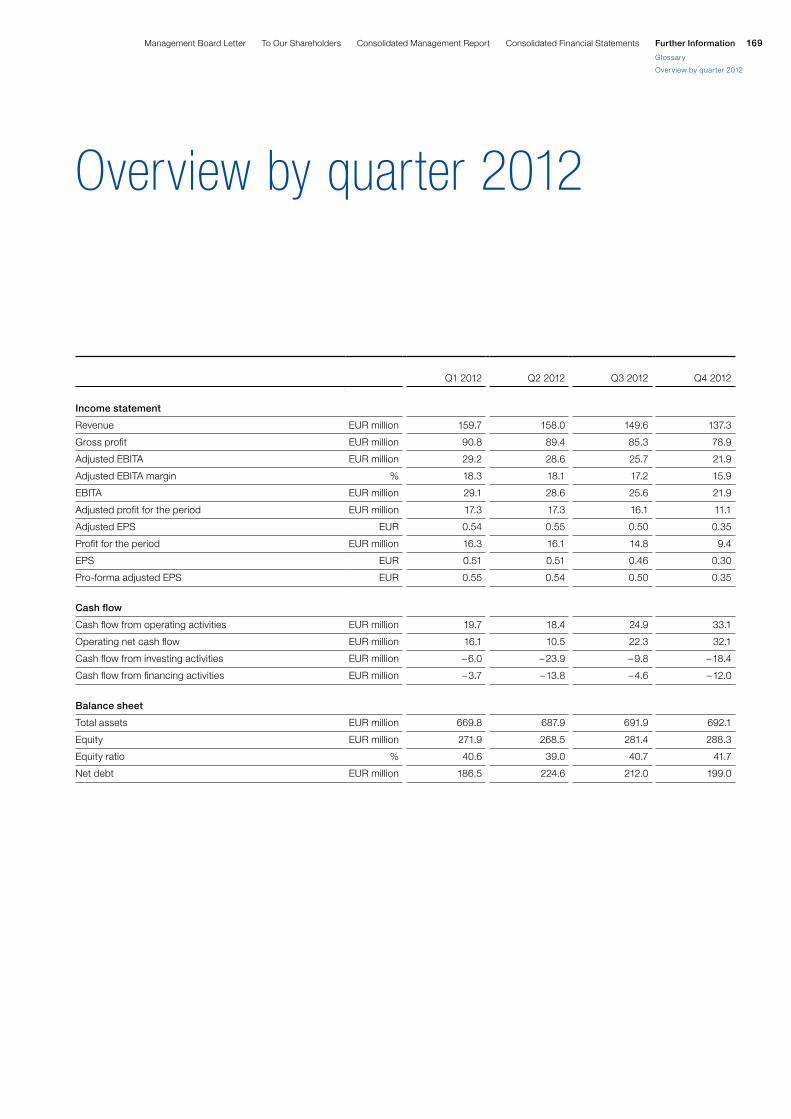
169Management Board Letter To Our Shareholders Consolidated Management Report Consolidated Financial Statements Further Information
Glossary
Overview by quarter 2012
Q1 2012
Q2 2012
Q3 2012
Q4 2012
Income statement
Revenue EUR million 159.7 158.0 149.6 137.3
Gross profit EUR million 90.8 89.4 85.3 78.9
Adjusted EBITA EUR million 29.2 28.6 25.7 21.9
Adjusted EBITA margin % 18.3 18.1 17.2 15.9
EBITA EUR million 29.1 28.6 25.6 21.9
Adjusted profit for the period EUR million 17.3 17.3 16.1 11.1
Adjusted EPS EUR 0.54 0.55 0.50 0.35
Profit for the period EUR million 16.3 16.1 14.8 9.4
EPS EUR 0.51 0.51 0.46 0.30
Pro-forma adjusted EPS EUR 0.55 0.54 0.50 0.35
Cash flow
Cash flow from operating activities EUR million 19.7 18.4 24.9 33.1
Operating net cash flow EUR million 16.1 10.5 22.3 32.1
Cash flow from investing activities EUR million – 6.0 – 23.9 – 9.8 – 18.4
Cash flow from financing activities EUR million – 3.7 – 13.8 – 4.6 – 12.0
balance sheet
Total assets EUR million 669.8 687.9 691.9 692.1
Equity EUR million 271.9 268.5 281.4 288.3
Equity ratio % 40.6 39.0 40.7 41.7
Net debt EUR million 186.5 224.6 212.0 199.0
Overview by quarter 2012
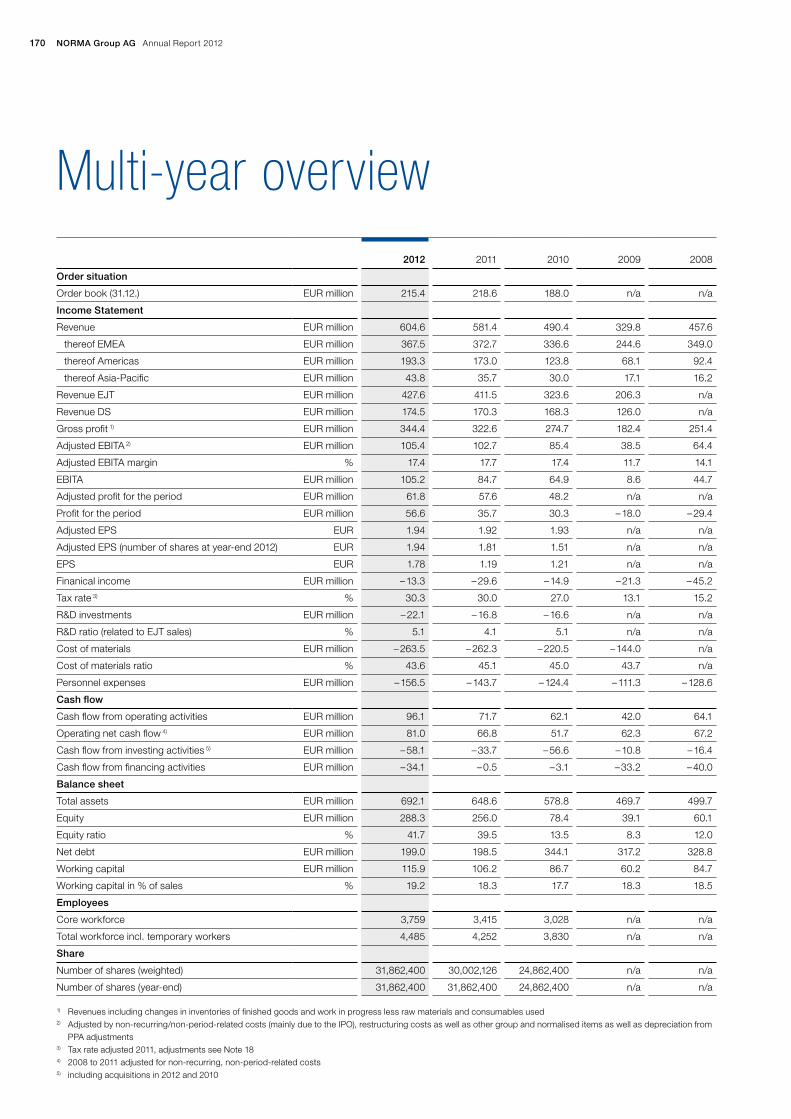
170 NORMA Group AG Annual Report 2012
Multi-year overview
2012
2011
2010
2009
2008
Order situation
Order book (31.12.) EUR million 215.4 218.6 188.0 n/a n/a
Income Statement
Revenue EUR million 604.6 581.4 490.4 329.8 457.6
thereof EMEA EUR million 367.5 372.7 336.6 244.6 349.0
thereof Americas EUR million 193.3 173.0 123.8 68.1 92.4
thereof Asia-Pacific EUR million 43.8 35.7 30.0 17.1 16.2
Revenue EJT EUR million 427.6 411.5 323.6 206.3 n/a
Revenue DS EUR million 174.5 170.3 168.3 126.0 n/a
Gross profit 1) EUR million 344.4 322.6 274.7 182.4 251.4
Adjusted EBITA 2) EUR million 105.4 102.7 85.4 38.5 64.4
Adjusted EBITA margin % 17.4 17.7 17.4 11.7 14.1
EBITA EUR million 105.2 84.7 64.9 8.6 44.7
Adjusted profit for the period EUR million 61.8 57.6 48.2 n/a n/a
Profit for the period EUR million 56.6 35.7 30.3 – 18.0 – 29.4
Adjusted EPS EUR 1.94 1.92 1.93 n/a n/a
Adjusted EPS (number of shares at year-end 2012) EUR 1.94 1.81 1.51 n/a n/a
EPS EUR 1.78 1.19 1.21 n/a n/a
Finanical income EUR million – 13.3 – 29.6 – 14.9 – 21.3 – 45.2
Tax rate 3) % 30.3 30.0 27.0 13.1 15.2
R&D investments EUR million – 22.1 – 16.8 – 16.6 n/a n/a
R&D ratio (related to EJT sales) % 5.1 4.1 5.1 n/a n/a
Cost of materials EUR million – 263.5 – 262.3 – 220.5 – 144.0 n/a
Cost of materials ratio % 43.6 45.1 45.0 43.7 n/a
Personnel expenses EUR million – 156.5 – 143.7 – 124.4 – 111.3 – 128.6
Cash flow
Cash flow from operating activities EUR million 96.1 71.7 62.1 42.0 64.1
Operating net cash flow 4) EUR million 81.0 66.8 51.7 62.3 67.2
Cash flow from investing activities 5) EUR million – 58.1 – 33.7 – 56.6 – 10.8 – 16.4
Cash flow from financing activities EUR million – 34.1 – 0.5 – 3.1 – 33.2 – 40.0
balance sheet
Total assets EUR million 692.1 648.6 578.8 469.7 499.7
Equity EUR million 288.3 256.0 78.4 39.1 60.1
Equity ratio % 41.7 39.5 13.5 8.3 12.0
Net debt EUR million 199.0 198.5 344.1 317.2 328.8
Working capital EUR million 115.9 106.2 86.7 60.2 84.7
Working capital in % of sales % 19.2 18.3 17.7 18.3 18.5
employees
Core workforce 3,759 3,415 3,028 n/a n/a
Total workforce incl. temporary workers 4,485 4,252 3,830 n/a n/a
Share
Number of shares (weighted) 31,862,400 30,002,126 24,862,400 n/a n/a
Number of shares (year-end) 31,862,400 31,862,400 24,862,400 n/a n/a
1) Revenues including changes in inventories of finished goods and work in progress less raw materials and consumables used2) Adjusted by non-recurring/non-period-related costs (mainly due to the IPO), restructuring costs as well as other group and normalised items as well as depreciation from
PPA adjustments3) Tax rate adjusted 2011, adjustments see Note 184) 2008 to 2011 adjusted for non-recurring, non-period-related costs5) including acquisitions in 2012 and 2010

NORMA Group worldwideEmEa
Czech Republic (P)France (P, D) Germany (P, D)Italy (P, D)Netherlands (D)Poland (P)Russia (P, D)Serbia (P)Spain (D)Sweden (P, D)Switzerland (D)Turkey (D)United Kingdom (P, D)
amEricas
Brazil (D)Mexico (P)USA (P, D)
asia-Pacific
Australia (D)China (P, D)India (P, D)Indonesia (D)Japan (D)Korea (D)Malaysia (P, D)Philippines (D)Singapore (D)Thailand (P)Vietnam (D)
P = Production D = Distribution centre, Sales
centre, Competence centre
salEs amEricas
Employees: 619Sales growth: + 11.8 %
2011
EUR 173.0 million
EUR 193.3 million
2012
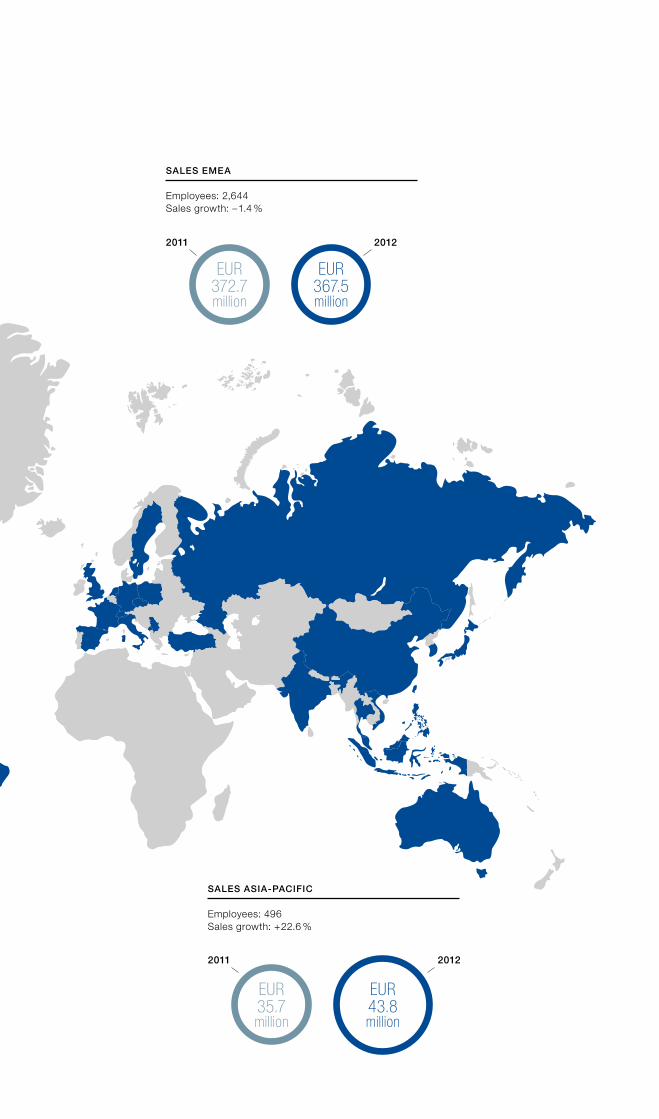
SalES EMEa
Employees: 2,644Sales growth: – 1.4 %
2011 2012
SalES aSia-paCiFiC
Employees: 496Sales growth: + 22.6 %
2011 2012
eUR 372.7 million
eUR 367.5 million
eUR 35.7 million
eUR 43.8 million
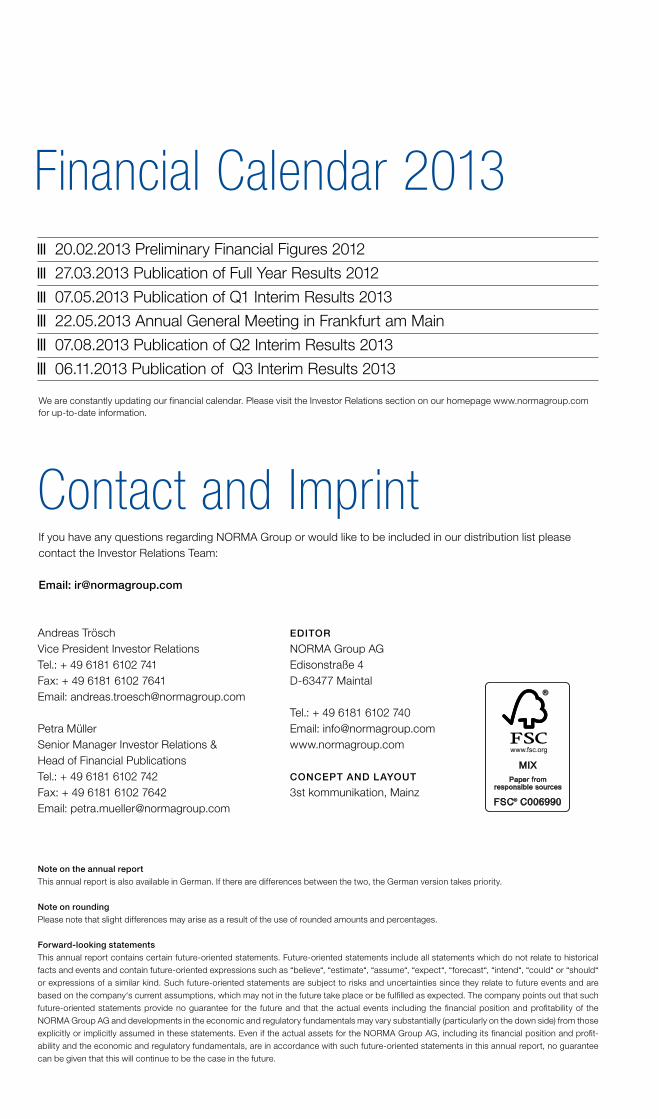
Andreas TröschVice President Investor RelationsTel.: + 49 6181 6102 741Fax: + 49 6181 6102 7641Email: [email protected]
Petra MüllerSenior Manager Investor Relations & Head of Financial PublicationsTel.: + 49 6181 6102 742Fax: + 49 6181 6102 7642Email: [email protected]
Note on the annual reportThis annual report is also available in German. If there are differences between the two, the German version takes priority.
Note on roundingPlease note that slight differences may arise as a result of the use of rounded amounts and percentages.
Forward-looking statementsThis annual report contains certain future-oriented statements. Future-oriented statements include all statements which do not relate to historical facts and events and contain future-oriented expressions such as “believe“, “estimate“, “assume“, “expect“, “forecast“, “intend“, “could“ or “should“ or expressions of a similar kind. Such future-oriented statements are subject to risks and uncertainties since they relate to future events and are based on the company‘s current assumptions, which may not in the future take place or be fulfilled as expected. The company points out that such future-oriented statements provide no guarantee for the future and that the actual events including the financial position and profitability of the NORMA Group AG and developments in the economic and regulatory fundamentals may vary substantially (particularly on the down side) from those explicitly or implicitly assumed in these statements. Even if the actual assets for the NORMA Group AG, including its financial position and profit-ability and the economic and regulatory fundamentals, are in accordance with such future-oriented statements in this annual report, no guarantee can be given that this will continue to be the case in the future.
Editor
NORMA Group AG Edisonstraße 4D-63477 Maintal
Tel.: + 49 6181 6102 740Email: [email protected]
CoNCEpt aNd layout
3st kommunikation, Mainz
Financial Calendar 2013
Contact and Imprint
20.02.2013 Preliminary Financial Figures 2012
27.03.2013 Publication of Full Year Results 2012
07.05.2013 Publication of Q1 Interim Results 2013
22.05.2013 Annual General Meeting in Frankfurt am Main
07.08.2013 Publication of Q2 Interim Results 2013
06.11.2013 Publication of Q3 Interim Results 2013
We are constantly updating our financial calendar. Please visit the Investor Relations section on our homepage www.normagroup.com for up-to-date information.
If you have any questions regarding NORMA Group or would like to be included in our distribution list please contact the Investor Relations Team:
Email: [email protected]

aN
Nu
al
rE
po
rt
20
12N
or
Ma
Gro
up a
G
NorMa Group aGEdisonstrasse 4D-63477 Maintal
Phone: +49 6181 6102 740Email: [email protected]