tennant creek primary school - web.ntschools.netweb.ntschools.net/w/antgsr/annual...
TRANSCRIPT

TENNANT CREEK PRIMARY SCHOOL
2014
Annual Performance Report to the School Community
An Engaging Urban Students School

Tennant Creek Primary School
School Overview
Our School
Tennant Creek Primary School is a large, remote, primary school providing pre and primaryschool education for Tennant Creek and the Mungkarta Homeland Centre. Our aim is to
offer a comprehensive education to a student cohort which comes from widely diverse
backgrounds. Our focus is always on attendance, literacy and numeracy but we offer a huge
variety of other programs that are aimed at making our school a place where students wantto be. We are an Accelerated
Literacy (AL) school and are
constantly developing school
programs that support andenhance AL. We see ourselves
as a full service school: We pick
students up in the morning
and take them home after
school. We supply breakfast,recess and lunch to students
through a comprehensive
nutrition program,
Our students
In 2014 we had an average
enrolment of 402 students.
The average attendance over
the year was 69% and the average attendance of our Indigenous students, who make up
73% of our school population, was 63%.
Our Staff
In 2014 our staff
included the Principal,
Assistant Principal,three Senior Teachers,
16 primary class
teachers, a preschool
teacher and five
specialist teachers. In
addition we serviced
Mungkarta Homelands
Centre with a
Transition to Year 6
classroom teacher.
Whole school teaching
support staff included three specialist teachers for science, the arts and history, a Special

Tennant Creek Primary School
Education teacher and two teachers for the Positive Learning Centres in the school. We also
shared a School Nurse and School Councillor with Tennant Creek High School. All teachers
held the necessary and relevant teaching qualification to carry out their duties and were
registered with the Teacher Registration Board of the Northern Territory.
Our administration staff
consisted of an
Administration Manager, an
AIEW, a Special Education
Assistant, four administrative
support staff, two AssistantTeachers and a maintenance
officer. Through our
Government Equity funding
and School Council funding
we employed a further 31
support staff in positions
including classroomassistants, individual tutors,
nutrition program staff and
crossing attendant.
Our Community
Our school community takes in children from
across Tennant Creek. We also attract
students from other communities in the
Barkly who attend the Primary School when
they are in Tennant Creek with their families,
A School and Community Partnership
Agreement was negotiated and signed off in
2013. This remained in place in 2014 and
helped formalise the strong support we
enjoy from our community and the
partnerships we have developed with local
Indigenous organisations.
WSi^^SSS&^SS^S^S^^^^^^Sfi^^^SS^^^^^^f^^^^^^^

Tennant Creek Primary School1 »w '*•(••<• i;a«ii i I»M 9M»]
Principal's Report
I would like to firstly acknowledge the immense support provided during 2014 by our
Chairperson, Susan Wright and all School Council members who have contributed many
hours of their time to support and guide all we do. It has been a year of highlights and
challenges.
I want to congratulate all our staff and students for their contribution and efforts during the
year. Working in a school in any community has many complexities however as a combinedgroup we have achieved some positive outcomes in 2014.
We had a major focus on
improving our teachingpractices as a whole
school with the
implementation of Visible
Learning (VL) andAccelerated Literacy (AL)
practices by all teachers.
A focus on student Well-
Being and Behaviour has
enabled new policies and
practices to beimplemented. There
were two Positive
Learning Centres' created
to support behaviourally
challenged students and
a Behaviour Specialist who provided support for staff and students, Teachers have engaged
in a variety of professional learning experiences to improve what we do in supportingstudents to be active learners.
Our Visible Learning Impact Coaches have led the ongoing implementation of Visible
Learning in the school. Teachers were involved in having their lessons critiqued by
themselves and their peers. This focus on VL and AL will continue in 2015 so that we become
the best teachers we can for ALL students.
There have been many highlights which include Sport and Swimming Carnival Days, ourstudent's engagement in a range of sports locally, at intra- school carnivals and at interstate
competitions. Parents and teachers have all year supported students to participate in a
range of sporting activities locally and on trips away from our community particularly with
Athletics, Cricket, Football, including the Port Adelaide Willpower Program, Netball and Bin
Ball. Our students were well behaved, liked and respected and displayed good
sportsmanship skills. This is a real credit to all families and our wider community. I would like

Tennant Creek Primary School
to acknowledge the many businesses and individuals who have helped to fundraise for
students to attend sporting experiences throughout 2014,
Other fundraising highlights were the School Fete ($5470), Breakfast with the Stars and Book
Fair ($6129) Family Fun Day ($1800)School Concert ($3400)and Centrecorp who supportedstudents to attend
the Year 6
Educational Futures
Trip to Darwin
($6000).
Thank you to the
parents and carers
who supported the
Preschool with
fundraising, workingbees and
improvements to
the Preschool
learning areas. A
grant was secured
to upgrade the
toilets and the
kitchen area to
meet the national compliance standards.
Congratulations to our Mungkarta Parents and Teaching staff who delivered a key noteaddress at the Indigenous Educator Conference in November and were very well received,
Mungkarta Class had the top student attendance in 2014.
There were several positive initiatives to engage students in 2014 and offer a diverse range
of opportunities for them to explore new interests and strengths-:
• Bluearth Program
• a successful gymnastic week with the NT Gymnastic Coach
• a tennis clinic
• the Year 6 Educational Futures trip to Darwin
• Constable Warrior and Constable Shields visits to improve behavior, learn about
cyber bullying and their fun discos
• Vibe 3 on 3 Challenge Day
• Anzac Commemoration Assembly, the Friday Elective Program
• The Dance Program with Lamb
• Tennant's Got Talent Day and Celebration Day
• Year 6 Graduation Extravaganza
• Annual School Concert in Desert Harmony Week
• Winanjjikari Music Sessions for Students and The Barkly Boys concert
• Anyinginyi Men's Centre sessions for boys
Tennant Creek Primary School
• Warumungu Language and Cultural lessons, Reconciliation Day and NAIDOC Day
were also highlights where all children have learned more about Indigenous culture
to build positive relationships and understandings
Support from the Health Department, Anyinginyi Congress and our Regional Office
Consultants enabled students to receive free dental checks, ear and eye testing, health care,
and psychological and intellectual assessment of students with high needs requiring
specialist care. 15 students now attract SESP funding to support their learning needs.
The Remote Attendance Improvement Strategy has enabled a positive relationship to be
developed with Papulu Appar Kari (Language Centre) staff where the 'yellow shirt' officers
have helped engage poor attenders in schooling and talk with families about ways to
improve school participation.
Other community partnership initiatives included the PACE program, Julilikari's 'Red Shirt'
Support Initiative and the FAST program. These have developed greater community
engagement so parents and carers take an active role in their children's learning, A new
parent room was established by the PACE team. The positive partnership with staff, parents
and community was important for student learning and the support of many outside
agencies was greatly appreciated.
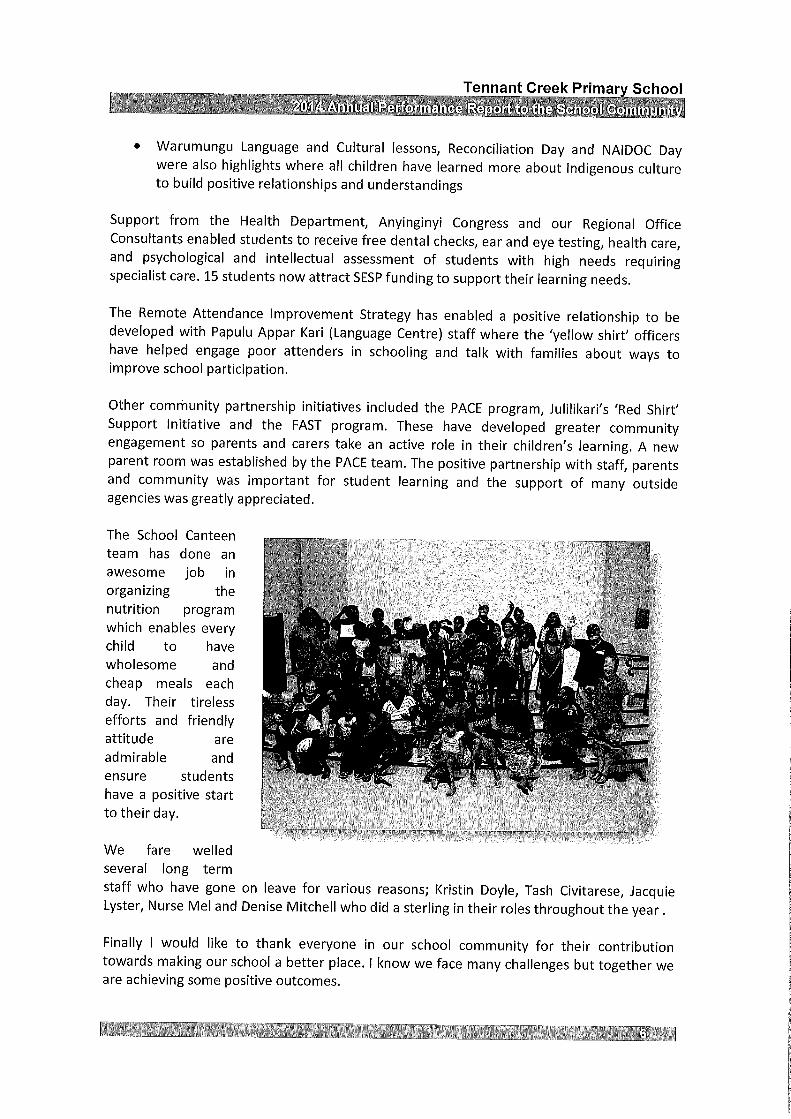
The School Canteen
team has done an
awesome job in
organizing thenutrition program
which enables everychild to have
wholesome and
cheap meals each
day. Their tireless
efforts and friendly
attitude are
admirable and
ensure students
have a positive start
to their day.
We fare welled
several long term
staff who have gone on leave for various reasons; Kristin Doyle, Tash Civitarese, Jacquie
Lyster, Nurse Mel and Denise Mitchell who did a sterling in their roles throughout the year.
Finally I would like to thank everyone in our school community for their contribution
towards making our school a better place. I know we face many challenges but together weare achieving some positive outcomes.

Tennant Creek Primary School
Teaching and Learning
The school has developed strategies that focus on whole school assessment moving away
from individual teacher accountability to whole school all staff accountability for individual
student learning. This development has come about as a result of the extensive data
received through the Accelerated Literacy program (now in its eighth year) and the data
received from the introduction of NAPLAN testing. Now in its fifth year, the school based
Genre/Writing program has also been invaluable. These initiatives have led us to thedevelopment of a whole School Literacy Document,
2014 Initiatives/Directions
The school's literacy and numeracy programs align with the new Australian Curriculum and
extensive use has been made of the Curriculum to Classroom documents in achieving this as
well as the Multiple Year Level documents developed in the Northern Territory.
In 2014 Tennant Creek
Primary School took part
in the Visible Learning
initiative being run across
Central Australia. This
initiative, based on the
research of John Hattie,
focusses on identifyingwhat works in the
classroom and why it
works. Visible Learning
uses data collected in the
classroom as a means of
driving classroom
improvement. The school
will be using twice yearly
assessments in 2014 to
provide further information on the progress of our students and to help identify gaps in
individual student learning.
The school also continued to see the benefits of the Accelerated Literacy program in terms
of whole school literacy development. To date this program has seen significant results
across the school. This progress has been a result of explicit teaching methodologies which
have only been achieved due to significant Professional Development and support fromschool based Coordinators.
NAPLAN Participation and Results
2014 saw the NAPLAN participation rates fall back when compared to 2013. This meant that
fewer students took the test than in the previous year and that may have had an effect on

Tennant Creek Primary School
the data. The table below summarises student results in Years 3 and 5 and compares them
to those achieved in 2013. (Full NAPLAN results are attached in Appendix B).
Year 3
Results
Grammar
Numeracy
Reading
SpellingWriting
School Mean
2013232294277270243
School Mean2014189278254299225
Years
Results
Grammar
Numeracy
Reading
SpellingWriting
School Mean
2013349378373369299
School Mean
2014358411353397354
The Year 3 results were slightly lower than in the previous year except for Spelling wherethere was a small improvement. The 'School Mean' figure hides the fact that 68% of our Year
3 students either met or exceeded National Minimum Standards for Spelling while 61% met
or exceeded National Minimum Standards for Numeracy. This reflects two of the School's
focus area but also shows that we need to catch our students up in the other key areas.
Most of the growth was seen in Year 5 where there were improvements in four of the five
areas - most noticeably in the Numeracy test and the writing test. Again the 'School Mean'
figure disguises the fact that more than half our students met or exceed National Minimum
Standards in Numeracy, Reading, Spelling and Writing - only just missing out in Grammar.
Tennant Creek Primary School continued to take part in the Visible Learning project in 2014,
receiving advice on teaching and learning from leading academics led by Prof John Hattie.
The data gathered through internal standardised testing show that significant gains were
made in Years 1 and 2 in 2014 as a result techniques used in the classroom. This should see
improved results in the Year 3 NAPLAN tests in 2015. Similar techniques focusing on explicit
teaching should see a further improvement in the Year 5 results in 2015.
The support made
available through the
Engaging UrbanStudents Smarter
School National
Partnership grant hasfurther enabled the
school to provide
focused support and
individualisedprogramming for thoseworking below
benchmark support for
those achieving above
benchmark.

Wellbeing
Enrolment and Attendance
In 2014 average enrolment increased fell to 402 from the previous year's figure of 432. The
average attendance for the year was 69.0%, again showing little change from the previous
year's 69.3%. In this period the enrolment of Indigenous students fell from 306 to 293 with
the average attendance for our Indigenous students rising to 63.0%.
The following activities and special events are ongoing from year to year and act to engagemore students in attendance and participation at the school:
• Student Representative Council
including House Captains
• School Concert •
• NAIDOCDay
• Celebration Day
• Breakfast with the Stars
• Two week swimming and water
safety program
• Sports Day
• Weekly Clontarf sessions
• Year 6 Excursion to Darwin
• Year 6 Graduation
and CDSong writing
production.
workshop
The following long running programs alsocontinued:
• Daily school bus services
• Nutrition program
• Meet the teacher afternoons
• Class presentations
• First aid courses with the school
nurse and St John staff
• Preparation for Puberty
Perhaps the most important program we conduct is the Nutrition Program which feeds on
average 170 students a day. The school works hard to keep the cost of the program down
while supplying nutritious food.

Tennant Creek Primary School
Participation, Transitions and Pathways
Remote School Attendance Strategy
The School welcomed the federally funded Remote School Attendance Strategy in 2014.The
program was operated in the Barkly by Papulu Apparr-Kari (PAK) and helped to strength tiesbetween this school and other schools in the Barkly. The program will take time to bed in
and we are very pleased that the funding for this program will continue into 2015. As part of
the Memorandum of Understanding between the School and PAK, provides each weekday
morning the PAK School Attendance Supervisor and PAK School Attendance Officers to assist
with agreed activities at the school, PAK also provides invaluable assistance with school
special activities such as sports carnivals, special assemblies to help build positiverelationships with school children and their families. The attendance strategy has been a
great help to the
school and we have
all become familiar
with the Yellow Shirts
both around town
and in the school.
Student Movement
Student mobility - as
measured by thenumber of students
enrolling and leavingthe school
increased markedly in2014 and this brought
its own problems,
Many of thesestudents were those
attending Tennant
Creek Primary while their families were in town for short periods of time. During 2014
student turnover stood at 90% for the year as a whole. This compares with 62% in 2013 -
which was itself an increase when compared to previous years.
The school is aware that there are always going to be families and students moving through
the region and, in common with other schools in the Barkly, we continue to see a high
degree of student mobility. Out of a total enrolment of 402, the School saw 355 students
arrive and 288 leave. Many of these students moved between Tennant Creek and other
Barkly communities and the figures include those who left, returned and re-enrolled.
Traditionally our Year 6 students make the transition to the Middle School campus of Barkly
College with some leaving for schools in Alice Springs or further afield. Anecdotal evidence
continues to suggest that the creation of the Clontarf Academy and the Stronger Sisters

Tennant Creek Primary School
program, based at Barkly College, have helped smooth the transition to middle school and
improved student retention.
Age of Entry - One Transition Intake
The Preschool forms a vital part of ensuring that children are ready to start in the Transition
Class, The Preschool teacher and her team do amazing work with children who come to her
with a wide variety of needs and degrees of school readiness. This really is a vital part of
schooling.
The Positive Learning Centre
The Positive Learning Centre was created in Term 4 of 2013 to provide a welcoming andfocussed environment for students at risk either because of low attendance or for
behavioural reasons. This centre continued in 2014 and a second, Junior PLC for those in
Years 2-4 was added with the aim of providing a supporting environment in which gaps in
student learning could be identified and rectified.
Graduating Year 6 Students and Friendly Faces
The Friendly Faces program was again active in 2014, making good use of our continued
close links with the Barkly College Middle School campus. During the last term all Year 6
students have at least three full days on the other campus where they became part of
normal classes. This immersion in the school culture gives the students a very good idea of
how the school works
and what to expect in
Year 7. Groups of Year
7 students (last year's
graduates) also cameto school to talk of
their experiences in
Middle School.
Engaging Urban
Students
In 2014 we continued
to be an EngagingUrban Students School
with access to funding
that could be used to
encourage attendance
and participation of all students in our community. The transition points between the phasesof learning continued to be a particular focus. Our aim was to ensure that students were
ready for school on entering Transition and that those who had reached the end of Year 6
were equipped to continue with their schooling in Year 7.
Other projects included engaging visiting artists to conduct music and song writing
workshops, school-wide behaviour support, child protection training and supporting families
through our nutrition program. This program has had a major positive impact on the way toget students to school and keep them focussed on their own learning while they are here.

Tennant Creek Primary School
Partnerships
The School Community Partnership Agreement was negotiated and put in place for 2013.
This partnership represents an ongoing commitment between the school and its Indigenous
Community to work together to better support the education of Indigenous children and
young people. The Agreement sets out a range of actions to improve these links and to
further support Indigenous students through actions derived from the school's Strategic
Improvement Plan and Annual Operating Plan.
This formal partnership has added a further dimension to our existing partnerships with
organisations in Tennant Creek. As a result of these partnerships we are able to offer
students a wide range of educational experiences and to further the important concept that
our school is central to the community.
We are pleased that our school was able to maintain its very strong relationship with Barkly
Arts - something most evident during the Desert Harmony Festival. The school continued to
enjoy the benefits of our sporting partnerships both within the community and from further
afield. These included the Clontarf Academy, Auskick, Barkly Australian Football League, MiloCricket, and Cricket Central Australia. Major School - Community Events in 2014 included the
School Concert,
Breakfast with the
Stars during Literacy
and Numeracy
Week and the
ongoing HistoryGarden Project.
Parent and
Community
Engagement
The partnership
formed with the
Parent and
Community
Engagement project
(PACE) was of majorbenefit to the school
in 2014, particularly in the second half of the year. Through PACE school pamphlets with
frequently asked questions were translated into Warumungu, Warlpiri and Alyawarra.
School posters promoting the Concert, Breakfast with the Stars and the School Fete were
also translated into these languages. The result was a major increase in attendance and
involvement in these activities from across the whole community. The PACE led survey into
student and family perceptions also helped us to pin-point areas of need in the school.

Tennant Creek Primary School
Leadership
Staffing numbers at the end of 2014 stood at 37. This included 11 DoE support staff,
including administrative officers and classroom assistants, and 22 teachers. In terms of
teaching staff we
maintained a staff
retention rate of 73%
when comparing thefirst term of 2014 to the
last term of 2014.
As can be seen in the
table below, providing
quality, targetedprofessional
development
opportunities was again
a major focus in 2014.
Much of this focus was
on the Visible Learninginitiative which the
whole school
participated in. This
level of professional development is essential if we are to enable our staff to continue to
develop as quality educators and to bring new knowledge and techniques into the classroomin order to further improve the educational outcomes for our students. Attendance for a
number of these courses was funded thanks to the Engaging Urban Students School.
Professional Learning
Event Type
Accredited Course
Non Accredited Course
Training Session
Information Session
Workshop
Seminar
Conference
No. of Staff: 65
No. of Attendances
3
31
29
366
21
17
1
468
Please note that the difference in the number of staff and the number of attendances is the
result of members of staff who may have attended more than one event or a single event
more than once. In 2014, 65 Staff at Tennant Creek Primary School attended 468 Learning
Events for a total of 1,040 Hours. This figure includes School Council Employees.

Tennant Creek Primary School
ATTACHMENT A
Audited Financial Statements
Frt)ffl:Holiatt Daant . .T"l"»99^?422 11/03/2015 16:45 #696 P.002/01008 85633010'
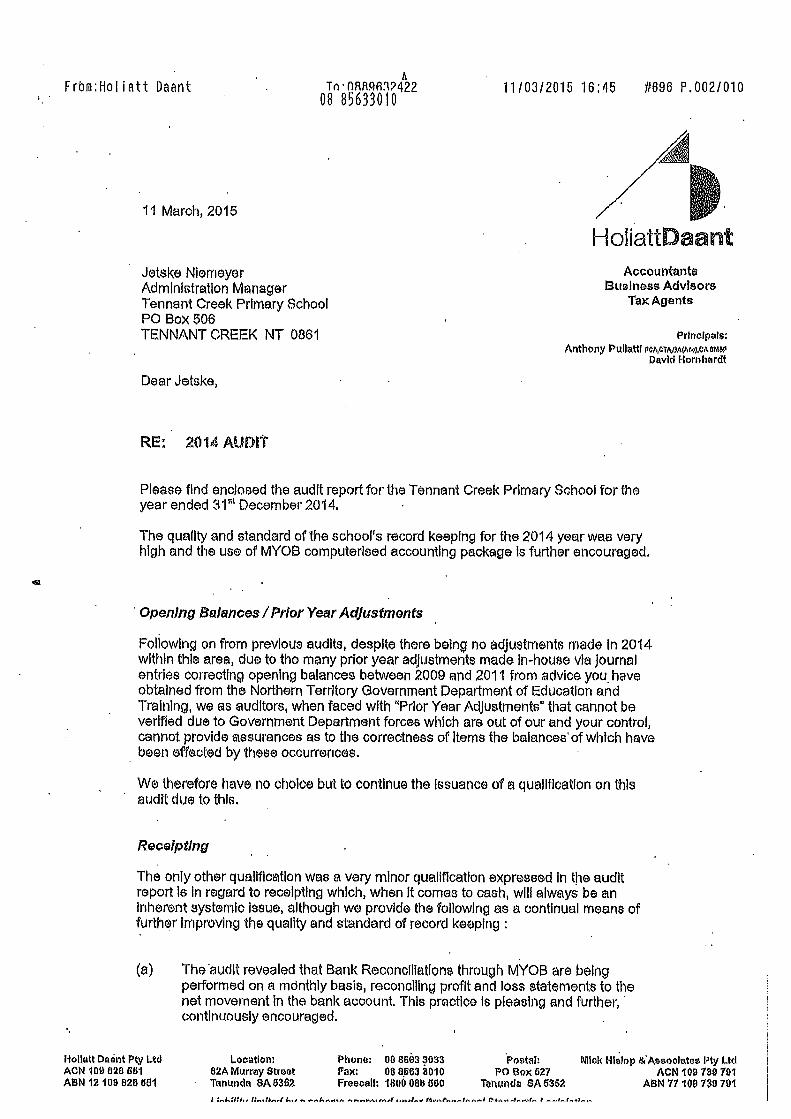
11 March, 2015
Joteke Nl©m©y©r AccountantsAdmlnlRtratlon Manager Business AdvisorsTennant Creek Primary School Tax AgentsPO Box 506TENNANT CREEK NT 0861 principals
Anthony Pullattl PCA|CTA,OA(AC<.),CA<IMSPDavid Hornhardt
Dear Jetske,
RE: 2014 AUDtt
Please find enclosed the audit report for the Tennant Creek Primary School for theyear ended 31s'1 December 2014.
The quality and standard of the school's record keeping for the 2014 year was veryhigh and the us© of MYOB computQrised accounting package Is further Qncouragsd.
Opening Balances / Prior Year Adjustments
Following on from previous audits, despite there being no adjustments made in 2014within this area, due to the many prior year adjustments made In-house via journalentries correcting opening balances between 2009 and 2011 from advice you. haveobtained from the Northern Territory Government Department of Education andTraining, we as auditors, when faced with "Prior Year Adjustmente" that cannot beverified due to Government Department forces which are out of our and your control,cannot provide assurances as to th® correctness of Items the balances'of which havebeen ©ftected by these occurroncQS.
W© th©refore have. no choice but to continue the Issuance of a qualification on thisaudit due to this.
Receipting
The only other qualification was a very minor qualification express&d In the auditreport Is in regard to receipting which, when It comes to cash, will always be sininherent systemic Issue, although we provide the following as a oontlnuat means offurther improving the quality and standard of record keeping :
(a) The audit revealed that Bank Reconciliations through MYOB are beingperformed on a monthly basis, recondltng profit and loss statements to thenet movement in the bank acoount. This practice ie pleasing and further,continuously encouraged.
Hollatt Daant Pty Ltd Location! Phons: 0888633033 Postal; Mlok Hlslop &'Assoolate9 Pty LtdACN108828SS1 82A Murray Street Fax: 068.5633010 POBoxS27 ACN1097397&1ABN 12 109 828 851 Tanunda SA53S2 Freeoall: 1800088560 Tanunda SA6352 ABN 77109 730 701

Fro'rHoliatt Daant Jn;nRR-qfi;)?422 11/03/201516:45 #698 P.003/010
(b) General voucher receipting for cash Income and expense requlsltlon forms forgeneral petty cash expenditure should be adhered to as a means ofestablishing internal controls over th© flows of income and expensesespecially in the form of cash. Your groan book kept receipting income and 'reconciling to banking Is excellent. You have now a similar process for cash©xponses with your Petty Cash Voucher redomptfon system which is furtherencouraged.
Should you wish to discuss these or any other matters, plsase do not hesitate tocontact me.
Yours faithfully,Hollatt Daant Pty Ltd
Anthony Puliatli

Fr'om;Hol iatt Oaant ^rrnRR.qfi^422 11/03/2015 16:45 .N96 P.004/010
AccountantsBusiness Advisors
TaxAgonte
Principals;Anthony Putlattl ?A,c;TA,eA(Am!),oAEMep
Dwid Homhardt
SCHOOL COUNCIL
FOR THE YEAR
PREPARED BYHOLIATT DAANT PTY LTD
82A MURRAY STREETTANUNDA S.A, 5362
Hollatt Dannt Pty LtdACN 10S 828 351ABN-12109028S51
Location:S2A Murray StreetTanunda SAS3S2
1 inh.nn^ itt^jf^ri hw
Phone; 08 8S63 3033Pax; 08 8663 3010Froncall: 1800 088 500
Postal;PO Box 627
Tanunda 8AB3S2
Miok Hietop & Associates Ply LtdACN 109 739 791
ABN 77 109 739 791
c/.hnfTTo nrtrt*'Ai;^rtf im//or' 0*'nrtnttto//tn.ft/ jE;/An//A*y/jor / /t/t/c/nft'nn

Fro'ni:Holiatt DaantA
Tn-QRR.qfi^?42208 856330'fO' 11/03/2015 16:45 #696 P.005/010
COMMITTEE STATEMENT
For the year ©nded 31st Dscembw 2014
In the opinion of the members of the committee, the accompanying FinancialStatements give a true and fair view ofthtsi School Council's financial position andresults of its operations for the last year for Official account.
The committee membors certify that the accompanying Financial Statements andAudit Reports have been presented to members of the School,CommfttQQ andaccQptod thereon at the Annual General Meeting hold on 12 March 2015.
Principal
0
Cdurtci I Treasurer or Ch&tfperson

Fr'om.-Holiatt Daant .T"l"«R-qR'??422 11/03/201516:45 1tQ9Q P. 006/01008 85633010'" ..— .-
Accountants
SCHOOL COUNCIL Business AdvisorsTax Agents
Prinolpate:
FOR THE YEAR 3isr ^^thonypunatu^,c^^David Hornhardt
SCOPE
We have audited th® Financial Report of the Tennant Creek Primary School Council,Official Account forthQ yoar endsd 31st December 2014. The members of theSchool Council are responsible for the prepergtion and presentation of the FinancialReport and the information contained therein. We have performed an audit of the
. Financial Report In order to express an opinion on it to those of concorn.
Our audit has been planned and performed in accordance with Australian AuditingStandards to provide a reasonable level.of assurance as to whether the FinancialReport is free of material mlsstatement. Our procedures Inolucied ©XQminatton, on atest basis, of evidsnce supporting ths amounts and other disclosures in the Reportand th© ©valuation of accounting policiss and significant accounting estimates. Theseprocedures have been undertaken to form an opinion as to whether, in all materialrespects, the Financial Report is presented fairly In accordance with AustralianStatements of Accounting Concepts and Accounting Standards and other statutoryrequirements, so as to present a view of the School Counoil which Is consistent withour understanding of Its financial position and the results of its operations.
The audit opinion expressed In this report has been formed on the above basis,
QUALinCATION
It was not practicablQ for controls to be sstabllshed over receipts, other than for GrantFunding and Investment Income, prior to their receipt and entry into Ihe accountingrecords. Accordingly, It was not practicable for our examination of these areas toextend beyond amounts recorded,
Furthermore, internal NT Government adjustments previously made to th© generalledger and subsequent Internal accounts of the Tennant Creek Primary Schoolcontinue to Impact on our ability to provide assurances.
Adjustments made in prior years from assets appearing with prior period purchasedates, depreciation lntroduo©d where previously this was spQclflcaIly against policyand procedure, and new accounts introduced Info the general ledger by the NTGovernment providing no guidance as to their accounting treatment continue tocreate these difficulties for us auditors.
We continue to qualify the audit due to these "Prior Year Adjustments" and "PolicyChange Adjustments" Impacts.
Hollatt Daant Ply LtdACN109828SS1ABN 12 109 828 551
Location:82A Murray StreetTanunda 8AS3S2
Phone:Fax:Preecall:
W 8S63 3033088S8330101800088560
Poatsl;.PO Box 627
Tanunda 8A 8352
Mlok Hfslop &AseooiatoB Ply LtdAON 109 739 791
ABN 77 109 738 791
Llabliliy llmltod by o -wlwme spproved under Proftseslwal Sfondards LoglsleVon

From;Holiatt Daant .T^:Q^6'1i?422 11/03/2015 16:45 #69Q P.007/01008 85633010'"" ..— ."..-
FOR THE YEAR 31sr 2014
AUDIT OPINION
In our opinion, subject to the above qualification in reference to practicable controlsover receipts and except for the flow on effects associated with the total of "PriorYearAdjustmQnts" and "Policy Change Adjustments", the Flrnancfal Report of theTennant Greek Primary School Council, Official Account gives a true and fair view ofthe School Council's financial position as at 31et December 2014 and the results of Itsoperations forth® year then ended and have bs@n prepared in accordance withAustralian Statements of Accounting Concepts and Accounting Standards. We cannow certify that the assets register is being regularly maintained In an acceptablemanner,
Date; ...;.»)/3/^.
Hollatt Daant Pty Ltd Anthony P^W CA, FTtA, BA(Acc)82A Murray Street Chartered accountantTANUNDA SA 5352

From;Holiatt Daant J(\nRRflfi:}?422 11/03/201516:45 !?696 P. 008/01008 85633010 • ....-.-....-.-..- ..„...-„,.,
INCOIVIE & EXPENDITURE STATEIVIENTFOR THE PERIOD 1st JANUARY 2014 TO 31st DECEMBER 2014
ALLOCATED FUNDS
Activities . 209,282.93Excursion / Camp Income 1 1,950.93Fundratstng - 16,836.30Government Funds 1,205,855,94Interest Earned 477.49Interest Earned - V2 Plus Bus Replacement Account 3,219.07Parent ContributionsOther" MlecellanQous Income . 60,533.62OGS - Staff Funding Adjustment
Stock on Hand - Uniforms
TOTAL INCOME 1,506,856.18
EXPENDITURE
Administration Expanses 49,730.61Capital Grant ExpensesCurriculum Areas • 149,889,19DsprQciatfon 3,767.63Fundraising ExpensesGenaral Sundries 127,281.39Grants 12,406.73Ground Maintenance 27,118.32Other Staffing Expenses 77,769.61Property Management 90,227.06Student ActtvltiQS 282,039.47Utilities 146,019.70Wages 847,859.67
TOTAL EXPENDITURE 1,814,110.18
SUB-TOTAL SURPLUS / (DEFICIT) . (307,254.00)
ADD ; RECONCILIATION ADJUSTMENTPrior Year Adjustments
SURPLUS / (DEFICIT) (307,254.00)

Fr'orHoliatt'Daant JlrnRRflfi-'??422 11/03/201516:46 N96 P.009/010
BALANCE SHEETAS AT 3-let DECEMBER 2014
ACCUIVIULATED FUNDS
BALANCE BROUGHT FORWARD 2013 614,378.38
SURPLUS / (DEFICIT) (307,264.00)
ROUNDING ADJUSTMENT 0.00
ACCUMULATED FUNDS AS AT 31/12/14 307,124.38
Represented By:
CURRENT ASSETS
Cash sat Benk' General Account (ANZ) 47,023.8$ANZ V2 Plus Account - Bus Replacement AVC 238,608.40Accounts ReceivableCash on Hand - Petty Cash 300.00Stock on Hand - Uniforms 62,839.00Assets PurchasedG8T Owed . • 28,91
348,700.20
NOW - CURRENT ASSETS
Assets at Cost 75,721.20Loss; Accumulated Depreciation (68,896.69) 8,724.29'
6,724.29
TOTAL ASSETS 388,424.49
CURRENT LIABILITIES
Electronic Payroll Account 2,500.00 ^Trade Creditors / Commitments 28,852.2405T & PAYQ LiabilitiesLong Service Leave Provision 1 6,947,86
TOTAL LIABILITIES 48,300.10
NET ASSETS 307,124.39

Fr'om;Hol iatt Daant Tr>-nRR,qRn?42208 85633010' 11/03/2015 16:46 ?696 P,010/010
TENNANT CREEK PRMARY SCHOOL COUNCIL
OFFICIAL ACCOUNT BANK RECONClLIATfONAS AT 31ST DECEMBER 2014
BALANCE AS PER BANK STATEMENT" 31ST DECEMBEsR 2014
ADD: OUTSTANDING DEPOSITS
LESS: UNPRESENTEO CHEQUES
BALANCE AS PER AUDITED ACCOUNTS - 31ST DECEMBER 2014
64,307.50
121.72
17,405.33
47,023.89
)AT6
10/06/1412/12/1412/12/1422/12/1422/12/1431/12/1431/12/1431/12/14 .
CHEQUE #
023388BP0002676P000258
02341902342002342.1
EP000284EP000266
AMOUNT
1,03-1.70
1.104.001,104.00
263.60333.00
2,608.948,144.182,818,00
TOTAL UNPRESENTED CHEQUES 17.40S.33
I hereby certify the above eimounts are a true and correct extraot from the accounting records of thePrimary School Council for the above account.
Principal Treasurer

Tennant Creek Primary School
ATTACHMENT B
NAPLAN data
NorthernTerritoryGovernment DEPARTMENT OF EDUCATION
17030 NAPLAN School Summary Report 2009 - 2014Last Refreshed: 13/02/2015
Refreshed by: Stephen.nimmo
NAPLAN Results 2009 - 2014
Tennant Creek PrimarySchool
In to ais a
toa or to in
not be to
Universe: NAPLAN school summary results
Students in Years 3, 5, 7 and 9 across Australia sit common tests in numeracy, reading, writing and language conventions (spelling,
grammar and punctuation). The results from this assessment provide an important measure of how all Australian students are performing inliteracy and numeracy against national achievement bands. Page 1 /1

'<»-Northern
Gow^wnf I DEPARTMENT OF EDUCATION
NAPLAN Results 2009 - 2014
Tennant Creek Primary School
NorthernTerritoryGovernment DEPARTMENT OF EDUCAT
17030 NAPLAN School Summaiy Report 2009 - 2014Last Refreshed: 13/02/2015
Refreshed by: stephen.nimmo
When comparing NAPLAN results from year to year, it is important to consider several technical aspects to test if any differences in the results are real.One way to do this is to calculate 'confidence inten/als' which describe how confident we are that the result is an accurate estimate,In the follovring graphs 2009-2014 comparisons are shown with the'confidence intervals'as error bars at the top of each graph.As a general rule of thumb, where confidence intervals overiap, average scores should not be considered as statistically different, i.e. they should be considered to be the same.
Note: In 2011, students were required to complete a persuasive writing task. This is a change from previous years (2010 and prior) when students were required to write a narrative or story.Due to this change in genre, post 2010 Writing results should not be compared to previous years.
Year Level 3
Grammar
700
600
500
400
300
200 llllil
School Mean Scale Scores
700
600
500
Numeracy
- Confidence interval ^ + Confidence inten/al
700
600
500
Reading
2009 2010 2011 2012 2013 20H
Mean Scale Score
700
600
500
400
300
200
100
0
Spelling
2009 2010 2(
700
600
Writing (Persuasive)
In the following table 2009 - 2014 comparisons are shown with the School Mean, NT Mean and Australian Mean. In addition, the range of values that your school's results may actually fail into (ie. SchoolMean with Confidence tnten/als) are shown as School Mean Range. As with above, as a general rule of thumb, where the ranges overiap (behween years), average scores should not be considered asstatistically different i.e. they should be considered to be the same.
School Mean Range
School MeanGrammar
NT Mean
Aust Mean
School Mean Range
School MeanNumsra<
NT Mean
Aust Mean
Sc/joo/ Mean Range
School MeanReadins
NT Mean
Aust Mean
School Mean Range
School MeanSpelling
NT Mean
Aust Mean
2009193-270
232
316420
256 -301278
322
394
228-294261
322
411264 - 309
286
305405
Mean Scale Scores
2010198 - 297
247
311417
266-32?294
329
39520-326
272329
414
286 - 343314
300399
- Comparison
2011(89-276
232313421
295-336315
338398
147-244195323
416
264 -312288303
406
2012181 - 297
239
315424
272-341307
323
398
245-336290332
420275 - 340
307
337414
2013(87-278
232338
428274-318
294
332397
240 - 314277339
419
246-294270
327
411
2014135-243
189326
426
245-311278
338402
208-299254
332418
269-329299327
412
Writing(Persuasive)
School Mean Range
School Mean
NT Mean
Aust Mean
218-284256
330416
239-322
281
323416
209-277243
320416
190 - 269
225318402
Universe: NAPLAN school summary results
Students !n Years 3. S, 7 and 9 across Australia sit common tests in numeracy. reading, writing and language conventions (spelling, grammar and puncfuafion). The results from this assessment provide animportant measure of how all Australian students are performing in literacy and numeracy against national achievement bands. page 1/2

Northern
Gww^me^ I DEPARTMENT OF EDUCATION
NAPLAN Results 2009 - 2014
Tennant Creek Primary School
•wNorthernTerritoryGovernment DEPARTMENT OR EDUCAT
17030 NAPtAN School Summaiy Report 2009 - 2014Last Refreshad: 13/02/2015
Refreshed by; slephen.nimmo
When comparing NAPLAN results from year to year, it is important to consider several technical aspects to lest if any differences in the results are real.One way to do this is to calculate 'confidence intervals' which describe how confident we are that the result is an accurate estimate.In the following graphs 2009 - 2014 comparisons are shown with the 'confidence inlen/ais' as error bars at the top of each graph.As a general rule of thumb, where confidence inten/als overlap, average scores should not be considered as statistically different, i.e. they should be considered to be the same.
Note: In 2011, students were required to complete a persuasive writing task. This isa change from previous years (2010 and prior) when students v/ere required to write a narrative or story.Due to this change in genre, post 2010 Writing results should not be compared to previous years.
Year Level 5
700
600
Grammar
School Mean Scale Scores
700
600
Numeracy
- Confidence inter/al D + confidence Interval
700
600
Reading Spelling Writing (Pereuaslve)
Mean Scale Score
In the following table 2009 - 2014 comparisons are shown with the School Mean, NT Mean and Australian Mean. In addition, the range of values that your schoot's results may actually fall into (ie. SchoolMean with Confidence Inten/als) are shown as School Mean Range. As with above, as a general rule of thumb, where the ranges overlap (between years), average scores should not be considered asstatistically different i.e. they should be considered to be the same.
School Mean Range
School MeanGrammar
NT Mean
Aust Mean
Schoo! Mean Range
School MeanNumeracy
NT Mean
Aust Mean
School Mean Range
School MeanReading
NT Mean
Aust Mean
School Mean Range
School MeanSpelling
NT Mean
Aust Mean
School Mean Range
Writing School Mean
(Parsuasive) NT Mean
Aust Mean
2009282-355
319415500
360 - 399380
430487
331 - 393362421
494
340-393367
411487
Mean Scale Scores
2010272-353
312
397500
312-377344
422
489
251 - 333292412
487
359 - 408383409
487
- Comparison
2011257-337
297400
499344 - 387
366
424488
280-352316
403
488338-388
363393
484309 - 382
346
397483
2012321 - 412
366394
491
390-445417
418489
339 - 420379
405
494
362-431396413
495311-392
351391477
2013318 -381
349423
501362 - 395
378
422486
349-397373437
502345-393
369413
494257-342
299
386478
2014302-415
358419
504
376-446411
423488
291-415353
426501
358 - 435397422
498
295-412354
380468
Universe: NAPLAN school summary results
Sfudenfs in Years 3, 5, 7 and 9 across Australia sit common tests in numeracy, read'mg, wntmg and language conventions (spelling, grammar and punctuation). The results from this assessment provide animportant measure of how all Australian students are performing in literacy and numeracy against national achievement bands, page 2/2

17030 NAPLAN School Summary Report 2009 - 2014Last Refreshed: 13/02/2015
Refreshed by: Stephen.nimmoNAPLAN Results Writing (Narrative) 2009 - 2010
Tennant Creek Primary School
When comparing NAPLAN results from year to year, it is important to consider several technical aspects to test if any differences inthe results are real. One way to do this is to calculate 'confidence Intervals' which describe how confident we are that the result is an
accurate estimate. In the following graphs 2009 - 2010 comparisons are shown with the 'confidence intervals' as error bars at the top of
each graph. As a general rule of thumb, where confidence intervals overlap, average scores should not be considered as statistically
different, i.e. they should be considered to be the same.
Note: In 2011, students were required to complete a persuasive writing task. This is a change from previous years (2010 and
prior) when students were required to write a narrative or story. Due to this change in genre, 2011 & 2012 Writing resultsshould not be compared to previous years.
School Mean Scale Scores -Writing (Narrative)
Years
700
600
soo
400
300
200
100
0
Year5
700
600
500
400
300
200
100
2009 2010
- Confidence Interval D + Confidence Interval Mean Scale Score
In the following table 2008 - 2010 comparisons are shown with the School Mean, NT Mean and Australian Mean. In addition, the rangeof values that your school's results may actually fall into (ie. School Mean with Confidence Intervals) are shown as School MeanRange. As with above, as a general rule of thumb, where the ranges overlap (between years), average scores should not be
considered as statistically different i.e. they should be considered to be the same.
Mean Scale Scores - Comparison
2009 2010
Year 3
Year 5
Writing(Narrative)
Writing(Narrative)
Schoo/ Mean Range
School Mean
NT Mean
Aust Mean
School Mean Range
School Mean
NT Mean
Aust Mean
251-313
282338415
294 - 352
323409485
263 - 335
299331419
3^8-388
353400485
Universe: NAPLAN school summary results
Students in Years 3, 5, 7 and 9 across Australia sit common tests in numeracy, reading, writing and language conventions (spelling,
grammar and punctuation). The results from this assessment provide an important measure of how all Australian students are performing inliteracy and numeracy against national achievement bands, page 1 /1

t^lorthomTerritory DEPARTMENT OF EDUCATIONNAPLAN Results 2009 - 2014
Tennant Creek Primary SchoolNote: In 2011, students were required to complete a persuasive writing task. This is a change from previous years (2010 and prior) whenstudents were required to write a narrative or story. Due to this change in genre, post 2010 Writing results should not be compared to previousyears.
Year3
17030 NAPLAN School Summary Report 2009 - 2014Last Refreshed: 13/02/2015
Refreshed by: stephen.nimmo
Percentage of Students Achieving NMS (%)
Numeracy Reading
100so
50403020100
100so6070606040302010 I
Spelling Writing (Persuasive)
% Achieved NMS B % Not Achieved NMS
Note: % Achieved includes students who were either At or Above NMS divided by the number of students participating in the test(including exempt students). The % Not Achieved NMS includes students who were Beiow NMS or Exempt from testing divided by thenumber of students participating in the test (including exempt students).
200920102011
Grammar201220132014200920102011
Numeracy ^^
20132014200920102011
Reading ^
20132014200920102011
spelling ;^
20132014200920102011
Writing (Persuasive)
20132014
B
No of Students
19242117282314208111816141821141820112122203412n/a
n/a
14192923
etow NMS
> % of Students
63%51%55%41%53%62%56%44%26%33%39%39%50%41%58%39%40%56%37%45%58%49%64%32%
39%48%56%62%
No of Student;
657992813128121196469514634414n/a
n/a
8466
AtNMS
s % of Students
20%11%18%22%17%5%32%29%39%24%26%27%32%14%11%17%20%14%47%13%8%10%8%
38%
22%10%12%16%
Above NMS
No of Students % of Students
51810151612312111416145
20111618115
2013171511n/a
n/a
1417178
17%38%28%37%30%32%12%27%35%42%35%34%18%45%31%44%40%31%17%43%34%41%28%30%
39%43%33%22%
Total No ofStudents
304738415337254531334641284436364536304738415337n/a
n/a
36405237
Universe: NAPLAN school summary resultsStudents in Years 3, 5, 7 and 9 across Australia sit common tests in numeracy, reading, wrifing and language conventions (spelling, grammar and punctuation). The results from this assessment provide animportant measure of how al! Australian students are pefforming in lileracy and numeracy against national achievement bands.
Page 1/2

tslorthom•rritory
DERARTM ENT OF EOU CATIONNAPLAN Results 2009 - 2014
Tennant Creek Primary SchoolNote: In 2011, students were required to complete a persuasive writing task. This is a change from previous years (2010 and prior) whenstudents were required to write a narrative or story. Due to this change in genre, post 2010 Writing results should not be compared to previousyears.
Years Percentage of Students Achieving NIVIS (%)
17030 NAPIAN School Summaiy Report 2009 - 2014Last Refreshed: 13/02/2015
Refreshed by: stephen.nimmo
Grammar Writing (Persuasive)
% Achieved NMS % Not Achieved NMS
Note: % Achieved includes students who were either At or Above NMS divided by the number of students participating in the test(including exempt students). The % Not Achieved NMS includes students who were Below NMS or Exempt from testing divided by thenumber of students participating in the test (including exempt students).
200920102011
Grammar -^
20132014200920102011
Numeracy ^^
20132014200920102011
Reading -^
20132014200920102011
Spe»."8 ^,
20132014200920102011
Writing (Persuasive)
20132014
Below NMS
No of Students %
292822222015192615201710283320241513262517222413n/a
n/a
19222312
of Students
74%61%73%49%57%52%53%54%58%47%49%37%67%63%74%51%41%46%67%54%57%49%69%45%
61%49%70%43%
AtNMS
No of Students
411678313128713541253142478317
n/a
n/a
2445
t of Students
10%24%20%16%23%10%36%25%31%16%37%19%10%23%19%6%38%7%10%15%27%7%3%
24%
6%9%12%18%
Above
No of Students
672167
114103165121072208
139
14520109
nfa
n/a
10196
11
iNMS
% of Students
15%15%7%36%20%38%11%21%12%37%14%44%24%13%7%43%22%46%23%30%17%44%29%31%
32%42%18%39%
Total No ofStudents
394630453529364826433527425227473728394630453529n/a
n/a
31453328
Universe: NAPLAN school summary results
Students in Years 3, 5, 7 and 9 across Australia sit common tests in numeracy, reading, wnting and language conventions (spelling, grammar and punctuaiion). The results from this assessment provide anImportant measure of how all Australian students are performmg in literacy and numeracy against nafional achievement bands.
Page 2/2

NorthernTerritoryGovsm merit DEPARTMENT OF EDUCATION
17030 NAPLAN School Summary Report 2009 - 2014Last Refreshed: 13/02/2015
Refreshed by: Stephen.nimmo
NAPLAN Results Writing (Narrative) 2009 - 2010Tennant Creek Primary SchoolNote: In 2011, students were required to complete a persuasive writing task. This is a change from previous years (2010 and
prior) when students were required to write a narrative or story. Due to this change in genre, post 2010 Writing results shouldnot be compared to previous years.
Percentage of Students Achieving NMS in Writing (Narrative) (%)
Years
% Achieved NMS H 1 Not Achieved NMS
Note: % Achieved includes students who were either At or Above NMS divided by the number of students participating in the test(including exempt students). The % Not Achieved NMS includes students who were Below NMS or Exempt from testing divided by thenumber of students participating in the test (including exempt students).
Writing 2009(Narrative) 2010
Writing 2009(Narrative) 2010
Below NMS
No of % ofStudents Students
13 45%20 42%
28 67%23 50%
AtNMSNo of % of
Students Students
7 24%
5 10%
8 19%
7 15%
Above NMS
No of % ofStudents Students
9 31%
23 48%6 14%
16 35%
Total Noof
Students
29
4842
46
Universe: NAPLAN school summary resultsStudents in Years 3, 5, 7 and 9 across Australia sit common tests in numeracy, reading, writing and language conventions (spelling,
grammar and punctuation). The results from this assessment provide an important measure of how all Australian students are performing inliteracy and numeracy against national achievement bands.

0 E PART M EN X 0 F E 0 U CA T I ONNAPLAN Results 2009 - 2014
Tennant Creek Primary SchoolNote: In 2011, students were required to complete a persuasive writing task. This is a change from previous years (2010 and prior) whenstudents were required to write a narrative or story. Due to this change in genre, post 2010 Writing results should not be compared to previousyears.
17030 NAPIAN School Summary Report 2009 - 2014
Last Refreshed: 13/02/2015Refreshed by: stephen.nimmo
Year3 Number of Students in High/IVIedium/Low Bands
Grammar Numeracy Reading Spelling Writing (Persuasive)
Low a Medium "B HighNote: For each year level, students are grouped into high, medium and tow categories according to their band level.The two lowest bands (Below or At the National Minimum Standard) are within the Low category, the next two bands are within theMedium category, and the highest two bands comprise the High category. Students who are Exempt from testing are included in theLow category.
200920102011
Grammar201220132014200920102011
Numeracy -^
20132014200920102011
Reading -^
20132014200920102011
lelling20122013201420092010
Writing 2011(Persuasive) 2012
20132014
LOW
No of Students
252928263725223320193027232425202725252726243826n/a
nla
22233529
% of Students
83%62%74%63
70%68%88%73%65%58
65%66%82%55%69%56
60%69%83%57%68%59
72%70%69%52%61%58
67%78%
Medium
No of Students
312981082891018104141081584111110126
ala
n/a
1310156
i of Students
10%26%24%20
19%22%8%18%29%30
35%24%14%32%28%25
33%22%13%23%29%24
23%16%24%31%36%25
29%16%
High
No of Students
2617641424
4161733192735
n/a
n/a
1722
% of Students
7%13%3%17
11%11%4%9%6%12
10%4%14%3%19Th8%3%19%5%176%14%Th17%3%18
4%5%
Total No ofStudents
304738415337254531334641284436364536304738415337n/a
n/a
36405237
Universe: NAPLAN school summary results
Students in Years 3, 5, 7 and 9 across Australia sit common tests sn numeracy, reading, writing and language conventions (spelling, grammar and punctuation). The results from this assessment provide animportant measure of how all Ausfraliw students are perfornvng in literacy and numeracy against national achievement bands.
Page 1/2

OEPARTMENT OF ED'UCATIONNAPLAN Results 2009 - 2014
Tennant Creek Primary SchoolNote: In 2011, students were required to complete a persuasive writing task. This is a change from previous years (2010 and prior) whenstudents were required to write a narrative or story. Due to this change in genre, post 2010 Writing results should not be compared to previousyears.
17030 NAPLAN School Summary Report 2009 - 2014Last Refreshed: 13/02/2015
Refreshed by: Stephen, nimmo
Years Number of Students in High/IVIedium/Low Bands
Grammar Numeracy Spelling Writing (Persuasive)
• Low B Medium • HighNote: For each year ieve!, students are grouped into high, medium and low categories according to their band level.The two lowest bands (Below or At the National Minimum Standard) are within the Low category, the next two bands are within theMedium category, and the highest two bands comprise the High category. Students who are Exempt from testing are included in theLow category.
200920102011
Grammar201220132014200920102011
Numrracy -^
20132014200920102011
H!201220132014200920102011
Spelling -^
2013201420092010
Writing 2011(Persuasive) 2012
20132014
No of Students
333928292818323823273015324525272915303225252520n/a
n/a
21262717
Low
% of Students
85%85%93%64
80'A
62%89%79%8B%63
86%56%76%87%93%57
78%54%77%70%83%56
71%69%88%65%68%58
82%61%
Medium
No of Students °/
461
10763939587521389711412105
n/a
n/a
101887
ti of Students
10%13%3%22
20%21%8%19%12%21
14%30%17%10%7%28
22%32%18%24%13%27
29%17%12%35%32%40
18%25%
High
No of Students
2116
511
7
432
7
42318
4n/a
n/a
1
4
% of Students
5%2%3%13
17%3%2%
18
15%7%4%
15
14%5%7%3%18
14%2%
2
14%
Total No ofStudents
394630453529364826433527425227473728394630453529n/a
n/a
31453328
Universe: NAPLAN school summary resultsStudents in Years 3, 5, 7 and 9 across Australia sit common tests in numeracy, reading, wn'fing and language conventions (spelling, grammar and puncfuafion). The results from this assessment provide animportant measure of how all Ausiraf'ian students are performing in literacy and numeracy against national achievement bands.
Page 2/2

17030 NAPLAN School Summary Report 2009 - 2014Last Refreshed: 13/02/2015
Refreshed by: Stephen, nimmo
NAPLAN Results Writing (Narrative) 2009 - 2010Tennant Creek Primary SchoolNote; In 2011, students were required to complete a persuasive writing task. This is a change from previous years (2010 and
prior) when students were required to write a narrative or story. Due to this change in genre, 2011 & 2012 Writing resultsshould not be compared to previous years.
Number of Students in High/Medium/Low Bands
Year 3
50
40
30
20
10
0
YearS
2009 2010
Low B Medium High
Note: For each year level, students are grouped into high, medium and low categories according to their band level.
The two lowest bands (Below or At the National Minimum Standard) are within the Low category, the next two bands are within theMedium category, and the highest two bands comprise the High category. Students who are Exempt from testing are included In theLow category.
Year3
Year 5
Writing(Narrative)
Writing(Narrative)
2009
20102009
2010
Low
No ofStudents
2025
36
30
% ofStudents
69%52%
86%
65%
Medium
No of % ofStudents Students
7
155
16
24%
31%12%
35%
No ofStudents
2
81
High% of
Students
7%17%2%
Total Noof
Students
294842
46
Universe: NAPLAN school summary resultsStudents in Years 3, 5, 7 and 9 across Australia sit common tests in numeracy, reading, writing and language conventions (spelling,
grammar and punctuafion). The results from this assessment provide an important measure of how all Australian students are performing inliteracy and numeracy against national achievement bands.
1/1

tsl>Iorthem'Territory
'rnme-nt D E PART M E N T~ 0 f= E D U CA T 10 NNAPLAN Results 2009 - 2014
Tennant Creek Primary School
17030 NAPIAN School Summary Report 2009 - 2014Last Refreshed: 13/02/2016
Refreshed by: stephen.nimmo
Year3 Percentage of Students Participating (%)
Grammar Numeracy Writing
200S 2010 2011 2012 2013 201-1
% Participating % Not Participating
Note: % Participating includes students who were either Present or Exempt divided by the total number of students in the test population. The % Not Participating includes students who were Absent,Withdrawn or Sanctioned Abandonment from testing divided by the total number of students in the test population.
Grammar
Numeracy
Reading
Spelling
Writing
200920102011201220132014200920102011201220132014200920102011201220132014200920102011201220132014200920102011201220132014
Participating
Present
No of Students % of Students
304738415237254531334541284436364436304738415237294836405137
91%89%75%95%85%70%76%85%61%79%74%77%85%83%72%84%72%68%91%89%75%95%85%70%88%91%72%93%84%70%
Participating
Exempt
No of Students % of Students
1 2%
1 2%
1 2%
1 2%
1 2%
Not Partia'pat
Absent
iting
No of Students % of Students
361328168820915125914616173613281645143916
9%11%25%5%13%30%24%15%39%21%25%23%15%17%28%14%26%32%9%11%25%5%13%30%12%9%
28%7%15%30%
Not Participating
Withdrawn
No of Students % of Students
1 2%
Total No ofStudents
3353514361533353514261S333535043615333535143615333S3 •
504361S3
Universe: NAPLAN school summary results
Students in Years 3, 5, 7 and 9 across Australia sit common tests in numeracy, reading, wnfing and language conventions (spelling, grammar and punctuation). The results from this assessment provide animportant measure of how all Australian students are pefformmg in literacy and numeracy against national achievement bands.
Page 1/2

tslorthemTorrifrory DEPARTM ENT OF EOU CATI ONNAPLAN Results 2009 - 2014
Tennant Creek Primary School
Year 5 Percentage of Students Participating (%)
17030 NAPLAN School Summaiy Report 2009 - 2014Last Refreshed: 13/02/2015
Refreshed by: stephen.nimmo
Grammar Numeracy Reading Spelling Writing
'arttdpating H % Not Partldpallng
Note: % Participating includes students who were either Present or Exempt divided by the total number of students in the test population. The % Not Participating includes students who were Absent,Withdrawn or Sanctioned Abandonment from testing divided by the total number of students in the test population.
200920102011
Grammar ^^
20132014200920102011
Numeracy201220132014200920102011
Ro'dlng ^^
20132014200920102011
sp°"i"a ^
20132014200920102011
Wrilinf201220132014
No of Studf
394630453529364826433527425227473728394630453529424631453328
Participating
Present
ints % of Students
78% .
85%88%90%81%78%72%89%76%88%81%73%84%96%79%94%86%76%78%85%88%90%81%78%84%85%91%90'A
77%76%
Not Partlcipaling
Sanctioned Abandonment
No of Students % of Students
1 2%
Not Participating
Absent
No of Students % of Students
11845881468781082736911845887835109
22%15%12%10%19%22%28%11%24%14%19%27%16%4%21%6%14%24%22%15%12%10%19%22%14%15%9%10%23%24%
Total No ofStudents
505434504337505434504337505434504337505434504337505434504337
Universe: NAPLAN school summary resultsStudents in Years 3, 6, 7 and 9 across Australia sit common tests in numeracy, reading, wn'tsng and language conventions (spetlfng, grammar and puncfuation). The nssulfs from this assessment provide animportant measure of how all Ausfralian students are performing in Itferacy and numeracy against national achievement bands.
Page 2/2

Tennant Creek Primary School
ATTACHMENT C
Student Enrolment, Attendance and Learning
'wNorthernTerritoryGovernment DEPARTMENT OF EDUCATION
16030b 2014 School Performance Report - Community EngagementLast refreshed 13/02/2015Printed by Stephen.nimmo
Community Engagement
For more information and clarification of which code to use please contact the Enrolment & Attendance Team:Darwin & Palmerston 1800 070 493Central Australia 1800206317
Tennant Creek Primary School
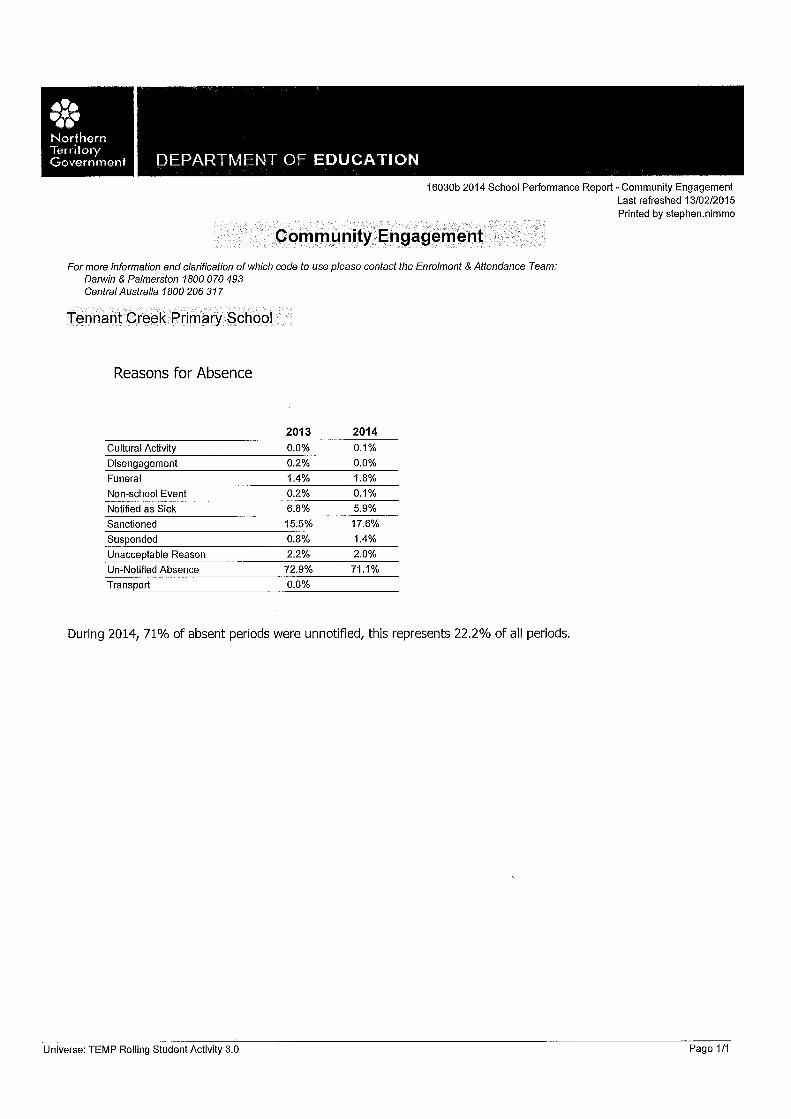
Reasons for Absence
Cultural Activity
Disengagement
Funeral
Non-school Event
Notified as Sick
Sanctioned
Suspended
Unacceptable Reason
Un-Notlfied Absence
Transport
20130.0%
0.2%
1.4%
0.2%
6.8%
15.5%
0.8%
2.2%
72.9%
0.0%
20140.1%
0.0%
1.8%
0.1%
5.9%
17.6%
1.4%
2.0%
71.1%
During 2014, 71% of absent periods were unnotified, this represents 22.2% of all periods.
Universe: TEMP Rolling Student Activity 3.0 Page 1/1