tenencia de dolares colchon
DESCRIPTION
informe dólares ColchónTRANSCRIPT
MPRAMunich Personal RePEc Archive
New estimates of U.S. currency abroad,the domestic money supply and theunreported Economy
Edgar L. Feige
September 2011
Online at http://mpra.ub.uni-muenchen.de/34778/MPRA Paper No. 34778, posted 16. November 2011 18:01 UTC
1
New Estimates of U.S. Currency Abroad, the Domestic Money
Supply and the Unreported Economy
Edgar L. Feige *
Abstract
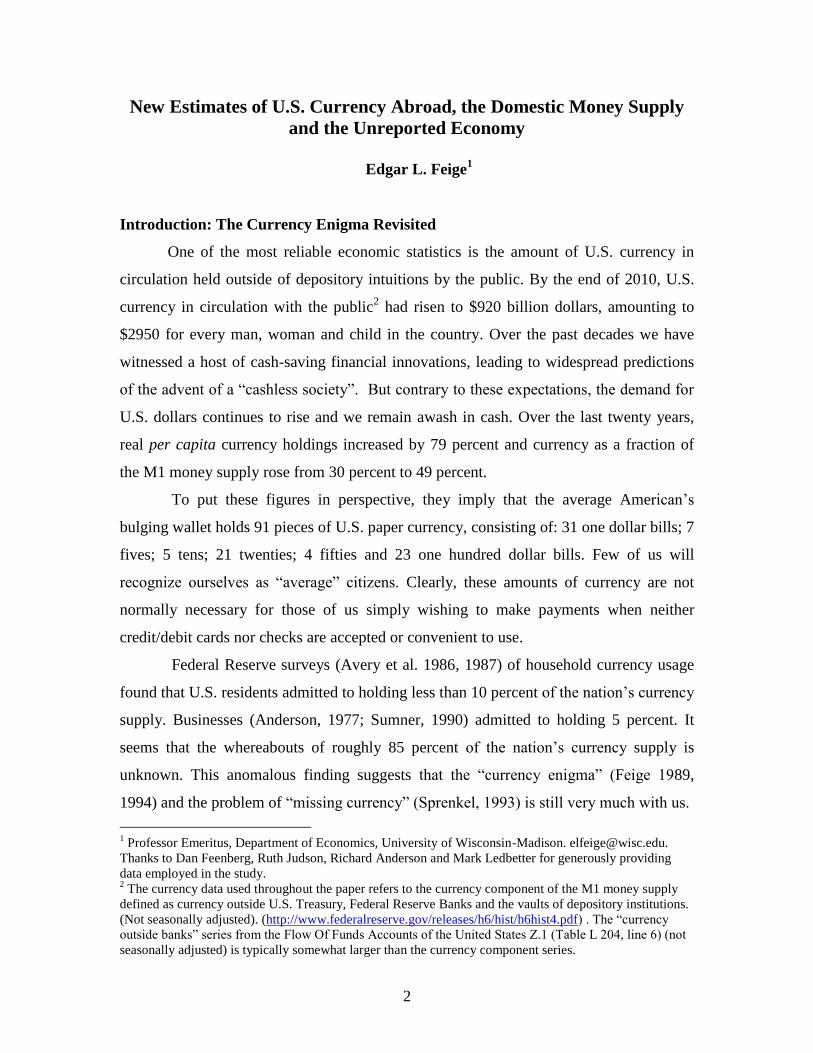
Despite financial innovations that have created important new substitutes for cash
usage, per capita holdings of U.S. currency amount to $2950. Yet American
households and businesses admit to holding only 15 percent of the currency stock,
leaving the whereabouts of 85 percent unknown. Some fraction of this unaccounted
for currency is held abroad (the dollarization hypothesis) and some is held
domestically undeclared, as a store of value and a medium of exchange for
transactions involving the production and distribution of illegal goods and services,
and for transactions earning income that is not reported to the IRS (the unreported
economy hypothesis).
We find that the percentage of U.S. currency currently held overseas is between
30-37 percent rather than the widely cited figure of 65 percent. This finding is based
on the official Federal Reserve/Bureau of Economic Analysis data which is a proxy
measure of the New York Federal Reserve‟s (NYB) “confidential” data on wholesale
currency shipments abroad. We recommend that the NYB data be aggregated so as to
circumvent confidentiality concerns, and be made readily available to all researchers
in order to shed greater light on the questions of how much U.S. currency is abroad
and on the particular location of overseas U.S. dollars.
The newly revised official estimates of overseas currency holdings are employed
to determine the Federal Reserve‟s seigniorage earnings from 1964-2010, which have
provided a $287 billion windfall for U.S. taxpayers. Overseas currency stock data are
also used to derive estimates of the domestically held stock of currency as well as
narrow and broad measures of domestic monetary aggregates. These domestic
monetary aggregates are believed to be better predictors of future economic activity
than traditional monetary aggregates and are tested to determine their ability to
predict fluctuations in real output and prices.
Domestic cash holdings are finally used to estimate the size of the U.S.
unreported economy as measured by the amount of income that is not properly
reported to the IRS. By 2010, we estimate that legal and illegal source unreported
income” is $1.9 - $2.4 trillion, implying a “tax gap” in the range of $400- $550
billion. Currently, we estimate that 18-23 percent of total reportable income is not
properly reported to the IRS.
Forthcoming: Crime, Law and Social Change, April, 2012
Keywords: Overseas currency, currency abroad, underground economy; unreported
economy; tax gap; tax evasion; cash payments; monetary aggregates.
JEL Classifications: E26; H26; O17; E41; E52
* Professor Emeritus, University of Wisconsin-Madison. Contact: [email protected].
2
New Estimates of U.S. Currency Abroad, the Domestic Money Supply
and the Unreported Economy
Edgar L. Feige
1
Introduction: The Currency Enigma Revisited
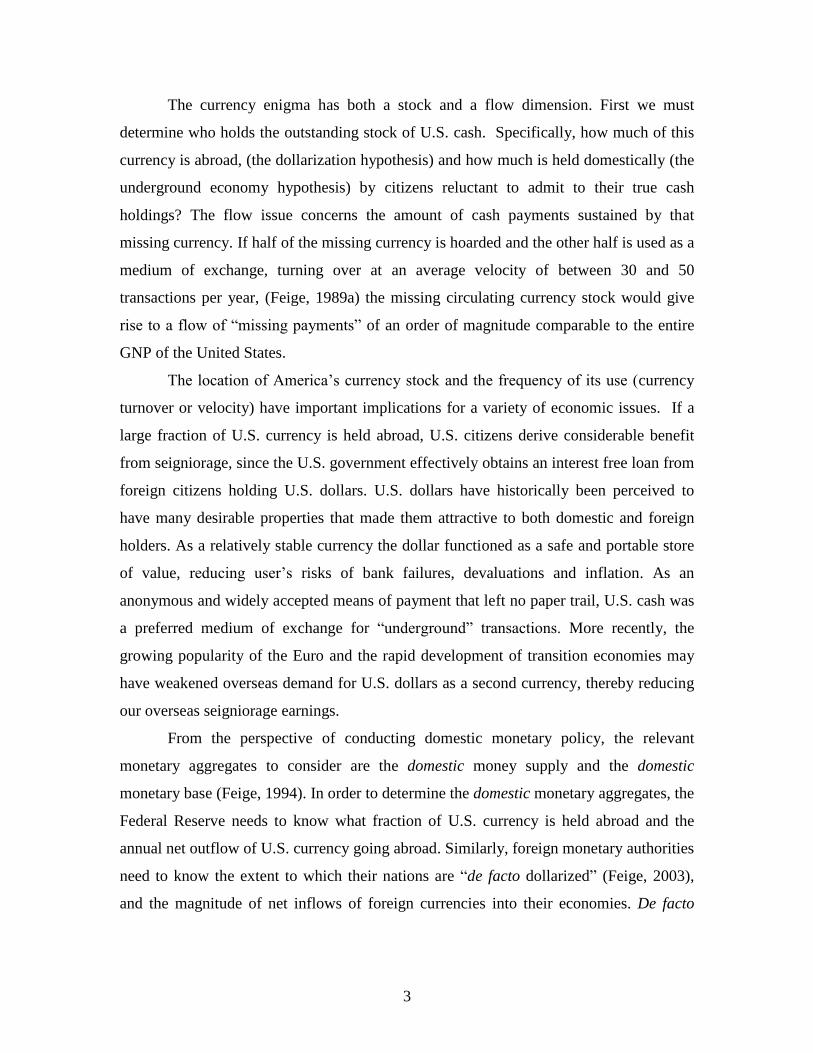
One of the most reliable economic statistics is the amount of U.S. currency in
circulation held outside of depository intuitions by the public. By the end of 2010, U.S.
currency in circulation with the public2 had risen to $920 billion dollars, amounting to
$2950 for every man, woman and child in the country. Over the past decades we have
witnessed a host of cash-saving financial innovations, leading to widespread predictions
of the advent of a “cashless society”. But contrary to these expectations, the demand for
U.S. dollars continues to rise and we remain awash in cash. Over the last twenty years,
real per capita currency holdings increased by 79 percent and currency as a fraction of
the M1 money supply rose from 30 percent to 49 percent.
To put these figures in perspective, they imply that the average American‟s
bulging wallet holds 91 pieces of U.S. paper currency, consisting of: 31 one dollar bills; 7
fives; 5 tens; 21 twenties; 4 fifties and 23 one hundred dollar bills. Few of us will
recognize ourselves as “average” citizens. Clearly, these amounts of currency are not
normally necessary for those of us simply wishing to make payments when neither
credit/debit cards nor checks are accepted or convenient to use.
Federal Reserve surveys (Avery et al. 1986, 1987) of household currency usage
found that U.S. residents admitted to holding less than 10 percent of the nation‟s currency
supply. Businesses (Anderson, 1977; Sumner, 1990) admitted to holding 5 percent. It
seems that the whereabouts of roughly 85 percent of the nation‟s currency supply is
unknown. This anomalous finding suggests that the “currency enigma” (Feige 1989,
1994) and the problem of “missing currency” (Sprenkel, 1993) is still very much with us.
1 Professor Emeritus, Department of Economics, University of Wisconsin-Madison. [email protected].
Thanks to Dan Feenberg, Ruth Judson, Richard Anderson and Mark Ledbetter for generously providing
data employed in the study. 2 The currency data used throughout the paper refers to the currency component of the M1 money supply
defined as currency outside U.S. Treasury, Federal Reserve Banks and the vaults of depository institutions.
(Not seasonally adjusted). (http://www.federalreserve.gov/releases/h6/hist/h6hist4.pdf) . The “currency
outside banks” series from the Flow Of Funds Accounts of the United States Z.1 (Table L 204, line 6) (not
seasonally adjusted) is typically somewhat larger than the currency component series.
3
The currency enigma has both a stock and a flow dimension. First we must
determine who holds the outstanding stock of U.S. cash. Specifically, how much of this
currency is abroad, (the dollarization hypothesis) and how much is held domestically (the
underground economy hypothesis) by citizens reluctant to admit to their true cash
holdings? The flow issue concerns the amount of cash payments sustained by that
missing currency. If half of the missing currency is hoarded and the other half is used as a
medium of exchange, turning over at an average velocity of between 30 and 50
transactions per year, (Feige, 1989a) the missing circulating currency stock would give
rise to a flow of “missing payments” of an order of magnitude comparable to the entire
GNP of the United States.
The location of America‟s currency stock and the frequency of its use (currency
turnover or velocity) have important implications for a variety of economic issues. If a
large fraction of U.S. currency is held abroad, U.S. citizens derive considerable benefit
from seigniorage, since the U.S. government effectively obtains an interest free loan from
foreign citizens holding U.S. dollars. U.S. dollars have historically been perceived to
have many desirable properties that made them attractive to both domestic and foreign
holders. As a relatively stable currency the dollar functioned as a safe and portable store
of value, reducing user‟s risks of bank failures, devaluations and inflation. As an
anonymous and widely accepted means of payment that left no paper trail, U.S. cash was
a preferred medium of exchange for “underground” transactions. More recently, the
growing popularity of the Euro and the rapid development of transition economies may
have weakened overseas demand for U.S. dollars as a second currency, thereby reducing
our overseas seigniorage earnings.
From the perspective of conducting domestic monetary policy, the relevant
monetary aggregates to consider are the domestic money supply and the domestic
monetary base (Feige, 1994). In order to determine the domestic monetary aggregates, the
Federal Reserve needs to know what fraction of U.S. currency is held abroad and the
annual net outflow of U.S. currency going abroad. Similarly, foreign monetary authorities
need to know the extent to which their nations are “de facto dollarized” (Feige, 2003),
and the magnitude of net inflows of foreign currencies into their economies. De facto
4
dollarization reduces the effectiveness of exchange rate stabilization policies and reduces
seigniorage revenues.
The whereabouts of America‟s cash also has fiscal consequences. U.S. currency is
a preferred medium of exchange for facilitating clandestine transactions, and for storing
illicit and untaxed wealth. Knowledge of its location and usage is required to estimate the
origins and volume of illicit transactions. These include the illegal trade in drugs, arms
and sex as well as the amount of “unreported” income, that is, income not properly
reported to the fiscal authorities due to noncompliance with the tax code. The fiscal
revenue lost to the government creates a “tax gap” that measures the extent to which
taxpayers do not file their tax returns and pay the correct tax in a timely manner. Tax
evasion gains increasing importance at a time of severe fiscal deficits that could be
reduced by improved tax compliance.
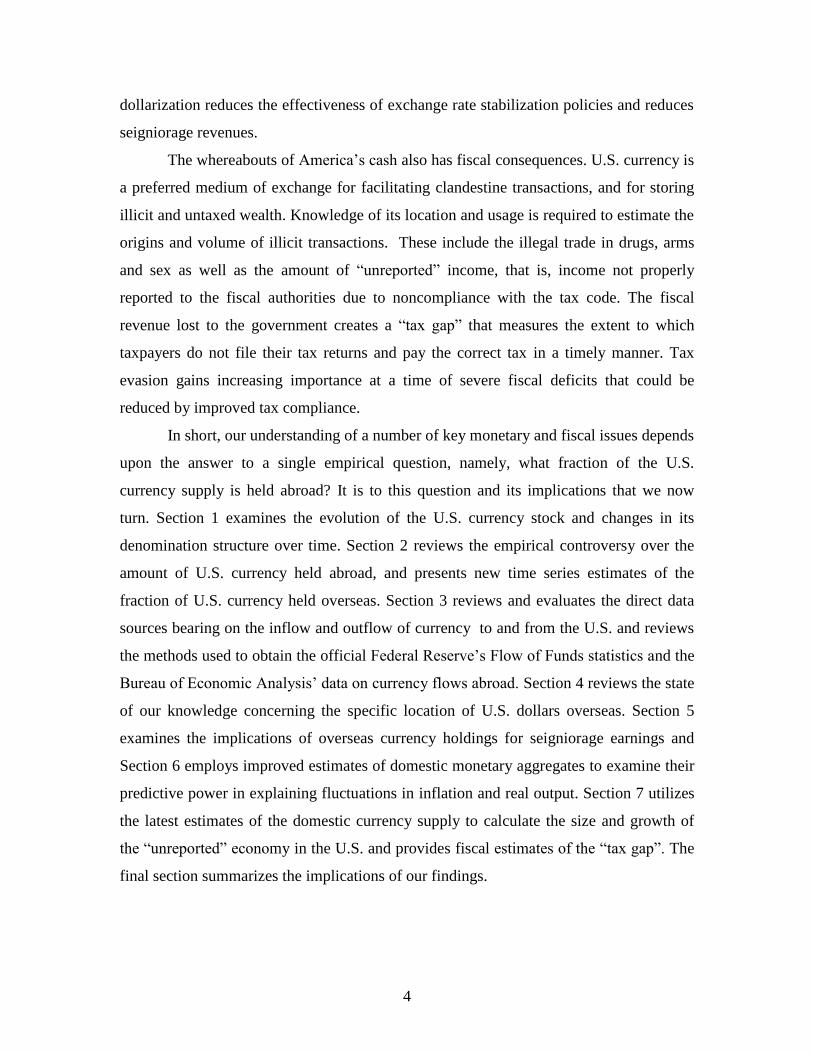
In short, our understanding of a number of key monetary and fiscal issues depends
upon the answer to a single empirical question, namely, what fraction of the U.S.
currency supply is held abroad? It is to this question and its implications that we now
turn. Section 1 examines the evolution of the U.S. currency stock and changes in its
denomination structure over time. Section 2 reviews the empirical controversy over the
amount of U.S. currency held abroad, and presents new time series estimates of the
fraction of U.S. currency held overseas. Section 3 reviews and evaluates the direct data
sources bearing on the inflow and outflow of currency to and from the U.S. and reviews
the methods used to obtain the official Federal Reserve‟s Flow of Funds statistics and the
Bureau of Economic Analysis‟ data on currency flows abroad. Section 4 reviews the state
of our knowledge concerning the specific location of U.S. dollars overseas. Section 5
examines the implications of overseas currency holdings for seigniorage earnings and
Section 6 employs improved estimates of domestic monetary aggregates to examine their
predictive power in explaining fluctuations in inflation and real output. Section 7 utilizes
the latest estimates of the domestic currency supply to calculate the size and growth of
the “unreported” economy in the U.S. and provides fiscal estimates of the “tax gap”. The
final section summarizes the implications of our findings.
5
1) The Evolution of Cash and its Denomination Structure
Financial innovation creates many substitutes for cash. Credit and debit cards,
electronic payments, EZ pass transponders on toll roads, and pre-paid phone cards are
common examples. Yet all predictions concerning the advent of a “cashless” society have
proven false as evidenced by the evolution of U.S. currency held by the public between
1964 and 2010.
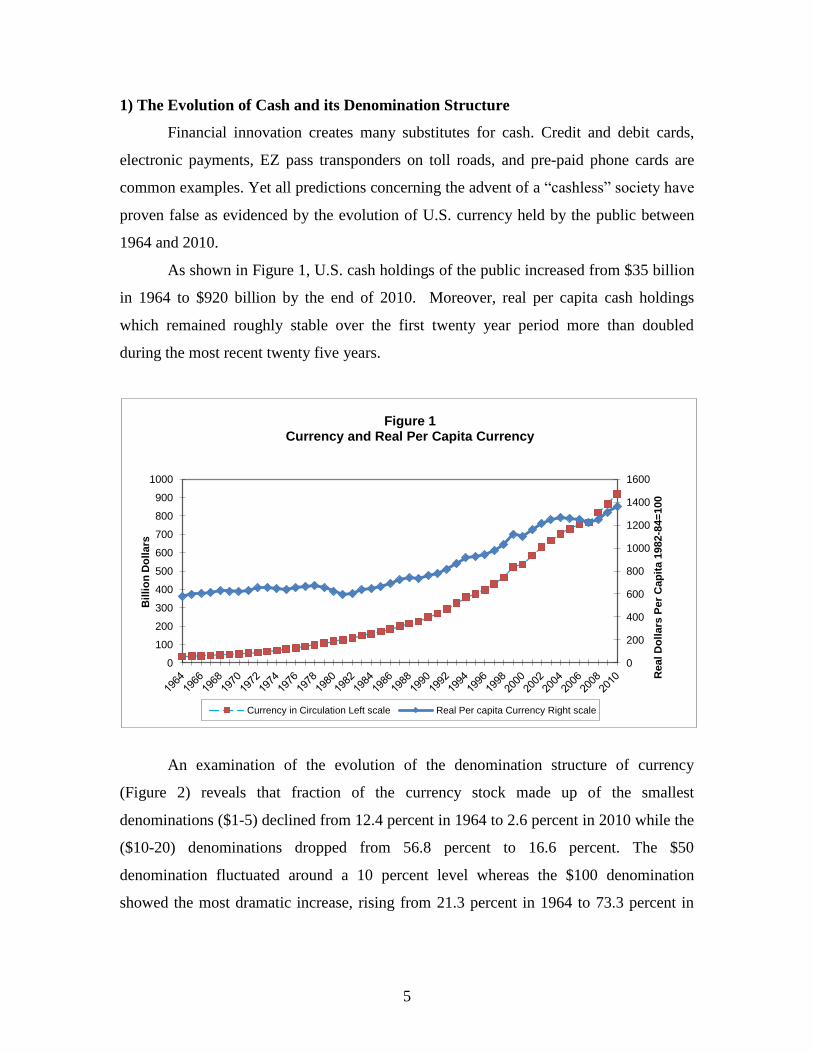
As shown in Figure 1, U.S. cash holdings of the public increased from $35 billion
in 1964 to $920 billion by the end of 2010. Moreover, real per capita cash holdings
which remained roughly stable over the first twenty year period more than doubled
during the most recent twenty five years.
An examination of the evolution of the denomination structure of currency
(Figure 2) reveals that fraction of the currency stock made up of the smallest
denominations ($1-5) declined from 12.4 percent in 1964 to 2.6 percent in 2010 while the
($10-20) denominations dropped from 56.8 percent to 16.6 percent. The $50
denomination fluctuated around a 10 percent level whereas the $100 denomination
showed the most dramatic increase, rising from 21.3 percent in 1964 to 73.3 percent in
0
200
400
600
800
1000
1200
1400
1600
0
100
200
300
400
500
600
700
800
900
1000
Real D
oll
ars
Per
Cap
ita 1
982
-84=
100
Bil
lio
n D
oll
ars
Figure 1 Currency and Real Per Capita Currency
Currency in Circulation Left scale Real Per capita Currency Right scale
6
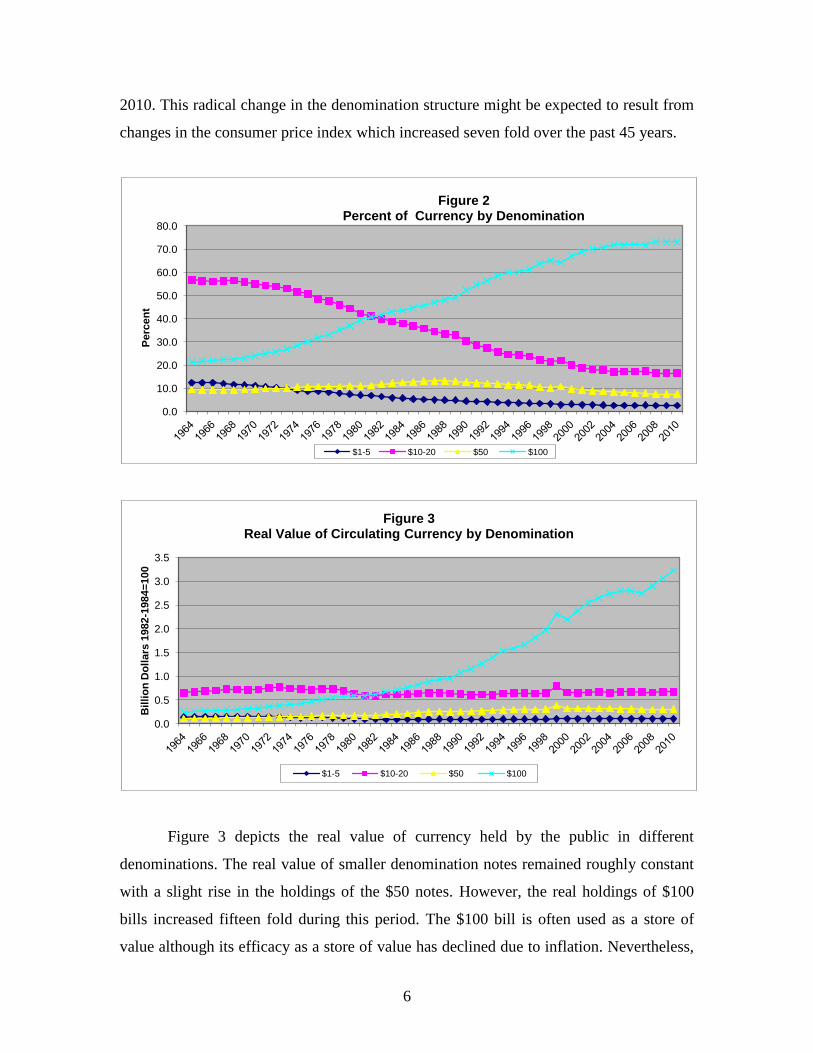
2010. This radical change in the denomination structure might be expected to result from
changes in the consumer price index which increased seven fold over the past 45 years.
Figure 3 depicts the real value of currency held by the public in different
denominations. The real value of smaller denomination notes remained roughly constant
with a slight rise in the holdings of the $50 notes. However, the real holdings of $100
bills increased fifteen fold during this period. The $100 bill is often used as a store of
value although its efficacy as a store of value has declined due to inflation. Nevertheless,
0.0
10.0
20.0
30.0
40.0
50.0
60.0
70.0
80.0
Perc
en
t
Figure 2 Percent of Currency by Denomination
$1-5 $10-20 $50 $100
0.0
0.5
1.0
1.5
2.0
2.5
3.0
3.5
Bil
lio
n D
oll
ars
1982
-1984=
100
Figure 3 Real Value of Circulating Currency by Denomination
$1-5 $10-20 $50 $100
7
the demand for $100 bills continued to rise in both nominal and real terms. One possible
explanation is the “dollarization” hypothesis, (Feige, 2003; 2004) suggesting that U.S.
currency, and particularly $100 bills are widely demanded as a second currency in
foreign countries experiencing banking crises, political instability and/or hyperinflations.
An alternative source of cash demand arises from its use as a medium of
exchange and store of value in the “underground” economy. Since cash usage is
anonymous, without leaving a paper trail, it is the preferred medium for purchasing
illegal goods and services and for hiding income that should be, but is not reported to the
tax authority. The problem then is to determine what fraction of the U.S. currency supply
is held abroad and what fraction is held domestically, albeit somewhat clandestinely.
2) The controversy over the location of U.S. currency.
Research in the early nineties witnessed a number of studies attempting to
estimate the fraction of U.S. currency held abroad, resulting in an empirical controversy
that persists to this day. Examining direct data sources 3 on net outflows of U.S. currency
(Feige, 1994), and indirect methods, (variants of monetary demography models) Feige
(1996) concluded “that roughly 36 percent of U.S. currency is held abroad”. Since
alternative methods of estimating overseas currency holdings yielded a varied results,
Feige (1997) suggested that the most plausible range of estimates was between 25-45
percent. Doyle (2000) subsequently estimated that in 1995, 30 percent of U.S. currency
was held abroad.
Very different results were obtained by Porter and Judson (1996), whose indirect
“seasonal” method estimated the share of currency held abroad, to be 70 percent. Taking
account of alternative estimation methods, Porter and Judson reported a “median flow
estimate” for 1995 of 55 percent abroad, similar to the estimate produced by Anderson
and Rasche (1997) of 53.2 percent. Porter and Judson‟s key conclusion, which has often
been cited in the literature, is “that between 55 percent and 70 percent of the U.S.
currency stock is currently held outside the country”.4
3 These included both Currency and Monetary Instrument Reports (CMIR) and the Federal Reserve Bank
of New York‟s (NYB) confidential wholesale currency bulk transport data. 4 Page 899.
8
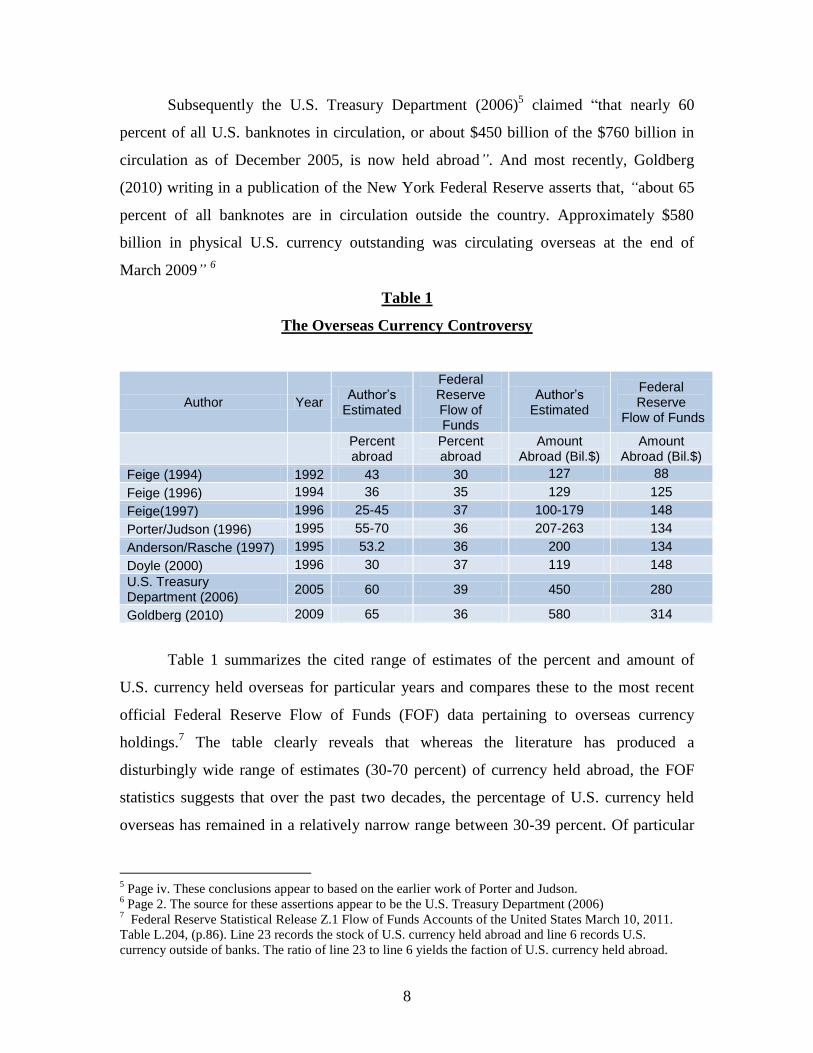
Subsequently the U.S. Treasury Department (2006)5 claimed “that nearly 60
percent of all U.S. banknotes in circulation, or about $450 billion of the $760 billion in
circulation as of December 2005, is now held abroad”. And most recently, Goldberg
(2010) writing in a publication of the New York Federal Reserve asserts that, “about 65
percent of all banknotes are in circulation outside the country. Approximately $580
billion in physical U.S. currency outstanding was circulating overseas at the end of
March 2009” 6
Table 1
The Overseas Currency Controversy
Author Year Author’s
Estimated
Federal Reserve Flow of Funds
Author’s Estimated
Federal Reserve
Flow of Funds
Percent abroad
Percent abroad
Amount Abroad (Bil.$)
Amount Abroad (Bil.$)
Feige (1994) 1992 43 30 127 88
Feige (1996) 1994 36 35 129 125
Feige(1997) 1996 25-45 37 100-179 148
Porter/Judson (1996) 1995 55-70 36 207-263 134
Anderson/Rasche (1997) 1995 53.2 36 200 134
Doyle (2000) 1996 30 37 119 148
U.S. Treasury Department (2006)
2005 60 39 450 280
Goldberg (2010) 2009 65 36 580 314
Table 1 summarizes the cited range of estimates of the percent and amount of
U.S. currency held overseas for particular years and compares these to the most recent
official Federal Reserve Flow of Funds (FOF) data pertaining to overseas currency
holdings.7 The table clearly reveals that whereas the literature has produced a
disturbingly wide range of estimates (30-70 percent) of currency held abroad, the FOF
statistics suggests that over the past two decades, the percentage of U.S. currency held
overseas has remained in a relatively narrow range between 30-39 percent. Of particular
5 Page iv. These conclusions appear to based on the earlier work of Porter and Judson.
6 Page 2. The source for these assertions appear to be the U.S. Treasury Department (2006)
7 Federal Reserve Statistical Release Z.1 Flow of Funds Accounts of the United States March 10, 2011.
Table L.204, (p.86). Line 23 records the stock of U.S. currency held abroad and line 6 records U.S.
currency outside of banks. The ratio of line 23 to line 6 yields the faction of U.S. currency held abroad.
9
concern is the huge $264 billion discrepancy between Goldberg‟s (2010) estimate of
currency abroad and the Board of Governors FOF estimate.
In light of these unsettlingly divergent estimates, we review the main data sources
employed to determine the amount of U.S. currency held abroad. Our aim is to review
earlier research results; explain the recent dramatic revisions adopted by both the Bureau
of Economic Analysis8 and the Federal Reserve
9 in their officially published estimates of
currency held abroad; and to suggest how the long standing controversy over the true
fraction of U.S. currency held abroad might be more readily resolved.
3) Direct data sources of currency inflows and outflows
The most direct method for estimating the faction of currency held abroad relies
upon data systems designed to track currency outflows and inflows to and from abroad.
Two such information systems are the U.S. Customs Service Currency and Monetary
Instrument Reports (CMIR)10
and the New York Federal Reserve Bank‟s (NYB) records
of international wholesale currency shipments abroad.11
a) New York Federal Reserve Bank Wholesale Shipments Reports
At present, there is no information system that collects comprehensive data on the
total amounts of currency flowing into and out of the U.S. Large overseas shipments of
U.S. currency are typically handled by a number of commercial banks acting as bank-
note brokers specializing in wholesale bulk currency transport to and from the U.S.
Interviews with Federal Reserve officials suggest that the main source of currency
provided to these bulk shippers comes from the New York Federal Reserve, with smaller
portions originating in the San Francisco and Atlanta Federal Reserve districts.
Since 1988, bulk currency transporters informally reported their overseas
shipments and receipts to the New York Reserve Bank Cash Office which maintains an
internal confidential data base (NYB) on these currency inflows and outflows. The data
are incomplete insofar as they do not reflect currency mailed or hand carried by travelers
8 BEA News release. June 17, 2008.
9 The new figures appear in the 2008 Flow of Funds Z1 Tables F-204 and L-204, however no mention is
made of the change in method employed to estimate the revised series of currency flows abroad. 10
Currently known as the Report of International Transportation of Currency or Monetary Instruments
(FinCEN Form 105). 11
Both of these data systems are described, compared and evaluated in Feige (1996, 1997).
10
or guest workers. They may also exclude some currency shipments into or out of the
country by non reporting shipping entities. Nevertheless, these data currently represent an
informative (if at times imperfect) record12
of currency inflows and outflows, and are
invaluable for determining the geographic destination of cash shipments and the origins
of cash receipts from overseas locations. Unfortunately, researchers have been denied
access to the data for the last decade despite the fact that aggregation techniques (Feige
and Watts, 1972) are readily available to overcome confidentiality concerns. Most
recently, economists at the Federal Reserve Bank of New York (Hellerstein and Ryan,
2011, displayed graphs of aggregate monthly currency payments and receipts based on
these NYB data for the period 1990-2007 but the underlying data were withheld on
claims of confidentiality.
b) The FR-160 Proxy
In an effort to avoid the confidentiality restrictions that have prevented direct
publication of the NYB data for the past two decades, Feige (1994) initially proposed
using a proxy for these confidential data based on the Federal Reserve‟s FR-160 cash
accounting system.13
The FR-160 reports contain monthly data on denomination specific
flows of currency paid into circulation (PIC) and received from circulation (RFC) for
each of the 37 Federal Reserve cash offices. Net injections (PIC-RFC) of $100
denomination bills by the New York Federal Reserve cash office (NYNET) were found
to be so highly correlated with the internal confidential New York Fed‟s series on
aggregate bulk shipments that they were initially accepted as a serviceable proxy for the
NYB series of net currency shipments abroad.14
Subsequent investigation led Feige
(1996) to warn that the NYNET proxy overstated true net outflows. 15
Recognizing that
shipments and receipts of currency to and from Asian markets often originated at the Los
Angeles cash office of the Federal Reserve, the Board of Governors of the Federal
12
In 2003, the Federal Reserve terminated its Extended Custodial Inventory (ECI) agreement with UBS
and in 2004 followed with a $100 million civil penalty after discovering that UBS had falsified its reports
of overseas shipments to the Federal Reserve over an eight year period. (Pasley, 2005) 13
The historical background and evolution of the FR-160 reporting system is contained in the Board of
Governors technical memorandum #91 entitled “ Processing Procedures for the Cash Series”, November,
1988. 14
Feige, 1994. 15
Feige, 1996, pp. 43-45.
11
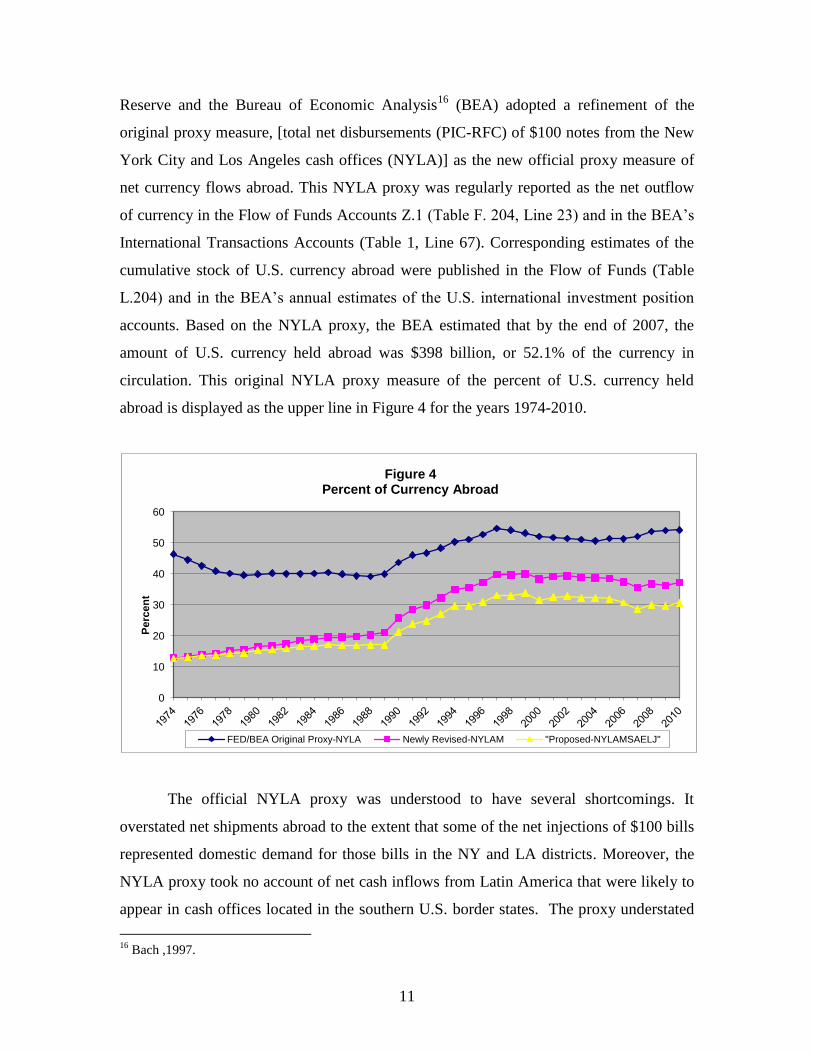
Reserve and the Bureau of Economic Analysis16
(BEA) adopted a refinement of the
original proxy measure, [total net disbursements (PIC-RFC) of $100 notes from the New
York City and Los Angeles cash offices (NYLA)] as the new official proxy measure of
net currency flows abroad. This NYLA proxy was regularly reported as the net outflow
of currency in the Flow of Funds Accounts Z.1 (Table F. 204, Line 23) and in the BEA‟s
International Transactions Accounts (Table 1, Line 67). Corresponding estimates of the
cumulative stock of U.S. currency abroad were published in the Flow of Funds (Table
L.204) and in the BEA‟s annual estimates of the U.S. international investment position
accounts. Based on the NYLA proxy, the BEA estimated that by the end of 2007, the
amount of U.S. currency held abroad was $398 billion, or 52.1% of the currency in
circulation. This original NYLA proxy measure of the percent of U.S. currency held
abroad is displayed as the upper line in Figure 4 for the years 1974-2010.
The official NYLA proxy was understood to have several shortcomings. It
overstated net shipments abroad to the extent that some of the net injections of $100 bills
represented domestic demand for those bills in the NY and LA districts. Moreover, the
NYLA proxy took no account of net cash inflows from Latin America that were likely to
appear in cash offices located in the southern U.S. border states. The proxy understated
16
Bach ,1997.
0
10
20
30
40
50
60
Perc
en
t
Figure 4 Percent of Currency Abroad
FED/BEA Original Proxy-NYLA Newly Revised-NYLAM "Proposed-NYLAMSAELJ"
12
net shipments abroad to the extent that it excluded shipments of lower denomination
notes and took no account of currency flows abroad resulting from tourism, immigrant
remittances and U.S. military personnel stationed overseas.
In response to some of the aforementioned criticisms, the BEA17
recently released
significantly revised estimates of the stocks and flows of U.S. currency abroad for the
period 1974-2007. The new estimates are based on an adjusted flow proxy that measures
total net disbursements (PIC-RFC) of $100 notes from the New York City, Los Angeles
and Miami cash offices (NYLAM). These revised estimates decreased the presumed
amount of currency held abroad at the end of 1973 from $30.5 billion to $7.7 billion.
Since 2008, the revised series appears in both the official Federal Reserve Flow of Funds
Accounts and the BEA International Transactions and International Positions Accounts.
According to the newly revised estimates displayed as (NYLAM) in Figure 4, the
percent of U.S. currency held abroad at the end of 2010 was 37.2 percent, down from the
former estimate of 51.6 percent. This substantial downward revision suggests that $133
billion, formerly thought to have been held overseas is now officially recognized as
circulating domestically.
Further scrutiny of net cash disbursements of $100 bills from the Federal
Reserve‟s cash offices in San Antonio (SA), El Paso (EL) and Jacksonville (J) reveals an
unusual pattern of net cash inflows that cannot be readily explained by tourist inflows
from other cash offices. These offices, located near our Southern border entry points, are
likely recipients of funds flowing into the U.S. from Central and South America. I
therefore propose to add the net cash disbursements from these additional border cash
offices to the currency proxy in the hope of obtaining a more reliable estimate of net
currency flows abroad. The resulting estimated percentage of currency held abroad as
measured by the proposed (NYLAMSAELJ) proxy is displayed in Figure 4 and suggests
that at the end of 2010, 30.7 percent of U.S. currency was held abroad, amounting to
$282.2 billion.
To summarize, both Federal Reserve‟s Flow of Funds and the Bureau of
Economic Analysis (FOF/BEA) base their official estimates of U.S. currency flows
abroad on a proxy measure which is a surrogate for the New York Federal Reserve‟s
17
BEA (June 17, 2008) News Release
13
“confidential” data on wholesale bulk shipments of U.S. currency overseas (NYB). The
accuracy of the official data therefore depends critically upon how closely it mimics the
underlying NYB data. To our knowledge, the only official statement regarding the actual
NYB flows appeared in Secretary of the Treasury (2006) which reported that “about $130
billion in U.S. banknotes, on net, moved abroad via wholesale banknote brokers in the
eighteen years from 1988 through 2005.18
By way of comparison, during the same
eighteen year period, the official NYLAM proxy estimated that $241 billion had been
shipped abroad whereas our proposed NYLAMSAELJ proxy estimated that $199 billion
has been shipped abroad. Our tentative conclusion is that even the current “official”
estimates of overseas currency are overstated and it is most likely that considerably less
than 30 percent of U.S. currency is presently abroad.
c) Currency and Monetary Instrument Reports
As part of its regulatory responsibility under the Currency and Foreign
Transactions Reporting Act, the U.S. Customs Service collects information on U.S.
currency outflows and inflows. This act required persons or institutions exporting or
importing currency or other monetary instruments in excess of $500019
to file a “Report
of International Transportation of Currency or Monetary Instruments”. Commonly known
as “CMIRs”, these reports have been collected by the U.S. Customs Service since 1977
and are now collected by the Financial Crimes Enforcement Network (FinCEN) of the
Department of the Treasury. The CMIR records contain all reported cross border
currency inflows and outflows including currency physically transported by currency
retailers, non-financial businesses and individuals and currency shipped by financial
institutions specializing in wholesale currency transactions. Exceptions as to who must
file a CMIR form suggest that the CMIR‟s are likely to understate true net outflows of
currency abroad.
The CMIR reports on currency inflows and outflows can be aggregated by origin
and destination. With the cooperation of the U.S. Customs Service and the U.S. Treasury
Department Financial Crimes Enforcement Network, the information contained in the
18
P.28. 19
In 1980 the reporting threshold was raised to $10,000.
14
millions of accumulated confidential CMIR forms was combined by a specially designed
algorithm that aggregated CMIR outflows (CTO) and inflows (CTI) so as to maintain the
confidentiality of individual records in the CMIR data system. CMIR reports have their
own limitations in so far as they exclude currency transactions that fall below the
reporting requirement; shipments that circumvent the legal reporting requirements and
direct shipments by Federal Reserve Banks and others who are not required to file a
CMIR.20
In the analysis that follows we have adjusted the CMIR data to include
shipments and receipts of currency made directly by the New York Federal Reserve. We
denote these adjusted aggregated CMIR outflows as CTOadj and the adjusted aggregated
CMIR inflows as CTIadj..
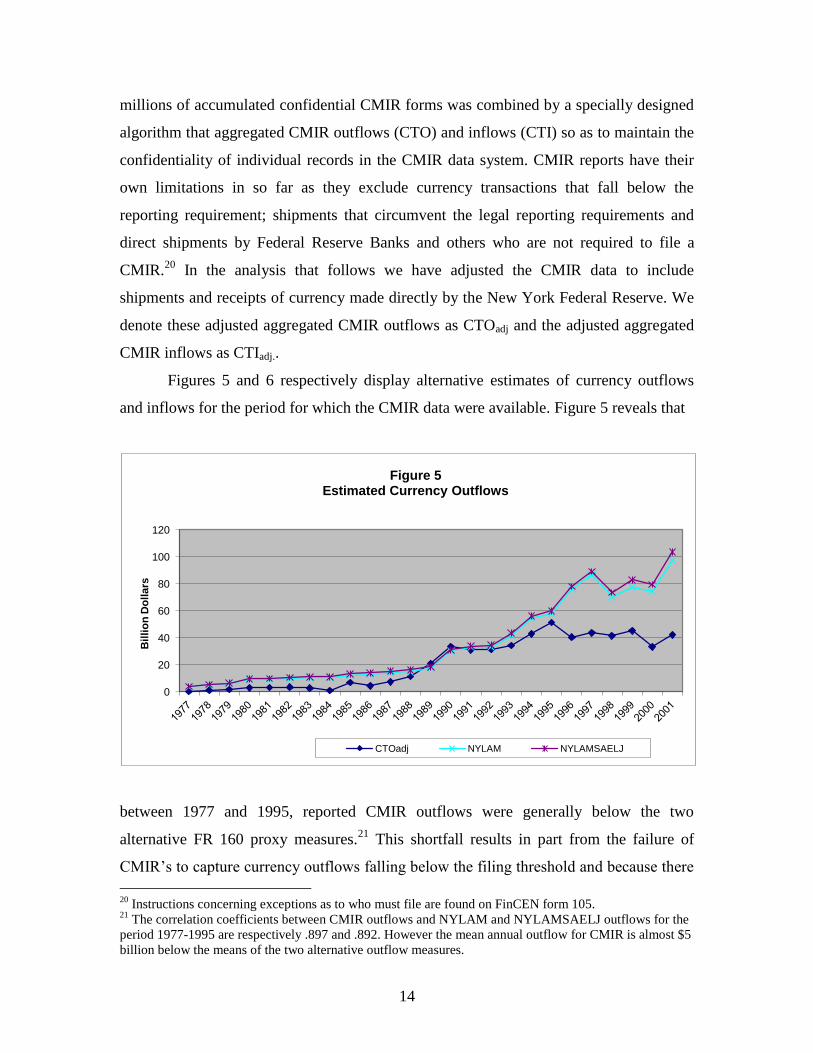
Figures 5 and 6 respectively display alternative estimates of currency outflows
and inflows for the period for which the CMIR data were available. Figure 5 reveals that
between 1977 and 1995, reported CMIR outflows were generally below the two
alternative FR 160 proxy measures.21
This shortfall results in part from the failure of
CMIR‟s to capture currency outflows falling below the filing threshold and because there
20
Instructions concerning exceptions as to who must file are found on FinCEN form 105. 21
The correlation coefficients between CMIR outflows and NYLAM and NYLAMSAELJ outflows for the
period 1977-1995 are respectively .897 and .892. However the mean annual outflow for CMIR is almost $5
billion below the means of the two alternative outflow measures.
0
20
40
60
80
100
120
Bil
lio
n D
oll
ars
Figure 5 Estimated Currency Outflows
CTOadj NYLAM NYLAMSAELJ

15
is a general lack of awareness and enforcement of the requirement for individuals to file
these reports when leaving the country. Individuals entering the country typically pass
through customs and are specifically reminded to fill out the required CMIR form if they
are carrying cash amounts above the threshold. The differential awareness and
enforcement is reflected by the fact that roughly five times as many arriving travelers
filed CMIR forms than did departing travelers and that recorded CMIR inflows for the
period 1977-1995 are highly consistent with the two proxy flows as displayed in Figure
6.22
We conclude that for the period 1977-1995 CMIR estimates of net currency flows
abroad are understated, and should, at best, be considered as a lower bound estimate of
the net currency sent abroad.
In 1996 the Treasury Department introduced a newly designed $100
denomination banknote with improved security features. In order to facilitate the rapid
introduction of the new notes and to expedite the repatriation of older designed notes, the
Federal Reserve established the Extended Custodial Inventory (ECI) program, creating
overseas cash depots managed by the New York Federal Reserve. One of the unintended
consequences of the establishment of the ECI program was to degrade the quality of
CMIR reporting, which failed to appropriately capture currency outflows from the ECI‟s
22
The correlation coefficients between CMIR inflows and NYLAM and NYLAMSAELJ inflows for the
period 1977-1995 are respectively .988 and .989 with comparable means.
0
10
20
30
40
50
60
70
80
90
100
Bil
lio
n D
oll
ars
Figure 6 Estimated Currency Inflows
CTIadj NYLAM NYLAMSAELJ
16
to other countries as well as currency reflows from foreign countries back to the overseas
ECIs. Figures 5 and 6 display the decline in measured CMIR outflows and inflows
following the introduction of the ECI program. Taking the currency NYLAM proxy as a
basis, it appears that the CMIR data reported lower net outflows during the period 1996-
2001 by roughly $19 billion per year. How much of this discrepancy is due to the
understatement of the CMIR data or to the overstatement of the NYLAM proxy is
impossible to determine. However, the known decline in the reliability of the CMIR data
further highlights the importance of obtaining the New York Federal Reserve‟s (NYB)
wholesale currency shipments data in order to arrive at more reliable estimates of the true
fraction of currency abroad as well as the country specific location of U.S. currency
balances.
The most significant conclusion resulting from our review of direct measures of
overseas currency is that far less currency appears to be circulating overseas than was
previously thought to be the case. For 2008, the original “official” estimate of the percent
of currency overseas was 51 percent whereas the new FED/BEA estimate now stands at
37 percent. If we include FR-160 data from the three additional southern border cash
offices that are known to receive considerable amounts of currency from Latin America,
the fraction of currency estimated to be overseas is reduced to 30 percent. These new
estimates are well below the oft cited figures claiming that half to two thirds of the U.S.
currency is held outside the United States.
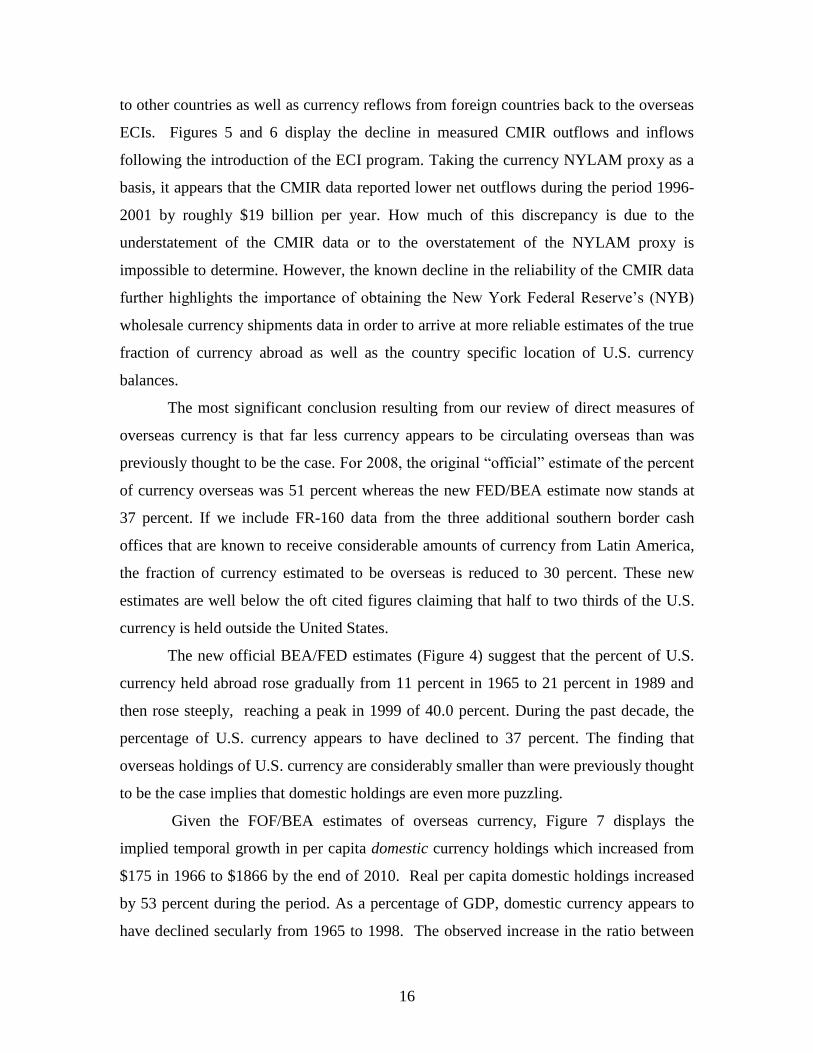
The new official BEA/FED estimates (Figure 4) suggest that the percent of U.S.
currency held abroad rose gradually from 11 percent in 1965 to 21 percent in 1989 and
then rose steeply, reaching a peak in 1999 of 40.0 percent. During the past decade, the
percentage of U.S. currency appears to have declined to 37 percent. The finding that
overseas holdings of U.S. currency are considerably smaller than were previously thought
to be the case implies that domestic holdings are even more puzzling.
Given the FOF/BEA estimates of overseas currency, Figure 7 displays the
implied temporal growth in per capita domestic currency holdings which increased from
$175 in 1966 to $1866 by the end of 2010. Real per capita domestic holdings increased
by 53 percent during the period. As a percentage of GDP, domestic currency appears to
have declined secularly from 1965 to 1998. The observed increase in the ratio between
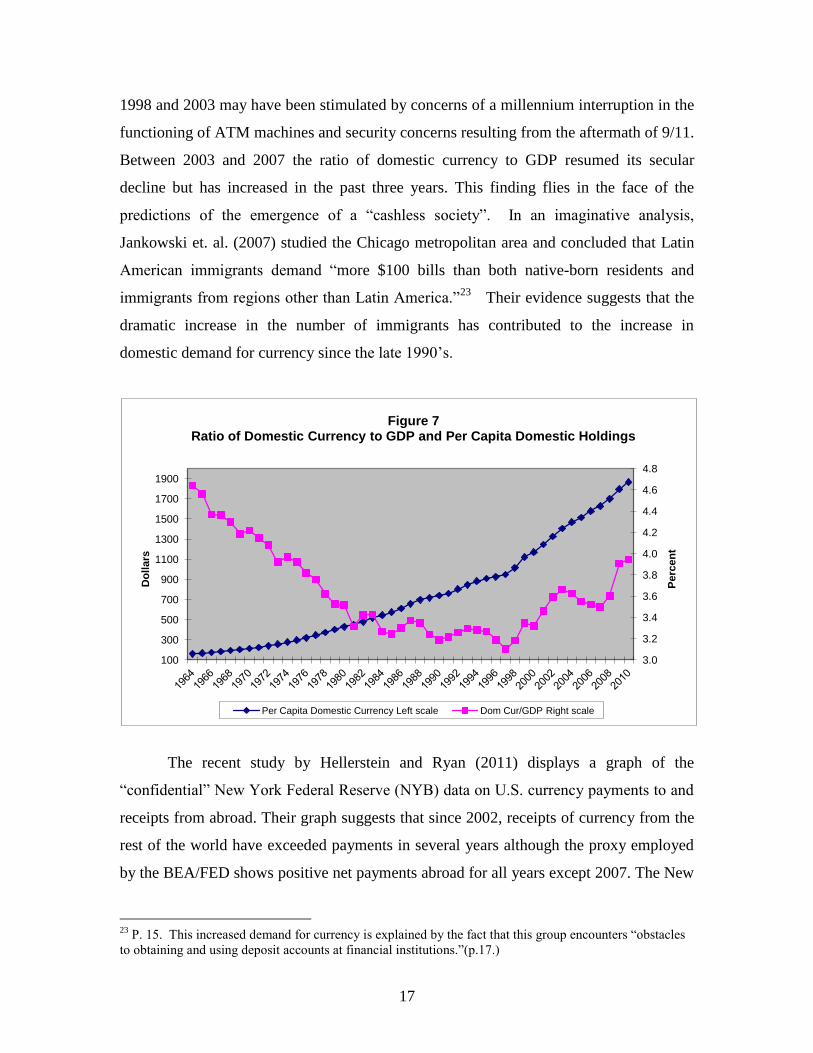
17
1998 and 2003 may have been stimulated by concerns of a millennium interruption in the
functioning of ATM machines and security concerns resulting from the aftermath of 9/11.
Between 2003 and 2007 the ratio of domestic currency to GDP resumed its secular
decline but has increased in the past three years. This finding flies in the face of the
predictions of the emergence of a “cashless society”. In an imaginative analysis,
Jankowski et. al. (2007) studied the Chicago metropolitan area and concluded that Latin
American immigrants demand “more $100 bills than both native-born residents and
immigrants from regions other than Latin America.”23
Their evidence suggests that the
dramatic increase in the number of immigrants has contributed to the increase in
domestic demand for currency since the late 1990‟s.
The recent study by Hellerstein and Ryan (2011) displays a graph of the
“confidential” New York Federal Reserve (NYB) data on U.S. currency payments to and
receipts from abroad. Their graph suggests that since 2002, receipts of currency from the
rest of the world have exceeded payments in several years although the proxy employed
by the BEA/FED shows positive net payments abroad for all years except 2007. The New
23
P. 15. This increased demand for currency is explained by the fact that this group encounters “obstacles
to obtaining and using deposit accounts at financial institutions.”(p.17.)
3.0
3.2
3.4
3.6
3.8
4.0
4.2
4.4
4.6
4.8
100
300
500
700
900
1100
1300
1500
1700
1900
Perc
en
t
Do
llars
Figure 7 Ratio of Domestic Currency to GDP and Per Capita Domestic Holdings
Per Capita Domestic Currency Left scale Dom Cur/GDP Right scale
18
York Federal Reserve (NYB) data appear to imply that the percentage of currency
currently held abroad is even lower than the NYLAM percentage displayed in Figure 4.
Moreover, they suggest that the past decade has witnessed a significant decline in the rest
of the world‟s demand for U.S. currency. If true, domestic currency holdings must have
increased even more rapidly than implied by Figure 7.
4) The Location of U.S. Currency Held Abroad
Two sources of data are available for estimating the location of U.S. dollars
overseas. Between 1994 and 2005 officials from the U.S. Treasury, the Board of
Governors of the Federal Reserve, the New York Federal Reserve and the U.S. Secret
Service visited forty-one countries to conduct informal surveys concerning the amount of
U.S. currency in circulation. The amounts of U.S. currency believed to be held in each
country are reported in the United States Treasury Department (2006) [Table 3.3] and are
reproduced here in Table 2.
Unfortunately, the Treasury Report gives no indication of the method employed to
obtain these “survey” estimates other than to obliquely state in a footnote: “For currency
holdings, estimates were provided during the teams visit to each country and thus are
estimates as of the most recent trip to each country”.24
Table 2 also includes estimates of
currency held abroad in 12 additional countries not visited by the official teams. These
additional country estimates are based on aggregated CMIR reports of currency inflows
and outflows organized by country of origin and destination.
To examine the consistency of the “informal survey” results with the BEA/FED
estimates of total currency abroad, we note that the amount of currency reportedly held in
the 31 visited countries ($248.1 billion) during the period 1994-2005 exceeds the new
official BEA/Fed estimate of the average amount of currency held abroad ($205.4 billion)
during this period by $42.7 billion. The additional CMIR country estimates bring this
discrepancy to $76.3 billion. We suspect that the anecdotal evidence presented as survey
results grossly overstate U.S. currency holdings abroad.
24
P. 25.
19
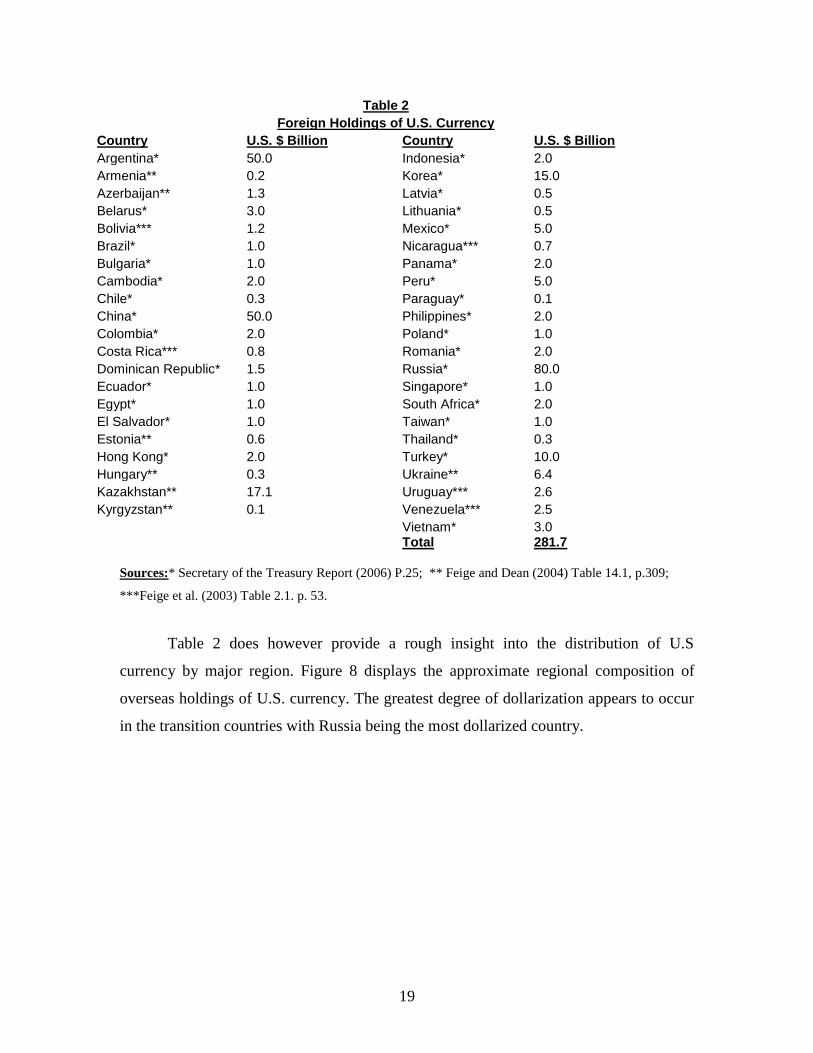
Table 2
Foreign Holdings of U.S. Currency
Country U.S. $ Billion Country U.S. $ Billion
Argentina* 50.0 Indonesia* 2.0
Armenia** 0.2 Korea* 15.0
Azerbaijan** 1.3 Latvia* 0.5
Belarus* 3.0 Lithuania* 0.5
Bolivia*** 1.2 Mexico* 5.0
Brazil* 1.0 Nicaragua*** 0.7
Bulgaria* 1.0 Panama* 2.0
Cambodia* 2.0 Peru* 5.0
Chile* 0.3 Paraguay* 0.1
China* 50.0 Philippines* 2.0
Colombia* 2.0 Poland* 1.0
Costa Rica*** 0.8 Romania* 2.0
Dominican Republic* 1.5 Russia* 80.0
Ecuador* 1.0 Singapore* 1.0
Egypt* 1.0 South Africa* 2.0
El Salvador* 1.0 Taiwan* 1.0
Estonia** 0.6 Thailand* 0.3
Hong Kong* 2.0 Turkey* 10.0
Hungary** 0.3 Ukraine** 6.4
Kazakhstan** 17.1 Uruguay*** 2.6
Kyrgyzstan** 0.1 Venezuela*** 2.5
Vietnam* 3.0
Total
281.7
Sources:* Secretary of the Treasury Report (2006) P.25; ** Feige and Dean (2004) Table 14.1, p.309;
***Feige et al. (2003) Table 2.1. p. 53.
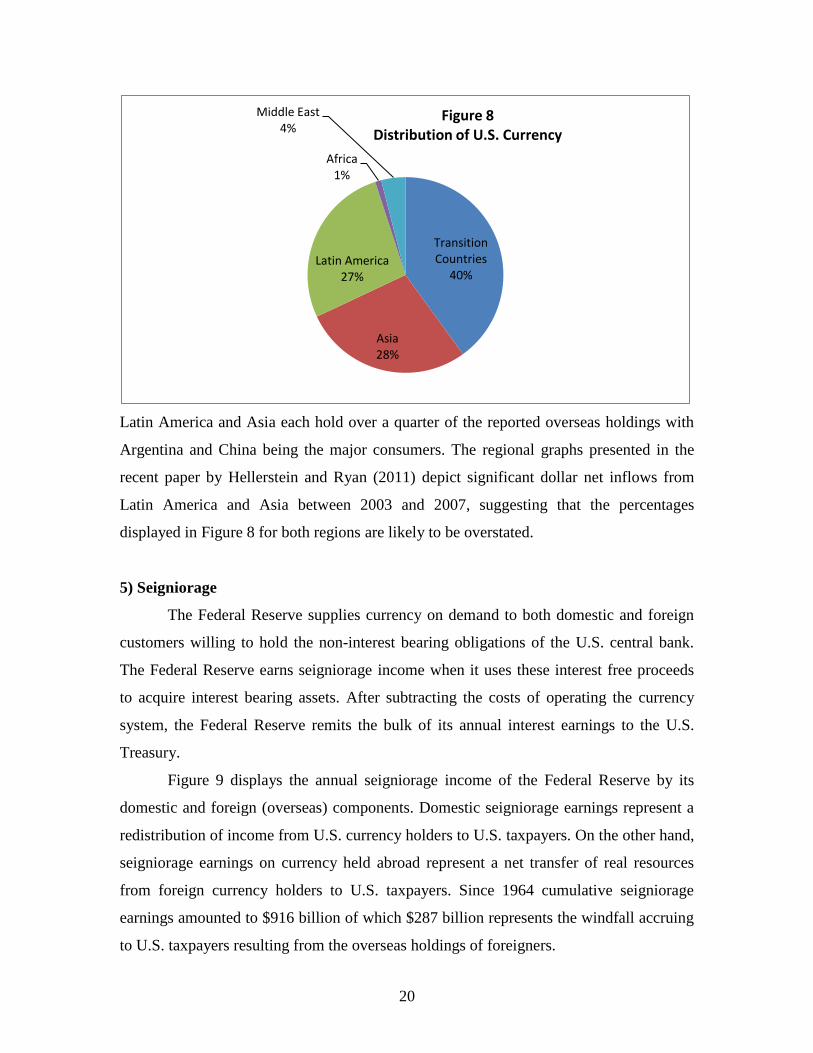
Table 2 does however provide a rough insight into the distribution of U.S
currency by major region. Figure 8 displays the approximate regional composition of
overseas holdings of U.S. currency. The greatest degree of dollarization appears to occur
in the transition countries with Russia being the most dollarized country.
20
Latin America and Asia each hold over a quarter of the reported overseas holdings with
Argentina and China being the major consumers. The regional graphs presented in the
recent paper by Hellerstein and Ryan (2011) depict significant dollar net inflows from
Latin America and Asia between 2003 and 2007, suggesting that the percentages
displayed in Figure 8 for both regions are likely to be overstated.
5) Seigniorage
The Federal Reserve supplies currency on demand to both domestic and foreign
customers willing to hold the non-interest bearing obligations of the U.S. central bank.
The Federal Reserve earns seigniorage income when it uses these interest free proceeds
to acquire interest bearing assets. After subtracting the costs of operating the currency
system, the Federal Reserve remits the bulk of its annual interest earnings to the U.S.
Treasury.
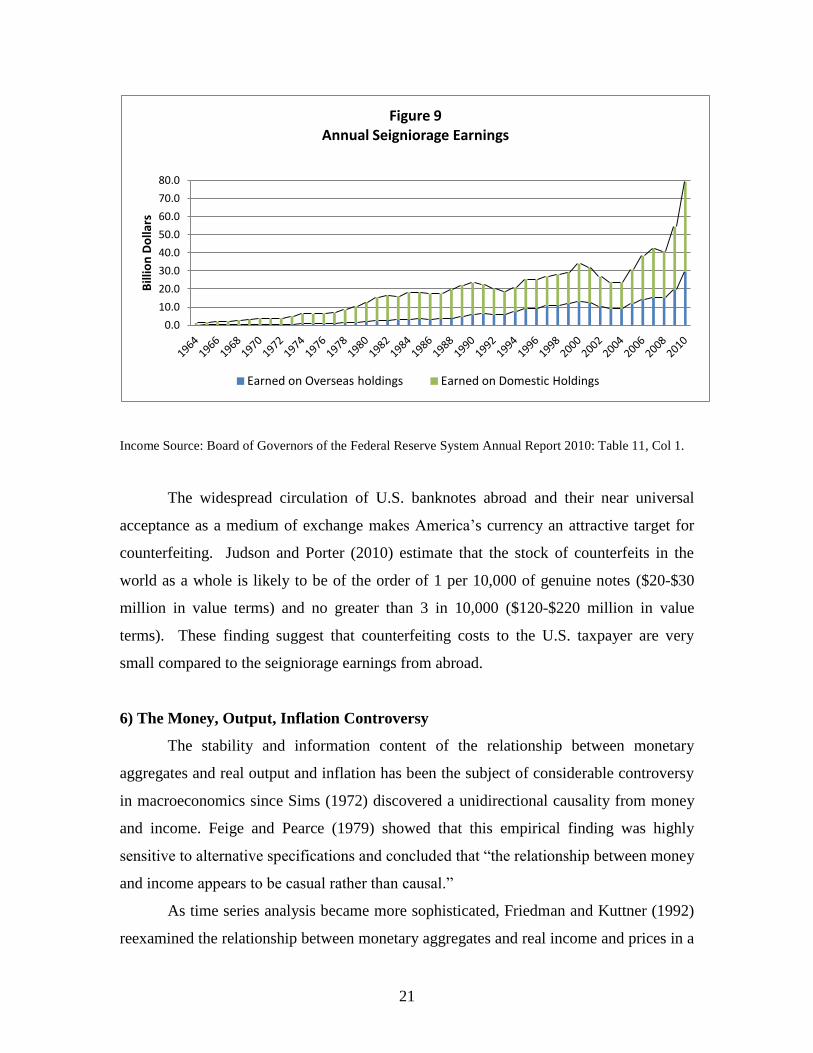
Figure 9 displays the annual seigniorage income of the Federal Reserve by its
domestic and foreign (overseas) components. Domestic seigniorage earnings represent a
redistribution of income from U.S. currency holders to U.S. taxpayers. On the other hand,
seigniorage earnings on currency held abroad represent a net transfer of real resources
from foreign currency holders to U.S. taxpayers. Since 1964 cumulative seigniorage
earnings amounted to $916 billion of which $287 billion represents the windfall accruing
to U.S. taxpayers resulting from the overseas holdings of foreigners.
Transition Countries
40%
Asia 28%
Latin America 27%
Africa 1%
Middle East 4%
Figure 8 Distribution of U.S. Currency
21
Income Source: Board of Governors of the Federal Reserve System Annual Report 2010: Table 11, Col 1.
The widespread circulation of U.S. banknotes abroad and their near universal
acceptance as a medium of exchange makes America‟s currency an attractive target for
counterfeiting. Judson and Porter (2010) estimate that the stock of counterfeits in the
world as a whole is likely to be of the order of 1 per 10,000 of genuine notes ($20-$30
million in value terms) and no greater than 3 in 10,000 ($120-$220 million in value
terms). These finding suggest that counterfeiting costs to the U.S. taxpayer are very
small compared to the seigniorage earnings from abroad.
6) The Money, Output, Inflation Controversy
The stability and information content of the relationship between monetary
aggregates and real output and inflation has been the subject of considerable controversy
in macroeconomics since Sims (1972) discovered a unidirectional causality from money
and income. Feige and Pearce (1979) showed that this empirical finding was highly
sensitive to alternative specifications and concluded that “the relationship between money
and income appears to be casual rather than causal.”
As time series analysis became more sophisticated, Friedman and Kuttner (1992)
reexamined the relationship between monetary aggregates and real income and prices in a
0.0
10.0
20.0
30.0
40.0
50.0
60.0
70.0
80.0
Bill
ion
Do
llars
Figure 9 Annual Seigniorage Earnings
Earned on Overseas holdings Earned on Domestic Holdings
22
trivariate autoregressive framework and found that the “the U.S. experience does not
indicate a close relationship between money and non-financial economic activity.” Their
key finding that “there is no evidence to show that fluctuations in money contain any
information about subsequent movements in income or prices” is the hypothesis we wish
to reexamine in light of our new information concerning the amounts of currency
circulating abroad.
Feige (1994) suggested that “if a sizable and variable fraction of currency is held
abroad, reliance on conventional monetary aggregates which include total currency in
circulation would be misleading. The appropriate monetary aggregates to monitor would
be the domestic monetary base and the domestic money supply rather than the total
monetary base and the total money supply.” Aksoy and Piskorski (2006) recently
provided partial evidence to support this conjecture. They reexamined the Friedman
Kuttner (1992) results employing earlier estimates of the domestic currency supply and
found that „currency corrected for foreign holdings has increased marginal predictive
content for U.S. inflation and real output relative to standard unadjusted money series.”
Employing the same autoregressive specification for real output changes and inflation as
used by Friedman and Kuttner (1992) and Aksoy and Piskorski (2006), we compare the
results of Granger causality relationships between the newly revised domestic monetary
aggregates and output and inflation and those based on conventional monetary
aggregates.
Empirical consideration of whether monetary aggregates can usefully play a role
in monetary policy depends upon whether they help to predict future fluctuations in real
income or prices that are not already predictable on the basis of fluctuations of income
itself or price fluctuations. We therefore examine -square tests of the null hypothesis
that all of the coefficients on the lagged growth of various monetary aggregates are zero
in autoregressions of the form:
1) tt
i
i
i
tiit
i
it vmpyy
1
4
1
4
1
1
4
1
2) tt
i
it
i
it
i
it vmypp
1
4
1
1
4
1
1
4
1
23
where Δy, Δp, and Δm are respectively, the quarterly growth rates of real output, inflation
and alternative monetary aggregates.25
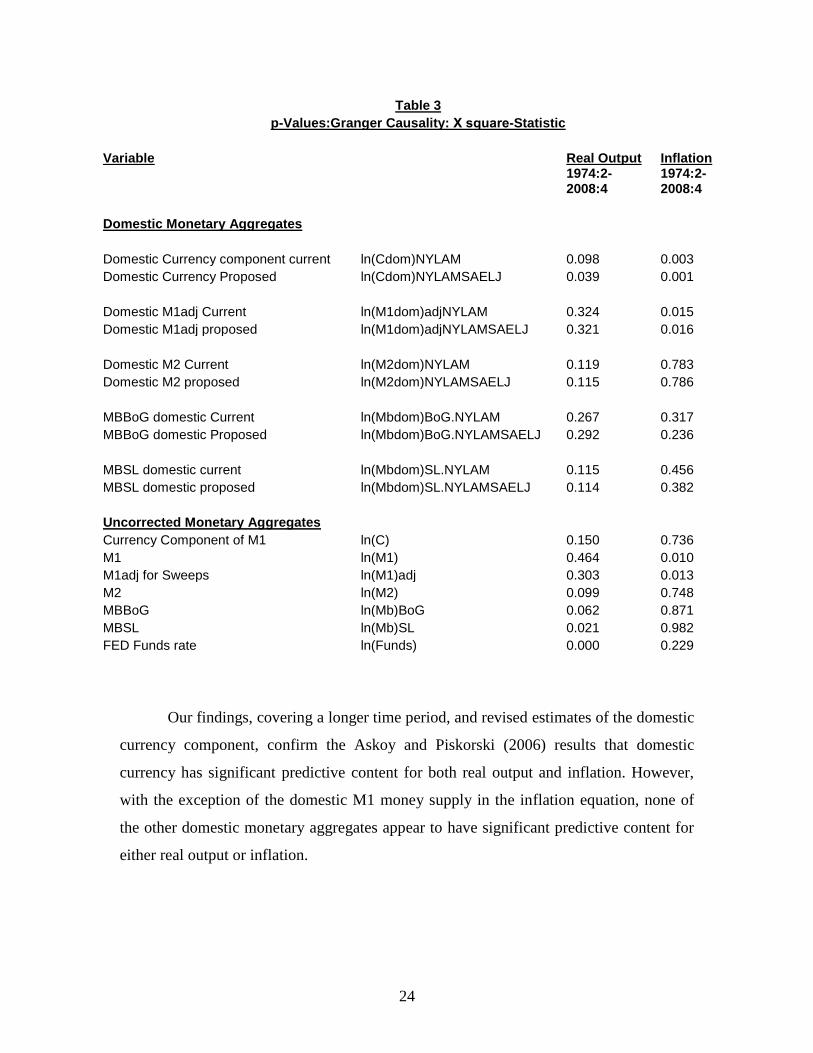
Table 3 presents the p-values of the Granger causality -square statistics
computed with White (1980) heteroskedasticity consistent standard errors. The null
hypothesis is that all coefficients on the lagged financial variables, considered
individually in the autoregressive specifications, are zero. Table 3 is similar to the
presentation in Aksoy and Piskorski (2006) who used the earlier estimates of domestic
currency based on the NYLA proxy for foreign holdings described in Section 2 above.
Our estimates of domestic currency holdings are derived from the newly revised
official BEA/FED estimates of foreign holdings based on the NYLAM proxy, and on our
proposed NYLAMSAELJ proxy. Additionally, we examine estimates of the M1, M2, and
MB aggregates corrected for alternative estimates of domestic currency holdings.
Table 3 reveals that in the real output equations, the only variables significant at
the 5 percent level are the Fed Funds rate, the St. Louis monetary base and the proposed
domestic currency component. At the 10 percent level we find that the conventional
Board of Governors monetary base, the M2 monetary aggregate and the current estimate
of domestic currency component are significant. We find no significant predictive content
for either the conventional narrow monetary aggregates or the domestic monetary
aggregates other than the currency component.
The conclusions are quite different for the inflation equations. At the 5 percent
significance level we find that the domestic currency component and both the
conventional and domestic narrow money supply aggregates are significant. However,
none of the other conventional monetary aggregates, (M2 and monetary base) nor the
domestic M2 and base aggregates have significant predictive content for inflation.
25
Real output is measured by real GDP; inflation by the GDP deflator and the monetary aggregates are
respectively, C = Currency component of M1, M1= the M1 money supply; M2= M2 money supply; MbSL =
the St. Louis Federal Reserve monetary base; MbBoG =Board of Governors Monetary base; Cdom = domestic
currency; M1dom = domestic M1 money supply; M2dom = domestic M2 money supply; Mbdom = domestic
monetary base.
24
Table 3
p-Values:Granger Causality: Χ square-Statistic
Variable Real Output Inflation
1974:2-2008:4
1974:2-2008:4
Domestic Monetary Aggregates
Domestic Currency component current ln(Cdom)NYLAM 0.098 0.003
Domestic Currency Proposed ln(Cdom)NYLAMSAELJ 0.039 0.001
Domestic M1adj Current ln(M1dom)adjNYLAM 0.324 0.015
Domestic M1adj proposed ln(M1dom)adjNYLAMSAELJ 0.321 0.016
Domestic M2 Current ln(M2dom)NYLAM 0.119 0.783
Domestic M2 proposed ln(M2dom)NYLAMSAELJ 0.115 0.786
MBBoG domestic Current ln(Mbdom)BoG.NYLAM 0.267 0.317
MBBoG domestic Proposed ln(Mbdom)BoG.NYLAMSAELJ 0.292 0.236
MBSL domestic current ln(Mbdom)SL.NYLAM 0.115 0.456
MBSL domestic proposed ln(Mbdom)SL.NYLAMSAELJ 0.114 0.382
Uncorrected Monetary Aggregates
Currency Component of M1 ln(C) 0.150 0.736
M1 ln(M1) 0.464 0.010
M1adj for Sweeps ln(M1)adj 0.303 0.013
M2 ln(M2) 0.099 0.748
MBBoG ln(Mb)BoG 0.062 0.871
MBSL ln(Mb)SL 0.021 0.982
FED Funds rate ln(Funds) 0.000 0.229
Our findings, covering a longer time period, and revised estimates of the domestic
currency component, confirm the Askoy and Piskorski (2006) results that domestic
currency has significant predictive content for both real output and inflation. However,
with the exception of the domestic M1 money supply in the inflation equation, none of
the other domestic monetary aggregates appear to have significant predictive content for
either real output or inflation.
25
7) Implications for the Unreported Economy and the Tax Gap
The foregoing estimates of the domestic currency supply are now employed to
generate a time series estimates of the relative size of the unreported economy which
reflects tax evasion activity in the U.S. We focus our discussion on the estimation of
“unreported income” (Yu), namely the difference between the total amount of income
that should be reported to the tax authority (YT) (under full compliance with the tax code)
and the amount actually reported (Yo), namely, adjusted gross income (AGI). The most
common method for estimating the relative size of the unreported economy relies on
some variant of the general currency ratio (GCR) model described in Feige (1986; 1989).
The most restrictive specifications of the currency ratio model [Cagan (1958),
Gutmann (1977)] assume that currency is the exclusive medium of exchange for
unreported transactions, that the ratio of currency to checkable deposits remains constant
except for changes induced by the growth of unreported income and that the amount of
unreported income produced by a dollar of currency transacted in the unreported sector is
the same as the amount of reported income produced by a dollar of currency transacted in
the reported economy. In order to obtain a benchmark estimate of the size of the
unreported sector, the restrictive model also assumes that in some benchmark year
(1940), unreported income is zero.26
As described in greater detail in Cebula and Feige (2012), we refine the restrictive
GCR model by relaxing some of its key assumptions. First we substitute our estimate of
domestic currency in circulation (Cdom) for the total amount of currency in circulation (C)
since currency held abroad does not reflect tax evasion activity in the U.S. Second we
account for a major technological innovation in the financial industry (the introduction of
sweep accounts) which reduced the volume of “checkable deposits” (D) in a manner
totally unrelated to behavior in the unreported economy.
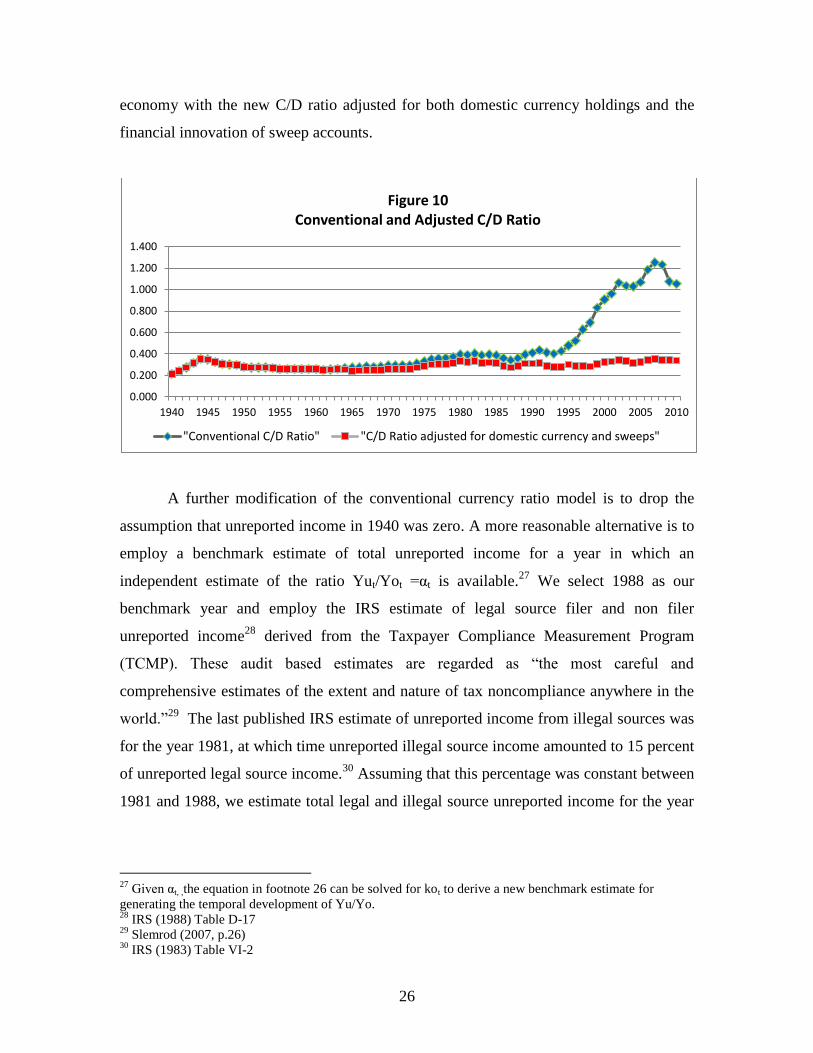
Figure 10 displays the effects of these two adjustments by comparing the
conventional C/D ratio employed in many published estimates of the “underground”
26
As described in Feige (1989) and Cebula and Feige (2012) these restrictions imply that the ratio of
unreported income (Yu) to reported income( Yo) can be estimated as follows:
Yu/Yo =(C-koD)/ (ko+1) D: where C = Currency, D= Checkable deposits and ko= (Co/Do), the currency
deposit ratio in the official economy which is observed in the year (1940) when the underground economy
is assumed to be zero.
26
economy with the new C/D ratio adjusted for both domestic currency holdings and the
financial innovation of sweep accounts.
A further modification of the conventional currency ratio model is to drop the
assumption that unreported income in 1940 was zero. A more reasonable alternative is to
employ a benchmark estimate of total unreported income for a year in which an
independent estimate of the ratio Yut/Yot =αt is available.27
We select 1988 as our
benchmark year and employ the IRS estimate of legal source filer and non filer
unreported income28
derived from the Taxpayer Compliance Measurement Program
(TCMP). These audit based estimates are regarded as “the most careful and
comprehensive estimates of the extent and nature of tax noncompliance anywhere in the
world.”29
The last published IRS estimate of unreported income from illegal sources was
for the year 1981, at which time unreported illegal source income amounted to 15 percent
of unreported legal source income.30
Assuming that this percentage was constant between
1981 and 1988, we estimate total legal and illegal source unreported income for the year
27
Given αt, ,the equation in footnote 26 can be solved for kot to derive a new benchmark estimate for
generating the temporal development of Yu/Yo. 28
IRS (1988) Table D-17 29
Slemrod (2007, p.26) 30
IRS (1983) Table VI-2
0.000
0.200
0.400
0.600
0.800
1.000
1.200
1.400
1940 1945 1950 1955 1960 1965 1970 1975 1980 1985 1990 1995 2000 2005 2010
Figure 10 Conventional and Adjusted C/D Ratio
"Conventional C/D Ratio" "C/D Ratio adjusted for domestic currency and sweeps"
27
1988 and use the ratio of total unreported income to reported AGI as our new benchmark
measure of the relative magnitude of tax evasion in 1988.
A final refinement of the GCR model is to relax the assumption that currency is
the exclusive medium of exchange for transactions involving tax evasion. Income from
interest and dividend payments, state tax refunds, capital gains, taxable unemployment
benefits, pensions and annuities, estates and trusts and social security payments is
typically paid by check. According to the 1988 TCMP audits, the sum of unreported filer
income from all of these sources amounted to eighteen percent of total unreported filer
income. 31
If twenty percent of unreported income is paid by check and the remaining
eighty percent paid by cash, the ratio of currency to deposits the unreported economy
(ku) = 4.
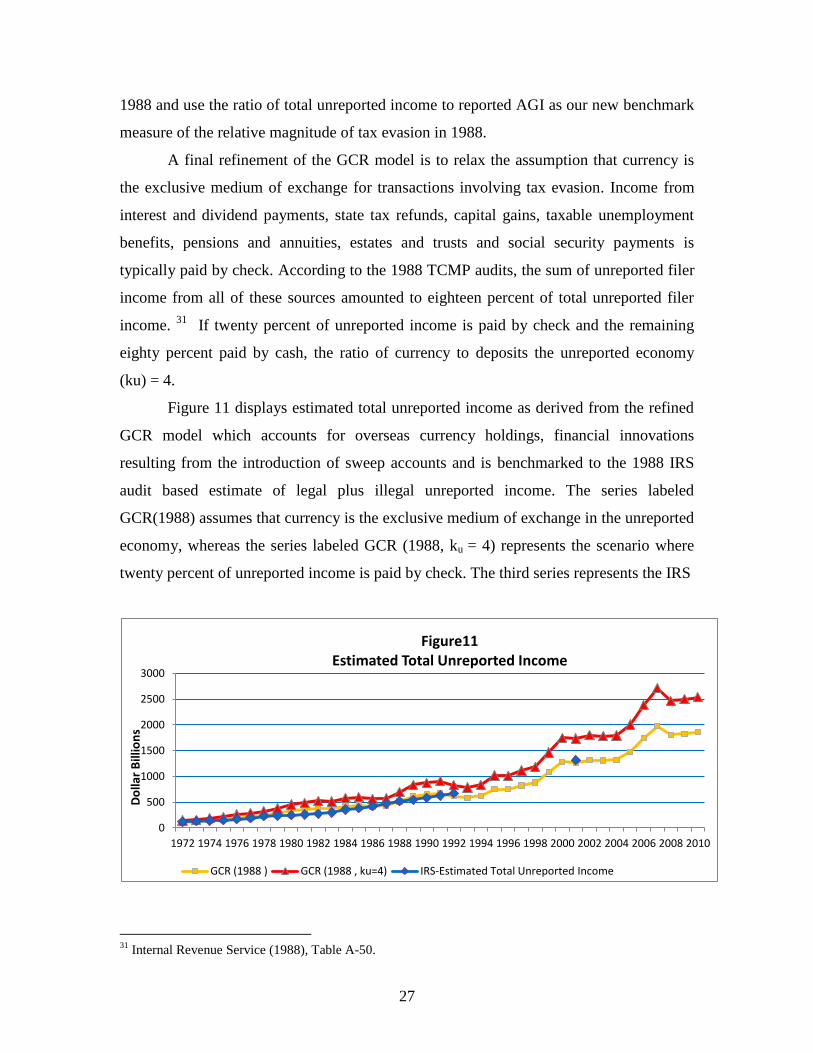
Figure 11 displays estimated total unreported income as derived from the refined
GCR model which accounts for overseas currency holdings, financial innovations
resulting from the introduction of sweep accounts and is benchmarked to the 1988 IRS
audit based estimate of legal plus illegal unreported income. The series labeled
GCR(1988) assumes that currency is the exclusive medium of exchange in the unreported
economy, whereas the series labeled GCR (1988, ku = 4) represents the scenario where
twenty percent of unreported income is paid by check. The third series represents the IRS
31
Internal Revenue Service (1988), Table A-50.
0
500
1000
1500
2000
2500
3000
1972 1974 1976 1978 1980 1982 1984 1986 1988 1990 1992 1994 1996 1998 2000 2002 2004 2006 2008 2010
Do
llar
Bill
ion
s
Figure11 Estimated Total Unreported Income
GCR (1988 ) GCR (1988 , ku=4) IRS-Estimated Total Unreported Income
28
estimate of total unreported income for those years for which projections of earlier audit
based estimates are published.32
Unreported income appears to have risen steadily over
the past four decades, peaking in 2007. The GCR models suggest that by 2010, total
unreported income amounted to $1.9 -2.4 trillion, giving rise to a tax gap of roughly
$400-$550 billion. While these estimates relax several of the key assumptions usually
associated with the currency demand approach, they remain quite sensitive to alternative
specifying assumptions.
8) Summary and Conclusions
Financial innovations have created major substitutes for currency, yet per capita
holdings of U.S. currency in circulation outside of the banking system amount to $2950.
American households and businesses admit to holding less than 15 percent of this huge
stock of U.S. currency, giving rise to what has been called the “currency enigma”. Two
complementary hypotheses have been advanced to explain the whereabouts of the
remaining 85 percent of the currency supply.
Some fraction of the currency is believed to be held abroad in nations whose
citizens and businesses feel it prudent to employ U.S. currency as a substitute for their
own national currencies as both a medium of exchange and as a store of value. Evidence
has been brought to bear (Table 2) that extensive “dollarization” occurred, primarily in
Russia, Argentina and China, but the percentage of the U.S. currency supply believed to
be held abroad remains in dispute. Porter and Judson (1996) suggested that at its peak in
1995 as much as 70 percent of the nation‟s stock of $100 bills were held abroad and
concluded that the percentage of currency overseas was between 55 and 70 percent. The
notion that between half and two thirds of U.S. currency is held abroad is widely
reiterated in the press, by the U.S. Treasury and in Federal Reserve publications despite
the fact that since 2008, the official Federal Reserve Flow of Funds (FOF) statistics and
the U.S Bureau of Economic Analysis (BEA) places the percentage abroad between 36-
37 percent. We have proposed an alternative proxy measure which includes net currency
32
The1972-92 estimates are derived from IRS (1988) Appendix D adjusted for illegal income IRS (1983)
assumed to be a constant proportion of legal source income. The data point for 2001 is based on the IRS
estimated tax gap due to underreporting (adjusted for illegal underreporting), divided by the 2001 NBER
estimated marginal tax rate.
29
outflows from several additional U.S. southern border Federal Reserve branch banks.
This alternative estimate suggests that only 30 percent of U.S. currency is presently held
abroad.
The official Federal Reserve/ BEA measures of overseas currency are proxy
based surrogates for the “confidential” New York Federal Reserve Bank data (NYB)
pertaining to wholesale bulk currency shipments abroad. Indeed, the yet to be fully
disclosed, (NYB) data33
suggests that the percent of currency abroad may be substantially
lower than the current (FOF/BEA) estimate and implies that the demand for U.S. dollars
has declined quite precipitously during the past decade. Hopefully, the New York Federal
Reserve will make these important data concerning overseas currency flows readily
available, so that researchers can more accurately determine both the amount of currency
abroad and its likely location. Aggregation procedures are available that can satisfy
confidentiality requirements without compromising the information content of this
important data source.
Taking the current official FOF/BEA data at face value implies that seigniorage
earnings from abroad are considerably smaller than is usually presumed and that the
demand for dollars from abroad has declined relative to the domestic demand for U.S.
currency. Domestic per capita holdings of U.S. currency are now roughly $1900 and the
overwhelming portion of these holdings are in the form of $100 bills that are used both as
a store of value and as a medium of exchange. The dramatic growth in real per capita
domestic currency holdings flies in the face of widespread predictions of the emergence
of a “cashless” society. One partial explanation (Jankowski et. al., 2007) for the increase
in domestic currency demand is the rapid growth in the number of Latin American
immigrants who encounter barriers to participation in the mainstream financial system.
Domestic currency is also known to be the preferred medium of exchange for
transactions that individuals and businesses wish to conceal. Such transactions include:
the production and distribution of illegal goods (drugs) and services (prostitution); and
incomes earned that are not reported to the fiscal authority in order to evade taxes. In
order to examine this “underground” economy hypothesis, we employ a modified
33
The data in question are displayed in Figure 1 of Hellerstein and Ryan (2011) but to date; researchers
have been denied access to the underlying data, despite the fact that these highly aggregated data eliminate
any concerns of confidentiality.
30
currency ratio model to estimate both the volume of “unreported income” and the “tax
gap” resulting from this underreporting. Our findings suggest that by 2010, unreported
income amounted to $1.9-$2.4 trillion resulting in a “tax gap” ranging from $400 to $550
billion per year. Currently, we estimate that 18-24 percent of total reportable income is
not properly reported to the IRS. Despite several key refinements of the traditional
currency ratio models, these estimates remain highly sensitive to alternative
specifications34
and estimates of overseas cash holdings.
Given the revised estimates of overseas currency holdings, we reexamine the
relationship between monetary aggregates and output and inflation. Particular interest
centers on the question of whether new estimates of domestic currency holdings and of
domestic monetary aggregates have better predictive power in explaining output and
price fluctuations than do conventional monetary aggregates that take no account of
overseas currency holdings. Following the specifications of Friedman and Kuttner (1992)
we confirm the limited findings of Aksoy and Piskorsky (2006) that the revised domestic
currency component has significant predictive power for real output and inflation.
However, with the exception of the domestic M1 money supply in the inflation equation,
none of the other domestic monetary aggregates appear to have significant predictive
content for either real output or inflation. Thus, with the surprising exception of the
domestic currency component, it appears that adjusting the conventional monetary
aggregates to reflect only the domestic money supply does not significantly improve the
predictive power of these aggregates in forecasting future real output or price
fluctuations.
34
Cebula and Feige (2012) show that estimates of unreported income will increase if allowance is made for
the likelihood that the income velocity of unreported income exceeds that of reported income, and if the
secular rise of plastic payment mechanisms which substitute for cash usage are taken into account.
31
References:
Anderson, 1977, P. Anderson, Currency in use and in hoards, New England Economic
Review, Federal Reserve Bank of Boston, (1977), pp. 21-30.
Anderson and Rasche, 1997, R.G. Anderson and R.H. Rasche, Construction of an
estimated domestic monetary base using new estimates of foreign holdings of U.S.
currency, Federal Reserve Bank of St. Louis Working paper 019A, (1997), pp. 1-50.
Askoy and Piskorski, Y. 2006 Y. Askoy and T. Piskorski, U.S. domestic money, inflation
and output, Journal of Monetary Economics, 53(2), (2006), pp.183-197.
Avery, et.al. , 1986, R.B. Avery, G.E. Elliehausen, A.B. Kinneckell and P. A. Spindt, The
use of cash and transaction accounts by American families, Federal Reserve Bulletin, 72
(1986) pp. 87-108.
Avery, et.al. , 1987, R.B. Avery, G.E. Elliehausen, A.B. Kinneckell and P. A Spindt,
Changes in the use of transaction accounts and cash from 1984 to 1986, Federal Reserve
Bulletin, 73 (1987) pp. 179-196.
Bach, 1997, C.L. Bach, U.S. International transactions, revised estimates for 1974-96,
Survey of Current Business, 77(7) (1997), pp. 43-55
Bureau of Economic Analysis, 2008, News release, June, 17, 2008, pp. 1-7.
Cagan, 1958, P. Cagan, The demand for currency relative to total money supply, Journal
of Political Economy, 66 (1958) pp.303-328.
Cebula and Feige, 2012, R. Cebula and E.L. Feige, America‟s Unreported Economy:
Measuring the Size, Growth and Determinants of Income Tax Evasion in the U.S., Crime,
Law and Social Change. April, 2012
32
Doyle, 2000, B. M. Doyle, Here dollars, dollars-Estimating currency demand and
worldwide currency substitution, International Finance Working Paper No. 657, January
2000.
Feige and Watts, 1972, E. L. Feige and H.W. Watts, An Investigation of the
Consequences of Partial Aggregation of Micro-Economic Data. Econometrica,
Econometric Society, 40(2), pp. 343-60,
Feige and Pearce 1979, E.L. Feige and D. Pearce, The casual causal relationship between
money and income: Some caveats for time series analysis, The Review of Economics and
Statistics, 61(4) (1979) pp. 521-533.
Feige, 1986 , E.L. Feige, A Re-examination of the “Underground Economy in the United
States: A Comment on Tanzi,” Staff Papers, International Monetary Fund 33(4) pp. 768-81.
Feige, 1989, E.L. Feige (ed.) The underground economies: tax evasion and information
distortion. Cambridge University Press. (1989)
Feige, 1989a, E.L. Feige, Currency velocity and cash payments in the U.S. Economy:
The Currency Enigma, http://ideas.repec.org/p/pra/mprapa/13807.html.
Feige, 1994, E.L. Feige, The underground economy and the currency enigma, Public
Finance, 49, (1994) pp.119-139. Reprinted in G. Fiorentini and S Zamagni (ed.) The
economics of corruption and illegal markets, International Library of Critical Writings in
Economics, Elgar (1999), pp. 23-40)
Feige, 1996, E.L. Feige, Overseas holdings of U.S. currency and the underground
economy, in Pozo (ed.) Exploring the underground economy: studies of illegal and
unreported activity, Kalamazoo, Mich. W.E Upjohn Institute for Employment and
Research, (1966), pp. 5-62.

33
Feige, 1997, E.L. Feige, Revised estimates of the underground economy: Implications of
U.S. currency held abroad, in O. Lippert and M. Walker (ed.) The Underground
economy: Global evidence of its size and impact. (1997), pp.151-208.
Feige et. al. 2003, E.L. Feige, M. Faulend, V. Sonje and V. Sosic, Unofficial dollarization
in Latin America: Currency substitution, network externalities and irreversibility, in D.
Salvatore, J.W. Dean and T.D. Willett (ed.) The Dollarization debate, Oxford university
press, (2003), pp.46-71.
Feige and Dean, 2004, E.L. Feige and J.W. Dean, Dollarization and Euroization in
transition countries: Currency substitution, asset substitution, network externalities and
irreversibility, in V. Alexander, J. Melitz and G.M. von Furstenberg (ed.), Monetary
Unions and hard pegs: Effects on trade, Financial development, and stability, Oxford
University Press, (2004) pp. 303-319.
Friedman and Kuttner, 1992 B.M Friedman and K.N. Kuttner, Money, income, prices
and interest rates, American Economic Review 82 (1992), pp. 472-492.
Goldberg, 2010, L. S. Goldberg, Is the International Role of the Dollar Changing?
Federal Reserve Bank Of New York, Current Issues in Economics and Finance, 16(1)
(2010) pp.1-7.
Gutmann, 1977, P. Gutmann, The subterranean economy, Financial Analysts Journal, 33
(1977) pp. 24-27.
Hellerstein and Ryan, 2011, R. Hellerstein and W. Ryan, Cash Dollars Abroad, Federal
Reserve Bank of New York Staff Report no. 400. February, 2011.
Internal Revenue Service, 1983, Income tax compliance research, Estimates for 1973-
1981, Research Division, July, 1983.
34
Internal Revenue Service, 1988, Income tax compliance research, Supporting Appendices
to Publication 7285, Publication 1415, 1988.
Jankowski et. al. 2007, C. Jankowski, R.D. Porter and T. Rice, Against the tide-Currency
use among Latin American immigrants in Chicago, Federal Reserve Bank of Chicago,
Economic Perspectives, 31(2) (2007) pp. 2-21.
Judson and Porter, 2010, R.A. Judson and R.D. Porter, Estimating the Volume of
Counterfeit U.S. Currency in Circulation Worldwide: Data and Extrapolation, Federal
Reserve Bank of Chicago Policy Discussion Papers Series, PDP 2010-2. March 1, 2010
Pasley, 2005, R. Pasley, Recent Developments in Bank Secrecy Act Enforcement, North
Carolina Banking Institute, 9 pp.61-102.
Porter and Judson, 1996, R.D. Porter and R.A. Judson, The location of U.S. currency:
How much is abroad? Federal Reserve Bulletin 82 (1996), pp. 883-903.
Sims, 1972, C. A. Sims, Money, income and causality, American Economic Review, 62,
(1972), pp. 540-552
.
Slemrod, 2007, J. Slemrod, The Economics of Tax Evasion, The Journal of Economic
Perspectives, Vol 21,(1) Winter (2007) pp. 25-48.
Sprenkle, 1993, C.M. Sprenkle, The case of the missing currency, The Journal of
Economic Perspectives, 7(4) (1993), pp. 175-184.
Summer, 1990, S.B. Summer, The transactions and hoarding demand for currency,
Quarterly Review of Economics and Business, 30 (1990), pp. 75-89.
35
United States Treasury Department, 2006, United States Treasury Department, 2006, The
use and counterfeiting of United States Currency Abroad, Part 3, January (2006).
White, 1980, H. White, A heteroskedasticity-consistent covariance matrix and a direct
test for heteroskedasticity, Econometrica, 48 (1980) pp.817-838.