tenant outlook report (fall 2012)
TRANSCRIPT

FALL 2012 | OFFICE | TENANT ADVISORY SERVICES
Steady office demand with uncertainties on the horizon MARKET OVERVIEW Demand in the San Diego County office market recorded over 205,000 SF of positive net absorption in the third quarter. Much of the demand was driven by larger tenants such as ServiceNow, The County of San Diego and Solar Turbines that signed leases in the prior quarters. With a 19% dip in leasing activity in Q3 we will expect a smaller positive net absorption by year-end. San Diego County’s unemployment rate measured 9.0% in August, with California’s unemployment rate at 10.4%. The combined industry sectors of “Professional and Business Services” and “Financial Activities” – the two predominant office-utilizing employment sectors – posted a combined gain of 8,900 jobs. However, we should expect small increases in the months ahead as several companies are scaling back their head counts in anticipation of the upcoming elections. YTD we have had steady employment growth, primarily from Technology, Life Sciences, and Healthcare. Unexpected growth has occurred within the Craft Brewery industry which has become one of the most recognized beer communities in the country growing from 50 breweries to 70 in 2012 alone. However, there’s heated discussions on what will happen after January 2, 2013 with planned budget cuts in the Defense sector and the impact this will have on San Diego’s jobs and economy. Defense related firms are preparing for the worst and making adjustments to their business such as freezing any hiring and capital expenditures. A recent study compiled by National Association of Manufacturers is anticipating that California may lose up to 148,000 jobs in 2014 relating to cuts in defense spending. Furthermore with “sequestration” there could be drastic effects on the national and local employment and economy. Should this feared concept materialize, our government will implement $1.2 trillion budget cuts over 10 years with $500 billion occurring from defense cuts. With about 25% of all San Diego jobs tied to the military sector this will have an unbelievable impact on our local economy. NET ABSORPTION ANd VACANCY Class A contributed 64,000 SF of the 205,000 SF absorbed in Q3. YTD absorption is 487,000 SF with 414,000 SF in Class A. Class B office space experienced 157,000 SF of positive absorption in Q3 bringing the YTD total to 63,000 SF YTD. Class B activity has been driven by a recent increase in demand by smaller tenants. The increase in absorption by smaller tenants noted over the last three quarter will likely continue throughout the remainder of the year. With a 9% decrease in the total number of executed leases in Q3 compared to Q2, activity should be comparable during the last quarter. Economic and election uncertainty has kept many tenants, users and investors on the sidelines waiting to make any substantial real estate decisions. The top office markets with positive net positive absorption in Q3 include UTC posting 101,000 SF and Downtown San Diego (CBD) with 37,000 SF net absorption. Overall net absorption for the suburban submarkets totaled 169,000 SF with 51,000 SF concentrated in Class A space and 124,000 SF for Class B. Class C for all markets compiled a negative 15,000 SF. The countywide average asking rental rate for all classes bottomed out in 2011. With consistent absorption and declining vacancy rates, the majority of the Class A office markets are experiencing rising rental rates and diminishing concessions. The markets with the highest Class A office monthly rental rates include Carmel Valley ($3.20 psf + E) and UTC ($2.95 psf FS). The countywide average asking rental rate for all classes bottomed out in 2011. With consistent absorption and declining vacancy rates, the majority of the Class A office markets are experiencing rising rental rates and diminishing concessions. The markets with the highest Class A office monthly rental rates include Carmel Valley ($3.20 psf + E) and UTC ($2.95 psf FS). Ten of the last 11 quarters have posted positive net absorption, culminating in a countywide total vacancy rate that has dropped to 14.7% in Q3 2012. The countywide total vacancy is comprised of 14.2% direct vacancy and 0.6% sublease vacancy. With the continued demand we are expecting the overall vacancy rate to drop to approximately 14.5% by year-end 2012
VACANCY BY CLASS Q3 2012 Q2 2012 CHANGE
CLASS A 12.78% 12.99%
CLASS B 17.34% 17.78%
CLASS C 12.60% 12.51%
OFFICE VACANCY RATESQ3 2012
0%
2%
4%
6%
8%
10%
12%
14%
16%
18%
20%
-1.0
-0.5
0.0
0.5
1.0
1.5
2.0
2.5
3.0
2001 2002 2003 2004 2005 2006 2007 2008 2009 2010 2011 2012Q3
Vaca
ncy
Rate
SF (M
illio
ns)
Net Absorption New Supply Vacancy
NEW SUPPLY, ABSORPTION AND VACANCY RATES
17.7%
11.3%
12.8%
20.1%
14.0%
14.7%
0% 5% 10% 15% 20% 25%
Downtown
Suburban
S.D. County
All Classes Class A
OFFICE VACANCY RATES Q3 2012
61.8%
28.3% 6.6% 0.9%
2.4% <= 2,000 SF [336]
2,001 - 5,000 SF [154]
5,001 - 10,000 SF [36]
10,001 - 20,000 SF [5]
>= 20,001 SF [13]
OFFICE LEASING ACTIVITY BY TENANT SIZE Percentage of Total Leases Completed in Q3 2012
$2.00$2.10$2.20$2.30$2.40$2.50$2.60$2.70$2.80$2.90$3.00$3.10$3.20$3.30
Q307
Q407
Q108
Q208
Q308
Q408
Q109
Q209
Q309
Q409
Q110
Q210
Q310
Q410
Q111
Q211
Q311
Q411
Q112
Q212
Q312
$ /
SF /
Mon
th (F
S)
Class A All Classes
HISTORICAL RENTAL RATE TRENDS Class A & Overall Office Rates Quarterly Average Asking Rate Per SF Per Month (Full Service)
Colliers International | Accelerating success. | www.colliersTAS.com
VACANCY BY SPACE TYPE Q3 2012 Q2 2012 CHANGE
dIRECT 14.17% 14.37%
SUBLEASE 0.55% 0.61%
TOTAL 14.73% 14.98%
TENANT OUTLOOK REPORTSAN dIEGO COUNTY
COLLIERS INTERNATIONAL | P. 2
TENANT OUTLOOK REPORT | FALL 2012 | OFFICE | SAN DIEGO COUNTY
Average rental rates are defined as the average asking monthly rate per square foot normalized to a “full service gross” basis.
Colliers International | Accelerating success. | www.colliersTAS.com
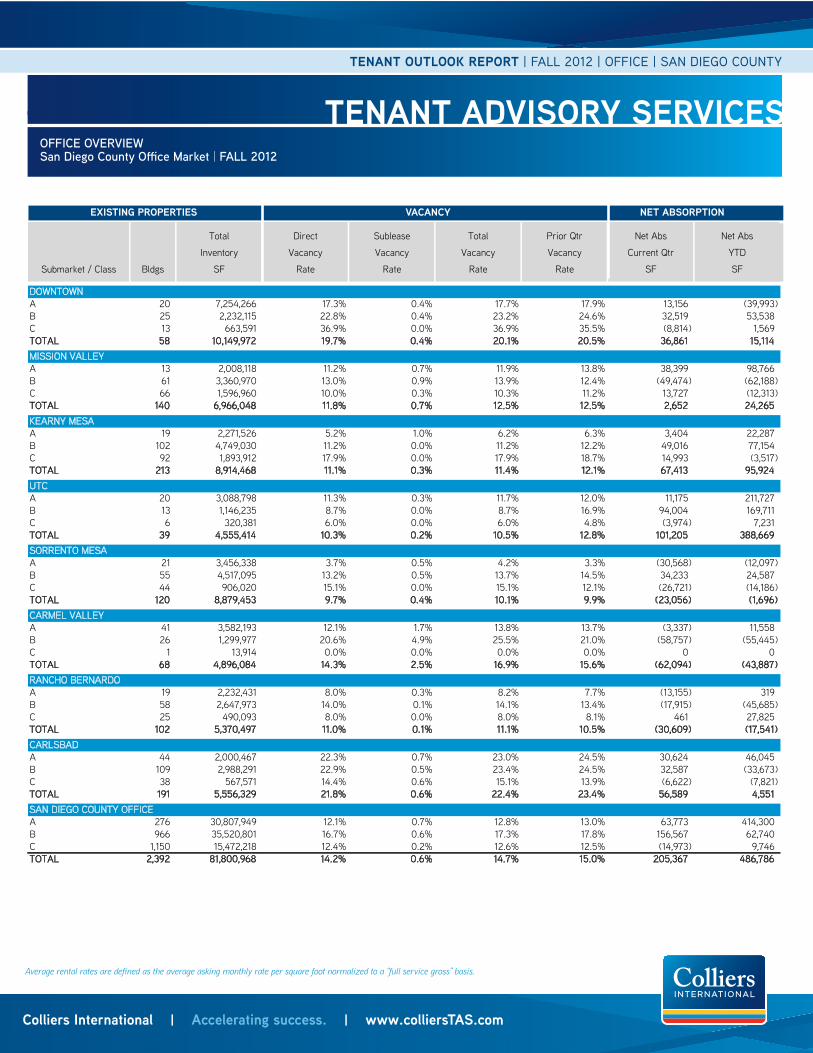
TENANT ADVISORY SERVICESOFFICE OVERVIEWSan Diego County Office Market | FALL 2012
Submarket / Class Bldgs
Total
Inventory
SF
Direct
Vacancy
Rate
Sublease
Vacancy
Rate
Total
Vacancy
Rate
Prior Qtr
Vacancy
Rate
Net Abs
Current Qtr
SF
Net Abs
YTD
SF
DOWNTOWNA 20 7,254,266 17.3% 0.4% 17.7% 17.9% 13,156 (39,993)B 25 2,232,115 22.8% 0.4% 23.2% 24.6% 32,519 53,538C 13 663,591 36.9% 0.0% 36.9% 35.5% (8,814) 1,569TOTAL 58 10,149,972 19.7% 0.4% 20.1% 20.5% 36,861 15,114MISSION VALLEYA 13 2,008,118 11.2% 0.7% 11.9% 13.8% 38,399 98,766B 61 3,360,970 13.0% 0.9% 13.9% 12.4% (49,474) (62,188)C 66 1,596,960 10.0% 0.3% 10.3% 11.2% 13,727 (12,313)TOTAL 140 6,966,048 11.8% 0.7% 12.5% 12.5% 2,652 24,265KEARNY MESAA 19 2,271,526 5.2% 1.0% 6.2% 6.3% 3,404 22,287B 102 4,749,030 11.2% 0.0% 11.2% 12.2% 49,016 77,154C 92 1,893,912 17.9% 0.0% 17.9% 18.7% 14,993 (3,517)TOTAL 213 8,914,468 11.1% 0.3% 11.4% 12.1% 67,413 95,924UTCA 20 3,088,798 11.3% 0.3% 11.7% 12.0% 11,175 211,727B 13 1,146,235 8.7% 0.0% 8.7% 16.9% 94,004 169,711C 6 320,381 6.0% 0.0% 6.0% 4.8% (3,974) 7,231TOTAL 39 4,555,414 10.3% 0.2% 10.5% 12.8% 101,205 388,669SORRENTO MESAA 21 3,456,338 3.7% 0.5% 4.2% 3.3% (30,568) (12,097)B 55 4,517,095 13.2% 0.5% 13.7% 14.5% 34,233 24,587C 44 906,020 15.1% 0.0% 15.1% 12.1% (26,721) (14,186)TOTAL 120 8,879,453 9.7% 0.4% 10.1% 9.9% (23,056) (1,696)CARMEL VALLEYA 41 3,582,193 12.1% 1.7% 13.8% 13.7% (3,337) 11,558B 26 1,299,977 20.6% 4.9% 25.5% 21.0% (58,757) (55,445)C 1 13,914 0.0% 0.0% 0.0% 0.0% 0 0TOTAL 68 4,896,084 14.3% 2.5% 16.9% 15.6% (62,094) (43,887)RANCHO BERNARDOA 19 2,232,431 8.0% 0.3% 8.2% 7.7% (13,155) 319B 58 2,647,973 14.0% 0.1% 14.1% 13.4% (17,915) (45,685)C 25 490,093 8.0% 0.0% 8.0% 8.1% 461 27,825TOTAL 102 5,370,497 11.0% 0.1% 11.1% 10.5% (30,609) (17,541)CARLSBADA 44 2,000,467 22.3% 0.7% 23.0% 24.5% 30,624 46,045B 109 2,988,291 22.9% 0.5% 23.4% 24.5% 32,587 (33,673)C 38 567,571 14.4% 0.6% 15.1% 13.9% (6,622) (7,821)TOTAL 191 5,556,329 21.8% 0.6% 22.4% 23.4% 56,589 4,551SAN DIEGO COUNTY OFFICEA 276 30,807,949 12.1% 0.7% 12.8% 13.0% 63,773 414,300B 966 35,520,801 16.7% 0.6% 17.3% 17.8% 156,567 62,740C 1,150 15,472,218 12.4% 0.2% 12.6% 12.5% (14,973) 9,746TOTAL 2,392 81,800,968 14.2% 0.6% 14.7% 15.0% 205,367 486,786
San Diego County Office Market�
VACANCY NET ABSORPTIONEXISTING PROPERTIES
OFFICE OVERVIEW
Q3 2012 EXISTING PROPERTIES VACANCY NET ABSORPTION

COLLIERS INTERNATIONAL 4660 La Jolla Village Drive, Suite 100 San Diego, CA 92122 | USA TEL +1 858.677.5363
522 offices in 62 countries on 6 continentsUnited States: 125Canada: 38Latin America: 18Asia Pacific: 214EMEA: 117
• $68 billion in annual revenue
• 1.25 billion square feet under management
• Over 12,300 professionals
This report has been prepared by Colliers International for general information only. Information contained herein has been obtained from sources deemed reliable and no representation is made as to the accuracy thereof. Colliers International does not guarantee, warrant or represent that the information contained in this document is correct. Any interested party should undertake their own inquiries as to the accuracy of the information. Colliers International excludes unequivocally all inferred or implied terms, conditions and warranties arising out of this document and excludes all liability for loss and damages arising there from.
Accelerating success.
TENANT OUTLOOK REPORT | FALL 2012 | OFFICE | SAN DIEGO COUNTY
www.colliersTAS.com
31.8
24.3
21.8
23.4
14.2
26.0
18.2
29.4
27.1
22.5
18.6
19.8
16.5
24.0
17.6
33.3
26.4
24.8
28.2
20.1
20.7
18.8
21.2
22.7
29.4
27.1
25.2
0
6
12
18
24
30
36
Downtown MissionValley
KearnyMesa
UTC SorrentoMesa
CarmelValley
RanchoBernardo
Carlsbad San DiegoCounty
Mon
ths
Class A Class B All Classes
OFFICE SPACE TIME-ON-THE-MARKET Average Months by Submarket and Class
Tenant Advisory Services
www.ColliersTAS.com
> Only represent tenants in their office lease and purchase negotiations
> Provide objective conflict-free advice with full service resources
> Increase profitability & mitigate risk
RON MILLER Senior Director Tenant Advisory Services 858.677.5363 LIC # 00874868
Ron Miller is a tenant advisory specialist. His expertise encompasses relocation / expansion / contraction strategies, lease renewal and restructuring, market analysis, and user purchase opportunities. With his extensive career experience in representing both tenants and landlords, Ron offers a unique perspective and valuable insight to his tenant clients.
TIME ON MARKET
Time-on-the-market for Class A office space is averaging 27.1 months countywide.
0%
2%
4%
6%
8%
10%
12%
14%
16%
18%
20%
-1.0
-0.5
0.0
0.5
1.0
1.5
2.0
2.5
3.0
2001 2002 2003 2004 2005 2006 2007 2008 2009 2010 2011 2012Q3
Vaca
ncy
Rate
SF (M
illio
ns)
Net Absorption New Supply Vacancy
NEW SUPPLY, ABSORPTION AND VACANCY RATES
17.7%
11.3%
12.8%
20.1%
14.0%
14.7%
0% 5% 10% 15% 20% 25%
Downtown
Suburban
S.D. County
All Classes Class A
OFFICE VACANCY RATES Q3 2012
61.8%
28.3% 6.6% 0.9%
2.4% <= 2,000 SF [336]
2,001 - 5,000 SF [154]
5,001 - 10,000 SF [36]
10,001 - 20,000 SF [5]
>= 20,001 SF [13]
OFFICE LEASING ACTIVITY BY TENANT SIZE Percentage of Total Leases Completed in Q3 2012
$2.00$2.10$2.20$2.30$2.40$2.50$2.60$2.70$2.80$2.90$3.00$3.10$3.20$3.30
Q307
Q407
Q108
Q208
Q308
Q408
Q109
Q209
Q309
Q409
Q110
Q210
Q310
Q410
Q111
Q211
Q311
Q411
Q112
Q212
Q312
$ /
SF /
Mon
th (F
S)
Class A All Classes
HISTORICAL RENTAL RATE TRENDS Class A & Overall Office Rates Quarterly Average Asking Rate Per SF Per Month (Full Service)
RENTAL RATES
For four years, the average asking rental rate in all office classes had been steadily decreasing decreased and bottomed out at $2.10/SF/month “full service gross” at the end of 2011. However, for the last three quarters, the average rate for all classes increased has remained level at $2.11/SF. The Class A rate of $2.58/SF had remained flat for the previous three quarters, but made a notable increase (+$0.05 to $2.63/SF) in Q2 and increased again in Q3 to $2.64/SF.
LEASING ACTIVITY
A total of 544 leases were completed in Q3 totaling 1.6 million square feet. This equated to a 9% decrease in lease transactions compared to the previous quarter. In terms of square footage, the drop in leasing equated to a 19% decrease over under Q2 but was a 5% improvement over Q1. Absorption is expected to be minimal – but positive – in Q4 based on the lower leasing activity levels in Q3.
www.ronmil lersd.com