ten-year forecasts of minnesota adult outdoor recreation...
TRANSCRIPT

Ten-year forecasts of Minnesotaadult outdoor recreation
participation, 2004 to 2014

Ten-year Forecasts of Minnesota Adult Outdoor Recreation Participation2
TEN-YEAR FORECASTS OF MINNESOTAADULT OUTDOOR RECREATION
PARTICIPATION, 2004 TO 2014
This study was funded by the Legislative Commission on Minnesota Resourceswith an allocation of Land and Water Conservation Funds
Report prepared by:
Tim KellyOffice of Management and Budget ServicesMinnesota Department of Natural Resources
July 2005
An electronic copy of this report can be found on the MN DNR’s website: www.dnr.state.mn.us;

3Minnesota Department of Natural Resources
CONTENTS
Topic
Summary . . . . . . . . . . . . . . . . . . . . . . . . . . . . . . . . . . . . . . . . . . . . . . . . . . .
Introduction . . . . . . . . . . . . . . . . . . . . . . . . . . . . . . . . . . . . . . . . . . . . . . . . .
Activity trend information and short-term forecastsInformation sources and analysis procedures . . . . . . . . . . . . . . . . . . . . . .Short-term forecasts . . . . . . . . . . . . . . . . . . . . . . . . . . . . . . . . . . . . . . . . .
Historical context for the short-term forecast results . . . . . . . . . . . . . . . . . . . .
References . . . . . . . . . . . . . . . . . . . . . . . . . . . . . . . . . . . . . . . . . . . . . . . . . . .
Appendix A: Information on activity trends and data analysis procedures for activity projections . . . . . . . . . . . . . . . . . . . . . .
Page
4
10
1218
23
32
34

Ten-year Forecasts of Minnesota Adult Outdoor Recreation Participation4
SUMMARY
INTRODUCTION
The most recent State Comprehensive Outdoor Recreation Plan identified the need to better under-stand the changing nature of outdoor recreation in Minnesota. To meet this need, four efforts wereoriginally planned. The first three of these are now complete, while the fourth will commenceonce funding is certain:
● determine the outdoor recreation patterns of adult Minnesotans.● analyze existing information sources to determine recent trends in recreation participation (e.g.,
trends in fishing licenses); these analyses will assist with short-term forecasting.● determine—from local-government recreation providers—the recreation facility and manage-
ment needs of cities, counties and school districts in the state.● determine the recreation facility and program needs of the general Minnesota population
directly from that population.
For all of these efforts, the intent is to design a cost-effective methodology that can be repeatedevery five years. Repetitions of the efforts will monitor the changing nature of outdoor recreationin Minnesota, and will create trend information that can be analyzed and applied in short-termrecreation forecasting. At this time, however, only the first iteration of the efforts exists, and, thus,the “intended” method for assessing trends and making short-term forecasts cannot be completedfor a number of years.
In the meantime, demands exist for short-term forecasts of recreation participation. The purpose ofthis document is to address the demand for short-term forecasts in the years prior to the next itera-tion of the preceding efforts. The document provides statewide ten-year forecasts of the outdoorrecreation participation patterns of adult Minnesotans. The forecasts are based on extrapolationsof available recreation activity trend information and population projections.
The available information on recreation activity trends is of mixed quality, and this will be directlyreflected in the quality of the results. The results are graded in terms of quality as they are pre-sented. The results should be understood to represent a “best shot” at short-term forecasts usingreadily available information. There are numerous assumptions that need to be made to performthe forecasts. General conclusions from the results are considered tentative.
This summary is organized as follows:● The first section describes the activity trend information and short-term forecasts. Included are
discussions of information sources, analysis procedures, and results.
● The next section presents the historical context for the short-term forecast results. Many of theshort-term activity forecasts—based on recent trends—point to decreasing recreation participa-tion. This would not always have been the conclusion reached in the past.
Funding for all of these efforts is from the Land and Water Conservation Fund, as allocated by theLegislative Commission on Minnesota Resources.

5Minnesota Department of Natural Resources
ACTIVITY TREND INFORMATION AND SHORT-TERM FORECASTS
Information sources and analysis procedures
The method used to forecast recreation is based on extrapolation of recent trends into the nearfuture. “Recent trends” are over the last ten years (or some period close to that) and the “nearfuture” is the next ten years. Each activity is done separately.
For each activity, a measure of the recent trend was identified. The trend measures fall into fourcategories: A—measures based on Minnesota-specific activity trend data; B—measures based onU.S. trend data closely related to target activity; C—measures based on U.S. trend data somewhatrelated to target activity; and D—no trend measures could be found, so short-term forecasts are notmade (see Table S-1). Category B and C measures are taken from the National Sporting GoodsAssociation (NSGA) annual survey of some 10,000 U.S. households.
When this study commenced, the plan was to have the category A activities as they are here, but tohave the category B, C and D activities come from a different data source. That different datasource was the National Survey of Recreation and the Environment (NSRE). Unfortunately, theNSRE data proved unreliable in two important tests that are available to evaluate recreation surveyquality; the two tests pertain to the ability to describe national hunting and fishing participationtrends. The NSRE trends compared so poorly with the reliable hunting and fishing trend informa-tion that this study concluded that it could not justify using NSRE for any activity trends.
To use the NSGA data for Minnesota, many assumptions are made. Given all these assumptions,and the inability to offer evidence as to the general reasonableness of some of the assumptions, theapproach here is to clearly label the source of the results, and ensure that all results are understoodas “tentative”. Even given their tentative nature, however, the results provide some valuableinsights into the changing nature of outdoor recreation in Minnesota.
Short-term forecasts
Using the preceding methods and information sources, ten-year forecasts were made for the activi-ties for which trend information was available. These forecast activities cover the bulk of adultMinnesotans annual outdoor recreation time in 2004 (83% of total recreation time). Those activi-ties with Minnesota-specific trend information cover just over one-third of total recreation time.
Most activities have decreasing activity participation rates in the ten-year projections (see first set ofcolumns in Table S-1). In the category A activities, which are based on Minnesota-specific trenddata, all of the activities have decreases in participation rates between 11 and 25 percent, exceptoffroad ATV driving. ATV driving has an exceptionally large increase, due to the rapid rate atwhich this activity has grown in the last ten years. Over these last ten years, ATV recreationalvehicle registrations have about doubled every five years. Extrapolating this over the next tenyears creates a huge increase, an increase that may or may not be realized. ATV registrations needto be closely monitored on a yearly basis to see if this rapid rate of growth continues.

Ten-year Forecasts of Minnesota Adult Outdoor Recreation Participation6
Tabl
e S-
1
Cat
egor
yA
ctiv
ity
2004
2014
Cha
nge
2004
2014
Cha
nge
2004
2014
Cha
nge
A. P
roje
ctio
ns b
ased
on
MN
-spe
cifi
c ac
tivi
ty t
rend
dat
aB
oati
ng o
f al
l typ
es, e
xclu
ding
fis
hing
fro
m a
boa
t35
.5%
31.4
%-1
1.5%
1,23
7.3
1,25
8.9
1.8%
58,0
99.7
59,1
18.5
1.8%
Fish
ing
of a
ll ty
pes
30.2
%24
.7%
-18.
4%1,
053.
998
8.3
-6.2
%76
,239
.871
,497
.6-6
.2%
Vis
itin
g ou
tdoo
r zo
os27
.5%
20.7
%-2
4.7%
956.
682
8.1
-13.
4%5,
822.
65,
040.
9-1
3.4%
Vis
itin
g hi
stor
ic o
r ar
chae
olog
ical
sit
es20
.7%
16.2
%-2
1.6%
721.
164
9.8
-9.9
%6,
198.
65,
585.
5-9
.9%
Vie
win
g, id
entif
ying
or
phot
ogra
phin
g bi
rds
20.4
%15
.9%
-22.
0%71
1.9
638.
5-1
0.3%
41,2
66.8
37,0
10.1
-10.
3%
and
oth
er w
ildli
feH
unti
ng o
f al
l typ
es16
.0%
14.2
%-1
1.2%
556.
056
7.8
2.1%
48,1
87.7
49,2
12.3
2.1%
Off
road
AT
V d
rivi
ng10
.3%
36.1
%25
1.9%
357.
31,
446.
030
4.7%
15,2
62.4
61,7
62.0
304.
7%Sn
owm
obili
ng9.
8%8.
2%-1
6.8%
341.
832
7.0
-4.3
%10
,259
.99,
817.
0-4
.3%
B. P
roje
ctio
ns b
ased
on
U.S
. tre
nd d
ata
clos
ely
rela
ted
to t
arge
t ac
tivi
tyB
ikin
g (b
icyc
ling
out
door
s of
all
type
s,29
.0%
17.8
%-3
8.5%
1,01
0.5
714.
6-2
9.3%
31,8
89.8
22,5
51.6
-29.
3%
inc
ludi
ng m
ount
ain
biki
ng)
Cam
ping
of
all t
ypes
25.8
%29
.9%
15.8
%89
8.5
1,19
6.1
33.1
%34
,060
.045
,339
.633
.1%
Gol
fing
23.5
%23
.5%
0.0%
819.
994
2.7
15.0
%37
,063
.242
,615
.815
.0%
Out
door
fie
ld s
port
s (e
.g.,
socc
er, s
oftb
all/b
aseb
all
21.1
%16
.0%
-24.
5%73
6.6
639.
3-1
3.2%
21,1
85.3
18,3
88.2
-13.
2%
foo
tbal
l)In
line
skat
ing,
rol
lerb
ladi
ng, r
olle
r sk
atin
g, r
olle
r sk
iing
11.3
%6.
2%-4
4.8%
393.
825
0.1
-36.
5%11
,384
.37,
228.
5-3
6.5%
Dow
nhill
ski
ing/
snow
boar
ding
9.0%
9.0%
0.0%
313.
436
0.3
15.0
%8,
657.
59,
954.
515
.0%
Cro
ss c
ount
ry s
kiin
g6.
5%3.
2%-5
1.4%
227.
012
7.0
-44.
1%3,
669.
12,
052.
3-4
4.1%
C. P
roje
ctio
ns b
ased
on
U.S
. tre
nd d
ata
som
ewha
t rel
ated
to
targ
et a
ctiv
ity
Wal
king
/hik
ing
(wal
king
or
hiki
ng o
utdo
ors
for
54.4
%54
.4%
0.0%
1,89
6.4
2,18
0.5
15.0
%12
9,65
4.7
149,
078.
815
.0%
e
xerc
ise
or p
leas
ure)
Swim
min
g or
wad
ing
(all
plac
es)
40.8
%30
.7%
-24.
8%1,
422.
71,
230.
4-1
3.5%
53,4
75.5
46,2
47.8
-13.
5%O
utdo
or c
ourt
spo
rts
(e.g
., vo
lley
ball,
bas
ketb
all
17.6
%12
.0%
-31.
6%61
1.8
481.
3-2
1.3%
11,6
69.9
9,18
0.9
-21.
3%
ten
nis,
hor
sesh
oes)
Run
ning
or
jogg
ing
14.2
%15
.2%
6.8%
496.
560
9.6
22.8
%24
,331
.529
,869
.722
.8%
Ice
skat
ing/
hock
ey o
utdo
ors
11.5
%6.
8%-4
0.9%
401.
527
2.9
-32.
0%4,
918.
73,
343.
1-3
2.0%
D. N
o pr
ojec
tion
s du
e to
lack
of
any
tren
d da
taD
rivi
ng f
or p
leas
ure
on s
ceni
c ro
ads
or in
a p
ark
37.3
% -
-- -
--1,
300.
0 -
-- -
--33
,472
.8 -
-- -
--Pi
cnic
king
35.7
% -
-- -
--1,
245.
3 -
-- -
--35
,914
.0 -
-- -
--V
isit
ing
natu
re c
ente
rs25
.4%
---
---
883.
6 -
-- -
--8,
440.
1 -
-- -
--Sl
eddi
ng a
nd s
now
tubi
ng18
.4%
---
---
642.
1 -
-- -
--4,
998.
7 -
-- -
--V
iew
ing,
iden
tifyi
ng o
r ph
otog
raph
ing
wild
flow
ers,
18.0
% -
-- -
--62
8.9
---
---
35,9
88.8
---
---
t
rees
, nat
ural
veg
etat
ion
Gat
her
mus
hroo
ms,
ber
ries
, or
othe
r w
ild
food
s8.
7% -
-- -
--30
2.1
---
---
5,09
0.1
---
---
Hor
seba
ck r
idin
g4.
5% -
-- -
--15
7.1
---
---
2,56
7.3
---
---
Snow
shoe
ing
4.2%
---
---
146.
2 -
-- -
--97
4.3
---
---
Ten
-yea
r pr
ojec
tions
of
annu
al o
utdo
or r
ecre
atio
n pa
rtic
ipat
ion
by M
inne
sota
ns, 2
004
to 2
014
(pop
ulat
ion
20 y
ears
old
and
old
er p
arti
cipa
ting
in M
inne
sota
and
els
ewhe
re; t
he 2
004
estim
ates
are
der
ived
fro
m e
xpan
ding
the
2004
sur
vey
sam
ple
by th
e 20
00 U
.S. C
ensu
s co
unts
for
M
N, a
nd th
e 20
14 e
stim
ates
by
the
2010
pop
ulat
ion
proj
ecti
ons
for
MN
; the
pro
ject
ed p
opul
atio
n ri
se is
15%
ove
r th
e 10
-yea
r pe
riod
)
Per
cent
of p
opul
atio
n pa
rtic
ipat
ing
annu
ally
Num
ber
of a
nnua
l par
tici
pant
s (0
00's
)N
umbe
r of
ann
ual h
ours
of
part
icip
atio
n (0
00's
)

7Minnesota Department of Natural Resources
For the category B and C activities, which are based on national trends, the projected participationrate changes are generally negative, much like the category A activities. Certain activities, how-ever, are projected to have stable participation rates (golfing, downhill skiing/snowboarding, andwalking/hiking), while a few have a projected increase in participation rates (camping and running/jogging).
These participation rate changes, when used in conjunction with population projections, provideforecasts of the number of activity participants (second set of columns in Table S-1). Further, sinceit is being assumed that added (and subtracted) activity participants are typical in terms of 2004activity hours per year, the procedures provide forecasts of the number of annual hours of activityparticipation (last set of columns in Table S-1).
It is evident that projected population gains are offsetting many of the negative participation ratechanges, and, thereby, producing more stable numbers of participants over the ten-year period. Forexample, hunting is forecast to have an 11 percent participation-rate decrease over the ten-yearperiod, but the projected increase in the adult population of 15 percent produces a small gain innumber of hunters and hunting hours (2% gain). If the population was not growing, the number ofhunters and hunting hours would be projected to decrease at the same rate as the participation ratechange (-11 percent).
This projected population gain is relatively rapid by Minnesota standards and—like any projec-tion—it needs to be followed to see how well it tracks with actual population growth. The projec-tions following the 2000 U.S. Census reflect the rapid increase in Minnesota’s population duringthe 1990s, exceeded since World War II only by the baby-boom expansion of the 1950s .
The statewide projected population growth in Minnesota is expected to be unevenly distributed,just as it has been in the recent past. The pattern of population change will have a significant effecton recreation activity changes around the state. In the areas of the state that are growing rapidly,net increases in recreation use will likely result. The increases will be most evident in those areaswith large numbers of new residents (population density change) coupled with large relativeincrease in population (percent change). These high population growth areas are the urban expan-sion regions of the state. Much of this expansion is focused on the greater Twin Cities metropoli-tan area, although other places are also expected to continue to grow rapidly.
In the aggregate, statewide outdoor recreation use in terms of hours of participation is projected toincrease, if ATV riding is included, and to remain about the same as today, if ATV riding is ex-cluded (see Table S-2). In other words, even with a relatively rapid population increase, overalloutdoor recreation use for nearly all activities we can assess is stable; ATV riding is the exception.This conclusion applies to the category A activities by themselves, as well as to the A activitiescombined with the B and C activities. To a large extent, outdoor recreation use is projected toplateau in Minnesota.
On a per-capita basis, most projections are for decreases, meaning that the typical Minnesota adultwill invest less time in outdoor recreation than in the past (Table S-2). The only exception is thecategory A activities with ATV riding included, which leads to no per-capita change.

Ten-year Forecasts of Minnesota Adult Outdoor Recreation Participation8
HISTORICAL CONTEXT FOR THE SHORT-TERM FORECAST RESULTS
Are these projections of decreasing per-capita use and plateauing total use at all realistic? Thecareful answer to this question—given the basis upon which the projections are made—is thatthese conclusions are tentative and will remain tentative until move evidence becomes available inthe future. At this time, there are further pieces and parts of corroborating information that point inthe direction of decreasing per-capita use. These pieces and parts add to the strength of the conclu-sions, but the conclusions still remain tentative.
The recently completed outdoor recreation survey of Minnesota adults examined the effect ofbroad demographic trends on shaping overall outdoor recreation use. For many of the demo-graphic trends, the associated recreation trend is less overall use per capita. Take age as an ex-ample. In 2004, the pattern is one of decreasing recreation use as people age. And since thepopulation is aging, the effect of the aging population is less overall use on a per-capita basis.
The conclusion to be drawn from these demographic trends is not that those demographic trendsassociated with less use per capita will in fact predominate over those associated with more use,and there are some of the latter. The conclusion to be drawn is that less overall use per capitashould not be an unexpected outcome.
In addition, there is evidence at the national level for a generational shift in certain activities thatleads to less activity involvement on a per-capita basis. The wildlife-related activities (fishing,
Table S-2
----------- Annual hours (000's) ----------- --------- Annual hours per capita ---------Projection categories included* 2004 2014 Percent change 2004 2014 Percent change
Including ATV driving: A 261,338 299,044 14% 75 75 0% A+B 409,247 447,175 9% 117 112 -5% A+B+C 633,297 684,895 8% 182 171 -6%
Excluding ATV driving: A 246,075 237,282 -4% 71 59 -16% A+B 393,984 385,413 -2% 113 96 -15% A+B+C 618,034 623,133 1% 177 156 -12%
*Activity projection categories: A. Projections based on MN-specific activity trend data B. Projections based on U.S. trend data closely related to target activity C. Projections based on U.S. trend data somewhat related to target activity D. No projections due to lack of any trend data
(population 20 years old and older participating in Minnesota and elsewhere; the 2004 estimates are derived from expanding the 2004 survey sample by the 2000 U.S. Census counts for MN, and the 2014 estimates by the 2010 population projections for MN;
the projected population rise is 15% over the 10-year period)
Summary (by activity projection category) of ten-year projections of annual outdoor recreation hours by Minnesotans, 2004 to 2014

9Minnesota Department of Natural Resources
hunting, and wildlife-watching) all experienced decreasing overall participation rates in the 1990s,according to National Survey of Fishing, Hunting and Wildlife-Associated Outdoor Recreation.Within these overall decreases, the drops for the younger age groups are especially strong and exerta significant downward pull on overall population participation. The drop in the younger ageclasses was sufficient to shift the peak in participation out of the younger age classes into the nextolder age classes.
Whether these age-class patterns evident in the wildlife-related activities are applicable to otherforms of outdoor recreation, and whether they are applicable in MN are seminal questions.
Based on assessments of historical records this study was able to assemble, decreasing per-capitarecreation involvement has not always been the case at the national or Minnesota scale. In earliertime periods, increasing per-capita involvement was not unusual. Decreasing per-capita participa-tion—especially the strong decreases—is of more recent vintage.
At the national scale, fishing participation was increasing faster than population in the 1955 to1970 period, and hunting—although decreasing slightly—was just about maintaining a constantper-capita rate. In later time periods, both fishing and hunting had increasingly negative participa-tion-rate changes.
In a similar historical sequence, both U.S. National Park and Minnesota State Park attendance per-capita increased in the 1980s, and decreased in the 1990s. Recent per-capita decreases in use arealso evident for Twin Cities regional parks and trails. Although Twin Cities regional park and trailuse has increased since 1998, population has increased even faster, which means less use percapita.
The final historical trend-series assessment comes from a place that is as far as you can get in arecreational sense from the Twin Cities metro area. It is from the Boundary Waters Canoe AreaWilderness (BWCAW), located along the Canadian border in northeastern Minnesota. The assess-ment shows a decreasing per-capita use trend for Minnesotans in recent years, preceded by anincrease. This pattern of change is similar to that experienced by Minnesota State Parks.
Altogether, the historical BWCAW trend, plus the park and activity trends may be indicative of adiminishing desire of people for a wide variety of outdoor recreation pursuits. They may beindicative of the diminishing importance of outdoor recreation in the scheme of people’s lives.Only time will tell whether this is true. Aspects of the American culture regularly experiencephases of increasing and decreasing popularity. The outdoor recreation aspect of the culture shouldnot be expected to be any different.
As part of the planned routine monitoring of the changing nature of recreation in Minnesota, onequestion monitors the general importance of outdoor recreation to adult Minnesotans: How impor-tant a part of your life is outdoor recreation? Responses to this question in 2004 show that amajority (57%) of adults believe outdoor recreation is a “very important” part of their life. Notsurprisingly, the importance ascribed to recreation is closely connected to the amount of recreationparticipation. Future assessments of this question should prove most interesting.

Ten-year Forecasts of Minnesota Adult Outdoor Recreation Participation10
INTRODUCTION
The most recent State Comprehensive Outdoor Recreation Plan identified theneed to better understand the changing nature of outdoor recreation in Minnesota(Reference 1). To meet this need, four efforts were originally planned. The firstthree of these are now complete, while the fourth will commence once funding iscertain:
● determine the outdoor recreation patterns of adult Minnesotans.● analyze existing information sources to determine recent trends in recreation
participation (e.g., trends in fishing licenses); these analyses will assist withshort-term forecasting.
● determine—from local-government recreation providers—the recreationfacility and management needs of cities, counties and school districts in thestate.
● determine the recreation facility and program needs of the general Minnesotapopulation directly from that population.
For all of these efforts, the intent is to design a cost-effective methodology thatcan be repeated every five years. Repetitions of the efforts will monitor thechanging nature of outdoor recreation in Minnesota, and will create trendinformation that can be analyzed and applied in short-term recreation forecasting.At this time, however, only the first iteration of the efforts exists, and, thus, the“intended” method for assessing trends and making short-term forecasts cannot becompleted for a number of years.
In the meantime, demands exist for short-term forecasts of recreation participation.The purpose of this document is to address the demand for short-term forecasts inthe years prior to the next iteration of the preceding efforts. The documentprovides statewide ten-year forecasts of the outdoor recreation participationpatterns of adult Minnesotans. The forecasts are based on extrapolations ofavailable recreation activity trend information and population projections.
The available information on recreation activity trends is of mixed quality, andthis will be directly reflected in the quality of the results. The results are graded interms of quality as they are presented. The results should be understood torepresent a “best shot” at short-term forecasts using readily available information.There are numerous assumptions that need to be made to perform the forecasts.General conclusions from the results are considered tentative.

11Minnesota Department of Natural Resources
This document is organized as follows:● The first section describes the activity trend information and short-term
forecasts. Included are discussions of information sources, analysisprocedures, and results.
● The next section presents the historical context for the short-term forecastresults. Many of the short-term activity forecasts—based on recent trends—point to decreasing recreation participation. This would not always havebeen the conclusion reached in the past.
Funding for all of these efforts is from the Land and Water Conservation Fund, asallocated by the Legislative Commission on Minnesota Resources.
The scoping and planning of the efforts was done by a work team, whichcontinues to meet on an ad hoc basis as the efforts progress:
Current members:Dorian Grilley, Parks & Trails Council of MinnesotaTim Kelly, MN DNREmmett Mullin, MN DNRJon Nauman, Three Rivers Park DistrictWayne Sames, MN DNRRon Sushak, MN DNRJonathan Vlaming, initially with the Metropolitan Council, presently
with Three Rivers Park District
Past members:John Schneider, Metropolitan State UniversityColleen Tollefson, Office of Tourism

Ten-year Forecasts of Minnesota Adult Outdoor Recreation Participation12
ACTIVITY TREND INFORMATION AND SHORT-TERM FORECASTS
Information sources and analysis procedures
The method used to forecast recreation is based on extrapolation of recent trendsinto the near future. “Recent trends” are over the last ten years (or some periodclose to that) and the “near future” is the next ten years. Each activity is doneseparately.
For each activity, a measure of the recent trend was identified (Table 1). The trendmeasures fall into four categories: A—measures based on Minnesota-specificactivity trend data; B—measures based on U.S. trend data closely related to targetactivity; C—measures based on U.S. trend data somewhat related to targetactivity; and D—no trend measures could be found, so short-term forecasts arenot made.
For the category A activities, Minnesota-specific measures come from thefollowing sources (see Appendix A for more detail):
Recreational boating, excluding fishing from a boat: measure from multipleMinnesota boating studies conducted by MN DNR and others.
Fishing and hunting of all types: measures from Minnesota hunting andfishing licensing records from MN DNR
Visiting outdoor zoos: measure from attendance records at the Minnesota andDuluth Zoo
Visiting historic or archaeological sites: measure from attendance records atnine outdoor sites maintained by the Minnesota Historical Society
Viewing, identifying or photographing birds and other wildlife: measure fromthe Minnesota data in the National Survey of Fishing, Hunting, andWildlife-Associated Recreation, conducted by the USFWS and CensusBureau
Offroad ATV driving: measure from recreational vehicle registration records ofMN DNR.
Snowmobiling: measure from recreational vehicle registration records of MNDNR.
When this study commenced, the plan was to have the category A activities asthey are here, but to have the category B, C and D activities come from a differentdata source. That different data source was the National Survey of Recreation andthe Environment (NSRE)(see Reference 2). NSRE had been done in 1994-95

13Minnesota Department of Natural Resources
Tabl
e 1
Cat
egor
yA
ctiv
ity
Sour
ce o
f in
form
atio
n us
ed to
est
imat
e ac
tivi
ty tr
end
A. E
stim
ates
bas
ed o
n M
N-s
peci
fic
acti
vity
tre
nd d
ata
Boa
ting
of
all t
ypes
, exc
ludi
ng f
ishi
ng f
rom
a b
oat
Boa
ting
stu
dies
fro
m M
N D
NR
and
MN
-WI
BA
CFi
shin
g of
all
type
sM
N D
NR
lice
nsed
ang
lers
Vis
itin
g ou
tdoo
r zo
osM
N Z
oo +
Dul
uth
Zoo
att
enda
nce
Vis
itin
g hi
stor
ic o
r ar
chae
olog
ical
sit
esM
HS
att
enda
nce
at n
ine
outd
oor
site
sV
iew
ing,
iden
tifyi
ng o
r ph
otog
raph
ing
bird
sU
SFW
S su
rvey
par
tici
patio
n ra
te f
or M
N w
ildli
fe w
atch
ing
a
nd o
ther
wild
life
Hun
ting
of
all t
ypes
MN
DN
R li
cens
ed h
unte
rsO
ffro
ad A
TV
dri
ving
MN
DN
R r
egis
tere
d A
TV
sSn
owm
obili
ngM
N D
NR
reg
iste
red
snow
mob
iles
B. E
stim
ates
bas
ed o
n U
.S. t
rend
dat
a cl
osel
y re
late
d to
tar
get a
ctiv
ity
Bik
ing
(bic
ycli
ng o
utdo
ors
of a
ll ty
pes,
NS
GA
par
tici
patio
n su
rvey
: Bic
ycle
Rid
ing
i
nclu
ding
mou
ntai
n bi
king
)C
ampi
ng o
f al
l typ
esN
SG
A p
arti
cipa
tion
surv
ey: C
ampi
ng (
vaca
tion/
over
nite
)G
olfi
ngN
SG
A p
arti
cipa
tion
surv
ey: G
olf
Out
door
fie
ld s
port
s (e
.g.,
socc
er, s
oftb
all/b
aseb
all
NS
GA
par
tici
patio
n su
rvey
: Bas
ebal
l + F
ootb
all (
tack
le)
+ F
ootb
all (
touc
h) +
Soc
cer
+ S
oftb
all
f
ootb
all)
Inlin
e sk
atin
g, r
olle
rbla
ding
, rol
ler
skat
ing,
rol
ler
skii
ngN
SG
A p
arti
cipa
tion
surv
ey: I
nlin
e R
olle
r S
kati
ngD
ownh
ill s
kiin
g/sn
owbo
ardi
ngN
SG
A p
arti
cipa
tion
surv
ey: S
kiin
g (a
lpin
e) +
Sno
wbo
ardi
ngC
ross
cou
ntry
ski
ing
NS
GA
par
tici
patio
n su
rvey
: Ski
ing
(cro
ss c
ount
ry)
C. E
stim
ates
bas
ed o
n U
.S. t
rend
dat
a so
mew
hat
rela
ted
to t
arge
t ac
tivi
tyW
alki
ng/h
ikin
g (w
alki
ng o
r hi
king
out
door
s fo
rN
SG
A p
arti
cipa
tion
surv
ey: H
ikin
g +
Exe
rcis
e W
alki
ng (
incl
udes
indo
or a
nd o
utdo
or p
arti
cipa
nts)
e
xerc
ise
or p
leas
ure)
Swim
min
g or
wad
ing
(all
plac
es)
NS
GA
par
tici
patio
n su
rvey
: Sw
imm
ing
(in
clud
es in
door
and
out
door
par
ticip
ants
)O
utdo
or c
ourt
spo
rts
(e.g
., vo
lley
ball,
bas
ketb
all
NS
GA
par
tici
patio
n su
rvey
: Bas
ketb
all +
Ten
nis
+ V
olle
ybal
l (in
clud
es in
door
and
out
door
par
tici
pant
s)
ten
nis,
hor
sesh
oes)
Run
ning
or
jogg
ing
NS
GA
par
tici
patio
n su
rvey
: Run
ning
/Jog
ging
(in
clud
es in
door
and
out
door
par
tici
pant
s)Ic
e sk
atin
g/ho
ckey
out
door
sN
SG
A p
arti
cipa
tion
surv
ey: I
ce/F
igur
e S
katin
g +
Hoc
key
(ice
) (i
nclu
des
indo
or a
nd o
utdo
or p
arti
cipa
nts
D. N
o es
tim
ates
due
to
lack
of
any
tren
d da
taD
rivi
ng f
or p
leas
ure
on s
ceni
c ro
ads
or in
a p
ark
---
Picn
icki
ng -
--V
isit
ing
natu
re c
ente
rs -
--Sl
eddi
ng a
nd s
now
tubi
ng -
--V
iew
ing,
iden
tifyi
ng o
r ph
otog
raph
ing
wil
dflo
wer
s, -
--
tre
es, n
atur
al v
eget
atio
nG
athe
r m
ushr
oom
s, b
erri
es, o
r ot
her
wil
d fo
ods
---
Hor
seba
ck r
idin
g -
--Sn
owsh
oein
g -
--
Sour
ces
of in
form
atio
n on
rec
ent a
ctiv
ity
part
icip
atio
n ra
te c
hang
es u
sed
in te
n-ye
ar p
roje
ctio
ns
("re
cent
" is
last
10
year
s)

Ten-year Forecasts of Minnesota Adult Outdoor Recreation Participation14
and repeated in 2000-01, and trends from these two surveys were to be used forMinnesota activity trends. NSRE data were to be analyzed and the best availableNSRE geographic representation of Minnesota was to be identified (e.g., multi-state region including Minnesota).
Unfortunately, the NSRE data proved unreliable in two important tests that areavailable to evaluate recreation survey quality. At a national level, trends inhunting and fishing participation are relatively well known from USFWS-compiled license sales information (Reference 3) and from the USFWS NationalSurvey of Fishing, Hunting and Wildlife-Associated Recreation (Reference 4).The USFWS’s license-sales trend and the National-Survey trend closely matcheach other and, together, provide a reliable guide to national fishing and huntingtrends (Table 2). Both hunting and fishing fell from the mid 1990s to the earlypart of the currentdecade.
The NSRE trends forthese two activities,however, are fardifferent. NSRE hasnational fishing andhunting participationrising rapidly overthis same period(Table 2). TheNSRE trendscompared so poorlywith the reliabletrend informationthat this studyconcluded that itcould not justifyusing NSRE for anyactivity trends.
Once NSRE was eliminated from consideration, two options were considered.The first was to just do the category A activities with Minnesota-specific data andignore the rest. The second was to find and test another data source on activitytrends. The other data source tested was one that is commonly used in the sports
FISHINGUSFWS: USFWS: NSRE:
YearNational survey (1996 to
2001)*
National summation of state-licensed participants per capita (1996 to 2001)**
National survey (1994-95 to 2000-01)***
mid-1990s (=100) 100 100 100early 2000s 92 93 118
HUNTINGUSFWS: USFWS: NSRE:
YearNational survey (1996 to
2001)*
National summation of state-licensed participants per capita (1996 to 2001)**
National survey (1994-95 to 2000-01)***
mid-1990s (=100) 100 100 100early 2000s 89 93 122
*** Index based on participation rate of age 16+ population from National Survey of Recreation and the Environment (NSRE).
Note: All population figures are from the U.S. Census and are linearly interpolated between decennial census years; 2001 figure is an estimates from the U.S. Census Bureau.
Trend indicators for fishing and hunting, mid-1990s to early 2000s
* Index based on participation rate of age 16+ population from USFWS National Survey of Fishing, Hunting and Wildlife-Associated Recreation.
** Index based on national summation of state-licensed participants, normalized by U.S. population age 16+, from USFWS license certification records.
Table 2

15Minnesota Department of Natural Resources
and recreation area: National Sporting Goods Association (NSGA)(see Reference5). NSGA conducts an annual sports/recreation participation survey of some10,000 U.S. households.
The NSGA survey results were run through the same national fishing and huntingtrend tests, and the survey fared better. The fishing trend was well captured byNSGA between 1991 and 2001 (Table 3). The hunting trend, however, was notthat well captured. NSGA has hunting participation heading down over the1991-2001 period,but the decrease istoo small. TheNSGA hunting trenddata do not cover alltypes of hunting(only “firearmshunting”), but thetypes captured are thelargest types ofhunting.
Since NSGAcaptured the fishingtrend well, and thehunting trend at leastpartially, the decisionwas made to useNSGA in this studywhere it hadapplicability (for thecategory B and Cactivities). TheNSGA data used here are the “free” information available at the national level forages 7 and older.
To use the NSGA data for Minnesota, two assumptions are made: national trendsfrom NSGA are reflected in Minnesota, and NSGA activity trends for ages 7+ arereflected in Minnesota age 20+ trends. It is known that national trends forhunting, fishing and wildlife watching have similarities at the national andMinnesota level (Table 4), but it is not known whether this is the case for the other
FISHINGUSFWS: USFWS: NSGA:
Year National survey*
National summation of state-licensed participants per
capita** National survey***
1991 (=100) 100 100 1001996 93 91 892001 86 85 84
HUNTINGUSFWS: USFWS: NSGA:
Year National survey*
National summation of state-licensed participants per
capita**National survey (firearm
hunters only)***
1991 (=100) 100 100 1001996 94 90 922001 83 84 95
Note: All population figures are from the U.S. Census and are linearly interpolated between decennial census years; 2001-02 figures are estimates from the U.S. Census Bureau.
* Index based on participation rate of age 16+ population from USFWS National Survey of Fishing, Hunting and Wildlife-Associated Recreation.
** Index based on national summation of state-licensed participants, normalized by U.S. population age 16+, from USFWS license certification records.
*** Index based on NSGA annual participant survey, normalized by U.S. population age 7+. Figures are three-year averages (e.g., 1991 is an average of 1990, 1991 and 1992).
Trend indicators for fishing and hunting, 1991 to 2001
Table 3

Ten-year Forecasts of Minnesota Adult Outdoor Recreation Participation16
activities. Also, how the age differences affect the results is not known, exceptthat most of the population over 7 years old is in the 20+ age group (nearly 80%of U.S. population aged 7+ is 20+ in 2000).
In addition, for the category C activities, the NSGA data are for activities that areregularly performed both outdoors and indoors, and the assumption is made thattrends in the NSGA outdoor-indoor activity are the same as for the outdoor
----- Percent of population participating ----- Percent changeActivity 1991 2001 1991 to 2001***
Fishing U.S.* 18.7% 16.0% -14.3% Minnesota** 38.5% 31.5% -18.1%
Hunting U.S.* 7.4% 6.1% -17.1% Minnesota** 15.8% 14.5% -7.8%
U.S.* 15.8% 10.3% -34.9% Minnesota* 23.6% 15.2% -35.5%
U.S.* 40.1% 31.1% -22.3% Minnesota* 59.1% 54.0% -8.5%
*** For those based on the National Survey, all the changes are estimated to be statistically significant at the .05 level, except the MN "total wildlife watching" change, which is not statistically different from zero. Statistical significance is estimated from parameters published with the National Survey.
Away-from-home wildlife-watching (at least 1 mile from home)
Total wildlife-watching (includes activity within 1 mile of home and over 1 mile of home)
Recent (1991 to 2001) trends in annual participation in wildlife-related recreation for U.S. and Minnesota
(population aged 16 and over; the population increase from 1991 to 2001 was 12% for U.S. and 14% for Minnesota)
* Source: National Survey of Fishing, Hunting, and Wildlife-Associated Recreation (1991 and 2001). U.S. Department of Interior, Fish and Wildlife Service; and U.S. Department of Commerce, Census Bureau.
** Source: MN DNR and U. S. Bureau of the Census. The participation measure is the percent of the MN population aged 16+ who have a MN fishing or hunting license. The 1991 figure is an average of 1990 to 1992, and the 2001 figure is an average of 2000 to 2002.
Table 4

17Minnesota Department of Natural Resources
component of the target activity in this study; the accuracy of this assumption isnot known.
Given all these assumptions, and the inability to offer evidence as to the generalreasonableness of some of the assumptions, the approach here is to clearly labelthe source of the results, and ensure that all results are understood as “tentative”.Even given their tentative nature, however, the results provide some valuableinsights into the changing nature of outdoor recreation in Minnesota.
After activity measures were identified, the following three-step generalforecasting procedure was applied (see Appendix A for a detailed discussion of thedata and procedures for each activity):
1. The measure of activity involvement over the most recent 10 years isnormalized by the relevant population to derive a per-capita data series.The measure of activity involvement is either the number of participants,amount of use, or registered recreational vehicles. The relevant populationmay be age specific (e.g., age 16+ for fishing licenses), and may refer to theU.S. as a whole or Minnesota or a portion of Minnesota (e.g., seven-countyTwin Cities metropolitan area).
2. A linear regression line is fit to the data series in #1, and the percent changealong the regression line between the first and tenth year is computed. Ifthe slope of the regression line is not statistically different from zero (whichoccurred in 3 of the 18 cases), the slope is set at zero (i.e., percent change isset to zero).
3. The percent change in #2 is assessed against the current (2004) percent ofpopulation participating in an activity to derive the percent participating 10years later in 2014. The 2014 percent is then multiplied by the projectedpopulation 10 years later to get the number of participants. The number ofparticipants is subsequently multiplied by the 2004 annual activity hoursper participant value to compute 2014 activity hours. The assumption ismade that added (and subtracted) activity participants are typical in terms ofactivity hours per year.
Steps 1 to 3 were done for all but two activities, whose measures were vehicleregistration trends. One of these (Minnesota ATV registrations) was examineddifferently because it was expanding so rapidly. ATV registrations over the last 10years were examined in three ways: (i) all of the 10 years, (ii) first 5 years, (iii) last5 years. All three of these measures (as shown in Appendix A) are nearly the

Ten-year Forecasts of Minnesota Adult Outdoor Recreation Participation18
same, so the entire ten-year trend was used. The other of these was Minnesotasnowmobile registrations, which were rather erratic over the last 10 years, perhapsdue—at least in part—to variable snow conditions. Snowmobile registrationswere examined in the same way as ATV registrations: (i) all of the 10 years, (ii)first 5 years, (iii) last 5 years. The last 5 years differed materially from the first 5,so the last 5 were used to derive the trend for the projections (see Appendix A).
Short-term forecasts
Using the preceding methods and information sources, ten-year forecasts are madefor the activities for which trend information was available. These forecastactivities cover the bulk ofadult Minnesotans annualoutdoor recreation time in2004 (83% of totalrecreation time—Table 5).Those activities withMinnesota-specific trendinformation cover just overone-third of total recreationtime.
Most activities havedecreasing activityparticipation rates in the ten-year projections (see first setof columns in Table 6). Inthe category A activities,which are based onMinnesota-specific trenddata, all of the activities have decreases in participation rates between 11 and 25percent, except offroad ATV driving. ATV driving has an exceptionally largeincrease, due to the rapid rate at which this activity has grown in the last ten years.Over these last ten years, ATV recreational vehicle registrations have aboutdoubled every five years. Extrapolating this over the next ten years creates a hugeincrease, an increase that may or may not be realized. ATV registrations need tobe closely monitored on a yearly basis to see if this rapid rate of growth continues.[As an aside, ATV riding needs to be routinely monitored to see how, where, and
Table 5
Projection category Percent of hours
A. Projections based on MN-specific activity trend data
34.4%
B. Projections based on U.S. trend data closely related to target activity
19.4%
C. Projections based on U.S. trend data somewhat related to target activity
29.5%
D. No projections due to lack of any trend data
16.8%
Total 100.0%
Percent of 2004 recreation hours in activity projection categories

19Minnesota Department of Natural Resources
Tabl
e 6
Cat
egor
yA
ctiv
ity
2004
2014
Cha
nge
2004
2014
Cha
nge
2004
2014
Cha
nge
A. P
roje
ctio
ns b
ased
on
MN
-spe
cifi
c ac
tivi
ty t
rend
dat
aB
oati
ng o
f al
l typ
es, e
xclu
ding
fis
hing
fro
m a
boa
t35
.5%
31.4
%-1
1.5%
1,23
7.3
1,25
8.9
1.8%
58,0
99.7
59,1
18.5
1.8%
Fish
ing
of a
ll ty
pes
30.2
%24
.7%
-18.
4%1,
053.
998
8.3
-6.2
%76
,239
.871
,497
.6-6
.2%
Vis
itin
g ou
tdoo
r zo
os27
.5%
20.7
%-2
4.7%
956.
682
8.1
-13.
4%5,
822.
65,
040.
9-1
3.4%
Vis
itin
g hi
stor
ic o
r ar
chae
olog
ical
sit
es20
.7%
16.2
%-2
1.6%
721.
164
9.8
-9.9
%6,
198.
65,
585.
5-9
.9%
Vie
win
g, id
entif
ying
or
phot
ogra
phin
g bi
rds
20.4
%15
.9%
-22.
0%71
1.9
638.
5-1
0.3%
41,2
66.8
37,0
10.1
-10.
3%
and
oth
er w
ildli
feH
unti
ng o
f al
l typ
es16
.0%
14.2
%-1
1.2%
556.
056
7.8
2.1%
48,1
87.7
49,2
12.3
2.1%
Off
road
AT
V d
rivi
ng10
.3%
36.1
%25
1.9%
357.
31,
446.
030
4.7%
15,2
62.4
61,7
62.0
304.
7%Sn
owm
obili
ng9.
8%8.
2%-1
6.8%
341.
832
7.0
-4.3
%10
,259
.99,
817.
0-4
.3%
B. P
roje
ctio
ns b
ased
on
U.S
. tre
nd d
ata
clos
ely
rela
ted
to t
arge
t ac
tivi
tyB
ikin
g (b
icyc
ling
out
door
s of
all
type
s,29
.0%
17.8
%-3
8.5%
1,01
0.5
714.
6-2
9.3%
31,8
89.8
22,5
51.6
-29.
3%
inc
ludi
ng m
ount
ain
biki
ng)
Cam
ping
of
all t
ypes
25.8
%29
.9%
15.8
%89
8.5
1,19
6.1
33.1
%34
,060
.045
,339
.633
.1%
Gol
fing
23.5
%23
.5%
0.0%
819.
994
2.7
15.0
%37
,063
.242
,615
.815
.0%
Out
door
fie
ld s
port
s (e
.g.,
socc
er, s
oftb
all/b
aseb
all
21.1
%16
.0%
-24.
5%73
6.6
639.
3-1
3.2%
21,1
85.3
18,3
88.2
-13.
2%
foo
tbal
l)In
line
skat
ing,
rol
lerb
ladi
ng, r
olle
r sk
atin
g, r
olle
r sk
iing
11.3
%6.
2%-4
4.8%
393.
825
0.1
-36.
5%11
,384
.37,
228.
5-3
6.5%
Dow
nhill
ski
ing/
snow
boar
ding
9.0%
9.0%
0.0%
313.
436
0.3
15.0
%8,
657.
59,
954.
515
.0%
Cro
ss c
ount
ry s
kiin
g6.
5%3.
2%-5
1.4%
227.
012
7.0
-44.
1%3,
669.
12,
052.
3-4
4.1%
C. P
roje
ctio
ns b
ased
on
U.S
. tre
nd d
ata
som
ewha
t rel
ated
to
targ
et a
ctiv
ity
Wal
king
/hik
ing
(wal
king
or
hiki
ng o
utdo
ors
for
54.4
%54
.4%
0.0%
1,89
6.4
2,18
0.5
15.0
%12
9,65
4.7
149,
078.
815
.0%
e
xerc
ise
or p
leas
ure)
Swim
min
g or
wad
ing
(all
plac
es)
40.8
%30
.7%
-24.
8%1,
422.
71,
230.
4-1
3.5%
53,4
75.5
46,2
47.8
-13.
5%O
utdo
or c
ourt
spo
rts
(e.g
., vo
lley
ball,
bas
ketb
all
17.6
%12
.0%
-31.
6%61
1.8
481.
3-2
1.3%
11,6
69.9
9,18
0.9
-21.
3%
ten
nis,
hor
sesh
oes)
Run
ning
or
jogg
ing
14.2
%15
.2%
6.8%
496.
560
9.6
22.8
%24
,331
.529
,869
.722
.8%
Ice
skat
ing/
hock
ey o
utdo
ors
11.5
%6.
8%-4
0.9%
401.
527
2.9
-32.
0%4,
918.
73,
343.
1-3
2.0%
D. N
o pr
ojec
tion
s du
e to
lack
of
any
tren
d da
taD
rivi
ng f
or p
leas
ure
on s
ceni
c ro
ads
or in
a p
ark
37.3
% -
-- -
--1,
300.
0 -
-- -
--33
,472
.8 -
-- -
--Pi
cnic
king
35.7
% -
-- -
--1,
245.
3 -
-- -
--35
,914
.0 -
-- -
--V
isit
ing
natu
re c
ente
rs25
.4%
---
---
883.
6 -
-- -
--8,
440.
1 -
-- -
--Sl
eddi
ng a
nd s
now
tubi
ng18
.4%
---
---
642.
1 -
-- -
--4,
998.
7 -
-- -
--V
iew
ing,
iden
tifyi
ng o
r ph
otog
raph
ing
wild
flow
ers,
18.0
% -
-- -
--62
8.9
---
---
35,9
88.8
---
---
t
rees
, nat
ural
veg
etat
ion
Gat
her
mus
hroo
ms,
ber
ries
, or
othe
r w
ild
food
s8.
7% -
-- -
--30
2.1
---
---
5,09
0.1
---
---
Hor
seba
ck r
idin
g4.
5% -
-- -
--15
7.1
---
---
2,56
7.3
---
---
Snow
shoe
ing
4.2%
---
---
146.
2 -
-- -
--97
4.3
---
---
Ten
-yea
r pr
ojec
tions
of
annu
al o
utdo
or r
ecre
atio
n pa
rtic
ipat
ion
by M
inne
sota
ns, 2
004
to 2
014
(pop
ulat
ion
20 y
ears
old
and
old
er p
arti
cipa
ting
in M
inne
sota
and
els
ewhe
re; t
he 2
004
estim
ates
are
der
ived
fro
m e
xpan
ding
the
2004
sur
vey
sam
ple
by th
e 20
00 U
.S. C
ensu
s co
unts
for
M
N, a
nd th
e 20
14 e
stim
ates
by
the
2010
pop
ulat
ion
proj
ecti
ons
for
MN
; the
pro
ject
ed p
opul
atio
n ri
se is
15%
ove
r th
e 10
-yea
r pe
riod
)
Per
cent
of p
opul
atio
n pa
rtic
ipat
ing
annu
ally
Num
ber
of a
nnua
l par
tici
pant
s (0
00's
)N
umbe
r of
ann
ual h
ours
of
part
icip
atio
n (0
00's
)

Ten-year Forecasts of Minnesota Adult Outdoor Recreation Participation20
by whom these machines are being used. The activity is growing so fast that newpatterns of use may be emerging that could quickly dominate the overall activityin a matter of years.]
For the category B and C activities, which are based on national trends, theprojected participation rate changes are generally negative, much like the categoryA activities. Certain activities, however, are projected to have stable participationrates (golfing, downhill skiing/snowboarding, and walking/hiking), while a fewhave a projected increase in participation rates (camping and running/jogging).
These participation rate changes, when used in conjunction with populationprojections, provide forecasts of the number of activity participants (second set ofcolumns in Table 6). Further, since it is being assumed that added (andsubtracted) activity participants are typical in terms of 2004 activity hours peryear, the procedures provide forecasts of the number of annual hours of activityparticipation (last set of columns in Table 6).
It is evident in Table 6 that projected population gains are offsetting many of thenegative participation rate changes, and, thereby, producing more stable numbersof participants over the ten-year period. For example, hunting is forecast to havean 11 percent participation-rate decrease over the ten-year period, but the projectedincrease in the adult population of 15 percent produces a small gain in number ofhunters and hunting hours (2% gain). If the population was not growing, thenumber of hunters and hunting hours would be projected to decrease at the samerate as the participation rate change (-11 percent).
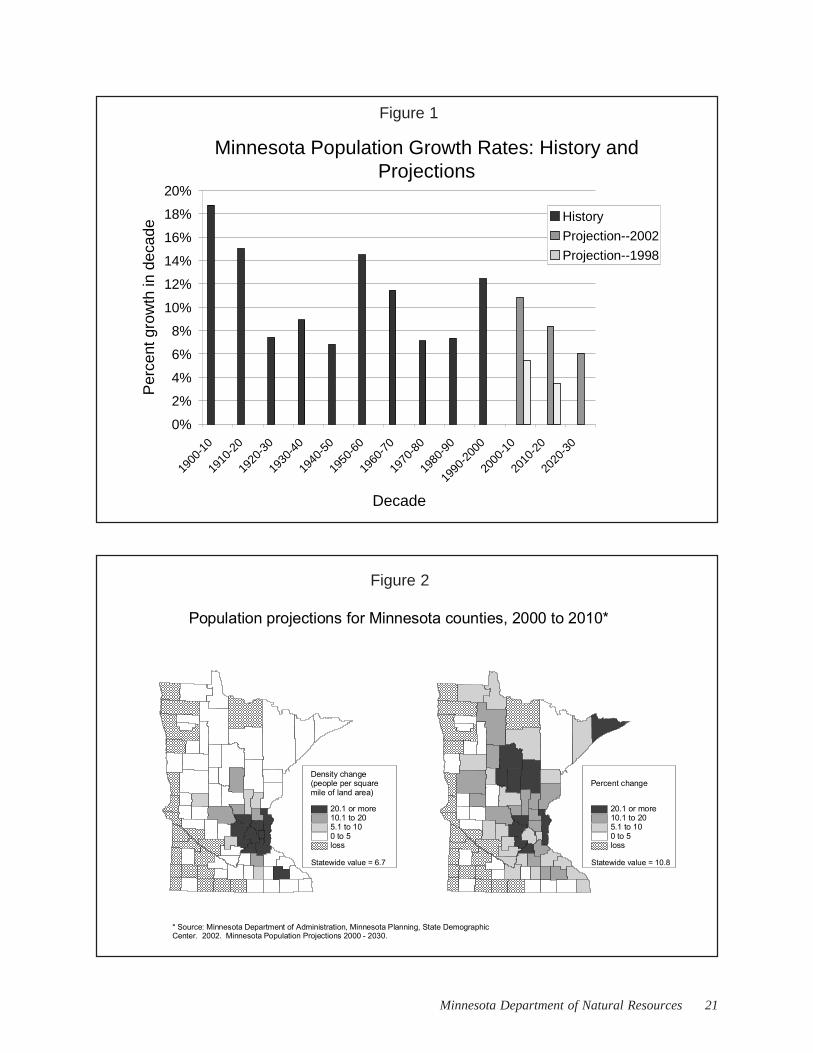
This projected population gain is relatively rapid by Minnesota standards and—like any projection—it needs to be followed to see how well it tracks with actualpopulation growth (Reference 6). The projections following the 2000 U.S.Census reflect the rapid increase in Minnesota’s population during the 1990s,exceeded since World War II only by the baby-boom expansion of the 1950s(Reference 7)(see Figure 1). Before the full extent of the 1990s populationgrowth was realized, the projections (from 1998) were considerably lower. Inboth the 1998 and 2002 population projections, the rate of growth decreases overtime, which means that the damping effect on any participation-rate decreaseswould be less in the future.
The statewide projected population growth in Minnesota is expected to beunevenly distributed, just as it has been in the recent past (Figure 2). The pattern
21Minnesota Department of Natural Resources
Minnesota Population Growth Rates: History and Projections
0%
2%
4%
6%
8%
10%
12%
14%
16%
18%
20%
1900
-10
1910
-20
1920
-30
1930
-40
1940
-50
1950
-60
1960
-70
1970
-80
1980
-90
1990
-200
0
2000
-10
2010
-20
2020
-30
Decade
Per
cent
gro
wth
in d
ecad
e History
Projection--2002
Projection--1998
Figure 1
Figure 2
Density change(people per squaremile of land area)
20.1 or more10.1 to 205.1 to 100 to 5loss
Percent change
20.1 or more10.1 to 205.1 to 100 to 5loss
Population projections for Minnesota counties, 2000 to 2010*
* Source: Minnesota Department of Administration, Minnesota Planning, State Demographic Center. 2002. Minnesota Population Projections 2000 - 2030.
Statewide value = 6.7 Statewide value = 10.8

Ten-year Forecasts of Minnesota Adult Outdoor Recreation Participation22
of population change will have a significant effect on recreation activity changesaround the state. This study does not have activity-trend information below thestate level to make sub-state recreation projections, but a few observations basedon population growth patterns are worth noting. In the future, when the baserecreation studies are repeated on a regular five-year basis as planned, sub-stateprojections will be possible.
In the areas of the state that are growing rapidly, net increases in recreation use willlikely result. The increases will be most evident in those areas with large numbersof new residents (density change on Figure 2) coupled with large relative increasesin population (percent change on Figure 2). These high population growth areasare the urban expansion regions of the state. Much of this expansion is focusedon the greater Twin Cities metropolitan area, although other places are alsoexpected to grow rapidly (e.g., Olmsted County in southeastern Minnesota).
In the aggregate, statewide outdoor recreation use in terms of hours ofparticipation is projected to increase, if ATV riding is included, and to remainabout the same as today, if ATV riding is excluded (Table 7). In other words,even with a relatively rapid population increase, overall outdoor recreation use for
Table 7
----------- Annual hours (000's) ----------- --------- Annual hours per capita ---------Projection categories included* 2004 2014 Percent change 2004 2014 Percent change
Including ATV driving: A 261,338 299,044 14% 75 75 0% A+B 409,247 447,175 9% 117 112 -5% A+B+C 633,297 684,895 8% 182 171 -6%
Excluding ATV driving: A 246,075 237,282 -4% 71 59 -16% A+B 393,984 385,413 -2% 113 96 -15% A+B+C 618,034 623,133 1% 177 156 -12%
*Activity projection categories: A. Projections based on MN-specific activity trend data B. Projections based on U.S. trend data closely related to target activity C. Projections based on U.S. trend data somewhat related to target activity D. No projections due to lack of any trend data
(population 20 years old and older participating in Minnesota and elsewhere; the 2004 estimates are derived from expanding the 2004 survey sample by the 2000 U.S. Census counts for MN, and the 2014 estimates by the 2010 population projections for MN;
the projected population rise is 15% over the 10-year period)
Summary (by activity projection category) of ten-year projections of annual outdoor recreation hours by Minnesotans, 2004 to 2014

23Minnesota Department of Natural Resources
nearly all activities we can assess is stable; ATV riding is the exception. Thisconclusion applies to the category A activities by themselves, as well as to the Aactivities combined with the B and C activities. To a large extent, outdoorrecreation use is projected to plateau in Minnesota.
On a per-capita basis, most projections are for decreases, meaning that the typicalMinnesota adult will invest less time in outdoor recreation than in the past (Table7). The only exception is the category A activities with ATV riding included,which leads to no per-capita change.
HISTORICAL CONTEXT FOR THE SHORT-TERM FORECAST RESULTS
Are these projections of decreasing per-capita use and plateauing total use at allrealistic? The careful answer to this question—given the basis upon which theprojections are made—is that these conclusions are tentative, and will remaintentative until move evidence becomes available down the road. At this time,there are further pieces and parts of corroborating information that point in thedirection of decreasing per-capita use. These pieces and parts add to the strengthof the conclusions, but the conclusions still remain tentative.
The recently completed outdoor recreation survey of Minnesota adults examinedthe effect of broad demographic trends on shaping overall outdoor recreation use(Reference 8)(see Table 8). For many of the demographic trends, the associatedrecreation trend is less overall use per capita. Take age as an example. In 2004,the pattern is one of decreasing recreation use as people age (Figure 3). And sincethe population is aging (Figure 4), the effect of the aging population is less overalluse on a per-capita basis.
The conclusion to be drawn from these demographic trends is not that thosedemographic trends associated with less use per capita will in fact predominateover those associated with more use, and there are some of the latter (Table 8).The conclusion to be drawn is that less overall use per capita should not be anunexpected outcome.
In addition, there is evidence at the national level for a generational shift in certainactivities that leads to less activity involvement on a per-capita basis (Figure 5).The wildlife-related activities (fishing, hunting, and wildlife-watching) all

Ten-year Forecasts of Minnesota Adult Outdoor Recreation Participation24
experienced decreasing overall participation rates in the 1990s, according toNational Survey of Fishing, Hunting and Wildlife-Associated Outdoor Recreation(Reference 4). Within these overall decreases, the drops for the younger agegroups are especially strong and exert a significant downward pull on overallpopulation participation. The drop in the younger age classes was sufficient toshift the peak in participation out of the younger age classes into the next olderage classes. [As an aside, Minnesota—through its Electronic Licensing System—can begin to develop detailed demographic trends on hunting and angling (e.g.,age, gender, and geographic trends). ELS went into operation in 2001, and allinformation is archived.]
Whether these age-class patterns evident in the wildlife-related activities aregeneralizable to other forms of outdoor recreation, and whether they are applicablein Minnesota are seminal questions. In this regard, one speculative item is worthnoting.
On the age-class pattern of overall recreation use in Minnesota (Figure 3), theincrease in overall recreation use per capita with decreasing age—which in 2004dropped down for the youngest adult age class—continued to rise into theyoungest adult age class in the 1980s, the only other time this kind of work hasbeen done in Minnesota (Reference 9). This pattern change—a shift of peakinvolvement from the younger to an older age group—is the same as noted abovefor wildlife-related activities at the national level. If the Minnesota pattern change
Associated recreation use trend Demographic characteristic Demographic trend
Less useLess overall use per capita Population density of residence (urban-rural) Increasing urbanLess overall use per capita Region of Minnesota Increasing metro area/urbanLess overall use per capita Age class Increasing ageLess overall use per capita Race/ethnicity More non-white and/or HispanicLess overall use per capita Household size Smaller sizes
No effect on useNeutral Gender Neutral
More useMore overall use per capita Education More formal educationMore overall use per capita Household Income Higher incomes
Summary table: Recreation use trends associated with demographic characteristics and trends
Table 8

25Minnesota Department of Natural Resources
Index of outdoor recreation use (hours) by age class
53
89
110121
108
0
20
40
60
80
100
120
140
20-34 35-44 45-54 55-64 65+
Per
cap
ita in
dex
(100
=av
erag
e)
Trends in Minnesota median age
35.432.4
29.226.828.630.629.5
27.225.3
23.722
0
10
20
30
40
50
1900
1910
1920
1930
1940
1950
1960
1970
1980
1990
2000
Med
ian
age
in y
ears
Figure 3
Figure 4

Ten-year Forecasts of Minnesota Adult Outdoor Recreation Participation26
Figure 5
Fishing
Hunting
Away-from-home wildlifewatching
Participation rate changes by age class in U.S. wildlife-related recreation, 1991 to 2001
(participation rate = participants / population)
Ove
rall
16 to
24
year
s
25 to
34
year
s
35 to
44
year
s
45 to
54
year
s
55 to
64
year
s
65 y
ears
and
olde
r
Total wildlifewatching
-50%
-40%
-30%
-20%
-10%
0%
10%
-50%
-40%
-30%
-20%
-10%
0%
10%
-50%
-40%
-30%
-20%
-10%
0%
10%
-50%
-40%
-30%
-20%
-10%
0%
10%

27Minnesota Department of Natural Resources
is real and not apparent (and only future monitoring can provide that distinction),it would be indicative of a relative drop of overall recreation involvement by theyoungest Minnesota adults.
Based on assessments of historical records this study was able to assemble,decreasing per-capita recreation involvement has not always been the case at thenational or Minnesota scale. In earlier time periods, increasing per-capitainvolvement was not unusual. Decreasing per-capita participation—especially thestrong decreases—is of more recent vintage.
At the national scale, fishing participation was increasing faster than population inthe 1955 to 1970 period, and hunting—although decreasing slightly—was justabout maintaining a constant per-capita rate (Figure 6). In later time periods, bothfishing and hunting had increasingly negative participation-rate changes.
In a similar historical sequence, both U.S. National Park and Minnesota State Parkattendance per-capita increased in the 1980s, and decreased in the 1990s(Reference 10 & 11)(see Figure 7). Recent per-capita decreases in use are alsoevident for Twin Cities regional parks and trails (Reference 12)(see Figure 8).
Trends in U.S. hunting and fishing participation rates from the 1950s*(participation rate = participants / population)
-25%
-20%
-15%
-10%
-5%
0%
5%
10%
15%
20%
25%
Per
cent
cha
nge
over
indi
cate
d pe
riod
FisingHunting
1955 to 1970 1975 to 1985 1991 to 2001
* Source: 2001 National Survey of Fishing, Hunting, and Wildlife-Associated Recreation. U.S. Department of Interior, Fish and Wildlife Service; and U.S. Department of Commerce, Census Bureau. The 2001 document contains all of these historical data.
Figure 6

Ten-year Forecasts of Minnesota Adult Outdoor Recreation Participation28
Figure 8
Trends in MN State Park and National Park visits per capita from the 1980s*
-15%
-10%
-5%
0%
5%
10%
15%
20%P
erce
nt c
hang
e ov
er in
dica
ted
perio
d
Minnesota State ParksNational Parks
1980s(1981 to 1991)
1990s(1991 to 2001)
*Sources: Park visitation figures are from MN DNR and NPS. Visitation figures are three-year averages (e.g., 1991 is an average of 1990, 1991 and 1992. Visitation at parks that opened between two comparison years is excluded. Population figures are from the U.S. Census and are linearly interpolated between decennial census years; 2001 figures are estimates from the U.S. Census Bureau.
Figure 7
Visitation
Visitationper capita(Twin Citiespopulation)
Visitation trends at regional parks and trails that existed in 1998 in the Twin Cities Metropolitan Region*
(53 regional parks, 16 regional trails)
90
95
100
105
110
1998 1999 2000 2001 2002 2003 2004
Index: 1998 values = 100
*Source: Visitation data from Metropolitan Council. Twin Cities seven-county population data from U.S. Census Bureau.

29Minnesota Department of Natural Resources
Although Twin Cities regional park and trail use has increased since 1998,population has increased even faster, which means less use per capita. [Note:1998 is the first year available from the new standardized monitoring of TwinCities park and trail use; monitoring began in 1995 and it takes four years ofaccumulated data to report for a year.]
The final historical trend-series assessment comes from a place that is as far as youcan get in a recreational sense from the Twin Cities metro area. It is from theBoundary Waters Canoe Area Wilderness (BWCAW), located along the Canadianborder in northeastern Minnesota. The assessment shows a decreasing per-capitause trend for Minnesotans in recent years, preceded by an increase (Figure 9).This pattern of change is similar to that experienced by Minnesota State Parks.
The BWCAW trend measure is yearly May-September overnight quota permitssince 1982, when standard reporting of these permit data began (Reference 13).The BWCAW is a formal wilderness, and quotas are established to limit use andmaintain a wilderness experience for visitors. Quotas are managed through thepermit system. The large majority of the BWCAW annual use (in terms ofrecreational visitor days) is connected to these overnight permits. Origin (state) ofthe user is tied to the origin of the person who applies for the group permit.
Trends in May-to-September overnight group permits in the BWCAW*
60
70
80
90
100
110
120
130
140
1982
1983
1984
1985
1986
1987
1988
1989
1990
1991
1992
1993
1994
1995
1996
1997
1998
1999
2000
2001
2002
2003
2004
Index:1982 values = 100
* Sources: Superior National Forest. The permit data for 1999 to 2004 are from a new permit system are considered preliminary at this time. Population figures are from the U.S. Census and are linearly interpolated between decennial census years; 2001-2004 figures are estimates from the U.S. Census Bureau.
Total groups
MN groupsMN groupsper capita
(MN population)
Figure 9

Ten-year Forecasts of Minnesota Adult Outdoor Recreation Participation30
Total overnight group permits at first decreased in the early 1980s (probablyassociated with decreasing quotas for motorboats), then rose to the late 1980s,after which they stayed relatively constant for about 10 years until the latter part ofthe 1990s. Permits numbers then fell and have remained stable over the last fewyears (the permit data for 1999 to 2004 are from a new permit system and areconsidered preliminary at this time; some revisions may be made in the nearfuture). The relatively constant period from the late 1980s through the latter partof the 1990s occurred during the sizable drop (27% decrease) between 1993 and1994 in the number of May-September overnight quota permits. At present, justover half (54%) of the available May-September overnight permit quota is used.
Since 1994 when the current May-September overnight quotas wereimplemented, the per-capita index of Minnesota groups has shown an overalldecrease of about 25 percent. In the years prior to 1994, this per-capita index roseoverall.
Altogether, the historical BWCAW trend, plus the park and activity trends may beindicative of a diminishing desire of people for a wide variety of outdoorrecreation pursuits. They may be indicative of the diminishing importance ofoutdoor recreation in the scheme of people’s lives. Only time will tell whetherthis is true. Aspects of the American culture regularly experience phases ofincreasing and decreasing popularity. The outdoor recreation aspect of the cultureshould not be expected to be any different.
As part of the planned routinemonitoring of the changingnature of recreation inMinnesota, one questionmonitors the generalimportance of outdoorrecreation to adultMinnesotans: How important apart of your life is outdoorrecreation? Responses to thisquestion in 2004 show that amajority (57%) of adultsbelieve outdoor recreation is a“very important” part of theirlife (Figure 10). Not
Figure 10
How important a part of your life is outdoor recreation?
Very important57%
Moderately important
25%
Slightly important
10%
Not important at all (or did not recreate last
year)8%

31Minnesota Department of Natural Resources
Figure 11
Comparison of importance of outdoor recreation in people's lives with amount of their recreation
0%
10%
20%
30%
40%
50%
60%
70%
80%
90%
100%
Not importantat all (or didnot recreate
last year)
Slightlyimportant
Moderatelyimportant
Very important
Importance of outdoor recreation
Per
cent
of a
dults More than twice a week (101+
days)Once to twice a week (51 to100 days)
Once a month to once a week(11 to 50 days)Less than once a month (0 to10 days)
Amount of annual recreation
surprisingly, the importance ascribed to recreation is closely connected to theamount of recreation participation (Figure 11). Future assessments of thisquestion should prove most interesting.

Ten-year Forecasts of Minnesota Adult Outdoor Recreation Participation32
REFERENCES
1. Minnesota Department of Natural Resources. 2002. Minnesota’s 2003-2008State Comprehensive Outdoor Recreation Plan. Minnesota Department ofNatural Resources, Office of Management and Budget Services.
2. National Survey on Recreation and the Environment (NSRE). Data for 1994-95 reported in: H. Ken Cordell, Principal Investigator. 1999. OutdoorRecreation in American Life. Sagamore Publishing; and data for 2000-01reported in: H. Ken Cordell, Principal Author. 2004. Outdoor Recreationfor 21st Century America. Venture Publishing.
3. U. S. Department of the Interior, Fish and Wildlife Service, Division of FederalAssistance. Historical data on fishing and hunting license sales by state:http://federalaid.fws.gov/financialinfo/finainfo.html .
4. U. S. Department of the Interior, Fish and Wildlife Service and U. S.Department of Commerce, U. S. Census Bureau. 1955 to 2001 NationalSurvey of Fishing, Hunting, and Wildlife-Associated Recreation.
An analysis of these and related data are presented in: Kelly, Tim. 2005.Outdoor recreation participation trends in wildlife-related activities (fishing,hunting, wildlife observation) and recreational boating. A backgroundreport for Minnesota State Comprehensive Outdoor Recreation Planning.Minnesota Department of Natural Resources, Office of Management andBudget Services.
5. National Sporting Goods Association (NSGA). All sports participationinformation received in May 2005 directly from NSGA, Dan Kasen,Manager of Information Services. The May 2005 data set contained allrevisions to date made to the participation data, and, thus, may differ fromformer NSGA data sets that have not been revised.
6. Minnesota Department of Administration, Minnesota Planning, StateDemographic Center. (i) 2002. Minnesota Population Projections 2000 -2030; and (ii) 1998. Minnesota Population Projections 1995 - 2025.

33Minnesota Department of Natural Resources
7. U. S. Department of Commerce, U. S. Census Bureau. Minnesota decennialcensus population counts for 1900 to 2000.
8. Kelly, Tim. 2005. 2004 Outdoor Recreation Participation Survey ofMinnesotans: Report on Findings. Minnesota Department of NaturalResources, Office of Management and Budget Services.
9. Minnesota Department of Natural Resources (MN DNR). 1985-86 OutdoorRecreation Participation and Expenditure Survey of Minnesotans. Surveyconducted for the MN DNR by the Minnesota Center for Survey Research,University of Minnesota.
10. U.S. Department of Interior, National Park Service (NPS), Public UseStatistics Office. NPS attendance data from: http://www2.nature.nps.gov/stats/ .
11. Minnesota Department of Natural Resources, Division of Parks andRecreation. Historical attendance data on Minnesota State Parks.
12. Metropolitan Council. Historical visitation data for Twin Cities regional parksand trails.
13. U.S. Department of Agriculture, Forest Service, Superior National Forest.Historical May-September overnight permit data for the Boundary WatersCanoe Area Wilderness.

Ten-year Forecasts of Minnesota Adult Outdoor Recreation Participation34
APPENDIX A
INFORMATION ON ACTIVITY TRENDS AND DATA ANALYSISPROCEDURES FOR ACTIVITY PROJECTIONS
CONTENTS
Topic
Activity projection procedures . . . . . . . . . . . . . . . . . . . . . . . . . . . . . . . . . . .
Results of activity trend analysis . . . . . . . . . . . . . . . . . . . . . . . . . . . . . . . . .
Information for activity trend analysisActivity: Recreational boating, excluding fishing from a boat . . . . . . . . .Activity: Fishing and hunting of all types . . . . . . . . . . . . . . . . . . . . . . . .Activity: Visiting outdoor zoos . . . . . . . . . . . . . . . . . . . . . . . . . . . . . . . .Activity: Visiting historic or archaeological sites . . . . . . . . . . . . . . . . . . .Activity: Viewing, identifying or photographing birds
and other wildlife . . . . . . . . . . . . . . . . . . . . . . . . . . . . . . . . . . .
Activity: Offroad ATV driving . . . . . . . . . . . . . . . . . . . . . . . . . . . . . . . .Activity: Snowmobiling . . . . . . . . . . . . . . . . . . . . . . . . . . . . . . . . . . . . .
Activity: All remaining activities with trend estimates . . . . . . . . . . . . . . .
References for information sources . . . . . . . . . . . . . . . . . . . . . . . . . . . . . . . .
Page
35
36
37414243
43
4445
46
47

35Minnesota Department of Natural Resources
Activity projection procedures
The procedures used to derive activity projections follow a standard three-stepformat:
1. The measure of activity involvement over the most recent 10 years isnormalized by the relevant population to derive a per-capita data series.The measure of activity involvement is either the number of participants,amount of use, or registered recreational vehicles. The relevant populationmay be age specific (e.g., age 16+ for fishing licenses), and may refer to theU.S. as a whole or Minnesota or a portion of Minnesota (e.g., seven-countyTwin Cities metropolitan area).
2. A linear regression line is fit to the data series in #1, and the percent changealong the regression line between the first and tenth year is computed. Ifthe slope of the regression line is not statistically different from zero (whichoccurred in 3 of the 18 cases), the slope is set at zero (i.e., percent change isset to zero).
3. The percent change in #2 is assessed against the current (2004) percent ofpopulation participating in an activity to derive the percent participating 10years later in 2014. The 2014 percent is then multiplied by the projectedpopulation 10 years later to get the number of participants. The number ofparticipants is subsequently multiplied by the 2004 annual activity hoursper participant value to compute 2014 activity hours. The assumption ismade that added (and subtracted) activity participants are typical in terms ofactivity hours per year.
Steps 1 to 3 were done for all but two activities, whose measures were vehicleregistration trends. One of these (Minnesota ATV registrations) was examineddifferently because it was expanding so rapidly. ATV registrations over the last 10years were examined in three ways: (i) all of the 10 years, (ii) first 5 years, (iii) last5 years. All three of these measures (as shown below) are nearly the same, so theentire ten-year trend was used. The other of these was Minnesota snowmobileregistrations, which were rather erratic over the last 10 years, perhaps due—at leastin part—to variable snow conditions. Snowmobile registrations were examinedin the same way as ATV registrations: (i) all of the 10 years, (ii) first 5 years, (iii)last 5 years. The last 5 years differed materially from the first 5, so the last 5 wereused to derive the trend for the projections (see below for snowmobile data).

Ten-year Forecasts of Minnesota Adult Outdoor Recreation Participation36
Results of activity trend analysis
The results of the ten-year activity-participation trend analysis is shown in thetable below. The “participation rate change” in Table A-1 is the percent change instep 2 above. It is used to derive the ten-year projected activity participationrates, number of participants and activity hours.
Category ActivityRecent participation rate change
(percent)
A. Estimates based on MN-specific activity trend dataBoating of all types, excluding fishing from a boat -11.5%Fishing of all types -18.4%Visiting outdoor zoos -24.7%Visiting historic or archaeological sites -21.6%Viewing, identifying or photographing birds -22.0% and other wildlifeHunting of all types -11.2%Offroad ATV driving 251.9%Snowmobiling -16.8%
B. Estimates based on U.S. trend data closely related to target activityBiking (bicycling outdoors of all types, -38.5% including mountain biking)Camping of all types 15.8%Golfing 0.0%Outdoor field sports (e.g., soccer, softball/baseball -24.5% football)Inline skating, rollerblading, roller skating, roller skiing -44.8%Downhill skiing/snowboarding 0.0%Cross country skiing -51.4%
C. Estimates based on U.S. trend data somewhat related to target activityWalking/hiking (walking of hiking outdoors for 0.0% exercise or pleasure)Swimming or wading (all places) -24.8%Outdoor court sports (e.g., volleyball, basketball -31.6% tennis, horseshoes)Running or jogging 6.8%Ice skating/hockey outdoors -40.9%
D. No estimates due to lack of any trend dataDriving for pleasure on scenic roads or in a park ---Picnicking ---Visiting nature centers ---Sledding and snow tubing ---Viewing, identifying or photographing wildflowers, --- trees, natural vegetationGather mushrooms, berries, or other wild foods ---Horseback riding ---Snowshoeing ---
Estimates of recent activity participation rate changes used in ten-year projections
("recent" is last 10 years; participation rate = activity participants / population)
Table A-1

37Minnesota Department of Natural Resources
The data sources used for each activity are given in Table A-2 on the next page.All population figures—used to derive per-capita activity measures—are from theU.S. Census and are linearly interpolated between decennial census years; 2001-2004 figures are estimates from the U.S. Census Bureau.
Information for activity trend analysis
Activity: Recreational boating, excluding fishing from a boat
Five recreational boating studies have been conducted from the 1980s into recentyears. All five lead to the same conclusion regarding trends: the number of boatson the water has neither increased nor decreased significantly (changes areassessed statistically at the .05 level). In the studies, boats are counted fromaircraft on summer weekend/holiday afternoons.
The studies cover a range of boating conditions in Minnesota. Two large, veryintensely used boating resources are covered by the studies (Lake Minnetonkalocated in the western part of the Twin Cities metropolitan area—Figure A-1, andthe Lower St. Croix River located in the eastern part of the Twin Cities—FigureA-2). Other Twin Cities boating lakes are covered in a separate regional boatingstudy (Figure A-3). More rural, less intensely used lakes are covered by tworegional boating studies: one in Central and one in North Central Minnesota(Figure A-3). The more rural lake regions are used three to five times lessintensely than typical Twin Cities’ lakes.
In some of the studies fishing is a small portion of all boating (e.g., LakeMinnetonka and St. Croix River—less than 20% of all boating) and in others it isa larger portion (e.g., Central Lakes Region—just over 50% of all boating). Thestable boat numbers over time are assumed here to apply whether or not fishingfrom a boat is included or excluded.
The “participation rate trend” over the recent ten-year period is derived fromconstant boating use divided by the increase in population (age 16+) over theperiod. The per-capita data series indexed to 1994=100 is:
1994 1995 1996 1997 1998 1999 2000 2001 2002 2003 2004Index 100 99 97 96 95 94 93 92 91 90 88

Ten-year Forecasts of Minnesota Adult Outdoor Recreation Participation38
Tabl
e A-2
Cat
egor
yA
ctiv
ity
Sour
ce o
f in
form
atio
n us
ed to
est
imat
e ac
tivi
ty tr
end
A. E
stim
ates
bas
ed o
n M
N-s
peci
fic
acti
vity
tre
nd d
ata
Boa
ting
of
all t
ypes
, exc
ludi
ng f
ishi
ng f
rom
a b
oat
Boa
ting
stu
dies
fro
m M
N D
NR
and
MN
-WI
BA
CFi
shin
g of
all
type
sM
N D
NR
lice
nsed
ang
lers
Vis
itin
g ou
tdoo
r zo
osM
N Z
oo +
Dul
uth
Zoo
att
enda
nce
Vis
itin
g hi
stor
ic o
r ar
chae
olog
ical
sit
esM
HS
att
enda
nce
at n
ine
outd
oor
site
sV
iew
ing,
iden
tifyi
ng o
r ph
otog
raph
ing
bird
sU
SFW
S su
rvey
par
tici
patio
n ra
te f
or M
N w
ildli
fe w
atch
ing
a
nd o
ther
wild
life
Hun
ting
of
all t
ypes
MN
DN
R li
cens
ed h
unte
rsO
ffro
ad A
TV
dri
ving
MN
DN
R r
egis
tere
d A
TV
sSn
owm
obili
ngM
N D
NR
reg
iste
red
snow
mob
iles
B. E
stim
ates
bas
ed o
n U
.S. t
rend
dat
a cl
osel
y re
late
d to
tar
get a
ctiv
ity
Bik
ing
(bic
ycli
ng o
utdo
ors
of a
ll ty
pes,
NS
GA
par
tici
patio
n su
rvey
: Bic
ycle
Rid
ing
i
nclu
ding
mou
ntai
n bi
king
)C
ampi
ng o
f al
l typ
esN
SG
A p
arti
cipa
tion
surv
ey: C
ampi
ng (
vaca
tion/
over
nite
)G
olfi
ngN
SG
A p
arti
cipa
tion
surv
ey: G
olf
Out
door
fie
ld s
port
s (e
.g.,
socc
er, s
oftb
all/b
aseb
all
NS
GA
par
tici
patio
n su
rvey
: Bas
ebal
l + F
ootb
all (
tack
le)
+ F
ootb
all (
touc
h) +
Soc
cer
+ S
oftb
all
f
ootb
all)
Inlin
e sk
atin
g, r
olle
rbla
ding
, rol
ler
skat
ing,
rol
ler
skii
ngN
SG
A p
arti
cipa
tion
surv
ey: I
nlin
e R
olle
r S
kati
ngD
ownh
ill s
kiin
g/sn
owbo
ardi
ngN
SG
A p
arti
cipa
tion
surv
ey: S
kiin
g (a
lpin
e) +
Sno
wbo
ardi
ngC
ross
cou
ntry
ski
ing
NS
GA
par
tici
patio
n su
rvey
: Ski
ing
(cro
ss c
ount
ry)
C. E
stim
ates
bas
ed o
n U
.S. t
rend
dat
a so
mew
hat
rela
ted
to t
arge
t ac
tivi
tyW
alki
ng/h
ikin
g (w
alki
ng o
r hi
king
out
door
s fo
rN
SG
A p
arti
cipa
tion
surv
ey: H
ikin
g +
Exe
rcis
e W
alki
ng (
incl
udes
indo
or a
nd o
utdo
or p
arti
cipa
nts)
e
xerc
ise
or p
leas
ure)
Swim
min
g or
wad
ing
(all
plac
es)
NS
GA
par
tici
patio
n su
rvey
: Sw
imm
ing
(in
clud
es in
door
and
out
door
par
ticip
ants
)O
utdo
or c
ourt
spo
rts
(e.g
., vo
lley
ball,
bas
ketb
all
NS
GA
par
tici
patio
n su
rvey
: Bas
ketb
all +
Ten
nis
+ V
olle
ybal
l (in
clud
es in
door
and
out
door
par
tici
pant
s)
ten
nis,
hor
sesh
oes)
Run
ning
or
jogg
ing
NS
GA
par
tici
patio
n su
rvey
: Run
ning
/Jog
ging
(in
clud
es in
door
and
out
door
par
tici
pant
s)Ic
e sk
atin
g/ho
ckey
out
door
sN
SG
A p
arti
cipa
tion
surv
ey: I
ce/F
igur
e S
katin
g +
Hoc
key
(ice
) (i
nclu
des
indo
or a
nd o
utdo
or p
arti
cipa
nts
D. N
o es
tim
ates
due
to
lack
of
any
tren
d da
taD
rivi
ng f
or p
leas
ure
on s
ceni
c ro
ads
or in
a p
ark
---
Picn
icki
ng -
--V
isit
ing
natu
re c
ente
rs -
--Sl
eddi
ng a
nd s
now
tubi
ng -
--V
iew
ing,
iden
tifyi
ng o
r ph
otog
raph
ing
wil
dflo
wer
s, -
--
tre
es, n
atur
al v
eget
atio
nG
athe
r m
ushr
oom
s, b
erri
es, o
r ot
her
wil
d fo
ods
---
Hor
seba
ck r
idin
g -
--Sn
owsh
oein
g -
--
Sour
ces
of in
form
atio
n on
rec
ent a
ctiv
ity
part
icip
atio
n ra
te c
hang
es u
sed
in te
n-ye
ar p
roje
ctio
ns
("re
cent
" is
last
10
year
s)

39Minnesota Department of Natural Resources
Figure A-1
Lake Minnetonka Weekend/Holiday Afternoon Aerial Boat Counts*
0
500
1000
1500
2000
2500
1984 1985 1986 1987 1988 1989 1990 1991 1992 1993 1994 1995 1996 1997 1998 1999 2000
* excludes 4 inclement weather counts between 1984 and 2000
Num
ber
of B
oats
AverageMaximum
(N=6) (N=5) (N=6) (N=11) (N=13) (N=11) (N=12) (N=11)
Lower St. Croix River Weekend/Holiday Afternoon Aerial Boat Counts*
0
500
1000
1500
2000
2500
1983 1984 1985 1986 1987 1988 1989 1990 1991 1992 1993 1994 1995 1996 1997 1998 1999
*counts beginning between noon and 6 p.m. Source of data is MWBAC, 1983 to 1999.
Num
ber
of B
oats
Average
Maximum
(N=5) (N=6) (N=5) (N=5) (N=4) (N=8) (N=5) (N=4) (N=5)
Figure A-2

Ten-year Forecasts of Minnesota Adult Outdoor Recreation Participation40
Figure A-3
Trends in boating intensities on summer week-end/holiday afternoons
Acres perBoat
LowerIntensity
HigherIntensity
0
10
20
30
40
50
60
70
80
90
100
1984study
1996study
1985study
1998study
1987study
2001study
Metro Lakes(excluding Lake
Minnetonka & St.Croix River)
North CentralLakes
(excluding Lake MilleLacs)
Central Lakes
Regional BoatingStudies
Metro 1984 & 1996
North Central 1985 & 1998
WestCentral
1986
Central 1987 & 2001

41Minnesota Department of Natural Resources
Activity: Fishing and hunting of all types
Minnesota fishing and hunting participation trends are assessed through licensesales records maintained by the MN DNR. As part of federal aid apportionmentsince 1957, Minnesota has certified with the U.S. FWS the number of licensedhunters and anglers in Minnesota. The certification records, based on actuallicense sales, contain the resident/nonresident split in licensed individuals since1969.
For trend analysis, the resident (Minnesotan) information from 1994 to 2004 isused. The number of licensed Minnesotans is examined relative to the size of theMinnesota population (aged 16+) to get a measure of the participation rate inhunting and fishing (Figure A-4 and A-5). This participation rate is the per-capitadata series for trend analysis.
Percent of MN population (aged 16+) who hold a MN fishing license, 1969 to 2004
(Source: MN DNR & U.S. Bureau of the Census)
0%
5%
10%
15%
20%
25%
30%
35%
40%
45%
50%
1969
1971
1973
1975
1977
1979
1981
1983
1985
1987
1989
1991
1993
1995
1997
1999
2001
2003
MN senior anglers (age 65+) were notrequired to buy a license from 1973 to 1987
Figure A-4

Ten-year Forecasts of Minnesota Adult Outdoor Recreation Participation42
Figure A-5
Percent of MN population (aged 16+) who hold a MN hunting license, 1969 to 2004
(Source: MN DNR & U.S. Bureau of the Census)
0%
5%
10%
15%
20%
25%
1969
1971
1973
1975
1977
1979
1981
1983
1985
1987
1989
1991
1993
1995
1997
1999
2001
2003
Activity: Visiting outdoor zoos
The measure of activity involvement over the most recent 10 years is annual zooattendance at the Minnesota plus Duluth Zoo from 1994 to 2004. Zoo attendanceis normalized by the Minnesota population to derive the per-capita data series fortrend analysis. The per-capita data series indexed to 1994=100 is:
1994 1995 1996 1997 1998 1999 2000 2001 2002 2003 2004Index 100 95 95 104 105 93 87 84 80 77 79

43Minnesota Department of Natural Resources
Activity: Visiting historic or archaeological sites
The measure of activity involvement over the most recent 10 years is annualattendance at nine outdoor sites maintained by the Minnesota Historical Society.Site attendance from 1994 to 2004 is normalized by the Minnesota population toderive the per-capita data series for trend analysis. The nine sites are: ForestHistory Center, Forestville, Fort Ridgely, Fort Snelling, Jeffers Petroglyphs,Kelley Farm, Lower Sioux Agency, North West Company Fur Post, and SplitRock Lighthouse.
The per-capita data series indexed to 1994=100 is:
1994 1995 1996 1997 1998 1999 2000 2001 2002 2003 2004Index 100 98 95 94 97 95 94 97 86 83 69
Activity: Viewing, identifying or photographing birds and other wildlife
The measure of activity involvement over a recent 10-years period comes from the1991 and 2001 National Survey of Fishing, Hunting, and Wildlife-AssociatedRecreation from the U.S. Fish and Wildlife Service and the U.S. Census Bureau.The surveys measure the percent of the Minnesota population (aged 16+) thatparticipates annually in wildlife-watching. Wildlife-watching is broken into twotypes: (1) away from home; and (2) total, which includes away from home plusnear-home activity. “Away from home” is over one mile from home.
The participation rate change from 1991 to 2001 for each of the two types ofwildlife-watching is: (1) away from home = -35.5%; and (2) total = -8.5%. Sinceboth types are relevant to the target activity, and since they differed by such alarge margin, the two were averaged for application here (average = -22.0%).

Ten-year Forecasts of Minnesota Adult Outdoor Recreation Participation44
Activity: Offroad ATV driving
The measure of activity involvement over a recent ten-year period comes from theMN DNR recreational ATV registration files. Registered ATVs from 1994 to2004 are normalized by the Minnesota population (aged 16+) to derive the per-capita data series for trend analysis.
ATVs are increasing very rapidly in Minnesota. For this reason, the per-capitadata series was examined differently than for other activities. ATV registrationsper capita over the last 10 years were examined in three ways: (i) all of the 10years, (ii) first 5 years, (iii) last 5 years:
Average annual percent Period growth for period1994 to 2004 13.4%1994 to 1999 13.0%1999 to 2004 13.8%
Because the growth rate for all three of these periods are nearly the same, the entire10-year average from 1994 to 2004 was used. When extrapolated for the next 10years, a 13.4 percent annual growth rate leads to a 252 percent increase.

45Minnesota Department of Natural Resources
Activity: Snowmobiling
The measure of activity involvement over a recent 10-years period comes from theMN DNR recreational snowmobile registration files. Registered snowmobilesfrom 1994 to 2004 are normalized by the Minnesota population (aged 16+) toderive the per-capita data series for trend analysis.
Snowmobile registrations have been erratic in Minnesota over the last 10 years,perhaps due—at least in part—to variable snow conditions. For this reason, theper-capita data series was examined differently than for other activities (examinedsame way as ATVs). Snowmobile registrations per capita over the last 10 yearswere examined in three ways: (i) all of the 10 years, (ii) first 5 years, (iii) last 5years:
Average annual percent Period growth for period1994 to 2004 1.6%1994 to 1999 5.0%1999 to 2004 -1.8%
Because the growth rates for all three of these periods are so different, the mostrecent five-year period was selected as the most appropriate for projecting over thenext 10 years. When extrapolated for the next 10 years, a -1.8% percent annualgrowth rate leads to a 17 percent decrease.

Ten-year Forecasts of Minnesota Adult Outdoor Recreation Participation46
Activity: All remaining activities with trend estimates
For all remaining activities for which estimates can be made (Table A-1), themeasure of activity involvement over a recent 10-year period comes from theannual participation survey of the National Sporting Goods Association (NSGA).NSGA has yearly reports on national participation in various recreation activities.NSGA activities were matched as closely as possible to the target activities for thisstudy (Table A-2). In some cases, the target activity involved summing NSGAactivities, and these are indicated in Table A-2. NSGA participation wasnormalized by the U.S. population (aged 7+) to derive the per-capita data seriesfor trend analyses.
The per-capita data series for each target activity indexed to 1994=100 is:
Activity 1994 1995 1996 1997 1998 1999 2000 2001 2002 2003 2004
Biking 100 112 104 87 83 80 80 72 72 69 72Camping 100 98 101 105 103 110 108 104 117 111 114Golfing 100 96 91 102 106 103 99 99 100 93 88Outdoor field sports nd 100 104 95 93 92 86 84 85 80 81Inline skating, and related 100 121 128 131 132 116 104 90 88 73 53
Downhill skiing/snowboarding 100 94 104 88 85 79 86 94 92 92 87Cross country skiing 100 93 92 67 70 58 60 59 55 48 58Walking/hiking 100 98 101 105 104 106 102 99 103 101 104Swimming/wading 100 101 97 95 92 90 90 83 80 78 78Outdoor court sports 100 105 105 100 92 86 80 82 81 75 75
Running or jogging 100 99 105 101 104 102 103 109 109 104 106Ice skating/hockey outdoors 100 101 105 97 97 92 83 71 nd 65 nd

47Minnesota Department of Natural Resources
References for information sources
ACTIVITY INFORMATION
Note: Activity trend information and related analyses for recreational boating,hunitng, fishing, and wildlife-watching are available in a separate report:Kelly, Tim. 2005. Outdoor recreation participation trends in wildlife-relatedactivities (fishing, hunting, wildlife observation) and recreational boating. Abackground report for Minnesota State Comprehensive Outdoor RecreationPlanning. Minnesota Department of Natural Resources, Office ofManagement and Budget Services.
Activity: Recreational boating, excluding fishing from a boatMinnesota Department of Natural Resources:
1997. Boating in the Twin Cities Metropolitan Area: Current Status (1996)and Trends Since 1984.
1999. Boating in North Central Minnesota: Status in 1998 and TrendsSince 1985.
2001. Boating Trends on Lake Minnetonka, 1984 to 2000. Boatingstudies are done in cooperation with the Lake Minnetonka ConservationDistrict.
2002. Boating in Central Minnesota: Status in 2001 and Trends Since1987.
Minnesota-Wisconsin Boundary Area Commission:Recreational boating studies (ever two years from 1983 to 1999) of the
Lower St. Croix National Scenic Riverway.
Activity: Fishing and hunting of all typesMinnesota Department of Natural Resource. Historical information on
licensing of hunters and anglers.
Activity: Visiting outdoor zoosHistorical attendance information received in May-June 2005 from Minnesota
Zoo and Duluth Zoo.

Ten-year Forecasts of Minnesota Adult Outdoor Recreation Participation48
Activity: Visiting historic or archaeological sitesHistorical attendance information received in May-June 2005 from Minnesota
Historical Society.
Activity: Viewing, identifying or photographing birds and other wildlifeU. S. Department of the Interior, Fish and Wildlife Service and U. S.
Department of Commerce, U. S. Census Bureau. National Survey ofFishing, Hunting, and Wildlife-Associated Recreation. Survey years 1991to 2001.
Activity: Offroad ATV drivingMinnesota Department of Natural Resource. Historical information on
recreational vehicle registrations.
Activity: SnowmobilingMinnesota Department of Natural Resource. Historical information on
recreational vehicle registrations.
Activity: All remaining activities with trend estimatesAnnual national survey information from National Sporting Goods
Association (NSGA) through 2004. All information received in May 2005directly from NSGA, Dan Kasen, Manager of Information Services. TheMay 2005 data set contained all revisions to date made to the participationdata, and, thus, may differ from former NSGA data sets that have not beenrevised.
POPULATION INFORMATION
U. S. Department of Commerce, U. S. Census Bureau. U.S. and Minnesotadecennial census population counts for 1960 to 2000, and U.S. and Minnesotapopulation estimates for 2001 to 2004.
Minnesota Department of Administration, Minnesota Planning, StateDemographic Center. 2002. Minnesota Population Projections 2000 - 2030.