ten facts about inequality in advanced economies
TRANSCRIPT

Peterson Institute for International Economics17 October 2019
Ten facts about inequality in advanced economies
Lucas ChancelCo-director and Senior Economist
World Inequality Lab, Paris School of Economics

2
Survey paper « Ten key facts about inequality in advanced economies »
1. Inequality data remains scarce in the digital age
2. Income inequality is on the rise after a historical decline
3. Nations became richer but govts. became poorer
4. Capital is back, for a few
5. No sign of a new normal since the Great Recession
This presentation: the inequality landscape in advanced economies

3
Survey paper « Ten key facts about inequality in advanced economies »
6. Global inequality is now more about class than nationality
7. Higher inequality is associated with less social mobility
8. Gender and racial inequalities remain high, particularly at the top
9. Predistribution policies drive US/EU growth differentials at the bottom
10. Progressive taxation is key to curb extreme inequality at the top
This presentation: the inequality landscape in advanced economies

4
Inequality data remains scarce in the digital age

5
A significant share of capital income is not recorded on tax recordsReconciling national capital income andcapital income reported on tax returns
0%
5%
10%
15%
20%
25%
30%
1916
1920
1924
1928
1932
1936
1940
1944
1948
1952
1956
1960
1964
1968
1972
1976
1980
1984
1988
1992
1996
2000
2004
2008
2012
% o
f nat
iona
l inc
ome
From taxable to total capital income
Didivends, interest, rents & profits reported on tax returns
Imputed rents + property tax
Retained earnings
Income paid to pensions & insurance
Non-filers & other
Corporate income tax
Source: Appendix Table I-S.A8.
Composition of capital income in the US, 1916-2012
Source: Piketty, Saez, Zucman (2018)
2/3 not reported on
tax data

6
Distributional national accounts: systematic combination of survey, tax and national accountsdata to distribute 100% of macroeconomic growth
Top 10% income share in Germany and France, 1995-2015: Survey vs. tax vs. Distributional National Accounts (DINA)
Top 10% Survey
Top 10%Tax
Germany France
Top 10% Survey
Top 10%Tax
Top 10% DINASurvey+Tax+Nat. Acc.
Top 10% DINASurvey+Tax+Nat. Acc.
Source: Author based on Blanchet, Chancel and Gethin (2019)

7
Income inequality is on the riseafter a historical decline

8
After a historical decline, income inequality rose at different speeds
Top 1% income share across the world, 1900-2018(decennial averages)
0
5
10
15
20
25
1900 1910 1920 1930 1940 1950 1960 1970 1980 1990 2000 2010
% n
atio
nal i
ncom
e
India Russia USA Western Europe China
Source: Author based on WID.world (2019)
0
5
10
15
20
25
1900 1910 1920 1930 1940 1950 1960 1970 1980 1990 2000 2010
% n
atio
nal i
ncom
e
USA Western Europe

9
After a historical decline, income inequality rose at different speeds
Top 1% income share across the world, 1900-2018(decennial averages)
0
5
10
15
20
25
1900 1910 1920 1930 1940 1950 1960 1970 1980 1990 2000 2010
% n
atio
nal i
ncom
e
India Russia USA Western Europe China
Source: Author based on WID.world (2019)
0
5
10
15
20
25
1900 1910 1920 1930 1940 1950 1960 1970 1980 1990 2000 2010
% n
atio
nal i
ncom
e
USA Western Europe
0
5
10
15
20
25
1900 1910 1920 1930 1940 1950 1960 1970 1980 1990 2000 2010
% to
tal i
ncom
e
USA Western Europe Japan AU-NZ
10
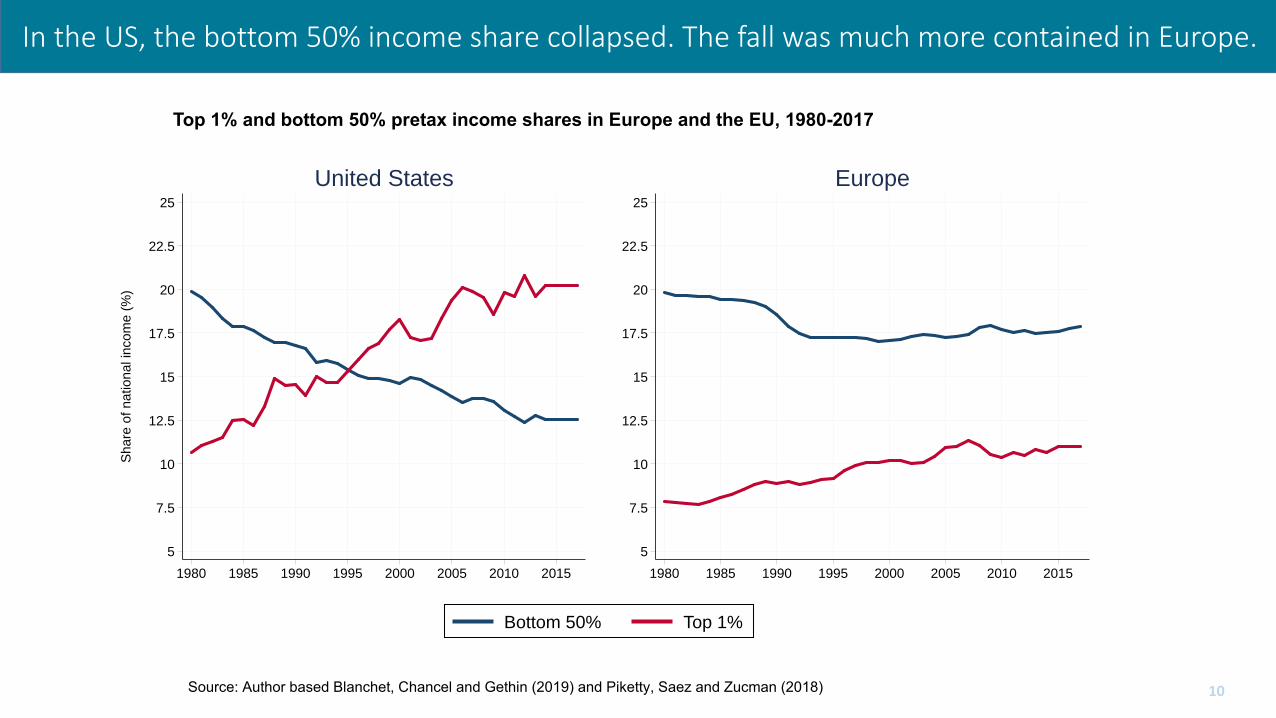
In the US, the bottom 50% income share collapsed. The fall was much more contained in Europe.
52 How Unequal Is Europe?
Figure 26: Income inequality trends in Europe and the US, 1980-2017
(a) Bottom 50% vs. Top 1% income shares
5
7.5
10
12.5
15
17.5
20
22.5
25
Shar
e of
nat
iona
l inc
ome
(%)
1980 1985 1990 1995 2000 2005 2010 2015
United States
5
7.5
10
12.5
15
17.5
20
22.5
25
1980 1985 1990 1995 2000 2005 2010 2015
Europe
Bottom 50% Top 1%
(b) Growth Incidence Curves
0
100
200
300
400
500
600
700
Tota
l inc
ome
grow
th (%
)
10 20 30 40 50 60 70 80 90 99 99.9 99.99 99.999Income group (percentile)
United States Europe
Source: authors’ computations combining surveys, tax data and national accounts for Europe;Piketty, Saez, and Zucman (2018) for the United States.
WID.world Working Paper 2019–6
Top 1% and bottom 50% pretax income shares in Europe and the EU, 1980-2017
Source: Author based Blanchet, Chancel and Gethin (2019) and Piketty, Saez and Zucman (2018)

11
Capital is back, for a few

12
Wealth inequality has been rising at different speeds since the 1980s
Top 1% wealth share in the US and Europe, 1910-2014
0%
10%
20%
30%
40%
50%
60%
70%
1910 1920 1930 1940 1950 1960 1970 1980 1990 2000 2010
Top
1% p
erso
nal w
ealth
sha
reFrance United Kingdom
USA Sweden
Source: Author using WID.world data. Distribution of per adult personal wealth.

13
The return of wealth inequality in the US is mainly driven by the very top of the distribution. Dynamic of savings rate played a huge role in driving these trends.
Wealth inequality in the US, 1913-2012
0%
5%
10%
15%
20%
25%
30%
1910 1920 1930 1940 1950 1960 1970 1980 1990 2000 2010
Shar
e of
hou
seho
ld w
ealth
(%)
Top 0.1%
Top 1-0.1%
Source: Saez and Zucman (2016)

14
Wealth at the top grew 3x faster than avg. wealth, 9x faster than avg. income
Source: Author based on WID.world (2019) and Blanchet (2018)
Top 1/100 million (Forbes) 8.9%
Top 1/20 million (Forbes) 8.8%
Top 0.01% (WID.world) 6.1%
Top 0.1% (WID.world) 4.9%
Top 1% (WID.world) 4.0%
Average wealth 2.7%
Average income 1.0%
Annual real wealth growth per adult, 1987-2017
Wealth group US + EU

15
Nations have become richerbut governments have become poor

16
Net private wealth has risen since the 1970s while public wealth collapsed
iii. why does the eVolution of PriVate and PubliC CaPital ownershiP matter for inequality?
Economic inequality is largely driven by the unequal ownership of capital, which
can be either privately or public owned. We show that since 1980, very large
transfers of public to private wealth occurred in nearly all countries, whether
rich or emerging. While national wealth has substantially increased, public
wealth is now negative or close to zero in rich countries. Arguably this limits the
ability of governments to tackle inequality; certainly, it has important implica-
tions for wealth inequality among individuals.
over the past decades, countries have become richer but governments have become poor.
▶ the ratio of net private wealth to net national income gives insight into the total value of wealth commanded by individuals in
-100%
0%
100%
200%
300%
400%
500%
600%
700%
800%
2015201020052000199519901985198019751970
Val
ue
of
net
pu
blic
an
d p
riva
te w
ealt
h (%
of
nat
ion
al in
com
e)
In 2015, the value of net public wealth (or public capital) in the US was negative (-17% of net national income) while the value of net private wealth or private capital as o national income In , net public ealth amounted to o national income hile the figure as or net
private wealth. Net private wealth is equal to new private assets minus net private debt. Net public wealth is equal to public assets minus public debt.
Source: WID.world (2017). See wir2018.wid.world for data series and notes.
Spain
France
Germany
UK
Japan
US
Private capital
Public capital
Figure e6 the rise of private capital and the fall of public capital in rich countries, 1970–2016
exeCutIve summary
World inequalit y report 201814
Private and public capital in rich countries, 1970-2015
Source: Alvaredo, Chancel, Piketty, Saez and Zucman (2018)

Higher inequality is associatedwith lower social mobility

18
40%
50%
60%
70%
80%
90%
100%
1940 1945 1950 1955 1960 1965 1970 1975 1980 1985
Perc
enta
ge o
f chi
ldre
n ea
rnin
gm
ore
than
thei
r par
ents
at a
ge 3
0
Birth cohort
Absolute mobility (% children earning more than their parents) declined in the US since the 1970s while relative mobility (% low income individuals making it to the top) was broadly stable.
Absolute income mobility in the US, 1970-2014
Source: based on data from Chetty et al., 2017.
In 2014, 50% ofAmericans aged30 earned morethan their parents.
In 1970, 92% ofAmericans aged 30earned more thantheir parents.

19
Gender and racial inequalitiesremain high after a historical decline

20
Gender inequality declined since the 1960s thanks to the rise of female participation & reduction of gender pay gap, but the gap remains high.
Source: Piketty, Saez and Zucman, 2018. Men and women aged 20-64.
Gender inequality in the US, 1962-2014(average pretax labor income of men aged 20-64 / of women aged 20-64)
In 2014, men earned 75% more than women

21
Gender inequality remains particularly high at the top of the distribution in rich countries
Share of women by income group in France, 1970-2012
Source: Garbinti, Goupille and Piketty, 2018

22
Equal access to education, health and well-paid jobs are key to lift pretax income at the bottom of the distribution
23
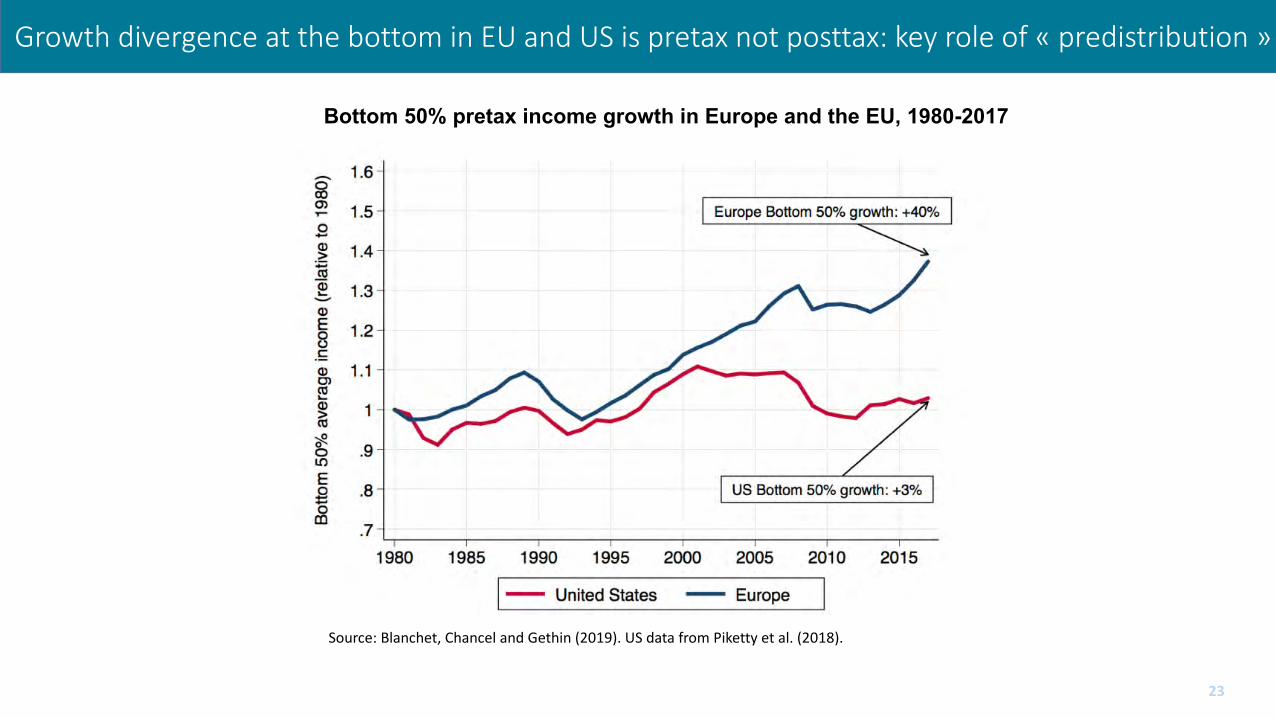
Growth divergence at the bottom in EU and US is pretax not posttax: key role of « predistribution »
Bottom 50% pretax income growth in Europe and the EU, 1980-2017
Source: Blanchet, Chancel and Gethin (2019). US data from Piketty et al. (2018).

24
Inequality in access to higher education is particularly strong in the US
intergenerational mobility is lo er in areas ith larger A rican-American populations o ever, in areas ith large A rican-Amer-
ican populations, both blacks and whites have lower rates of upward income mobility, indi-cating that social and environmental causes other than race, such as differences in history and institutions, may play a role. spatial and social segregation is also negatively associ-ated with upward mobility. in particular, longer commuting time decreases opportuni-ties to climb the social ladder, and spatial segregation o the poorest individuals has a stronger negative impact on mobility his suggests that the isolation o lo er-income amilies and the di ficulties they e perience
in reaching ob sites are important drivers o social immobility.
income inequality at the local level, school quality, social capital, and family structure are also important actors igher income ine uality among the poorest o indi-
viduals is associated with lower mobility.15 Mean hile, a larger middle class stimulates upwards mobility.16 igher public school e penditures per student along ith lo er class si es signi icantly increase social mobility igher social capital also avors mobility or e ample, areas ith high involve-ment in community organi ations 17 finally, amily structure is also a ey determinant
upward mobility is substantially lower in areas here the raction o children living in single-
parent households, or the share of divorced parents, or the share of non-married adults is higher
hat is remar able is that combining these actors e plains very e ectively social
mobility patterns a en together, ive actors commuting time, income ine uality
among the poorest individuals, high-school dropout rates, social capital, and the raction o children ith single parents
e plain o ine ualities in up ard mobility
30% of children whose parents are in the Bottom 10% of the income distribution attend college between age 18 and 21. Almost 90% of children whose parents are in the Top 10% of the income distribution attend college between age 18 and 21.
Source: Chetty, Hendren, Kline and Saez (2014). See wir2018.wid.world for data series and notes.
20%
40%
60%
80%
100%
1009080 706050403020100
Sh
are
of
chil
dre
n w
ho
att
en
d c
oll
ege
b
etw
ee
n a
ge 1
8-2
1 (%
)
Parent income rank
Figure 5.4.1 College attendance rates and parent income rank in the us for children born in 1980–1982
Part v taCklinG eConomiC inequalit y
World inequalit y report 2018270
College attendance rate and parent income rank in the US for children born in 1980-1982
~90% of childrenfrom the top 10% US attend college
~30% of childrenfrom the bot. 20% US attend college

25
Anglo-Saxon countries largely rely on private higher eductation funding. Central EU + Scandinavian countries essentially rely on public.
0%
10%
20%
30%
40%
50%
60%
70%
United States UK/Canada/AU/NZ France/Italy/Spain Germany/Austria/Scandinavia
Shar
e of
priv
ate
fund
ing
in to
tal e
xpen
ditu
res
(%)Share of private funding in higher education, 2014
Higher education
Primary-secondary
Source: Piketty, 2019 based on OECD (2014)

26
Minimum wage reduced by 30% in the US since the 1970s, multiplied by x3 in France, introduced in Germany, UK. Scandinavian countries: branch agreements + high union density.
0
2
4
6
8
10
12
0
2
4
6
8
10
12
20152010200520001995199019851980197519701965196019551950
US
ho
url
y m
inim
um
wag
e (C
on
stan
t 2
01
6 $
)
Fre
nch
ho
url
y m
inim
um
wag
e (2
01
6 €
PP
P)
Between 2000 and 2016, the hourly minimum wage rose from €7.9 to €9.7 in France, while it rose from $7.13 to $7.25 in the US. Income estimates are calculated using Purchasing Power Parity (PPP) euros for France and dollars for the US. For comparison, €1 = $1.3 = ¥4.4 at PPP. PPP accounts for differences in the cost of living bet een countries Values are net o inflation
France (2016 €)
Source: Piketty (2014) and updates. See wir2018.wid.world for data series and notes.
US (2016 $)
Figure 5.4.3 minimum wage in France and the us, 1950–2016
taCklinG eConomiC inequalit y
World inequalit y report 2018 277
Part v
Minimum wage in France and the US, 1950-2016

27
Shifts in progressive taxation fueledinequality at the top

28
Progressive taxation was reduced since the 1980s, different patterns across countries.
0%
20%
40%
60%
80%
100%
201020001990198019701960195019401930192019101900
To
p m
arg
ina
l ta
x r
ate
(%
)
Between 1963 and 2017, the top marginal tax rate of income tax (applying to the highest incomes) in the US fell from 91% to 40%.
Sources: Piketty (2014) and updates. See wir2018.wid.world for data series and notes.
France
Germany
UK
Japan
US
Figure 5.2.2 top income tax rates in rich countries, 1900–2017
0%
20%
40%
60%
80%
100%
201020001990198019701960195019401930192019101900
To
p m
arg
ina
l ta
x r
ate
(%
)
Source: Piketty (2014) and updates. See wir2018.wid.world for data series and notes.
Between 1980 and 2017, the top marginal tax rate of inheritance tax (applying to the highest inheritances) in the UK fell from 75% to 40%.
France
Germany
UK
Japan
US
Figure 5.2.3 top inheritance tax rates in rich countries, 1900–2017
Part v taCklinG eConomiC inequalit y
World inequalit y report 2018260

29
Changes in top tax rates relatively associated to changes in top income shares.
suggests that top ta rates play a ey role in moderating pre-ta top incomes In addition, there as no significant impact on gro th, suggesting again that bargaining elasticities are more important than incentive effects.
a window of opportunity for tax progressivity?
Figure 5.2.2 presents in detail the evolution o top marginal income ta rates in the nited states, the uk, Germany, france, and Japan since In the five countries, there as either no personal income ta ation or there was a very modest of it at the turn of the t entieth century Income ta as then intro-duced, partly to finance the irst orld ar, and top marginal ta rates ere brought to very high levels in the s op ta rates rose up to 94% in the united states, 98% in the uk.) top rates were then drasti-cally reduced from the 1970s onwards (from
on average in these countries to on average in the mid- s
o to account or these movements p until the 1970s, policymakers and public opinion probably considered rightly or
rongly that at the very top o the income ladder, compensation increases reflected mostly greed or other socially aste ul activ-ities rather than productive work effort. this is why the united states and uk were able to set marginal ta rates as high as More recently, the eagan/ hatcher revolution succeeded in ma ing such top ta rate levels unthinkable, at least for a while. but after decades o increasing income concentration that has brought about mediocre gro th since the s, and a Great ecession trig-gered by inancial sector e cesses, a rethin ing o the eagan and hatcher poli-cies is perhaps underway—at least in some countries.
op marginal income ta increased in the united states, uk, Germany, france, and Japan over the past ten years. the united Kingdom, or instance, increased its top
Ch
an
ge in
To
p 1
% in
com
e s
ha
re
(pe
rce
nta
ge p
oin
ts)
Change in top marginal tax rate (percentage points)
UK
Spain
GermanySwitzerland
FranceDenmark
Netherlands
Canada
Australia
ItalyFinland
Sweden
Norway
Japan
In the US, the top marginal income tax rate was reduced by 33 percentage points between the early 1970s and the early 2010s. During the same period of time, the Top 1% income share increased by 9.5 percentage points.
Portugal
Source: Piketty, Saez and Stantcheva (2014). See wir2018.wid.world for data series and notes.
USA
Ireland
NZ
-40 -30 -20 -10
0
100
2
4
6
8
10
Figure 5.2.1 Changes in top marginal tax rates and top income shares in rich countries since the 1970s
taCklinG eConomiC inequalit y
World inequalit y report 2018 259
Part v

30
§ Return of inequality since the 1980s, no clear trend inversion after 2008 crisis
§ Large divergence across countries: policies matter a lot beyond trade and tech
§ US/Europe growth differentials at the bottom: importance of « predistribution » policies (e.g. education, health, high-paid jobs)
§ Growth at the top: role of progressive taxation
§ Education, health need to be financed: need to reconsider role of « pre » and « re » distribution as complementary tools, not substitutes
Concluding remarks