temple universityfact book 2013–2014
TRANSCRIPT

TEMPLE UNIVERSITY
Fact Book 2013–2014

i
Table of Contents
Table of Contents i
Section 1: Institutional Facts 1
Temple University At a Glance 3 1.1 Board of Trustees 5 1.2 Honorary Life Trustees 6 1.3 Ex Officio Trustees 6 1.4 Temple’s Presidents, 1887‐2012 7 1.5 Temple’s Current President 8 1.6 President Theobald’s Six Core Commitments for Temple’s Success 9 1.7 Mission Statement 10 1.8 University Officers 11 1.9 Schools and Colleges 12 1.10 Campuses 13 1.11 Accreditation 14 1.12 Temple Health 15
Section 2: Student Admissions 17
2.1 Incoming Freshmen 19 2.2 Incoming Transfers 20 2.3 Graduate and Professional Admissions 21 2.4 Student Admissions ‐ Section Appendix 22
Section 3: Student Enrollment 25
3.1 Enrollment Headcount by School/College and Level – Matriculated 27 3.2 Enrollment Headcount by School/College and Level – Non‐Matriculated 28 3.3 Enrollment by Campus 29 3.4 Enrollment by Demographics 30 3.5 Undergraduate Enrollment by State 31 3.6 Undergraduate Enrollment by Pennsylvania County 32 3.7 Undergraduate Enrollment by Country 33 3.8 Student Enrollment – Section Appendix 34
Section 4: Student Success 35
4.1 Degrees Conferred 37 4.2 Undergraduate Retention and Graduation Rates 38 4.3 Student Success – Section Appendix 39
Section 5: Temple University Japan (TUJ) 41
5.1 Temple University Japan Admissions 43 5.2 Temple University Japan Enrollment by School/College 44 5.3 Temple University Japan Enrollment by Demographics 45
NOTE: Temple University Japan Campus (TUJ) is excluded unless otherwise stated. For more information on TUJ, proceed to Section 5.

ii
Section 6: Instruction and Academic Degree Programs 47
6.1 Instructional Characteristics 49 6.2 Academic Degree Programs 49
Section 7: Residential and Student Life 51
7.1 Student Organizations 53 7.2 Athletics 53 7.3 Undergraduate Residence Halls 54 7.4 Graduate Residence Halls 54 7.5 Temple Sponsored Housing 54 7.6 Residential and Student Life – Section Appendix 55
Section 8: Community Engagement 57
8.1 Temple in the Community 59
Section 9: Alumni and Philanthropy 61
9.1 Alumni 63 9.2 Alumni Distributed by State 63 9.3 Alumni Distributed by Pennsylvania County 63 9.4 Philanthropic Giving 64
Section 10: Faculty, Staff and Administration 65
10.1 University Faculty, Staff and Administration 67 10.2 University Faculty, Staff and Administration – Section Appendix 68
Section 11: Finance 69
11.1 General Tuition and Fees 71 11.2 Financial Aid by Source 72 11.3 Endowments 73 11.4 Operating Budget 74 11.5 Finance – Section Appendix 75
Section 12: Facilities 77
12.1 Physical Plant 79 12.2 Main Campus Map 80 12.3 Physical Plant ‐ Utility Expenditures 81
Section 13: Research and Technology Transfer 83
13.1 Technology Development and Commercialization 85 13.2 Research and Technology Transfer – Section Appendix 86
Section 14: Information Technology 87
14.1 The TECH Center 89 14.2 Information Technology Resources 90 14.3 Information Technology Usage 90

Introduction The Temple University Fact Book and Temple University At a Glance are compiled by the Office of
Institutional Research and Assessment (IRA). These documents are designed to provide a convenient
and concise source of information from key university units. The facts and figures presented are intended
to answer frequently requested inquiries.
IRA collects data and provides accurate and actionable information and analysis to university decision-
makers, the Temple community and external stakeholders. This information is used for assessment,
planning, policy formulation and mandated reporting. IRA is committed to fostering a culture of continuous
improvement that advances the university's mission and strategic goals.
See appendices at the conclusion of each section for further details and definitions. It is important to note
that the information in this fact book may differ from data reported by IRA to federal, state and regional
agencies due to differences in reporting guidelines, reporting definitions and the timing of when
information was prepared.
A comprehensive document of this magnitude requires the assistance of a number of people across the
University community. Many thanks to all that have contributed to this fact book. A special thanks to the
Office of Strategic Marketing and Communications for their contributions to the Temple At a Glance and
the Temple Fact Book.
For more information, please visit our website: www.temple.edu/ira
Any questions concerning the material presented in this book should be directed to:
The Office of Institutional Research and Assessment
301 Conwell Hall
1801 N. Broad Street
Philadelphia, PA 19122

SECTION 1
Institutional Facts

Temple University Fact Book 2013 – 2014 Page | 2

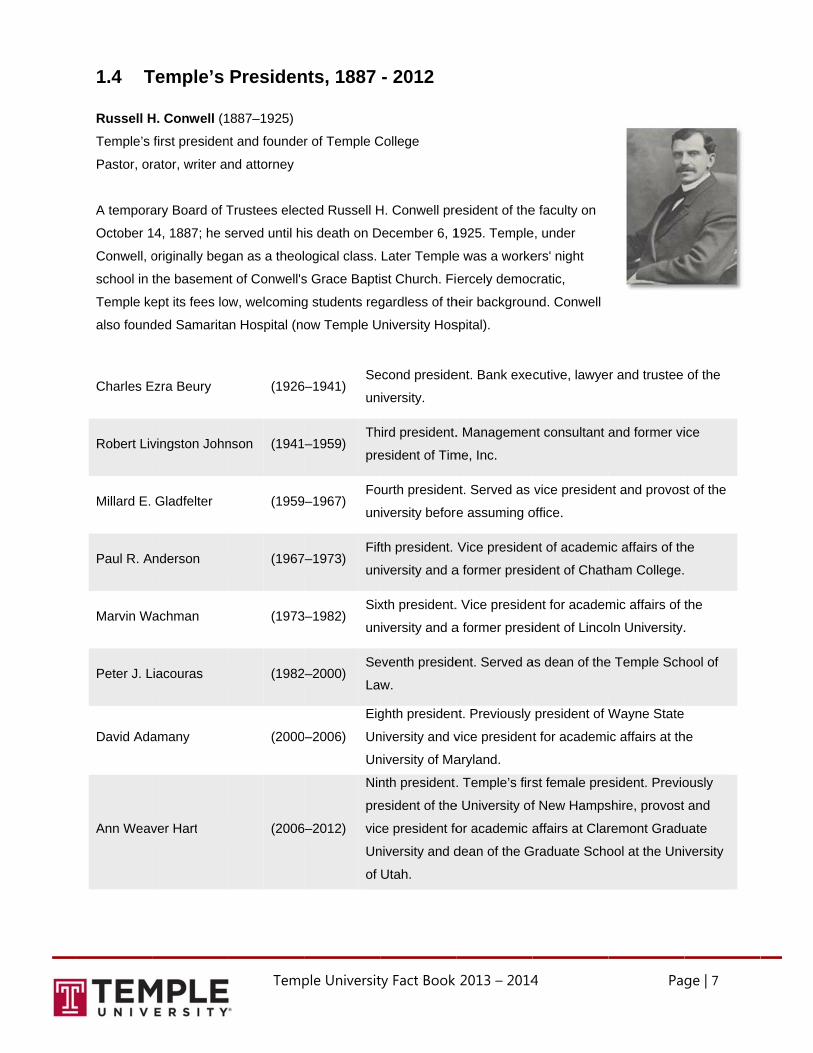
TEMPLE UNIVERSITY is a public, four-year research university and a national leader in education, research and healthcare. Founded by Dr. Russell H. Conwell in 1884, Temple’s official motto—Perseverantia Vincit, or Perseverance Conquers—reflects its students’ drive to succeed and commitment to excellence.
Temple is a vital institution in the Philadelphia region and commonwealth of Pennsylvania, contributing more than $3 billion toward Pennsylvania’s economy each year. The university also has a strong global reach, with long-standing and vibrant campuses in Tokyo and Rome, programs in London, Beijing and other locations worldwide, and nearly 300,000 alumni living around the world.
Carnegie Classification: RU/H Research University w/ High Research Activity
UNIVERSITY LEADERSHIPBoard of Trustees Patrick J. O’Connor Chair
President Neil D. Theobald Temple’s 10th President
University Officers
William T. BergmanVice President and Special Assistant to the President
Kevin G. ClarkVice President and Director of Athletics
Karen B. ClarkeVice President for Strategic Marketing and Communications
James P. CreedonSenior Vice President for Construction, Facilities and Operations
Hai-Lung DaiProvost and Senior Vice President for Academic Affairs
Michael GebhardtInterim University Counsel
Ken KaiserVice President, Chief Financial Officer and Treasurer
Larry R. KaiserSenior Executive Vice President for Health Affairs; President and Chief Executive Officer, Temple Health; Dean, Temple University School of Medicine
Kenneth LawrenceSenior Vice President for Government, Community and Public Affairs
Tilghman H. Moyer IVInterim Senior Vice President for Institutional Advancement
Timothy O’RourkeVice President for Computer and Financial Services and Chief Information Officer
Theresa A. PowellVice President for Student Affairs
ADMISSIONS (FALL 2013)
Incoming Freshmen Completed applications 18,813 Admitted 12,016 Enrolled 4,390 Percent admitted 63.9% Percent admitted who enrolled 36.5%
Incoming Transfers Completed applications 5,133 Admitted 4,158 Enrolled 2,716 Percent admitted 81.0% Percent admitted who enrolled 65.3%
Total Undergraduate Applicants 23,946
Freshman Quality Indicators Average SAT (combined math & verbal) 1129 Average ACT composite score 24 Average high school GPA 3.44 Percent in top 10% of high school graduating class 20.1%
Average transfer GPA 3.07
Graduate and Professional
COMPLETED APPLICATIONS ADMITTED ENROLLED
Masters’ 4,851 2,256 1,102
Doctoral 2,263 716 357
Professional Schools
Dentistry 3,591 284 127Law 2,609 1,151 227Medicine 10,980 514 215Pharmacy 791 255 158Podiatric Medicine 627 199 97
Total 18,598 2,403 824
ENROLLMENT (FALL 2013)
Head Count Undergraduate 28,242 Graduate/professional 9,377
Total Enrollment Head Count 37,619 Full-Time Equivalent 33,563
Full time 84% Part time 16%
PA residents 74% Non-PA residents 26%
Female 52% Male 48%
Enrollment by Race/Ethnicity
TOTAL UNDERGRADUATE ENROLLMENT
Hispanic/Latino 5.4% 5.1%African American 13.3% 12.0%American Indian/ Alaska Native 0.2% 0.2%Asian 10.0% 9.7%Pacific Islander 0.1% 0.1%Other/unknown 5.2% 8.7%Two or more races 2.3% 2.0%White, non-Hispanic 59.6% 56.2%International 3.9% 6.1%
Temple University Japan and Temple Health excluded from
all data unless otherwise stated.
STUDENT SUCCESS
Degrees Conferred (July 1, 2012–June 30, 2013) Postsecondary certificates 124 Associates 8 Bachelors’ 6,080 Masters’ 1,573 Graduate certificates 79 Doctoral—professional practice 995 Doctoral—scholarship/research 206
Total Degrees Conferred 9,065
Graduation Rates 4-year rate (2009 freshman cohort) 43% 6-year rate (2007 freshman cohort) 66%
2012 freshman-to-sophomore retention rate 89%
INSTRUCTION AND ACADEMIC PROGRAMS
Instruction (Academic Year 2013) Classes with fewer than 20 students 38% Classes with 50 or more students 7% Undergraduate sections offered 4,575 Student-to-faculty ratio 14:1 Library volumes held 4.5 M
Academic Programs (as of July 2013) Postsecondary certificates 19 Associates 2 Bachelors’ 142 Masters’ 125 Graduate certificates 57 Doctoral—professional practice 15 Doctoral—scholarship/research 44
Total Academic Programs 404
FACULTY, STAFF AND ADMINISTRATION (FALL 2013)
Head Count Full-time faculty 2,034 Part-time faculty 1,514 Full-time staff and administration 4,174
GENERAL TUITION AND FEES (ACADEMIC YEAR 2014)
Undergraduate (per Academic Year) PA residents $14,096 Non-PA residents $24,122 Room and board (on campus) $10,296
Graduate (per Credit Hour) PA residents $745 Non-PA residents $1,043
FINANCETotal operating budget (FY13) $1.21 B
Full-time undergraduates awarded aid 81%
Full-time undergraduates awarded need-based scholarships or grant aid 52%
Average award $6,757
Full-time undergraduates awarded need-based loans 53%
Average loan $4,598
RESEARCH AND TECHNOLOGY TRANSFER (ACADEMIC YEAR 2013)
Sponsored programs—expenditures $230 M Disclosures 60 Patent filings 19 Licenses/options 6 Technology transfer income $11.5 M
TEMPLE UNIVERSITY AT A GLANCE 2013–2014

SCHOOLS AND COLLEGES
Center for the Arts Dean Robert Stroker Tyler School of Art Boyer College of Music and Dance Division of Theater, Film and Media Arts
Fox School of Business and Management Dean Moshe Porat
Kornberg School of Dentistry Dean Amid Ismail
College of Education Dean Gregory Anderson
College of Engineering Dean Keya Sadeghipour
College of Health Professions and Social Work Dean Laura Siminoff School of Social Work
Beasley School of Law Dean JoAnne Epps
College of Liberal Arts Dean Teresa Soufas School of Environmental Design
School of Media and Communication Dean David Boardman
School of Medicine Dean Larry Kaiser
School of Pharmacy Dean Peter Doukas
School of Podiatric Medicine Dean John Mattiacci
College of Science and Technology Dean Michael Klein
School of Tourism and Hospitality Management Dean Moshe Porat
CAMPUSES
Temple University Main 1801 N. Broad Street Philadelphia, PA 19122
Additional Campuses Philadelphia Temple University Center City Health Sciences Center Podiatric Medicine
Regional Pennsylvania Ambler Fort Washington Harrisburg
International Tokyo, Japan Rome, Italy
CONTACT INFORMATION
temple.edu/contact
Undergraduate Admissions and Tours admissions.temple.edu [email protected] 215.204.7200
Graduate Admissions temple.edu/grad [email protected] 215.204.1380
Human Resources/Employment temple.edu/hr/departments/employment 215.204.7174
Media Inquiries news.temple.edu 215.204.8561
RESIDENTIAL AND STUDENT LIFE (FALL 2013)
Living in University-Affiliated Housing Full-time undergraduate freshmen 77% All undergraduates 18%
Housing (Temple Owned and Sponsored) Residence halls/housing units 12 Capacity 5,558 Occupancy 5,313
Campus Recreation/Student Organizations
Intercollegiate sports clubs 28 Participating students 2,621
Campus recreation locations 7
Registered student organizations 328 Participating students 7,200
Greek life organizations 30 Participating students 1,100
ATHLETICS (AS OF FALL 2013)
Varsity sports 24 NCAA Division I teams Athletics conference American Athletic Nickname Owls Colors Cherry and white Mascot Hooter the Owl
FACILITIES (AS OF FISCAL YEAR 2013)
Buildings (Temple Health included) 211 Land area maintained (acres) 382 Utility expense $33.1 M
TECHNOLOGY (AS OF FISCAL YEAR 2013)
Estimated number of university- owned workstations 11,233 Computer labs 100
Smart classrooms 85% Help Desk calls for assistance 94,847 Devices collected by the Computer Recycling Center 7,762 Tech Center average daily visitors 6,000
TEMPLE UNIVERSITY JAPAN (FALL 2013)
Admissions Incoming Freshmen Admitted 286 Enrolled 152 Percent admitted who enrolled 53%
Graduate Admitted 39 Enrolled 36 Percent admitted who enrolled 92%
Enrollment Undergraduate 723 Graduate 281
Total TUJ Enrollment 1,004
ALUMNI AND PHILANTHROPY (AS OF JULY 2013)
Alumni residing in the U.S. 264,809 Total alumni 291,877 Alumni giving participation rate 8.07%
Philanthropy by Funding Opportunity (FY13) Student Support Giving amount $16.5 M Percent of total giving 25.2%
Research and Faculty Giving amount $16.2 M Percent of total giving 24.6%
Campus Development Giving amount $2.7 M Percent of total giving 4.2%
Community Programs Giving amount $3 M Percent of total giving 4.6%
Temple Fund and Other Giving amount $27.2 M Percent of total giving 41.4%
Total Giving $65.8 M Total Donors 45,571
COMMUNITY ENGAGEMENT
Temple-sponsored programs 300+
Temple student participation 14,000+
Volunteer hours for the city of Philadelphia 65,000
TEMPLE HEALTH A $1.4 billion academic health system
Consists of Temple University Hospital 571-bed teaching hospital; only Level 1 trauma center with burn unit in Philadelphia; chief clinical training site for Temple University School of Medicine
TUH—Episcopal Campus 139-bed behavioral-health center with full-service emergency department
TUH—Northeastern Campus Ambulatory care center
Fox Chase Cancer Center NCI-designated comprehensive cancer center
Jeanes Hospital Acute-care community hospital
Temple Physicians Inc. 48 practices, 110 physicians
Temple Transport Team Critical-care ground and air (T3-C3) services
ReadyCare and Satellite Practice Sites 4 certified urgent-care clinics and 4 specialty practice sites in the Philadelphia region
NOTES
See University Fact Book on the Institutional Research and Assessment website for full definitions of data points.
TEMPLE UNIVERSITY AT A GLANCE 2013–2014 published by Institutional Research and Assessment April 2014 temple.edu/ira
311_1314_tb
Temple University Fact Book 2013 – 2014 Page | 5
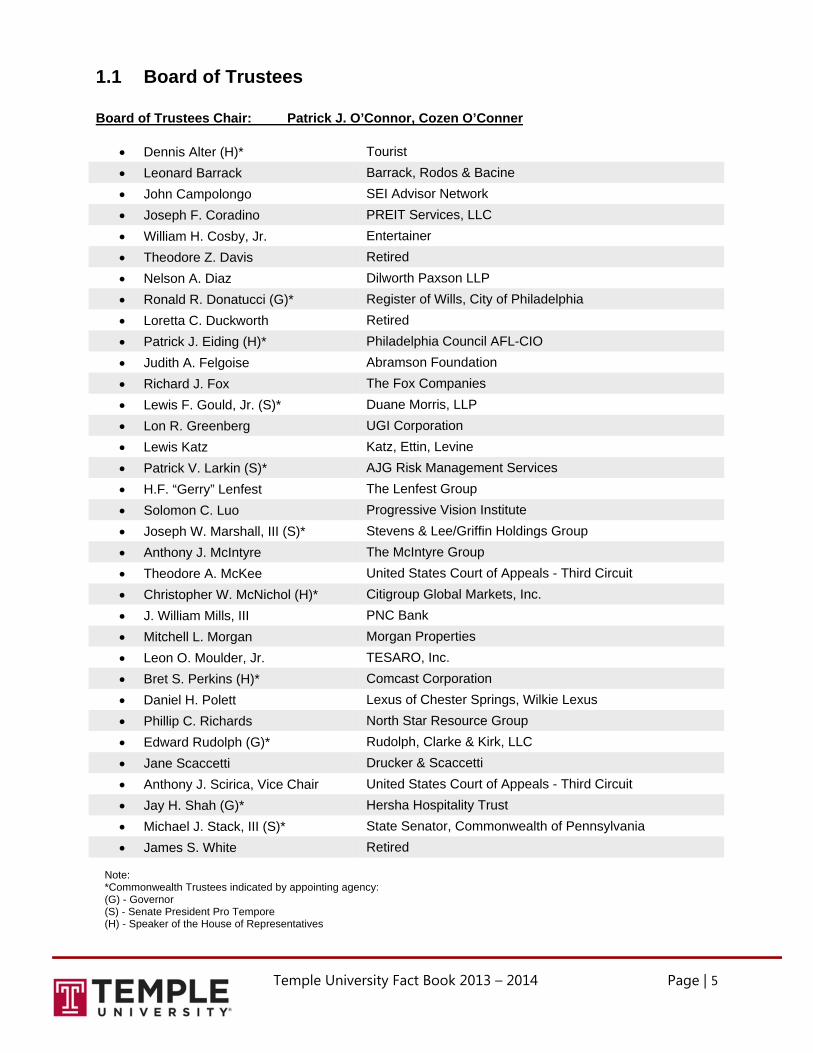
1.1 Board of Trustees Board of Trustees Chair: Patrick J. O’Connor, Cozen O’Conner
Dennis Alter (H)* Tourist
Leonard Barrack Barrack, Rodos & Bacine
John Campolongo SEI Advisor Network
Joseph F. Coradino PREIT Services, LLC
William H. Cosby, Jr. Entertainer
Theodore Z. Davis Retired
Nelson A. Diaz Dilworth Paxson LLP
Ronald R. Donatucci (G)* Register of Wills, City of Philadelphia
Loretta C. Duckworth Retired
Patrick J. Eiding (H)* Philadelphia Council AFL-CIO
Judith A. Felgoise Abramson Foundation
Richard J. Fox The Fox Companies
Lewis F. Gould, Jr. (S)* Duane Morris, LLP
Lon R. Greenberg UGI Corporation
Lewis Katz Katz, Ettin, Levine
Patrick V. Larkin (S)* AJG Risk Management Services
H.F. “Gerry” Lenfest The Lenfest Group
Solomon C. Luo Progressive Vision Institute
Joseph W. Marshall, III (S)* Stevens & Lee/Griffin Holdings Group
Anthony J. McIntyre The McIntyre Group
Theodore A. McKee United States Court of Appeals - Third Circuit
Christopher W. McNichol (H)* Citigroup Global Markets, Inc.
J. William Mills, III PNC Bank
Mitchell L. Morgan Morgan Properties
Leon O. Moulder, Jr. TESARO, Inc.
Bret S. Perkins (H)* Comcast Corporation
Daniel H. Polett Lexus of Chester Springs, Wilkie Lexus
Phillip C. Richards North Star Resource Group
Edward Rudolph (G)* Rudolph, Clarke & Kirk, LLC
Jane Scaccetti Drucker & Scaccetti
Anthony J. Scirica, Vice Chair United States Court of Appeals - Third Circuit
Jay H. Shah (G)* Hersha Hospitality Trust
Michael J. Stack, III (S)* State Senator, Commonwealth of Pennsylvania
James S. White Retired
Note: *Commonwealth Trustees indicated by appointing agency: (G) - Governor (S) - Senate President Pro Tempore (H) - Speaker of the House of Representatives

Temple University Fact Book 2013 – 2014 Page | 6
1.2 Honorary Life Trustees
John J. Contoudis Peter J. Liacouras
Peter D. DePaul Milton L. Rock
Louis J. Esposito Edward H. Rosen
Lacy H. Hunt Murray H. Shusterman
Sidney Kimmel
1.3 Ex Officio Trustees
The Honorable Thomas Corbett,
Governor, Commonwealth of Pennsylvania
The Honorable Michael A. Nutter,
Mayor, City of Philadelphia
The Honorable Carolyn Dumaresq,
Acting Secretary of Education, Pennsylvania Department of Education
James F. Cawley, IV,
Lieutenant Governor - Commonwealth of Pennsylvania, Governor’s Non-voting Representative
Robert A. Rovner,
Governor’s Alternate Non-Voting Representative
Lori A. Shorr,
Mayor’s Non-voting Representative
1.4 TRussell H
Temple’s
Pastor, or
A tempora
October 1
Conwell, o
school in
Temple ke
also found
Charles E
Robert Liv
Millard E.
Paul R. A
Marvin W
Peter J. L
David Ada
Ann Weav
Temple’s
H. Conwell (1
first presiden
rator, writer a
ary Board of T
4, 1887; he s
originally beg
the basemen
ept its fees lo
ded Samarita
Ezra Beury
vingston John
Gladfelter
nderson
achman
Liacouras
amany
ver Hart
Temp
Presiden
887–1925)
nt and founde
nd attorney
Trustees elec
served until h
an as a theol
t of Conwell's
ow, welcoming
an Hospital (no
(1926
nson (1941
(1959
(1967
(1973
(1982
(2000
(2006
ple Universit
nts, 1887
r of Temple C
cted Russell H
is death on D
ogical class.
s Grace Bapti
g students reg
ow Temple U
6–1941) Se
un
–1959) Th
pre
9–1967) Fo
un
7–1973) Fif
un
3–1982) Six
un
–2000) Se
La
–2006)
Eig
Un
Un
6–2012)
Nin
pre
vic
Un
of
ty Fact Book
- 2012
College
H. Conwell pre
December 6, 1
Later Temple
ist Church. Fi
gardless of th
University Hos
econd preside
iversity.
ird president.
esident of Tim
ourth presiden
iversity before
fth president.
iversity and a
xth president.
iversity and a
eventh preside
w.
ghth presiden
niversity and v
niversity of Ma
nth president.
esident of the
ce president fo
niversity and d
Utah.
2013 – 2014
esident of the
1925. Temple
e was a worke
ercely democ
heir backgroun
spital).
ent. Bank exe
. Managemen
me, Inc.
nt. Served as
e assuming o
Vice presiden
a former presi
. Vice preside
a former presi
ent. Served a
nt. Previously
vice presiden
aryland.
. Temple’s firs
e University of
or academic a
dean of the G
4
e faculty on
e, under
ers' night
cratic,
nd. Conwell
cutive, lawye
nt consultant
vice presiden
office.
nt of academ
ident of Chath
ent for academ
ident of Linco
as dean of the
president of W
t for academi
st female pre
f New Hamps
affairs at Clar
Graduate Scho
Pag
r and trustee
and former vi
nt and provos
ic affairs of th
ham College.
mic affairs of t
oln University.
e Temple Sch
Wayne State
ic affairs at th
sident. Previo
shire, provost
remont Gradu
ool at the Uni
ge | 7
of the
ice
st of the
he
the
.
hool of
he
ously
and
uate
versity

1.5 T
Neil D.
flagship c
more than
score of th
campaign
In addition
finance. H
modeling
books and
reports fo
research c
devising e
Theobald
Temple’s
. Theobal
ampus in Blo
n a decade as
he incoming c
n, and boostin
n to his admin
His research i
educational l
d book chapte
r state govern
center that as
education fun
was a three-
Temp
Current P
ld
Neil D. T
Universi
the field
first mem
experien
have acc
Theobal
Previous
oomington and
s a senior adm
class at IU Blo
ng IU’s credit
nistrative resp
nterests in the
abor markets
ers, dozens o
nments acros
ssisted state g
ding processe
time winner o
ple Universit
Presiden
Theobald, Tem
ty on January
of education
mber of his fa
nces helped s
cess to an ed
d was named
sly, he had se
d as special a
ministrator at
oomington fro
ranking to Mo
ponsibilities a
e appropriate
s are reflected
of articles pub
ss the United
governments
es that equita
of IU's Teachi
ty Fact Book
t
mple’s 10th pr
y 1, 2013. The
finance. As w
mily to attend
shape his prim
ducation that i
d Indiana Univ
erved as the s
assistant to IU
Indiana Unive
om 1096 to 12
oody’s highes
t Temple, The
e role of decen
d in more than
blished in prof
States. At Ind
in Ohio, Mich
ably facilitated
ng Excellenc
2013 – 2014
resident, bega
eobald is a na
with so many
d college. Bot
mary goal for
is both afforda
versity’s (IU)
senior vice pr
U’s president.
ersity include
203, directing
st level (AAA)
eobald holds
ntralization in
n $1.5 million
fessional journ
diana Univers
higan, Indiana
d academic e
e Recognition
4
an his tenure
ationally reco
Temple stude
th his profess
Temple: ensu
able and exce
senior vice pr
rovost at that
Major accom
e increasing th
g a $1.1 billion
.
a professors
n educational
in funded res
nals, and nea
sity, Dr. Theob
a, Iowa, and W
xcellence. In
n Award.
Pag
at Temple
ognized leade
ents, he was
ional and per
uring that stud
ellent.
resident in 20
university’s
mplishments d
he mean SAT
n capital
hip in educati
financing and
search, nume
arly 50 policy
bald directed
Washington in
addition,
ge | 8
er in
the
rsonal
dents
007.
during
T
ion
d in
erous
a
n

1.6 PS
On Octob
pioneering
— at its co
where the
reinvigora
and our n
1
2
3
4
5
6
PresidentSuccess
ber 18, 2013, d
g plan for the
ore, an exper
e nation’s mid
ate the Conwe
ation.”
A commit
At a time w
education
affordabili
Telling th
Temple’s
based on
know how
Harnessi
Temple is
communit
neighborh
Research
Temple’s
technolog
making dr
As divers
Temple is
America.
serve stud
The entre
Being rea
student en
Temp
Theobal
during his ina
success of th
riment in dem
dle-class has
ell legacy in o
tment to affo
when many s
or burdened
ty and bold, i
he Temple sto
reputation as
broadening a
w good a Tem
ng the mind
Philadelphia
ty of scholars
hoods and has
h that improv
fast-growing
ies that affec
rinking water
se and intern
one of the na
Homogeneity
dents of all ba
epreneurial s
l-world ready
ntrepreneursh
ple Universit
d’s Six C
auguration as
he university w
mocracy — ca
s access to a
order to create
ordability
students acros
by mounting
nnovative stra
ory
s one of the na
awareness of
ple education
to help the c
a’s public univ
is committed
s the perspec
ves lives
research ente
t people’s eve
safer.
national as th
ation’s most d
y is a death se
ackgrounds a
spirit: Ready
means harne
hip and innov
ty Fact Book
Core Com
Temple’s 10t
with six core
n only succee
quality, afford
e success in o
ss the nation
debt, Temple
ategies to red
ation’s finest
the quality an
n truly is.
city
versity and a p
d to tackling th
ctives, ideas a
erprise is lase
eryday lives,
he real world
diverse unive
entence in the
nd nationalitie
for success
essing opport
ation—at Tem
2013 – 2014
mmitments
th president,
commitments
ed if Temple U
dable educati
our students,
are priced ou
e University is
duce student
urban resear
nd creativity o
powerful intel
he toughest c
and leadershi
er-focused on
from understa
d
rsities, with a
e modern wor
es is key.
s
tunities acros
mple and bey
4
s for Tem
Neil D. Theob
s. “Conwell's
University rem
on,” said The
our city, our
ut of a high-qu
s committed t
debt.
rch universitie
of our faculty.
lectual partne
challenges fac
ip to do so.
n breakthroug
anding childh
a student body
rld—continuin
ss the curricul
yond.
Pag
mple’s
bald laid out a
great experim
mains the plac
eobald. “We m
commonwea
uality higher
to access,
es is growing
The world sh
er for the city.
cing urban
ghs and
hood obesity t
y that looks lik
ng to attract a
um to foster
ge | 9
a
ment
ce
must
lth
hould
Our
to
ke
and

Temple University Fact Book 2013 – 2014 Page | 10
1.7 Mission Statement Temple University is a national center of excellence in teaching and research with an international
presence. Our talented faculty and broad curriculum of over 400 academic programs provide superior
educational opportunities for academically talented and highly motivated students, without regard to their
status or station in life. Temple’s richly diverse student population and the dramatic growth of our
residential campus community of student scholars enrich the educational and extracurricular lives of our
people. While the university especially serves students from Greater Philadelphia, it is enlivened by a
rapidly increasing number of students from across Pennsylvania, throughout the nation, and around the
world. We maintain an international presence with campuses in Tokyo and Rome and programs in
London, Beijing, and six other locations worldwide. A longtime leader in professional education, Temple
prepares the largest body of practitioners in Pennsylvania; we are among the nation’s largest educators in
the combined fields of medicine, dentistry, pharmacy, podiatry and law. In addition, we offer more than 4
dozen doctoral and more than 100 master’s degree programs that contribute to research and scholarship.
Temple seeks to create new knowledge that improves the human condition and uplifts the human spirit.
To achieve this goal, we maintain our commitment to recruiting, retaining, and supporting outstanding
faculty who prize diversity of thought, excel in scholarly endeavors and support the aspirations of capable
students.

Temple University Fact Book 2013 – 2014 Page | 11
1.8 University Officers President Neil D. Theobald Temple’s 10th president University Officers William T. Bergman Vice President and Special Assistant to the President Kevin G. Clark Vice President and Director of Athletics Karen B. Clarke Vice President for Strategic Marketing and Communications James P. Creedon Senior Vice President for Construction, Facilities and Operations Hai-Lung Dai Provost and Senior Vice President for Academic Affairs Michael Gebhardt Interim University Counsel Ken Kaiser Vice President, Chief Financial Officer and Treasurer Larry R. Kaiser Senior Executive Vice President for Health Affairs President and Chief Executive Officer, Temple Health Dean, Temple University School of Medicine Kenneth Lawrence Senior Vice President for Government, Community and Public Affairs Tilghman H. Moyer IV Interim Senior Vice President for Institutional Advancement Timothy O’Rourke Vice President for Computer and Financial Services and Chief Information Officer Theresa A. Powell Vice President for Student Affairs
Temple University Fact Book 2013 – 2014 Page | 12
1.9 Schools and Colleges Center for the Arts Dean Robert Stroker
Tyler School of Art Boyer College of Music and Dance Division of Theater, Film and Media Arts
Fox School of Business and Management Dean Moshe Porat Kornberg School of Dentistry Dean Amid Ismail College of Education Dean Gregory Anderson College of Engineering Dean Keya Sadeghipour College of Health Professions and Social Work Dean Laura Siminoff
School of Social Work
Beasley School of Law Dean JoAnne Epps College of Liberal Arts Dean Teresa Soufas
School of Environmental Design School of Media and Communication Dean David Boardman School of Medicine Dean Larry Kaiser School of Pharmacy Dean Peter Doukas School of Podiatric Medicine Dean John Mattiacci College of Science and Technology Dean Michael Klein School of Tourism and Hospitality Management Dean Moshe Porat

1.10 C Temple U
1801 N. B
Philadelph
Additiona
Philadelp
Health Sc
Podiatric
Temple U
Regional
Ambler
Fort Wash
Harrisburg
Internatio Rome, Ita Tokyo, Ja
Campuses
University Ma
Broad Street
hia, PA 19122
al Campuses
phia
ciences Cente
Medicine
University Cen
Pennsylvan
hington
g
onal Campus
aly
apan
Temp
s
ain Campus
2
s
er
nter City
nia
ses
ple Universit
ty Fact Book
2013 – 20144 Page | 13

Temple University Fact Book 2013 – 2014 Page | 14
1.11 Accreditation
Temple University is accredited by the Middle States Commission on Higher Education, an institutional
accrediting agency recognized by the U.S. Secretary of Education and the Council for Higher Education
Accreditation. Additionally, Temple has numerous academic programs accredited or reviewed by external
professional organizations, including the following:
Accreditation Board for Engineering and Technology (ABET) Accreditation Council for Pharmacy Education (ACPE) Accreditation Council on Education in Journalism and Mass Communications (ACEJMC) American Bar Association, Council of the Section of Legal Education and Admissions to the Bar (ABA) American Chemical Society (ACS) American Dental Association, Commission on Dental Accreditation (CODA) American Music Therapy Association (AMTA) American Occupational Therapy Association, Accreditation Council for Occupational Therapy Education
(ACOTE) American Physical Therapy Association, Commission on Accreditation in Physical Therapy Education (CAPTE) American Podiatric Medical Association, Council on Podiatric Medical Education (CPME) American Psychological Association, Commission on Accreditation (APA-CoA) American Society of Landscape Architects (ASLA) American Speech-Language-Hearing Association, Council on Academic Accreditation in Audiology and Speech-
Language Pathology (CAA) Association to Advance Collegiate Schools of Business (AACSB) Commission on Accreditation of Healthcare Management Education (CAHME) Commission on Accreditation for Health Informatics and Information Management (CAHIIM) Commission on Accreditation of Athletic Training Education (CAATE) Commission on Allied Health Education Programs (CAAHEP) Commission on Collegiate Nursing Education (CAATE) Council on Accreditation of Parks, Recreation, Tourism and Related Professions (COAPRT) Council on Education for Public Health (CEPH) Council on Social Work Education (CSWE) Liaison Committee on Medical Education (LCME) National Architecture Accrediting Board (NASAD) National Association of School Psychologists (NASP) National Association of Schools of Art and Design, Commission on Accreditation (NASAD) National Association of Schools of Dance, Commission on Accreditation (NASD) National Association of Schools of Music, Commission on Accreditation (NASM) National Association of Schools of Theatre, Commission on Accreditation (NAST) National Athletic Trainer's Association (NATA) National Recreation and Park Association (NRPA) Pennsylvania Department of Education (PDE) Teacher Education Accreditation Council, Accreditation Committee (TEAC) University Council for Educational Administration (UCEA) University/Resident Theater Association (U/RTA)

Temple University Fact Book 2013 – 2014 Page | 15
1.12 Temple Health
As one of the region’s top academic health systems, Temple Health, a $1.4 billion academic health
system, is dedicated to providing access to quality patient care and supporting excellence in medical
education and research. Temple Health comprises the health, education and research activities carried
out by the affiliates of Temple University Health System and Temple University School of Medicine
(TUSM).
Temple University School of Medicine is one of the nation’s leading medical schools. Each year, it
educates more than 700 medical students and 140 graduate students. Based on its level of funding from
the National Institutes of Health, TUSM is the second-highest-ranked medical school in Philadelphia and
the third-highest in Pennsylvania. Learn more about Temple Health at www.templehealth.org
Consists of:
Temple University Hospital
571-bed teaching hospital; only Level 1 trauma center with burn unit in Philadelphia; chief clinical training
site for Temple University School of Medicine
TUH-Episcopal Campus
139-bed behavioral-health center with full-service emergency department
TUH-Northeastern Campus
Ambulatory care center
Fox Chase Cancer Center
NCI-designated comprehensive cancer center
Jeanes Hospital
Acute-care community hospital
Temple Physicians, Inc.
48 practices, 110 physicians
Temple Transport team
Critical-care ground and air (T3-C3) services
ReadyCare and Satellite Practice Sites
4 certified urgent-care clinics and 4 specialty practice sites in the Philadelphia region

Temple University Fact Book 2013 – 2014 Page | 16

SECTION 2
Student Admissions
2

Temple University Fact Book 2013 – 2014 Page | 18

Temple University Fact Book 2013 – 2014 Page | 19
2.1 Incoming Freshmen
Fall 2013 Completed
ApplicationsStudents Admitted
StudentsEnrolled
Total Incoming Freshmen 18,813 12,016 4,390
Gender
Male 8,314 5,261 2,028
Female 10,499 6,755 2,362
Unreported 0 0 0
Pennsylvania Residency
Pennsylvania Resident 11,617 7,588 3,205
Non-PA Resident 7,196 4,428 1,185
Race/Ethnicity
American Indian/Alaska Native 22 5 2
Asian 1,772 1,319 489
African American 3,379 1,432 460
Hispanic/Latino 1,450 769 235
Pacific Islander 24 13 5
Two or More Races 720 455 144
White, non-Hispanic 9,852 6,995 2,699
Unknown 468 339 132
International 1,126 689 224
Freshman Quality Indicators - Fall 2013 Cohort
Average SAT Verbal/Reading Score 558
Average SAT Math Score 571
Average SAT Combined Math and Verbal Score 1129
Average SAT Writing Score 553
Average ACT Composite Score 24
Average High School GPA (4.00 Scale) 3.44
Percentage in Top 10% of High School Graduating Class (of those with class rank data) 20%

Temple University Fact Book 2013 – 2014 Page | 20
2.2 Incoming Transfers
Fall 2013 Completed
ApplicationsStudents Admitted
Students Enrolled
Total Incoming Transfers 5,133 4,158 2,716
Gender
Male 2,570 2,066 1,376
Female 2,557 2,088 1,338
Unreported 6 4 2
Pennsylvania Residency
Pennsylvania Resident 3,760 3,102 2,235
Non-PA Resident 1,373 1,056 481
Race/Ethnicity
American Indian/Alaska Native 15 12 9
Asian 389 321 216
African American 934 721 488
Hispanic/Latino 390 329 213
Pacific Islander 6 6 3
Two or More Races 149 116 79
White, non-Hispanic 2,720 2,266 1,500
Unknown 163 134 88
International 367 253 120
Transfer Quality Indicator - Fall 2013 Cohort
Average GPA of Transfer Students (4.00 Scale) 3.07

Temple University Fact Book 2013 – 2014 Page | 21
2.3 Graduate and Professional Admissions Graduate
Fall 2013 Completed
ApplicationsStudents Admitted
Students Enrolled
Total Graduate Students 7,114 2,972 1,459
Master’s 4,851 2,256 1,102
Doctoral 2,263 716 357
Professional
Fall 2013 Completed
ApplicationsStudents Admitted
Students Enrolled
Total Professional Students 18,598 2,403 824
Kornberg School of Dentistry 3,591 284 127
Beasley School of Law 2,609 1,151 227
School of Medicine 10,980 514 215
School of Pharmacy 791 255 158
School of Podiatric Medicine 627 199 97

Temple University Fact Book 2013 – 2014 Page | 22
2.4 Student Admissions - Section Appendix
All data are as of the official fall census date. This date reflects the end of the drop/add period for
course registrations. The census date for fall 2013 was September 9, 2013. Undergraduate
Included are matriculated applicants, domestic and international applicants, and Main, Ambler, and
Harrisburg Campus applicants
Excluded are Japan Campus applicants, Continuing Studies applicants, and Continuing Education applicants
Completed Applications – Students who have submitted the minimum elements required for an
admissions decision. For freshman applicants, this includes those who have submitted SAT/ACT scores, high school transcripts, and the application fee. For transfer applicants, this includes those who have submitted required high school and/or required college transcripts and the application fee.
Enrolled – Students who are currently registered for at least one credit for the upcoming semester.
At enrollment, students who are registered for fewer than 12 credits are designated part-time. Incoming Freshmen – Students who have fewer than 15 college credits
Incoming Transfers – Students who have 15 or more college credits Residency - When students are admitted, a residency decision is posted. Applicants with
undetermined residency are classified based on their permanent address.
Race/Ethnicity – This is determined based on the federal coding/reporting rules, and includes all non-international students. Students self-identify, using the two-question format. Students are first asked if they are Hispanic, and those who respond yes are identified as such. Students who respond no are asked to identify themselves as one or more of the other race/ethnicities; those who mark more than one are counted in the two or more races category.
International Students – Students are classified as international if 1) they complete an international application or 2) they complete a domestic application and their nation of citizenship is other than the US and their visa type indicates they are neither a US citizen nor a permanent resident. The Office of International Admissions reviews and makes admissions decisions for international applicants. When students arrive on campus, the Office of International Services verifies their data and enters any missing information. The numbers of “International Students” and “Non-Resident International” students may not match at times, as a small number of International Students have a permanent mailing address in Pennsylvania.
Transfer GPA – This is a combination of GPA’s from all prior-attended schools. The ranges listed on
the report are consistent with those used to award transfer scholarships. GPAs are recorded at the point of the admissions decision.
Graduate

Temple University Fact Book 2013 – 2014 Page | 23
Included are applicants to all Graduate School degree programs, domestic and international applicants, Main, Ambler, and Harrisburg Campus applicants and applications to Graduate School programs that are part of Temple dual and joint programs (e.g., JD/MBA, MPH/MSW)
Excluded are Japan Campus applicants, Continuing Studies applicants, Continuing Education applicants, and Doctoral – Professional Practice applicants not under the purview of the Graduate School (Law, MD, D.Pharm, DMD, Podiatry degrees)
Completed Applications – This includes those who submitted the minimum elements (required
reference letters, transcripts, test scores, application fee, and statement of goals) necessary for an admissions decision. Requirements vary by graduate program.
Enrolled – Students who are currently registered for at least one credit for the upcoming semester.
Mean GPA – This is a combination of GPA’s from all prior-attended schools. GPAs are to be recorded on the applicant’s record in Banner at the point of the admissions decision.
GRE Scores – Graduate programs vary as to the standardized test required, and not all programs
require test scores. GRE is reported here, as it is the most common test (others include GMAT, MAT, MCAT, and Praxis). Approximately 55% of graduate applicants submit GRE scores.
The GRE scores reported here are the highest scores submitted to date. If a student submitted GRE scores from an administration before November, 2011, the scores were converted to the “revised” GRE scores, using the concordance tables.
Residency – When students are admitted, a residency decision is posted. Applicants with undetermined residency are classified based on their permanent address.

Temple University Fact Book 2013 – 2014 Page | 24

SECTION 3
Student Enrollment

Temple University Fact Book 2013 – 2014 Page | 26

Temple University Fact Book 2013 – 2014 Page | 27
3.1 Enrollment Headcount by School/College and Level
Matriculated
Matriculated
Fall 2013
To
tal U
niv
ersi
ty
Mat
ric
and
N
on
Mat
ric
Un
der
gra
du
ate
Mas
ter’
s
Do
cto
ral
Pro
fess
ion
al
Do
cto
ral
Sch
ola
rsh
ip-
Res
earc
h
Total 37,619 27,528 3,354 3,458 1,684
Center for the Arts 3,108 2,643 340 29 74
Tyler School of Art 1,370 1,224 104 0 39
Boyer College of Music and Dance 974 915 59 0 0
Division of Theater, Film and Media Arts 764 504 177 29 35
Fox School of Business and Management 7,177 6,233 778 0 139
Kornberg School of Dentistry 590 0 5 548 0
College of Education 2,266 1,282 366 0 269
College of Engineering 1,570 1,416 72 0 71
School of Environmental Design 233 143 71 0 0
College of Health Professions and Social Work 4,500 3,108 909 305 42
Health Professions 3,518 2,740 368 305 42
Social Work 982 368 541 0 0
Beasley School of Law 1,029 0 206 774 11
College of Liberal Arts 5,512 4,742 140 0 601
School of Media and Communication 3,028 2,865 75 0 55
School of Medicine 1,031 0 16 830 125
School of Pharmacy 1,000 0 209 591 27
School of Podiatric Medicine 381 0 0 381 0
College of Science and Technology 4,047 3,685 92 0 270
School of Tourism and Hospitality Management 871 789 75 0 0
University College 8 7 0 0 0
University Studies 1,268 615 0 0 0
Continuing Studies 0 0 0 0 0

Temple University Fact Book 2013 – 2014 Page | 28
3.2 Enrollment Headcount by School/College and Level
Non-Matriculated
Non-Matriculated
Fall 2013
To
tal U
niv
ersi
ty
Mat
ric
and
N
on
Mat
ric
Un
der
gra
du
ate
Cer
tifi
cate
Un
der
gra
du
ate
No
n-D
egre
e (O
ther
)
Gra
du
ate
Cer
tifi
cate
Gra
du
ate
No
n-D
egre
e (O
ther
)
Total 37,619 94 620 157 724
Center for the Arts 3,108 3 4 0 15
Tyler School of Art 1,370 0 0 0 3
Boyer College of Music and Dance 974 0 0 0 0
Division of Theater, Film and Media Arts 764 3 4 0 12
Fox School of Business and Management 7,177 1 0 5 21
Kornberg School of Dentistry 590 0 0 37 0
College of Education 2,266 86 2 50 211
College of Engineering 1,570 0 2 0 9
School of Environmental Design 233 3 0 0 16
College of Health Professions and Social Work 4,500 0 0 16 120
Health Professions 3,518 0 0 11 52
Social Work 982 0 0 5 68
Beasley School of Law 1,029 0 0 5 33
College of Liberal Arts 5,512 0 16 0 13
School of Media and Communication 3,028 0 23 0 10
School of Medicine 1,031 0 0 4 56
School of Pharmacy 1,000 0 0 40 133
School of Podiatric Medicine 381 0 0 0 0
College of Science and Technology 4,047 0 0 0 0
School of Tourism and Hospitality Management 871 0 0 0 7
University College 8 1 0 0 0
University Studies 1,268 0 573 0 80
Continuing Studies 0 0 0 0 0

Temple University Fact Book 2013 – 2014 Page | 29
3.3 Enrollment by Campus
Fall 2013
To
tal U
niv
ersi
ty
Mat
ric
and
N
on
Mat
ric
Un
der
gra
du
ate
Mas
ter’
s
Do
cto
ral
Pro
fess
ion
al
Do
cto
ral
Sch
ola
rsh
ip a
nd
Res
earc
h
Cer
tifi
cate
an
dN
on
-Deg
ree
See
kin
g
Total 37,619 27,528 3,354 3,458 1,684 1,595
Ambler/Fort Washington 1,117 752 177 0 24 164
Temple University Center City 678 203 331 12 2 130
Harrisburg 234 14 192 0 1 27
Health Sciences Center 3,016 82 153 2,525 157 99
Main Campus 31,589 26,308 2,146 806 1,477 852
Other Various Off Campus Locations 839 89 351 115 23 261
Rome, Italy 146 80 4 0 0 62
* See section 5 for student enrollment at Temple Japan campus

Temple University Fact Book 2013 – 2014 Page | 30
3.4 Enrollment by Demographics
Fall 2013
To
tal U
niv
ersi
ty
Mat
ric
and
N
on
Mat
ric
Un
der
gra
du
ate
Mas
ter’
s
Do
cto
ral
Pro
fess
ion
al
Do
cto
ral
Sch
ola
rsh
ip-
Res
earc
h
Cer
tifi
cate
an
d
No
n-D
egre
e S
eeki
ng
Total 37,619 27,528 3,354 3,458 1,684 1,595
Time Status
Full-Time 31,533 24,710 1,850 3,146 1,436 391
Part-Time 6,086 2,818 1,504 312 248 1,204
Full-Time Equivalent (FTE) Students 33,563 25,652 2,351 3,250 1,519 792
(Full-Time + 1/3 Part-Time Headcount)
Gender
Male 18,040 13,503 1,308 1,758 808 663
Female 19,550 14,019 2,042 1698 876 915
Unreported 29 6 4 2 0 17
Pennsylvania Residency
Pennsylvania Resident 27,751 22,002 2,053 1,974 691 1,031
Non-Pennsylvania Resident 9,868 5,526 1,301 1,484 993 564
Race/Ethnicity
American Indian/Alaska Native 76 52 5 12 2 5
Asian 3,651 2,788 150 560 81 72
African American 4,497 3,722 325 201 101 148
Hispanic/Latino 1,918 1,493 124 201 57 43
Pacific Islander 32 26 2 3 0 1
Two or More Races 753 642 54 29 19 9
White, non-Hispanic 21,141 16,642 1,585 1,588 864 462
Unknown 3,270 1,207 570 780 109 604
International 2,281 956 539 84 451 251

Temple University Fact Book 2013 – 2014 Page | 31
3.5 Undergraduate Enrollment by State Total Undergraduate Students Enrolled from the United States 26,468 Alaska 1 Montana 1
Arizona 6 Nebraska 3
Arkansas 3 Nevada 4
California 72 New Hampshire 38
Colorado 11 New Jersey 1,889
Connecticut 188 New Mexico 3
Delaware 99 New York 564
District of Columbia 111 North Carolina 21
Florida 45 Ohio 28
Georgia 22 Oklahoma 2
Hawaii 4 Oregon 9
Illinois 27 Pennsylvania 22,318
Indiana 2 Rhode Island 23
Iowa 2 South Carolina 10
Kansas 1 South Dakota 1
Kentucky 2 Tennessee 5
Louisiana 4 Texas 34
Maine 15 Utah 2
Maryland 450 Vermont 9
Massachusetts 174 Virginia 136
Michigan 10 Washington 12
Minnesota 5 West Virginia 4
Mississippi 1 Wisconsin 10
Missouri 4 Wyoming 1
Unknown 68
Commonwealth/Armed Forces
Armed Forces 4 Puerto Rico 3
Guam 2 Virgin Islands 5

Temple University Fact Book 2013 – 2014 Page | 32
3.6 Undergraduate Enrollment by Pennsylvania County
Total Undergraduate Students Enrolled from Pennsylvania 22,318
Adams 22 Lackawanna 328
Allegheny 202 Lancaster 556
Armstrong 2 Lawrence 2
Beaver 13 Lebanon 95
Bedford 7 Lehigh 589
Berks 450 Luzerne 310
Blair 11 Lycoming 37
Bradford 8 McKean 3
Bucks 3,408 Mercer 2
Butler 10 Monroe 211
Cambria 9 Montgomery 4,165
Carbon 37 Montour 7
Centre 4 Northampton 483
Chester 1,295 Northumberland 15
Clarion 1 Perry 11
Clearfield 6 Philadelphia 6,735
Clinton 6 Pike 43
Columbia 23 Schuylkill 68
Crawford 2 Snyder 14
Cumberland 183 Somerset 2
Dauphin 201 Susquehanna 15
Delaware 2,235 Tioga 5
Elk 3 Union 17
Erie 15 Warren 2
Fayette 3 Washington 20
Franklin 34 Wayne 43
Fulton 3 Westmoreland 22
Huntingdon 1 Wyoming 11
Indiana 4 York 304
Jefferson 2 Unknown 2
Juniata 1

Temple University Fact Book 2013 – 2014 Page | 33
3.7 Undergraduate Enrollment by Country
Total Undergraduate International Student Enrollment 1,060
Albania 8 Greece 3 Pakistan 2
Angola 1 Haiti 1 Peru 2
Australia 3 Hong Kong 9 Philippines 5
Bahamas 3 India 49 Poland 1
Bahrain 1 Indonesia 3 Qatar 11
Bangladesh 2 Iran 2 Romania 2
Belarus 2 Ireland 1 Russia 7
Benin 2 Israel 4 Saudi Arabia 39
Bermuda 4 Italy 1 Senegal 1
Bosnia-Herzegovina 1 Ivory Coast 9 Serbia 1
Botswana 1 Jamaica 3 Singapore 2
Brazil 5 Japan 19 Slovakia 1
British Virgin Islands 1 Jordan 2 South Africa 1
Bulgaria 2 Kazakhstan 1 Spain 3
Burkina Faso 5 Kenya 2 St. Vincent and the Grenadines 1
Cambodia 2 Korea, Republic of 101 Sweden 2
Cameroon 3 Kuwait 92 Switzerland 1
Canada 12 Liberia 3 Syria 2
Chile 1 Lithuania 1 Taiwan 13
China, People's Republic 426 Malaysia 15 Tanzania 1
Colombia 1 Mali 3 Thailand 3
Congo, Democratic Republic 4 Mauritius 1 Togo 2
Czech Republic 1 Mexico 5 Trinidad and Tobago 3
Denmark 1 Mongolia 1 Turkey 4
Dominican Republic 1 Morocco 2 Turks and Caicos Islands 1
Ecuador 1 Mozambique 1 Uganda 1
Egypt 2 Myanmar 2 Ukraine 3
Ethiopia 3 Nepal 2 United Arab Emirates 2
Finland 1 Netherlands 2 United Kingdom 6
France 14 Niger 1 Venezuela 8
Germany 6 Nigeria 19 Vietnam 37
Ghana 9 Norway 2 Zimbabwe 1

Temple University Fact Book 2013 – 2014 Page | 34
3.8 Student Enrollment – Section Appendix
All data are as of the official fall census date. This date reflects the end of the drop/add period for
course registrations. The census date for fall 2013 was September 9, 2013.
Students included are matriculated (degree-seeking) and non-degree seeking students, and students in programs at domestic and international campuses (other than Japan) registered for at least one credit-bearing course.
Records excluded from this section are students who are registered at Temple University Japan, students who are participating in a Non-Temple Study Away Location or University Exchange, and students who are taking only Continuing Education (non-credit) courses
All school/college categorizations are based on the student and the program in which they are
enrolled. Time Status – Time status is a breakdown by full-time and part-time. Undergraduates who are
registered for 12 or more credits are considered full-time; generally, graduate students who are registered for nine or more credits are considered full-time (dissertation/thesis students and those with assistantships are typically coded as full-time regardless of credit hours). All professional-practice doctoral students in the professional schools are considered full-time.
Residency – Each student has a residency code, determined and posted during the admissions
process or re-enrollment processes, and maintained (updated, as appropriate) by the Office of the Registrar.
Race/Ethnicity – Based on the federal coding/reporting rules. International students are reported separately, so only non-international students will have a reported race/ethnicity. Students self-identify, using a two-question format: Students are first asked if they are Hispanic, and those who respond yes are identified as such. Students who respond no are asked to identify themselves as one or more of the other races/ethnicities; those who mark more than one are counted in the Two or More Races category.
International Students – Students are classified as international if 1) they complete an international
application or 2) they complete a domestic application and their nation of citizenship is other than the US and their visa type indicates they are neither a US citizen nor a permanent resident. The Office of International Admissions reviews and makes admissions decisions for international applicants. When students arrive on campus, the Office of International Services verifies their data and enters any missing information. The numbers of “International Students” and “Non-Resident International” students may not match at times, as a small number of International Students have a permanent mailing address in Pennsylvania.

SECTION 4
Student Success

Temple University Fact Book 2013 – 2014 Page | 36

Temple University Fact Book 2013 – 2014 Page | 37
4.1 Degrees Conferred Temple Japan Included 7/1/2012 through 6/30/2013 Degrees Conferred
Total 9,065
Level
Undergraduate Certificate 124
Associate 8
Bachelor’s 6,080
Master’s 1,573
Graduate Certificate 79
Doctoral-Professional Practice 995
Doctoral-Research/Scholarship 206
School/College
Center for the Arts 812
Tyler School of Art 407
Boyer College of Music and Dance 174
Division of Theater, Film and Media Arts 231
Fox School of Business and Management 1,668
Kornberg School of Dentistry 159
College of Education 554
College of Engineering 244
School of Environmental Design 94
College of Health Professions and Social Work 1,154
Health Professions 825
Social Work 329
Beasley School of Law 413
College of Liberal Arts 1,763
School of Media and Communication 808
School of Medicine 222
School of Pharmacy 252
School of Podiatric Medicine 105
College of Science and Technology 577
School of Tourism and Hospitality Management 207

Temple University Fact Book 2013 – 2014 Page | 38
4.2 Undergraduate Retention and Graduation Rates
Fall 2012 Cohort - Retention from Freshman to Sophomore Year
Total Number of Students in Cohort 4,132
Percent Retained Fall 2012 to Fall 2013 89%
Graduation Rates
4 Year Rate (2009 Freshman Cohort) 43%
6 Year Rate (2007 Freshman Cohort) 66%

Temple University Fact Book 2013 – 2014 Page | 39
4.3 Student Success – Section Appendix
The Fall 2012 cohort retention from freshman to sophomore year includes students who entered into
baccalaureate degree programs. Associate degree program and transfer admits have been excluded.
The percent retained from Fall 2012 to Fall 2013 represents those entrants who were enrolled at the fall census point, excluding Temple Japan. Both full-time and part-time students are included.
Degree information is based on census file extracts created in July and include graduations in August
2012, January 2013 and May 2013. Degree counts are not updated to reflect retroactively awarded degrees.

Temple University Fact Book 2013 – 2014 Page | 40

SECTION 5
Temple University Japan

Temple University Fact Book 2013 – 2014 Page | 42

Temple University Fact Book 2013 – 2014 Page | 43
5.1 Temple University Japan - Admissions
The Temple "T" flies proudly over this campus, which is the oldest and largest foreign university in Japan.
Temple University Japan (TUJ) takes pride in the top-quality, English-language education it offers. It also
provides a unique opportunity for thousands of students from nearly 60 countries to earn American
undergraduate and graduate degrees.
Fall 2013 Students Admitted
Students Enrolled
Total 325 188
Undergraduate Total 286 152
Freshmen 171 85
Transfers 115 67
Graduate Total 39 36
Law 5 3
MBA 10 9
TESOL MSEd (Tokyo and Osaka) 24 24
Temple University Fact Book 2013 – 2014 Page | 44
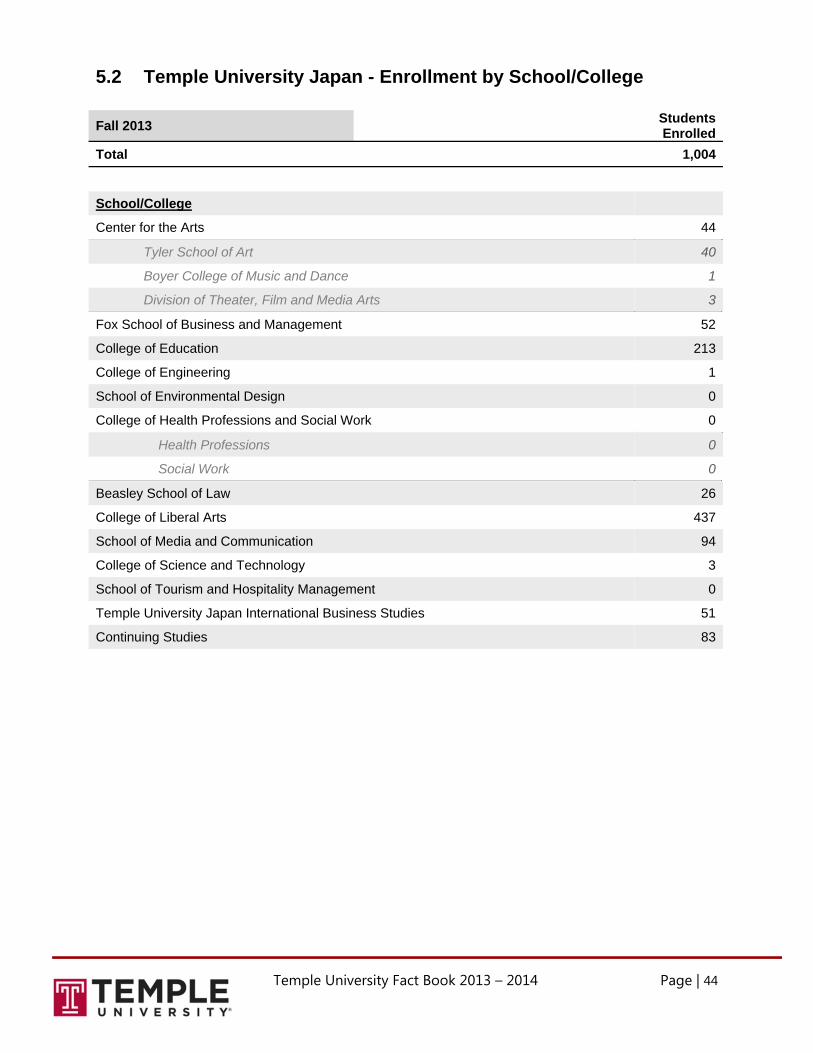
5.2 Temple University Japan - Enrollment by School/College
Fall 2013 Students Enrolled
Total 1,004
School/College
Center for the Arts 44
Tyler School of Art 40
Boyer College of Music and Dance 1
Division of Theater, Film and Media Arts 3
Fox School of Business and Management 52
College of Education 213
College of Engineering 1
School of Environmental Design 0
College of Health Professions and Social Work 0
Health Professions 0
Social Work 0
Beasley School of Law 26
College of Liberal Arts 437
School of Media and Communication 94
College of Science and Technology 3
School of Tourism and Hospitality Management 0
Temple University Japan International Business Studies 51
Continuing Studies 83

Temple University Fact Book 2013 – 2014 Page | 45
5.3 Temple University Japan Enrollment by Demographics
Fall 2013 Students Enrolled
Total 1,004
Level
Undergraduate 723
Graduate 281
Time Status
Full-Time 606
Part-Time 398
Full-Time Equivalent (FTE) Students 739
Gender
Male 525
Female 479
Unreported 0
Race/Ethnicity
American Indian/Alaska Native 0
Asian 12
African American 11
Hispanic/Latino 7
Pacific Islander 0
Two or More Races 4
White, non-Hispanic 64
Unknown 362
International 544

Temple University Fact Book 2013 – 2014 Page | 46

SECTION 6
Instruction and Academic Degree Programs

Temple University Fact Book 2013 – 2014 Page | 48

Temple University Fact Book 2013 – 2014 Page | 49
6.1 Instructional Characteristics
7/1/2012 through 6/30/2013
Classes with fewer than 20 students 38%
Classes with 50 or more students 7%
Total number of undergraduate sections offered 4,575
Student to faculty ratio 14:1
6.2 Academic Degree Programs
Temple Japan Included
As of July 1, 2013 Active Academic Degree Programs
Total 404
Post-secondary Certificate or Diploma 19
Associate 2
Bachelor’s 142
Master’s 125
Graduate Certificate 57
Doctoral-Professional Practice 15
Doctoral-Scholarship/Research 44
For a complete list of programs offered, please visit temple.edu/academics/degree-programs.

Temple University Fact Book 2013 – 2014 Page | 50

SECTION 7
Residential and Student Life
7

Temple University Fact Book 2013 – 2014 Page | 52

Temple University Fact Book 2013 – 2014 Page | 53
7.1 Student Organizations
Student Organizations
Registered Student Organizations 328
Student Participants 7,200
Greek Life
Greek Organizations 30
Student Participants 1,100
7.2 Athletics
Varsity Athletic Conference The American Athletic Conference
Number of Recreation Campus Locations 7
Number of Recreation Facilities Patrons per Year 1 Million +
Intercollegiate Sports Clubs 28
Student Participants 2,621

Temple University Fact Book 2013 – 2014 Page | 54
7.3 Undergraduate Residence Halls
Temple Owned Year
OpenedResident Capacity
Student Staff
TotalCapacity
Total 5,079 155 5,234
1300 2001 997 30 1027
1940 1999 465 13 478
Hardwick Hall 1967 479 13 492
Johnson Hall 1967 472 13 485
Morgan North 2013 588 26 614
Morgan South 2013 646 17 663
Peabody 1957 286 8 294
Temple Towers 1985 592 15 607
White Hall 1993 554 20 574
7.4 Graduate Residence Halls
Temple Owned Year
OpenedResident Capacity
Student Staff
TotalCapacity
Total 129 2 131
Podiatry 1999 129 2 131
7.5 Temple Sponsored Housing Resident Capacity
Student Staff
TotalCapacity
Total 164 29 193
Beech International (Graduate) 24 1 25
Elmira Jeffries (Undergraduate) 138 4 142
University Village (Graduate) 2 24 26

Temple University Fact Book 2013 – 2014 Page | 55
7.6 Residential and Student Life – Section Appendix Elmira Jeffries is a sublease of the entire facility.
Johnson Hall includes eight overbook spaces.
Hardwick Hall includes twenty-eight overbook spaces.
1300 includes eighteen overbook spaces.

Temple University Fact Book 2013 – 2014 Page | 56

SECTION 8
Community Engagement

Temple University Fact Book 2013 – 2014 Page | 58

Temple University Fact Book 2013 – 2014 Page | 59
8.1 Temple in the Community
Temple has been named to the President's Higher Education Community Service Honor Roll every year since 2008. The Carnegie Foundation for the Advancement of Teaching awarded Temple University the Community Engagement Classification, a national acknowledgement of the degree of mutually beneficial collaboration between Temple and its greater community, in 2010. Volunteer Services Temple University sponsors more than 300 community engagement programs recognized by the President’s Higher Education Community Service Honor Roll. More than 14,000 Temple Students engage in community services contributing to approximately 65,000 volunteer hours for the city of Philadelphia per year. Engagement Programs 20/20 Scholarship Temple created the 20/20 Scholarship program to help increase the number of Philadelphians with college degrees and to give back to its community. Over the next 10 years, 250 four-year scholarships are to be awarded. The scholarships are available to students who live in Temple’s North Philadelphia community. The $5,000 per year scholarships will close the gap on tuition not covered by financial aid, merit-based scholarships, or other funding. To date, over 40 scholarships have been awarded. School of Medicine’s Center for Obesity Research and Education The School of Medicine’s Center for Obesity Research and Education is a university-wide group of investigators dedicated to excellence in obesity research. A particular focus of the Center is a greater understanding of the causes, treatment and prevention of obesity among minorities of lower socioeconomic status, among whom obesity is more prevalent. School of Medicine’s Center for Bioethics, Urban Health and Policy The School of Medicine’s Center for Bioethics, Urban Health and Policy develops diagnostic, treatment and prevention strategies for North Philadelphia residents who suffer from preventable and treatable health conditions. Tyler School of Art’s Arts in Community Program The Arts in Community Program, administered by Temple’s Tyler School of Art, combines artistic disciplines with skills and knowledge in community organizing. It builds community arts partnerships that stimulate dialogue and share history to create exhibitions and interdisciplinary performances based on community lives and stories, and shared student experiences. Temple University’s Community Hiring and Outreach Temple University’s Community Hiring and Outreach Office assists local residents in preparing for interviews and finding jobs at Temple University and other local employers. Center for Social Policy and Community Development The College of Health Professions and Social Work’s Center for Social Policy and Community Development administers eight workforce development programs to prepare 1,000 youths and adults annually to transition into employment or post-secondary education.

Temple University Fact Book 2013 – 2014 Page | 60

SECTION 9
Alumni and Philanthropy

Temple University Fact Book 2013 – 2014 Page | 62
Temple University Fact Book 2013 – 2014 Page | 64
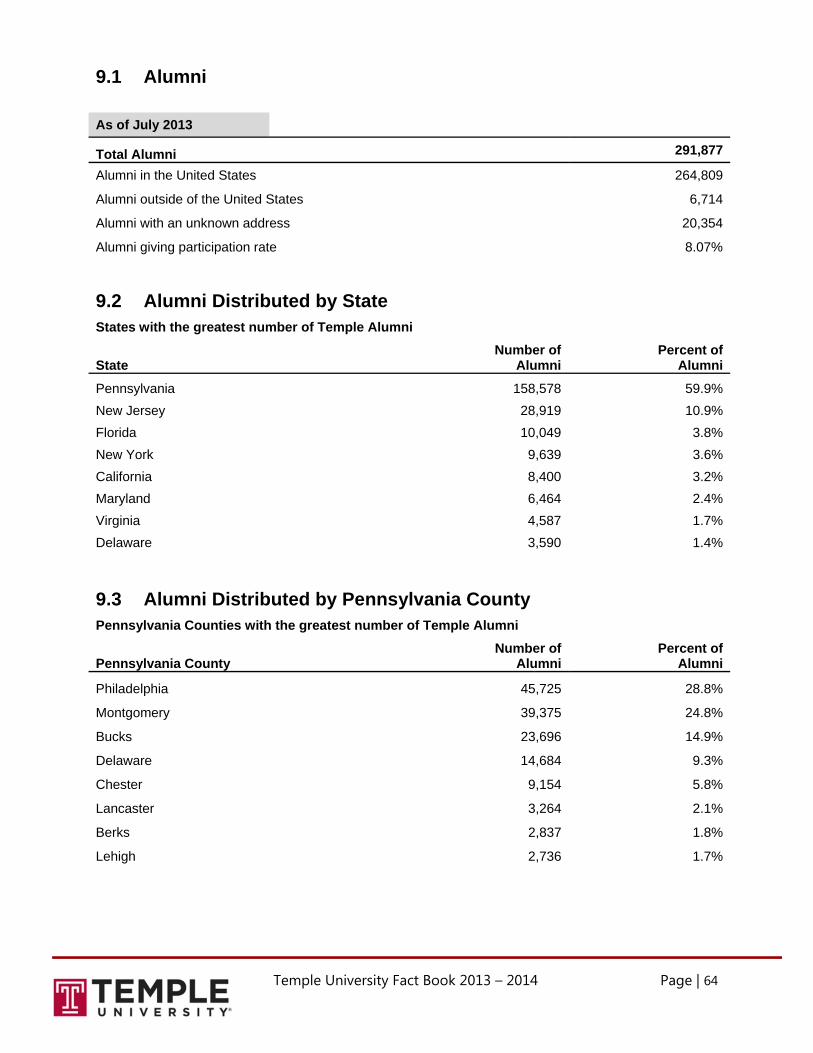
9.1 Alumni
As of July 2013
Total Alumni 291,877
Alumni in the United States 264,809
Alumni outside of the United States 6,714
Alumni with an unknown address 20,354
Alumni giving participation rate 8.07%
9.2 Alumni Distributed by State States with the greatest number of Temple Alumni
State Number of
AlumniPercent of
Alumni
Pennsylvania 158,578 59.9%
New Jersey 28,919 10.9%
Florida 10,049 3.8%
New York 9,639 3.6%
California 8,400 3.2%
Maryland 6,464 2.4%
Virginia 4,587 1.7%
Delaware 3,590 1.4%
9.3 Alumni Distributed by Pennsylvania County Pennsylvania Counties with the greatest number of Temple Alumni
Pennsylvania County Number of
AlumniPercent of
Alumni
Philadelphia 45,725 28.8%
Montgomery 39,375 24.8%
Bucks 23,696 14.9%
Delaware 14,684 9.3%
Chester 9,154 5.8%
Lancaster 3,264 2.1%
Berks 2,837 1.8%
Lehigh 2,736 1.7%
Temple University Fact Book 2013 – 2014 Page | 64
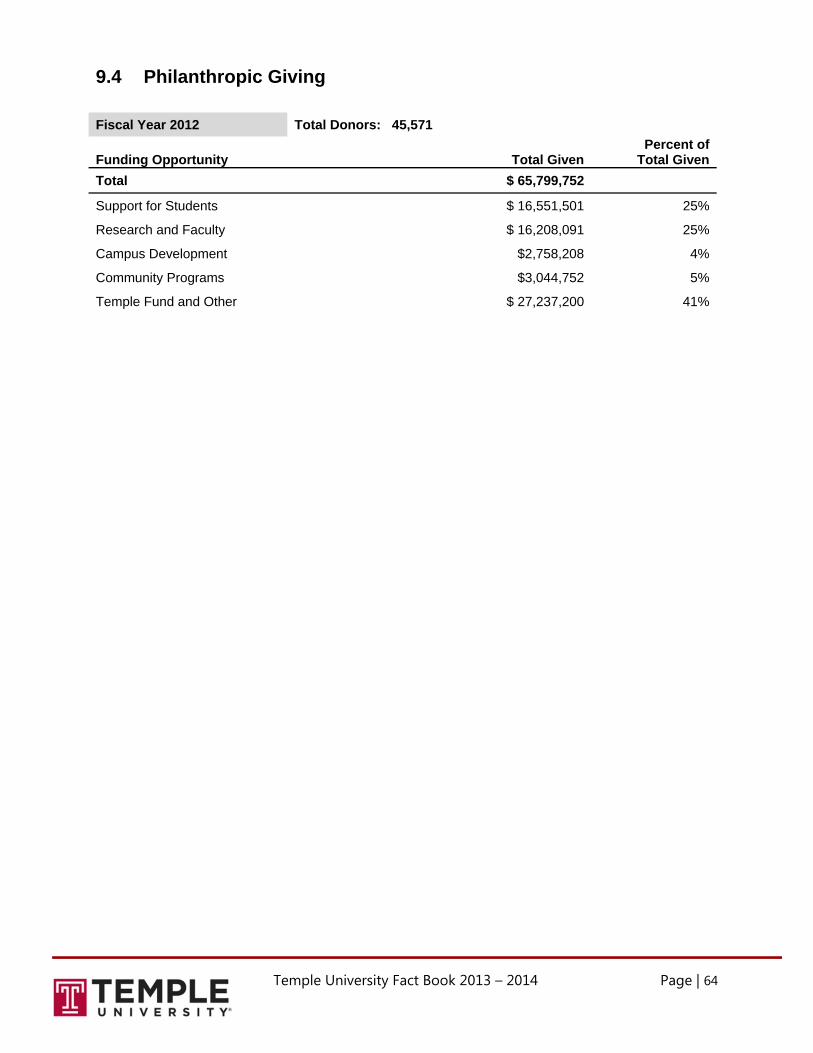
9.4 Philanthropic Giving
Fiscal Year 2012 Total Donors: 45,571
Funding Opportunity Total Given Percent of
Total Given
Total $ 65,799,752
Support for Students $ 16,551,501 25%
Research and Faculty $ 16,208,091 25%
Campus Development $2,758,208 4%
Community Programs $3,044,752 5%
Temple Fund and Other $ 27,237,200 41%

SECTION 10
Faculty, Staff and Administration

Temple University Fact Book 2013 – 2014 Page | 66

Temple University Fact Book 2013 – 2014 Page | 67
10.1 University Faculty, Staff and Administration
Fall 2013 Full-time Part-time
Total University Employees (Headcount) 6,208 2,044
Administration and Staff by Occupational Job Category
Clerical/Secretarial 584 21
Executive, Administrative and Managerial 1,090 28
Other Professional Staff 1,512 436
Service/Maintenance 479 0
Skilled Crafts 183 0
Technical/Paraprofessional 326 45
Total Administration and Staff 4,174 530
Faculty by Tenure Status
Tenured 732 0
Tenure Track 235 0
Non-Tenure Track 1067 0
Adjunct 0 1,514
Total Faculty 2,034 1,514

Temple University Fact Book 2013 – 2014 Page | 68
10.2 Faculty, Staff and Administration – Section Appendix
Job categories are specified by the Federal Equal Employment Opportunity (EEO) job categories.
Administrators with faculty rank are not included in the faculty counts. Faculty, Staff and Administration counts as of the official HR Fall Census, IPEDS – October end.

SECTION 11
Finance

Temple University Fact Book 2013 – 2014 Page | 70

Temple University Fact Book 2013 – 2014 Page | 71
11.1 General Tuition and Fees
Academic Year 2014 In-State Residents
Out-of-State Residents
Undergraduate - Lower Division
Full-time Undergraduate $13,406 $23,432
Full-time Undergraduate
Including University services fee $14,096 $24,122
Part-time Undergraduate (per credit hour) $517 $834
Undergraduate - Upper Division
Full-time Undergraduate $14,006 $24,032
Full-time Undergraduate
Including University services fee $14,696 $24,722
Part-time Undergraduate (per credit hour) $538 $855
Graduate
Graduate (per credit hour) $745 $1,043
Fee Structure
Fall and Spring
Semesters
Summer
Sessions
1.0 to 4.9 Credits $122 $77
5.0 to 8.9 Credits $249 $132
9+ Credits $345 $173
For more information about tuition and fees, please visit:
www.bursar.temple.edu/tuition-and-fees/tuition-rates
For more information about room and board costs, please visit:
http://housing.temple.edu/

Temple University Fact Book 2013 – 2014 Page | 73
11.2 Financial Aid by Source
Academic Year 2013 Need Based
AidNon-Need Based
Aid
Scholarships / Grants
Total $104,564,736 $34,995,537
Federal $40,234,757
State $25,744,073
Temple $38,585,906 $27,452,986
Private $7,542,551
Self-Help
Total $140,496,458 $43,567,802
Student loans $138,047,283 $43,567,802
Federal work study $2,449,175
Other Financial Aid Sources
Total $49,634,310
Parent loans $36,239,425
Tuition waivers $4,700,181
Athletic awards $8,694,704
Need Based Financial Aid
Full-time undergraduates awarded need-based scholarships or grant aid 52%
Average Award $6,757
Full-time undergraduates awarded need-based loans 53%
Average Loan $4,598
Non-need based Financial Aid
Full-time undergraduates awarded non-need-based scholarships or grant aid 8%
Average Award $5,336
Full-time undergraduates awarded non-need-based athletic scholarships or grant aid 2%
Average Award $16,618

Temple University Fact Book 2013 – 2014 Page | 74
11.3 Endowments
Endowment Balances by Net Asset Classification
June 30, 2013 Unrestricted
Temporarily Restricted
Permanently Restricted Total
Total $ 72,332,000 $ 60,007,000 $ 274,817,000 $ 407,156,000
Donor-restricted endowment funds $ (305,000) $ 60,007,000 $ 274,817,000 $ 334,519,000
Board-designated endowment funds $ 72,637,000 - - $ 72,637,000
June 30, 2012
Total $ 52,994,000 $ 39,891,000 $ 234,794,000 $ 327,679,000
Donor-restricted endowment funds $ (1,571,000) $ 39,891,000 $ 234,794,000 $ 273,114,000
Board-designated endowment funds $ 54,565,000 - - $ 54,565,000
Changes in Endowment Net Assets
June 30, 2013 Unrestricted
Temporarily Restricted
Permanently
Restricted Total
Total investment return $ 6,289,000 $ 24,302,000 $ 3,855,000 $ 34,446,000
Endowment net assets, beginning of the year $ 52,994,000 $ 39,891,000 $ 234,794,000 $ 327,679,000
Investment return:
Investment income $ 13,000 $ 4,843,000 $ 347,000 $ 5,203,000
Net realized and unrealized appreciation $ 6,276,000 $ 19,459,000 $ 3,508,000 $ 29,243,000
Contributions and transfers $ 14,952,000 $ 7,109,000 $ 36,168,000 $ 58,229,000
Appropriation of endowment assets for expenditure (spending rule)
$ (1,903,000) $ (11,295,000) - $ (13,198,000)
Endowment net assets, end of the year $ 72,332,000 $ 60,007,000 $ 274,817,000 $ 407,156,000

Temple University Fact Book 2013 – 2014 Page | 74
11.4 Operating Budget
Fiscal Year 2014
Budget
Total Revenue $1,210,566,000
Total Education and General Revenue $925,547,000
Tuition and Fees $727,308,000
Commonwealth Appropriation $146,453,000
Indirect Cost Recovery $26,126,000
Other Sources $25,660,000
Total Other Revenue $285,019,000
Sales and Services of Auxiliary Enterprises $94,505,000
Practice Plans $190,514,000
Total Expenditures $1,210,566,000
President $51,201,151
Provost $559,110,280
Sr. Executive Vice President Health Science $232,314,563
Sr. Vice President - Construction, Facilities and Operations $130,506,439
Executive Vice President, CFO and Treasurer $237,433,567 For more information please visit:
temple.edu/controller/financial_statements

Temple University Fact Book 2013 – 2014 Page | 75
11.5 Finance – Section Appendix
Once an undergraduate student has completed 60 credit hours earned, the student is considered
an upper division student. All transfer credits placed on the Temple University transcript will count towards the total number of credit hours earned. Depending on when grades are entered and transfer credits are approved, a mid-semester tuition increase may result.

Temple University Fact Book 2013 – 2014 Page | 76

SECTION 12
Facilities

Temple University Fact Book 2013 – 2014 Page | 78

Temple University Fact Book 2013 – 2014 Page | 79
12.1 Physical Plant
Fall 2013
Buildings Gross
Square Feet
Net Square
Feet AcreageParking
Areas Parking Spaces
Number of Beds –
Student Housing
Total – All Campuses
211 13,788,281 8,466,795 382 44 8,542 4,952
Main Campus 109 8,767,723 5,322,748 117 23 2,970 4,823
Ambler 24 321,498 193,349 186 11 1,325 0
Temple University Center City
1 131,988 74,151N/A
LeasedN/A N/A N/A
Harrisburg 1 35,650 25,634N/A
LeasedN/A N/A N/A
Health Sciences 23 1,716,522 954,355 21 3 1,140 N/A
Hunting Park Complex
1 210,875 137,068N/A
Leased1 620 N/A
Podiatric Medicine 2 212,456 137,161 3 1 125 129
Temple University Health System (TUHS)
48 2,391,569 1,622,329 55 5 2,362 N/A
Fort Washington 2 25,550 19,845 N/A Leased
N/A N/A N/A

Temple University Fact Book 2013 – 2014 Page | 80
12.2 Main Campus Map

Temple University Fact Book 2013 – 2014 Page | 81
12.3 Physical Plant - Utility Expenditures
Fall 2013
Utility All Campuses
Main Campus
Health Sciences
CenterPodiatric Medicine Ambler TUHS
Water / Sewer ($M) $ 2.70 $ 1.43 $ 0.56 $ 0.04 $ 0.08 $ 0.59
Oil / Gas ($M) $ 8.60 $ 4.55 $ 1.79 $ 0.13 $ 0.26 $ 1.87
Electric ($M) $ 21.80 $ 11.53 $ 4.54 $ 0.33 $ 0.66 $ 4.74
FY13 Utility Cost ($M) $ 33.10 $ 17.50 $ 6.90 $ 0.50 $ 1.00 $ 7.20
% of Total 100% 52.9% 20.8% 1.5% 3.0% 21.8%

Temple University Fact Book 2013 – 2014 Page | 82
SECTION 13
Research and Technology Transfer

Temple University Fact Book 2013 – 2014 Page | 84

Temple University Fact Book 2013 – 2014 Page | 85
13.1 Technology Development and Commercialization
Net Income Distribution
Net Income is shared between the inventors (personally) and the university. Net Income equals gross
income minus 20% to supplement the Office of Technology Development and Commercialization’s
budget, in addition to patent, legal, and marketing expenses. Net Income is split equally between the
inventors and the university; therefore, 40% is disbursed to the inventors and the remaining 40% is
distributed as follows:
Less than or equal
to $500,000 Adjusted
Greater than
$500,000 Adjusted
Department/Research Unit 35% 14% 10% 4%
College/School 15% 6% 10% 4%
University 50% 20% 80% 32%
Fiscal Year 2013
Sponsored Research Programs (Internal and External) Total Expenditures $230 M
Invention Disclosures 60
Patent Filings 19
Licenses/Options 6
Income $11.5M
Temple University Fact Book 2013 – 2014 Page | 86
13.2 Research and Technology Transfer – Section Appendix The Technology Development and Commercialization FY2013 figures are projected.
The Net Income Distribution adjusted percentages are calculated as a percentage of net income
versus Temple University’s share of net income.

SECTION 14
Information Technology

Temple University Fact Book 2013 – 2014 Page | 88
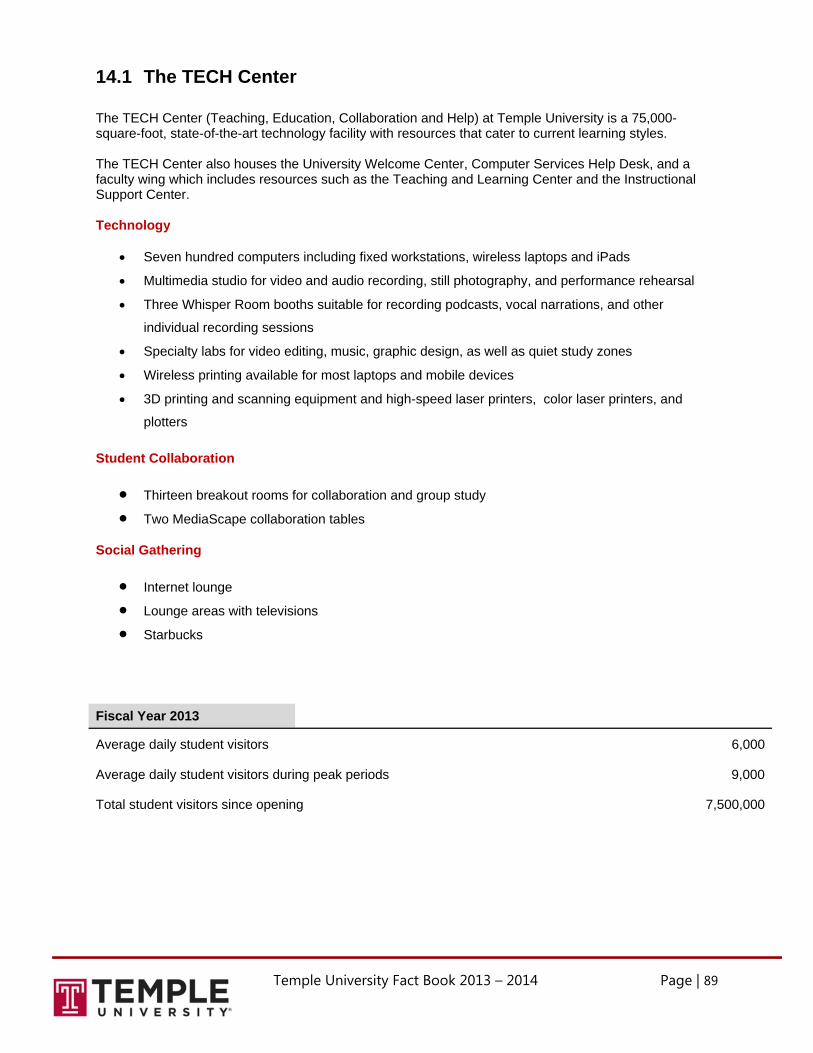
Temple University Fact Book 2013 – 2014 Page | 89
14.1 The TECH Center The TECH Center (Teaching, Education, Collaboration and Help) at Temple University is a 75,000-square-foot, state-of-the-art technology facility with resources that cater to current learning styles. The TECH Center also houses the University Welcome Center, Computer Services Help Desk, and a faculty wing which includes resources such as the Teaching and Learning Center and the Instructional Support Center. Technology
Seven hundred computers including fixed workstations, wireless laptops and iPads
Multimedia studio for video and audio recording, still photography, and performance rehearsal
Three Whisper Room booths suitable for recording podcasts, vocal narrations, and other
individual recording sessions Specialty labs for video editing, music, graphic design, as well as quiet study zones Wireless printing available for most laptops and mobile devices 3D printing and scanning equipment and high-speed laser printers, color laser printers, and
plotters
Student Collaboration
Thirteen breakout rooms for collaboration and group study Two MediaScape collaboration tables
Social Gathering
Internet lounge Lounge areas with televisions Starbucks
Fiscal Year 2013
Average daily student visitors 6,000
Average daily student visitors during peak periods 9,000
Total student visitors since opening 7,500,000

Temple University Fact Book 2013 – 2014 Page | 90
14.2 Information Technology Resources Estimated number of University-owned workstations 11,233
Number of computer labs available across Temple's campuses 100
Percent of faculty connected to the campus network/internet 100%
Percent of classrooms connected to the campus network/internet 100%
Percent of classrooms that are smart classrooms 85%
Percent of smart classrooms served by wireless network access 89%
Percent of residence hall beds that have internet access 100%
Percent of residence hall beds that have wireless internet access 100%
Number of wireless nodes on the campus network 2,850
Average number of concurrent wireless connections 17,500
Number of data ports on campus 56,000
Number of physical network servers on campus 163
Number of virtual network servers on campus 496
Internet bandwidth offered 7,000 Mbps
University datacenter size 27,000 sqft
Number of telephones on University phone system 34,380
14.3 Information Technology Usage High performance computing (HPC) service units (core hours) 19,000,000
Number of Help Desk contacts for assistance 94,847
Number of office visits made by Desktop Support Staff 13,215
Number of TUportal logins 10,283,541
Number of www.temple.edu hits 24,000,000
Number of professors and organization leaders using Blackboard 9,182
Number of courses on Blackboard 44,319
Number of communities/organizations on Blackboard 1,681
Number of users connected to Temple's Blackboard Mobile App 16,749
Number of computers and peripherals collected by the Computer Recycling Center (CRC) 7,762
Number of computers and peripherals refurbished/reused 3,247
Tonnage of all items refurbished/reused 35 tons
Total tons of all items properly disposed of 55 tons

plus.google.com/+templeuniversity facebook.com/templeu twitter.com/templeuniv
instagram.com/templeunivyoutube.com/templeuniversity linkedin.com/edu/temple-university
www.temple.edu