template fao/jmpr evaluations › fileadmin › templates › agphome › documents ›...
TRANSCRIPT

Cyflumetofen 175
CYFLUMETOFEN (273)
First draft prepared by Dr Yukiko Yamada, Ministry of Agriculture, Forestry and Fisheries,
Tokyo, Japan
EXPLANATION
Cyflumetofen (consisting of isomers) is a bridged diphenyl acaricide (miticide) for control of Tetranychus sp. (Two spotted spider mite, Kanzawa spider mite, Desert spider mite) and influences the mitochondrial electron transport chain by inhibiting the complex II substance in the cell. Cyflumetofen does not have translaminar or systemic activity.
Cyflumetofen was first registered in Japan in 2007. Henceforth, cyflumetofen has been registered in a number of countries. It is used in a variety of crops, including citrus fruits, pome fruits, stone fruits, berry fruits, vegetables, dried herbs, and teas. It was included in the Codex Priority List in 2013 by the 45th CCPR as a new compound for evaluation by the current JMPR.
The Meeting received information on physical and chemical properties, animal and plant metabolism, environmental fate, analytical methods, storage stability, use patterns, supervised trials, and processing. Cyflumetofen is reviewed by the JMPR for the first time.
IDENTITY ISO common name: Cyflumetofen Chemical name IUPAC: 2-methoxyethyl (RS)-2-(4-tert-butylphenyl)-2-cyano-3-oxo-3-(α,α,α-trifluoro-o-
tolyl)propionate CAS: 2-methoxyethyl α-cyano-α-[4-(1,1-dimethylethyl)phenyl]-β-oxo-2-
(trifluoromethyl)benzenepropanoate CAS Registry No.: 400882-07-7 CIPAC No.: 821 Structural formula:
Molecular formula: C24H24F3NO4 Molecular weight: 447.45
PHYSICAL AND CHEMICAL PROPERTIES
Pure active ingredient
Property Results Reference Appearance White solids at 21.5 °C
Iijima K, 2001a [OTSA-0029(EN)-FR]
Odour: Odourless at 21.5 °C
Iijima K, 2001c [OTSA-0030(EN)-FR]

176 Cyflumetofen
Hydrolysis Half-life at 25 and 40 °C 25 °C 40 °C pH 4 222 h 70 h pH 7 5 h 3 h pH 9 12 m not calculable
Knight L, 2004a [OTSA-0076]
Photolysis After 4 and 2 hours of irradiation with xenon arc light (38 W/m2, 300–400 nm) respectively at 25 °C (0.01 mg/L). DT50 : pH 4 buffer Natural water Eq. summer, 40 °N lat: 5.00 h 54 h (including hydrolysis) Eq. Tokyo spring, 35 °N lat: 10.6 h 5.36 h In non-irradiated aqueous pH 4 buffer solution, 93.4% of AR recovered as the parent after 4 h, while in non-irradiated natural water, degradation was significant (38.6% of AR recovered as the parent after 2 hours). Since degradation also occurred in non-irradiated samples, a significant proportion of the degradation in natural water could be attributed to hydrolysis.
Knight L, 2004a, [OTSA-0078]
Technical material Property Results Reference Appearance: Yellow solid at room temperature
Baltussen E, 2006a [OTSA-0327-FR]
Odour No characteristic odour at room temperature
Baltussen E, 2006a [OTSA-0327-FR]
Relative density: 1.229 g/mL at 20 °C (pycnometer comparable method)
Iijima K, 2003a [OTSA-0031(EN)-FR]
Melting point: 779–81.7 °C Iijima K, 2002a [OTSA-0032(EN)-FR]
Boiling point: 293–297 °C at atmospheric pressure (no decomposition prior to boiling)
Iijima K, 2002a [OTSA-0032(EN)-FR] Iijima K, 2002c [OTSA-0039(EN)-FR]
Temperature of decomposition
In the range of 320–446 °C Iijima K, 2002a [OTSA-0032(EN)-FR]
Vapour pressure: < 5.9 × 10⁻⁶ Pa at 25 °C 3.1 + 0.23 × 10⁻⁵ Pa at 50 °C (Extrapolation from measurements at 150 °C to 190 °C) < 1.3 × 10⁻⁵ Pa (1 × 10⁻⁷ mmHg) (25 °C) (Triplicate test system using gas saturation method)
Saka M, 2002 [OTSA-0049(EN)-FR]
Volatility, Henry's Law Constant at 20 °C
< 9.4 × 10⁻² Pa m3/mol (Calculation by dividing vapour pressure by water solubility)
Cardinaals JM, 2006a [OTSA-0331-FR]
Octanol-water partition coefficient at (log Pow)
4.3 at 25 °C No significant effect of pH (4–10) on log Pow.
Iijima K, 2004 [OTSA-0036(EN)-FR]
Solubility in water In pure water Iijima K, 2002e

Cyflumetofen 177
Property Results Reference 28 μg/L at 20 °C (pH 7) No effect of PH expected
[OTSA-0034(EN)-FR]
Solubility in solvents at 20 °C:
mg/mL solvent Acetone > 500 Dichloromethane > 500 Ethyl acetate > 500 n-Hexane 5.16 (in solution) Methanol 98.7 (in solution) Toluene > 500 Deionized water 2.15 0.215 pH 5 Buffer 36.0 3.69 pH 7 Buffer 479 68.1 pH 9 Buffer 518 76.5 a corrected for solution density
Iijima K, 2003c [OTSA-0035(EN)-FR]
Hydrolysis: DT50 at 25 °C
pH 4 7.7 d pH 5 6.0 d pH 7 9.8 h pH 9 10.3 m Five major metabolites (> 10% of TAR) were formed
Nakamura H, 2004a [OTSA-0156(EN)-FR]
Dissociation constant (pKa)
-4.2 Cardinaals JM, 2006b [OTSA-0330-FR]
Photolysis The aquatic photolysis was determined after 2 days of irradiation with xenon arc light (20 W/m2, 290–400 nm) at 25 °C. In natural water a significant proportion of the degradation may be attributed to hydrolysis since non-irradiated solution showed extensive degradation DT50 in pH 5 buffer: Irradiated: 1.28 h (including hydrolysis) Non irradiated: 134 h DT50 in natural water: Irradiated: 1.07 h (including hydrolysis) Non irradiated: 3.40 h
Ohyama K, 2004a [OTSA-0157(EN)-FR]
Formulations: Suspension concentrate (flowable concentrate) (SC) formulations containing
200 g ai/L available
No FAO specification has been developed for cyflumetofen.
METABOLISM AND ENVIRONMENTAL FATE
The following links code numbers and structure or description of the compounds appearing in the various metabolism and environmental fate studies.

178 Cyflumetofen
Table 1 Structure of compounds appearing in metabolism and environmental fate studies
Code (MW) IUPAC name Structure Metabolite or degradate
found in
Cyflumetofen (447.45)
2-methoxyethyl (RS)-2-(4-tert-butylphenyl)-2-cyano-3-oxo-3-(α,α,α-trifluoro-o-tolyl)propionate
Goat Satsuma mandarin Apple Eggplant
B-1 (190.12) 2-(trifluoromethyl)benzoic acid
F F
F
O
OH
Rat Goat Satsuma mandarin Apple Eggplant Soil
B-3 (189.13) Syn: M9210I005
2-(trifluoromethyl)benzamide
FF
F
O
NH2
Soil
AB-1 (345.36) Syn: M9210I003
(RS)-2-(4-tert-butylphenyl) -3-oxo-3-[2-(trifluoromethyl)phenyl] propanenitrile
FFF
O
N
Rat Goat Hydrolysis in buffer Hydrolysis simulating processing Soil
AB-6 (465.45)
2-methoxyethyl-2-((R,S)-4- tert-butylphenyl)-3-oxo-3-({[2-(trifluoromethyl)phenyl]carbonyl}amino)propanoate
O
O
F FF
O
NH
O
O
Satsuma mandarin Apple Eggplant
AB-7 (447.45)
2-methoxyethyl-((R,S)-4-tert-butyl-2-{[2-(trifluoromethyl)phenyl]carbonyl}phenyl (cyano)acetate
F F
F
O
N O
O
O
Satsuma mandarin Apple Eggplant
A-1 (275.35) Syn: M9210I008
4-methoxyethyl (RS)-4-tert-butylphenyl)(cyano)acetate
O
N
OO
Soil
A-2 (173.26) Syn: M9210I001
4-tert-butylphenyl- acetonitrile
N
Goat Soil

Cyflumetofen 179
Code (MW) IUPAC name Structure Metabolite or degradate
found in
A-12 (178.23) Syn: M9210I002
4-tert-butylbenzoic acid
O
OH
Goat Soil
A-20 (173.26) Syn: M9210I019
2-(4-carboxyphenyl)-2- methyl-1-propanol
OH
O
OH
Rat Goat
M9210I014 (217.67) 2-cyano-2-(4-tert-butylphenyl)acetic acid
Goat
M9210I021 (375.35)
(2RS)-2-methyl- 2-{4-[2-(2-trifluoromethylphenyl)- 1-cyano-2-oxoethyl]phenyl}- propionic acid
Goat
M9210I023 (189.26) 4-(1-hydroxy-2-methyl-2-propyl) benzonitrile
Goat
M9210I029 (363.33)
(2RS)-2-{4-[(2RS)-1,2-dihydroxy- 2-propyl]phenyl}- 3-(2-trifluorophenyl)-3-oxo- propiononitrile
Goat
M9210I030 (347.34)
(2RS)-2-[4-(2-hydroxy-2-propyl) phenyl]-3-(2-trifluorophenyl)- 3-oxopropiononitrile
Goat
M9210I031 (331.30)
(2RS)-2-(4-acetylphenyl)- 3-(2-trifluorophenyl)- 3-oxopropiononitrile
Goat
M9210I032 (203.24)
2-(4-cyanomethylphenyl)-2-methyl- propionic acid
Goat
N
O OH
FF FO
N
OH
O
N
OH
FF FO
OH
N
OH
FF FO
OH
N
N
OH
O
FF F
O
O
N

180 Cyflumetofen
Code (MW) IUPAC name Structure Metabolite or degradate
found in
M9210I033 (235.28)
N-(4-tert-butylphenylcarbonyl)- aminoacetic acid
Goat
M9210I040 (251.28)
N-[4-(1-hydroxy-2-methyl-2-propyl) phenylcarbonyl]-aminoacetic acid
Goat
M9210I042/ M9210I044 (isomers) (521.49)
α-[2-(4-tert-butylphenyl)-2-cyano- 1-(2-trifluoromethylphenyl) ethenyl]glucoside
Goat
M9210I043 (537.47)
α-{2-cyano- 1-(2-trifluoromethylphenyl)- 2-[4-(1-hydroxy-2-methyl-2-propyl) phenyl]ethenyl}glucoside
Goat
The metabolism and distribution of cyflumetofen in animals and plants and the fate of cyflumetofen in the environment were investigated using the following 14C-radiolabelled compounds.
[t-butylphenyl-ring-U-14C]-cyflumetofen (“butylphenyl-label”)
[benzoyl-ring-U-14C]-cyflumetofen (“benzoyl-label”)
Animal metabolism
The Meeting received information on the results of studies on lactating goats which were fed radio-labelled cyflumetofen.
Metabolism studies on laboratory animals including rats were reviewed in the framework of toxicological evaluation by the current JMPR and the relevant information is summarized below.
Rat
Highest residues were found in the liver followed by the kidney regardless of sex, dose and label position and time point of measurement. Cyflumetofen was extensively metabolized: in total 18 metabolites were identified. B-1, 2-trifluoromethylbenzoic acid was a major metabolite in the rat metabolism (occurring up to 28% of the applied dose). The predominant metabolic pathway for cyflumetofen involves cleavage of the tert-butylphenyl and trifluorotolyl moieties. Major reactions on the tert-butylphenyl ring are cleavage of the methoxyethyl group, hydroxylation at the butyl group, decarboxylation and glucuronidation at the butyl group. Major reactions on the trifluorotolyl-ring are glutathione conjugation at the carboxyl group and further changes of the glutathione group to mercapturic acid or thiolactic acid. In addition, hydroxylation and
N
O
OHO
H
N
O
OHO
H
OH
FF FO
N
GlcA
FF FO
N
GlcAOH
*
*

Cyflumetofen 181
oxidation reactions at the butyl group and cleavage of the carboxylic ester moiety is observed on the parent structure.
Lactating goats (Sowka, et al, 2011a; and Fabian & Landsiedel, 2011a)
Two lactating goats were given orally by gavage radio-labelled cyflumetofen for 12 (benzyol-label) or 10 (butylphenyl-label) consecutive days. The mean actual dose of benzoyl-label for each of the two goats (Goat 1 and 2) was 0.27 and 0.30 mg/kg bw corresponding to 14.9 and 12.1 ppm in feed. The mean actual dose of butylphenyl-label for each of the two goats (Goat 3 and 4) was 0.43 and 0.48 mg/kg bw corresponding to 12.8 and 11.8 ppm in feed. Milk samples were collected twice daily. The goats were sacrificed 18–24 h after the last dose and tissue/organ samples were collected.
The radioactivity in urine, faeces, blood, stomach content, gut content, gut/stomach, individual milk samples (two samples per day), cage wash, cream and skim milk was determined by liquid scintillation counting (LSC). After transport of the samples to the test facility, subsamples of urine, faeces, and milk of both animals dosed with the benzoyl-label and both animals dosed with the butylphenyl-label were combined to generate label-specific pooled samples. The tissues/organs of both animals (benzoyl- and butylphenyl-label separately) were combined and homogenized. Bile was also pooled. The pooled samples and homogenized tissues were measured with LSC (solid samples after oxidative combustion of small aliquots). All samples were stored at -18 °C or below.
No extraction was necessary for urine and bile prior to HPLC analysis. Subsamples of the pooled milk and faeces samples, and homogenized tissue samples were extracted with acetonitrile and water, or only acetonitrile. The results of the solvent extractions (LSC of the combined extracts) are referred to as extracted radioactive residues (ERR). The residual radioactive residues after solvent extraction (RRR) were determined by combustion analysis. The solvent extracts with sufficient concentrations of radioactive residues were analysed by reversed-phase HPLC with gradient elution and radio-detection, generally using two chromatographic methods.
Identification of metabolites was mainly based on fractionation of urine of both labels and bile of the butylphenyl-label, followed by HPLC-MS, GC-MS and/or NMR analysis of the isolated fractions. Thereafter, the MS samples were used as reference items for co-chromatography experiments to achieve peak assignment.
The residues after solvent extraction of liver (benzoyl- and butylphenyl-label) and kidney (benzoyl-label) were further incubated with protease, whereby significant portions of radioactivity were released. The protease solubilizates of liver (both labels) were analysed by HPLC.
During the study period, no behavioural or physical abnormalities were observed. At sacrifice, macroscopic examinations revealed no abnormalities.
Daily samples of milk, urine, and faeces obtained for twelve and ten consecutive days were measured for total radioactive residues for each animal. The results in Table 2 indicate that the radioactive residue was rapidly and extensively excreted.
Until sacrifice, the radioactive residues excreted via urine amounted to 29.9% and 33.6% (Goat 1 and 2 of the benzoyl-label) and 38.4% and 45.3% (Goat 3 and 4 of the butylphenyl-label) of the total radioactivity administered. The residues excreted via faeces accounted for 49.0% and 43.9% (Goat 1 and 2) and 50.3% and 42.6% (Goat 3 and 4) of the dose. The recovered radioactivity from urine and faeces together with from cage wash accounted for 79.4 and 78.5% of the total administered radioactivity for Goat 1 and Goat 2, respectively. Similarly, the recovered radioactivity from urine and faeces together with from cage wash accounted for 89.6, and 89.1% of the total administered radioactivity for Goat 3 and 4, respectively.
In milk, only low proportions of the administered dose were found, 0.10% and 0.14% (benzoyl- label, Goat 1 and 2) and 0.04% and 0.03% (butylphenyl-label, Goat 3 and Goat 4).
For both labels, only low portions of the administered dose were retained in edible tissues and organs. The total radioactive residues of the benzoyl- and butylphenyl-label in edible tissues/organs and milk were as follows: 0.019 mg/kg and 0.008 mg/kg in milk; 0.404 mg/kg and 0.287 mg/kg in liver, 0.191 mg/kg and 0.167 mg/kg in kidney, 0.010 mg/kg and 0.005 mg/kg in leg muscle, 0.010 mg/kg and 0.004 mg/kg in back muscle, 0.014 mg/kg and 0.018 mg/kg in abdominal fat and 0.014 mg/kg and 0.015 mg/kg in renal fat. In milk, muscle and fat tissues, only low residue levels were found. The rate of extracted radioactivity was high, above 78% TRR, except for milk from goats dosed with the benzoyl-label (51% TRR) and liver

182 Cyflumetofen
(≥ 65% TRR). In milk; however, the radioactive residues after solvent extraction were below 0.010 mg/kg, and from liver additional radioactivity was released upon protease treatment.
For further analysis, samples from Goat 1 and Goat 2 were pooled (benzoyl-label) and Goat 3 and Goat 4 (butylphenyl-label) were pooled to generate pooled samples for milk (Days 5-12 and Days 5-10), urine (Days 1-12 and Days 1-10), and homogenized faeces (Days 1-12 and Days 1-10). Similarly for each label, samples of liver, bile, kidney, muscle tissues and fat tissues were used to generate one pooled sample per matrix and label. These samples were LSC measured, resulting in the TRR. Additionally, milk and tissue samples were extracted and the TRR was calculated as the sum of the ERR and the residue after solvent extraction (TRR calculated). The TRR calculated was used for all further calculations.
The total radioactive residues in goat milk, tissue, urine and faeces are provided in Table 2.
Table 2a Material balance after repeated oral dose of radiolabelled cyflumetofen to goats, including distribution of residues, and total radioactive residues (TRRs) in milk, tissues, urine and faeces
Benzoyl-label
Matrix TRR measured a mg eq/kg % of Dose
TRR calculated b mg eq/kg
Goat 1 Goat 2 Goat 1 Goat 2 Goats 1 & 2 Urine Subtotal Day 1–12 29.873 33.608 Urine, pooled sample Day 1–12 4.084 c
Faeces Subtotal Day 1–12 48.965 43.906 Faeces, pooled sample Day 1–12 e 1.357 1.252
Milk; Application day 1 0.003 0.007 c
Milk; Application day 2 0.006 0.007 c Milk; Application day 3 0.006 0.008 c Milk; Application day 4 0.008 0.012 c Milk; Application day 5 0.009 0.014 c Milk; Application day 6 0.012 0.020 c Milk; Application day 7 0.013 0.012 c Milk; Application day 8 0.011 0.013 c Milk; Application day 9 0.008 0.012 c Milk; Application day 10 0.008 0.011 c Milk; Application day 11 0.008 0.009 c Milk; Application day 12 0.008 0.015 c Milk Subtotal 0.101 0.141 Milk: pooled sample Day 5–12 0.019 0.018 Liver 0.404 0.404 0.184 0.154 0.390 Blood 0.039 0.014 0.047 0.018 c Kidney 0.191 0.191 0.017 0.016 0.190 Kidney fat 0.014 0.014 0.001 0.002 0.015 Abdominal fat f 0.014 0.014 0.001 0.002 0.015 Leg muscle 0.010 0.010 0.020 0.019 0.010 Back muscle f 0.010 0.010 0.004 0.003 0.009 Bile 1.426 1.426 0.008 0.019 c Gut/Stomach 0.066 0.061 0.337 0.276 c Stomach contents 0.271 0.104 4.667 1.190 c Gut contents 1.556 1.535 4.122 5.974 c Urine in bladder d 3.219 d 0.026 c Organs/Tissues Subtotal 9.408 7.699 Cage wash – – 0.546 0.961 Total Recovery 88.894 86.318
a For liver, bile, kidney, fat and muscle samples, the values determined from pool samples are given and were converted to % dose values for the individual animals. b TRR calculated from pooled samples as the sum of ERR and residue after solvent extract (used for calculation of metabolite concentrations) c Not calculated d Not sampled e Faeces was homogenized with water prior LSC (approximately 4 to 8 parts water per part faeces) f Abdominal fat referred as subcutaneous fat in the in-life report, back muscle referred as flank muscle

Cyflumetofen 183
Table 2b Material balance after repeated oral dose of radiolabelled cyflumetofen to goats, including distribution of residues, and total radioactive residues (TRRs) in milk, tissues, urine and faeces
Butylphenyl-label
Matrix TRR measured mg eq/kg a % of Dose
TRR calculated b mg eq/kg
Goat 3 Goat 4 Goat 3 Goat 4 Goats 3 /4 Urine Subtotal Day 1–12 38.437 45.272 Urine, pooled sample Day 1–12 6.079 c Faeces Subtotal Day 1–12 50.280 42.639 Faeces, pooled sample Day 1–12 e
1.304 1.290
Milk; Application day 1 0.003 0.002 c Milk; Application day 2 0.003 0.002 c Milk; Application day 3 0.003 0.003 c Milk; Application day 4 0.003 0.003 c Milk; Application day 5 0.004 0.003 c Milk; Application day 6 0.003 0.004 c Milk; Application day 7 0.004 0.003 c Milk; Application day 8 0.004 0.003 c Milk; Application day 9 0.005 0.002 c Milk; Application day 10 0.004 0.002 c Milk Subtotal 0.036 0.026 Milk: pooled sample Day 5–10 0.008 0.007 Liver 0.287 0.287 0.118 0.121 0.282 Kidney 0.167 0.167 0.012 0.013 0.163 Kidney fat 0.015 d 0.000 d d Abdominal fat f 0.018 0.018 0.002 0.001 0.020 Leg muscle 0.005 0.005 0.010 0.012 0.004 Back muscle f 0.004 0.004 0.010 0.002 0.003 Blood 0.015 0.024 0.010 0.023 c Bile 3.164 3.164 0.022 0.050 c Gut/Stomach 0.056 0.039 0.176 0.136 c Gut contents 0.762 0.654 2.080 0.772 c Stomach contents 0.220 0.279 1.770 3.182 c Urine in bladder 3.295 d 0.042 d c Organs / Tissues Subtotal 4.252 4.312 Cage wash - - 0.921 1.192 Total Recovery 93.917 95.442
a For liver, bile, kidney, fat and muscle samples, the values determined from pool samples are given and were converted to % dose values for the individual animals. b TRR calculated from pooled samples as the sum of ERR and residue after solvent extract (used for calculation of metabolite concentrations) c Not calculated d Not sampled e Faeces was homogenized with water prior LSC (approximately 4 to 8 parts water per part faeces) f Abdominal fat referred as subcutaneous fat in the in-life report, back muscle referred as flank muscle
Recovered radioactivity from goat matrices were characterized and the results are shown in Tables 3 (benzoyl-label) and 4 (butylphenyl-label).
In urine of the goats given benzoyl-label, the main component B-1 accounted for 1.92 mg/kg or 47.0% TRR. Metabolite M9210I021 was the second most abundant component (0.61 mg/kg or 15.0% TRR). Metabolites M9210I029, M9210I030 and AB-1 were less abundant and accounted for up to 8.9% TRR.
In urine of the goats dosed with butylphenyl-label, metabolite M9210I014 was the main component and accounted for 1.26 mg/kg or 20.7% TRR. Metabolites M9210I021 and M9210I040 were the second most abundant components and accounted for 0.644 mg/kg or 11.0% TRR and 0.612 mg/kg and 10.1% TRR, respectively. Other identified metabolites were M9210I019, M9210I023, M9210I032, M9210I029, M9210I033, M9210I030, A-12, A-2 and AB-1 (each below or equal to 0.316 mg/kg or 5.2% TRR).
The extracted radioactive residues (ERR) in pooled samples of faeces of the goat administered with benzoyl-label (Days 1-12) and butylphenyl-label (Days 1-10) amounted to 78.7% and 95.5% of the TRR, respectively. In the faeces acetonitrile extract of the benzoyl-label metabolite B-1 was the main component

184 Cyflumetofen
with 0.801 mg/kg or 63.9% TRR. The parent compound BAS 9210 I was also identified, although at significantly lower amounts, and accounted for 0.092 mg/kg or 7.4% TRR. In the faeces acetonitrile extract of the butylphenyl-label, the unchanged parent compound was the only component identified accounting for 0.588 mg/kg or 45.6% TRR.
The ERR in pooled samples of milk from the goats dosed with the benzoyl-label (Days 5-12) and butylphenyl-label (Days 5-10) amounted to 0.009 mg/kg or 51.0% TRR and 0.007 mg/kg or 93.5% TRR, respectively. In the acetonitrile extract of milk from the benzoyl-label dose, metabolite B-1 was the only component identified and accounted for 0.001 mg/kg or 4.5% TRR. In the solvent-extracted residues of milk from the butylphenyl-label dose, metabolite M9210I033 was the main component and accounted for 0.002 mg/kg or 30.0% TRR. The other identified metabolites, M9210I023, M9210I029 and M9210I030, were significantly less abundant and accounted for up to 7.8% of the TRR, less than 10% TRR.
In bile from the both experiments, the label-unspecific metabolites M9210I042, M9210I044 and M9210I043 were identified from 12.1% to 22.3% of the TRR. In bile from the benzoyl-label dose, B-1 was additionally identified accounting for 0.319 mg/kg or 22.4% TRR.
The ERR in pooled sample of liver from the benzoyl- and butylphenyl-label doses amounted to 0.276 mg/kg or 70.8% TRR and 0.182 mg/kg or 64.6% TRR. The residues after solvent extraction of liver (from benzoyl-label and butylphenyl-label) were further incubated with protease, whereby 14.0% and 17.4% of the TRR were released additionally. In the solvent extracted residues of liver from the benzoyl-label dose, metabolite B-1 was the main component accounting for 0.125 mg/kg or 32.0% of the TRR. M9210I042 accounted for 6.7% of the TRR. All components characterized in the ERR from the benzoyl-label dose by HPLC were below or equal to 3.3% TRR. Metabolite B-1 was also identified in the protease solubilizate (0.010 mg/kg or 2.5% TRR). In the solvent extracted residues of liver from the butylphenyl-label dose, M9210I042 accounted for 0.023 mg/kg or 8.3% TRR and M9210I043 for 0.014 mg/kg and 5.1% TRR. All components characterized in the ERR of the butylphenyl-label dose by HPLC were below or equal to 3.1% TRR. The characterized components in the protease solubilizate of the butylphenyl-label dose were each below or equal to 4.6% TRR.
The ERR in samples of kidney from the benzoyl- and butylphenyl-label doses amounted to 0.161 mg/kg or 85.1% TRR and 0.155 mg/kg or 95.5% TRR. The residue after solvent extraction of kidney (benzoyl-label) was further incubated with protease, whereby 9.4% of the TRR were released additionally. In the solvent extracted residues of kidney of the benzoyl-label dose, metabolite B-1 was the most abundant component with 0.102 mg/kg or 53.9% TRR. All components characterized in the ERR of the benzoyl-label dose by HPLC were below or equal to 5.3% TRR. In the acetonitrile extract of kidney of the butylphenyl-label dose, metabolite M9210I023 accounted for 0.017 mg/kg or 10.2% TRR. Other metabolites identified were M9210I032, M9210I033, M9210I030, M9210I014 and A-2, which were present at up to 6.7% of the TRR. All components characterized in the ERR of the butylphenyl-label by HPLC were below or equal to 8.0% TRR.
The ERR in samples of leg muscle from the benzoyl- and butylphenyl-label dose amounted to 0.008 mg/kg or 84.3% TRR and 0.004 mg/kg or 92.6% TRR. In samples of back muscle the ERR was 0.007 mg/kg or 78.4% and 0.003 mg/kg or 90.4%, respectively. In the acetonitrile extracts of leg muscle and back muscle of the benzoyl-label dose, metabolite B-1 was the main component accounting for 0.005 mg/kg or 50.5% TRR and 0.004 mg/kg or 46.5% TRR, respectively. Due to low residue levels, the muscle tissue extracts of the butylphenyl-label were not analysed by HPLC.
The ERR in samples of abdominal fat of the benzoyl- and butylphenyl-label dose amounted to 0.014 mg/kg or 93.2% TRR and 0.019 mg/kg or 96.3% TRR. In samples of kidney fat (benzoyl-label) the ERR was 0.014 mg/kg or 93.0%. In the acetonitrile extracts of abdominal and kidney fat of the benzoyl-label dose, metabolite B-1 was also the main component (0.006 mg/kg or 40.2% TRR and 0.006 mg/kg or 41.0% TRR), but additionally the parent compound was identified (0.003 mg/kg or 19.6% TRR and 0.003 mg/kg or 21.0% TRR). In the acetonitrile extract of abdominal fat of the butylphenyl-label dose, metabolite A-2 was the main component accounting for 0.008 mg/kg or 40.2% TRR.
The results of the above metabolism studies indicate that residue levels of Cyflumetofen and its metabolites were relatively low in edible tissues and milk except liver and kidney.
After repeated oral doses of benzoyl-label, metabolite B-1 was the predominant radioactive residue present in all of edible tissues tested and milk as well as excreta. It is the only metabolite present above 0.01 mg eq/kg and > 10% TRR in edible tissues or milk: in liver (0.125 mg eq/kg, 32.0% TRR) and kidney

Cyflumetofen 185
(0.102 mg eq/kg, 53.9% TRR). M9210I042 was found at 0.026 mg eq/kg but 6.7% TRR. Cyflumetofen was found only in fat, among edible tissues, at 0.003 mg eq/kg, around 20%TRR. There were no identified metabolites in edible tissues or milk.
After repeated oral dose of butylphenyl-label, only M9210I023 was identified above 0.01 mg eq/kg and > 10% TRR in kidney (0.017 mg eq/kg, 10.2% TRR). M9210I043 and M9210I042 were found in liver at 0.014 mg eq/kg (5.1% TRR) and 0.023 mg eq/kg (8.3% TRR) respectively. M9210I033 was present in kidney at 0.011 mg eq/kg but 6.7% TRR. There were some other minor metabolites identified in edible tissues and milk but all were < 0.01 mg eq/kg. Cyflumetofen was not found in any edible tissues or milk.
From the metabolism studies, the metabolic pathway of cyflumetofen in lactating goats is speculated as:
hydrolysis of the formic acid ester followed by hydrolytic cleavage of the trifluoromethylbenzoyl moiety resulting in metabolite B-1 (2-trifluoromethylbenzoic acid) and the labile metabolite M9210I014
decarboxylation of metabolite M9210I014 resulting in metabolite A-2
hydrolysis of the formic acid ester followed by decarboxylation yielding metabolite AB-1
hydrolytic cleavage of the trifluoromethylbenzoyl moiety of metabolite AB-1 also leads to metabolite A-2
glucuronidation of AB-1 to form M9210I042 and M9210I044
hydroxylation yields M9210I043.
Oxidation, decarboxylation and hydroxylation of the t-butyl side chain seem to occur. Loss of nitrile from A-2 or its further metabolites also occur. Some conjugation of the carboxyl group of metabolites with the amino acid glycine, yielding conjugated metabolites also may occur.

186
Cyf
lum
etof
en
Tabl
e 3
Extra
ctio
n of
radi
oact
ivity
in m
ilk, t
issu
es, a
nd fa
eces
from
goa
ts g
iven
radi
oact
ive
cyflu
met
ofen
TR
R
Ace
toni
trile
Ext
ract
a W
ater
ext
ract
a ER
R b
RR
R c
TRR
M
atrix
(m
easu
red)
(c
alcu
late
d)
m
g eq
/kg
mg
eq/k
g %
TR
R
mg
eq/k
g %
TR
R
mg
eq/k
g %
TR
R
mg
eq/k
g %
TR
R
mg
eq/k
g B
enzo
yl-la
bel
Milk
d 0.
019
0.00
9 51
.0
n.a.
n.
a.
0.00
9 51
.0
0.00
9 49
.0
0.01
8 Li
ver
0.40
4 0.
233
59.8
0.
045
11.4
0.
276
70.8
0.
114
29.2
0.
390
Kid
ney
0.19
1 0.
146
77.0
0.
016
8.5
0.16
1 85
.1
0.02
8 14
.9
0.19
0 A
bdom
inal
fat
0.01
4 0.
011
73.0
0.
003
19.5
0.
014
93.2
0.
001
6.8
0.01
5 K
idne
y fa
t 0.
014
0.01
1 74
.7
0.00
3 18
.3
0.01
4 93
.0
0.00
1 7.
0 0.
015
Leg
mus
cle
0.01
0 0.
007
74.1
0.
001
10.3
0.
008
84.3
0.
001
15.7
0.
010
Bac
k m
uscl
e 0.
010
0.00
7 72
.5
0.00
1 7.
7 0.
007
78.4
0.
002
21.6
0.
009
Faec
es e
1.35
7 0.
986
78.7
n.
a.
n.a.
0.
986
78.7
0.
266
21.3
1.
252
But
ylph
enyl
-labe
l M
ilk d
0.00
8 0.
007
92.7
n.
a.
n.a.
0.
007
93.5
<
0.00
1 6.
5 0.
007
Live
r 0.
287
0.15
6 55
.5
0.02
8 10
.0
0.18
2 64
.6
0.10
0 35
.4
0.28
2 K
idne
y 0.
167
0.13
2 81
.2
0.02
3 13
.9
0.15
5 95
.5
0.00
7 4.
5 0.
163
Leg
mus
cle
0.00
5 0.
004
85.9
<
0.00
1 6.
5 0.
004
92.6
<
0.00
1 7.
4 0.
004
Bac
k m
uscl
e 0.
004
0.00
3 84
.0
< 0.
001
11.6
0.
003
90.4
<
0.00
1 9.
6 0.
003
Abd
omin
al fa
t 0.
018
0.01
7 82
.9
0.00
2 11
.3
0.01
9 96
.3
0.00
1 3.
7 0.
020
Faec
es e
1.30
4 1.
205
93.4
0.
033
2.6
1.23
2 95
.5
0.05
8 4.
5 1.
290
a TR
R o
f poo
l sam
ples
b ER
R =
Ext
ract
able
Rad
ioac
tive
Res
idue
(cal
cula
ted
from
indi
vidu
al sa
mpl
es)
c RR
R =
Res
idua
l Rad
ioac
tive
Res
idue
(res
idue
afte
r sol
vent
ext
ract
ion)
d P
oole
d sa
mpl
es o
f milk
(Day
5-1
2 fo
r the
ben
zoyl
-labe
l or 5
–10
for t
he b
utyl
phen
yl-la
bel),
ext
ract
ed w
ith 3
× a
ceto
nitri
le
e Po
oled
faec
es sa
mpl
e (D
ay 1
–12
for t
he b
enzo
yl-la
bel a
nd 1
–10
for t
he b
utyl
phen
yl-la
bel).
Sam
ple
dilu
ted
with
wat
er.

C
yflu
met
ofen
18
7
Tabl
e 4(
1) C
hara
cter
izat
ion
of ra
dioa
ctiv
e re
sidu
es in
goa
t milk
, liv
er, k
idne
y, m
uscl
e, fa
t, ur
ine,
faec
es a
nd b
ile fr
om g
oats
dos
ed w
ith b
enzo
yl-la
bel c
yflu
met
ofen
Met
abol
ite/F
ract
ion
Milk
a Li
ver
Kid
ney
Mus
cle
b Fa
t c U
rine
d Fa
eces
a B
ile d
mg
eq/k
g %
TR
R
mg
eq/k
g %
TR
R
mg
eq/k
g %
TR
R
mg
eq/k
g %
TR
R
mg
eq/k
g %
TR
R
mg
eq/k
g %
TR
R
mg
eq/k
g %
TR
R
mg
eq/k
g %
TR
R
Pare
nt
0.00
3 0.
003
19.6
21
.0
0.09
2 7.
4
B-1
0.
001
4.5
0.12
5 32
.0
0.10
2 53
.9
0.00
5 0.
004
50.5
46
.5
0.00
6 0.
006
40.2
21
.0
1.91
8 47
.0
0.80
1 63
.9
0.31
9 22
.4
M92
10I0
43
0.20
0 14
.0
M92
10I0
29
0.36
4 8.
9
M
9210
I030
0.
142
3.5
M92
10I0
21
0.61
1 15
.0
M92
10I0
42
0.02
6 6.
7
0.
194
13.6
M
9210
I044
0.
172
12.1
A
B-1
0.
047
1.2
Tota
l Ide
ntifi
ed (E
RR
) 0.
001
4.5
0.15
1 38
.7
0.10
2 53
.9
0.00
5 0.
004
50.5
46
.5
0.00
9 0.
009
59.8
62
.0
3.08
2 75
.5
0.89
3 71
.3
0.88
5 62
.1
Tota
l Cha
ract
eriz
ed b
y H
PLC
(ER
R)
0.00
4 19
.6
0.07
0 17
.9
0.02
4 12
.6
0.00
2 0.
002
17.2
19
.8
0.00
1 0.
002
10.0
10
.8
1.00
2 24
.5
0.09
3 7.
4 0.
541
37.9
RR
R a
fter s
olve
nt
extra
ctio
n 0.
009
49.0
0.
114
29.2
0.
028
14.9
0.
001
0.00
2 15
.7
21.6
0.
001
0.00
1 6.
8 7.
0 e
e 0.
266
21.3
e
e
Tota
l Cha
ract
eriz
ed
0.00
7 41
.2
0.16
3 41
.7
0.06
3 33
.2
0.00
3 0.
002
28.4
27
.5
0.00
5 0.
005
31.7
31
.0
1.00
2 24
.5
0.09
3 7.
4 0.
541
37.9
Tota
l Ide
ntifi
ed a
nd/o
r C
hara
cter
ized
0.
008
45.7
0.
313
80.4
0.
165
87.1
0.
008
0.00
7 78
.9
74.0
0.
013
0.01
4 91
.5
93.0
4.
084
100.
0 0.
986
78.7
1.
426
100.
0
Gra
nd to
tal [
%]
0.01
7 94
.7
0.36
1 92
.6
0.17
3 91
.4
0.00
9 0.
009
94.6
95
.6
0.01
4 0.
015
98.3
10
0.0
4.08
4 10
0.0
1.25
2 10
0.0
1.42
6 10
0.0
a Ana
lysi
s afte
r ext
ract
ion
with
ace
toni
trile
. b In
divi
dual
val
ues f
or le
g (to
p) a
nd b
ack
(bot
tom
) mus
cle
are
repo
rted.
c In
divi
dual
val
ues f
or a
bdom
inal
(top
) and
kid
ney
fat (
botto
m) a
re re
porte
d.
d Ana
lyse
d af
ter d
irect
inje
ctio
n.
e Not
app
lied.

188
Cyf
lum
etof
en
Tabl
e 4(
2) C
hara
cter
izat
ion
of ra
dioa
ctiv
e re
sidu
es in
goa
t milk
, liv
er, k
idne
y, m
uscl
e, fa
t, ur
ine,
faec
es a
nd b
ile fr
om g
oats
dos
ed w
ith b
utyl
phen
yl-la
bel c
yflu
met
ofen
Met
abol
ite/F
ract
ion
Milk
a Li
ver
Kid
ney
Fat b
Urin
e c
Faec
es
Bile
c m
g eq
/kg
% T
RR
m
g eq
/kg
% T
RR
m
g eq
/kg
% T
RR
m
g eq
/kg
% T
RR
m
g eq
/kg
% T
RR
m
g eq
/kg
% T
RR
m
g eq
/kg
% T
RR
Pa
rent
0.
588
45.6
M
9210
I040
0.
612
10.1
M
9210
I019
0.
214
3.5
M92
10I0
23
0.00
05
6.7
0.01
7 10
.2
0.31
2 5.
3
M
9210
I032
0.
005
3.2
0.16
5 2.
7
M
9210
I043
0.
014
5.1
0.70
5 22
.3
M92
10I0
29
0.00
05
6.8
0.31
6 5.
2
M
9210
I033
0.
0021
30
.0
0.01
1 6.
7
0.
306
5.0
M92
10I0
30
0.00
06
7.8
0.00
7 4.
1
0.
137
2.3
M92
10I0
21
0.66
4 11
.0
M92
10I0
42
0.02
3 8.
3
0.
592
18.7
A
-12
0.22
1 3.
7
M
9210
I014
0.
007
4.2
1.25
7 20
.7
M92
10I0
44
0.46
2 14
.6
A-2
0.
009
5.3
0.00
8 40
.2
0.08
2 1.
3
A
B-1
0.
027
0.4
Tota
l Ide
ntifi
ed (E
RR
) 0.
0036
51
.3
0.03
8 13
.4
0.05
5 33
.7
0.00
8 40
.2
4.32
0 71
.1
0.58
8 45
.6
1.75
9 55
.6
Tota
l Cha
ract
eriz
ed b
y H
PLC
(ER
R)
0.00
26
36.3
0.
103
36.8
0.
068
41.5
0.
006
28.6
1.
759
28.9
0.
605
46.9
1.
406
44.4
RR
R a
fter s
olve
nt
extra
ctio
n 0.
0005
6.
5 0.
100
35.4
0.
007
4.5
0.00
1 3.
7 d
d 0.
058
4.5
d d
Tota
l Cha
ract
eriz
ed
0.00
29
40.6
0.
176
62.5
0.
093
56.9
0.
010
48.0
1.
759
28.9
0.
638
49.4
1.
406
44.4
To
tal I
dent
ified
and
/or
Cha
ract
eriz
ed
0.00
65
91.8
0.
213
75.8
0.
147
90.6
0.
018
88.2
6.
079
100.
0 1.
226
95.0
3.
164
100.
0
Gra
nd to
tal [
%]
0.00
70
98.4
0.
254
90.1
0.
155
95.1
0.
018
91.9
6.
079
100.
0 1.
283
99.5
3.
164
100.
0
a Ana
lysi
s afte
r ext
ract
ion
with
ace
toni
trile
b A
bdom
inal
fat s
ampl
e c H
LC a
naly
sed
by d
irect
inje
ctio
n d N
ot a
pplie
d

Cyflumetofen 189
FF FO
N
GlcAOH
Figure 1 Proposed metabolic pathway of cyflumetofen in goats
FF F
O
O
OO
N

190 Cyflumetofen
Plant metabolism The Meeting received information on the fate of cyflumetofen in Satsuma mandarin, apple and eggplant.
Satsuma mandarin (Hayashi, 2004a)
Two individual Satsuma mandarin trees were sprayed with formulated butylphenyl-label or benzoyl-label at an equivalent application rate of 0.600 kg ai/ha. The concentration of the application solutions was 16 mg cyflumetofen in 0.080 L blank formulation. The concentration of the blank formulation was 159 mg formulation in 0.199 L of water. The amount of spray solution per tree was 0.0369 L. The growth stage of the Satsuma mandarin fruit was just before fruit maturation. Satsuma mandarin trees, each tree separately, were kept in climate controlled greenhouses. The trees were irrigated and fertilizer (N-P-K-Mg) was added as needed. No other pesticides were used. The achieved application rate was 89.2 to 92.9% of the target.
For both treatments with the two radio-labelled cyflumetofen, fruit samples were taken at 1, 7 and 30 DAT and leaf samples at 1, 7 and 14 DAT. Four fruits were sampled at random per sampling point and pooled per two fruits. Twenty leaves were randomly sampled per sampling points and pooled per 10 leaves. Untreated fruit and leaf samples were taken at the final harvest point. Fruit and leaf samples were immediately surface rinsed with acetonitrile.
Total radioactivity in the rinse was determined by LSC. The surface rinse was concentrated by evaporation to dryness, and then redissolved prior to analysis by HPLC. The rinsed fruit was separated into peel and pulp fractions. Surface washed leaf, peel and pulp samples were homogenized with dry ice. Homogenates were extracted twice with acetonitrile:water (8:2 v/v). The extracts, after filtration, were combined and radioactivity was determined by LSC. Extracts were further concentrated (volume reduction by rotary-evaporation) prior to analysis by HPLC. Solid residues were dried and radioactivity was determined by combustion/LSC. Total radioactivity was determined as the sum of surface rinse, extracts and solid residues.
Identification was achieved by HPLC and TLC, and comparison with reference standards. Confirmation was also achieved by LC-MS/MS analysis of isolated fractions. HPLC recoveries were determined and were always > 86%. The procedural recovery of the extraction method was 96% for cyflumetofen and 100.4% for total radioactivity, demonstrating the applicability of the employed methods. Storage stability was demonstrated over the experimental period.
The results for distribution and identification of radioactivity in Satsuma mandarin fruit and leaves are presented in the following tables.
Total radioactive residues (TRR) in fruit were 0.58–0.62 mg eq/kg on 1 DAT and 0.57–0.57 mg eq/kg on 30 DAT. Distribution of radioactivity for butylphenyl- or benzoyl-label applications were similar. The majority of the radioactivity was found in the surface rinse: 95–96% of the TRR on 1 DAT and 88–89% of the TRR on 30 DAT. In peel, 4.3–4.8% of the TRR was recovered on 1 DAT, increasing to 10.8–11.5% of the TRR on 30 DAT (9.1–10.1%of the TRR extracted from peel on 30 DAT). Radioactive residues in flesh were very low (≤ 0.6% of the TRR).
TRR in leaves were 33–35 mg eq/kg on 1 DAT and 28–38 mg eq/kg on 14 DAT. Distribution of radioactivity for butylphenyl- or benzoyl-label applications was similar. The majority of the radioactivity was found in the surface rinse: 95–97% of the TRR on 1 DAT and 87–94% of the TRR on 30 DAT. Leaf residues were 3.4–4.9% of the TRR on 1 DAT, increasing to 5.6–12.9% of the TRR on 30 DAT (4.9–12.4% of the TRR extracted from leaves on 14 DAT).
Cyflumetofen was by far the predominant identified fraction in fruit (sum of rinse and peel extracts): 88–90% of the TRR on 1 DAT decreasing to 44–54% of the TRR on 30 DAT. Other identified metabolites were AB-6, AB-7, A-12 and B-1 (all ≤ 1.6% TRR on 1 DAT and maximum 8.6, 8.5, 4.4 and 11.2% of the TRR, respectively on 30 DAT). It is gradually metabolized over time to produce metabolites B-1, AB-6 and AB-7. However, even 30 DAT, the parent accounted for about 50% TRR.

Cyflumetofen 191
Cyflumetofen was also the predominant identified fraction in leaves (sum of rinse and extracts): 89–90% of the TRR on 1 DAT decreasing to 73-81% of the TRR on 30 DAT. Other identified metabolites were AB-6, AB-7, A-12 and B-1 (all ≤ 4.8% of the TRR on 1 DAT and maximum 4.2, 1.5, 3.6 and 9.1% of the TRR, respectively on 30 DAT).
Table 5 Distribution of radioactivity in Satsuma mandarin fruit and leaf after treatment with radio-labelled cyflumetofen
Sample Day-1 Day-7 Day-30 (fruit) /
Day-14 (leaves) mg eq./kg % TRR mg eq./kg % TRR mg eq./kg % TRR
Butylphenyl-label
Fruit
Surface rinse 0.5539 95.62 0.4173 93.00 0.5067 88.77
Peel residues 0.0239 4.32 0.0307 6.85 0.0622 10.86
Extracted 0.0207 3.72 0.0256 5.70 0.0523 9.12
Unextracted 0.0032 0.60 0.0051 1.15 0.0099 1.73
Flesh residues 0.0004 0.06 0.0007 0.15 0.0020 0.37
Extracted 0.0004 0.05 0.0006 0.13 0.0018 0.33
Unextracted 0.0000 0.01 0.0001 0.02 0.002 0.04
Total radioactive residues 0.5783 100.00 0.4487 1000.00 0.5709 100.00
Leaves
Surface rinse 34.8679 96.60 29.5027 93.54 28.3494 94.44
Leaf residues 1.2257 3.40 2.0377 6.46 1.6639 5.56
Extracted 1.1090 3.08 1.8256 5.79 1.4737 4.92
Unextracted 0.1167 0.32 0.2121 0.67 0.1901 0.64
Total radioactive residues 36.0936 100.00 31.5404 100.00 30.0132 100.00
Sample Day-1 Day-7 Day-30 (fruit) /
Day-14 (leaves) mg eq./kg % TRR mg eq./kg % TRR mg eq./kg % TRR
Benzoyl-label
Fruit
Surface rinse 0.5868 95.02 0.3826 91.40 0.5041 87.87
Peel residues 0.0295 4.84 0.0349 8.31 0.0662 11.53
Extracted 0.0268 4.32 0.0316 7.54 0.0581 10.11
Unextracted 0.0027 0.52 0.0032 0.77 0.0081 1.42
Flesh residues 0.0010 0.14 0.0012 0.29 0.0034 0.60
Extracted 0.0009 0.14 0.0011 0.27 0.0033 0.58
Unextracted 0.0000 0.00 0.0001 0.01 0.0001 0.02
Total radioactive residues 0.6173 100.00 0.4187 100.00 0.5737 100.00
Leaves
Surface rinse 33.3370 95.09 30.7705 91.23 37.6579 87.14
Leaf residues 1.7188 4.91 2.9824 8.77 5.4724 12.86
Extracted 1.6259 4.65 2.8039 8.23 5.2696 12.37
Unextracted 0.0929 0.27 0.1785 0.53 0.2028 0.49
Total radioactive residues 35.0558 100.00 33.7529 100.00 43.1303 100.00

192 Cyflumetofen
Table 6 Identification of radioactive residues in Satsuma mandarin surface rinse and peel extracts
Identified compound Surface rinse Peel extract Total mg eq./kg % TRR mg eq./kg % TRR mg eq./kg % TRR
Butylphenyl-label
Day 1 A-12 AB-6 AB-7 Parent
0.0040 0.71 0.0062 1.17 0.0102 1.88 0.0053 0.92 0.0008 0.16 0.0061 1.07 0.0034 0.59 0.0005 0.09 0.0039 0.69 0.5174 89.25 0.0037 0.58 0.5211 89.83
Unidentified peaks total 0.0238 4.15 0.0095 1.72 0.0333 5.88
Total 0.5539 95.62 0.0207 3.72 0.5746 99.35
Day 7 A-12 AB-6 AB-7 Parent
0.0047 1.04 0.0076 1.69 0.0122 2.73 0.0084 1.88 0.0010 0.23 0.0095 2.11 0.0037 1.50 0.0006 0.13 0.0073 1.63 0.3674 81.88 0.0033 0.74 0.3708 82.62
Unidentified peaks total 0.0331 6.70 0.0131 2.91 0.0431 9.61
Total 0.4173 93.00 0.0256 5.70 0.4429 98.70
Day 30 A-12 AB-6 AB-7 Parent
0.0132 2.32 0.0119 2.04 0.0250 4.36 0.0392 6.95 0.0032 0.57 0.0424 7.51 0.0389 6.93 0.0015 0.26 0.0404 7.19 0.3064 53.26 0.0043 0.77 0.3107 54.03
Unidentified peaks total 0.109 19.31 0.0314 5.48 0.1405 24.81
Total 0.5067 88.77 0.0523 9.12 0.5590 97.90
Benzoyl-label
Day 1 B-1 AB-6 AB-7 Parent
0.0097 1.55 0.0185 3.07 0.0282 4.66 0.0055 0.89 0.0006 0.10 0.0061 0.99 0.0026 0.45 0.0002 0.03 0.0028 0.48 0.5434 87.94 0.0032 0.46 0.5466 88.40
Unidentified peaks total 0.0256 4.19 0.0043 0.66 0.0299 4.81
Total 0.5868 95.02 0.0268 4.32 0.6136 99.34
Day 7 B-1 AB-6 AB-7 Parent
0.0070 1.67 0.0206 4.91 0.0276 6.58 0.0093 2.22 0.0010 0.23 0.0103 2.45 0.0077 1.84 0.0005 0.12 0.0082 1.97 0.3282 78.40 0.0020 0.49 0.3303 78.89
Unidentified peaks total 0.0304 7.27 0.0075 1.79 0.0378 9.05
Total 0.3826 91.40 0.0316 7.54 0.4142 98.94
Day 30 B-1 AB-6 AB-7 Parent
0.0248 4.32 0.0394 6.86 0.0642 11.17 0.0474 8.26 0.0020 0.35 0.0494 8.61 0.0481 8.37 0.0007 0.12 0.0488 8.49 0.2491 43.48 0.0021 0.37 0.2512 43.85
Unidentified peaks total 0.1347 23.44 0.0139 2.41 0.1486 25.87
Total 0.5041 87.87 0.0581 10.11 0.5622 97.99 Data are the mean of duplicate experiments.
Apple (Dohn, 2004a)
One apple tree grown within a commercial apple orchard in California, USA, was sprayed with formulated butylphenyl- or benzoyl-label at an equivalent application rate of 0.600 kg ai/ha.

Cyflumetofen 193
Application took place in October 2002. The concentration of the application solutions was approximately 225 (butylphenyl-label) and 211 mg/L (benzoyl-label) cyflumetofen in blank formulation. The achieved application rate was 115 to 120% of the target. Storage stability was demonstrated over the experimental period. At the time of application, fruits were near maturity. The plots were (drip) irrigated and fertilizer (N-P-K and Ca) was added as needed. Other pesticides were used prior to application of cyflumetofen, which does not interfere with cyflumetofen. Fruit samples were taken at 1, 7 and 30 DAT (for both labels and untreated plot). Leaf samples were taken at 7 and 30 DAT (also for both labels and untreated plot).
Fruit and leaf samples were immediately surface rinsed two times with acetonitrile. Total radioactivity in the rinse was determined by LSC. The surface rinse was concentrated prior to analysis by HPLC/TLC. The rinsed fruit and leaves were homogenized with dry ice and liquid nitrogen. Homogenates were extracted twice with acetonitrile and twice with acetonitrile:water (1:1 v/v). The extracts after centrifugation were combined and radioactivity was determined by LSC. Extracts were further concentrated prior to analysis by HPLC/TLC. Solid residues were dried and radioactivity was determined by combustion/LSC. Total radioactivity was determined as the sum of surface rinse, extracts and solid residues.
Identification was achieved by HPLC and TLC, and comparison with reference standards. Some extracts were further characterized by reversed phase solid phase extraction and LSC/HPLC analysis of eluates.
Total radioactive residues (TRR) in apple fruit were 0.100–0.113 mg eq/kg on 1 DAT and 0.079–0.057 mg eq/kg on 30 DAT. Results for butylphenyl- and benzoyl-label were similar. For the butylphenyl- and benzoyl-label, the majority of the radioactivity was found in the surface rinse: 95 and 96% of the TRR, respectively on 1 DAT and 71 and 67% of the TRR, respectively on 30 DAT. Extracted radioactivity was not determined on 1 DAT due to low levels of radioactivity, and was 15 and 9.6% of the TRR on 7 DAT for butylphenyl- and benzoyl-label respectively and 22 and 28% of the TRR on 30 DAT, respectively. Unextracted radioactivity was low: 5.3–7.6% of the TRR on 30 DAT.
TRR in apple leaves were 6.1–7.3 mg eq/kg on 7 DAT and 4.9–9.5 mg eq/kg on 30 DAT. Surface rinse removed less radioactivity from leaves for the benzoyl-label compared to the butylphenyl-label. For the butylphenyl- and benzoyl-label, the majority of the radioactivity was found in the surface rinse: 91 and 87% of the TRR, respectively on 7 DAT and 82 and 72% of the TRR, respectively on 30 DAT. Extracted radioactivity was 13 and 21% of the TRR on 30 DAT for butylphenyl- and benzoyl-label respectively. Unextracted radioactivity was low: 4.9–6.7% of the TRR on 30 DAT.
Cyflumetofen was the predominant identified compound in apple fruit (sum of rinse and extracts): 89–95% of the TRR on 1 DAT decreasing to 53–65% of the TRR on 30 DAT. Other identified metabolites were AB-6, AB-7 and B-1 (all ≤ 5% of the TRR on 1 DAT and maximum 5.3, 6.3 and 1.8% of the TRR, respectively on 30 DAT).
Cyflumetofen was also the predominant identified compound in apple leaves (sum of rinse and extracts): 77–85% of the TRR on 7 DAT and 44–60% of the TRR on 30 DAT. Other identified metabolites were AB-6, AB-7 and B-1 at maximum 8.6, 5.6 and 4.8% of the TRR, respectively on 30 DAT.
The results for apple fruit and leaves (distribution and identification of radioactivity for both labels) are presented in the following tables.

194 Cyflumetofen
Table 7 Distribution of radioactivity in apple fruit and leaf after treatment with radio-labelled cyflumetofen
DAT Surface rinse Extracted Unextracted Total % TRR mg eq./kg % TRR mg eq./kg % TRR mg eq./kg % TRR mg eq./kg
Butylphenyl-label
Apple fruit
Day 1 95.0 0.095 Np np 5.0 0.005 100 0.10
Day 7 82.1 0.064 15.4 0.012 2.6 0.002 100 0.078
Day 30 70.9 0.056 21.5 0.017 7.6 0.006 100 0.079
Leaves
Day 7 90.8 5.535 7.9 0.479 1.4 0.085 100 6.099
Day 30 82.0 4.046 13.1 0.644 4.9 0.242 100 4.932
Benzoyl-label
Apple fruit
Day 1 95.6 0.108 Np np 4.4 0.005 100 0.113
Day 7 89.2 0.149 9.6 0.016 1.2 0.002 100 0.167
Day 30 66.7 0.038 28.1 0.016 5.3 0.003 100 0.057
Leaves
Day 7 86.8 6.306 11.6 0.843 1.6 0.117 100 7.266
Day 30 72.0 6.884 21.3 2.039 6.7 0.641 100 9.564
Table 8 Identification of radioactive residues in apple fruit surface rinse and extracts
Identified compound Surface rinse Extract Total mg eq./kg % TRR mg eq./kg % TRR mg eq./kg % TRR
Butylphenyl-label Day 1 AB-6 0.005 5.0
Not extracted due to low radioactive residues: < 0.01 mg eq/kg
0.005 5.0 AB-7 Parent 0.061 61.0 0.061 61.0 Breakdown of parent 0.028 28.0 0.028 28.0 14C in Extract (mg eq/kg) 0.095 0.095 Day 7 AB-6 0.001 1.3 0.001 1.3 AB-7 Parent 0.059 75.6 0.002 2.6 0.061 78.2 Minor 0.004 5.1 0.003 3.8 0.007 8.9 Unknown 0.006 7.7 0.006 7.7 14C in Extract (mg eq/kg) 0.064 0.012 0.076 Day 30 AB-6 0.003 3.8 0.001 1.3 0.004 5.1 AB-7 0.002 2.5 0.003 3.8 0.005 6.3 Parent 0.038 48.1 0.004 5.1 0.042 53.2 Minor 0.013 16.5 0.009 11.4 0.022 27.9 14C in Extract (mg eq/kg) 0.056 0.016 0.072 Benzoyl-label Day 1 AB-6
Not extracted due to low radioactive residues: < 0.01 mg eq/kg
AB-7 Parent 0.066 58.4 0.066 58.4 Breakdown of parent 0.041 36.3 0.041 36.3 14C in Extract (mg eq/kg) 0.108 0.108

Cyflumetofen 195
Identified compound Surface rinse Extract Total mg eq./kg % TRR mg eq./kg % TRR mg eq./kg % TRR
Day 7 B-1 0.002 1.2 0.002 1.2 AB-6 AB-7 0.003 1.8 0.006 3.6 0.009 5.4 Parent 0.137 82.0 0.003 1.8 0.14 83.8 Minor 0.006 3.6 0.006 3.6 0.012 7.2 14C in Extract (mg eq/kg) 0.149 0.016 0.165 Day 30 B-1 0.001 1.8 0.001 1.8 AB-6 0.001 1.8 0.002 3.5 0.003 5.3 AB-7 0.001 1.8 0.002 3.5 0.003 5.3 Parent 0.029 50.9 0.008 14.0 0.037 64.9
Minor 0.001 1.8 0.003 5.3 0.004 7.1 Unknown 0.005 8.8 0.005 8.8 14C in Extract (mg eq/kg) 0.038 0.016 0.054
“Minor” refers to 14C peaks in the chromatogram with a concentration < 0.005 mg eq/kg in the extract. This refers to a total of all minor components.
Table 9 Identification of radioactive residues in apple leaf surface rinse and extracts
Identified compound Surface rinse Extract Total mg eq./kg % TRR mg eq./kg % TRR mg eq./kg % TRR
Butylphenyl-label Day 7 AB-6 0.133 2.2 0.031 0.5 0.164 2.7 AB-7 0.188 3.1 0.032 0.5 0.22 3.6 Parent 4.904 80.4 0.272 4.5 5.176 84.9 Minor 0.310 5.1 0.144 2.4 0.454 7.5
Unknown 14C in Extract (mg eq/kg) 5.535 0.479 6.014 Day 30 AB-6 0.267 5.4 0.067 1.4 0.334 6.8 AB-7 0.210 4.3 0.028 0.6 0.238 4.9 Parent 2.881 58.4 0.086 1.7 2.967 60.1 Minor 0.688 13.9 0.688 13.9 14C in Extract (mg eq/kg) 4.046 0.644 4.69 Benzoyl-label Day 7 B-1 0.120 1.7 0.140 1.9 0.26 3.6 AB-6 0.290 4.0 0.050 0.7 0.34 4.7 AB-7 0.265 3.6 0.044 0.6 0.309 4.2 Parent 5.278 72.6 0.333 4.6 5.611 77.2 Minor 0.353 4.9 0.353 4.9 14C in Extract (mg eq/kg) 6.306 0.843 7.149 Day 30 B-1 0.248 2.6 0.208 2.2 0.456 4.8 AB-6 0.688 7.2 0.139 1.5 0.827 8.7 AB-7 0.454 4.7 0.077 0.8 0.531 5.5 Parent 3.979 41.6 0.208 2.2 4.187 43.8
Minor 0.317 3.3 0.812 8.5 1.129 11.8
Unknown 1.198 (4 peaks) 12.5 0.595
(2 peaks) 6.2 1.793 18.7 14C in Extract (mg eq/kg) 6.884 2.039 8.923
“Minor” refers to 14C peaks in the chromatogram with a concentration < 0.200 mg eq/kg in the extract. This refers to a

196 Cyflumetofen
total of all minor components.
Eggplant (Dohn, 2004b)
Eggplants grown on two plots (1.1–1.5 m2) located in California and containing six to eight eggplants were sprayed with formulated butylphenyl- or benzoyl-label cyflumetofen at an equivalent application rate of 0.600 kg ai/ha. Application took place on August 2002. The concentration of the application solutions was approximately 140 (butylphenyl-label) and 220 mg/L (benzoyl-label) cyflumetofen in blank formulation. The achieved application rate was 98 to 114% of the target. Storage stability was demonstrated over the experimental period. The growth stage of the eggplant fruit was from just pollinated to .mature. The eggplants were grown outdoors. The plots were (drip) irrigated and fertilizer (N-P-K-Ca-S) was added as needed. Other pesticides were used which do not interfere with cyflumetofen. Fruit samples were taken at 1, 7 and 14 DAT (for both labels and untreated plot). Leaf samples were taken at 14 DAT (also for both labels and untreated plot).
Fruit and leaf samples were immediately surface rinsed two times with acetonitrile. Total radioactivity in the rinse was determined by LSC. The surface rinse was concentrated, if necessary, prior to analysis by HPLC. The rinsed fruit and leaves were homogenized with dry ice. Homogenates were extracted twice with acetonitrile and twice with acetonitrile:water (1:1 v/v). The extracts, after centrifugation, were combined and radioactivity was determined by LSC. Extracts were further concentrated, if necessary by volume reduction by rotary-evaporation, prior to analysis by HPLC. Solid residues were dried and radioactivity was determined by combustion/LSC. Total radioactivity was determined as the sum of surface rinse, extracts and solid residues.
Identification was achieved by HPLC and 2D-TLC, and comparison with reference standards. Some degradates (U4) were identified by LC-MS/MS analysis of isolated fractions or were subjected to acid hydrolysis (U1 and U2) with 1 N HCl at 80 °C to release acid labile conjugates.
Total radioactive residues (TRR) in eggplant fruit were 0.323–0.488 mg eq/kg on 1 DAT and 0.315–0.413 mg eq/kg on 14 DAT. Surface rinse removed less radioactivity from fruit for the benzoyl-label compared to the butylphenyl-label. For the butylphenyl- and benzoyl-label, the majority of the radioactivity was found in the surface rinse: 92 and 86% of the RR, respectively on 1 DAT and 81 and 56% of the TRR, respectively on 14 DAT. Extracted radioactivity was 7.1 and 13% TRR on 1 DAT for butylphenyl- and benzoyl-label respectively and 15 and 41% TRR on 14 DAT, respectively. Unextracted radioactivity was low: 2.7–4.1% of the TRR on 14 DAT.
TRR in eggplant leaves were 17–23 mg eq/kg on 14 DAT. Surface rinse removed less radioactivity from leaves for the benzoyl-label compared to the butylphenyl-label. For the butylphenyl- and benzoyl-label, the majority of the radioactivity was found in the surface rinse: 83 and 69% of the TRR, respectively on 14 DAT. Extracted radioactivity was 14 and 27% of the TRR on 14 DAT for butylphenyl- and benzoyl-label respectively. Unextracted radioactivity was low: 2.6–4.7% of the TRR on 14 DAT.
Cyflumetofen was the predominant identified compound in eggplant fruit (sum of rinse and extracts): 91–95% of the TRR on 1 DAT decreasing to 42–62% of the TRR on 14 DAT. Other identified metabolites were AB-6, AB-7, B-1, U4 and U1 and U2 (acid labile conjugates of B-1) (all ≤ 2.5% TRR on 1 DAT and maximum 3.4, 3.6, 14.8, 1.2, 16.2 and 6.3% of the TRR, respectively on 14 DAT).
Cyflumetofen was also the predominant identified compound in eggplant leaves (sum of rinse and extracts): 47–58% of the TRR on 14 DAT. Other identified metabolites were AB-6, AB-7, B-1, U4 (structure proposed) and U1 (conjugate of B-1) and U2 (conjugate of B-1) at 8.1, 5.7, 4.6, 4.3, 4.1 and 1.4% of the TRR, respectively on 14 DAT).
The results for eggplant fruit and leaves (distribution and identification of radioactivity for both labels) are presented in the following tables.

Cyflumetofen 197
Table 10 Distribution of radioactivity in eggplant fruit and leaf after treatment with radio-labelled cyflumetofen
DAT Surface Rinse Extracted Unextracted Total % TRR mg eq./kg % TRR mg eq./kg % TRR mg eq./kg % TRR mg eq./kg
Butylphenyl-label
Eggplant fruit
Day 1 92.0 0.297 7.1 0.023 0.9 0.003 100 0.323
Day 7 86.1 0.323 11.5 0.043 2.4 0.009 100 0.375
Day 14 81.3 0.256 14.6 0.046 4.1 0.013 100 0.315
Leaves
Day 14 83.4 19.144 14.1 3.232 2.6 0.592 100 22.968
Benzoyl-label
Eggplant fruit
Day 1 86.5 0.422 12.7 0.062 0.8 0.004 100 0.488
Day 7 79.2 0.442 19.4 0.108 1.4 0.008 100 0.558
Day 14 56.4 0.233 40.9 0.169 2.7 0.011 100 0.413
Leaves
Day 14 68.7 12.001 26.6 4.644 4.7 0.818 100 17.463
Table 11 Identification of radioactive residues in eggplant fruit surface rinse and extracts
Identified compound Surface rinse Extract Total mg eq./kg % TRR mg eq./kg % TRR mg eq./kg % TRR
Butylphenyl-label Day 1 Parent 0.294 91.0 0.013 4.0 0.307 95 Minor 0.003 0.9 0.010 3.1 0.013 4 14C in Extract (mg eq/kg) 0.297 0.023 Day 7 AB-6 0.033 8.8 0.033 8.8 AB-7 0.018 4.8 0.018 4.8 Parent 0.240 64.0 0.011 2.9 0.251 66.9 U4(tentatively identified) 0.022 5.9 0.022 5.9
Minor 0.010 2.7 0.013 3.5 0.023 6.2
Unknown 0.019 (3 peaks) 5.1 0.019 5.1
14C in Extract (mg eq/kg) 0.323 0.043 Day 14 AB-6 0.016 5.1 0.016 5.1 AB-7 0.016 5.1 0.016 5.1 Parent 0.188 59.7 0.008 2.5 0.196 62.2 U4(tentatively identified) 0.011 3.5 0.011 3.5
Minor 0.025 7.9 0.025 7.9
Unknown 0.019 (2 peaks) 6.0 0.016 6.0
14C in Extract (mg eq/kg) 0.256 0.046
Benzoyl-label Day 1 B-1 0.012 2.5 0.012 2.5 Parent 0.408 83.6 0.037 7.6 0.445 91.2 Minor 0.014 2.9 0.008 1.6 0.022 4.5
Unknown 0.005 1.0 0.005 1.0

198 Cyflumetofen
Identified compound Surface rinse Extract Total mg eq./kg % TRR mg eq./kg % TRR mg eq./kg % TRR
14C in Extract (mg eq/kg) 0.422 0.062 Day 7 B-1 0.011 2.0 0.048 8.6 0.059 10.6 AB-6 0.017 3.0 0.017 3 AB-7 0.016 2.9 0.016 2.9 Parent 0.387 69.4 0.007 1.3 0.394 70.7 U1 (conjugate of B-1) 0.034 6.1 0.034 6.1 U2 (conjugate of B-1) 0.011 2.0 0.011 2 Minor 0.007 1.3 0.007 1.3 Unknown 0.005 0.9 0.005 0.9 14C in Extract (mg eq/kg) 0.442 0.108 Day 14 B-1 0.061 14.8 0.061 14.8 AB-6 0.014 3.4 0.014 3.4 AB-7 0.015 3.6 0.015 3.6 Parent 0.173 41.9 0.002 0.5 0.175 42.4
U4(tentatively identified) 0.005 1.2 0.005 1.2
U2 (conjugate of B-1) 0.026 6.3 0.026 6.3
U1 (conjugate of B-1) 0.067 16.2 0.067 16.2
Minor 0.020 4.8 0.014 3.4 0.034 8.2
Unknown 0.005 1.2 0.061 14.8 14C in Extract (mg eq/kg) 0.233 0.169
“Minor” refers to 14C peaks in the chromatogram with a concentration < 0.005 mg eq/kg in the extract. This refers to a total of all minor components.
Table 12 Identification of radioactive residues in eggplant leaf surface rinse and extracts
Identified compound Surface rinse Extract Total mg eq./kg % TRR mg eq./kg % TRR mg eq./kg % TRR
Butylphenyl-label Day 14 AB-6 2.068 9.0 0.278 1.2 2.346 10.2 AB-7 1.455 6.3 0.110 0.5 1.565 6.8 Parent 12.061 52.5 1.173 5.1 13.234 57.6
U4(tentatively identified) 0.861 3.7 0.861 3.7
U3 0.823 3.6 0.823 3.6
Minor 0.249 1.1 0.931 4.1 1.18 5.2
Unknown 1.436 (3 peaks) 6.2 0.740 3.2 2.176 9.4
14C in Extract (mg eq/kg) 19.144 3.232
Benzoyl-label Day 14 B-1 0.240 1.4 0.571 3.3 0.811 4.7 AB-6 0.996 5.7 0.418 2.4 1.414 8.1 AB-7 0.876 5.0 0.121 0.7 0.997 5.7 Parent 6.937 39.7 1.333 7.6 8.27 47.3
U4(tentatively identified) 0.480 2.7 0.279 1.6 0.759 4.3
U3 0.504 2.9 0.504 2.9
U2 (conjugate of B-1) 0.251 1.4 0.251 1.4
U1 (conjugate of B-1) 0.715 4.1 0.715 4.1
Minor 0.516 3.0 0.516 3

Cyflumetofen 199
Identified compound Surface rinse Extract Total mg eq./kg % TRR mg eq./kg % TRR mg eq./kg % TRR
Unknown 1.452 (4 peaks) 8.3 1.452 8.3
14C in Extract (mg eq/kg) 12.001 4.644
“Minor” refers to 14C peaks in the chromatogram with a concentration < 0.200 mg eq/kg in the extract. This refers to a total of all minor components.
Proposed metabolic pathway of cyflumetofen in plants
In the metabolism studies on Satsuma mandarin, apple and eggplant, radioactive residues after treatment were at significantly higher concentrations in surface rinse of the respective fruits than their extracts. In all plants, cyflumetofen was the predominant residue. Metabolite B-1 was found in the fruit extract of apple (30 DAT) and eggplant (14 DAT) at 11.2% and 14.8% of TRR corresponding to 0.064 and 0.061 mg eq/kg respectively. No other individual components accounted for > 10% TRR. At smaller amounts, metabolites AB-6 and AB-7 were often identified in fruits.
Considering the results of the plant metabolism studies, the metabolic pathway of cyflumetofen in plants was speculated as follows:
Cyflumetofen is photodegraded to AB-7, hydrolysed to B-1, or its nitrile is hydrolysed to amide followed by acyl migration to produce AB-6.
The side chain of AB-7 is hydrolysed and oxidized to produce U4 (identified only in eggplant).
B-1 conjugates to produce U1 and U2 (found only in eggplant).
B-1 may also be produced from AB-6 and AB-7. A-12 (found only in Satsuma mandarin) may be derived directly from cyflumetofen or through AB-6
Figure 2 Proposed metabolic pathway of cyflumetofen in plants

200 Cyflumetofen
Environmental fate The Meeting received extensive information on fate and behaviour in soil, hydrolysis in aquatic systems, and residues in succeeding crops. Since cyflumetofen is applied as foliar spray on trees (citrus fruits, pome fruits, grapes and tree nuts), strawberry, tomato and eggplant, studies on hydrolysis rate and products (some included in the Physical and Chemical Properties Section), photolysis on plant surface (conditional: No information was available) and rotational crops were relevant to the current review (“Submission and evaluation of pesticide residues data for the estimation of maximum residue levels in food and feed”, FAO, 2009).
Aerobic soil metabolism
Studies on aerobic soil metabolism studies on cyflumetofen and its degradates were provided.
Study 1 (Knight, 2004a)
Butylphenyl- or benzoyl-label cyflumetofen was incubated for 181 days in a sandy loam soil in the dark at 25 °C under aerobic conditions at a concentration of 0.93 mg/kg dw. Moisture was maintained throughout the incubation period and volatile radioactivity was trapped (PUF, ethyl digol, KOH). Soil biomass was 3.08% at the start of the experiment and 0.6% after 181 days (study end), indicating sufficiently viable conditions (at least during the first 100 days, as is also indicated by the continuous increase of [14C]CO2).
Single soil portions of each label treatment were sampled at 0, 1, 3, 6, 10, 14, 30, 59, 90, 121 and 181 days. Samples were extracted with 100 mL acetonitrile (2×), followed by extraction with 100 mL acetonitrile:water (3:1 v/v) (2×) and finally reflux for 6 hours in acetonitrile:water (3:1 v/v). Polyurethane foam plugs were extracted with acetonitrile. Post-extraction solids were fractionated into fulvic and humic acids and humin. Extracts were subjected to chromatographic analysis by HPLC-RAM and TLC. Metabolite identification was obtained by comparison with reference substances of metabolites.
Mass balances were between 89.6 and 102.6% of applied radioactivity (AR) for both labels. Unextracted radioactivity was at maximum 43.4% AR (14 d) and 37.8% AR on day 90. Volatile radioactivity consisted only of CO2 and was 25.7 and 34.0% AR on day 90 for butylphenyl- and benzoyl-label, respectively (27.9 and 39.3% AR at study end).
Cyflumetofen degraded with a DT50 of 2.76 days and a DT90 of 9.16 days by linear regression analysis. Degradation could be described by first-order kinetics (r2 0.952). Significant metabolites (exceeding 10% AR or 2× 5% at two consecutive time points) were AB-1 (max 8.3% AR, day 59), B-1 (max 22.9% AR, day 6) and SHL9 (max 7.9%, day 10).
Table 13 Soil properties of Wolston sandy loam
Property Value Origin Wolston, UK Texture (USDA) Sandy loam Sand (%, USDA) 70.8 Silt (%, USDA) 16.8 Clay (%, USDA) 12.4 pH-water 6.5 pH-KCl 6.5 pH-CaCl2 5.8 % OM 3.3 % OC 1.9 CEC (meq/100g) 15.3 water content at pF2 (%, w/w) 22.3 MWHC (%, w/w) 52.4

Cyflumetofen 201
Table 14 Distribution of radioactivity after aerobic incubation at 25 °C of sandy loam soil treated with butylphenyl- or benzoyl-label cyflumetofen at 0.93 mg/kg
Time d
% AR Extracted radioactivity
Unextracted radioactivity Volatile radioactivity
Mass balance fulvic acids humic acids humin total
Butylphenyl-label 0 98.2 nd nd nd 2.8 na 101.0 1 87.5 2.1 3.7 4.2 10.0 < 0.1 97.5 3 58.5 5.7 11.7 10.4 27.8 6.6 92.9 6 46.3 6.7 13.9 12.0 32.5 14.2 93.0 10 44.4 7.3 13.3 12.8 33.4 11.8 89.6 14 34.9 8.4 16.0 19.1 43.4 16.4 94.7 30 32.9 7.0 14.2 19.6 40.8 19.3 93.0 59 34.5 7.1 19.4 15.8 42.3 24.6 101.4 90 28.3 6.9 17.2 13.7 37.8 25.7 91.8 121 29.0 7.2 15.4 14.4 36.9 31.2 97.1 181 29.9 7.9 15.9 14.1 37.9 27.9 95.4 Benzoyl-label 0 98.3 nd nd nd 4.3 na 102.6 1 94.2 4.6 0.7 1.4 6.7 0.7 101.6 3 79.1 12.2 2.1 3.8 18.0 3.6 100.7 6 67.2 15.0 3.0 6.2 24.2 7.7 99.1 10 55.7 16.4 4.5 7.8 28.7 12.6 97.0 14 44.4 18.5 5.6 10.3 34.3 20.8 99.5 30 36.8 15.0 4.9 11.2 31.2 27.1 95.1 59 34.5 16.3 5.7 12.9 34.9 28.6 98.0 90 29.4 14.6 5.7 10.3 30.6 34.0 94.0 121 30.0 13.9 5.4 9.6 29.0 36.7 95.7 181 27.1 14.8 4.9 11.0 30.7 39.3 97.1
Nd = Not determined na = Not applicable
Table 15 Identification of radioactivity after aerobic incubation at 25 °C of sandy loam soil treated with butylphenyl- or benzoyl-label at 0.93 mg/kg
Component % AR 0 d 1 d 3 d 6 d 10 d 14 d 30 d 59 d 90 d 121 d 181 d
Butylphenyl-label Polar comp. nd nd 0.8 1.0 1.2 1.1 0.5 1.1 1.5 1.2 1.4 SHL1 nd nd 1.2 1.1 0.8 0.8 1.3 0.9 1.0 1.1 1.5 SHL3 nd 0.9 6.2 2.5 2.0 2.1 1.6 0.9 1.4 1.6 1.7 SHL4 nd 1.4 2.6 2.7 2.8 2.5 1.6 1.8 1.9 1.8 2.0 AB-1 nd 2.4 3.3 4.4 6.9 6.4 5.5 8.3 6.5 6.0 3.8 SHL6 0.9 nd 0.9 2.1 1.2 0.7 0.9 0.6 0.5 1.4 1.9 Parent 96.8 76.6 27.1 15.1 9.8 6.2 4.6 3.6 2.2 1.9 1.3 SHL7 nd nd 1.7 1.1 0.2 0.6 0.7 1.4 1.2 1.7 1.3 SHL8 nd nd 1.0 2.4 3.7 1.4 1.4 2.9 1.6 1.2 1.7 AB-1 dimer nd 2.0 4.6 4.4 5.8 4.6 4.8 5.0 3.4 2.8 3.6 AB-1 (cis) nd 1.8 6.4 5.7 1.2 5.1 2.0 3.2 5.8 2.7 3.2 AB-1 (trans) nd 5.1 3.2 3.4 4.1 4.7 Others 0.5 2.5 2.7 3.7 3.6 3.4 4.7 1.2 1.2 1.5 1.8 Benzoyl-label Polar comp. nd 0.5 1.7 1.9 2.3 3.2 1.8 2.7 1.5 2.2 1.6 B-1 nd 7.6 18.7 22.9 18.3 8.4 3.6 4.3 2.3 3.2 2.7 SHL3 nd nd 0.3 0.4 0.3 0.3 0.4 nd nd nd nd SHL4 nd 0.2 1.4 0.9 0.4 0.8 0.5 1.9 0.7 0.8 1.2 AB-1 nd 0.7 4.0 4.8 5.6 3.6 7.8 5.2 7.0 6.5 5.1 SHL6 nd 0.4 0.8 0.9 1.4 2.0 1.3 1.8 1.1 1.1 nd Parent 98.0 80.6 38.8 17.5 7.1 6.3 5.0 4.4 2.6 2.2 1.8 SHL7 nd nd 1.1 1.9 0.7 1.3 0.7 0.6 0.4 1.9 1.6 SHL8 nd nd 1.7 1.8 1.3 1.6 1.1 2.2 1.9 0.9 2.2

202 Cyflumetofen
Component % AR 0 d 1 d 3 d 6 d 10 d 14 d 30 d 59 d 90 d 121 d 181 d
AB-1 dimer nd 1.4 4.6 5.0 7.9 7.1 5.8 3.8 4.4 3.5 3.3 AB-1 (cis) nd 1.7 4.2 6.0 1.0 6.5 1.1 4.3 1.4 1.2 1.2 AB-1 (trans) nd 7.1 4.6 4.1 4.1 4.1 Others 0.3 1.1 1.7 3.1 2.3 3.2 2.9 3.2 2.1 2.4 2.4 nd = Not detected
Table 16 Distribution of radioactivity after sterile incubation at 25 °C of sandy loam soil treated with butylphenyl- or benzoyl-label at 0.93 mg/kg
Time, d % AR Extracted Unextracted Volatiles Mass balance
Butylphenyl-label 0 103.5 < 0.1 na 103.5 1 100.7 0.8 < 0.1 101.5 7 93.0 8.4 < 0.1 101.4 30 61.0 42.7 4.1 107.8 Benzoyl-label 0 100.2 < 0.1 na 100.2 1 99.0 0.7 < 0.1 99.7 7 94.6 5.3 < 0.1 99.9 30 83.6 19.7 < 0.1 103.3 Na = Not applicable
Table 17 Identification of radioactivity after sterile incubation at 25 °C of sandy loam soil treated with butylphenyl or benzoyl-label at 0.93 mg/kg
% AR Butylphenyl-label Benzoyl-label 0 d 1 d 7 d 30 d 0 d 1 d 7d 30 d
Polar comp. nd nd nd 7.3 nd nd 0.4 5.3 SHL1 nd nd nd nd na na na na B-1 na na na na nd 1.8 12.0 55.1 SHL3 nd nd 0.8 7.7 nd nd nd nd SHL4 nd 0.4 0.7 1.9 nd nd nd nd AB-1 nd 0.6 2.7 6.5 nd 0.5 2.6 3.0 Parent 95.4 97.0 85.0 30.8 97.7 95.1 77.9 17.0 SHL7 nd nd 0.9 1.8 nd nd nd 1.1 SHL8 nd nd nd 0.9 nd nd 0.3 nd AB-1 dimer nd nd 0.4 0.4 nd nd nd nd AB-1 (cis/trans) nd nd nd 0.7 nd nd nd nd
Others 4.6 2.0 2.5 3.1 2.3 1.6 1.4 2.2 Na = Not applicable nd = Not detected
Study 2 (Willems, 2008a)
Basing on the above study results, DT50 and DT90 for the degradation of cyflumetofen in soil were calculated following FOCUS guidance of EU. Optimization was by the Marquardt method using ordinary least squares weighting.
Cyflumetofen degrades in Wolston sandy loam soil (at 25 °C) with a half-life of 1.81–2.29 days (mean 2.05 d, persistence endpoint). Degradation was described by DFOP kinetics. For modelling a mean DegT50 of 2.38 days was calculated (correction for soil moisture not included).

Cyflumetofen 203
Study 3 (Ta and Strobush, 2011a)
The metabolism of cyflumetofen in four US soils under aerobic conditions was investigated using benzoyl- and butylphenyl-label. Four soils of different textures (loamy sand and loam soils) collected from different locations representing various geographical regions in the USA were used. Cyflumetofen was applied at the rate of 0.8 mg ai/kg soil, equivalent to 200 g ai/ha.
Soil equivalent to 50 g of dry weight was weighed into 250 mL wide-mouth polypropylene centrifuge bottles. The soils were maintained aerobically by connecting to an air flow-through system in the dark at 20 ± 2 oC for 120 days. The soil moistures were adjusted to approximately 40–60% of the maximum water holding capacity (MWHC) prior to application of test material to the soil and maintained throughout the incubation period by adding HPLC water if necessary. Moisturized CO2-free air was passed over the soil surface and air leaving the system was passed through 1 N NaOH solution to trap any CO2 produced. Duplicate samples were analysed at 0, 1, 3, 7, 16, 29, 58, and 120 days after treatment (DAT). The soil samples were extracted once with acetonitrile, followed by 70% acetonitrile in water twice, and trifluoroacetic acid was added to bring the extract solution to a concentration of 0.1% acid to prevent any hydrolysis that may occur. The solvent extracts were pooled, concentrated and analysed by HPLC. Identification of parent and its transformation products was performed by retention matching with reference standards by HPLC and confirmation by LC/MS and/or NMR. The amounts of CO2 and organic volatiles produced were determined at each sampling time (excluding 0 DAT). The traps were assayed directly by adding aliquots of the trapping solutions into liquid scintillation fluid and counting by liquid scintillation counting.
Table 18 Soil properties
Geographic Location CA, USA IN, USA NJ, USA WI, USA Soil series Corralitos Crosby Penn Burkhardt Classification Mixed, thermic,
Typic Xeropsam-ments
Fine, mixed, active, mesic Aeric Epiaqualfs
Fine-loamy, mixed, superactive mesic Ultic Hapludalfs
Sandy, mixed, mesic Typic Hapludolls
Texture Class Loamy Sand Loam Loam Loamy Sand Sand (%) 87 35 29 87 Silt (%) 8 46 44 6 Clay (%) 5 19 27 7 pH (in water) 8.1 6.5 6.9 6.3 Organic Matter (%) 0.49 2.30 2.30 2.70 Organic Carbon % (1) 0.28 1.33 1.33 1.57 Soil Biomass (μgC/ g soil) 0 DAT
43.2
160.9
139.8
128.5
120 DAF 55.3 127.9 54.2 86.8 Cation Exchange Capacity (CEC, meq/100 g) 6.6 9.0 8.1 8.4
Max Moisture Holding Capacity (%) 18.8 36.6 43.3 28.0
Bulk Density g/cc (disturbed) 1.42 1.04 1.11 1.34
The average total recovery of the radiolabelled material was 95.5% of the total applied radioactivity (TAR) for all samples from four soils with two labels.
California soil:
The total radioactivity recovered from the benzoyl-label ranged from 97.1 to 103.3% of the total applied radioactivity (TAR) with an average of 99.4% TAR. Radioactive residues extracted by solvent decreased from approximately 99.7–100% TAR at 0 day after treatment (DAT) to approximately 67.6–77.4% TAR at 120 DAT. Unextracted radioactive residues increased from approximately 0.3% TAR at 0 DAT to 16–21.6% TAR at 120 DAT. The concentration of the parent compound decreased from approximately 98.1–98.2% TAR at 0 DAT to approximately 3–5% TAR at 120 DAT. There
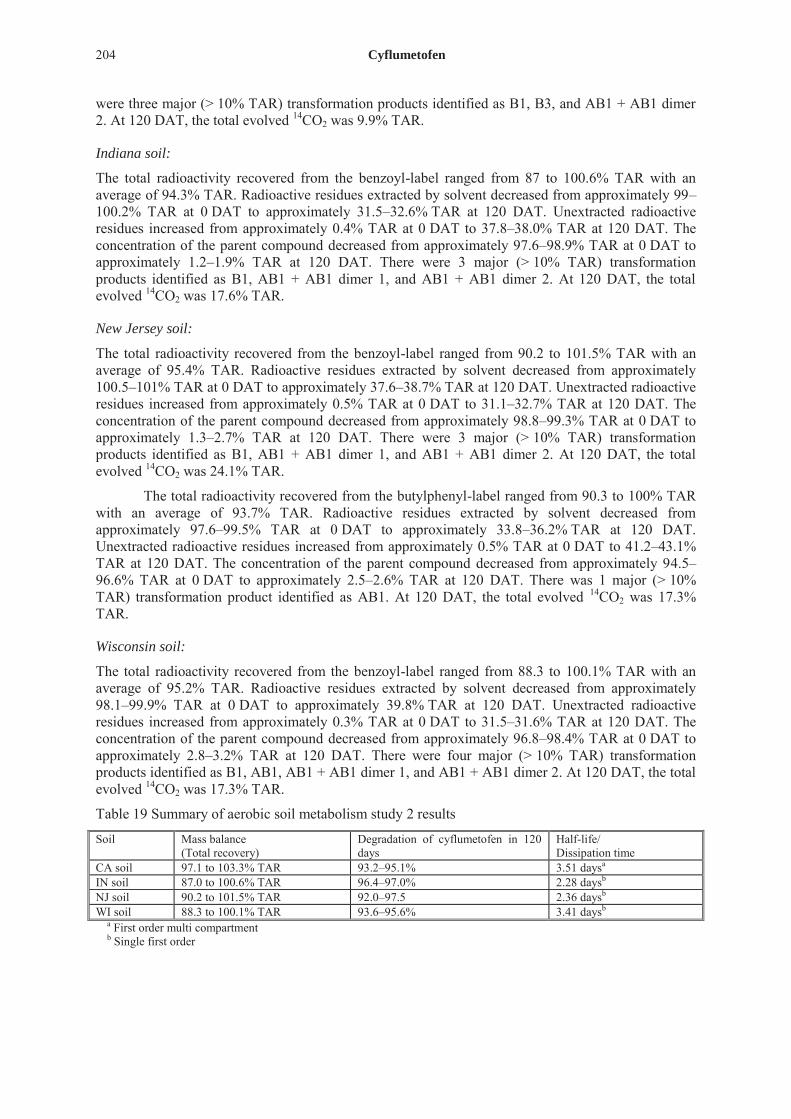
204 Cyflumetofen
were three major (> 10% TAR) transformation products identified as B1, B3, and AB1 + AB1 dimer 2. At 120 DAT, the total evolved 14CO2 was 9.9% TAR.
Indiana soil:
The total radioactivity recovered from the benzoyl-label ranged from 87 to 100.6% TAR with an average of 94.3% TAR. Radioactive residues extracted by solvent decreased from approximately 99–100.2% TAR at 0 DAT to approximately 31.5–32.6% TAR at 120 DAT. Unextracted radioactive residues increased from approximately 0.4% TAR at 0 DAT to 37.8–38.0% TAR at 120 DAT. The concentration of the parent compound decreased from approximately 97.6–98.9% TAR at 0 DAT to approximately 1.2–1.9% TAR at 120 DAT. There were 3 major (> 10% TAR) transformation products identified as B1, AB1 + AB1 dimer 1, and AB1 + AB1 dimer 2. At 120 DAT, the total evolved 14CO2 was 17.6% TAR.
New Jersey soil:
The total radioactivity recovered from the benzoyl-label ranged from 90.2 to 101.5% TAR with an average of 95.4% TAR. Radioactive residues extracted by solvent decreased from approximately 100.5–101% TAR at 0 DAT to approximately 37.6–38.7% TAR at 120 DAT. Unextracted radioactive residues increased from approximately 0.5% TAR at 0 DAT to 31.1–32.7% TAR at 120 DAT. The concentration of the parent compound decreased from approximately 98.8–99.3% TAR at 0 DAT to approximately 1.3–2.7% TAR at 120 DAT. There were 3 major (> 10% TAR) transformation products identified as B1, AB1 + AB1 dimer 1, and AB1 + AB1 dimer 2. At 120 DAT, the total evolved 14CO2 was 24.1% TAR.
The total radioactivity recovered from the butylphenyl-label ranged from 90.3 to 100% TAR with an average of 93.7% TAR. Radioactive residues extracted by solvent decreased from approximately 97.6–99.5% TAR at 0 DAT to approximately 33.8–36.2% TAR at 120 DAT. Unextracted radioactive residues increased from approximately 0.5% TAR at 0 DAT to 41.2–43.1% TAR at 120 DAT. The concentration of the parent compound decreased from approximately 94.5–96.6% TAR at 0 DAT to approximately 2.5–2.6% TAR at 120 DAT. There was 1 major (> 10% TAR) transformation product identified as AB1. At 120 DAT, the total evolved 14CO2 was 17.3% TAR.
Wisconsin soil:
The total radioactivity recovered from the benzoyl-label ranged from 88.3 to 100.1% TAR with an average of 95.2% TAR. Radioactive residues extracted by solvent decreased from approximately 98.1–99.9% TAR at 0 DAT to approximately 39.8% TAR at 120 DAT. Unextracted radioactive residues increased from approximately 0.3% TAR at 0 DAT to 31.5–31.6% TAR at 120 DAT. The concentration of the parent compound decreased from approximately 96.8–98.4% TAR at 0 DAT to approximately 2.8–3.2% TAR at 120 DAT. There were four major (> 10% TAR) transformation products identified as B1, AB1, AB1 + AB1 dimer 1, and AB1 + AB1 dimer 2. At 120 DAT, the total evolved 14CO2 was 17.3% TAR.
Table 19 Summary of aerobic soil metabolism study 2 results
Soil Mass balance (Total recovery)
Degradation of cyflumetofen in 120 days
Half-life/ Dissipation time
CA soil 97.1 to 103.3% TAR 93.2–95.1% 3.51 daysa IN soil 87.0 to 100.6% TAR 96.4–97.0% 2.28 daysb NJ soil 90.2 to 101.5% TAR 92.0–97.5 2.36 daysb WI soil 88.3 to 100.1% TAR 93.6–95.6% 3.41 daysb
a First order multi compartment b Single first order

Cyflumetofen 205
Study 4 (Brands, 2011a)
Benzoyl-label was incubated for 120 days in the dark in 100 g dw equivalent each of three soils (Spreyer 2.2, loamy sand; Spreyer 2.3, sandy loam; and Spreyer 6S, clay), which were equilibrated for 20–21 days in the dark, at 20 2 °C under aerobic conditions at a concentration of 0.383 mg/kg (~0.8% acetonitrile) on a dry weight basis. A humidified air stream was passed through the soil containers (2 x 30 minutes/day). The outgoing air was passed through a polyurethane foam plug, a trap containing 2-ethoxyethanol and two traps containing 2M NaOH to trap volatile substances and CO2. Soil moisture was kept constant at 45% of the MWHC throughout the incubation period. Soil biomass was determined at the start and end of the incubation period by the fumigation/extraction method.
Speyer 2.2, 2.3 and 6S soils, after sieving (2 mm), were used within two months (storage at 4 °C) of field sampling. The properties of these soils are shown in the following Table.
Table 20 Properties of the three soils used in the study.
Property Speyer 2.2 Speyer 2.3 Speyer 6S
Origin Hanhofen, Rheinland-Pfalz, Germany
Offenbach, Rhein-land-Pfalz, Germany
Siebeldingen, Rhein-land-Pfalz, Germany
Texture (USDA) Loamy sand Sandy loam Clay Sand (%, USDA) 79.1 61.0 21.9 Silt (%, USDA) 13.5 29.8 36.0 Clay (%, USDA) 7.9 9.2 42.0 pH-water - - - pH-KCl - - - pH-CaCl2 5.6 6.2 7.0 % OM 4.07 1.76 3.26 % OC 2.36 1.02 1.89 CEC (meq/100g) 11 9 20 MWHC (%, w/w) 48.0 34.9 42.3
Single soil portions and associated traps were sampled at 0, 1, 3, 6 (duplicate sample), 10, 14, 21, 35 (duplicate sample), 58, 90 and 120 days. Soil samples were extracted three times with 100 mL acetonitrile/sodium acetate buffer pH 4 (75:25, v/v). Samples of day 35 were also extracted by n-hexane and acetonitrile-Soxhlet extraction (3 hours). Polyurethane foam plugs were extracted with acetonitrile (2×). Radioactivity in extracts and liquid traps was determined by LSC and in post-extraction solids by combustion/LSC. Soil extracts were fractionated in an organic and aqueous phase. Relevant fractions were subjected to analyses by HPLC-RAM and TLC. Metabolites were identified by comparison with reference substances of metabolites and LC-MS/MS analysis. Radioactivity in the NaOH traps was confirmed as CO2 by precipitation with Ba(OH)2.
Soil biomass was 1.1–2.1% of OC at the start and 0.3–2.7% at the end of the experiment. In combination with significant mineralization at the end of the study, sufficiently viable conditions were indicated.
Mass balances were between 87.9 and 109.8% of applied radioactivity (AR). No specific trend was observed and all results were considered acceptable.
The amount of extractable residues decreased from 103.5–104.6% AR to 54.1 (Speyer 2.2), 26.9 (Speyer 2.3) and 62.2% AR (Speyer 6S) at study end (day 120). Unextractables were maximum 32.1 (Speyer 2.2, day 58), 40.1 (Speyer 2.3, day 120) and 38.4% AR (Speyer 6S, day 35). Additional extraction with n-hexane (day 35 sample) released 1.6–3.2% AR radioactivity and with Soxhlet 1.8–5.1% AR.
Volatile radioactivity consisted mostly of CO2 and was 9.5 (Speyer 2.2), 20.7 (Speyer 2.3) and 1.7% AR (Speyer 6S) at day 120 (study end) (0.8, 16.2 and 1.8% AR, respectively at day 90).
Unextracted radioactivity was at a maximum of 32.1 (Speyer 2.2, day 58), 40.1 (Speyer 2.3, day 120) and 38.4% AR (Speyer 6S, day 35).

206 Cyflumetofen
Cyflumetofen degraded to < 10% AR after 21 days in Speyer 2.1 soil, to < 10% AR after 10 days in Speyer 6S soil and to ~10% AR at day 120 in Speyer 2.3 soil under aerobic conditions in the dark at 20 °C.
Those metabolites exceeding 10% AR or 2× 5% at two consecutive time points were B-1 (max 63.0% AR, day 90, Speyer 2.2) and B-3 (max 23.0% AR, day 21, Speyer 2.2). No other metabolites exceeding 5% AR were observed in any soil.
Table 21 Distribution of radioactivity after aerobic incubation at 20 °C of Speyer 2.2, 2.3 and 6S soils treated with benzoyl-label at 0.383 mg/kg
Time d
% AR
Organic volatiles CO2 Extracted radioactivity
Unextracted radioactivity Mass balance
Speyer 2.2 Soil 0 na Na 103.7 2.6 106.3 1 0.0 0.0 90.2 5.4 95.6 3 0.0 0.1 94.1 9.1 103.3 6 0.0 0.1 82.5 14.1 96.7 6 0.0 0.0 69.1 18.7 87.9 10 0.0 1.3 79.2 20.4 101.0 14 0.1 1.4 76.6 16.1 94.2 21 0.0 1.2 76.8 18.1 96.2 35 0.3 5.1 67.3 21.2 93.9 35 0.1 0.7 72.6 22.5 95.9 58 0.4 1.1 72.5 32.1 106.1 90 0.2 0.8 77.2 18.3 96.6 120 1.4 9.5 54.1 30.1 95.0 Speyer 2.3 Soil 0 na na 104.6 0.9 105.5 1 0.0 0.1 81.7 7.4 89.1 3 0.1 0.5 78.4 19.3 98.4 6 0.1 0.8 66.7 22.4 90.0 6 0.1 0.3 75.7 24.2 100.4 10 0.1 2.8 68.6 27.8 99.2 14 0.1 3.2 71.4 19.4 94.1 21 0.1 3.5 71.2 20.8 95.8 35 0.2 4.4 71.1 24.8 100.4 35 0.1 7.0 61.0 25.1 93.2 58 0.2 11.4 41.5 38.3 91.4 90 0.1 16.2 41.4 33.3 91.0 120 0.1 20.7 26.9 40.1 87.8 Speyer 6S soil 0 na na 103.5 6.3 109.8 1 0.0 0.0 80.6 21.4 102.0 3 0.0 0.0 75.6 26.0 101.6 6 0.1 0.4 67.2 33.4 101.1 6 0.0 0.3 70.5 30.7 101.5 10 0.2 1.0 61.7 34.6 97.5 14 0.1 0.7 57.0 32.1 89.9 21 0.1 0.4 64.9 29.1 94.4 35 0.1 0.0 55.1 37.4 92.6 35 0.1 0.0 59.6 38.4 98.1 58 0.2 1.2 66.3 37.1 104.8 90 0.4 1.8 60.6 32.1 94.9 120 0.4 1.7 62.2 33.0 97.4
na: not applicable

Cyflumetofen 207
Table 22 Identification of radioactivity after aerobic incubation at 20 °C of Speyer 2.2, Speyer 2.3 and Speyer 6S soils treated with Benzoyl-label at 0.383 mg/kg
Time d
% AR Cyflumetofen B-1b B-3b Others a
Speyer 2.2 Soil 0 97.5 3.0 0.0 0.0 1 94.1 3.8 0.0 0.0 3 75.7 8.9 1.8 4.0 6 31.6 35.7 4.9 5.9 6 29.6 34.3 14.2 0.0 10 22.4 35.4 16.1 3.5 14 17.4 47.1 12.4 0.0 21 6.7 55.2 23.0 0.0 35 14.7 35.3 5.6 12.9 35 7.1 48.7 13.8 6.5 58 14.7 39.9 9.9 1.6 90 2.6 63.0 8.3 6.2 120 10.2 33.8 5.2 7.1 Speyer 2.3 0 96.2 7.9 0.0 0.0 1 80.3 13.5 0.0 0.0 3 54.4 22.3 0.0 0.0 6 23.4 34.3 12.7 2.1 6 26.4 37.2 3.6 6.9 10 22.3 36.6 4.7 5.6 14 20.9 36.1 2.1 8.2 21 14.7 42.8 3.2 8.9 35 15.2 43.2 3.5 9.0 35 14.6 36.3 1.9 8.4 58 12.5 12.6 1.0 15.4 90 11.2 16.4 0.0 15.0 120 10.6 2.6 0.0 15.7 Speyer 6S 0 95.1 4.3 0.0 0.0 1 70.1 13.3 0.0 0.0 3 40.8 23.2 0.0 9.4 6 14.9 32.4 2.0 8.4 6 21.8 36.4 3.2 14.1 10 6.4 42.3 2.3 7.8 14 4.8 46.2 3.1 5.9 21 5.9 39.4 4.8 7.9 35 3.4 42.3 1.1 7.3 35 3.0 45.5 2.5 5.9 58 5.0 52.8 1.3 7.5 90 4.8 42.4 0.0 11.5 120 5.4 43.0 0.0 11.6
a individual fractions <5% AR b confirmed by co-chromatography with reference standard (HPLC, TLC (only B-1), LC-MS/MS)
DT50 and DT90 values for calculated by fitting single first order (SFO), first order multi-compartment (FOMC) and double first order in parallel (DFOP) models to the data and the best fit was obtained by DFOP model (based on visual examination, r2 and 2). Calculated DT50 and DT90 values are shown in the following Table.
Table 23 Half-lives for degradation of cyflumetofen at 20 °C under aerobic conditions (double first order in parallel was assumed)
Soil M0 % g k1
days- k2 days-1
DT50 days
DT90 days r2 χ2
(err) Speyer 2.2 105 ± 6.0 0.91 ± 0.03 0.197 ± 0.030 0 4.0 21 0.960 15.3 Speyer 2.3 98.8 ± 3.1 0.83 ± 0.03 0.303 ± 0.035 0.004 ± 3.0 130 0.988 7.3

208 Cyflumetofen
Soil M0 % g k1
days- k2 days-1
DT50 days
DT90 days r2 χ2
(err) 0.003
Speyer 6S 95.0 ± 1.7 0.95 ± 0.01 0.312 ± 0.014 0 2.4 9.2 0.996 3.5
Study 5 (Willems, 2008a)
The degradation of cyflumetofen in three soils (Speyer 2.2, 2.3 and 6S) was studies by Brands in 2008 (NOTOX report 478338; 7.2.1/01), in which benzoyl-label was spiked to these soils and incubated for 120 days at 20 °C in the dark. Using the degradation results, DT50 and DT90 were calculated for cyflumetofen in accordance with FOCUS guidance ((SANCO/10058/2005, vs 2.0, June 2006). Optimization was by the Marquardt method using ordinary least squares weighting.
Table 24 Cyflumetofen degradation in Speyer 2.2, 2.3 and 6S soils
Time d
Cyflumetofen (% of applied) Speyer 2.2 Speyer 2.3 Speyer 6S
0 100.1a 97.1b 101.4c
1 94.1 80.3 70.1 3 75.7 54.4 40.8 6 31.6 23.4 14.9 6 29.6 26.4 21.8 10 22.4 22.3 6.4 14 17.4 20.9 4.8 21 6.7 14.7 5.9 35 14.7 15.2 3.4 35 7.1 14.6 3.0 58 14.7 12.5 5.0 90 2.6 11.2 4.8 120 10.2 10.6 5.4
a including 2.6% unextracted residues b including 0.9% unextracted residues c including 6.3% unextracted residues
According to FOCUS guidance, first, single first order (SFO) and first order multi-compartment (FOMC) kinetics were run. Time zero results for cyflumetofen were adjusted for unextracted residues but not for metabolites because the radioactivity present as metabolites was similar to the amount of impurities in the spike solutions. The possibility for elimination of data points or constraining of M0 was investigated, and when FOMC still resulted in a better fit, also dual first order in parallel (DFOP) kinetics were fitted to the data. DegT50 and DegT90 values for persistence were taken from the best fit model. For modelling, the SFO fit was first evaluated and when not acceptable, FOMC or DFOP were also assessed. In case FOMC or DFOP was suited for modelling, the DegT50 for modelling was calculated as DegT90/3.32.
Persistence and modelling endpoints for the degradation of cyflumetofen in soil were calculated and are shown in the following Table.
Table 25 Persistence and modelling endpoints for degradation of OK-5101 in Speyer soils
Soil Persistence Modelling DT50 at 20 °C days
DT90 at 20 °C days model DT50 at 20 °C a
Days Speyer 2.2 4.33 23.10 DFOP 6.70 Speyer 2.3 3.13 134.10 DFOP 13.30 Speyer 6S 2.20 8.40 DFOP 2.95
a not including moisture correction.

Cyflumetofen 209
Study 6 (Brands & Corral, 2011b)
The degradation of B-1 in soil was investigated in three soils (the same soils as in Study 4). A 50 g (dw) portion each of three soils (Speyer 2.2, loamy sand; Speyer 2.3, sandy loam; and Speyer 6S, clay), which were sieved (2 mm), stored at 4 °C and used within 4 weeks of field sampling, was equilibrated for 4 days in the dark at a moisture content of ~40% of the MWHC at 20 °C. Following equilibration, soil portions were treated with B-1 in acetonitrile/water 1/9 (v/v) at a rate of 0.25 mg/kg dw (~0.16% acetonitrile). The test substance was gently mixed in the soil. Incubation took place in the dark at 20 2 °C under aerobic conditions for 120 days. Soil moisture was kept constant at ~40% of the MWHC throughout the incubation period.
Soil biomass was determined at the start and end of the incubation period by the fumigation/extraction method. Single soil portions were sampled at 0, 1, 4 (duplicate sample), 10, 28 (duplicate sample), 70 and 120 days. Soil samples were extracted with 250 mL acetonitrile/water (10/90 v/v) for 30 minutes. The samples were filtered over a 0.2 μm filter prior to analysis by UPLC-MS/MS.
Biomass was > 1% of OC throughout the study. Actual moisture contents (dw basis) throughout the study were 20% (Speyer 2.2), 14% (Speyer 2.3) and 16% (Speyer 6S), equivalent to ~39% of the MWHC.
Table 26 Degradation of B-1 during aerobic incubation at 20 °C in soil treated with B-1 at 0.25 mg/kg
Time d
B-1 (% of applied) Speyer 2.2 Speyer 2.3 Speyer 6S
0 102 105 100 1 93 101 95 4 72 91 95 4 68 93 93 10 34 70 94 28 0.5* 28 56 28 0.5* 33 63 70 na 16 16 120 na 1.3 20
na: not applicable * set at ½ LOQ
DT50 and DT90 values for B-1 were obtained by fitting single first order (SFO) kinetics to the data. The results are given in the following Table. The FOMC model was also verified and gave similar results as the SFO model, but optimization errors were much larger compared to the SFO model. Because there was also no biphasic pattern visible, the SFO model was selected as best fit model.
Table 27 Half-lives for degradation of B-1 at 20 °C under aerobic conditions based on SFO kinetics a
Soil M0 %
K day-1
DT50 days
DT90 Days r2 χ2 (err)
Speyer 2.2 104 ± 2.8 0.110 ± 0.008 6.3 21.0 0.993 4.6 Speyer 2.3 106 ± 2.7 0.041 ± 0.003 16.7 55.5 0.988 5.3 Speyer 6S 102 ± 3.7 0.019 ± 0.002 36.3 121 0.959 7.2
a not corrected for moisture content.
B-1 degraded in three soils under aerobic conditions in the dark at 20 °C with half-lives of 6.3, 16.7 and 36.3 days and DT90 values of 21.0, 55.5 and 121 days. These values are not normalized for moisture. Degradation was described by SFO kinetics.
Study 7 (Corral & Brands, 2010c)
AB-1 was studied by incubating for 120 days in three soils (Speyer 2.1, sand; Speyer 2.2, loamy sand; and Speyer 6S, clay) in the dark at 20 °C under aerobic conditions at a concentration of 0.04 mg/kg

210 Cyflumetofen
dw. Portions of 50 g dw equivalent soil were equilibrated for 11 days in the dark at a moisture content of ~40% of the MWHC at 20 °C. Following equilibration, soil portions were treated with AB-1 in acetonitrile at a rate of 0.04 mg/kg dw. The test substance was gently mixed in the soil. Incubation took place in the dark at 20 2 °C under aerobic conditions for 120 days. Soil moisture was kept constant at ~40% of the MWHC throughout the incubation period. Soil biomass was determined at the start and end of the incubation period by the fumigation/extraction method.
Single soil portions were sampled at 0, 0.25 (duplicate sample), 1, 2 (duplicate sample), 4, 29, 72 and 120 days. Soil samples were extracted with 400 mL acetonitrile/water (50/50 v/v) containing 0.05 or 0.1% (v/v) ammonium solution for 30 minutes. The samples were filtered over a 0.2 μm filter prior to analysis by UPLC-MS/MS (fully validated, see OTSA-0368).
Biomass was >1% of OC throughout the study. Actual moisture contents (dw basis) throughout the study were 13% (Speyer 2.1), 20% (Speyer 2.2) and 16% (Speyer 6S), equivalent to 39-40% of the MWHC
Table 28 Soil properties of Speyer 2.1, 2.2 and 6S soils
Property Speyer 2.1 Speyer 2.2 Speyer 6S
Origin Dudenhofen, Rheinland-Pfalz, Germany
Hanhofen, Rheinland-Pfalz, Germany
Siebeldingen, Rhein-land-Pfalz, Germany
Texture (USDA) Sand Loamy sand Clay Sand (%, USDA) 88.1 81.2 21.7 Silt (%, USDA) 8.5 12.1 35.7 Clay (%, USDA) 3.4 6.7 42.6 pH-water - - - pH-KCl - - - pH-CaCl2 5.1 5.4 7.2 % OM 1.52 4.0 3.1 % OC 0.88 2.29 1.79 CEC (meq/100g) 4 10 20 water content at pF2 (%, w/w) - - - MWHC (%, w/w) 33.3 49.7 40.1
Material balance was between 85 and 123% for these soils. The degradation of AB-1 over time in these soils is shown in the following table.
Table 29 Degradation of AB-1 during aerobic incubation at 20 °C in soil treated with AB-1 at 0.04 mg/kg
Time d
AB-1 (% of applied) Speyer 2.1 Speyer 2.2 Speyer 6S
0 95 88 90 0.25 18 18 22 0.25 18 19 21 1 14 13 11 2 15 14 9 2 16 14 10 4 12 12 10 29 12 11 8 72 11 9 6 120 8 6 3
DT50 and DT90 values for AB-1 were obtained by fitting single first order (SFO), first-order multi-compartment (FOMC), dual first order in parallel (DFOP) and hockey-stick (HS) kinetics to the data. As there was a clear bi-phasic pattern observed, the HS and DFOP models described the results the best (and equally good). According to FOCUS guidance, the HS model is not used for obtaining endpoints for persistence, therefore the DFOP model was selected for use in exposure assessment. The calculated results are shown in the following table.

Cyflumetofen 211
AB-1 degraded in three soils under aerobic conditions in the dark at 20 °C with half-lives of 0.07, 0.08 and 0.11 days (not corrected for moisture). Degradation was described by DFOP kinetics.
Table 30 Half-lives for degradation of AB-1 at 20 °C under aerobic conditions based on DFOP kinetics a
Soil M0 % k1, k2 and g DT50
days DT90 Days r2 χ2 (err)
Speyer 2.1 95.0 ± 1.2 k1 = 12.40 ± 1.13 k2 = 0.005 ± 0.001 g = 0.847 ± 0.007
0.07 90.8 0.998 3.9
Speyer 2.2 88.0 ± 0.7 k1 = 10.75 ± 0.50 k2 = 0.006 ± 0.001 g = 0.846 ± 0.004
0.08 69.3 0.999 2.5
Speyer 6S 90.0 ± 0.7 k1 = 7.81 ± 0.22 k2 = 0.009 ± 0.001 g = 0.885 ± 0.004
0.11 15.7 0.999 2.7
a not corrected for moisture
Photodegradation on soil surface (van Noorloos, 2007a and 2007b)
Photodegradation of cyflymetofen on soil surface was investigated using butylphenyl- and benzoyl-label cyflumetofen.
Butylphenyl- or benzoyl-label was applied uniformly over the surface of thin soil layers at a rate of 401 g ai/ha or 391–395 g ai/ha, respectively. The soil layers were irradiated (300–400 nm: 66.5 Watt/m2) for 15 days (equivalent to 33–38 days natural sunlight at 40 °N, summer) at 18–23 °C or for 14 days (equivalent to 35–36 days natural sunlight at 40 °N, summer) at 19–22 °C, respectively, with artificial light (Xenon lamp) simulating the sunlight spectrum. Control samples were incubated in the dark at approximately 20 °C. Duplicate samples were taken after 0, 1, 4, 7, 11 and 15 days of irradiation/incubation. Soil layers were extracted with (75/25 (v/v)) acetonitrile/sodium acetate buffer pH 4. Following fractionation into an organic and aqueous phase the organic phase was analysed by reversed phase HPLC-RAM and selected samples also by TLC. The aqueous phase was not further analysed due to low levels of radioactivity. Polyurethane foam plugs were extracted by acetonitrile and soda lime granules were dissolved in 2 M HCl and released CO2 was trapped in 2 M NaOH. Radioactivity in liquid fractions was determined by LSC and in residual soil by combustion/LSC. Identification of radioactive fractions was obtained by co-chromatography with reference standards (HPLC and TLC).
Table 31 Soil properties of Speyer 3A loam
Property Value Origin Altu heim, Baden-Württemberg, Germany Texture Loam Sand (%) 46.7 Silt (%) 35.5 Clay (%) 17.7 pH-water - pH-KCl - pH-CaCl2 7.2 % OM 3.7 % OC 2.17 CEC (meq/100g) 19 water content at pF2 (%, w/w) - MWHC (%, w/w) 48.4
Mass balances
Butylphenyl-label: Mass balances were between 81.4 and 105.4% of applied radioactivity (AR) for the irradiated samples and between 87.2 and 102.0% AR for the dark control samples. Unextracted

212 Cyflumetofen
radioactivity was 44.6–45.6% AR (irradiated, study end) and 45.0% AR (dark control, study end, mean). Volatile radioactivity was at the maximum 2.5% AR in any sample.
Benzoyl-label: Mass balances were between 96.4 and 104.7% of applied radioactivity (AR) for the irradiated samples and dark control samples. Unextractables were approximately 24% AR (irradiated, study end) and approximately 39% AR (dark control, study end). Volatile radioactivity was insignificant ( 0.5% AR).
Cyflumetofen dissipation
Butylphenyl-label: Cyflumetofen dissipated with a single first order DT50 of 1 and 0.95 days in irradiated soil and dark controls, respectively. No metabolites exceeded 10% AR. Specific photolytic metabolites were not observed. All metabolite fractions observed in irradiated soil were also present in similar amounts in dark controls.
Benzoyl-label: Cyflumetofen dissipated with a single first order DT50 of 1.4 days in irradiated soil and dark controls, respectively. One significant metabolite, B-1, exceeded 10% AR in both the irradiated and dark soil. Specific significant (> 10% AR) photolytic metabolites were not observed.
Table 32 Distribution of radioactivity after irradiation of soil layers treated with butylphenyl- or benzoyl-label
Time d
Time sunlight equivalent b
% AR
PUF CO2 residue in soda lime extracted a unextracted mass
balance Butylphenyl-label 0.0 0.0 Na na Na 92.2 6.5 98.6 0.0 Na Nas Na 98.8 6.6 105.4 0.7 1.6 0.0 0.0 0.0 77.9 22.0 99.9 1.8 0.0 0.0 0.0 79.7 20.1 99.8 3.8 8.2 0.0 1.6 0.1 46.0 37.7 85.4 9.5 0.0 0.1 0.0 50.5 41.6 92.2 6.8 15.4 0.3 0.0 0.4 53.5 33.0 87.2 17.7 0.0 1.3 0.7 34.4 44.9 81.4 10.8 24.5 0.0 0.7 0.7 39.2 44.0 84.7 28.3 0.0 0.6 0.8 45.2 47.7 94.4 14.7 32.6 0.1 1.8 1.7 37.4 45.6 86.7 37.6 0.0 2.5 1.6 41.9 44.6 90.6 Benzoyl-label 0.0 0.0 na Na Na 97.1 6.6 103.7 0.0 na Na Na 98.5 5.3 103.8 0.9 2.2 0.0 0.0 0.0 82.3 19.0 101.4 2.3 0.0 0.0 0.0 79.6 25.0 104.7 2.8 7.2 0.0 0.0 0.0 79.4 21.0 100.5 7.4 0.0 0.1 0.0 78.1 19.7 97.9 5.8 14.8 0.0 0.4 0.1 74.0 25.5 100.1 14.6 0.0 0.3 0.1 76.0 23.1 99.4 9.8 25.5 0.0 0.4 0.1 72.6 25.1 98.2 24.1 0.0 0.5 0.3 75.0 23.3 99.1 13.8 35.0 0.0 0.3 0.0 73.5 22.8 96.6 35.9 0.0 0.3 0.2 71.8 24.5 96.8
Na = Not applicable a 0.9 to 4.2% AR remained in aqueous phase after partitioning (butylphenyl-label) and 0.8 to 21.6% AR remained (benzoyl-label) increasing trend with time. b summer, 40 °N

Cyflumetofen 213
Table 33 Distribution of radioactivity in dark controls treated with butylphenyl- and benzoyl-label
Time d
% AR
PUF CO2 residue in soda lime extracted a Unextracted mass balance
Butylphenyl-label 0.0 na Na na 95.5 6.5 102.0 0.7 0.0 0.0 0.0 73.4 27.7 101.1 3.8 0.1 0.0 0.0 49.8 42.2 92.1 6.8 0.0 0.2 0.0 47.5 44.1 91.8 10.8 0.0 0.6 0.0 47.5 39.1 87.2 14.7 0.0 0.5 0.3 46.2 45.0 92.1 Benzoyl-label 0.0 na na na 97.8 5.9 103.8 0.9 0.0 0.0 0.0 74.8 21.6 96.4 2.8 0.0 0.0 0.0 61.3 37.2 98.6 5.8 0.0 0.0 0.0 56.4 40.0 96.4 9.8 0.0 0.0 0.0 59.8 38.2 98.0 13.8 0.0 0.0 0.0 58.7 38.7 97.5
na = Not applicable a 0.9 to 3.8% AR remained in aqueous phase after partitioning (butylphenyl-label) and 0.8 to 19.4% AR remained (benzoyl-label) increasing trend with time.
Table 34a Identification of radioactivity in irradiated soil and dark controls treated with butylphenyl-label
Time d
Time natural sunlight d
% AR Parent 14.5–14.8 min
Met 2 6.8-6.9 min
Met 9 b 17.1–17.4 min
Met 10 19.1–19.5 min
Met 11 c 20.8–21.1 min
Met 12 d 21.4–21.7 min
Sum of others a
Butylphenyl-label 0.0 0.0 47.9 0.3 0.5 0.1 0.0 0.0 1.8 0.0 79.7 0.4 0.6 0.2 0.0 0.0 2.6 0.7 1.6 53.0 4.7 1.6 1.5 1.2 1.0 6.7 1.8 59.4 1.7 3.6 2.2 1.3 1.4 3.9 3.8 8.2 16.3 2.9 2.3 2.6 2.9 2.6 6.7 9.5 12.1 17.7 2.7 2.6 2.8 2.3 3.5 6.8 15.4 11.5 9.5 9.6 7.8 2.5 2.1 3.3 17.7 4.5 2.1 2.5 1.3 1.4 1.1 14.8 10.8 24.5 4.8 5.1 3.6 3.9 3.2 2.8 10.4 28.3 6.5 8.8 6.4 4.8 2.5 2.2 3.6 14.7 32.6 3.2 3.2 2.9 4.4 4.2 4.8 8.5 37.6 4.4 8.9 2.4 3.6 4.6 3.9 6.6 0.7 Dark 48.4 1.4 2.9 2.1 1.0 0.9 3.0 Dark 60.0 1.7 3.5 2.6 1.5 1.2 1.1 3.8 Dark 13.7 4.5 3.9 4.9 4.3 3.7 8.5 Dark 14.6 4.4 4.5 5.4 4.8 3.9 8.7 6.8 Dark 7.7 4.5 3.6 4.5 4.6 3.5 8.8 Dark 8.5 4.6 3.9 5.0 5.2 3.9 9.5 10.8 Dark 8.6 3.2 5.6 6.4 6.2 5.2 8.5 Dark 3.2 5.7 4.0 4.4 3.0 3.0 6.9 14.7 Dark 5.0 1.1 7.4 7.0 6.1 4.5 7.3 Dark 5.9 3.8 5.0 6.0 5.4 4.5 9.2
Table 34b Identification of radioactivity in irradiated soil and dark controls treated with benzoyl-label
Time in Suntest (d)
Time natural sunlight (days)
% AR Parent 14.3–14.7 min
Met 4 4.3–4.5 min e, f
Met 9 13.7–13.9 min g
Sum of other metabolites
Benzoyl-label 0.0 0.0 91.2 2.4 0.0 0.0 0.0 91.8

214 Cyflumetofen
Time in Suntest (d)
Time natural sunlight (days)
% AR Parent 14.3–14.7 min
Met 4 4.3–4.5 min e, f
Met 9 13.7–13.9 min g
Sum of other metabolites
Benzoyl-label 0.9 2.2 46.3 17.6 5.2 4.8 2.3 45.8 2.8 7.2 29.9 31.7 3.4 11.1 7.4 23.5 5.8 14.8 9.1 47.6 2.5 9.4 14.6 13.4 9.8 25.5 6.6 39.4 5.7 14.0 24.1 3.6 13.8 35.0 4.8 32.7 4.6 13.5 h 35.9 3.0 0.9 dark 57.1 16.0 0.0 2.8 dark 62.4 2.8 dark 18.2 30.9 0.0 9.1 dark 17.8 5.8 dark 7.9 32.4 0.0 7.5 dark 9.4 9.8 dark 8.0 36.1 0.0 7.2 dark 8.7 13.8 dark 5.7 37.7 0.0 7.7 dark 11.5
a Each individual peak, < 5% of applied b Match with AB-11 based on retention time c Match with AB-12 based on retention time d Match with AB-13 based on retention time e Sum of activity in concentrated extract and aqueous residue f Match with B-1 based on retention time g Match with AB-8 based on retention time h Each individual peak < 5% of applied i Each individual peak < 5% of applied, except one metabolite (Met 11) with retention time 19.0–19.2 min (≤ 5.9% of applied)
Single first order DT50 and DT90 values (in natural sunlight equivalent days) for irradiated soil and dark controls are presented in Tables 23–29. The results indicated there is no difference between the DT50s in irradiated soils and dark controls.
Table 35 Half-lives for degradation of cyflumetofen in irradiated soil and dark controls
System M0 %
K days-1
DT50 days
DT90 days r2 χ2 Number of
data pointsButylphenyl-label
irradiated soil 99.1 ± 4.5 0.673 ± 0.101 1.0 3.4 0.972 13.37 12
dark control 99.3 ± 5.1 0.729 ± 0.123 0.95 3.2 0.965 14.95 12
Benzoyl-label
Irradiated soil 86.7 ± 4.5 0.480 ± 0.063 1.4 4.8 0.960 15.4 12
Dark control 91.8 ± 4.0 0.502 ± 0.056 1.4 4.6 0.970 12.9 12
In conclusion, photolytic degradation on soil surfaces is not expected to play a role in the overall fate of cyflumetofen residues in soil, regardless of radio-labelled cyflumetofen used.
Hydrolytic degradation in aquatic systems (Nakamura, 2004a)
Portions of 2.5 mL butylphenyl- or benzoyl-label cyflumetofen in acetonitrile were added to 250 mL sterilized, deoxygenated buffer solutions of pH 4, 5, 7 and 9 at a concentration of 0.1 mg/L. The fortified buffer solutions were incubated in the dark at 25 1 °C for 30 days (pH 4, 5 and 7), 10 days (pH 7, benzoyl-label) or 1 day (pH 9). Sterility and pH were checked at the beginning and end of the

Cyflumetofen 215
incubation period. Samples were taken at various time points. Immediately after sampling, the pH 7 and pH 9 samples were acidified (acetic acid) to slow hydrolysis. Samples were partitioned into an organic phase (acetonitrile) and aqueous phase by C18- SPE. Radioactivity was determined by LSC and the organic phase was subjected to chromatographic analysis (HPLC-RAM, TLC, LC-MS). The aqueous phase for the final sampling point and selected sampling points of benzoyl-label incubations was acidified (HCl) and subjected to PLS-2 SPE. Radioactivity in organic and aqueous phases was determined by LSC. The resulting organic phase (acetonitrile) was subjected to analysis using HPLC-RAM. Metabolite identification was done by comparison of retention times of HPLC, running factors (TLC) and MS spectra (LC-MS ion-trap) with reference standards of metabolites (A1, B1, AB-1, A-18). Metabolites for which no references were available were identified by LC-MS (ion-trap). Hydrolytic half-lives for cyflumetofen were calculated by linear regression using first order kinetics.
The mean total recovery for butylphenyl-label was 94.2 to 103.5% of applied radioactivity and that for benzoyl-label was 97.6 to 102.2%.
Degradation of cyflumetofen and its identified degradates at pH 4–9 at 25 °C are shown in the following Tables. Hydrolysis was fastest at pH 9 and slower in lower pH.
The degradation products of hydrolysis exceeding 10% of the applied radioactivity were A-1 (max 14.44% AR at pH 5–7), A-2 (max 44.12% AR at pH 5–7), A-18 (max 36.22% AR at pH 5–7), AB-1 (max 44.51% AR at pH 5–7) and B-1 (max 53.17% AR at pH 5–7). Other unknown fractions were all 7.76% AR, with the exception of BU14: 11.39% AR (pH 5, benzoyl-label). This fraction was identical to AU14 (pH 5, butylphenyl-label). When taking the average of the butylphenyl- and benzoyl-label incubations at pH 5, also this fraction was < 10% AR at all time points.
Table 36 Distribution of radioactivity after hydrolysis of butylphenyl- and benzoyl-label cyflumetofen at pH 4 at 25 °C
Time, d Butylphenyl-label, % of applied Benzoyl-label, % of applied Organic Aqueous Mass balance Organic Aqueous Mass balance
0 97.66 nd 97.66 99.05 1.52 100.57 1 98.15 nd 98.15 92.04 6.13 98.17 3 97.36 nd 97.36 87.01 14.11 101.12 7 99.04 nd 99.04 73.46 25.11 98.56 14 99.55 nd 99.55 61.61 38.55 100.16 21 99.07 nd 99.07 54.25 43.99 98.24 30 98.24 nd 98.24 51.76 48.40 100.16 nd = Not detected
Table 37 Distribution of radioactivity after hydrolysis of butylphenyl- and benzoyl-label cyflumetofen at pH 5 at 25 °C
Time, d Butylphenyl-label, % of applied Benzoyl-label, % of applied Organic Aqueous Mass balance Organic Aqueous Mass balance
0 94.15 nd 94.15 100.76 1.39 102.15 1 97.39 nd 97.39 90.49 7.13 97.62 3 100.53 nd 100.83 82.13 17.57 99.70 7 99.82 0.76 100.59 68.79 31.48 100.27 14 98.53 1.07 99.60 57.35 43.54 100.89 21 96.29 1.16 97.46 49.52 49.61 99.14 30 96.32 1.22 97.54 47.70 51.86 99.56 Nd = Not detected
Table 38 Distribution of radioactivity after hydrolysis of butylphenyl- and benzoyl-label cyflumetofen at pH 7 at 25 °C
Time, d Butylphenyl-label, % of applied Benzoyl-label, % of applied Organic Aqueous Mass balance Organic Aqueous Mass balance
0 98.92 nd 98.92 98.06 1.85 99.91 0.08 (2 h) 99.26 nd 99.26 92.39 8.90 101.29

216 Cyflumetofen
Time, d Butylphenyl-label, % of applied Benzoyl-label, % of applied Organic Aqueous Mass balance Organic Aqueous Mass balance
0.33 (8 h) 98.92 nd 98.92 74.96 25.34 100.29 1 98.22 0.90 99.12 55.66 44.80 100.46 2 101.78 0.79 102.57 47.80 52.43 100.22 5 101.00 0.87 101.87 47.18 53.11 100.29 10 100.49 nd 100.49 48.03 52.85 100.88 30 100.83 nd 100.83 – – – nd = Not detected
Table 39 Distribution of radioactivity after hydrolysis of butylphenyl- and benzoyl-label cyflumetofen at pH 9 at 25 °C
Time, min Butylphenyl-label, % of applied Benzoyl-label, % of applied Organic Aqueous Mass balance Organic Aqueous Mass balance
0 101.26 nd 101.26 97.86 1.98 99.84 5 100.19 nd 100.19 79.79 20.79 100.58 15 100.56 nd 100.56 62.37 38.46 100.83 30 100.02 nd 100.02 55.61 45.79 101.40 45 101.25 nd 101.25 55.81 45.01 100.81 90 101.70 nd 101.70 52.57 48.05 100.62 1440 102.45 1.02 103.47 50.29 50.31 100.61 Nd = Not detected
Table 40 Identification of radioactivity after hydrolysis of butylphenyl-label or benzoyl-label cyflumetofen at pH 4 at 25 °C
Time, d % of applied Parent A-1 A-2 A-18 AB-1 AU16 UNK 1 UNK 2 UNK 3
Butylphenyl-label 0 93.79 Nd Nd 1.97 nd nd nd Nd 1 90.73 4.63 Nd Nd nd nd nd Nd 3 71.89 12.79 Nd Nd 11.90 nd nd nd Nd 7 48.46 20.78 2.46 2.55 19.51 2.79 nd nd Nd 14 26.93 24.89 8.67 6.10 22.23 6.56 2.36 nd Nd 21 14.87 26.94 8.60 10.28 30.92 4.90 nd nd Nd 30 6.26 21.03 14.55 12.63 34.80 5.53 nd 1.15 1.47 Nd = Not detected
Time, d % of applied
Parent B-1 AB-1 UNK 1 (BU16) UNK 2 UNK 3 UNK 4
Benzoyl-label 0 97.43 1.52 Nd Nd nd nd nd 1 88.62 6.13 2.56 Nd nd nd nd 3 73.69 14.11 12.49 Nd nd nd nd 7 48.95 25.90 13.62 4.78 2.50 1.87 nd 14 24.61 40.56 22.59 6.25 3.12 nd 2.30 21 15.18 44.80 29.80 7.76 nd nd nd 30 6.50 48.40 34.17 6.39 3.53 nd nd Nd = Not detected
Table 41 Identification of radioactivity after hydrolysis of butylphenyl-label or benzoyl-label cyflumetofen at pH 5 at 25 °C
Time, d
% of applied
Parent A-1 A-2 A-18 AB-1 AU16 AU17 UNK 1 (AU14) UNK 2 UNK 3 UNK 4
Butylphenyl-label 0 94.15 nd nd nd Nd nd nd nd nd nd

Cyflumetofen 217
Time, d
% of applied
Parent A-1 A-2 A-18 AB-1 AU16 AU17 UNK 1 (AU14) UNK 2 UNK 3 UNK 4
1 85.38 6.00 nd 3.73 nd nd nd nd nd nd 3 71.78 9.89 1.35 nd 9.03 2.15 3.08 nd nd nd nd 7 45.34 10.02 6.38 4.35 16.19 5.67 5.86 4.06 nd nd nd 14 18.91 5.73 7.62 8.04 23.67 11.97 13.60 4.16 nd nd 4.83 21 8.71 0.89 14.12 8.63 18.72 15.19 17.62 3.71 1.31 1.92 5.46 30 5.15 0.51 12.41 7.37 19.93 15.78 21.09 3.82 nd 2.81 7.46 Nd = Not detected AU14 = BU14 (pH5)
Time, d % of applied
Parent B-1 AB-1 BU17 UNK 1 (BU14) UNK 2 UNK 3 UNK 4 UNK 5
Benzoyl-label 0 99.99 1.39 nd nd nd nd nd nd nd 1 82.89 8.23 3.14 nd 3.36 nd nd nd nd 3 68.76 17.57 8.60 1.64 3.14 nd nd nd nd 7 43.02 31.48 8.89 3.09 7.05 2.64 nd 2.55 nd 14 19.14 43.54 20.61 4.87 11.39 nd nd nd nd 21 8.70 49.61 15.83 7.50 3.23 2.93 2.36 5.98 3.00 30 2.85 52.62 23.35 9.55 5.35 2.51 nd nd 3.33 Nd = Not detected BU14 = AU14 (pH5)
Table 42 Identification of radioactivity after hydrolysis of butylphenyl-label or benzoyl-label cyflumetofen at pH 7 at 25 °C
Time, h % of applied
Parent A-1 A-2 A-18 AB-1 UNK 1 (AU16) Others
Butylphenyl-label 0 97.95 nd nd nd nd nd 2 82.29 7.48 nd 3.33 1.75 nd 8 53.31 14.44 3.62 6.53 12.91 4.01 2.48 24 19.02 9.85 15.70 17.94 29.58 3.95 nd 48 6.32 1.95 14.64 32.91 36.44 4.91 1.99 120 Nd 0.22 19.12 36.22 44.51 nd nd 240 Nd 24.30 31.98 41.61 2.60 nd 720 Nd 44.12 10.85 36.96 5.03 nd Nd = Not detected
Time, h % of applied Parent B-1 AB-1 UNK 1 (BU16) Others
Benzoyl-label 0 98.06 1.85 nd nd Nd 2 86.97 8.90 2.38 nd Nd 8 55.81 25.34 15.91 2.39 Nd 24 16.83 44.80 30.59 5.57 Nd 48 3.29 53.17 38.37 2.80 Nd 120 Nd 53.11 40.00 3.02 2.54 240 Nd 52.85 41.18 1.92 1.92 nd: not detected

218 Cyflumetofen
Table 43 Identification of radioactivity after hydrolysis of butylphenyl-label or benzoyl-label cyflumetofen at pH 9 at 25 °C
Time, min % of applied
Parent A-1 A-2 A-18 AB-1 UNK 1 (AU16) Others
Butylphenyl-label 0 101.26 Nd nd nd nd nd 5 64.94 17.48 nd 2.01 13.29 nd nd 15 26.87 28.27 3.66 7.22 26.02 4.13 3.15 30 16.46 24.77 6.16 11.74 35.99 2.73 nd 45 9.02 27.90 nd 20.98 40.27 3.08 nd 90 Nd 3.70 15.05 33.66 39.60 4.16 2.87 1440 Nd nd 6.17 48.80 44.75 nd nd Nd = Not detected
Time, min % of applied Parent B-1 AB-1 Others UNK 1
Benzoyl-label 0 97.86 1.98 nd nd nd 5 63.14 20.79 16.65 nd nd 15 25.88 38.46 33.11 nd nd 30 10.08 47.39 43.16 nd nd 45 11.53 46.75 34.48 1.67 3.69 90 5.58 48.05 41.85 3.07 nd 1440 Nd 50.31 45.68 nd nd Nd = Not detected
Table 44 Kinetic parameters for hydrolysis of cyflumetofen in aqueous buffer solutions of pH 4, 5, 7 and 9 at 25 °C
Test DT50 DT90 first order equation r2
pH4 Butylphenyl-label 7.7 d 25.6 d lnC = -0.09008t + ln(95.0235) 0.9991 Benzoyl-label 7.7 d 25.6 d lnC = -0.08980t + ln(94.9601) 0.9977 Mean 7.7 d 25.6 d pH 5 Butylphenyl-label 6.0 d 20.0 d lnC = -0.11504t + ln(97.4473) 0.9988 Benzoyl-label 6.0 d 20.0 d lnC = -0.11496t + ln(96.5132) 0.9994 Mean 6.0 d 20.0 d pH 7 Butylphenyl-label 10.3 h 34.1 h lnC = -0.06751 + ln(94.9138) 0.9984 Benzoyl-label 9.4 h 31.1 h lnC = -0.07395t + ln(99.7485) 0.9997 Mean 9.8 h 32.6 h pH9 Butylphenyl-label 11.5 min 38.0 min lnC = -0.06053t + ln(88.0009) 0.9428 Benzoyl-label 9.1 min 30.4 min lnC = -0.07583t + ln(91.9483) 0.9918 Mean 10.3 min 34.2 min
Metabolism and Distribution in Succeeding Crops
Confined Rotational Crop Study (Grosshans et al., 2011a)
A confined rotational crop study was conducted with benzoyl- and butylphenyl-label cyflumetofen. The active substance was applied to bare sandy loam soil in plastic containers (40 cm × 60 cm) at an application rate of 1 × 400 g ai/ha using an automatic spray track system. After the soil aging periods, ploughing was simulated by mixing the treated and untreated soil layers using a spade before replanting. The nature and the quantities of the radioactive residues were investigated in lettuce (immature and mature), white radish (top and root) and spring wheat (forage, hay, straw, chaff and

Cyflumetofen 219
grain) after plant back intervals (PBI) of 30, 120 and 365 days. They are cultivated under natural climatic conditions but protected from rain. Plant samples were harvested at maturity, and additional immature lettuce samples as well as spring wheat forage samples (in part dried to hay) were taken 26 to 39 days and 47 to 62 days after planting or sowing, respectively. Soil samples were taken after application, after ploughing and after harvest of the mature crops for each plant back interval.
Mature and immature lettuce leaves were sampled with the roots remaining in the soil. Ripe white radishes were pulled from the soil and separated into the root and the remaining green parts (top). Immature green plants of spring wheat were sampled (wheat forage) and partly dried to wheat hay. Furthermore, ears of mature wheat and straw were cut off with scissors. Afterwards, ears were separated into chaff and grain using a thresher. For the plant back intervals of 120 and 356 DAT (benzoyl-label), chaff and straw samples were combined. For the butylphenyl-label, chaff and straw samples were generally combined. Soil samples were taken after application into petri dishes, after the individual plant back intervals and after harvest of the mature crops.
All samples were stored in a freezer at -18 °C or below, immediately after they were taken and until they were transferred to the laboratory. The storage conditions remained constant until analysis started and during the whole period of the study. Lettuce, radish and wheat forage and hay samples were homogenized with dry ice using a planetary mill or a blender. Samples of wheat hay, wheat straw and wheat straw + chaff were also frozen in liquid nitrogen and generally homogenized using a meat grinder. Individual hay samples were frozen and coarsely cut prior to homogenization with the meat grinder or homogenized with the blender. Samples of wheat grain and chaff were frozen in liquid nitrogen or dry ice and homogenized using a centrifugal grinding mill or with the blender (grain 365 PBI).
The radioactive residues in homogenized plant or soil samples were determined by oxidative combustion of small aliquots using LSC. Weighed subsamples of homogenized plant material were extracted three times with a sufficient volume of acetonitrile using a Polytron blender and the radioactivity was determined (LSC). Subsamples of spring wheat hay, straw and chaff were soaked in water before extraction. The residues were further extracted with appropriate volumes of water (two times). The water extracts were also radioassayed. The results of the acetonitrile and the water extraction were summed and referred to as extractable radioactive residues (ERR). The residue after solvent extraction (acetonitrile and water) of each sample was dried at room temperature under a fume hood, homogenized and aliquots were combusted for the determination of the residual radioactive residue (RRR). The total radioactive residues (TRR) were the result of the combustion analyses or the calculated sum of ERR and RRR values.
The residual radioactive residues of spring wheat hay, straw, chaff and grain (plant back interval of 30 days in the case of the benzoyl-label, plant back intervals of 120 and 365 days in the case of the butylphenyl-label) were further characterized using sequential solubilisation procedures. In the case of the benzoyl-label, the first solubilisation step with aqueous ammonia solution was also applied for the other rotational crop matrices. The residues from spring wheat hay, straw, chaff and grain after ammonia solubilisation (both labels) were subjected to two consecutive solubilisation steps applying the following hydrolysing enzymes: macerozyme/cellulase and amylase/amyloglucosidase. In the case of the benzoyl-label (30 PBI), the incubations with enzymes were followed by two non-selective solubilisation steps with hydrochloric acid.
The nature of the radioactive residues in the acetonitrile and aqueous extracts (with a sufficient level of radioactivity) as well as solubilizates (from RRR matrices, only spring wheat grain 30 PBI, benzoyl-label) of individual matrices of the different crops and labels was investigated using different HPLC methods with radio-detection. Peak assignment and identification of degradates in extracts was done by comparison of the retention times and the elution profiles/degradate patterns of extracts with reference items in at least two different HPLC methods. Further information for the identification of degradates in the case of the benzoyl-label was obtained from GC-MS or LC-MS analyses. In addition, 14C-labelled reference items were combined with selected extracts for co-chromatography to identify the degradates unequivocally.

220 Cyflumetofen
Following the spray application of cyflumetofen to soil at an application rate of 1 × 0.40 kg ai/ha, the total radioactive residues (TRR) were measured. They were significantly higher after application of the benzoyl-label compared to the butylphenyl-label for all rotational crop matrices, except for spring wheat grain for the plant back intervals of 120 and 365 days.
The residue concentrations in lettuce (immature and mature samples) did not exceed 0.057 mg eq/kg or 0.018 mg eq/kg for all plant back intervals for the benzoyl- and the butylphenyl-label, respectively.
The TRR in white radish root in the case of the benzoyl-label decreased from 0.027 to 0.008 mg eq/kg with increasing soil aging period, whereas in white radish top, the residue levels were slightly higher (decreasing from 0.137 to 0.036 mg eq/kg). In the case of the butylphenyl-label, all residue concentrations in white radish were below 0.010 mg eq/kg.
In spring wheat, the highest residue levels were measured in chaff (benzoyl-label, 30 PBI: 1.271 mg eq/kg), straw (benzoyl-label, 30 PBI: 0.484 mg eq/kg), straw + chaff (0.259 and 0.058 mg eq/kg for the benzoyl-label, 120 and 365 PBI; 0.027 to 0.107 mg eq/kg for the butylphenyl-label) and hay (decreasing from 0.636 to 0.053 mg eq/kg for the benzoyl-label and ranging from 0.016 to 0.086 mg eq/kg for the butylphenyl-label). The total radioactive residues in wheat forage decreased from 0.133 to 0.004 mg eq/kg in the case of the benzoyl-label and were around 0.010 mg eq/kg in the case of the butylphenyl-label. The total radioactive residues in wheat grain accounted for 0.021 to 0.166 mg eq/kg for the benzoyl-label and < 0.010 to 0.063 mg eq/kg for the butylphenyl-label.
The residue concentrations in the top soil layer after aging and ploughing stayed largely stable (plant back intervals 30, 120 and 365 PBI) for the benzoyl- (0.054 to 0.064 mg eq/kg) and butylphenyl-label (0.062 to 0.075 mg eq/kg). The residue levels in soil after harvest of the mature crops also remained more or less stable for both labels, ranging from 0.020 to 0.089 mg eq/kg (benzoyl-label) and from 0.033 to 0.090 mg eq/kg for the butylphenyl-label.
Table 45 Total radioactive residues in rotational crop matrices following cultivation in soil treated with benzoyl-label cyflumetofen after plant back intervals of 30, 120 and 365 days
Crop parts Combustion value mg eq/kg TRR calculated mg eq/kg a
Plant back interval: 30 DAT Immature lettuce (35 DAP b) 0.059 0.057 Mature lettuce (48 DAP) 0.056 0.057 White radish root (70 DAP) 0.032 0.027 White radish top (70 DAP) 0.150 0.137 Spring wheat forage (54 DAP) 0.148 0.133 Spring wheat hay (54 DAP) 0.704 0.636 Spring wheat straw (103 DAP) 0.450 0.484 Spring wheat chaff (103 DAP) 1.249 1.271 Spring wheat grain (103 DAP) 0.170 0.166 Plant back interval: 120 DAT Immature lettuce (36 DAP) 0.031 0.040 Mature lettuce (50 DAP) 0.022 0.021 White radish root (65 DAP) 0.012 0.025 White radish top (65 DAP) 0.070 0.066 Spring wheat forage (58 DAP) 0.058 0.058 Spring wheat hay (58 DAP) 0.307 0.316 Spring wheat straw + chaff (107 DAP) 0.243 0.259 Spring wheat grain (107 DAP) 0.048 0.045 Plant back interval: 365 DAT Immature lettuce (31 DAP) 0.041 0.038 Mature lettuce (51 DAP) 0.021 0.018 White radish root (71 DAP) 0.007 0.008 White radish top (71 DAP) 0.044 0.036

Cyflumetofen 221
Crop parts Combustion value mg eq/kg TRR calculated mg eq/kg a
Spring wheat forage (62 DAP) 0.010 0.004 Spring wheat hay (62 DAP) 0.065 0.053 Spring wheat straw + chaff (114 DAP) 0.056 0.058 Spring wheat grain (114 DAP) 0.020 0.021
a Sum of ERR (acetonitrile extract and water extract) and RRR (extraction residue) b Days after planting
Table 46 Total radioactive residues in rotational crop matrices following cultivation in soil treated with butylphenyl-label cyflumetofen after plant back intervals of 30, 120 and 365 days
Crop parts Combustion value mg eq/kg TRR calculated mg eq/kg a Plant back interval: 30 DAT Immature lettuce (26 DAP b) 0.021 0.018 Mature lettuce (53 DAP) 0.006 n. d White radish root (74 DAP) 0.001 n. d. White radish top (74 DAP) 0.005 n. d. Spring wheat forage (60 DAP) 0.006 n. d. Spring wheat hay (60 DAP) 0.022 0.016 Spring wheat straw + chaff (102 DAP) 0.028 0.027 Spring wheat grain (102 DAP) 0.008 n. d. Plant back interval: 120 DAT Immature lettuce (27 DAP) 0.006 n. d. Mature lettuce (48 DAP) 0.004 n. d. White radish root (69 DAP) 0.004 n. d. White radish top (69 DAP) 0.009 n. d. Spring wheat forage (47 DAP) 0.015 0.013 Spring wheat hay (47 DAP) 0.081 0.086 Spring wheat straw + chaff (111 DAP) 0.107 0.107 Spring wheat grain (111 DAP) 0.058 0.063 Plant back interval: 365 DAT Immature lettuce (39 DAP) 0.004 n. d. Mature lettuce (55 DAP) 0.003 n. d. Mature lettuce small-sized (55 DAP) 0.003 n. d. White radish root (75 DAP) 0.002 n. d. White radish top (75 DAP) 0.005 n. d. Spring wheat forage (50 DAP) 0.006 n. d. Spring wheat hay (50 DAP) 0.020 0.017 Spring wheat straw + chaff (98 DAP) 0.030 0.027 Spring wheat grain (98 DAP) 0.030 0.031
a Sum of ERR (acetonitrile extract and water extract) and RRR (extraction residue) b Days after planting n. d. = not determined (due to the low residue concentrations, no extraction was performed)
Table 47 Total radioactive residues in soil samples following treatment with benzoyl-label cyflumetofen and plant back intervals of 30, 120 and 365 days
Soil samples (Days After Treatment DAT)
TRR mg eq/kg determined by direct combustion
After application (petri dishes) (0 DAT) 3.854 Plant back interval: 30 DAT After Ploughing (30 DAT) 0.065 After harvest of mature crops Lettuce (78 DAT) 0.042 White radish (100 DAT) 0.056 Spring wheat (133 DAT) 0.078 Plant back interval: 120 DAT

222 Cyflumetofen
Soil samples (Days After Treatment DAT)
TRR mg eq/kg determined by direct combustion
After Ploughing (120 DAT) 0.064 After harvest of mature crops Lettuce (170 DAT) 0.020 White radish (185 DAT) 0.042 Spring wheat (227 DAT) 0.089 Plant back interval: 365 DAT After Ploughing (365 DAT) 0.054 After harvest of mature crops Lettuce (416 DAT) 0.067 White radish (436 DAT) 0.063 Spring wheat (479 DAT) 0.052
Table 48 Total radioactive residues in soil samples following treatment with butylphenyl-label cyflumetofen and plant back intervals of 30, 120 and 365 days
Soil samples (Days After Treatment DAT)
TRR mg eq/kg determined by direct combustion
After application (petri dishes) (0 DAT) 4.580 Plant back interval: 30 DAT After Ploughing (30 DAT) 0.075 After harvest of mature crops Lettuce (83 DAT) 0.083 White radish (104 DAT) 0.045 Spring wheat (132 DAT) 0.085 Plant back interval: 120 DAT After Ploughing (120 DAT) 0.070 After harvest of mature crops Lettuce (168 DAT) 0.033 White radish (189 DAT) 0.071 Spring wheat (231 DAT) 0.090 Plant back interval: 365 DAT After Ploughing (365 DAT) 0.062 After harvest of mature crops Lettuce (420 DAT) 0.066 Lettuce small-sized (420 DAT) 0.069 White radish (440 DAT) 0.035 Spring wheat (463 DAT) 0.066
The extractability of the radioactive residues with acetonitrile and water in the case of the benzoyl-label was equal to or above 75% of the TRR for all rotational crop matrices, except for wheat forage (365 PBI: 66.1% TRR) and wheat grain (30 and 365 PBI: 45.9% to 66.7% TRR). In the case of the butylphenyl-label, the extractability of the radioactive residues was notably lower, accounting for 57.9% TRR for immature lettuce (30 PBI), 35.8% to 65.7% TRR for wheat forage, hay and straw + chaff and 18.8% to 20.4% TRR for wheat grain. For both labels, the main portions of the radioactive residues were generally extracted with acetonitrile, except for spring wheat grain where only low portions were extracted with acetonitrile.

Cyflumetofen 223
Liquid/liquid partition of the acetonitrile extracts of immature lettuce, spring wheat hay and spring wheat straw + chaff between ethyl acetate and water (performed in the case of the butylphenyl-label only) yielded the main portions of the residues (22.6% to 46.1% TRR) in the organosoluble fraction and minor portions (11.7% to 20.1% TRR) in the water phase.
In the case of the benzoyl-label, the radioactive residues in the extracts of all rotational crop matrices mainly consisted of a medium polar component which was identified as trifluoroacetic acid (38.6% to 105.3% TRR, ranging from 0.004 to 1.076 mg eq/kg). In addition, in spring wheat grain 30 PBI, the main degradate trifluoroacetic acid was accompanied by minor amounts of the degradate B-1 (< 0.001 mg eq/kg or 0.2% TRR in the acetonitrile extract) and a peak representing one or several non-polar components, possibly including the unchanged parent molecule (present in both extracts, 0.006 mg eq/kg or 4.1% TRR in sum). The degradates, trifluoroacetic acid and B-1, are only detectable with the benzoyl-label.
In the case of the butylphenyl-label, a series of label-specific degradates was observed in the samples prepared from the extracts, all in minor concentrations (each below 0.010 mg eq/kg, only one non-polar derivative in immature lettuce (30 PBI, 11.6% TRR) and one medium polar component in wheat hay (120 PBI, 10.2% TRR) were above 10% of the TRR. The main portion of the extracted and analysed radioactive residues in all matrices except wheat grain was composed of medium polar derivatives of cyflumetofen (up to 39.4% TRR in sum per matrix, up to twenty peaks per sample). These medium polar degradates eluted in the same range of polarity as the degradates in the goat urine sample, used as a reference item. Therefore, some of the medium polar degradates formed during metabolism of cyflumetofen in the lactating goat after hydrolytic cleavage of the parent molecule (e.g. hydroxylated derivatives of degradate A-2) or similar components may also be present in rotational crops. Besides the medium polar components, up to seven polar peaks were detected in the extractable radioactive residues (representing up to 14.9% TRR in sum per matrix), one non-polar derivative was found in immature lettuce (30 PBI, 11.6% TRR), and eleven non-polar peaks were observed in spring wheat straw and chaff (30 PBI, 6.8% TRR in sum). In the case of wheat grain (120 PBI), the radioactive residues in the water extract mainly consisted of polar components (4.8% TRR in sum), accompanied by minor amounts of medium polar components (0.5% TRR in sum). Since the absolute concentration of these minor degradates was < 0.01 mg eq/kg, no further characterization was deemed necessary.
The residual radioactive residues after solvent extraction of the matrices sampled after the plant back interval of 30 days ranged from a minimum of 11.0% TRR (white radish top) to a maximum of 54.1% TRR (spring wheat grain) for the benzoyl-label. Therefore, the residual radioactive residues from these matrices (30 PBI) were further characterized by treatment with an aqueous ammonia solution which solubilized portions of 1.5% to 2.4% TRR (except for wheat grain, where 15.1% TRR were solubilized). In the cases of spring wheat hay, straw, chaff and grain, the solubilisation with ammonia was followed by incubation with enzymes (macerozyme/cellulase and amylase/amyloglucosidase) and by homogenization or reflux with hydrochloric acid. The most effective solubilisation steps for most of the wheat matrices were the non-selective reflux with hydrochloric acid which released up to 7.3% TRR (spring wheat hay 30 PBI), followed by incubation with macerozyme/cellulase. In the case of wheat grain (30 PBI), treatment with macerozyme/cellulase solubilized 17.4% TRR, ammonia treatment released 15.1% TRR and incubation with amylases/amyloglucosidase was also quite effective and released 7.7% TRR. HPLC analysis of the ammonia solubilizate of wheat grain 30 DAT showed a degradate pattern similar to that of the water extract.
In the case of the butylphenyl-label, notable amounts of the radioactive residues of wheat hay, wheat straw + chaff and wheat grain (120 PBI and 365 PBI, 39.1% to 81.2% TRR) were not extracted with acetonitrile and water. The residual radioactive residues after solvent extraction of these matrices were therefore further characterized using a sequential solubilisation procedure including treatment with aqueous ammonia solution, macerozyme/cellulase and amylase/amyloglucosidase. The most effective solubilisation step was incubation with macerozyme/cellulase (releasing up to 20.4% TRR, wheat grain 365 PBI), except for wheat straw + chaff (365 PBI), where ammonia treatment was slightly more effective (solubilizing 6.5% TRR).

224 Cyflumetofen
The solubilized residues had possibly been associated with or embedded/incorporated in insoluble plant material (e.g. proteins, cell wall polymers and starch).
Table 49 Extraction of radioactive residues in rotational crop matrices following their cultivation in soil treated with benzoyl-label cyflumetofen after plant back intervals of 30, 120 and 365 days
Crop parts
Distribution of radioactive residues
TRR a Acetonitrile extract Water extract ERR a RRR a
mg eq/kg mg eq/kg % TRR mg eq/kg % TRR mg eq/kg % TRR mg eq/kg % TRR Plant back interval: 30 DAT Immature lettuce 0.057 0.048 83.6 0.002 2.7 0.049 86.3 0.008 13.7 Mature lettuce 0.057 0.046 79.4 0.002 4.3 0.048 83.7 0.009 16.3 White radish root 0.027 0.016 58.5 0.005 19.0 0.021 77.5 0.006 22.5 White radish root 0.036 0.022 61.6 0.005 14.3 0.027 75.9 0.009 24.1 White radish top 0.137 0.115 83.5 0.008 5.5 0.122 89.0 0.015 11.0 Spring wheat forage 0.133 0.099 74.5 0.007 5.3 0.106 79.8 0.027 20.2 Spring wheat hay 0.636 0.421 66.2 0.057 8.9 0.478 75.0 0.159 25.0 Spring wheat straw 0.484 0.362 74.8 0.029 6.1 0.391 80.9 0.093 19.1 Spring wheat chaff 1.271 1.027 80.8 0.054 4.2 1.081 85.0 0.190 15.0 Spring wheat grain 0.166 0.007 4.5 0.069 41.4 0.076 45.9 0.090 54.1 Spring wheat grain 0.156 0.009 5.5 0.072 46.2 0.080 51.7 0.075 48.3 Plant back interval: 120 DAT Immature lettuce 0.040 0.039 97.8 < 0.001 0.9 0.039 98.8 < 0.001 1.2 Mature lettuce 0.021 0.020 96.8 < 0.001 1.3 0.021 98.1 < 0.001 1.9 White radish root 0.025 0.024 94.2 0.001 2.4 0.024 96.6 0.001 3.4 White radish top 0.066 0.063 96.3 0.001 2.2 0.065 98.6 0.001 1.4 Spring wheat forage 0.058 0.054 93.7 0.002 4.0 0.057 97.7 0.001 2.3 Spring wheat hay 0.316 0.283 89.4 0.023 7.2 0.306 96.6 0.011 3.4 Spring wheat straw + chaff 0.259 0.243 93.9 0.010 3.9 0.253 97.7 0.006 2.3
Spring wheat grain 0.045 0.006 13.0 0.032 71.6 0.038 84.7 0.007 15.3 Plant back interval: 365 DAT Immature lettuce 0.038 0.036 95.2 0.001 2.2 0.037 97.4 0.001 2.6 Mature lettuce 0.018 0.017 93.4 < 0.001 2.6 0.017 96.0 0.001 4.0 White radish root 0.008 0.007 93.1 < 0.001 3.2 0.008 96.3 < 0.001 3.7 White radish top 0.036 0.034 94.4 0.001 2.8 0.035 97.2 0.001 2.8 Spring wheat forage 0.004 0.002 53.5 0.001 12.5 0.003 66.1 0.002 33.9 Spring wheat hay 0.053 0.038 70.8 0.005 9.7 0.043 80.5 0.010 19.5 Spring wheat straw + chaff 0.058 0.046 80.4 0.003 5.9 0.050 86.3 0.008 13.7
Spring wheat grain 0.021 0.003 12.0 0.012 54.7 0.014 66.7 0.007 33.3 a ERR = Extractable Radioactive Residue (acetonitrile extract and water extract), RRR = Residual (non-extractable) Radioactive Residue, TRR = sum of ERR and RRR
Table 50 Extraction of radioactive residues in rotational crop matrices following their cultivation in soil treated with butylphenyl-label cyflumetofen after plant back intervals of 30, 120 and 365 days
Crop parts
Distribution of radioactive residues
TRR a Acetonitrile extract Water extract ERR a RRR a
mg eq/kg mg eq/kg % TRR mg eq/kg % TRR mg eq/kg % TRR mg eq/kg % TRR Plant back interval: 30 DAT Immature lettuce 0.0179 0.0087 48.3 0.0017 9.6 0.0104 57.9 0.0076 42.1 Spring wheat hay 0.0159 0.0070 44.1 0.0011 7.0 0.0081 51.1 0.0078 48.9 Spring wheat straw + chaff 0.0270 0.0158 58.8 0.0019 7.0 0.0177 65.7 0.0092 34.3
Plant back interval: 120 DAT Spring wheat forage 0.0133 0.0041 30.6 0.0020 15.2 0.0061 45.8 0.0072 54.2

Cyflumetofen 225
Crop parts
Distribution of radioactive residues
TRR a Acetonitrile extract Water extract ERR a RRR a
mg eq/kg mg eq/kg % TRR mg eq/kg % TRR mg eq/kg % TRR mg eq/kg % TRR Spring wheat hay 0.0860 0.0415 48.2 0.0053 6.1 0.0468 54.4 0.0393 45.6 Spring wheat straw + chaff 0.1067 0.0524 49.1 0.0126 11.8 0.0650 60.9 0.0417 39.1
Spring wheat grain 0.0630 0.0003 0.5 0.0115 18.3 0.0119 18.8 0.0511 81.2 Plant back interval: 365 DAT Spring wheat hay 0.0172 0.0050 28.8 0.0012 7.1 0.0062 35.8 0.0110 64.2 Spring wheat straw + chaff 0.0272 0.0093 34.1 0.0023 8.5 0.0116 42.6 0.0156 57.4
Spring wheat grain 0.0311 0.0009 2.9 0.0054 17.5 0.0063 20.4 0.0248 79.6 a ERR = Extractable Radioactive Residue (acetonitrile extract and water extract), RRR = Residual (non-extractable) Radioactive Residue after solvent extraction, TRR = sum of ERR and RRR
Table 51 Identified components in rotational crop matrices following their cultivation in soil treated with benzoyl-label cyflumetofen after a plant back interval of 30 days
Component Crop parts Immature lettuce Mature lettuce White radish root White radish top mg eq/kg % TRR mg eq/kg % TRR mg eq/kg % TRR mg eq/kg % TRR
Plant back interval: 30 DAT Trifluoroacetic acid 0.050 87.8 0.043 75.2 0.014 38.6 0.106 77.4 Trifluoroacetic acid corrected a 0.075 mg/kg 0.065 mg/kg 0.021 mg/kg 0.159 mg/kg
Sum of identified components 0.050 87.8 0.043 75.2 0.014 38.6 0.106 77.4
Component
Crop parts Spring wheat forage Spring wheat hay Spring wheat
straw Spring wheat chaff Spring wheat grain b
mg eq/kg % TRR mg
eq/kg % TRR mg eq/kg % TRR mg
eq/kg % TRR mg eq/kg % TRR
Plant back interval: 30 DAT Trifluoroacetic acid 0.100 75.2 0.427 67.1 0.332 68.7 1.076 84.6 0.066 42.1 Trifluoroacetic acid Corrected a 0.150 mg/kg 0.641 mg/kg 0.498 mg/kg 1.614 mg/kg 0.099 mg/kg
B-1 n. d n. d. n. d. n. d. n. d. n. d. n. d. n. d. < 0.001 0.2 Sum of identified components 0.100 75.2 0.427 67.1 0.332 68.7 1.076 84.6 0.066 42.2
a Corrected mg/kg values referring to the calculation of the radioactivity and molecular mass of the degradate Trifluoroacetic Acid b In the case of spring wheat grain, the sum of identified components in the extractable and residual radioactive residues (ERR + RRR) is given; the degradate Trifluoroacetic Acid was identified in the extracts (0.057 mg/kg or 36.3% TRR in sum) and in the ammonia solubilizate (0.010 mg eq/kg or 5.7% TRR) n. d. = not detected
Table 52 Identified components in rotational crop matrices following their cultivation in soil treated with benzoyl-label cyflumetofen after a plant back interval of 120 days
Component Crop parts Immature lettuce Mature lettuce White radish root White radish top mg eq/kg % TRR mg eq/kg % TRR mg eq/kg % TRR mg eq/kg % TRR
Plant back interval: 120 DAT Trifluoroacetic acid 0.042 105.3 0.015 72.0 0.013 53.1 0.060 91.0 Trifluoroacetic acid Corrected a 0.063 mg/kg 0.023 mg/kg 0.020 mg/kg 0.090 mg/kg
Sum of identified components 0.042 105.3 0.015 72.0 0.013 53.1 0.060 91.0

226 Cyflumetofen
Component Crop parts Immature lettuce Mature lettuce White radish root White radish top mg eq/kg % TRR mg eq/kg % TRR mg eq/kg % TRR mg eq/kg % TRR
Component
Crop parts
Spring wheat forage Spring wheat hay Spring wheat straw + chaff Spring wheat grain
mg eq/kg % TRR mg eq/kg % TRR mg eq/kg % TRR mg eq/kg % TRR Plant back interval: 120 DAT Trifluoroacetic Acid 0.056 96.9 0.252 79.5 0.246 94.9 0.030 66.6 Trifluoroacetic Acid Corrected a 0.084 mg/kg 0.377 mg/kg 0.369 mg/kg 0.045 mg/kg
Sum of identified components 0.056 96.9 0.252 79.5 0.246 94.9 0.030 66.6
a Corrected mg/kg values referring to the calculation of the radioactivity and molecular mass of the degradate Trifluoroacetic Acid
Table 53 Identified components in rotational crop matrices following their cultivation in soil treated with benzoyl-label cyflumetofen after a plant back interval of 365 days
Component
Crop parts
Immature lettuce Mature lettuce White radish root White radish top
mg eq/kg % TRR mg
eq/kg % TRR mg eq/kg % TRR mg
eq/kg % TRR
Plant back interval: 365 DAT Trifluoroacetic Acid 0.038 100.5 0.014 78.3 0.004 44.8 0.037 103.4 Trifluoroacetic Acid Corrected a 0.058 mg/kg 0.021 mg/kg 0.005 mg/kg 0.056 mg/kg
Sum of identified components 0.038 100.5 0.014 78.3 0.004 44.8 0.037 103.4
Component
Crop parts
Spring wheat forage Spring wheat hay Spring wheat straw + chaff Spring wheat grain
mg eq/kg % TRR mg eq/kg % TRR mg eq/kg % TRR mg eq/kg % TRR Plant back interval: 365 DAT Trifluoroacetic Acid n. d. n. d. 0.027 51.1 0.027 46.6 0.011 52.6 Trifluoroacetic Acid Corrected a n. d. 0.041 mg/kg 0.040 mg/kg 0.017 mg/kg
Sum of identified components n. d. n. d. 0.027 51.1 0.027 46.6 0.011 52.6
a corrected mg/kg values referring to the calculation of the radioactivity and molecular mass of the degradate Trifluoroacetic acid n. d. = not detected
Table 54 Characterized radioactive residues (ERR a+RRR a) from rotational crop matrices following their cultivation in soil treated with butylphenyl-label cyflumetofen after a plant back interval of 30, 120 and 365 days
Characterized Radioactive Residues
Crop parts
Immature lettuce Spring wheat forage Spring wheat hay Spring wheat
straw + chaff Spring wheat grain
mg eq/kg % TRR mg
eq/kg % TRR mg eq/kg % TRR mg
eq/kg % TRR mg eq/kg % TRR
Plant back interval: 30 DAT Characterized from ERR by HPLC analysis 0.0079 44.3 no extraction 0.0087 54.3 0.0142 52.6 no extraction
Number of HPLC peaks up to 7 peaks up to 19 peaks up to 31 peaks Maximum HPLC peak 0.0021 11.6 b 0.0011 7.2 0.0018 6.7

Cyflumetofen 227
Characterized Radioactive Residues
Crop parts
Immature lettuce Spring wheat forage Spring wheat hay Spring wheat
straw + chaff Spring wheat grain
mg eq/kg % TRR mg
eq/kg % TRR mg eq/kg % TRR mg
eq/kg % TRR mg eq/kg % TRR
Characterized from ERR by Extraction / Work-up 0.0021 11.9 0.0014 9.0 0.0034 12.8
Characterized from RRR by Solubilization not applied not applied not applied
Total Characterized 0.0101 56.2 0.0101 63.3 0.0176 65.4 Plant back interval: 120 DAT Characterized from ERR by HPLC analysis no extraction not applied 0.0266 30.9 0.0443 41.5 0.0033 5.3
Number of HPLC peaks 2 x 2 peaks up to 19 peaks 7 peaks Maximum HPLC peak 0.0088 10.2 c 0.0095 8.9 0.0013 2.1 Characterized from ERR by Extraction / Work-up 0.0061 45.8 0.0085 9.9 0.0044 4.2 0.0058 9.2
Characterized from RRR by Solubilization not applied 0.0138 16.0 0.0107 10.0 0.0261 41.5
Total Characterized 0.0061 45.8 0.0489 56.8 d 0.0594 55.6 e 0.0353 56.0 Plant back interval: 365 DAT Characterized from ERR by HPLC analysis no extraction no extraction not applied not applied not applied
Characterized from ERR by Extraction / Work-up 0.0062 35.8 0.0116 42.6 0.0063 20.4
Characterized from RRR by Solubilization 0.0033 19.1 0.0040 14.8 0.0130 41.7
Total Characterized 0.0095 55.0 0.0156 57.4 0.0193 62.1 a ERR = Extractable Radioactive Residues (acetonitrile extract and water extract), RRR = Residual Radioactive Residues (after solvent extraction) b The second most abundant HPLC peak represented 0.0018 mg eq/kg or 9.8% TRR; c The second and third most abundant HPLC peaks both represented 0.0062 mg eq/kg or 7.2% TRR d Calculated losses of 0.0117 mg eq/kg or 13.6% TRR in sum occurred during work-up of the acetonitrile extract e Calculated losses of 0.0151 mg eq/kg or 14.2% TRR in sum occurred during work-up of the acetonitrile extract
Table 55 Characterization of residual radioactive residues (RRR) after solvent extraction of rotational crop matrices following their cultivation in soil treated with benzoyl-label cyflumetofen after a plant back interval of 30 days
Fraction / Supernatant
Crop matrix
Immature lettuce Mature lettuce White radish root White radish top
mg eq/kg % TRR mg
eq/kg % TRR mg eq/kg % TRR mg
eq/kg % TRR
Plant back interval: 30 DAT RRR 0.008 13.7 0.009 16.3 0.006 22.5 0.015 11.0 Ammonia solubilizate 0.001 1.7 0.001 1.5 0.001 2.4 0.002 1.5 Sum of solubilized radioactive residues 0.001 1.7 0.001 1.5 0.001 2.4 0.002 1.5
Final residue 0.006 10.5 0.004 6.5 0.005 20.0 0.012 9.0 Procedural recovery 89.1% 49.1% 99.6% 95.9%
Fraction / Supernatant
Crop matrix Spring wheat forage Spring wheat hay Spring wheat
straw Spring wheat chaff
Spring wheat grain
mg eq/kg % TRR mg
eq/kg % TRR mg eq/kg % TRR mg
eq/kg % TRR mg eq/kg % TRR
Plant back interval: 30 DAT RRR 0.027 20.2 0.159 25.0 0.093 19.1 0.190 15.0 0.090 54.1 Ammonia solubilizate 0.002 1.8 0.014 2.1 0.008 1.8 0.020 1.6 0.025 15.1 Ammonia residue 0.024 17.9 0.148 23.2 0.104 21.5 0.170 13.4 0.064 38.6

228 Cyflumetofen
Fraction / Supernatant
Crop matrix
Immature lettuce Mature lettuce White radish root White radish top
mg eq/kg % TRR mg
eq/kg % TRR mg eq/kg % TRR mg
eq/kg % TRR
Macerozyme/cellulase solubilizate n. a. n. a. 0.024 3.8 0.012 2.4 0.023 1.8 0.029 17.4
Amylase/amyloglucosidase solubilizate n. a. n. a. 0.011 1.7 0.003 0.7 0.013 1.0 0.013 7.7
Amylase/amyloglucosidase residue n. a. n. a. 0.105 16.5 0.082 16.9 0.128 10.1 0.022 13.2
1 N HCl homogenization n. a. n. a. 0.003 0.4 0.001 0.2 0.002 0.2 0.002 1.2 6 N HCl reflux n. a. n. a. 0.047 7.3 0.026 5.3 0.045 3.5 0.012 7.0 Sum of solubilized radioactive residues 0.002 1.8 0.098 15.4 0.050 10.4 0.103 8.1 0.080 48.4
Final residue 0.024 17.9 0.036 5.7 0.040 8.3 0.063 4.9 0.006 3.9 Procedural recovery a 97.3% 84.5% 97.9% 87.0% 96.7%
a Recovery calculated as (Sum of solubilized radioactive residues + Final residue) mg eq/kg × 100 / RRR mg eq/kg n. a. = not applied
Table 56 Characterization of residual radioactive residues (RRR) after solvent extraction of rotational crop matrices following their cultivation in soil treated with butylphenyl-label cyflumetofen after plant back intervals of 120 and 365 days
Fraction / Supernatant
Crop matrix Spring wheat hay
Spring wheat straw + chaff
Spring wheat grain
mg eq/kg % TRR mg eq/kg % TRR mg eq/kg % TRR Plant back interval: 120 DAT RRR 0.0393 45.6 0.0417 39.1 0.0511 81.2 Ammonia solubilizate 0.0025 2.9 0.0033 3.0 0.0058 9.2 Macerozyme/cellulase solubilizate 0.0076 8.8 0.0045 4.2 0.0122 19.4
Amylase/amyloglucosidase solubilizate 0.0037 4.3 0.0029 2.7 0.0081 12.9
Sum of solubilized radioactive residues 0.0138 16.0 0.0107 10.0 0.0261 41.5
Final residue 0.0203 23.6 0.0279 26.2 0.0216 34.2 Procedural recovery a 86.7% 92.6% 93.3% Plant back interval: 365 DAT RRR 0.0110 64.2 0.0156 57.4 0.0248 79.6 Ammonia solubilizate 0.0009 5.1 0.0018 6.5 0.0022 6.9 Macerozyme/cellulase solubilizate 0.0015 8.5 0.0013 4.7 0.0063 20.4
Amylase/amyloglucosidase solubilizate 0.0009 5.5 0.0010 3.6 0.0045 14.4
Sum of solubilized radioactive residues 0.0033 19.1 0.0040 14.8 0.0130 41.7
Final residue 0.0073 42.4 0.0118 43.2 0.0119 38.4 Procedural recovery 95.9% 101.2% 100.6%
a Recovery calculated as (Sum of solubilized radioactive residues + Final residue) mg eq/kg × 100 / RRR mg eq/kg
With regard to the degradate patterns described above for the two labels, the degradation pathway of cyflumetofen in rotational crops can be proposed as follows: Hydrolytic cleavage of the parent molecule results in the formation of the degradate B-1, which is only detectable with the benzoyl-label, and one or several butylphenyl-label-specific intermediates which were not identified. The predominant degradate in the case of the benzoyl-label, Trifluoroacetic Acid, can be derived from the parent compound or the degradate B-1. The butylphenyl-label-specific cleavage products (such as the goat degradate A-2 which is formed by hydrolysis of the formic acid ester, decarboxylation and

Cyflumetofen 229
hydrolytic detachment of the trifluoromethyl benzoyl moiety) are further transformed to a series of minor (< 0.01 mg eq/kg), mainly medium polar degradates.
Figure 3 Proposed metabolic pathway in rotational crops (lettuce, radish and wheat)
RESIDUE ANALYSIS
Analytical methods
The Meeting received descriptions and validation data (including concurrent recovery data) for analytical methods for residues of cyflumetofen and its metabolites.
Analytical methods for plant matrices
The descriptions of the analytical methods used in supervised residue trials and for enforcement are shown below.
Method D1003
Analyte: Cyflumetofen and metabolites B-1, AB-6 and AB-7
Matrix: Dry bean, dried grapes (raisins), orange (fruits, juice and oil), rice (grain, straw), soybean seed, tomato
LOQ: 0.01 mg/kg for each analyte in all matrices (defined as the lowest fortification level successfully tested)

230 Cyflumetofen
Description: Crop materials Residues are extracted from plant matrices by shaking with acetonitrile followed by acetonitrile:water (75:25, v/v). An aliquot of the extract is centrifuged and, after removal of acetonitrile, acidified with formic acid. The residues are partitioned with a mixture of ethyl acetate: cyclohexane (75:25, v/v). An aliquot of the organic phase is concentrated in the presence of 0.1% aqueous formic acid, and re-dissolved in 0.1% formic acid in acetonitrile for determination with LC-MS/MS. Oil Residues are extracted from oil by shaking with a mixture of acetonitrile:water (75:25, v/v) and hexane. The hexane phase is removed and an aliquot of the aqueous acetonitrile phase is subjected to clean-up by partition with hexane or ethyl acetate:cyclohexane (75:25, v/v) followed by final determination as the above.
Juice Residues are extracted from juice by shaking with a mixture of acetonitrile:water (75:25, v/v). An aliquot of the aqueous acetonitrile extract is subject to clean-up and for final determination as the above.
LC-MS/MS condition
For data collection: Less concentrated final sample was used for analysis with highly sensitive LC-MS/MS instrument. From the acetonitrile extract of crop materials, acetonitrile is removed by concentration rather than centrifugation.
For enforcement: Larger amount of aliquot from the extract for sample clean-up to increase the residue concentration.
Reference: Carter et al., 2011a
Validation of D1003 for data collection
Validation of Method D1003 for collecting data on the concentrations of the parent, B-1, AB-6 and AB-7 was conducted using the sample size of 0.1 g for crop materials, and 5 g for oil and orange juice.
Table 57 Recovery results obtained for the analysis of plant matrices and some of their processed foods with Method D1003 for data collection
Matrix Analyte No. Fortification Level (mg/kg)
Primary transition a Secondary transition 2 b Range (%)
Mean (%)
RSD (%)
Range (%)
Mean (%)
RSD (%)
Orange Cyflumetofen 5 5 10
0.01 1.0 Overall
91–106 96–104 91–106
97 100 99
6 3 5
91–96 83–108 83–108
93 97 95
3 10 7
B-1 5 5 10
0.01 1.0 Overall
74–85 71–75 71–85
80 73 77
7 2 7
81–87 72–78 72–87
84 75 80
3 3 6
AB-6 5 5 10
0.01 1.0 Overall
92–96 92–106 92–106
95 99 97
2 6 5
86–98 85–100 85–100
94 94 94
5 7 6
AB-7 5 5 10
0.01 1.0 Overall
92–99 88–99 88–99
95 93 94
3 4 4
87–103 86–99 86–103
95 95 95
7 5 6
Tomato Cyflumetofen 5 5 10
0.01 1.0 Overall
78–124 80–92 78–124
94 84 89
20 6 16
84–133 77–92 77–133
100 84 92
20 7 17
B-1 5 5 10
0.01 1.0 Overall
71–84 75–97 71–97
77 82 79
8 11 10
73–81 70–93 70–93
76 81 78
5 12 9
AB-6 5 5 10
0.01 1.0 Overall
80–107 79–90 79–107
92 84 88
11 5 9
87–108 82–88 82–108
94 86 90
9 3 8
AB-7 5 5 10
0.01 1.0 Overall
74–98 71–83 71–98
85 78 82
12 7 11
77–103 83–92 77–103
89 87 88
11 4 8

Cyflumetofen 231
Matrix Analyte No. Fortification Level (mg/kg)
Primary transition a Secondary transition 2 b Range (%)
Mean (%)
RSD (%)
Range (%)
Mean (%)
RSD (%)
Bean, dry Cyflumetofen 5 5 10
0.01 1.0 Overall
100–114 98–119 98–119
108 110 109
5 8 7
104–110 92–117 92–117
107 106 106
2 9 6
B-1 5 5 10
0.01 1.0 Overall
70–76 71–95 70–95
72 80 76
3 12 11
79–94 74–84 74–94
86 81 83
8 5 7
AB-6 5 5 10
0.01 1.0 Overall
100–116 87–102 87–116
110 95 103
6 7 10
103–119 80–110 80–119
111 95 103
7 12 12
AB-7 5 5 10
0.01 1.0 Overall
99–118 92–106 92–118
108 99 103
7 7 8
99–119 89–105 89–119
111 99 105
7 7 9
Soybean Cyflumetofen 5 5 10
0.01 1.0 Overall
80–93 101–114 80–114
86 108 97
6 5 13
90–109 96–119 90–119
97 108 102
8 8 10
(seed) B-1 5 5 10
0.01 1.0 Overall
68–73 88–104 68–104
71 99 85
3 7 19
70–76 87–102 70–102
73 96 85
4 6 15
AB-6 5 5 10
0.01 1.0 Overall
106–120 98–114 98–120
113 109 110
6 6 6
90–123 92–108 90–123
107 102 104
15 7 11
AB-7 5 5 10
0.01 1.0 Overall
93–118 99–108 93–118
108 103 106
11 3 8
102–120 92–113 92–120
109 105 107
7 9 8
Rice Cyflumetofen 5 5 10
0.01 1.0 Overall
73–98 104–116 73–116
88 111 100
12 4 14
74–102 100–115 74–115
96 106 101
13 6 11
(grain) B-1 5 5 10
0.01 1.0 Overall
70–111 93–111 70–111
91 98 95
16 8 12
79–118 92–109 79–118
107 99 103
15 6 12
AB-6 5 4 9
0.01 1.0 Overall
74–125 105–107 74–125
107 106 107
19 0.8 13
71–124 96–121 71–124
102 111 107
19 8 14
AB-7 5 10
0.01 1.0 Overall
70–113 99–115 70–115
101 106 103
18 6 13
71–115 102–112 71–115
104 107 106
18 4 12
Orange juice Cyflumetofen
5 5 10
0.01 1.0 Overall
78–89 77–93 77–93
85 87 86
5 7 6
78–98 81–95 78–98
88 91 89
10 6 8
B-1 5 5 10
0.01 1.0 Overall
72–97 68–81 68–97
83 74 79
11 6 11
90–108 71–87 71–108
97 78 88
7 8 14
AB-6 5 5 10
0.01 1.0 Overall
79–88 83–92 79–92
83 87 85
4 5 5
75–83 81–99 75–99
78 87 83
5 9 9
AB-7 5 5 10
0.01 1.0 Overall
84–92 78–90 78–92
88 83 86
4 6 6
78–93 81–90 78–93
86 85 86
8 4 6
Orange oil Cyflumetofen 5 5 10
0.01 1.0 Overall
70–75 66–80 66–80
73 74 74
3 8 6
71–81 70–85 70–85
78 77 77
5 10 7
B-1 5 5 10
0.01 1.0 Overall
74–104 71–117 71–117
91 99 95
13 18 16
100–117 85–112 85–117
108 99 103
6 12 10
AB-6 5 5 10
0.01 1.0 Overall
93–100 77–98 77–100
97 88 92
3 9 8
86–107 80–101 80–107
98 93 95
8 9 8
AB-7 5 5 10
0.01 1.0 Overall
70–89 75–93 70–93
81 81 81
9 9 8
79–107 70–89 70–107
88 79 84
14 10 13

232 Cyflumetofen
Matrix Analyte No. Fortification Level (mg/kg)
Primary transition a Secondary transition 2 b Range (%)
Mean (%)
RSD (%)
Range (%)
Mean (%)
RSD (%)
Dried grape Cyflumetofen
5 5 10
0.01 1.0 Overall
102–123 96–127 96–127
109 114 111
8 10 9
94–117 92–131 92–131
104 113 109
9 15 12
B-1 5 5 10
0.01 1.0 Overall
75–83 72–83 72–83
78 78 78
5 6 5
71–81 71–89 71–89
75 80 78
5 9 8
AB-6 5 5 10
0.01 1.0 Overall
101–119 101–131 101–131
110 116 113
7 9 8
102–114 100–134 100–134
109 115 112
5 12 9
AB-7 5 5 10
0.01 1.0 Overall
100–114 96–136 96–136
109 112 110
6 14 10
106–114 94–141 96–141
111 114 113
3 16 11
Rice straw Cyflumetofen 5 5 10
0.01 1.0 Overall
97–111 104–118 97–118
104 111 107
5 5 6
97–118 97–118 97–118
104 107 105
8 7 7
B-1 5 5 10
0.01 1.0 Overall
71–91 71–84 71–94
79 77 78
10 7 8
68–73 70–76 68–76
71 73 72
3 4 4
AB-6 5 5 10
0.01 1.0 Overall
97–114 90–101 90–114
104 97 101
6 5 6
100–109 95–107 95–109
105 98 102
3 5 5
AB-7 5 5 10
0.01 1.0 Overall
98–109 85–99 85–109
101 93 97
4 7 7
100–107 86–99 86–107
102 92 97
3 6 7
a Primary transition used for quantification: Cyflumetofen: m/z 448.2 → 173.0 (ionization mode, positive) B-1: m/z 189.1 → 69.0 (ionization mode, negative) AB-6: m/z 466.4 → 173.0 (ionization mode, positive) AB-7: m/z 448.2 → 344.2 (ionization mode, positive) b Secondary transition used for confirmation: Cyflumetofen: m/z 448.2 → 145.1 B-1: m/z 189.1 → 145.1 AB-6: m/z 466.4 → 145.0 AB-7: m/z 448.2 → 372.2
The method showed good linearity in the range of 0.035–10.0 μg/kg. No known interference was observed from crop components or from reagents, solvents and glassware used, except in rice straw which may show matrix interference for the B-1 secondary ion. As the matrix interference residue was greater than 20% of the LOQ, alternative chromatography was developed for the secondary ion for validation of the method for this analyte.
The mean recoveries for all matrices tested and at all fortification levels ranged between 71 and 116% with relative standard deviations between 2 and 20%. However, some individual recovery values were higher than 120%.
Validation of Method D1003 for enforcement
Validation of Method D1003, as an enforcement method, was conducted using the sample size of 5 g for all matrices tested. In this validation, the parent compound and B-1 metabolite were determined.
Table 58 Recovery results obtained for the analysis of plant matrices and some of their processed foods with Method D1003 for enforcement
Matrix Analyte Fortification Level (mg/kg)
No. Primary transition a Secondary transition 2 b Range (%)
Mean (%)
RSD (%)
Range (%)
Mean (%)
RSD (%)
Tomato Cyflumetofen 0.01 1.0 Overall
5 5 10
87–103 90–100 87–103
94 93 93
7 5 6
84–104 84–111 84–111
95 93 94
10 11 10

Cyflumetofen 233
Matrix Analyte Fortification Level (mg/kg)
No. Primary transition a Secondary transition 2 b Range (%)
Mean (%)
RSD (%)
Range (%)
Mean (%)
RSD (%)
B-1 0.01 1.0 Overall
5 5 10
78–90 76–102 76–102
84 87 86
5 13 9
71–97 68–92 68–97
78 81 80
14 12 12
Soybean Cyflumetofen 0.01 1.0 Overall
5 5 10
82–103 89–111 82–111
92 98 95
9 8 9
74–108 88–107 74–108
94 97 96
13 7 10
(seed) B-1 0.01 1.0 Overall
5 5 10
76–93 80–102 76–102
83 91 87
9 10 11
77–106 80–109 77–109
93 88 90
15 14 14
Rice Cyflumetofen 0.01 1.0 Overall
5 5 10
77–109 89–106 77–109
88 98 93
15 7 12
79–100 96–106 79–106
87 101 94
10 4 11
(grain) B-1 0.01 1.0 Overall
6 5 10
84–100 87–107 84–107
89 95 92
7 8 8
78–119 76–105 76–119
98 86 92
19 15 18
Bean, dry Cyflumetofen 0.01 1.0 Overall
6 5 10
83–110 97–108 83–110
95 103 98
10 5 8
90–111 92–106 90–111
96 101 99
9 6 8
B-1 0.01 1.0 Overall
6 5 10
85–106 90–99 85–106
96 93 95
8 5 6
89–125 85–119 85–125
104 105 104
12 13 12
Orange Cyflumetofen 0.01 1.0 Overall
5 5 10
79–90 80–88 79–90
84 84 84
5 4 4
73–84 79–95 73–95
78 86 82
5 7 8
B-1 0.01 1.0 Overall
5 5 10
73–105 74–85 73–105
87 80 84
14 6 12
90–115 91–121 90–121
100 101 101
10 12 10
Orange juice Cyflumetofen
0.01 1.0 Overall
5 5 10
85–111 70–101 70–111
96 80 88
11 15 15
77–93 71–92 71–93
86 76 81
7 12 11
B-1 0.01 1.0 Overall
5 5 10
70–96 72–90 70–96
77 81 79
14 9 11
77–101 74–100 74–101
89 89 89
10 12 10
Orange oil Cyflumetofen
0.01 1.0 Overall
5 5 10
66–72 82–96 66–96
70 87 79
4 7 12
68–76 86–101 68–101
72 90 81
5 7 13
B-1 0.01 1.0 Overall
5 5 10
84–105 80–103 80–105
96 90 93
9 9 9
81–107 60–99 60–107
97 84 90
11 20 17
Rice straw Cyflumetofen
0.01 1.0 Overall
6 5 10
77–96 94–104 77–104
88 99 93
7 4 9
83–90 92–106 83–106
87 101 93
3 6 9
B-1 0.01 1.0 Overall
6 5 10
79–116 78–103 78–116
90 91 90
16 12 14
79–118 86–100 79–118
92 94 93
16 7 12
a Primary transition used for quantification: Cyflumetofen: m/z 448.2 → 173.0 (ionization mode, positive) B-1: m/z 189.1 → 69.0 (ionization mode, negative) b Secondary transition used for confirmation: Cyflumetofen: m/z 448.2 → 145.1 B-1: m/z 189.1 → 145.1
The method showed good linearity in the range of 0.14–15.0 μg/kg. No known interference was observed from crop components or from reagents, solvents and glassware used, except in rice straw as described above.
The mean recoveries for all matrices tested and at all fortification levels ranged between 70 and 105%, within the acceptable range, with relative standard deviations between 3 and 19%. However, some individual analysis recoveries were slightly higher than 120% and some were lower than 70%.

234 Cyflumetofen
Independent laboratory validation of Method D1003 (Marin, 2011a)
An independent laboratory validation of Method D1003 was conducted for the determination of cyflumetofen and metabolite B-1 in orange, wheat (grain and hay) and canola seed. Fortification levels used are 0.01 (LOQ) and 1.0 mg/kg.
Some modifications were made to the procedure of Method D1003 as follows:
Analyte: Cyflumetofen and metabolite B-1
LOQ: 0.01 mg/kg for each analyte in all matrices
Description: Residues are extracted from plant matrices by shaking with acetonitrile followed by acetonitrile:water (50:50, v/v) and centrifugation. An aliquot (2 mL) of the extract is transferred to a glass vessel containing aqueous formic acid. The extract is concentrated under a gentle flow of nitrogen and then partitioned with ethyl acetate: cyclohexane (75:25, v/v). After mixing, 2 g of sodium chloride is added and the mixture is partitioned for 5 minutes. After centrifugation, an aliquot (7 mL) of the extract is transferred to a glass tube containing 0.2 mL of aqueous formic acid. The extract is concentrated under a gentle flow of nitrogen and the volume is adjusted to 2.5 mL with acetonitrile containing formic acid. Residues are determined with LC-MS/MS.
Sample size used in this validation was 5 g.
Table 59 Recovery results obtained for the analysis of plant matrices with Method D1003 in independent laboratory validation
Matrix Analyte Fortification Level (mg/kg)
No. Primary transition a Secondary transition 2 b Range (%)
Mean (%)
RSD (%)
Range (%)
Mean (%)
RSD (%)
Orange Cyflumetofen 0.01 1.0 Overall
5 5 10
67–80 84–92 67–92
73 89 81
7 3 12
65–94 91–103 65–103
74 96 85
16 5 16
B-1 0.01 1.0 Overall
5 5 10
77–87 78–83 77–87
82 80 81
6 3 5
76–84 75–84 75–84
79 80 80
4 5 4
Tomato Cyflumetofen 0.01 1.0 Overall
5 5 10
61–85 74–77 61–85
74 75 75
12 1 8
60–90 75–85 60–90
72 78 75
17 5 12
B-1 0.01 1.0 Overall
5 5 10
60–86 77–81 60–86
76 79 78
13 3 9
58–86 75–79 58–86
71 78 75
14 3 11
Wheat grain Cyflumetofen
0.01 1.0 Overall
5 5 10
76–108 84–95 76–108
88 90 89
14 4 10
78–104 85–106 78–106
89 92 90
12 10 10
B-1 0.01 1.0 Overall
5 5 10
81–86 74–81 74–86
83 77 80
2 4 5
78–85 72–83 72–85
80 78 79
4 5 4
Canola seed Cyflumetofen
0.01 1.0 Overall
5 5 10
71–86 88–102 71–102
81 94 87
7 6 10
64–87 92–111 64–111
75 99 87
15 8 18
B-1 0.01 1.0 Overall
5 5 10
73–75 85–92 73–92
74 87 81
1 3 9
69–74 83–89 69–89
72 85 79
3 2 9
Wheat hay Cyflumetofen
0.01c 1.0c 1.0 Overall
5 5 5 10
84–91 90–96 93–101 84–101
88 94 97 93
5 2 4 5
80–98 86–94 78–91 78–98
87 90 83 87
8 3 6 7
B-1
0.01c 1.0c 1.0 Overall
5 5 5 10
85–109 64–68 75–81 64–109
95 66 78 80
12 3 3 18
45–59 64–71 75–81 45–81
51 67 77 65
12 4 3 17
a Primary transition used for quantification: Cyflumetofen: m/z 448.2 → 173.0 (ionization mode, positive)

Cyflumetofen 235
B-1: m/z 189.1 → 69.0 (ionization mode, negative) b Secondary transition used for confirmation: Cyflumetofen: m/z 448.2 → 145.0 B-1: m/z 189.1 → 145.0 c Analysed by modified method.
The method showed good linearity in the range of 0.35–10.0 μg/kg. No known interference was observed from crop components or from reagents, solvents and glassware used, except in wheat hay.
The mean recoveries for all matrices tested and at all fortification levels ranged between 71 and 97%, within the acceptable range, with relative standard deviations between 1 and 19% with the exceptions of B-1 in wheat hay in which even the mean recoveries at 0.01 and 1 mg/kg were lower than 70%. Some individual analysis recoveries for matrices tested were lower than 70%.
Analytical methods for animal matrices
The descriptions of the analytical methods related to the current review are shown below.
All of these methods showed good linearity with a correlation coefficient ≥ 0.99. There were no interferences at the analyte concentration higher than 30% of LOQ. Additional information on method performance is described later.
Method D1202
Analyte: Cyflumetofen and Metabolite B-1
Matrix: Bovine liver, meat and milk; and poultry eggs
LOQ: 0.001 mg/kg for each analyte in bovine milk; and 0.01 mg/kg for each analyte in other matrices.
Description: Bovine Liver and Poultry Eggs: Residues are extracted 5 g of sample by shaking with acetonitrile followed by acetonitrile-water (50:50, v/v). A salt mixture of magnesium sulfate (400 mg), sodium chloride (100 mg), sodium citrate sesquihydrate (50 mg), and sodium citrate dihydrate (100 mg) is added to an aliquot of the sample vortexed and centrifuged. The process is repeated with another salt mixture of magnesium sulfate (75 mg) and CUPSA (12.5 mg). An aliquot of the extract is concentrated to remove the acetonitrile to the aqueous phase in the presence of 20% formic acid in water. The extract is re-acidified and saturated with sodium chloride and partitioned with a mixture of ethyl acetate-cyclohexane (75:25, v/v). An aliquot of the organic phase is concentrated in the presence of 0.1% formic acid in water, and re-dissolved in 0.1% formic acid in acetonitrile for LC-MS/MS determination. Bovine Meat: Residues are extracted from 5 g of sample by shaking with acetonitrile followed by acetonitrile-water (50:50, v/v). An aliquot of the extract is concentrated to remove the acetonitrile to the aqueous phase in the presence of 0.1% formic acid in water. The extract is saturated with sodium chloride and partitioned with a mixture of ethyl acetate-cyclohexane (75:25, v/v). An aliquot of the organic phase is concentrated in the presence of 0.1% formic acid in water, and re-dissolved in 0.1% formic acid in acetonitrile for LC-MS/MS determination. Bovine Milk: Residues are extracted from 5 g or mL of sample by shaking with acetonitrile. An aliquot of the extract is concentrated to remove the acetonitrile to the aqueous phase in the presence of 20% formic acid in water. The extract is saturated with sodium chloride and partitioned with a mixture of ethyl acetate-cyclohexane (75:25, v/v). Aliquots of the organic phase are concentrated in the presence of 0.1% formic acid in water, and re-dissolved in 0.1% formic acid in acetonitrile. A salt mixture of magnesium sulfate (400 mg), sodium chloride (100 mg), sodium citrate sesquihydrate (50 mg), and sodium citrate dihydrate (100 mg) is added and vortexed and centrifuged. Another salt mixture of magnesium sulfate (75 mg) and CUPSA

236 Cyflumetofen
(12.5 mg) mixture is then added and vortexed and centrifuged. An aliquot is taken for LC-MS/MS determination.
Reference: Sweeney and Nejad, 1998a
An independent laboratory validation of Method D1202 was conducted for the determination of cyflumetofen and metabolite B-1 in bovine liver, meat and milk and poultry eggs at fortification levels of the LOQ and 100 × LOQ: i.e., 0.001 and 0.10 mg/kg for bovine milk; and 0.01 and 1.0 mg/kg for other matrices.
Table 60 Recovery results obtained during independent laboratory validation of Method D1202 for bovine liver, meat and milk and poultry eggs.
Matrix Analyte Fortification level (mg/kg) No.
Primary transition a Secondary transition b Range (%)
Mean (%)
RSD
(%) Range (%)
Mean (%)
RSD
(%)
Bovine Liver Parent
0.01 c 5 62–108 91 19 64–100 89 16 1.0 c 5 108–124 115 5 107–123 115 5 Overall 10 62–124 103 17 64–123 102 17
B-1 0.01 5 74–81 78 4 71–81 78 5 1.0 5 81–91 85 5 81–90 84 4 Overall 10 74–91 81 6 71–90 81 6
Bovine Meat Parent
0.01 5 69–82 77 7 71–84 77 7 1.0 5 84–99 90 8 85–102 92 9 Overall 10 69–99 84 11 71–102 85 12
B-1 0.01 5 76–88 83 6 78–93 86 6 1.0 5 70–85 77 8 71–86 77 8 Overall 10 70–88 80 8 71–93 82 9
Bovine Milk Parent
0.001 5 76–84 79 4 77–83 80 3 0.10 5 103–112 107 3 104–112 107 3 Overall 10 76–112 93 16 77–112 93 16
B-1 0.001 c 5 74–90 83 8 74–86 81 6 0.10 c 5 93–101 97 3 92–99 97 3 Overall 10 74–101 90 10 74–99 89 10
Poultry Eggs Parent
0.01 c 5 64–68 65 3 62–71 66 6 1.0 c 5 60–69 67 6 59–69 66 6 Overall 10 60–69 66 4 59–71 66 6
B-1 0.01 5 77–89 86 6 84–103 95 8 1.0 5 88–95 91 3 88–97 90 4 Overall 10 77–95 88 5 84–103 93 6
a Primary transition used for quantification: Cyflumetofen: m/z 448.2 → 173.2 (ionization mode, positive) B-1: m/z 189.0 → 69.1 (ionization mode, negative) b Secondary transition used for confirmation: Cyflumetofen: m/z 448.2 → 145.1 B-1: m/z 189.1 → 145.1 c Results obtained using matrix matched standards.
The method showed good linearity in the range of 0.20–10.0 μg/kg. No known interference was observed from animal components or from reagents, solvents and glassware used.
The mean recoveries for bovine matrices tested and at all fortification levels ranged between 77 and 115% with RSDs between 3 and 19%. The mean recoveries of the parent in poultry eggs ranged between 65–67% with the standard deviations between 3–6% while those for B-1 ranged between 86–95% with the standard deviations between 3–8%.
Stability of pesticide residues in stored analytical samples The Meeting received information on freezer storage stability of cyflumetofen and three of its metabolites, B-1, AB-6 and AB-7 in various plant matrices, such as orange (fruit, juice and oil), apple (fruit and juice), leaf lettuce, kidney bean (dry), radish root, wheat grain and almond nutmeat (Gorden, 2011a and 2013a).

Cyflumetofen 237
Homogenized samples (5 g) of each matrix were fortified separately with standard solutions containing Cyflumetofen and metabolites B-1, or AB-6 or AB-7 at a level of 0.1 mg/kg for each analyte and stored at –20 to –10 °C for up to 743–910 days (24–30 months).
After each specified period, a portion of sample was analysed with Method D1003 with the LOQ at 0.01 mg/kg. At the same time, a sample was freshly spiked at 0.1 mg/kg and analysed for concurrent procedural recovery.
Table 61 summarizes the storage periods, mean percent remaining and mean concurrent recovery at each time point.
Table 61 Stability of cyflumetofen and its metabolites B-1, AB-6 and AB-7 in frozen plant matrices fortified at 0.1 mg/kg
Matrix Storage period (month)
Cyflumetofen B-1 AB-6 AB-7
% remaining Procedural recovery % remaining Procedural
recovery % remaining Procedural recovery % remaining Procedural
recovery Almond 0 85 – 68 82 81 88 103 95 0.2 86 85 – – – – – – 1 89 94 – – – – 97 95 2 – – – – 93 88 – – 3 106 100 64 82 – – 73 86 5 – – – – 85 88 – – 6 84 90 70 76 – – 94 98 9, 8 87 94 – – 99 103 92 102 10 – – 67 83 – – – – 11 77 80 – – – – – – 12 – – – – 106 126 91 82 13 – – 78 85 – – – – 18 85 91 – – – – – – 19 – – – – 98 93 21 – – – – 77 89 – – 23 – – 78 94 – – – – 25 79 107 – – – – – – 26 – – – – – – 99 118 28 – – – – 82 115 – – 30 – – 74 101 – – – – Apple 0 83 – 77 81 80 89 88 86 Fruit 0.2 67 83 – – – – – – 1 76 85 – – – – 79 86 2 – – – – 81 89 – – 3 76 100 76 81 – – 60 78 5 – – – – 79 85 – – 6 74 77 78 80 – – – – 7 – – – – – – 77 82 9 106 93 – – 81 69 – – 10 – – 66 105 – – 87 80 11 77 85 – – – – – – 12 – – – – 102 109 71 92 13 – – 69 95 – – – – 18 70 75 – – – – – – 19 – – – – – – 67 77 21 – – – – 59 75 – – 22 – – 66 79 – – – – 25 79 77 – – – – – – 26 – – – – – – 80 82 28 – – – – 69 88 – – 29 – – 58 77 – – – – Apple 0 92 – 83 87 94 96 90 96 Juice 0.2 92 92 – – – – – – 1 83 101 – – – – 90 96 2 – – – – 94 96 – – 3 102 99 69 87 – – 79 101

238 Cyflumetofen
Matrix Storage period (month)
Cyflumetofen B-1 AB-6 AB-7
% remaining Procedural recovery % remaining Procedural
recovery % remaining Procedural recovery % remaining Procedural
recovery 5 – – – – 104 93 – – 6 105 91 79 84 – – – – 7 – – – – – – 96 94 9 106 98 – – 90 89 103 91 10 – – 74 81 – – – – 11 104 90 – – – – – – 12 – – – – 106 102 94 92 13 – – 83 94 – – – – 18 79 79 – – – – – – 19 – – – – – – 92 91 21 – – – – 80 91 – – 22 – – 93 94 – – – – 25 85 74 – – – – – – 26 – – – – – – 87 78 29 – – – – 65 83 – – 30 – – 51 78 – – – – Kidney 0 99 – 70 78 90 94 101 98 bean 0.2 90 99 – – – – – – 1 98 97 – – – – 99 98 2 – – – – – – – – 3 101 109 68 78 100 94 87 106 5 – – – – 91 90 – – 6 77 89 79 82 – – 106 96 9 72 99 – – 98 90 101 102 10 – – 74 77 – – – – 11 63 92 – – – – – – 12 – – – – 120 115 96 98 13 – – 66 76 – – – – 18 55 84 – – – – – – 19 – – – – – – 99 92 21 – – – – 83 93 – – 23 – – 85 93 – – – – 25 37 93 – – – – – – 26 – – – – – – 91 99 28 – – – – 91 110 – – 30 – – 77 106 – – – – Lettuce 0 93 – 60 65 84 78 80 86 0.2 80 93 – – – – – – 1 80 89 – – – – 74 86 2 – – 83 78 – – 3 82 99 58 65 – – – – 4 – – – – – – 57 81 5 – – – – 80 88 – – 6 53 93 71 84 – – – – 7 – – – – – – 65 90 9 70 103 – – 80 78 – – 10 – – 58 103 – – 82 102 11 56 85 – – – – – – 12 – – – – 84 109 67 92 13 – – 77 81 – – – – 18 46 86 – – – – – – 19 – – – – – – 59 83 21 – – – – 68 84 – – 22 – – 41 83 – – – – 26 – – – – – – 50 91 28 46 86 – – 59 91 – – 29 – – 88 91 – – – – Orange 0 86 – 66 75 83 83 92 81 Fruit 0.2 69 86 – – – – – –

Cyflumetofen 239
Matrix Storage period (month)
Cyflumetofen B-1 AB-6 AB-7
% remaining Procedural recovery % remaining Procedural
recovery % remaining Procedural recovery % remaining Procedural
recovery 1 75 93 – – – – 83 81 2 – – 77 83 – – 3 86 86 59 75 – – 65 82 5 – – – – 97 79 – – 6 82 83 81 69 – – – – 7 – – – – – – 77 82 9 106 93 – – 81 68 – – 10 – – 60 98 – – 85 89 11 80 85 – – – – – – 12 – – – – 104 103 81 89 13 – – 77 83 – – – – 18 83 80 – – – – – – 19 – – – – – – 103 81 21 – – – – 70 80 – – 22 – – 66 88 – – – – 24 76 77 – – – – – – 26 – – – – – – 56 81 28 – – – – 54 77 – – 29 – – 76 85 – – – – Orange 0 93 – 82 90 87 99 93 97 Juice 0.2 82 93 – – – – – – 1 92 87 – – – – 92 97 2 – – – – 91 99 – – 3 106 97 79 90 – – 82 100 5 – – – – 104 107 – – 6 98 97 80 85 – – – – 7 – – – – – – 96 98 9 104 83 – – 93 100 97 107 10 – – 75 81 – – – – 11 102 90 – – – – – – 12 – – – – 88 101 89 97 13 – – 89 82 – – – – 18 78 86 – – – – – – 19 – – – – – – 91 98 21 – – – – 80 97 – – 22 – – 83 100 – – – – 25 93 93 – – – – – – 26 – – – – – – 74 91 29 – – – – 63 90 – – 30 – – 103 90 – – – – Orange 0 81 – 84 88 88 87 97 92 Oil 0.2 75 81 – – – – – – 1 62 84 – – – – 97 92 2 – – – – 79 87 – – 3 92 84 68 88 – – – – 4 – – – – – – 76 91 5 – – – – 111 103 – – 6 99 72 65 92 – – 93 91 9 81 72 – – 103 104 104 92 10 – – 56 100 – – – – 11 82 72 – – 98 86 – – 12 – – 41 85 – – 93 93 18 79 80 – – – – – – 19 – – – – – – 84 83 21 – – – – 85 96 – – 22 – – 46 103 – – – – 25 97 83 – – – – – – 26 – – – – – – 95 69 29 – – – – 99 87 – –

240 Cyflumetofen
Matrix Storage period (month)
Cyflumetofen B-1 AB-6 AB-7
% remaining Procedural recovery % remaining Procedural
recovery % remaining Procedural recovery % remaining Procedural
recovery 30 – – 56 115 – – – – Radish 0 102 – 68 80 88 82 83 81 Root 0.2 82 102 – – – – – – 1 83 95 – – – – 69 81 2 – – – – 72 82 – – 3 86 101 67 80 – – – – 4 – – – – – – 50 79 5 – – – – 84 88 – – 6 63 82 79 79 – – – – 7 – – – – – – 60 79 9 59 87 – – 84 69 – – 10 – – 67 89 – – 62 99 11 65 88 – – – – – – 12 – – – – 82 102 43 94 13 – – 76 81 – – – – 18 55 75 – – – – – – 19 – – – – – – 44 76 21 – – – – 77 78 – – 22 – – 60 79 – – – – 24 60 84 – – – – – – 26 – – – – – – 47 88 28 – – – – 74 94 – – 29 – – 50 70 – – – – Wheat 0 102 – 86 86 102 97 94 90 Grain 0.2 102 102 – – – – – – 1 94 93 – – – – 87 90 2 – – – – 95 97 – – 3 104 100 75 86 – – – – 4 – – – – – – 72 88 5 – – – – – – – – 6 81 85 75 88 – – 86 96 9 124 106 – – 96 94 77 103 10 – – 68 79 – – – – 11 89 92 – – – – – – 12 – – – – 115 120 80 103 13 – – 86 86 – – – – 18 80 88 – – – – – – 19 – – – – – – 76 99 21 – – – – 93 94 – – 23 – – 82 90 – – – – 25 72 96 – – – – – – 26 – – – – – – 56 96 29 – – – – 80 103 – – 30 – – 67 86 – – – –
The results of the storage stability showed high uncertainty associated with the analytical method used.
Cyflumetofen was stable (> 70% remaining) when stored frozen at the temperature of –20– –10 °C for the longest time tested (24 or 25 months) in almond, apple fruit, apple juice, orange fruit, orange juice, orange oil and wheat grain. However, it showed stability only up to 9 months in lettuce and 3 months in radish root.
Metabolite B-1 was stable frozen up to: 30 months, the longest time tested, in almond, kidney bean, lettuce, orange fruit, orange juice and wheat grain, 22 months in apple fruit and apple juice, and 6 months in orange oil.

Cyflumetofen 241
Metabolite AB-6 was stable frozen up to: the longest period tested (28 or 29 months) in almond, apple fruit, kidney bean, orange juice, orange oil, radish root and wheat grain, 21 months in in apple juice, lettuce and orange fruit.
Metabolite AB-7 was stable frozen up to: the longest period tested (26 months) in almond, apple fruit, apple juice, kidney bean, orange juice, and orange oil, 19 months in orange fruit and wheat grain, 12 months in lettuce, and 1 month in radish root.
USE PATTERNS
Cyflumetofen is used either alone or in combination with other active substances and provides knock-down and residual control of tetranychid mites shown in the following table. It is highly active contact miticides on egg, nymph and adult stage of these mites.
Table 62 Mites controlled by Cyflumetofen
Bryobia rubrioculus Panonychus ulmi Eotetranychus willamettei Petrobia lateens Eotetranychus yumensis Tetranychus cinnabarinus Eutetranychus banksi Tetranychus mcdanieli Oligonychus pratensis Tetranychus pacificus Oligonychus ununguis Tetranychus turkestani Panonychus citri Tetranychus urticae
It has been registered in a number of countries for use on a variety of crops including citrus fruits; pome fruits; berries and other small fruits; fruiting vegetables, other than Cucurbits; and tree nuts. The authorized uses relevant to the supervised trials data submitted to the current Meeting are summarized in Table 63.
For the current review, a US label was provided which indicates that thorough and uniform spray coverage of foliage, with direct contact to target pest, is required for effective control and therefore sufficient volume of water is necessary to ensure thorough coverage of foliage.
Table 63 Registered use of cyflumetofen relevant to the residue evaluation by the current Meeting
Commodity Country Formulation Type and g/kg or g/L
F or, G a
Application Application rate per treatment PHI,
days b
Method Max rate per season, kg ai/ha
Min interval, days
No. c Timing Rate,
kg ai/ha
Min water vol., L/ha
Citrus fruits
Citrus fruits USA SC 200 F Foliar spray 0.40 14 2 At first sign
of infestation 0.19–0.20 935 7
Citrus fruits Brazil SC 200 F Foliar spray – – 1 0.08 kg ai/hL – 7
Pome fruits
Pome fruits USA SC 200 F Foliar spray 0.40 14 2 At first sign of
infestation 0.19–0.20 935 7
Berries and other small fruits
Grapes USA SC 200 F Foliar spray 0.40 14 2 At first sign of
infestation 0.19–0.20 468 14
Strawberry USA SC 200 F Foliar spray 0.40 14 2 At first sign of
infestation 0.19–0.20 468 1
Fruiting vegetables, other than Cucurbits
Tomato USA SC 200 F Foliar spray 0.40 14 2 At first sign of
infestation 0.19–0.20 468 3
Eggplant Japan SC 200 F G
Foliar spray – – 2 At first sign of
infestation 0.02 kg ai/hL (1000–3500) 1
Tree nuts

242 Cyflumetofen
Commodity Country Formulation Type and g/kg or g/L
F or, G a
Application Application rate per treatment PHI,
days b
Method Max rate per season, kg ai/ha
Min interval, days
No. c Timing Rate,
kg ai/ha
Min water vol., L/ha
Tree nuts USA SC 200 F Foliar spray 0.40 14 2 At first sign of
infestation 0.19–0.20 935 7 a F= outdoor or field use; G= glasshouse b PHI= Pre-harvest interval c Do not make more than 1 application before using an effective miticide with a different mode of action
RESIDUES RESULTING FROM SUPERVISED RIALS ON CROPS
The Meeting received residue data from supervised field trials conducted on citrus fruits (orange in Brazil and the USA, grapefruit and lemon in the USA), pome fruits (apple in Italy and the USA and pear in the USA); grapes (in the USA); strawberry (in the USA); fruiting vegetables, other than Cucurbits (tomato in the USA and eggplant in Japan; and tree nuts (in the USA).
Application rates and residue concentrations were reported as Cyflumetofen. Residue concentrations are recorded unadjusted for recoveries or for residue values in control samples. Where multiple samples were taken from a single plot, individual results are reported, and the calculated mean concentration is put in parentheses and used for estimation of maximum residue level. Where trials were conducted in the same location, with the same or similar varieties, same or similar formulations, and same equipment, and at the same or similar timing, they are not regarded as independent and only one result from these trials was chosen for the estimation of a maximum residue level. All the trials, except those on eggplant in Japan, were conducted outdoor using 20% SC formulations except one trial conducted in Italy on apple (25% SC). Residue concentrations are expressed in parent equivalents.
Residues from the trials conducted according to maximum GAP have been used for the estimation of maximum residue levels and they are underlined.
The results of supervised trials are summarized in the following tables:
Crop group Commodities Table no Citrus fruits Orange, grapefruit, lemon Table 64 Pome fruits Apple, pear Table 65 Berries and other small fruits Grapes Table 66 Strawberry Table 67 Fruiting vegetables, other than Cucurbits Tomato Table 68 Eggplant Table 69 Tree nuts Almond, pecan Table 70 By-products, used for animal feeding purposes, derived from fruits and vegetable processing
Almond hulls Table 71
Citrus fruits (orange, grapefruit and lemon)
During the growing season of 2009 and 2010, 23 supervised residue trials were conducted on citrus fruits (orange, grapefruit and lemon) in Arizona (one trial), California (eight trials), Florida (12 trials) and Texas (two trials) in the USA. Three (two in CA and one in FL) of these trials were decline trials. At each test location, one untreated and one treated plot were established. The treated plot received two broadcast foliar applications of cyflumetofen (20% SC formulation) each at 0.193–0.207 kg ai/ha, with a 14-day (+/- one day) re-treatment interval (RTI), except one trial that had a 12-day RTI. The applications were made with ground equipment using 280–2818 L/ha of water. Commercially mature fruits of orange, grapefruit or lemon were collected 7 days after treatment (DAT). In the three decline trials, citrus samples were collected 0, 1, 3, 7, 14 and 21 DAT.

Cyflumetofen 243
All samples were analysed for residues of cyflumetofen and its metabolites B-1, AB-6 and AB-7 using Method D1003 (with modifications), which quantifies residues by LC-MS/MS. Mean recoveries for all analytes were within the acceptable range of 70–120%. A recovery of 66% was obtained for B-1 on lemon fortified at the 0.01 mg/kg level. Several recovery values exceeded 120%. The LOD and LOQ for all analytes were 0.002 and 0.01 mg/kg, respectively. For B-1, when its concentration is expressed in parent equivalents, the LOQ will be 0.02 mg/kg.
In Brazil, during the growing season of 2007, four trials were conducted on oranges to determine the magnitude of the residues of cyflumetofen after treatment with 20% SC formulation of cyflumetofen. The formulation was applied two times at an application rate of 0.160 kg ai/ha and a spray volume of 2000 L/ha. In two of the four trials, the samples were taken immediately after the last application, 1, 7, 14 and 21. In the other two trials the samples were collected 7 days after the last application.
The residues of cyflumetofen were determined by LC-MS/MS. The LOQ was 0.05 mg/kg. The mean recoveries at 0.05 mg/kg spiked level were within the acceptable range of 70–120%.
Table 64 Results of supervised residue trials on citrus fruits (orange, grapefruit and lemon) conducted in Brazil and the USA.
CROP Country, Year Location variety Trial No.
Application
Portion analysed
DAT d
Residues (mg eq/kg) a Author Report Year Study No. DocID.
Method No. Rate kg ai/ha
Spray volume L/ha
Parent B-1 AB-6 AB-7
US GAP 2 0.2 Min. 935 7 (Interval: 14 days) ORANGE
USA, 2009 Orange, FL Hamlin R090446
Tractor mounted, PTO-Driven Airblast
2 0.2 1 × 1658 1 × 1640 Fruit 7
0.087 0.068 (0.078)
< 0.02 < 0.02
< 0.01 < 0.01
< 0.01 < 0.01
2011 / D.R. Hattermann, L.E. Crawford, S. Holt 350843 2012/7003656
USA, 2009 Volusia, FL Hamlin R090447
Tractor mounted, PTO-Driven Airblast
2 0.2 1 × 1648 1 × 1655 Fruit 7
0.095 0.080 (0.088)
< 0.02 < 0.02
< 0.01 < 0.01
< 0.01 < 0.01
2011 / D.R. Hattermann, L.E. Crawford, S .Holt 350843 2012/7003656
USA, 2009 Seminole, FL Navel R090448
Tractor mounted, PTO-Driven Airblast
2 0.2 1 × 699 1 × 706 Fruit 7
0.073 0.159 (0.116)
< 0.02 < 0.02
< 0.01 0.01
< 0.01 < 0.01
2011 / D.R. Hattermann, L.E. Crawford, S. Holt 350843 2012/7003656
USA, 2009 Polk, FL Hamlin R090449
SS Airblast 2 0.2 1 × 808 1 × 800 Fruit 7
0.102 0.099 (0.101)
< 0.02 < 0.02
< 0.01 < 0.01
< 0.01 < 0.01
2011 / D.R. Hattermann, L.E. Crawford, S. Holt 350843 2012/7003656
USA, 2010 Osceola, FL Valencia R090450
SS Airblast 2 0.2 1 × 747 1 × 718 Fruit 7
0.107 0.109 (0.108)
< 0.02 < 0.02
< 0.01 < 0.01
< 0.01 < 0.01
2011 / D.R. Hattermann, L.E. Crawford, S .Holt 350843 2012/7003656
USA, 2009 Lake, FL Hamlin R090451
SS Airblast 2 0.2 1 × 2232 1 × 2027 Fruit 7
0.046 0.075 (0.061)
< 0.02 < 0.02
< 0.01 < 0.01
< 0.01 < 0.01
2011 / D.R. Hattermann, L.E. Crawford, S. Holt 350843 2012/7003656
USA, 2009 Hobe Sound Martin, FL Hamlin R090452
Airblast 2 0.2 2 × 616 Fruit 7 0.107 0.084 (0.096)
< 0.02 < 0.02
0.013 0.014
0.012 0.015
2011 / D.R. Hattermann, L.E. Crawford, S. Holt 350843 2012/7003656

244 Cyflumetofen
CROP Country, Year Location variety Trial No.
Application
Portion analysed
DAT d
Residues (mg eq/kg) a Author Report Year Study No. DocID.
Method No. Rate kg ai/ha
Spray volume L/ha
Parent B-1 AB-6 AB-7
USA, 2009 Hobe Sound Martin, FL Pineapple R090453
Airblast 2 0.2 1 × 2049 1 × 1984 Fruit 7
0.062 0.076 (0.069)
< 0.02 < 0.02
< 0.01 < 0.01
< 0.01 < 0.01
2011 / D.R. Hattermann, L.E. Crawford, S. Holt 350843 2012/7003656
USA Willacy, TX N-33 Navel R090454
FMC DP 50 Airblast Sprayer 9SR-77
2 0.2 1 × 585 1 × 579 Fruit 7
0.010 0.010 (0.010)
< 0.02 < 0.02
< 0.01 < 0.01
< 0.01 < 0.01
2011 / D.R. Hattermann, L.E. Crawford, S. Holt 350843 2012/7003656
USA, 2009 Tulare, CA Atwood Navel
Broadcast 2 0.2 1 × 2109 1 × 2083 Fruit 0
0.055 0.061 (0.058)
< 0.02 < 0.02
< 0.01 < 0.01
< 0.01 < 0.01
2011 / D.R. Hattermann, L.E. Crawford, S. Holt
1
0.055 0.049 (0.052)
< 0.02 < 0.02
< 0.01 < 0.01
< 0.01 < 0.01
350843 2012/7003656 R090455
3 0.044 0.053 (0.0485)
< 0.02 < 0.02
< 0.01 < 0.01
< 0.01 < 0.01
7 0.038 0.031 (0.0345)
< 0.02 < 0.02
< 0.01 < 0.01
< 0.01 < 0.01
14 0.024 0.025 (0.0245)
< 0.02 < 0.02
< 0.01 < 0.01
< 0.01 < 0.01
21 0.015 0.014 (0.0145)
< 0.02 < 0.02
< 0.01 < 0.01
< 0.01 < 0.01
USA, 2009 San Luis Obispo, CA Olinda Valencia R090456
Tractor- mounted, PTO-Driven Airblast
2 0.2 1 × 611 1 × 606 Fruit 7
0.016 0.011 (0.014)
< 0.02 < 0.02
< 0.01 < 0.01
< 0.01 < 0.01
2011 / D.R. Hattermann, L.E. Crawford, S. Holt 350843 2012/7003656
USA, 2009 Kern, CA Navel R090457
Broadcast 2 0.2 1 × 1193 1 × 2152 Fruit 7
0.067 0.059 (0.063)
< 0.02 < 0.02
< 0.01 < 0.01
< 0.01 < 0.01
2011 / D.R. Hattermann, L.E. Crawford, S. Holt 350843 2012/7003656
GAP in Brazil 1 0.08 kg ai/hL – 7
Brazil, 2007 (n.r.) 2 0.2 2000 Fruit 0 0.3 – – – G. Casadei de Baptista Spray concentration not reported 1 0.3 – – – 2007 3 0.2 – – – n.r. 7 0.08 – – – OTSA-0484-FR 14 0.06 – – – Brazil, 2007
(n.r.) 2 0.2 2000 Fruit 7 < 0.05 – – – G. Casadei de Baptista 2007 n.r.
Spray concentration not reported OTSA-0508-FR Brazil, 2007 (n.r.) 2 0.2 2000 Fruit 0 0.1 – – – G. Casadei de Baptista Spray concentration not reported 1 0.1 – – – 2007 3 0.08 – – – n.r. 7 0.06 – – – OTSA-0511-FR 14 < 0.05 – – –
Brazil, 2007 (n.r.) 2 0.2 2000 Fruit 7 < 0.05 – – – G. Casadei de Baptista 2007 n.r.
Spray concentration not reported OTSA-0513-FR GRAPEFRUIT US GAP 2 0.2 Min. 935 7 (Interval: 14 days)

Cyflumetofen 245
CROP Country, Year Location variety Trial No.
Application
Portion analysed
DAT d
Residues (mg eq/kg) a Author Report Year Study No. DocID.
Method No. Rate kg ai/ha
Spray volume L/ha
Parent B-1 AB-6 AB-7
USA, 2009 Brevard, FL White Marsh
Airblast Sprayer 2 0.2 1 × 700
1 × 712 Fruit 0 0.191 0.084 (0.1375)
< 0.02 < 0.02
< 0.01 < 0.01
< 0.01 < 0.01
2011 / D.R. Hattermann, L.E. Crawford, S. Holt
R090458 1
0.101 0.057 (0.079)
< 0.02 < 0.02
< 0.01 < 0.01
< 0.01 < 0.01
350843 2012/7003656
3 0.097 0.043 (0.070)
< 0.02 < 0.02
< 0.01 < 0.01
< 0.01 < 0.01
7 0.046 0.031 (0.0385)
< 0.02 < 0.02
< 0.01 < 0.01
< 0.01 < 0.01
14 0.059 0.023 (0.041)
< 0.02 < 0.02
< 0.01 < 0.01
< 0.01 < 0.01
21 0.038 0.008 (0.023)
< 0.02 < 0.02
< 0.01 < 0.01
< 0.01 < 0.01
USA, 2009 Lake, FL White R090459
SS Airblast 2 0.2 1 × 1798 1 × 1588 Fruit 7
0.067 0.077 (0.072)
< 0.02 < 0.02
< 0.01 < 0.01
< 0.01 < 0.01
2011 / D.R. Hattermann, L.E. Crawford, S. Holt 350843 2012/7003656
USA, 2009 Polk, FL Ruby Red R090460
Broadcast 2 0.2 1 × 820 1 × 777 Fruit 7
0.039 0.040 (0.0395)
< 0.02 < 0.02
< 0.01 < 0.01
< 0.01 < 0.01
2011 / D.R. Hattermann, L.E. Crawford, S. Holt 350843 2012/7003656
USA, 2009 Willacy, TX Rio Red R090461
FMC DP 50 Airblast Spayer (SR-77)
2 0.2 1 × 2495 1 × 2467 Fruit 7
< 0.01 < 0.01 (< 0.01)
< 0.02 < 0.02
< 0.01 < 0.01
< 0.01 < 0.01
2011 / D.R. Hattermann, L.E. Crawford, S. Holt 350843 2012/7003656
USA, 2009 Porterville Tulare, CA Mellogold R090462
Tractor-mounted, PTO-Driven Airblast
2 0.2 1 × 724 1 × 765 Fruit 7
0.036 0.038 (0.037)
< 0.02 < 0.02
< 0.01 < 0.01
< 0.01 < 0.01
2011 / D.R. Hattermann, L.E. Crawford, S. Holt 350843 2012/7003656
USA, 2009 Strathmore Tulare, CA Mellogold R090463
Tractor-mounted, PTO-Driven Airblast
2 0.2 1 × 2253 1 × 2294 Fruit 7
0.027 0.019 (0.023)
< 0.02 < 0.02
< 0.01 < 0.01
< 0.01 < 0.01
2011 / D.R. Hattermann, L.E. Crawford, S. Holt 350843 2012/7003656
LEMON USA, 2009 St. Lucie, FL Bearss R090464
Airblast Sprayer 2 0.2 1 × 664
1 × 649 Fruit 7 < 0.01 < 0.01 (< 0.01)
< 0.02 < 0.02
< 0.01 < 0.01
< 0.01 < 0.01
2011 / D.R. Hattermann, L.E. Crawford, S .Holt 350843 2012/7003656
USA, 2009 Tulare, CA Pyror
Tractor- mounted, PTO-Driven
2 0.2 1 × 2203 1 × 2063 Fruit 0
0.122 0.113 (0.1175)
< 0.02 < 0.02
< 0.01 < 0.01
< 0.01 < 0.01
2011 / D.R. Hattermann, L.E. Crawford, S. Holt
R090465 Airblast 1
0.086 0.112 (0.099)
< 0.02 < 0.02
< 0.01 < 0.01
< 0.01 < 0.01
350843 2012/7003656
3 0.106 0.100 (0.103)
< 0.02 < 0.02
< 0.01 < 0.01
< 0.01 < 0.01
7 0.077 0.086 (0.0815)
< 0.02 < 0.02
< 0.01 < 0.01
< 0.01 < 0.01

246 Cyflumetofen
CROP Country, Year Location variety Trial No.
Application
Portion analysed
DAT d
Residues (mg eq/kg) a Author Report Year Study No. DocID.
Method No. Rate kg ai/ha
Spray volume L/ha
Parent B-1 AB-6 AB-7
14 0.049 0.052 (0.0505)
< 0.02 < 0.02
< 0.01 < 0.01
< 0.01 < 0.01
21 0.031 0.041 (0.036)
< 0.02 < 0.02
< 0.01 < 0.01
< 0.01 < 0.01
USA, 2009 Kern, CA Lisbon R090466
Tractor- mounted, PTO-Driven Airblast
2 0.2 1 × 714 1 × 742 Fruit 7
0.129 0.141 (0.135)
< 0.02 < 0.02
< 0.01 < 0.01
< 0.01 < 0.01
2011 / D.R. Hattermann, L.E. Crawford, S. Holt 350843 2012/7003656
USA, 2010 Yuma, AZ Lisbon R090467
D-4015-03 Airblast 2 0.2 1 × 2818
1 × 2801 Fruit 7 0.021 0.021 (0.021)
< 0.02 < 0.02
< 0.01 < 0.01
0.010 0.011
2011 / D.R. Hattermann, L.E .Crawford, S. Holt 350843 2012/7003656
USA, 2010 San Luis Obispo, CA Eureka R090468
Tractor- mounted, PTO-Driven Airblast
2 0.2 1 × 280 1 × 299 Fruit 7
0.021 0.019 (0.020)
< 0.02 < 0.02
0.01 < 0.01
< 0.01 < 0.01
2011 / D.R. Hattermann, L.E. Crawford, S. Holt 350843 2012/7003656
a Metabolite residues expressed in parent equivalents. n.r. = Not reported
Pome fruits (apple and pear)
During the years 2009 and 2010, 12 trials were conducted on apple in the USA (two trials in New York, one in Pennsylvania, one in Georgia, two in Wisconsin, one in Utah, one in California, two in Idaho, one in Oregon and one in Washington). At each test location, two broadcast foliar applications of 200 g/L SC formulation of cyflumetofen were made to apple trees, at a target application rate of 0.200 kg ai/ha, with a 13–15 day retreatment interval. The applications were made to plots at each site using either concentrate (478–857 L/ha of water, Treatment 2) or dilute (1129–2274 L/ha of water, Treatment 3) spray volumes with ground equipment (airblast sprayers). At each location, apple samples (fruit, one sample per untreated plot and duplicate samples per treated plot) were harvested at a 6 to 7 day preharvest interval (PHI). At one trial in New York (trial no. R090479) treated samples were collected at 1, 3, 8, 10, and 15 days after the last application, to evaluate residue decline. The residues of cyflumetofen and metabolites B-l, AB-6 and AB-7 were quantitated by Method D1003 (LC-MS/MS). Acceptable concurrent recovery data were obtained for each analyte. The LOQ was 0.01 mg/kg for each analyte. Apparent residues of cyflumetofen, B l, AB 6 and AB 7 were < LOQ in/on all untreated samples.
During the growing season 2006, one trial was conducted in Italy in which apple trees were treated with two applications of 250 g/L SC formulation of cyflumetofen at either 0.1 kg ai/ha, 0.2 kg ai/ha, 0.3 kg ai/ha or 0.4 kg ai/ha, diluted with water immediately prior to application to a good coverage spray volume. Samples of apple fruit from the untreated and treated plots were taken immediately after the last application, 3, 7, 14 and 21 days after last application. The LOQ for cyflumetofen in apple was set at 0.05 mg/kg. Procedural recoveries run currently with test specimen at levels of 0.05 mg/kg and 5.0 mg/kg gave an overall mean recovery of 93% and 85% respectively.
During the years 2009 and 2010, five trials were conducted on pear in the USA (one trial in New York, one in California, one in Oregon and two in Washington). At each test location, two broadcast foliar applications of 200 g/L SC formulation of cyflumetofen were made to pear trees, at a target application rate of 0.200 kg as/ha, with a 13–15 day retreatment interval. The applications were made to plots at each site using either concentrate (565–831 L/ha of water) or dilute (1111–1996 L/ha of water) spray volumes with ground equipment (airblast sprayers). At each location, pear samples

Cyflumetofen 247
(fruit, one sample per untreated plot and duplicate samples per treated plot) were harvested at a 7 to 8 day pre-harvest interval (PHI). At one trial in Washington, treated samples were collected at 1, 3, 7, 10, and 14 days after the last application, to evaluate residue decline. The residues of cyflumetofen and metabolites B-I, AB-6 and AB-7 were quantitated using Method D1003. Acceptable concurrent recovery data were obtained for each analyte. The LOQ was 0.01 mg/kg for each analyte. Apparent residues of cyflumetofen, B l, AB 6 and AB 7 were < LOQ in/on all untreated pear samples.
Table 65 Results of supervised residue trials on pome fruits (apple and pear) conducted in Italy and the USA
CROP Country, Year Location variety Trial No.
Application
Portion analysed
DAT d
Residues (mg eq/kg) a Author Report Year Study No. DocID.
Method No. Rate kg ai/ha
Spray volume L/ha
Parent B-1 AB-6 AB-7
US GAP 2 0.2 Min. 935 7 (Interval: 14 days)
APPLE USA, 2009 Wayne, NY
Broad-cast foliar 2 0.2 1 × 562
1 × 571 Fruit 1 0.182 0.175
< 0.02 < 0.02
0.011 < 0.01
< 0.01 < 0.01
M. T. White 2011
Romes RCN R090479
3 0.196 0.125
< 0.02 < 0.02
< 0.01 0.011
< 0.01 < 0.01
375302 2011/7000143
8 0.248 0.122 (0.185)
< 0.02 < 0.02
0.016 0.015
0.013 0.011
10 0.068 0.095
< 0.02 < 0.02
0.011 0.013
< 0.01 < 0.01
15 0.104 0.073
< 0.02 < 0.02
0.012 0.010
< 0.01 < 0.01
2 0.2 1 × 1129
1 × 1133 Fruit 1 0.121 0.122
< 0.02 < 0.02
< 0.01 < 0.01
< 0.01 < 0.01
3 0.079 0.065
< 0.02 < 0.02
< 0.01 < 0.01
< 0.01 < 0.01
8 0.065 0.055 (0.060)
< 0.02 < 0.02
0.011 0.010
< 0.01 < 0.01
10 0.051 0.071 (0.061)
< 0.02 < 0.02
0.011 0.011
< 0.01 < 0.01
15 0.041 0.046
< 0.02 < 0.02
< 0.01 0.010
< 0.01 < 0.01
USA, 2009 Wayne, NY
Broad-cast foliar 2 0.2 1 × 609
1 × 610 Fruit 7 0.101 0.091 (0.096)
< 0.02 < 0.02
< 0.01 0.010
< 0.01 < 0.01 M. T. White
2011 Romes RCN R090480
2 0.2 1 × 2091 1 × 2097 Fruit 7
0.067 0.058 (0.0625)
< 0.02 < 0.02
< 0.01 < 0.01
< 0.01 < 0.01
375302 2011/7000143
USA, 2009 Berks, PA
Broad-cast foliar 2 0.2 1 × 563
1 × 564 Fruit 6 0.160 0.238 (0.199)
< 0.02 < 0.02
< 0.01 0.010
0.011 0.012 M. T. White
2011 Starkrimson RCN R090481
2 0.2 1 × 2243 1 × 2249 Fruit 6
0.119 0.091 (0.105)
< 0.02 < 0.02
< 0.01 < 0.01
< 0.01 < 0.01
375302
2011/7000143
USA, 2009 Fannin, GA
Broad-cast foliar 2 0.2 1 × 691
1 × 613 Fruit 6 0.214 0.139 (0.1765)
< 0.02 < 0.02
0.012 0.012
0.013 0.011
M. T. White 2011
Yate RCN R090482
2 0.2 1 × 1594 1 × 1398 Fruit 6
0.082 0.108 (0.095)
< 0.02 < 0.02
< 0.01 < 0.01
0.011 < 0.01
375302 2011/7000143
USA, 2009 Lenawee, MI
Broad-cast foliar 2 0.2 1 × 823
1 × 806 Fruit 7 0.168 0.153 (0.1605)
< 0.02 < 0.02
0.018 0.017
0.013 0.012 M. T. White
2011

248 Cyflumetofen
CROP Country, Year Location variety Trial No.
Application
Portion analysed
DAT d
Residues (mg eq/kg) a Author Report Year Study No. DocID.
Method No. Rate kg ai/ha
Spray volume L/ha
Parent B-1 AB-6 AB-7
Delicious RCN R090483
2 0.2 1 × 1778 1 × 1757 Fruit 7
0.080 0.137 (0.1085)
< 0.02 < 0.02
< 0.01 0.010
< 0.01 < 0.01
375302 2011/7000143
USA, 2009 Pepin, WI
Broad-cast foliar 2 0.2 1 × 478
1 × 483 Fruit 6 0.130 0.122 (0.126)
< 0.02 < 0.02
0.012 0.015
< 0.01 0.013 M. T. White
2011 (Connel Red) RCN R090484
2 0.2 1 × 1927 1 × 1941 Fruit 6
0.027 0.045 (0.036)
< 0.02 < 0.02
< 0.01 0.011
< 0.01 < 0.01
375302 2011/7000143
USA, 2009 Cache, UT
Broad-cast foliar 2 0.2 1 × 707
1 × 707 Fruit 7 0.042 0.042 (0.042)
< 0.02 < 0.02
< 0.01 < 0.01
< 0.01 < 0.01 M. T. White
2011 Red Delicious RCN R090485
2 0.2 1 × 1598 1 × 1659 Fruit 7
0.061 0.059 (0.060)
< 0.02 < 0.02
< 0.01 < 0.01
< 0.01 < 0.01
375302 2011/7000143
USA, 2009 Madera, CA
Broad-cast foliar 2 0.2
1 × 747 1 × 751 Fruit 7
0.033 0.047 (0.040)
< 0.02 < 0.02
< 0.01 < 0.01
< 0.01 < 0.01 M. T. White
2011 Fuji RCN R090486
2 0.2 1 × 1888 1 × 1858 Fruit 7
0.032 0.024 (0.028)
< 0.02 < 0.02
< 0.01 < 0.01
< 0.01 < 0.01
375302 2011/7000143
USA, 2009 Bingham, ID
Broad-cast foliar 2 0.2) 1 × 576
1 × 555 Fruit 7 0.022 < 0.01 (0.0135)
< 0.02 < 0.02
< 0.01 < 0.01
< 0.01 < 0.01 M. T. White
2011 McIntosh RCN R090487
2 0.2 1 × 1423 1 × 1335 Fruit 7
0.011 0.018 (0.0145)
< 0.02 < 0.02
< 0.01 < 0.01
< 0.01 < 0.01
375302 2011/7000143
USA, 2009 Bingham, ID
Broad-cast foliar 2 0.2 1 × 574
1 × 552 Fruit 7 0.078 0.040
< 0.02 < 0.02
< 0.01 < 0.01
< 0.01 < 0.01 M. T. White
2011 Golden Delicious RCN R090488
2 0.2 1 × 1439 1 × 1385 Fruit 7
0.077 0.122 (0.0995)
< 0.02 < 0.02
< 0.01 < 0.01
< 0.01 < 0.01
375302 2011/7000143
USA, 2010 Hood River, OR
Broad-cast foliar 2 0.2 1 × 857
1 × 822 Fruit 7 0.072 0.067 (0.0695)
< 0.02 < 0.02
< 0.01 < 0.01
< 0.01 < 0.01
M. T. White 2011
Honey Crisp RCN R090489
2 0.2 1 × 2274 1 × 2235 Fruit 7
0.054 0.052 (0.053)
< 0.02 < 0.02
< 0.01 < 0.01
< 0.01 < 0.01
375302 2011/7000143
USA, 2010 Grant, WA
Broad-cast foliar 2 0.2 1 × 615
1 × 611 Fruit 7 0.209 0.177 (0.193)
< 0.02 < 0.02
< 0.01 < 0.01
< 0.01 < 0.01
M. T. White 2011
Red Delicious RCN R090490
2 0.2 1 × 1413 1 × 1424 Fruit 7
0.123 0.143 (0.133)
< 0.02 < 0.02
< 0.01 < 0.01
< 0.01 < 0.01
375302 2011/7000143
Italy, 2006 Mist blower 2 0.1 1 × 1241 Fruit 0 < 0.05 – – – n.r. Bologna sprayer 1 × 1132 3 < 0.05 – – – 2007 Double red 7 < 0.05 – – – AF/10943/OT AF/10943/OT/ 14 < 0.009 – – – OTSA-0301- 1 21 < 0.009 – – – FR 2 0.2 1 × 1193 Fruit 0 0.0998 – – – 1 × 1175 3 0.0780 – – – 7 0.0596 – – – 14 < 0.05 – – – 21 < 0.05 2 0.3 1 × 1197 Fruit 0 0.149 – – – 1 × 1158 3 0.111 – – –

Cyflumetofen 249
CROP Country, Year Location variety Trial No.
Application
Portion analysed
DAT d
Residues (mg eq/kg) a Author Report Year Study No. DocID.
Method No. Rate kg ai/ha
Spray volume L/ha
Parent B-1 AB-6 AB-7
7 < 0.05 – – – 14 < 0.05 – – – 21 < 0.05 – – – 2 0.4 1 × 1197 Fruit 0 0.151 – – – 1 × 1153 3 0.0914 7 0.0501 – – – 14 0.0522 – – – 21 < 0.05 – – – PEAR USA, 2009 Wayne, NY
Broad-cast foliar 2 0.2 1 × 565
1 × 567 Fruit 8 0.127 0.125
< 0.02 < 0.02
0.038 0.027
0.036 0.028
M. T. White 2011
Bosc RCN R090491
2 0.2 1 × 1111 1 × 1118 Fruit 8
0.121 0.265 (0.1995)
< 0.02 < 0.02
0.034 0.032
0.034 0.035
375302 2011/7000143
USA, 2009 Tulare, CA
Broad-cast foliar 2 0.2 1 × 819
1 × 831 Fruit 7 0.045 0.038 (0.0415)
< 0.02 < 0.02
< 0.01 < 0.01
0.011 < 0.01
M. T. White 2011
Olympic RCN R090493
2 0.2 1 × 1808 1 × 1831 Fruit 7
0.064 0.087 (0.0755)
< 0.02 < 0.02
< 0.01 < 0.01
< 0.01 0.012
375302 2011/7000143
USA, 2009 Hood River, OR
Broad-cast foliar 2 0.2 1 × 805
1 × 765 Fruit 7 0.032 0.039 (0.0355)
< 0.02 < 0.02
< 0.01 < 0.01
< 0.01 < 0.01
M. T. White 2011
Starkrismson RCN R090494
2 0.2 1 × 1729 1 × 1996 Fruit 7
0.061 0.065 (0.063)
< 0.02 < 0.02
< 0.01 < 0.01
< 0.01 < 0.01
375302 2011/7000143
USA, 2010 Grant, WA
Broad-cast foliar 2 0.2 1 × 607
1 × 610 Fruit 1 0.217 0.226
< 0.02 < 0.02
< 0.01 < 0.01
< 0.01 < 0.01
M. T. White 2011
Concord RCN R090495
3 0.206 0.203
< 0.02 < 0.02
< 0.01 < 0.01
< 0.01 < 0.01
375302 2011/7000143
7 0.125 0.106 (0.1155)
< 0.02 < 0.02
0.014 < 0.01
0.012 < 0.01
10 0.086 0.116
< 0.02 < 0.02
0.010 0.013
< 0.01 0.012
14 0.055 0.079
< 0.02 < 0.02
< 0.01 0.014
< 0.01 0.011
2 0.2 1 × 1398 1 × 1401 Fruit 1 0.215
0.231 < 0.02 < 0.02
< 0.01 < 0.01
< 0.01 < 0.01
3 0.231 0.170
< 0.02 < 0.02
0.012 0.010
0.011 < 0.01
7 0.125 0.114 (0.1195)
< 0.02 < 0.02
0.012 0.013
0.011 0.012
10 0.081 0.100
< 0.02 < 0.02
0.012 0.012
< 0.01 < 0.01
14 0.063 0.077
< 0.02 < 0.02
0.011 0.012
< 0.01 < 0.01
USA, 2010 Grant, WA
Broad-cast foliar 2 0.2 1 × 610
1 × 608 Fruit 7 0.089 0.124 (0.1065)
< 0.02 < 0.02
0.013 0.016
0.011 0.014
M. T. White 2011
Bartlett RCN R090496
2 0.2 1 × 1403
1 × 1396 Fruit 7 0.085 0.125 (0.105)
< 0.02 < 0.02
0.010 0.011
< 0.01 < 0.01
375302 2011/7000143
a Metabolite residues expressed in parent equivalents. n.r.= Not reported

250 Cyflumetofen
Berries and Other Small Fruits
Grapes
During the 2009 growing season, a total of 12 trials were conducted on grapes in the USA (two trials in New York, eight in California, one in Washington, and one in Oregon. One in California was a decline trial. In all trials, two broadcast foliar applications of 200 g/L SC formulation of cyflumetofen at 0.193–0.206 kg ai/ha were made with a 14–15 re-treatment interval. The applications were made with ground equipment using either a dilute or concentrated spray volume. Grape Samples were collected at 14 DAT. In the decline trial, the samples were collected at 0, 3, 7, 14, 21 and 28 DAT.
Samples of grape were analysed for residues of cyflumetofen and metabolites B-l, AB-6 and AB-7 using Method D1003. Acceptable concurrent recovery data for grape commodities between 69% and 111% were obtained for each analyte. The LOQ was 0.01 mg/kg for each analyte.
Table 66 Results of supervised residue trials on Grapes conducted in the USA
CROP Country, Year Location variety Trial No.
Application
Portion analysed
DAT d
Residues (mg eq/kg) a Author Report Year Study No. DocID.
Method No. Rate kg ai/ha
Spray volume L/ha
Parent B-1 AB-6 AB-7
US GAP 2 0.2 Min. 468 14 (Interval: 14 days) USA, 2009 Seneca, NY Catawba R090511
broadcast foliar application
2 0.20 1 × 2313 1 × 2354 Fruit 14
0.252 0.290 (0.271)
0.064 0.061 (0.0625)
< 0.01 < 0.01
< 0.01 < 0.01
D. R. Hattermann, T. Lott, 2011 375306 2011/7003995
USA, 2009 Yates, NY Vidal Blanc R090512
broadcast foliar application
2 0.20 1 × 466 1 × 473 Fruit 14
0.406 0.439 (0.4225)
0.040 0.045 (0.0425)
< 0.01 < 0.01
< 0.01 < 0.01
D. R. Hattermann, T. Lott, 2011 375306 2011/7003995
USA, 2009 Kern, CA Thompson Seedless R090513
broadcast foliar application
2 0.20 1 × 721 1 × 703 Fruit 14
0.073 0.124 (0.0985)
0.024 0.024 (0.024)
< 0.01 < 0.01
< 0.01 < 0.01
D. R. Hattermann, T. Lott, 2011 375306 2011/7003995
USA, 2009 Kingsberg Fresno, CA Crimson R090514
broadcast foliar application
2 0.20 1 × 1884 1 × 1889 Fruit 14
0.175 0.151 (0.163)
0.035 0.040 (0.0375)
0.013 0.016
0.013 0.015
D. R. Hattermann, T. Lott, 2011 375306 2011/7003995
USA, 2009 San Luis Obispo, CA Syrah R090515
broadcast foliar application
2 0.20 1 × 466 1 × 448 Fruit 14
0.014 0.031 (0.0225)
< 0.02 < 0.02
< 0.01 < 0.01
< 0.01 < 0.01
D. R. Hattermann, T. Lott, 2011 375306 2011/7003995
USA, 2009 Monterey, CA Syrah R090516
broadcast foliar application
2 0.20 0.20
1 × 628 1 × 602 Fruit 14
0.102 0.085 (0.0935)
0.024 0.024 (0.024)
0.011 < 0.01
< 0.01 < 0.01
D. R. Hattermann, T. Lott, 2011 375306 2011/7003995
USA, 2009 Kerman Fresno, CA Thompson Seedless R090517
broadcast foliar application
2 0.20 0.20
1 × 1876 1 × 1886 Fruit 14
0.125 0.117 (0.121)
0.071 0.061 (0.066)
0.013 0.013
0.012 0.011
D. R. Hattermann, T. Lott, 2011 375306 2011/7003995
USA, 2009 Kerman Fresno, CA Thompson Seedless R090518
broadcast foliar application
2 0.20 0.20
1 × 704 1 × 694 Fruit 14
0.126 0.121 (0.1235)
0.040 0.038 (0.039)
0.013 0.016
0.014 0.016
D. R. Hattermann, T. Lott, 2011 375306 2011/7003995
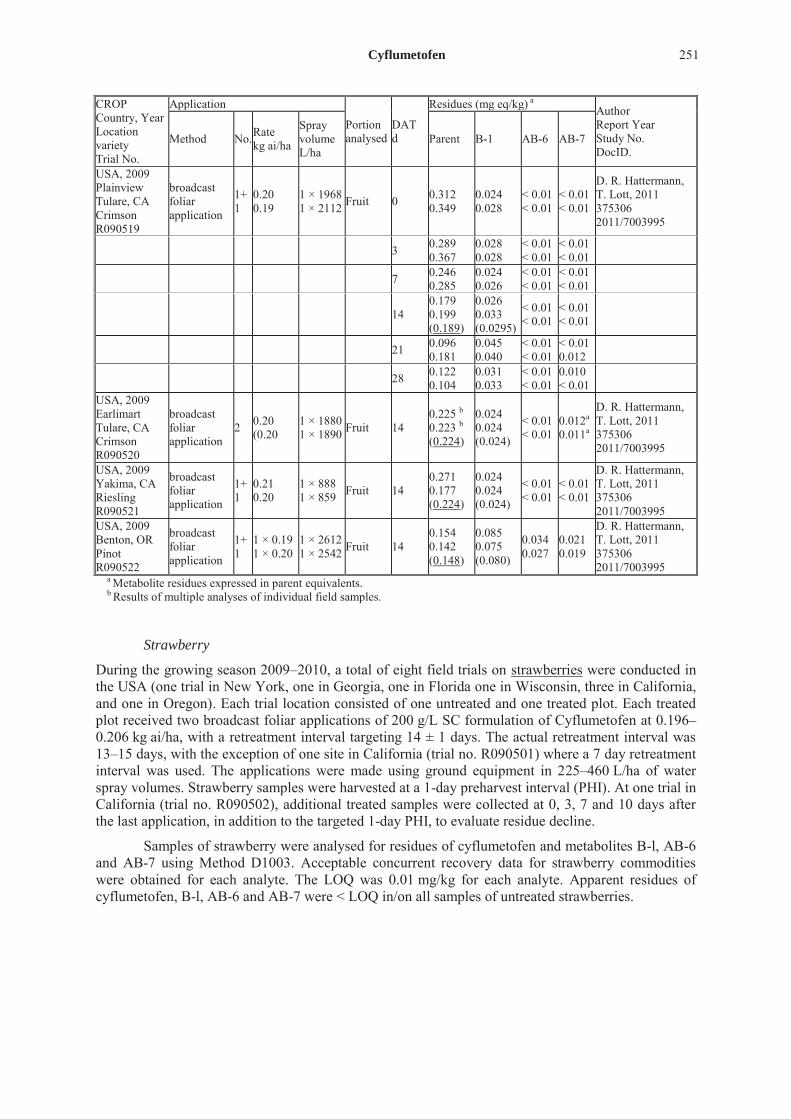
Cyflumetofen 251
CROP Country, Year Location variety Trial No.
Application
Portion analysed
DAT d
Residues (mg eq/kg) a Author Report Year Study No. DocID.
Method No. Rate kg ai/ha
Spray volume L/ha
Parent B-1 AB-6 AB-7
USA, 2009 Plainview Tulare, CA Crimson R090519
broadcast foliar application
1+ 1
0.20 0.19
1 × 1968 1 × 2112 Fruit 0 0.312
0.349 0.024 0.028
< 0.01 < 0.01
< 0.01 < 0.01
D. R. Hattermann, T. Lott, 2011 375306 2011/7003995
3 0.289 0.367
0.028 0.028
< 0.01 < 0.01
< 0.01 < 0.01
7 0.246 0.285
0.024 0.026
< 0.01 < 0.01
< 0.01 < 0.01
14 0.179 0.199 (0.189)
0.026 0.033 (0.0295)
< 0.01 < 0.01
< 0.01 < 0.01
21 0.096 0.181
0.045 0.040
< 0.01 < 0.01
< 0.01 0.012
28 0.122 0.104
0.031 0.033
< 0.01 < 0.01
0.010 < 0.01
USA, 2009 Earlimart Tulare, CA Crimson R090520
broadcast foliar application
2 0.20 (0.20
1 × 1880 1 × 1890 Fruit 14
0.225 b 0.223 b
(0.224)
0.024 0.024 (0.024)
< 0.01 < 0.01
0.012a 0.011a
D. R. Hattermann, T. Lott, 2011 375306 2011/7003995
USA, 2009 Yakima, CA Riesling R090521
broadcast foliar application
1+ 1
0.21 0.20
1 × 888 1 × 859 Fruit 14
0.271 0.177 (0.224)
0.024 0.024 (0.024)
< 0.01 < 0.01
< 0.01 < 0.01
D. R. Hattermann, T. Lott, 2011 375306 2011/7003995
USA, 2009 Benton, OR Pinot R090522
broadcast foliar application
1+ 1
1 × 0.19 1 × 0.20
1 × 2612 1 × 2542 Fruit 14
0.154 0.142 (0.148)
0.085 0.075 (0.080)
0.034 0.027
0.021 0.019
D. R. Hattermann, T. Lott, 2011 375306 2011/7003995
a Metabolite residues expressed in parent equivalents. b Results of multiple analyses of individual field samples.
Strawberry
During the growing season 2009–2010, a total of eight field trials on strawberries were conducted in the USA (one trial in New York, one in Georgia, one in Florida one in Wisconsin, three in California, and one in Oregon). Each trial location consisted of one untreated and one treated plot. Each treated plot received two broadcast foliar applications of 200 g/L SC formulation of Cyflumetofen at 0.196–0.206 kg ai/ha, with a retreatment interval targeting 14 ± 1 days. The actual retreatment interval was 13–15 days, with the exception of one site in California (trial no. R090501) where a 7 day retreatment interval was used. The applications were made using ground equipment in 225–460 L/ha of water spray volumes. Strawberry samples were harvested at a 1-day preharvest interval (PHI). At one trial in California (trial no. R090502), additional treated samples were collected at 0, 3, 7 and 10 days after the last application, in addition to the targeted 1-day PHI, to evaluate residue decline.
Samples of strawberry were analysed for residues of cyflumetofen and metabolites B-l, AB-6 and AB-7 using Method D1003. Acceptable concurrent recovery data for strawberry commodities were obtained for each analyte. The LOQ was 0.01 mg/kg for each analyte. Apparent residues of cyflumetofen, B-l, AB-6 and AB-7 were < LOQ in/on all samples of untreated strawberries.

252 Cyflumetofen
Table 67 Results of supervised residue trials on Strawberry conducted in the USA.
CROP Country, Year Location variety Trial No.
Application
Portion analysed
DAT d
Residues (mg eq/kg) a Author Report Year Study No. DocID.
Method No. Rate kg ai/ha
Spray volume L/ha
Parent B-1 AB-6 AB-7
US GAP 2 0.2 Min. 468 1 (Interval: 14 days) USA, 2010 Dane, WI L’Amour R090497
Broad-cast foliar 2 0.2 1 × 245
1 × 250 Berry 1 0.04 0.04 (0.04)
< 0.02 < 0.02
< 0.01 < 0.01
< 0.01 < 0.01
M. White, M. Saha 2011 375304 2010/7014999
USA, 2010 Tift, GA Camarosa R090498
Broad-cast foliar 2 0.2 1 × 237
1 × 225 Berry 1 0.11 0.09 (0.10)
0.031 0.026 (0.0285)
< 0.01 < 0.01
< 0.01 < 0.01
M. White, M. Saha 2011 375304 2010/7014999
USA, 2009 Washington, OR Albion R090499
Broad-cast foliar 2 0.2 2 × 235 Berry 1
0.23 0.18 (0.205)
0.032 0.029 (0.0305)
< 0.01 < 0.01
< 0.01 < 0.01
M. White, M. Saha 2011 375304 2010/7014999
USA, 2010 Yates, NY Honeoye R090500
Broad-cast foliar 2 0.2 1 × 455
1 × 460 Berry 1 0.15 0.18 (0.165)
0.028 0.032 (0.030)
< 0.01 < 0.01
< 0.01 < 0.01
M. White, M. Saha 2011 375304 2010/7014999
USA, 2010 Tulare, CA Diamante R090501
Broad-cast foliar 2 0.2 1 × 306
1 × 300 Berry 1 0.21 0.25 (0.23)
< 0.02 0.104 (0.052)
< 0.01 < 0.01
< 0.01 < 0.01
M. White, M. Saha 2011 375304 2010/7014999
USA, 2009 Santa Barbara,
Broad-cast foliar 2 0.2 2 × 374 Berry 0 0.16
0.21 < 0.02 < 0.02
< 0.01 < 0.01
< 0.01 < 0.01
M. White, M. Saha 2011
CA Albion R090502
1 0.11 0.14 (0.125)
< 0.02 < 0.02
< 0.01 < 0.01
< 0.01 < 0.01
375304 2010/7014999
3 0.16 0.11 (0.135)
0.028 < 0.02 (0.024)
< 0.01 < 0.01
< 0.01 < 0.01
7 0.15 0.11
0.026 0.027
< 0.01 < 0.01
< 0.01 < 0.01
10 0.10 0.09
0.025 < 0.02
< 0.01 < 0.01
< 0.01 < 0.01
USA, 2010 Madera, CA San Andreas R090503
Broad-cast foliar 2 0.2 1 × 284
1 × 279 Berry 1 0.16 0.12 (0.14)
0.025 0.025
< 0.01 < 0.01
< 0.01 < 0.01
M. White, M. Saha 2011 375304 2010/7014999
USA, 2010 Lake, FL Camarosa R090504
Broad-cast foliar 2 0.2 1 × 371
1 × 370 Berry 1 0.29 0.44 (0.365)
0.037 0.035 (0.036)
< 0.01 < 0.01
< 0.01 < 0.01
M. White, M. Saha 2011 375304 2010/7014999
a Metabolite residues expressed in parent equivalents.
Fruiting vegetables, other than Cucurbits (Tomato, eggplant)
During the growing season 2009–2010, a total of 16 field trials were conducted on tomatoes in the USA (one trial in New York, one in Georgia, two in Florida, one in Kansas, 10 in California and one in Arizona). Two of these trials were decline trials (one trial in NY and the other in CA). At each test location, one untreated and one treated plot were established. The treated plot received two broadcast foliar applications of 200 g/L CS formulation of cyflumetofen at 0.196–0.211 kg ai/ha/application, with a 14-day (+/– one day) re-treatment interval. The applications were made with ground equipment using 115–472 L/ha of water. Commercially mature, tomato samples were collected 3 days after treatment (DAT).

Cyflumetofen 253
All samples were analysed for residues of cyflumetofen, and its metabolites, B-1, AB-6, and AB-7, using Method D1003. Mean recoveries for all analytes were within the acceptable range of 70–120%. Three individual recoveries were in the range of 65–69%. The LOD and LOQ for all analytes were 0.002 and 0.01 mg/kg, respectively.
Table 68 Results of supervised residue trials on Tomato conducted in the USA.
CROP Country, Year Location variety Trial No.
Application
Portion analysed
DAT d
Residues (mg eq/kg) a Author Report Year Study No. DocID.
Method No. Rate kg ai/ha
Spray volume L/ha
Parent B-1 AB-6 AB-7
US GAP 2 0.2 Min. 468 3 (Interval: 14 days) USA,2009 Wayne, NY
Backpack hand- boom 2 0.2 2 × 234 Fruit 0 0.23
0.14 < 0.02 < 0.02
< 0.01 < 0.01
< 0.01 < 0.01
L.E. Crawford 2011
Basket Vee R090531 1 0.04
0.03 < 0.02 < 0.02
< 0.01 < 0.01
< 0.01 < 0.01
375305 2011/7002631
3 < 0.01 0.05 (0.03)
< 0.02 < 0.02
< 0.01 < 0.01
< 0.01 < 0.01
7 0.02 0.11 (0.064)
< 0.02 0.04 (0.03)
< 0.01 < 0.01
< 0.01 < 0.01
14 < 0.01 < 0.01
< 0.02 < 0.02
< 0.01 < 0.01
< 0.01 < 0.01
21 < 0.01 < 0.01
< 0.02 < 0.02
< 0.01 < 0.01
< 0.01 < 0.01
USA, 2009 Tift, GA Mountain Fresh R090532
Backpack hand- boom 2 0.2 1 × 345
1 × 352 Fruit 3 0.03 0.04 (0.035)
< 0.02 < 0.02
< 0.01 < 0.01
< 0.01 < 0.01
L.E. Crawford 2011 375305 2011/7002631
USA, 2009 Jackson, FL BHN602 R090533
Backpack hand- boom 2 0.2 2 × 347 Fruit 3
0.02 0.06 (0.04)
< 0.02 < 0.02
< 0.01 < 0.01
< 0.01 < 0.01
L.E. Crawford 2011 375305 2011/7002631
USA, 2009 Seminole, FL Better Boy R090534
Backpack hand- boom 2 2 × 0.2 1 × 284
1 × 280 Fruit 3 0.03 0.02 (0.025)
0.05 0.02 (0.035)
< 0.01 < 0.01
< 0.01 < 0.01
L.E. Crawford 2011 375305 2011/7002631
USA, 2009 Barber, KS Early Girl R090535
Backpack hand- boom 2 0.2 1 × 115
1 × 149 Fruit 3 0.07 0.07 (0.07)
0.02 0.02 (0.02)
< 0.01 < 0.01
< 0.01 < 0.01
L.E. Crawford 2011 375305 2011/7002631
USA, 2009 Fresno, CA 2401 R090536
Backpack hand- boom 2 0.2 1 × 467
1 × 472 Fruit 3 0.01 0.02 (0.015)
< 0.02 < 0.02
< 0.01 < 0.01
< 0.01 < 0.01
L.E. Crawford 2011 375305 2011/7002631
USA, 2009 Merced, CA Heinz 2780 R090537
Backpack hand- boom 2 0.2 2 × 466 Fruit 3
0.06 0.07 (0.065)
< 0.02 < 0.02
< 0.01 < 0.01
< 0.01 < 0.01
L.E. Crawford 2011 375305 2011/7002631
USA, 2010 Kerman Fresno, CA Sun 6366 R090538
Backpack hand- boom 2 0.2 1 × 189
1 × 187 Fruit 3 0.04 0.03 (0.035)
< 0.02 < 0.02
< 0.01 < 0.01
< 0.01 < 0.01
L.E. Crawford 2011 375305 2011/7002631
USA, 2010 Kwerman Fresno, CA APT 410 R090539
Backpack hand- boom 2 0.2 1 × 189
1 × 187 Fruit 3 0.04 0.05 (0.045)
< 0.02 < 0.02
< 0.01 < 0.01
< 0.01 < 0.01
L.E. Crawford 2011 375305 2011/7002631
USA, 2010 Porterville
Backpack hand- boom 2 0.2 1 × 339
1 × 335 Fruit 0 0.06 0.05
< 0.02 < 0.02
< 0.01 < 0.01
< 0.01 < 0.01
L.E. Crawford 2011

254 Cyflumetofen
CROP Country, Year Location variety Trial No.
Application
Portion analysed
DAT d
Residues (mg eq/kg) a Author Report Year Study No. DocID.
Method No. Rate kg ai/ha
Spray volume L/ha
Parent B-1 AB-6 AB-7
Tular, CA Tom Whopper
1 0.02 0.03
0.02 0.02
< 0.01 < 0.01
< 0.01 < 0.01
375305 2011/7002631
R090540 3
0.02 0.02 (0.02)
0.05 0.02 (0.035)
< 0.01 < 0.01
< 0.01 < 0.01
7 0.02 0.01
0.07 0.02
< 0.01 < 0.01
< 0.01 < 0.01
14 < 0.01 0.01
0.07 0.09
< 0.01 < 0.01
< 0.01 < 0.01
21 < 0.01 < 0.01
0.02 0.05
< 0.01 < 0.01
< 0.01 < 0.01
USA, 2010 Porterville Tular, CA ACE 55 VF (AS) R090541
Backpack hand- boom 2 0.2 1 × 337
1 × 335 Fruit 3 0.05 0.07 (0.06)
< 0.02 0.02
< 0.01 < 0.01
< 0.01 < 0.01
L.E. Crawford 2011 375305 2011/7002631
USA, 2009 Tular, CA Naoni Cherry (CT) R090542
Tractor mounted sprayer
2 0.2 1 × 363 1 × 383 Fruit 3
0.12 0.12 (0.12)
0.07 0.05 (0.06)
< 0.01 < 0.01
< 0.01 < 0.01
L.E. Crawford 2011 375305 2011/7002631
USA, 2009 King City Monterey, CA 8004 R090543
Backpack hand- boom 2 0.2 1 × 274
1 × 283 Fruit 3 0.03 0.04 (0.035)
< 0.02 < 0.02
< 0.01 < 0.01
< 0.01 < 0.01
L.E. Crawford 2011 375305 2011/7002631
USA, 2009 San Ardo Monterey, CA 8004 R090544
Backpack hand- boom 2 0.2 1 × 288
1 × 281 Fruit 3 0.10 0.08 (0.09)
< 0.02 < 0.02
< 0.01 < 0.01
< 0.01 < 0.01
L.E. Crawford 2011 375305 2011/7002631
USA, 2009 Tehama, CA APT 410 R090545
Backpack hand- boom 2 0.2 2 × 187 Fruit 3
0.16 0.14 (0.15)
< 0.02 < 0.02
0.02 0.01
0.03 0.02
L.E. Crawford 2011 375305 2011/7002631
USA, 2010 Yuma, AZ Montain Fresh R090546
Backpack hand- boom 2 0.2 1 × 230
1 × 229 Fruit 3 0.01 0.01 (0.01)
< 0.02 < 0.02
< 0.01 < 0.01
< 0.01 < 0.01
L.E. Crawford 2011 375305 2011/7002631
a Metabolite residues expressed in parent equivalents.
During the growing season 2004, two trials were conducted on eggplants in greenhouses in Japan to determine the magnitude of the residues of cyflumetofen after treatment with 20% SC formulation of cyflumetofen. The formulation was applied two times at an application rate of 0.400 kg ai/ha and a spray volume of 2000 L/ha. The samples were taken at 1, 3, 7 and 21 days after the last application. The residues of cyflumetofen were determined by LC-UV detection. The LOQ was 0.05 mg/kg.
Table 69 Results of supervised residue trials on Eggplant conducted in Japan
CROP Country, Year Location variety Trial No.
Application
Portion analysed
DAT d
Residues (mg eq/kg) a Author Report Year Study No. DocID.
Method No. Rate kg ai/ha
Spray volume L/ha
Parent B-1 AB-6 AB-7
GAP in Japan 2 0.02 kg ai/hL (1000–3500) 1

Cyflumetofen 255
CROP Country, Year Location variety Trial No.
Application
Portion analysed
DAT d
Residues (mg eq/kg) a Author Report Year Study No. DocID.
Method No. Rate kg ai/ha
Spray volume L/ha
Parent B-1 AB-6 AB-7
Japan, 2004 Kochi
n.r. 2 0.40 2 × 2000 Fruit (calyx removed)
1 0.35 0.32 (0.335)
0.06 0.05
< 0.05 < 0.05
< 0.05 < 0.05
n.r. 2004
Ryuma n.r. 3 0.28
0.24 0.06 0.06
< 0.05 < 0.05
< 0.05 < 0.05
Saku 16-P-2-48 OTSA-0203 (2)-FR
(greenhouse) 7 0.06 0.06
0.09 0.09
< 0.05 < 0.05
< 0.05 < 0.05
21 < 0.05 < 0.05
0.13 0.12
< 0.05 < 0.05
< 0.05 < 0.05
Japan, 2004 Miyazaki n.r. 2 0.40 2 × 2000
Fruit (calyx removed)
1 0.46 0.45 (0.455)
0.43 0.42
< 0.05 < 0.05
< 0.05 < 0.05 n.r.
2004
Kokuyo n.r. 3 0.37
0.36 0.50 0.49
< 0.05 < 0.05
< 0.05 < 0.05
Saku 16-P-2-48 OTSA-0203 (2)-FR
(greenhouse) 7 0.06 0.06
0.58 0.58
< 0.05 < 0.05
< 0.05 < 0.05
21 < 0.05 < 0.05
0.26 0.25
< 0.05 < 0.05
< 0.05 < 0.05
a Metabolite residues expressed in parent equivalents. n.r. = Not reported
Tree nuts (Almond and pecan)
During the growing season 2009, five trials were conducted on almonds in California in the USA. Each trial consisted of one untreated control and one treated plot except for sites that where both dilute and concentrate applications in which case there were two treated plots and one non-treated plot. For the concentrate plots, the treated plot received two air-blast foliar broadcast applications of 200 g/L SC formulation of cyflumetofen at 0.195–0.202 kg ai/ha, with a 14 day re-treatment interval. The applications were made with ground equipment using 469–656 L/ha of water. For the dilute plots, the treated plot received two airblast foliar broadcast applications of 200 g/L SC formulation of cyflumetofen at 0.197–0.200 kg ai/ha/, with a 13–14 day re-treatment interval. The applications were made with ground equipment using 1219–1875 L/ha of water. Almond samples were harvested 7 days after the last application for all trials except the decline trial (R090478). For the decline trial, samples were collected 0, 1, 3, 7, 14, and 21 days after the last application.
All samples were analysed for residues of cyflumetofen, and its metabolites, B-1, AB-6, and AB-7, using Method D1003. Mean recoveries for all analytes were within the acceptable range of 70–120%. The LOD and LOQ for all analytes were 0.002 and 0.01 mg/kg, respectively.
During the growing season 2009, five trials were conducted on pecans in the USA (two trials in Georgia, one in Louisiana, one in Texas and one in Oklahoma. Each trial consisted of one untreated control and one treated plot except for sites that where both dilute and concentrate applications in which case there were two treated plots and one non-treated plot. For the concentrate plots, the treated plot received two air-blast foliar broadcast applications of 200 g/L SC formulation of cyflumetofen at 0.195–0.204 kg ai/ha, with a 13–14 day re-treatment interval. The applications were made with ground equipment using 540–794 L/ha of water. For the dilute plots, the treated plot received two airblast foliar broadcast applications of 200 g/L SC formulation of Cyflumetofen at 0.198–0.205 kg ai/ha, with a 13–14 day re-treatment interval. The applications were made with ground equipment using 1104–2376 L/ha of water. Pecan samples were harvested 7 or 8 days after the last application.
All samples were analysed for residues of cyflumetofen, and its metabolites, B-1, AB-6, and AB-7, using Method D1003. Mean recoveries for all analytes were within the acceptable range of 70–120%. The LOD and LOQ for all analytes were 0.002 and 0.01 mg/kg, respectively.

256 Cyflumetofen
Table 70 Results of supervised residue trials on Almonds and Pecans conducted in the USA
CROP Country, Year Location variety Trial No.
Application
Portion analysed
DAT d
Residues (mg eq/kg) a Author Report Year Study No. DocID.
Method No. Rate kg ai/ha
Spray volume L/ha
Parent B-1 AB-6 AB-7
US GAP 2 0.2 Min. 935 7 (Interval: 14 days) ALMOND USA, 2009 Fresno, CA Non-Pariel R090474
Airblast foliar broadcast
2 0.20 1 × 1848 1 × 1875 Nutmeat 7
< 0.01 < 0.01 (< 0.01)
< 0.02 < 0.02
< 0.01 < 0.01
< 0.01 < 0.01
L. E. Crawford 2011 375303 2011/7003996
USA, 2009 Kern, CA Price R090475
Airblast foliar broadcast
2 0.20 1 × 656 1 × 610 Nutmeat 7
< 0.01 < 0.01 (< 0.01)
< 0.02 < 0.02
< 0.01 < 0.01
< 0.01 < 0.01
L. E. Crawford 2011 375303 2011/7003996
USA, 2009 Tulare, CA Carmel R090476
Airblast foliar broadcast
2 0.20 1 × 1813 1 × 1675 Nutmeat 7
< 0.01 < 0.01 (< 0.01)
< 0.02 < 0.02
< 0.01 < 0.01
< 0.01 < 0.01
L. E. Crawford 2011 375303 2011/7003996
USA, 2009 Glenn, CA Non-Pariel R090477
Airblast foliar broadcast
2 0.20 1 × 469 1 × 473 Nutmeat 7
< 0.01 < 0.01 (< 0.01)
< 0.02 < 0.02
< 0.01 < 0.01
< 0.01 < 0.01
L. E. Crawford 2011 375303 2011/7003996
USA, 2009 Tulare, CA
Airblast foliar 2 0.20 1 × 1219
1 × 1476 Nutmeat 0 < 0.01 < 0.01
< 0.02 < 0.02
< 0.01 < 0.01
< 0.01 < 0.01
L. E. Crawford 2011
Monterey R090478
broadcast 1 < 0.01 < 0.01
< 0.02 < 0.02
< 0.01 < 0.01
< 0.01 < 0.01
375303 2011/7003996
3 < 0.01 < 0.01
< 0.02 < 0.02
< 0.01 < 0.01
< 0.01 < 0.01
7 < 0.01 < 0.01 (< 0.01)
< 0.02 < 0.02
< 0.01 < 0.01
< 0.01 < 0.01
14 < 0.01 < 0.01
< 0.02 < 0.02
< 0.01 < 0.01
< 0.01 < 0.01
21 < 0.01 < 0.01
< 0.02 < 0.02
< 0.01 < 0.01
< 0.01 < 0.01
PECAN USA, 2009 Tift, GA Sumner R090469
Airblast foliar broadcast
2 0.20 1 × 2081 1 × 1999 Nutmeat 7
< 0.01 < 0.01 (< 0.01)
< 0.02 < 0.02
< 0.01 < 0.01
< 0.01 < 0.01
L. E. Crawford 2011 375303 2011/7003996
USA, 2009 Irwin, GA Sumner R090470
Airblast foliar broadcast 2 0.20 1 × 667
1 × 648 Nutmeat 7 < 0.01 < 0.01 (0.01)
< 0.02 < 0.02
< 0.01 < 0.01
< 0.01 < 0.01
L. E. Crawford 2011 375303 2011/7003996
USA, 2009 Rapides Parish, LA
Airblast foliar broadcast
2 0.20 1 × 1909 1 × 1821 Nutmeat 7
< 0.01 < 0.01 (< 0.01)
< 0.02 < 0.02
< 0.01 < 0.01
< 0.01 < 0.01
L. E. Crawford 2011 375303
Creek R090471
1 × 743
1 × 794 Nutmeat 7 < 0.01 < 0.01 (< 0.01)
< 0.02 < 0.02
< 0.01 < 0.01
< 0.01 < 0.01
2011/7003996
USA, 2009 Jackson, OK
Airblast foliar broadcast
2 0.20 1 × 2376 1 × 2312 Nutmeat 8
< 0.01 < 0.01 (< 0.01)
< 0.02 < 0.02
< 0.01 < 0.01
< 0.01 < 0.01
L. E. Crawford 2011 375303
Cheyenne R090472
1 × 740
1 × 731 Nutmeat 8 < 0.01 < 0.01 (< 0.01)
< 0.02 < 0.02
< 0.01 < 0.01
< 0.01 < 0.01
2011/7003996
USA, 2009 Frio, TX Wichita
Airblast foliar broadcast
2 0.20 1 × 1159 1 × 1104 Nutmeat 7
< 0.01 < 0.01 (< 0.01)
< 0.02 < 0.02
< 0.01 < 0.01
< 0.01 < 0.01
L. E. Crawford 2011 375303
R090473 1 × 558
1 × 540 Nutmeat 7 < 0.01 < 0.01 (< 0.01)
< 0.02 < 0.02
< 0.01 < 0.01
< 0.01 < 0.01
2011/7003996

Cyflumetofen 257
a Metabolite residues expressed in parent equivalents.
Animal feeds
Almond hulls
Table 71 Results of supervised residue trials on Almond hulls conducted in the USA
CROP Country, Year Location variety Trial No.
Application
Portion analysed
DAT d
Residues (mg/kg) a Author Report Year Study No. DocID.
Method No. Rate kg ai/ha
Spray volume L/ha
Parent B-1 AB-6 AB-7
US GAP 0.2 Min. 935 7 (Interval: 14 days) ALMOND USA, 2009 Fresno, CA Non-Pariel R090474
Airblast foliar broadcast
2 0.20 1 × 1848 1 × 1875 Hull 7
2.046 1.696 (1.871)
0.294 0.191 (0.242)
0.227 0.189
0.137 0.116
L. E. Crawford 2011 375303 2011/7003996
USA, 2009 Kern, CA Price R090475
Airblast foliar broadcast
2 0.20 1 × 656 1 × 610 Hull 7
0.522 0.545 (0.534)
0.092 0.094 (0.093)
0.074 0.076
0.021 0.022
L. E. Crawford 2011 375303 2011/7003996
USA, 2009 Tulare, CA Carmel R090476
Airblast foliar broadcast
2 0.20 1 × 1813 1 × 1675 Hull 7
0.840 0.887 (0.864)
0.106 0.115 (0.111)
0.102 0.096
0.040 0.041
L. E. Crawford 2011 375303 2011/7003996
USA, 2009 Glenn, CA Non-Pariel R090477
Airblast foliar broadcast
2 0.20 1 × 469 1 × 473 Hull 7
0.339 0.364 (0.352)
0.028 0.026 (0.027)
0.073 0.073
0.025 0.025
L. E. Crawford 2011 375303 2011/7003996
USA, 2009 Tulare, CA
Airblast foliar 2 0.20 1 × 1219
1 × 1476 Hull 0 0.737 0.885
0.045 0.035
0.104 0.098
0.027 0.026
L. E. Crawford 2011
Monterey R090478
broadcast 1 0.758 0.829
0.045 0.049
0.107 0.097
0.031 0.028
375303 2011/7003996
3 0.464 0.481
0.040 0.045
0.101 0.098
0.029 0.027
7 0.628 0.437 (0.533)
0.028 0.028
0.101 0.103
0.027 0.030
14 0.305 0.349
0.033 0.038
0.098 0.105
0.025 0.027
21 0.598 0.520 (0.559)
0.125 0.099 (0.112)
0.104 0.102
0.046 0.038
a Metabolite residues expressed in parent equivalents.
FATE OF RESIDUES IN STORAGE AND PROCESSING
In processing
The Meeting received information on the fate of residues of Cyflumetofen during hydrolysis and processing of oranges, apples, grapes and tomato reflecting the relevant processing procedures and household preparations.
Hydrolysis (Hassing, J, 2013a)
To simulate the degradation of cyflumetofen during pasteurization, hydrolysis of cyflumetofen was tested using benzoyl-ring-U-14C labelled and t-butylpheny-ring-U-14C labelled cyflumetofen in aqueous buffer solutions at pH 4, 5 and 6 under reflux at 90 °C for 20 min. Due to the rapid degradation of cyflumetofen under the light, each test procedure was done in the dark.

258 Cyflumetofen
Also for simulating baking, brewing and boiling, the test was conducted similarly but under reflux at 100 °C for 60 minutes. For sterilization, the test was conducted at about 120 °C in an autoclave for 20 minutes.
Aliquots were taken right before starting a test and at the end of the test for LSC-measurements after cooling of the solution. Additionally, aliquots for HPLC-analysis were taken before and at the end of a test. Because of the photolytic and hydrolytic instability of the test item and its metabolites, no work-up for an eventual confirmation by MS-analysis could be performed. Direct MS-analysis was not possible due to the low concentration of the test item especially metabolites in the samples.
The following table demonstrates the results of hydrolysis tests using the radioactive Cyflumetofen labelled at different positions.
Table 72 Effect of hydrolysis on Cyflumetofen simulating pasteurization, baking, brewing and boiling, and sterilization
Simulated process Hydrolysis condition % TAR pH Temp
°C Time, min
Parent B-1 AB-1 Others Sum
[Benzoyl-ring-U-14C]-cyflumetofen Pasteurization 4 90 20 70.9 23.2 4.2 nd 98.3 Baking, brewing and boiling
5 100 60 17.9 58.7 31.7 nd 108.2
Sterilization 6 120 20 Nd 75.3 38.8 1.0 115.1 Simulated process Hydrolysis condition % TAR
pH Temp °C
Time, min
Parent A-2 AB-1 Others Sum
[t-Butylphenyl-ring-U-14C]-cyflumetofen Pasteurization 4 90 20 69.3 14.3 Nd 15.4 99.1 Baking, brewing and boiling
5 100 60 5.0 52.9 39.9 4.3 102.2
Sterilization 6 120 20 Nd 44.4 49.1 1.8 95.2 nd =not detected
No loss of radioactivity of the both radio-labelled cyflumetofen occurred during heating in buffers of pH 4, 5 and 9 at 90–120 °C for 20 min or 60 min.
At the pH 4/90 °C condition, benzoyl-ring labelled cyflumetofen was degraded to 70.9% after 20 min. The major degradate was metabolite B-1 (23.2% TAR) followed by AB-1 (4.2% TAR). At the pH 5/100 °C condition, benzoyl-ring labelled cyflumetofen was degraded to 17.9% after 20 min. The major metabolites were B-1 (58.7% TAR) and AB-1 (31.7% TAR). At the pH 6/120 °C condition, benzoyl-ring labelled cyflumetofen was completely degraded to B-1 (75.3% TAR) and AB-1 (38.8% TAR) after 60 min.
At pH 4/90 °C, t-butylphenyl-ring labelled cyflumetofen was degraded to 68.3% TAR. The main metabolite was A-2 (14.3% TAR) with no other metabolite no more than 5% TAR. At pH 5/100 °C, t-butylphenyl-ring labelled cyflumetofen was degraded to 5.0%. The main metabolites were A-2 (52.9% TAR) and AB-1 (39.9% TAR). At pH 6/120 °C, t-butylphenyl-ring labelled cyflumetofen was completely degraded to A-2 (44.4% TAR) and AB-1 (49.1% TAR).
These results indicate that the higher the temperature of heating, the more cyflumetofen degrades and heating splits the Cyflumetofen into t-butylphenyl ring and benzoyl ring.
Oranges (Hattermann & Cowen, 2011c)
In two trials conducted in Florida and California in the USA during the 2009 growing season, 200 g/L SC formulation of cyflumetofen was applied as two foliar broadcast sprays to oranges at a target rate of 1.0 kg ai/ha (5 times GAP rate), with a 14-day re-treatment interval. The actual rate in the trials was 1.00 to 1.02 kg ai/ha, with a 14–15-day re-treatment interval. One trial had the application made in a concentrated spray volume and one in a dilute spray volume of 703 and 2457 L/ha of water,

Cyflumetofen 259
respectively, using ground equipment. Orange samples were harvested 7 days after the last application and sent for processing into processed commodities.
Two bulk samples were sent for processing, one treated and one untreated. These bulk orange samples were separately processed (untreated first) using simulated commercial processing procedures for citrus production to generate the required fractions of unwashed fruit, peel, wet pomace, dried pulp, meal, molasses, marmalade, fresh juice and citrus oil with slight variation to the commercial methodology.
The residues of cyflumetofen, B-1, AB-6, and AB-7 in orange processed commodity samples were quantitated using Method D1003. Acceptable concurrent recovery data for orange commodities were obtained for each analyte. The LOQ was 0.01 mg/kg each for parent and the metabolites B-1, AB-6, and AB-7 in/on processed orange samples. The LOD was set at 20% of the LOQ, or 0.002 mg/kg each for parent cyflumetofen and the metabolites B-1, AB-6, and AB-7. The residue levels detected in the treated specimens and processed fractions as well as the calculated processing factors are presented in the following tables. The concentrations of metabolites were expressed in cyflumetofen equivalents.
Table 73 Residues of cyflumetofen and its metabolites in processed commodities of orange
Trial ID County, State of USA /Year
Commodity Residues, mg eq/kg a Processing factor
Parent B-l Parent + B-1 b Parent Parent + B-1
R090554 Seminole, Orange RAC 0.664 0.028 0.692 – –
FL / 2009 Wet Pomace 0.169 0.104 0.273 0.255 0.395 Peel 1.899 0.078 1.977 2.86 2.86 Dried Pulp 0.388 0.275 0.663 0.584 0.958 Juice < 0.01 < 0.02 < 0.03 < 0.02 < 0.04 Oil 90.72 1.339 92.06 137 133 Meal 0.283 0.275 0.558 0.426 0.806 Molasses < 0.01 0.339 < 0.349 < 0.02 < 0.504 Marmalade 0.017 0.024 0.041 0.026 0.059 R090555 Kern, CA / Orange RAC 0.134 0.024 0.158 – –
2009 Wet Pomace 0.031 0.024 0.055 0.23 0.348 Peel 0.398 0.024 0.422 2.97 2.67 Dried Pulp 0.059 0.061 0.120 0.44 0.759 Juice < 0.01 0.024 < 0.034 < 0.08 < 0.22 Oil 13.65 0.250 13.90 102 88.0 Meal 0.061 0.061 0.122 0.46 0.77 Molasses < 0.01 0.042 < 0.052 < 0.08 < 0.33 Marmalade < 0.01 0.024 < 0.034 < 0.08 < 0.22
Trial ID County, State of USA /Year Commodity Residues, mg eq/kg a
AB-6 AB-7 R090554 Seminole, Orange RAC 0.079 0.022
FL / 2009 Wet Pomace 0.008 0.012 Peel 0.122 0.077 Dried Pulp 0.072 0.021 Juice 0.061 < 0.02 Oil 2.675 3.160 Meal 0.077 0.020 Molasses 0.058 < 0.01 Marmalade 0.048 0.011 R090555 Kern, CA / Orange RAC 0.062 0.013
2009 Wet Pomace 0.005 < 0.02 Peel 0.076 0.025

260 Cyflumetofen
Trial ID County, State of USA /Year Commodity Residues, mg eq/kg a
AB-6 AB-7 Dried Pulp 0.050 < 0.02 Juice 0.061 < 0.02 Oil 0.413 0.600 Meal 0.057 < 0.02 Molasses 0.055 < 0.02 Marmalade 0.057 < 0.02
a Expressed in cyflumetofen equivalents. b As the concentration of B-1 is sometimes higher than that of the parent, for the calculation of sum and processing factor, the LOQ value was used when the concentration is below the LOQ.
The results from these trials show that after two applications of cyflumetofen at 5× the maximum GAP rate, residues of cyflumetofen or its metabolites (B-1, AB-6 and AB-7) in the treated bulk orange RAC samples ranged from 0.013 to 0.664 mg/kg. Residues of cyflumetofen and its metabolites in processed commodities wet pomace, peel, dried pulp, juice, oil, meal, molasses and marmalade ranged from < 0.01 mg/kg (LOQ) to 2.675 km/kg in all matrices but oil. The residues in oil from the CA test site ranged from 0.600 mg/kg for metabolite AB-6 to 90.716 mg/kg for cyflumetofen.
A comparison of the total residues of cyflumetofen and all three metabolites combined in the processed RAC with those in each of the processed matrix samples showed that the total residue concentrated in peel and oil only (2.2× to 2.7× and 64× to 123×, respectively). Residue in all the other processed matrices did not concentrate and was diluted to concentrations less than the RAC samples collected before processing.
Apples (White, 2011b)
In two trials conducted in NY and PA during the 2009 growing season, 200 g/L SC formulation of cyflumetofen was applied as two airblast foliar sprays to apples at a rate of 0.996–1.027 kg ai/ha (5× the maximum GAP rate), with a 14 day retreatment interval. The first application was made approximately 3 weeks (21 days) prior to the harvest of fruit, when fruit were ripening (growth stage BBCH 79 to BBCH 81). The applications were made in 606–872 L/ha of water using ground equipment. Apple bulk RAC samples were harvested 7 days after the last application. The two bulk apple RAC samples were separately processed using simulated commercial processing procedures into wet pomace and juice. In addition, apple sauce, canned apples, and dried apples were collected for analysis.
The residues of cyflumetofen and metabolites B-l, AB-6 and AB-7 in apple RAC and processed commodity samples were quantitated using Method D1003. Acceptable concurrent recovery data for apple commodities were obtained for each analyte. The LOQ was 0.01 mg/kg for each analyte. Apparent residues of cyflumetofen, B-l, AB-6 and AB-7 were < LOQ in/on all untreated apple RAC and processed commodities.
Table 74 Residues of cyflumetofen and its metabolites in processed commodities of apple.
Trial ID County, State of USA /Year
Commodity Residues (mg/kg) a Processing Factor
Parent B-l Parent + B-1 b Parent Parent + B-1
RCN R090509 Apple RAC 0.584 < 0.02 0.604 – – Wayne, NY Wet pomace 0.547 < 0.02 0.567 0.937 0.939 / 2009 Applesauce 1.700 0.554 2.254 2.91 3.73 Juice 0.115 < 0.02 0.135 0.197 0.224 Dried apples 0.482 0.047 0.529 0.825 0.876 Canned apples 0.102 < 0.02 0.122 0.175 0.202 RCN R090510 Apple RAC 0.451 < 0.02 0.471 – – LeHigh, PA Wet pomace 0.719 < 0.02 0.739 1.59 1.57 / 2009 Applesauce 1.146 0.342 1.488 2.54 3.16 Juice 0.121 < 0.02 0.141 0.268 0.299

Cyflumetofen 261
Trial ID County, State of USA /Year
Commodity Residues (mg/kg) a Processing Factor
Parent B-l Parent + B-1 b Parent Parent + B-1
Dried apples 0.077 < 0.02 0.097 0.17 0.21 Canned apples 0.016 < 0.02 0.036 0.035 0.076
Trial ID County, State of USA /Year Commodity Residues (mg/kg) a
AB-6 AB-7 RCN R090509 Apple RAC 0.013 0.010 Wayne, NY Wet pomace 0.022 0.016 / 2009 Applesauce 0.055 < 0.01 Juice < 0.01 < 0.01 Dried apples 0.010 < 0.01 Canned apples < 0.01 < 0.01 RCN R090510 Apple RAC 0.010 0.010 LeHigh, PA Wet pomace 0.015 0.013 / 2009 Applesauce 0.039 < 0.01 Juice < 0.01 < 0.01 Dried apples < 0.01 < 0.01 Canned apples < 0.01 < 0.01
a Expressed in cyflumetofen equivalents. b As the concentration of B-1 is sometimes higher than that of the parent, for the calculation of sum and processing factor, the LOQ value was used when the concentration is below the LOQ.
The results from these trials show that after two applications of cyflumetofen targeting 2.0 kg as/ha/season, mean parent cyflumetofen residues in the treated apple RAC samples collected 7 days after the last application were 0.58 mg/kg and 0.45 mg/kg. For the individual analytes, expressed in parent equivalents, residues of the metabolites B-l, AB-6, and AB-7 were < 0.02 mg/kg, 0.01 mg/kg, and 0.01 mg/kg, respectively, in the treated apple RAC samples collected 7 days after the last application.
A comparison of the residues in the RAC with those in each processed fraction indicate that parent cyflumetofen residues concentrate in apple sauce (2.5–2.9×, average processing factor 2.7×), but do not concentrate appreciably in any other apple processed commodities, wet pomace, juice, dried apples, or canned apples.
Grapes (Hattermann & Lott, 2011b)
In four trials conducted in NY, CA and OR during the 2009 growing season, 200 g/L SC formulation of cyflumetofen was applied as two foliar broadcast sprays to grape at a target rate of 1.0 kg ai/ha (5× the maximum GAP rate), with a 14-day re-treatment interval (13-day interval at one CA site). The actual application rates were 1.99 to 2.02 kg ai/ha. The applications were made in 465–2600 L/ha of water using ground equipment. Two trials had product applied in a dilute application (935.4–3741.6 L/ha) and two in a concentrate spray volume (187.1–935.4 L/ha range). Grape samples were harvested 14 days after the last application except for one CA trial which was harvested at 15-day after the final application. One treated and one non-treated bulk sample was processed for each of four trials. Dried grapes, dried grape stems, juice, wine (young), wet pomace, must, yeast and grape stems were collected for analysis. The study was planned to include two trials, each performed on red and white grape varieties. However, an exception to protocol occurred when a white grape variety was used at the King County, CA trial instead of red. The white grapes from this trial were processed using the red grape procedure for wine, such that there were two trials processed with red and two with white grape procedures.
The residues of cyflumetofen, B-1, AB-6, and AB-7 in grape RAC and processed commodity samples were quantitated using Method D1003. Acceptable concurrent recovery data for grape commodities were obtained for each analyte. The LOQ was 0.01 mg/kg each for parent cyflumetofen and the metabolites B-1, AB-6, and AB-7 in/on grape RAC and processed commodity samples. The

262 Cyflumetofen
LOD was set at 20% of the LOQ, or 0.002 mg/kg each for parent cyflumetofen and the metabolites B-1, AB-6 and AB-7.
Table 75 Residues of cyflumetofen and its metabolites in processed commodities of grapes
Trial ID County, State of USA /Year
Commodity Residues (mg/kg) a Processing Factor
Parent B-l Parent + B-1 b Parent Parent + B-1
RCN R090550 Grape RAC 1.71 0.07 1.78 – – Yates, NY Dried grape 7.94 0.33 8.27 4.64 4.65 / 2009 Dried grape Stem 23.88, 18.96,
17.63 0.56 20.72 11.8 11.6
Juice 0.11 0.07 0.18 0.064 0.10 Wine (Young) < 0.01 0.07 < 0.08 < 0.006 0.04 Wet Pomace 5.80 0.14 5.94 3.39 3.34 Must 0.03 0.05 0.08 0.02 0.04 Yeast 2.34 1.37 3.71 1.37 2.08 Grape Stems 4.21 0.21 4.42 2.46 2.48 RCN R090551 Grape RAC 0.34 < 0.02 0.36 – – Tulare, CA Dried grape 0.22 0.09 0.31 0.65 0.86 / 2009 Dried grape Stem 3.07, 1.51,
1.73 0.38 2.48 6.16 6.89
Juice 0.08 < 0.02 0.10 0.2 0.28 Wine (Young) < 0.01 0.02 < 0.03 0.029 0.083 Wet Pomace 0.37 0.02 0.39 1.1 1.1 Must 0.14 < 0.02 0.16 0.412 0.44 Yeast 2.23 0.73 2.96 6.56 8.22 Grape Stems 0.34 0.05 0.39 1.0 1.1 RCN R090552 Grape RAC 0.57 0.02 0.59 – – Kings, CA Dried grape 0.53 0.09 0.62 0.93 1.1 / 2009 Dried grape Stem 14.79, 6.63,
6.90 1.01 10.45 16.4 17.7
Juice 0.14 0.05 0.19 0.25 0.32 Wine (Young) 0.02 0.07 0.09 0.04 0.2 Wet Pomace 1.72 0.07 1.79 3.02 3.03 Must 0.30 0.05 0.35 0.53 0.59 Yeast 0.31 0.54 0.85 0.54 1.4 Grape Stems 1.72 0.14 1.86 3.02 3.15 RCN R090553 Grape RAC 1.37 0.12 1.49 – – Benton, Dried grape 2.57 1.11 3.68 1.88 2.47 OR / 2009 Dried grape Stem 13.46, 10.08,
8.33 1.20 11.82 7.75 7.93
Juice 0.15 0.09 0.24 0.11 0.16 Wine (Young) 0.06 0.19 0.25 0.04 0.17 Wet Pomace 5.78 0.14 5.92 4.22 3.97 Must 0.25 0.07 0.32 0.18 0.22 Yeast 14.63 0.99 15.62 10.7 10.5 Grape Stems 3.23 0.33 3.56 2.36 2.39
Trial ID County, State of USA /Year Commodity Residues (mg/kg) a
AB-6 AB-7 RCN R090550 Grape RAC 0.03 0.02 Yates, NY Dried grape 0.11 0.07 / 2009 Dried grape Stem 0.19 0.12 Juice < 0.01 < 0.01 Wine (Young) < 0.01 < 0.01 Wet Pomace 0.04 0.03 Must < 0.01 < 0.01 Yeast 0.01 < 0.01

Cyflumetofen 263
Trial ID County, State of USA /Year Commodity Residues (mg/kg) a
AB-6 AB-7 Grape Stems 0.03 0.01 RCN R090551 Grape RAC 0.02 0.02 Tulare, CA Dried grape 0.02 0.02 / 2009 Dried grape Stem 0.07 0.10 Juice < 0.01 < 0.01 Wine (Young) < 0.01 < 0.01 Wet Pomace 0.02 0.03 Must < 0.01 < 0.01 Yeast 0.07 0.11 Grape Stems 0.02 0.02 RCN R090552 Grape RAC < 0.01 < 0.01 Kings, CA Dried grape < 0.01 < 0.01 / 2009 Dried grape Stem 0.17 0.10 Juice < 0.01 < 0.01 Wine (Young) < 0.01 < 0.01 Wet Pomace 0.02 0.02 Must < 0.01 < 0.01 Yeast 0.01 0.01 Grape Stems 0.02 0.02 RCN R090553 Grape RAC 0.15 0.12 Benton, Dried grape 0.29 0.19 OR / 2009 Dried grape Stem 0.42 0.30 Juice < 0.01 < 0.01 Wine (Young) < 0.01 < 0.01 Wet Pomace 0.55 0.42 Must < 0.01 < 0.01 Yeast 0.11 0.10 Grape Stems 0.10 0.08
a Expressed in cyflumetofen equivalents. b As the concentration of B-1 is sometimes higher than that of the parent, for the calculation of sum and processing factor, the LOQ value was used when the concentration is below the LOQ.
The results from these trials show that after two applications of cyflumetofen, targeting 1.0 kg ai/ha per application, residues of cyflumetofen, B-1, AB-6 or AB-7 (expressed in parent equivalents) in the treated grape RAC samples (whole fruit) collected 14–15 days after the last application ranged from < 0.01–1.71 mg/kg for cyflumetofen or its metabolites.
RAC grape samples showed measurable levels of parent cyflumetofen and the three metabolites. A comparison of the residues in the treated grape RAC samples with those in each processed fraction indicated that combined residues of cyflumetofen and its metabolites concentrated in dried grape at 2.37 and 4.62× at the OR and NY test sites, respectively, and in dried grape stem (6.63–17.6×), wet pomace (1.10–3.91×), yeast (1.43–8.99×), and grape stems (1.08–3.11×) at all four test sites. The compound did not concentrate in any of the other processed grape matrices and was actually diluted in these matrices (i.e. concentration factors less than or equal to 1×).
Tomato (Crawford, 2011b)
In two trials conducted in NY and CA during the 2009 growing season, 200 g/L SC formulation of cyflumetofen was applied as two foliar broadcast sprays to tomato at a rate of 1.00–1.01 kg ai/ha, with a 14-day retreatment interval, resulting in a total exaggerated rate (5×) of 2.01–2.02 kg ai/ha. The applications were made in 187–360 L/ha using ground equipment, and an adjuvant was added to the spray mixture for all applications. Tomato samples were harvested 3 days after the last application. A total of two separate treated bulk samples were processed for a total of two processing tests. The treated bulk tomato RAC samples were separately processed using simulated commercial processing procedures into paste and puree. In addition, canned tomatoes, peeled tomatoes, tomato juice, tomato peels, wash water, washed tomatoes, and wet pomace were collected for analysis.

264 Cyflumetofen
The residues of cyflumetofen and metabolites B-1, AB-6, and AB-7 in tomato processed commodity samples were quantitated using Method D1003. Acceptable concurrent recovery data for tomato commodities were obtained for each analyte. The LOQ was 0.01 mg/kg each for parent and the metabolites B-1, AB-6, and AB-7 in/on tomato processed commodity samples. The LOD was set at 20% of the LOQ, or 0.002 mg/kg each for parent cyflumetofen and the metabolites B-1, AB-6, and AB-7.
Table 76 Residues of cyflumetofen and its metabolites in processed commodities of tomato
Trial ID County, State of USA /Year
Commodity Residues (mg/kg) a Processing Factor
Parent B-l Parent + B-1 b Parent Parent + B-1
RCN R090548 Tomato RAC 0.24 0.05 0.29 – – Wayne, NY / 2009 Washed Tomatoes 0.26 0.05 0.31 1.1 1.1
Peeled Tomatoes < 0.01 < 0.02 < 0.03 < 0.04 < 0.1 Canned Tomatoes < 0.01 0.02 < 0.03 < 0.04 < 0.1 Puree 0.21 0.02 0.23 0.88 0.79 Paste 0.09 0.54 0.63 0.4 2.2 Wet Pomace 0.32 0.08 0.40 1.3 1.4 Tomato Peels 4.05 0.08 4.13 16.9 14.2 Wash Water 0.69 0.09 0.78 2.9 2.7 Tomato Juice 0.04 0.07 0.11 0.2 0.38 RCN R090549 Tomato RAC 0.17 0.02 0.19 – – Kings, CA / 2009 Washed Tomatoes 0.11 0.02 0.13 0.65 0.68 Peeled Tomatoes < 0.01 < 0.02 < 0.03 < 0.06 < 0.2 Canned Tomatoes 0.03 0.02 0.05 0.2 0.3 Puree 0.05 < 0.02 0.07 0.3 0.4 Paste 0.04 0.19 0.23 0.2 1.2 Wet Pomace 0.93 0.02 0.95 5.5 5.0 Tomato Peels 1.52 0.02 1.54 8.94 8.10 Wash Water 0.02 < 0.02 0.04 0.1 0.2 Tomato Juice < 0.01 0.02 < 0.03 < 0.06 < 0.2
Trial ID County, State of USA /Year Commodity Residues (mg/kg) a
AB-6 AB-7 RCN R090548 Tomato RAC 0.05 0.08 Wayne, NY / 2009 Washed Tomatoes 0.06 0.11 Peeled Tomatoes < 0.01 < 0.01 Canned Tomatoes < 0.01 < 0.01 Puree 0.05 0.08 Paste 0.07 0.17 Wet Pomace 0.06 0.11 Tomato Peels 0.73 1.46 Wash Water 0.01 0.01 Tomato Juice < 0.01 0.01 RCN R090549 Tomato RAC < 0.01 0.01 Kings, CA / 2009 Washed Tomatoes < 0.01 0.01 Peeled Tomatoes < 0.01 < 0.01 Canned Tomatoes < 0.01 < 0.01 Puree < 0.01 < 0.01 Paste < 0.01 < 0.01 Wet Pomace 0.03 0.05 Tomato Peels 0.06 0.10 Wash Water < 0.01 < 0.01 Tomato Juice < 0.01 < 0.01
a Expressed in cyflumetofen equivalents. b As the concentration of B-1 is sometimes higher than that of the parent, for the calculation of sum and processing factor, the LOQ value was used when the concentration is below the LOQ.

Cyflumetofen 265
The results from these trials show that after two applications of cyflumetofen targeting 1.0 kg ai/ha to each field trial to obtain 5× the maximum GAP per-season rate of 0.400 kg ai/ha, residues of cyflumetofen (metabolites B-1, AB-6 and AB-7 expressed in parent equivalents) in the treated tomato RAC samples (whole fruit) sampled 3 days PHI were < LOQ to 0.24 mg/kg. For the processed commodity samples, parent residues in the treated fractions from fruit sampled 3 days PHI were < LOQ to 4.05 mg/kg; residues of the metabolites B-1, AB-6, and AB-7 ranged from < LOQ to 1.46 mg/kg.
A comparison of the residues in the RAC tomato with those in each processed fraction indicated that combined residues of cyflumetofen concentrated in wash water (1.9×) at the New York site only and in paste (1.2 to 2.1×), wet pomace (1.3 to 4.2×) and tomato peel (8.1 to 15.0×) at both test sites. The compound did not concentrate in any other processed tomato fractions.
RESIDUES IN ANIMAL COMMODITIES
Farm animal feeding studies No information on farm animal feeding studies were received by the current Meeting.
APPRAISAL
Cyflumetofen (consisting of RS isomers) is a bridged diphenyl acaricide (miticide) for control of Tetranychus sp. and influences the mitochondrial electron transport chain by inhibiting the complex II substance in the cell. It has been registered in a number of countries.
The Meeting received information on physical and chemical properties, animal and plant metabolism, environmental fate, analytical methods, storage stability, use patterns, supervised trials, and processing. Cyflumetofen was scheduled by the Forty-fifth Session of the CCPR for review by the 2014 JMPR for the first time.
In this Appraisal, the following abbreviated names were used for referred metabolites.
Code (MW) IUPAC name Structure
Metabolite or degradate found
in
Cyflumetofen (447.45)
2-methoxyethyl (RS)-2-(4-tert-butylphenyl)-2-cyano-3-oxo-3-(α,α,α-trifluoro-o-tolyl)propionate
Goat Satsuma mandarin Apple Eggplant
B-1 (190.12) 2-(trifluoromethyl)benzoic acid Rat

266 Cyflumetofen
F FF
O
OH
Goat
Satsuma mandarin
Apple
Eggplant
Soil
AB-1 (345.36) Syn: M9210I003
(RS)-2-(4-tert-butylphenyl) -3-oxo-3-[2-(trifluoromethyl)phenyl] propanenitrile
FF
F
O
N
Rat
Goat
Hydrolysis in buffer
Hydrolysis simulating processing
Soil
AB-6 (465.45)
2-methoxyethyl-2-((R,S)-4- tert-butylphenyl)-3-oxo-3-({[2-(trifluoromethyl)phenyl]carbonyl}amino)propanoate
O
O
F FF
O
NH
O
O
Satsuma mandarin
Apple
Eggplant
AB-7 (447.45)
2-methoxyethyl-((R,S)-4-tert-butyl-2-{[2-(trifluoromethyl)phenyl]carbonyl}phenyl (cyano)acetate
F FF
O
N O
O
O
Satsuma mandarin
Apple
Eggplant
A-2 (173.26) Syn: M9210I001
4-tert-butylphenyl- acetonitrile
N
Goat
Soil
A-12 (178.23) Syn: M9210I002
4-tert-butylbenzoic acid
O
OH
Goat
Soil
Animal metabolism The Meeting received information on the fate of orally-dosed cyflumetofen in lactating goats.
In metabolism studies, total radioactive residues are expressed in mg eq./kg cyflumetofen equivalents unless otherwise stated.
Metabolism of cyflumetofen in rat
Metabolism studies on laboratory animals including rats were reviewed in the framework of toxicological evaluation by the current JMPR.

Cyflumetofen 267
In a rat metabolism study, highest residues were found in the liver followed by kidney regardless of sex, dose and label position and time point of measurement. Cyflumetofen was extensively metabolized. B-1, 2-trifluoromethylbenzoic acid, was the major metabolite (occurring up to 28% of the applied dose). The predominant metabolic pathway for cyflumetofen involves cleavage of the tert-butylphenyl and trifluorotolyl moieties. Major reactions on the tert-butylphenyl ring are cleavage of the methoxyethyl group, hydroxylation at the butyl group, decarboxylation and glucuronidation at the butyl group. Major reactions on the trifluorotolyl-ring are glutathione conjugation at the carboxyl group and further changes of the glutathione group to mercapturic acid or thiolactic acid. In addition, hydroxylation and oxidation reactions at the butyl group and cleavage of the carboxylic ester moiety are observed on the parent molecule.
Metabolism of cyflumetofen in lactating goat
Two lactating goats were orally administered [benzoyl-ring-U-14C]-cyflumetofen (hereafter abbreviated as benzoyl-label) for 12 consecutive days at 0.43 or 0.48 mg/kg bw (13 or 12 ppm in feed). Other two goats were orally administered [t-butylphenyl-ring-U-14C]-cyflumetofen (hereafter abbreviated as butylphenyl-label) for 10 consecutive days at 0.27 or 0.30 mg/kg bw (15 or 12 ppm in feed). The goats were sacrificed 18–24 hours after the last dose.
After radio-labelled cyflumetofen was administered orally to lactating goats, it was excreted in faeces and urine (total > 78% excreted during the testing periods) and only a small portion accounting for < 0.3% of the administered radioactivity (AR) remained in body tissues/organs. Radioactive residues were the highest in liver (0.29–0.40 mg eq./kg) followed by kidney (0.17–0.19 mg eq./kg) but low in fat (0.028–0.033 mg eq./kg) and muscle (0.009–0.020 mg eq./kg). Milk of each day contained < 0.02% AR and milk collected throughout the study period contained, in total, 0.008–0.19 mg eq./kg (0.03–0.14% AR).
The parent compound, cyflumetofen, was found only in fat but at low concentration of 0.003 mg/kg accounting for 20–21% of the total radioactive residues (TRR). The predominant metabolite in all tissues/organs and milk was B-1 at around 0.1 mg eq./kg in liver (32% TRR) and kidney (54% TRR), and lower than 0.01 mg eq./kg in muscle (46–51% TRR), fat (21–40% TRR) and milk (4.5% TRR).
The metabolism of cyflumetofen in goat involves extensive hydrolysis of formic acid ester and trifluoromethylbenzoyl moiety, decarboxylation, conjugation, hydroxylation and oxidation. In principle, excretion and distribution of cyflumetofen and its metabolism in goat are similar to those in rats with some differences in metabolites identified.
Plant metabolism
Satsuma mandarin
When Satsuma mandarin trees (grown outdoor) were sprayed with benzoyl- or butylphenyl-label cyflumetofen at a rate approximating 0.60 kg ai/ha (3× GAP rate of the USA), and Satsuma mandarin fruit samples were collected 1, 7 and 30 days after the treatment, the majority of the radioactivity was recovered from the acetonitrile surface rinse of fruits: 95–96% TRR on 1DAT; 91–93% TRR on 7DAT; and 88–89% on 30 DAT.
The predominant radioactive residue on/in mandarin fruits was cyflumetofen at 0.52–0.55 mg/kg (88-90% TRR) on 1DAT, decreasing to 0.33–0.37 mg/kg (79–83% TRR) on 7 DAT and further to 0.25–0.31 mg/kg (44–54% TRR) on 30 DAT.
Other than the parent, metabolites AB-6, AB-7, A-12 and B-1 were formed. B-1 increased over time from 0.028 mg eq./kg (4.7% TRR) on 1 DAT to 0.064 mg eq./kg (11% TRR) on 30 DAT. None of AB-6, AB-7 and A-12 exceeded 10% TRR. A number of unknown peaks were observed but none of them exceeded 10% of TRR.
The radioactive residues on/in leaves showed similar profile as those on/in fruits with the majority (>87% TRR) of radioactive residues found in the surface rinse, although the TRR was >50

268 Cyflumetofen
times that on/in fruits. A majority of radioactive residues remaining in leaves were extracted. Cyflumetofen was also the predominant identified fraction in leaves: >73% TRR in rinse and extract together. Four metabolites were identified but none exceeded 10% TRR.
Apple
When an apple tree (grown outdoor) was sprayed with benzoyl- or butylphenyl-label cyflumetofen at a rate approximating 0.60 kg ai/ha (3X GAP rate of the USA), and apple fruit samples were collected 1, 7 and 30 days after the treatment, the majority of the radioactivity was recovered from the acetonitrile surface rinse of fruits: 95–96% TRR on 1 DAT, 82–89% TRR on 7 DAT; and 67–71% TRR on 30 DAT.
The predominant radioactive residue on/in apple fruits was cyflumetofen at 0.061–0.066 mg/kg (58–61% TRR) in rinse while pulp extract contained too little radioactivity for further analysis on 1DAT, 0.061–0.14 mg/kg (78–84% TRR) on 7 DAT and decreased to 0.037–0.042 mg/kg (53–65% TRR) on 30 DAT.
There were minor metabolites identified. However, none of them exceeded 5% TRR.
The radioactive residues on/in leaves showed similar profile as those on/in fruits with the majority (>72% TRR) of radioactive residues found in the surface rinse, although the TRR was >50 times that on/in fruits. Cyflumetofen was also the predominant identified fraction in leaves: >44% TRR in rinse and extract together. No metabolites exceeded 10% TRR.
Eggplant
When eggplants (grown outdoor) were sprayed with benzoyl- or butylphenyl-label cyflumetofen at a rate approximating 0.60 kg ai/ha (3X GAP rate of the USA), and eggplant samples were collected 1, 7 and 14 days after the treatment, the majority of the radioactivity was also recovered from the acetonitrile surface rinse of fruits: 87–92% TRR on 1 DAT, 79–86% TRR on 7 DAT; and 56–81% TRR on 30 DAT.
The predominant radioactive residue on/in eggplant fruits was also cyflumetofen accounting for 0.31–0.44 mg/kg (91–95% TRR) on 1 DAT, decreased to 0.25–0.39 mg/kg (67–71% TRR) on 7 DAT and then to 0.18–0.20 mg/kg (42–62% TRR) on 14 DAT.
Metabolites B-1, AB-6 and AB-7 were identified from the fruit rinse and/or extracts. B-1 was found at 0.059 mg eq./kg (11% TRR) on 7 DAT and at 0.061 mg eq./kg (15% TRR) on 14 DAT on/in fruits. AB-6 and AB-7 did not exceed 10% TRR.
The tentatively identified U1/U2 (likely to be acid labile conjugates of B-1) and U4 were also found in 7 DAT and 14 DAT fruits but not in 1 DAT fruits. U1 was present at 0.067 mg eq./kg (16% TRR) on 14 DAT but <10% TRR on 1 DAT and 7 DAT. No other metabolites exceeded 10% TRR. U1 and U2 were found only in the fruit extracts but not in rinse, indicating that they were formed in the fruits.
The radioactive residues on/in leaves showed similar profile as those on/in fruits with the majority (>69% TRR) of radioactive residues found in the surface rinse, although the TRR was >50 times that on/in fruits. Cyflumetofen was also the predominant identified fraction in leaves: >47% TRR in rinse and extract together. No metabolites exceeded 10% TRR.
Summary of plant metabolism
The metabolism of cyflumetofen in these crops involves hydrolysis, acyl migration, oxidation and conjugation (U1 and U2 are the conjugate of B-1).
The plant metabolism studies on Satsuma mandarin, apple and eggplant showed similar pattern. Applied radioactively was mostly recovered from surface rinse with decreasing trend over time. Fruit flesh contained far less radioactivity. The predominant radioactive residue was cyflumetofen accounting for >42% TRR at all time points. The next important radioactive residue was

Cyflumetofen 269
B-1 but at the maximum 15% TRR (around 0.06 mg eq./kg). B-1 may be present in fruits in conjugated forms.
Environmental fate
Aerobic soil metabolism
The studies on aerobic soil degradation of cyflumetofen indicate that cyflumetofen sprayed on soil was rapidly and completely degraded with DT50 around 1.8–4.3 days in various soils at 20–25°C. Additionally, aerobic soil degradation of B-1 and AB-1 was studied resulting in DT50 of 6–36 days and 0.07–0.11 days respectively at 20°C.
Photolysis on soil surface
Photolysis of cyflumetofen on soil was found to be insignificant as the degradation rates of cyflumetofen with and without light irradiation were not significantly different.
Hydrolysis in aquatic system
Cyflumetofen is susceptible to hydrolysis and was hydrolysed faster at higher pH in aqueous buffer solutions at 25°C. DT50 was calculated using first order kinetics to be 7.7 days at pH 4, 6.0 days at pH 5, 9.8 h at pH 7 and 10.3 min at pH 9.
At slightly acidic to neutral pH, a number of degradates exceeded 10% of the applied dose: A-1 (max. 14% at 8 h), A-2 (max. 44% at 720 h), A-18 (max. 36% at 120 h), B-1 (max. 53% at 48 h) and AB-1 (max. 45%, at 120 h).
Residues in succeeding crops
A confined rotational crop study was conducted to examine the nature and level of residues of cyflumetofen in three succeeding crops (white radish, lettuce and wheat) using benzoyl- and butylphenyl-label cyflumetofen. A single application of radio-labelled cyflumetofen was made on bare soil in plastic containers at a rate of 0.40 kg ai/ha (2x GAP rate of the USA). After plant back interval (PBI) of 30, 120 and 365 days, lettuce, white radish and spring wheat were sown into the treated soil.
Following the application of cyflumetofen to soil, uptake of radioactivity from soil into rotational crops was observed, in particular, with benzoyl-label (up to 1.25 mg eq./kg in wheat chaff of 30 PBI but much lower in edible portions with the maximum of 0.17 mg eq./kg in wheat grain of 30 PBI). With butylphenyl-label, uptake of radioactivity into rotational crops were lower (maximum of 0.11 mg eq./kg in wheat straw+chaff of 120 PBI). Uptake was, in general, less with longer plant back interval.
The only major radioactive residue identified from benzoyl-label treatment was trifluoroacetic acid in all crops (39–100% TRR). B-1, specific to this label, was detected as a minor component.
With the butylphenyl-label, a series of label-specific metabolites were observed in the extracts but all of them were less than 0.01 mg eq./kg.
No parent compound was detected from any of the crop extracts.
No significant residues of cyflumetofen, other than trifluoroacetic acid, were expected to be found in rotational crops on the basis of aerobic soil degradation studies and confined succeeding crop study.
Methods of analysis Analytical methods for determination of residues of cyflumetofen and its metabolites B-1, AB-6 and AB-7 were developed for a wide range of matrices of plant and animal origin.

270 Cyflumetofen
In general, the method for data generation and enforcement for plant matrices employ extraction by shaking with acetonitrile and then a mixture of acetonitrile:water (75:25, v/v) or only with acetonitrile:water, clean-up by partitioning with a mixture of ethyl acetate:cyclohexane (75:25, v/v) and determination of the analytes using LC-MS/MS.
The method for plant matrices was validated for cyflumetofen, B-1, AB-6 and AB-7 resulting in acceptable recoveries and relative standard deviations (RSDs) with the LOQ of 0.01 mg/kg for various plant matrices.
The analytical method developed for cyflumetofen and B-1 in animal matrices was similar to the one for plant matrices but employs acetonitrile:water (50:50, v/v) for extraction instead of acetonitrile:water (75:25, v/v) and different clean-up procedure. This method was validated for cyflumetofen and B-1 resulting in acceptable recoveries and RSDs with the LOQ of 0.01 mg/kg for bovine liver, and meat and 0.001 mg/kg for bovine milk. The mean recoveries for cyflumetofen in poultry eggs were low at 65–67% (RSD, 3–6%) while those for B-1 were acceptable between 86–95%.
A number of scientific papers report the validation of the QuEChERS multi-residue method with GC-MS/MS for cyflumetofen in various plant commodities with the LOQ around 0.01 mg/kg.
Stability of pesticide residues in stored analytical samples The stability of cyflumetofen, B-1, AB-6 and AB-7 in homogenates of almond, apple (fruit, juice) kidney bean, lettuce, orange (fruit, juice, oil), radish and wheat grain at -20 to -10 °C was tested at a spike level (each analyte separately spiked) of 0.1 mg/kg for 743–910 days (24–30 months).
Cyflumetofen was stable when stored frozen for 25 months, the longest storage time tested, in almond, apple fruit, apple juice, orange fruit (24 months), orange juice, orange oil and wheat grain. However, it was stable only up to 9 months in kidney bean and lettuce, and 3 months in radish root.
B-1 was stable when stored frozen for 30 months, the longest storage time tested, in almond, kidney bean, lettuce, orange fruit, orange juice and wheat grain. It was stable up to 22 months in apple fruit, apple juice and radish root, and 6 months in orange oil.
AB-6 was stable when stored frozen for 28 months, the longest storage time tested, in almond, apple fruit, kidney bean, orange juice, orange oil, radish root, and wheat grain. It was stable up to 21 months in apple juice, lettuce and orange fruit.
AB-7 was stable when stored frozen for 26 months, the longest storage time tested, in almond, apple fruit, apple juice, kidney bean, orange juice, and orange oil. It is stable up to 19 months in orange fruit and wheat grain, 12 months in lettuce, but one month in radish root.
Definition of the residue In goat metabolism studies, radioactive residues were highest in liver followed by kidney. Far less radioactive residues were found in fat, muscle and milk.
When benzoyl-label cyflumetofen was administered, metabolite B-1 (2-trifluoromethylbenzoic acid) was the predominant residue in all edible tissues/organs (21–54% TRR) and milk (4.5% TRR). B-1 was also found in rat metabolism and is considered to be no more toxic than the parent and, therefore, toxicologically covered by the ADI for parent compound. Cyflumetofen was detected only in fat at 0.003 mg/kg (20% TRR). No other metabolites were detected above 10% TRR.
When butylphenyl-label cyflumetofen was administered, cyflumetofen was not detected in any of edible tissues/organs or in milk. None of all the identified metabolites exceeded 0.01 mg eq./kg and 10% TRR.
There is a validated LC-MS/MS method for cyflumetofen and B-1 in bovine matrices. The Meeting considered that both cyflumetofen and B-1 were suitable residues for enforcement of MRLs and for estimating dietary intake.

Cyflumetofen 271
LogPow of cyflumetofen is 4.3 at 25 °C and cyflumetofen was found only in the fat at < 0.01 mg/kg in the goat metabolism study. B-1 is a carboxylic acid and was present at 0.13 mg eq./kg in liver and 0.10 mg eq./kg in kidney but < 0.01 mg eq./kg in fat. The Meeting considered that, over all, residues (cyflumetofen and B-1) were not fat soluble.
In the plant metabolism studies on Satsuma mandarin, apple and eggplant, cyflumetofen was the predominant residue and accounted for > 42% TRR in the fruits of these crops at any time points. The Meeting considered that for enforcement of MRLs, cyflumetofen was a suitable residue.
The next important radioactive residue was B-1 but at the maximum 15% TRR (around 0.06 mg eq./kg). In the supervised residue trials, the concentrations of B-1 were mostly 1/10–1/2 of those of cyflumetofen. Conjugated forms of B-1 (U1 and U2) were found in the eggplant metabolism at slightly higher concentrations (in total) than B-1 itself but they were not found in the studies on Satsuma mandarin or apple. A validated LC-MS/MS method is available and used in the trials for quantification of cyflumetofen and B-1 but it determines the free form of B-1.
The Meeting considered that, for calculating dietary intake from commodities of plant origin, cyflumetofen and B-1 were suitable residues.
Based on the above, the Meeting recommended the following residue definition for plant and animal commodities:
Definition of the residue for plant commodities (for compliance with the MRL): Cyflumetofen.
Definition of the residue for plant commodities (for estimation of dietary intake): Sum of cyflumetofen and 2-trifluoromethylbenzoic acid, expressed as cyflumetofen.
Definition of the residue for animal commodities (for compliance with the MRL and estimation of dietary intake): Sum of cyflumetofen and 2-trifluoromethylbenzoic acid, expressed as cyflumetofen.
Residue is not fat-soluble.
Results of supervised residue trials on crops
The Meeting received supervised trial data for cyflumetofen on citrus fruits, pome fruits, grapes, strawberry, tomato, eggplant and tree nuts conducted outdoor (except trials on eggplant in Japan) using foliar spray of 20% SC formulation of cyflumetofen (except in a trial on apple in Italy).
Residues were expressed in cyflumetofen equivalents. The analytical results for B-1 were converted to cyflumetofen equivalents by multiplying the analytical results for B-1 with a factor of 2.35 based on the molecular weights of cyflumetofen (447.45) and B-1 (190.12).
For the estimation of a sum of cyflumetofen and B-1, where B-1 was below the LOQ, it was regarded as 0.02 mg eq./kg (LOQ of 0.01 mg/kg for B-1 is converted to 0.02 mg eq./kg) as B-1 was sometimes present at concentrations comparable to those of parent in trials.
Although in a number of trials conducted in the USA the water volume was smaller than the minimum water volume on the label, the Meeting agreed to use the results of these trials in estimating maximum residue levels as the purpose of the minimum requirement was for better efficacy and not for safety, and residues from lower water volume trials were not always lower than those from higher water volume trials.
Citrus fruits
A total of 23 supervised trials were conducted on orange (12), grapefruit (6) and lemon (5) in the USA in 2009 and 2010. GAP in the USA for citrus fruits allows 2 applications at a maximum rate of 0.2 kg ai/ha (at least 935 L/ha) with a PHI of 7 days.

272 Cyflumetofen
Residues of cyflumetofen from 11 independent orange trials matching GAP for citrus fruits in the USA were: 0.01, 0.01, 0.04, 0.06, 0.06, 0.08, 0.09, 0.10, 0.10, 0.11 and 0.12 mg/kg (median 0.08 mg/kg).
The information on four trials conducted on orange in Brazil in 2007 was also provided but they did not match the GAP in Brazil (one application at a spray concentration of 0.08 kg ai/hL).
Residues of cyflumetofen from six grapefruit trials matching GAP for citrus fruits in the USA were: < 0.01, 0.02, 0.04, 0.04, 0.04 and 0.07 mg/kg (median 0.04 mg/kg).
Residues of cyflumetofen from five lemon trials matching GAP for citrus fruits in the USA were: < 0.01, 0.02, 0.02, 0.08 and 0.14 mg/kg (median 0.02 mg/kg).
As the GAP in the USA is established for the group of citrus fruits, the median values from the trials conducted in the USA on these three commodities were not different more than 5-fold, and Kruskal-Wallis test indicated that the residues of orange, grapefruits and lemon were not statistically different, the Meeting decided to estimate a group maximum residue level. The residues of orange, grapefruits and lemon were combined for estimating a maximum residue level for estimating a maximum residue level for citrus fruits (n=22): < 0.01, < 0.01, 0.01, 0.01, 0.02, 0.02, 0.02, 0.04, 0.04, 0.04,0.04, 0.06, 0.06, 0.07, 0.08, 0.08, 0.09, 0.10, 0.10, 0.11, 0.12 and 0.14 mg/kg.
The Meeting estimated a maximum residue level of 0.3 mg/kg for citrus fruit.
For the estimation of STMR, the sum of cyflumetofen and B-1 was calculated: < 0.03, < 0.03, 0.03, 0.03, 0.04, 0.04, 0.04, 0.06, 0.06, 0.06, 0.06, 0.08, 0.08, 0.09, 0.10, 0.10, 0.11, 0.12, 0.12, 0.13, 0.14 and 0.16 and mg eq./kg.
The Meeting estimated an STMR of 0.07 mg/kg expressed as cyflumetofen.
Pome fruits
A total of 17 supervised trials were conducted in the USA in 2009 and 2010 on apples (12) and pear (5). One trial was conducted in Italy in 2006 on apples. The GAP in the USA for pome fruits allows 2 applications at a maximum rate of 0.2 kg ai/ha (at least 935 L/ha) with a PHI of 7 days.
The trial from Italy was provided but did not match any GAP and was not considered.
Residues from 12 apple trials matching US GAP were: 0.01, 0.04, 0.06, 0.07, 0.09, 0.10, 0.13, 0.14, 0.16, 0.18, 0.19 and 0.24 mg/kg (median 0.115 mg/kg).
Residues from five pear trials matching US GAP were: 0.06, 0.08, 0.12, 0.12 and 0.20 mg/kg (median 0.12 mg/kg).
As the GAP in the USA is established for the group of pome fruits, and the median values from the trials conducted in the USA on the two commodities did not differ by more than 5-fold, the Meeting decided to estimate a group maximum residue level.
Man-Whitney test indicated that the residues from apple trials and those from pear trials were not statistically different. The Meeting decided to combine the data for estimating a maximum residue level. Residues were (n=17): 0.01, 0.04, 0.06, 0.06, 0.07, 0.08, 0.09, 0.10, 0.12, 0.12, 0.13, 0.14, 0.16, 0.18, 0.19, 0.20 and 0.24 mg/kg.
The Meeting estimated a maximum residue level of 0.4 mg/kg for pome fruits.
The sum of cyflumetofen and B-1 was calculated: 0.03, 0.06, 0.08, 0.08, 0.09, 0.10, 0.11, 0.12, 0.14, 0.14, 0.15, 0.16, 0.18, 0.20, 0.21, 0.22 and 0.26 mg eq./kg.
The Meeting estimated an STMR of 0.14 mg/kg expressed as cyflumetofen.

Cyflumetofen 273
Berries and Other Small Fruits
Grapes
A total of 12 supervised trials were conducted on grapes in the USA in 2009. The GAP in the USA for grapes allows 2 applications at a maximum rate of 0.2 kg ai/ha (at least 468 L/ha) with a PHI of 14 days.
Residues from 11 independent trials matching US GAP were: 0.02, 0.09, 0.10, 0.12, 0.15, 0.16, 0.19, 0.22, 0.22, 0.27 and 0.42 mg/kg.
The Meeting estimated a maximum residue level of 0.6 mg/kg for grapes.
The sum of cyflumetofen and B-1 was calculated: 0.04, 0.12, 0.12, 0.16, 0.20, 0.22, 0.23, 0.25, 0.25, 0.33 and 0.46 mg eq./kg.
The Meeting estimated an STMR of 0.22 mg/kg expressed as cyflumetofen.
Strawberry
A total of eight supervised trials were conducted on strawberry in the USA in 2009 and 2010. The GAP in the USA for strawberry allows 2 applications at a maximum rate of 0.2 kg ai/ha (at least 468 L/ha) with a PHI of 1 day.
Residues from eight trials matching US GAP were: 0.04, 0.10, 0.14, 0.14, 0.16, 0.20, 0.23 and 0.36 mg/kg.
The Meeting estimated a maximum residue level of 0.6 mg/kg for strawberry.
The sum of cyflumetofen and B-1 was calculated: 0.06, 0.13, 0.16, 0.16, 0.20, 0.24, 0.28 and 0.40 mg eq./kg.
The Meeting estimated an STMR of 0.18 mg/kg expressed as cyflumetofen.
Fruiting Vegetables, Other Than Cucurbits
Tomato
A total of 16 supervised trials were conducted on tomato in the USA in 2009 and 2010. The GAP in the USA for tomato allows 2 applications at a maximum rate of 0.2 kg ai/ha (at least 468 L/ha) with a PHI of 3 days.
Residues from 14 independent trials matching US GAP were: 0.01, 0.02, 0.02, 0.04, 0.04, 0.04, 0.04, 0.06, 0.06, 0.06, 0.07, 0.09, 0.12 and 0.15 mg/kg.
The Meeting estimated a maximum residue level of 0.3 mg/kg for tomato.
The sum of cyflumetofen and B-1 was calculated: 0.03, 0.04, 0.06, 0.06, 0.06, 0.06, 0.06, 0.08, 0.08, 0.09, 0.10, 0.11, 0.17 and 0.18 mg eq./kg.
The Meeting estimated an STMR of 0.07 mg/kg expressed as cyflumetofen.
Eggplant
Two supervised trials were conducted on eggplant, green house grown, in Japan in 2004 with the analysis of cyflumetofen and the conjugates of B-1. The current GAP of Japan allows 2 applications at a spray concentration of 0.02 kg ai/hL with a PHI of 1 day. A spray volume of 1000–3500 L can be sprayed per ha. In the trials, spray concentration was 0.02 kg ai/hL and spray volume was 1996 L/ha, matching Japanese GAP. Residues from these trials were: 0.34 and 0.46 mg/kg.
The Meeting concluded that the data were insufficient for estimating a maximum residue level for eggplant.

274 Cyflumetofen
Tree nuts
Five trials were conducted on almonds and five other trials were conducted on pecans in the USA in 2009. The GAP in the USA for tree nuts allows 2 application at a maximum rate of 0.2 kg ai/ha (in at least 935 L/ha) with a PHI of 7 days.
Residues in almond nutmeat from five trials matching US GAP were: < 0.01 (5) mg/kg.
Residues in pecan nutmeat from five trials matching US GAP were: < 0.01 (5) mg/kg.
As the GAP in the USA is established for the group of tree nuts and as the residues were all < 0.01 mg/kg, the Meeting agreed to estimate a maximum residue level for the tree nuts group at 0.01* mg/kg.
As the B-1 was also below the LOQ in all the trials, and the nutmeat is protected by the hull and not exposed to cyflumetofen foliar spray, the Meeting estimated an STMR to be 0.01 mg/kg expressed as cyflumetofen.
Animal feeds
Almond hulls
Five trials were conducted on almond in the USA in 2009. The GAP is the USA allows 2 application at a maximum rate of 0.2 kg ai/ha (in at least 935 L/ha) with a PHI of 7 days.
Residues in almond hull from five trials matching US GAP were: 0.35, 0.53, 0.56, 0.86 and 1.87 mg/kg.
The Meeting estimated a maximum residue level of 4 mg/kg.
The sum of cyflumetofen and B-1 was calculated: 0.38, 0.63, 0.67, 0.98 and 2.11 mg/kg. The Meeting estimated a median residue of 0.67 mg/kg.
Fate of residues during processing
High temperature hydrolysis
To simulate the degradation of cyflumetofen during pasteurization, baking, brewing, boiling and sterilization, the hydrolysis of radio-labelled cyflumetofen was investigated in sterile buffered aqueous solutions.
After incubation at 90 °C (pH 4) for 20 minutes, 100 °C (pH 5) for 60 minutes or 120 °C (pH 6) for 20 minutes, no loss of radioactivity occurred. After heating at 90 °C for 20 minutes, about 69–71% of cyflumetofen remained with 14–23% of the applied radioactivity degraded to B-1. At 100 °C for 60 minutes, only 5–18% of cyflumetofen remained with the formation of B-1 (53–59% AR) and AB-1 (32–40% AR). At 120 °C, cyflumetofen was completely hydrolysed with the formation of B-1 (44–75% AR) and AB-1 (39–49% AR). Cyflumetofen was susceptible to hydrolysis at high temperature.
Processing
The Meeting received information on processing of orange, apple, grape and tomato.
Processing factors calculated for the processed commodities of the above raw agricultural commodities are shown in the table below. STMR-Ps were calculated for processed commodities of orange, apple and grape for which maximum residue levels were estimated.
Processed Orange Product
Cyflumetofen Cyflumetofen and B-1* STMR-P or median
Processing factor Best estimate
Processing factor Best estimate
Orange 0.07 Juice < 0.02, < 0.08 0.05 < 0.04, < 0.022 0.031 0.0022 Oil 102, 137 120 88.0, 133 111 7.77

Cyflumetofen 275
Processed Orange Product
Cyflumetofen Cyflumetofen and B-1* STMR-P or median
Processing factor Best estimate
Processing factor Best estimate
Marmalade 0.026, < 0.08 0.026 0.059, < 0.22 0.14 0.0098 Peel 2.86, 2.97 2.92 2.56, 2.67 2.6 0.18 Molasses < 0.02, < 0.08 < 0.06 < 0.075, < 0.502 0.28 0.020 Dried pulp 0.44, 0.584 0.51 0.759, 0.958 0.86 0.060 Apple 0.14 Applesauce 2.54, 2.91 2.7 3.16, 3.73 3.4 0.48 Juice 0.197, 0.268 0.23 0.224, 0.299 0.26 0.036 Dried apples 0.17, 0.825 0.50 0.21, 0.876 0.54 0.076 Canned apples 0.035, 0.175 0.10 0.076, 0.202 0.14 0.020 Wet pomace 0.937, 1.59 1.3 0.939, 1.57 1.3 0.18 Grape 0.22 Dried grape 0.65, 0.93, 1.88, 4.64 2.0 0.86, 1.1, 2.47, 4.65 2.3 0.506 Juice 0.064,0.11, 0.2, 0.25 0.16 0.10, 0.16, 0.28, 0.32 0.22 0.0484 Wine (Young) < 0.006, 0.029, 0.04, 0.04 0.04 0.04, 0.083,0.17, 0.2 0.12 0.0264 Must 0.02, 0.18, 0.41, 0.53 0.29 0.04, 0.22, 0.44, 0.59 0.32 0.071 Wet Pomace 1.1, 0.02, 3.39, 4.22 2.2 1.1, 3.03, 3.3, 3.97 2.9 0.638 Tomato 0.07 Juice < 0.06, 0.2 0.2 < 0.2, 0.38 0.38 0.027 Canned Tomato < 0.04, 0.2 0.2 < 0.1, 0.3 0.3 0.021 Puree 0.3, 0.88 0.59 0.4, 0.79 0.60 0.042 Paste 0.2, 0.4 0.3 1.2, 2.2 1.7 0.12 Wet Pomace 1.3, 5.5 3.4 1.4, 5.0 3.2 0.22
* expressed as cyflumetofen.
As the residue concentration is higher in orange oil than in fresh orange, the Meeting estimated a maximum residue level of 36 mg/kg for citrus oil by multiplying the maximum residue level of citrus fruits (0.3 mg/kg) by 120.
As the residue concentration is higher in dried grapes than in fresh grapes, the Meeting estimated a maximum residue level of 1.5 mg/kg by multiplying the maximum residue level for grapes (0.6 mg/kg) by 2.0.
In processing of foods, heating in aquatic system at high temperature may be employed, and therefore it is likely that AB-1 is present at significant concentrations after processing at slightly acidic to neutral pH (≥ 5). It may also occur from cyflumetofen during the storage of processed foods with high water content at room temperature. However, the Meeting concluded that AB-1 is covered by the ADI for the parent compound.
Residues in animal commodities
Estimation of dietary burden
The maximum and mean dietary burdens were calculated using the median residues of cyflumetofen (sum of cyflumetofen and B-1 expressed as cyflumetofen, to cover the worst case) estimated at the current Meeting on a basis of the OECD Animal Feeding Table.
Summary of livestock dietary burdens (ppm of dry matter diet)
US-Canada EU Australia Japan
Max Mean max Mean Max Mean Max mean Beef cattle 0.007 0.007 0.090 0.090 0.934 a 0.934 b 0 0 Dairy cattle 0.119 0.119 0.052 0.052 0.934 a 0.934 b 0 0 Broilers 0 0 0 0 0 0 0 0 Layers 0 0 0 0 0 0 0 0
a Suitable for estimating maximum residue levels for milk, meat, fat and edible offal of cattle. b Suitable for estimating STMRs for milk, meat, fat and edible offal of cattle.

276 Cyflumetofen
Residues in milk and cattle tissues
In the goat metabolism studies, in which goats were administered benzoyl-label cyflumetofen at a dose equivalent to 12.8 ppm in feed for 12 consecutive days and sacrificed one day later, cyflumetofen was found only in fat at 0.003 mg/kg. B-1 were found in liver, kidney, muscle, fat and milk at 0.125, 0.102, 0.005, 0.006 and 0.001 mg eq./kg respectively. The sum of cyflumetofen and B-1 in fat is 0.009 mg/kg as cyflumetofen. Neither cyflumetofen nor metabolites were found above 0.01 mg/kg or 10% TRR when butylphenyl-label cyflumetofen was administered to goats.
These concentrations were multiplied by 0.934/12.8 for estimating STMRs. The Meeting estimated STMRs of 0.010, 0.008, 0, 0 and 0 mg/kg for liver, kidney, meat, fat and milk, respectively.
The Meeting estimated maximum residue levels of 0.02, 0.01*, 0.01* and 0.01* mg/kg expressed as cyflumetofen for edible offal (mammalian), meat (from mammals other than marine mammals), mammalian fats (except milk fat) and milks, respectively.
The dietary burden for poultry was calculated to be 0 ppm of dry matter diet. No metabolism or feeding studies on laying hens were conducted.
RECOMMENDATIONS
On the basis of the data from supervised trials the Meeting concluded that the residue levels listed below are suitable for establishing maximum residue limits and for IEDI and IESTI assessment.
Definition of the residue for plant commodities (for compliance with the MRL): Cyflumetofen.
Definition of the residue for plant commodities (for estimation of dietary intake): Sum of cyflumetofen and 2-trifluoromethylbenzoic acid, expressed as cyflumetofen.
Definition of the residue for animal commodities (for compliance with the MRL and estimation of dietary intake): Sum of cyflumetofen and 2-trifluoromethylbenzoic acid, expressed as cyflumetofen.
Residue is not fat-soluble.
Commodity Recommended MRL, mg/kg STMR/STMR-P mg/kg a CCN Name New Previous
AM 0660 Almond hulls 4 - Median: 0.67 FC 0001 Citrus fruit 0.3 - 0.07 Citrus oil 36 7.77 DF 0269 Dried grape 1.5 0.506
MO 0105 Edible offal (mammalian) 0.02 Liver: 0.010 Kidney: 0.008
FB 0269 Grapes 0.6 - 0.22 MF 0100 Mammalian fats (except milk fat). 0.01* 0
MM 0095 Meat (from mammals other than marine mammals) 0.01* 0
ML 0106 Milks 0.01* 0 FP 0009 Pome fruits 0.4 - 0.14 FB 0275 Strawberry 0.6 - 0.18 VO 0448 Tomato 0.3 - 0.07 TN 0085 Tree nuts 0.01* - 0.01 Orange juice 0.0022 Marmalade 0.098 Citrus peel 0.18

Cyflumetofen 277
Commodity Recommended MRL, mg/kg STMR/STMR-P mg/kg a CCN Name New Previous
Citrus molasses 0.020 Apple sauce 0.48 Apple juice 0.036 Dried apple 0.076 Canned apple 0.020 Grape juice 0.048 Grape wine 0.026 Grape must 0.071 Tomato juice 0.027 Canned tomato 0.021 Tomato puree 0.042 Tomato paste 0.12
a Sum of cyflumetofen and B-1 expressed as cyflumetofen.
For calculating animal dietary burdens.
Commodity Median residue, mg/kg a
CCN Name
Citrus dry pulp 0.060 Apple wet pomace 0.18 Grape wet pomace 0.64 Tomato wet pomace 0.22
Expressed on an “as received” basis. a Sum of cyflumetofen and B-1 expressed as cyflumetofen.
DIETARY RISK ASSESSMENT
Long-term intake The International Estimated Dietary Intakes (IEDIs) of cyflumetofen were calculated for the 17 GEMS/Food cluster diets using STMRs estimated by the current Meeting (Annex 3 of the 2014 Report). The ADI is 0–0.1 mg/kg bw and the calculated IEDIs were 0–1% of the maximum ADI. The Meeting concluded that the long-term intake of residues of cyflumetofen resulting from the uses considered by the current JMPR is unlikely to present a public health concern.
Short-term intake
The 2014 JMPR decided that an ARfD was unnecessary. The Meeting therefore concluded that the short-term intake of residues of cyflumetofen is unlikely to present a public health concern.
REFERENCES Code Author(s) Year Title, Institute, Report reference OTSA-0183-FR
Baan-Treur, J van der
2004 a Determination of the flammability of OK-5101 Notox BV, s-Hertogenbosch, Netherlands Unpublished
OTSA-0182
Baan-Treur, J van der
2004 b Determination of the auto-ignition temperature of OK-5101 Notox BV, s-Hertogenbosch, Netherlands Unpublished

278 Cyflumetofen
Code Author(s) Year Title, Institute, Report reference OTSA-0183-FR
Baan-Treur, J van der
2004 c Determination of the flammability of OK-5101 Notox BV, s-Hertogenbosch, Netherlands Unpublished
OTSA-0182
Baan-Treur, J van der
2004 d Determination of the auto-ignition temperature of OK-5101 Notox BV, s-Hertogenbosch, Netherlands Unpublished
OTSA-0180
Baan-Treur, J van der
2004 e Statement on the explosive properties of OK-5101 Notox BV, s-Hertogenbosch, Netherlands Unpublished
OTSA-0181
Baan-Treur, J van der
2004 f Statement on the oxidizing properties of OK-5101 Notox BV, s-Hertogenbosch, Netherlands Unpublished
OTSA-0327-FR
Baltussen, E 2006 a Determination of appearance of OK-5101 Notox BV, s-Hertogenbosch, Netherlands Unpublished
OTSA-0327-FR
Baltussen, E 2006 b Determination of appearance of OK-5101 Notox BV, s-Hertogenbosch, Netherlands Unpublished
OTSA-0484-FR
Baptista ,GC de 2007 a Determination of residues of OK 5101 in oranges—Field study registry number: TRI 41/06 - IBATE-SP ESALQ—Escola Superior de Agricultura Luis de Queiroz, Piracicaba, Brazil Unpublished
OTSA-0511-FR
Baptsita ,GC de 2007 b Determination of residues of ALI 0301 in oranges—ALI 0504 EE01 ESALQ—Escola Superior de Agricultura Luis de Queiroz, Piracicaba, Brazil Unpublished
OTSA-0508-FR
Baptista, GC de 2007 d Determination of residues of OK 5101 in oranges—Field study registry number: TRI 42/06 ESALQ—Escola Superior de Agricultura Luis de Queiroz, Piracicaba, Brazil Unpublished
OTSA-0513-FR
Baptista, GC de 2007 e Determination of residues of ALI 0301 in oranges—ALI 0505 SPS01 ESALQ—Escola Superior de Agricultura Luis de Queiroz, Piracicaba, Brazil Unpublished
OTSA-0331-FR
Cardinaals, JM 2006 a OK-5101—Calculation of Henry s Law constant Notox BV, s-Hertogenbosch, Netherlands Unpublished
OTSA-0330-FR
Cardinaals, JM 2006 b OK-5101—Calculation of dissociation constant Notox BV, s-Hertogenbosch, Netherlands Unpublished
2011/7002620
Crawford, LE 2011 b Magnitude of Cyflumetofen residues in processed tomato following applications of Cyflumetofen Landis International Inc., Valdosta GA, United States of America Unpublished
2011/7002631
Crawford, LE 2011 e Magnitude of Cyflumetofen residues in tomato following applications of Cyflumetofen Landis International Inc., Valdosta GA, United States of America Unpublished
2011/7003996
Crawford, LE 2011 f Magnitude of Cyflumetofen residues in the tree nut group following applications of Cyflumetofen Landis International Inc., Valdosta GA, United States of America Unpublished
OTSA-0057-FR
Dohn, DR 2004 a Metabolic fate of (14C) OK-5101 (labelled in the phenyl and tolyl rings) in apples PTRL West Inc., Hercules CA, United States of America Unpublished
OTSA-0056-FR
Dohn, DR 2004 b Metabolic fate of (14C) OK-5101 (labelled in the phenyl and tolyl rings) in eggplants PTRL West Inc., Hercules CA, United States of America Unpublished
2011/1249430
Fabian, E and Landsiedel, R
2011 a 14C-BAS 9210 I (Cyflumetofen)—Absorption, distribution and excretion after repeated oral administration in lactating goats BASF SE, Ludwigshafen/Rhein, Germany Fed.Rep. Unpublished
2011/7002603
Gordon, B 2011 a Freezer storage stability of Cyflumetofen (BAS 9210 I) and its relevant metabolites in plant samples—Zero to twelve months analysis BASF Agricultural Research Center, Research Triangle Park NC, United States of America Unpublished
2012/7004638
Gordon, B 2013 a Freezer storage stability of Cyflumetofen (BAS 9210 I) and its relevant metabolites in plant samples BASF Agricultural Research Center, Research Triangle Park NC, United States of America Unpublished
2013/1164697
Hassing, J 2013 a Cyflumetofen: Hydrolysis at 90 °C, 100 °C and 120 °C BASF SE, Limburgerhof, Germany Fed.Rep. Unpublished
2011/7003994
Hattermann, D and Lott, T
2011 b Magnitude of Cyflumetofen residues in processed grapes following applications of Cyflumetofen Landis International Inc., Valdosta GA, United States of America Unpublished
2011/7003993
Hattermann, D and Cowen, B
2011 c Magnitude of Cyflumetofen residues in processed citrus following applications of Cyflumetofen Landis International Inc., Valdosta GA, United States of America Unpublished
2012/7003656
Hattermann, DR et al.
2012 a Magnitude of Cyflumetofen residues in citrus following applications of Cyflumetofen Landis International Inc., Valdosta GA, United States of America Unpublished
2011/7003995
Hattermann, DR and Lott, T
2011 a Raw agricultural commodity residue evaluation of Cyflumetofen 20 SC applied to grapes Landis International Inc., Valdosta GA, United States of America Unpublished

Cyflumetofen 279
Code Author(s) Year Title, Institute, Report reference OTSA-0072(EN)-FR
Hayashi, O 2004 a (14C)OK-5101 (phenyl-ring-U-and tolyl-ring-U-label): A metabolism study on Satsuma mandarin The Institute of Environmental Toxicology, Mitsukaido-shi Ibaraki 303-0043, Japan Unpublished
OTSA-0107-RA1
Hiler, T 2006 a Physical properties: Nuclear magnetic resonance (NMR) PTRL West Inc., Hercules CA, United States of America Unpublished
OTSA-0029(EN)-FR
Iijima, K 2001 a OK-5101 pure: Determination of physical state Institute of Environmental Toxicology, Mitsukaido Ibaraki 303-0043, Japan Unpublished
OTSA-0028(EN)-FR
Iijima, K 2001 b OK-5101 pure: Determination of color Institute of Environmental Toxicology, Mitsukaido Ibaraki 303-0043, Japan Unpublished
OTSA-0030(EN)-FR
Iijima, K 2001 c OK-5101 pure: Determination of odor Institute of Environmental Toxicology, Mitsukaido Ibaraki 303-0043, Japan Unpublished
OTSA-0032(EN)-FR
Iijima, K 2002 a OK-5101 pure: Determination of melting point Institute of Environmental Toxicology, Mitsukaido Ibaraki 303-0043, Japan Unpublished
OTSA-0033(EN)-FR
Iijima, K 2002 b OK-5101 pure: Determination of boiling point Institute of Environmental Toxicology, Mitsukaido Ibaraki 303-0043, Japan Unpublished
OTSA-0039(EN)-FR
Iijima, K 2002 c OK-5101 pure: Screening test for thermal stability Institute of Environmental Toxicology, Mitsukaido Ibaraki 303-0043, Japan Unpublished
OTSA-0040(EN)-FR
Iijima, K 2002 d OK-5101 pure: Determination of ultraviolet-visible absorption (UV/VIS) spectrum Institute of Environmental Toxicology, Mitsukaido Ibaraki 303-0043, Japan Unpublished
OTSA-0034(EN)-FR
Iijima, K 2002 e OK-5101 pure: Solubility study in water Institute of Environmental Toxicology, Mitsukaido Ibaraki 303-0043, Japan Unpublished
OTSA-0031(EN)-FR
Iijima, K 2003 a OK-5101 pure: Determination of density Institute of Environmental Toxicology, Mitsukaido Ibaraki 303-0043, Japan Unpublished
OTSA-0070(EN)-FR
Iijima, K 2003 b OK-5101 pure: Determination of mass spectrum Institute of Environmental Toxicology, Mitsukaido Ibaraki 303-0043, Japan Unpublished
OTSA-0035(EN)-FR
Iijima, K 2003 c OK-5101 pure: Solubility study in organic solvents Institute of Environmental Toxicology, Mitsukaido Ibaraki 303-0043, Japan Unpublished
OTSA-0036(EN)-FR
Iijima, K 2004 a OK-5101 pure: Determination of n-octanol/water partition coefficient Institute of Environmental Toxicology, Mitsukaido Ibaraki 303-0043, Japan Unpublished
OTSA-0076
Knight, L 2004 a OK-5101—Hydrolysis under laboratory conditions Huntingdon Life Sciences Ltd., Huntingdon Cambridgeshire PE28 4HS, United Kingdom Unpublished
OTSA-0078
Knight, LJL 2004 b OK-5101—Photodegradation in water and quantum yield of direct photodegradation in water Huntingdon Life Sciences Ltd., Huntingdon Cambridgeshire PE28 4HS, United Kingdom Unpublished
OTSA-0060(EN)-FR
Nakamura, H 2002 a OK-5101 pure: Determination of IR spectrum Institute of Environmental Toxicology, Mitsukaido Ibaraki 303-0043, Japan Unpublished
OTSA-0156(EN)-FR
Nakamura, H 2004 a (14C)OK-5101 (phenyl-ring-U-and tolyl-ring-U-label): A hydrolysis study Institute of Environmental Toxicology, Mitsukaido Ibaraki 303-0043, Japan Unpublished
OTSA-0301-FR
North, L et al. 2007 a Final report on project AF/10943/OT—To determine the magnitude of OK-5101 20SC residues at harvest in the raw agricultural commodity apple resulting from sequential overall foliar applications of OK-5101 20 SC, in Italy during 2006 Agrisearch UK Ltd., Melbourne Derbyshire DE73 8AG, United Kingdom Unpublished
OTSA-0203 (2)-FR
Odanaka, Y and Wakazone, Y
2004 a OK-5101 (Danisaraba)—Pesticide residue analysis on eggplant The Institute of Environmental Toxicology, Joso-shi Ibaraki 303-0043, Japan Unpublished
OTSA-0157(EN)-FR
Ohyama, K 2004 a (14C)OK-5101 (phenyl-ring-U-and tolyl-ring-U-label): A photolysis study in water Institute of Environmental Toxicology, Mitsukaido Ibaraki 303-0043, Japan Unpublished
OTSA-0049(EN)-FR
Saka, M 2002 a OK-5101 pure: Vapour pressure study Institute of Environmental Toxicology, Mitsukaido Ibaraki 303-0043, Japan Unpublished
2011/1106409
Sowka, N et al. 2011 a The metabolism of 14C-Cyflumetofen in lactating goats BASF SE, Limburgerhof, Germany Fed.Rep. Unpublished

280 Cyflumetofen
Code Author(s) Year Title, Institute, Report reference 2011/7000143
White, MT 2011 a Magnitude of Cyflumetofen (BAS 9210 I) in pomefruit following applications of BAS 9210 0I Alliance Pharma Inc., Malvern PA, United States of America Unpublished
2011/7000144
White, MT 2011 b Magnitude of Cyflumetofen (BAS 9210 I) in apple processed fractions following applications of BAS 9210 0I Alliance Pharma Inc., Malvern PA, United States of America Unpublished
2010/7014999
White, MT and Saha, M
2011 b Magnitude of Cyflumetofen (BAS 9210 I) in strawberry following applications of BAS 9210 0 I BASF Agricultural Research Center, Research Triangle Park NC, United States of America Unpublished
2008/1098832 Willems, HPL 2008 a OK-5101—Atkinson calculation Notox BV, s-Hertogenbosch, Netherlands Unpublished