temperature - msu billings 2009/suits/geo… · air temperature •surface temperature •air...
TRANSCRIPT

Air Temperature
• Surface Temperature
• Air Temperature
• The Daily Cycle of Air Temperature
• Temperature Structure of the Atmosphere
• The Annual Cycle of Air Temperature
• World Patterns of Air Temperature
• Global Warming and the Greenhouse Effect
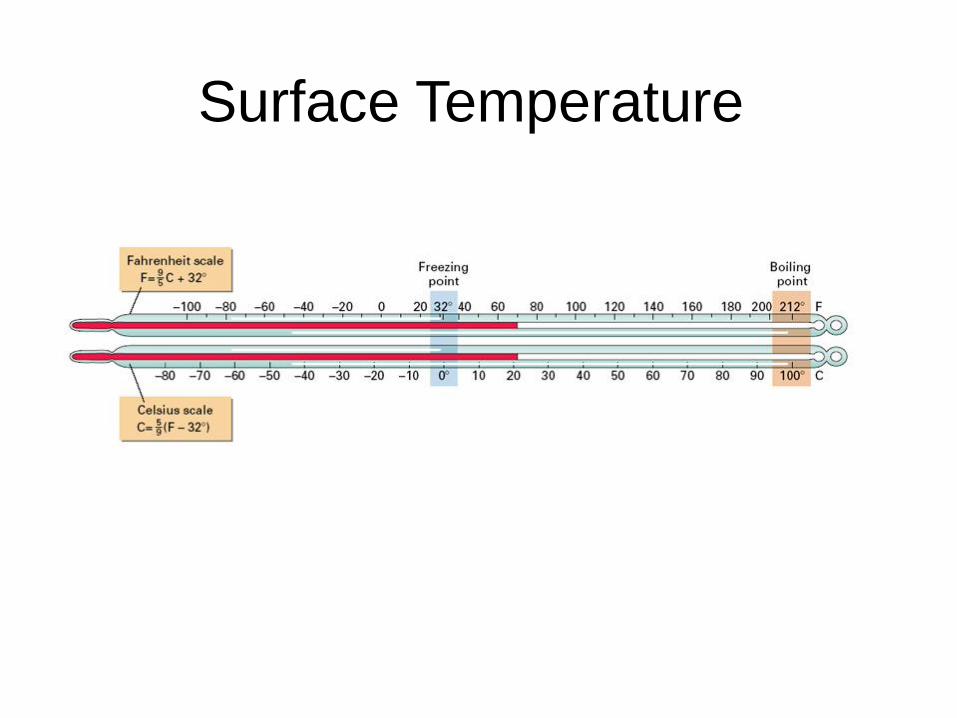
Surface Temperature

Surface Temperature
measured
at 1.2
meters (4
feet) above
the ground
surface by
weather
recording
instruments
Figure 3.4, p. 92
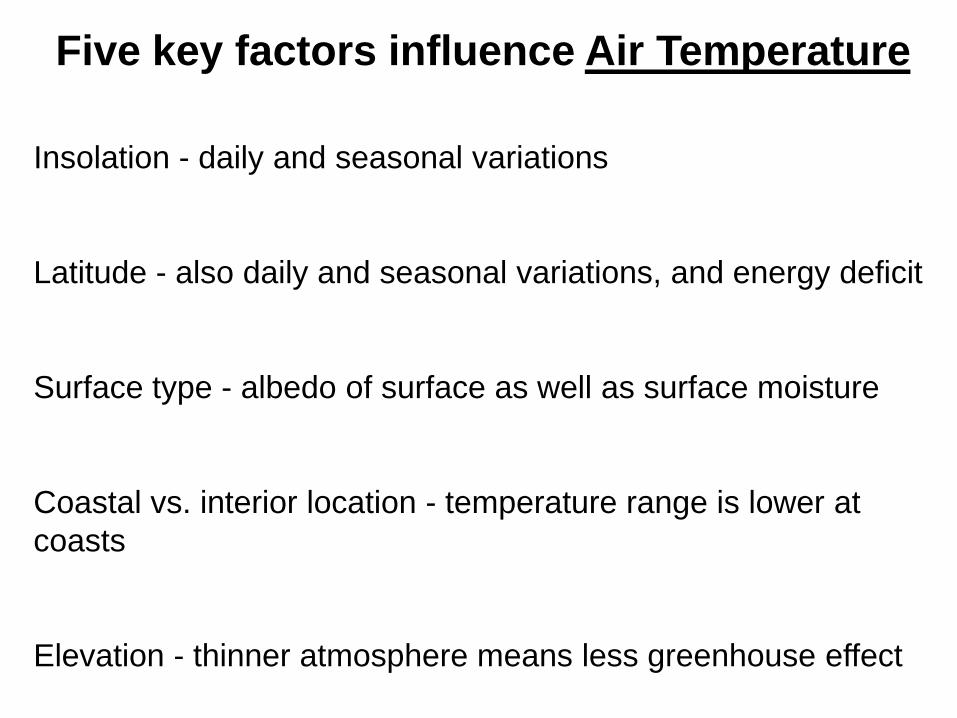
Five key factors influence Air Temperature
Insolation - daily and seasonal variations
Latitude - also daily and seasonal variations, and energy deficit
Surface type - albedo of surface as well as surface moisture
Coastal vs. interior location - temperature range is lower at
coasts
Elevation - thinner atmosphere means less greenhouse effect
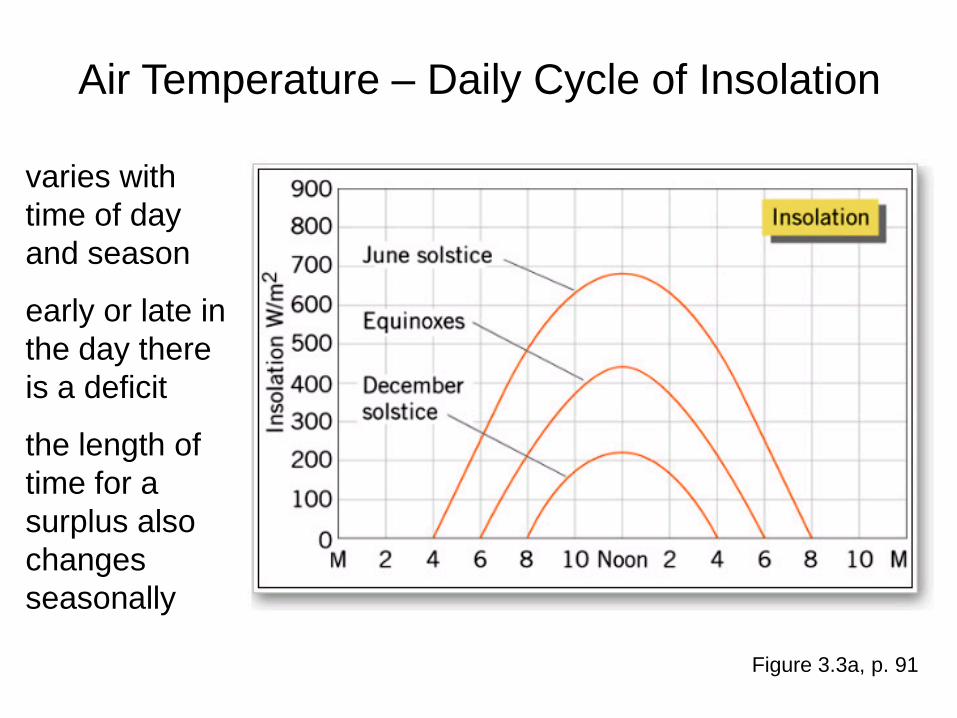
varies with
time of day
and season
early or late in
the day there
is a deficit
the length of
time for a
surplus also
changes
seasonally
Air Temperature – Daily Cycle of Insolation
Figure 3.3a, p. 91

Air Temperature – Daily Cycle of Net Radiation
when net
radiation is
Positive
(surplus) a
surface gains
heat
when net
radiation is
negative
(deficit) a
surface loses
heatFigure 3.3b, p. 91

daily
maxima and
minima
positive net
radiation
leads to an
increase in
temperature
notice that
there is a
time lag
Figure 3.3c, p. 91
Air Temperature – Daily Cycle of Temperature

Cooler Temperatures - rural areas
transpiration from leaves cools the surface
evaporation from moist soils plus transpiration
= evapotranspiration
Warmer Temperatures - urban areas
water is channeled so surfaces tend to be dry
surfaces are often dark (asphalt)
building materials store heat, and heat is
released from buildings
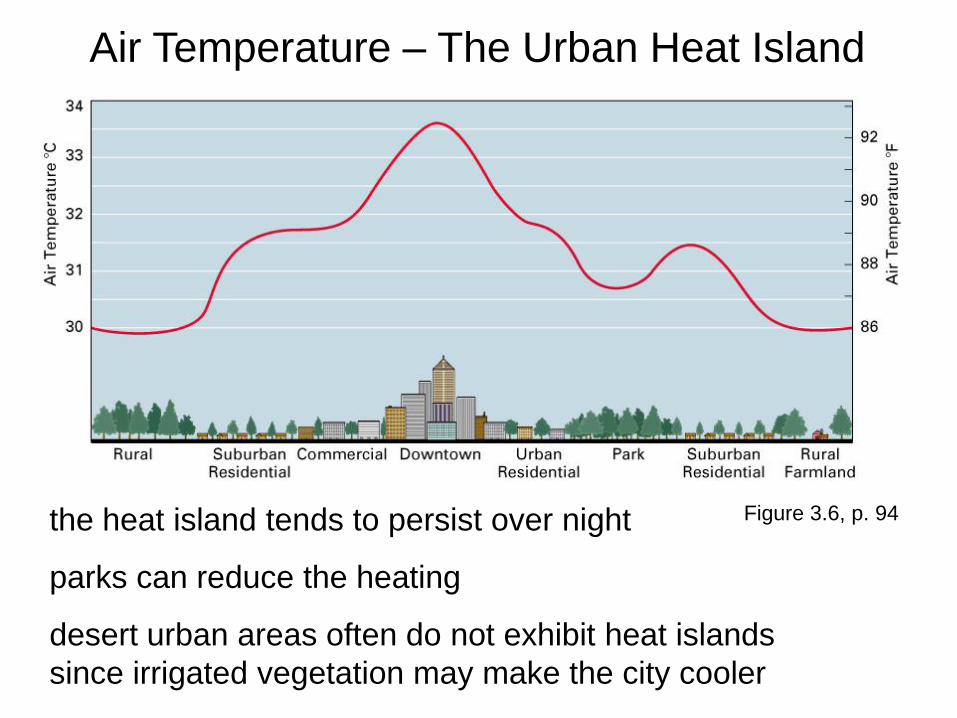
the heat island tends to persist over night
parks can reduce the heating
desert urban areas often do not exhibit heat islands
since irrigated vegetation may make the city cooler
Air Temperature – The Urban Heat Island
Figure 3.6, p. 94

Temperature Structure of the Atmosphere
atmosphere = gaseous envelope surrounding
the Earth
made up of a series of concentric layers
atmosphere is held down by gravity
most of the atmosphere’s mass is near the
surface

troposphere
bounded by the
tropopause
(~12km)
immediately above
is the stratosphere
in which the
temperature
increases with
altitude and a
prevalence of
ozone absorbs
ultraviolet (UV)
radiation
Temperature Structure of the Atmosphere
Figure 3.9, p. 97
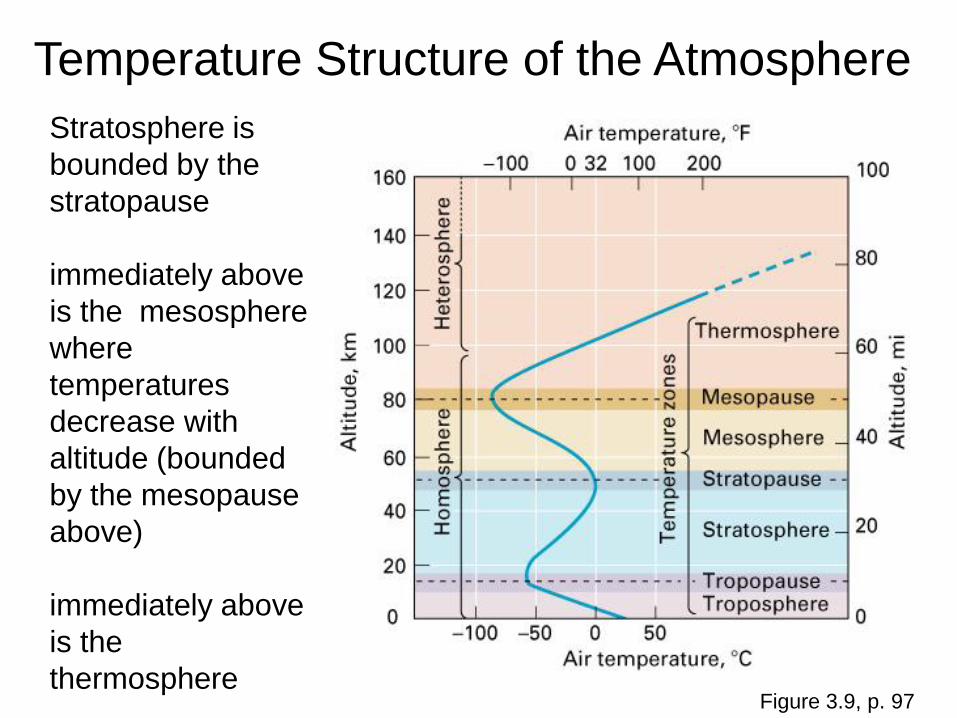
Temperature Structure of the Atmosphere
Figure 3.9, p. 97
Stratosphere is
bounded by the
stratopause
immediately above
is the mesosphere
where
temperatures
decrease with
altitude (bounded
by the mesopause
above)
immediately above
is the
thermosphere

Heat is transferred through the atmosphere by:
Conduction (direct heat transfer from the heated ground surface to the atmosphere)
Convection (heat transfer by warm air moving to colder upper atmosphere)
Advection (heat transfer by warm air mixing with colder adjacent air)
Temperature Structure of the Atmosphere

Temperature Structure of the Atmosphere
The troposphere is the lower most atmospheric layer
temperature
decreases on
average by
6.4˚C per 1000
meters (3.5˚F
per 1000 feet) in
the troposphere
(environmental
lapse rate)
Figure 3.8, p. 96

sometimes
upper air is
warmer than
lower air
(temperature
inversion)
occurs if the
ground cools
overnight
cold air may
flow into an
area
Temperature Structure of the Atmosphere
Figure 3.12, p. 99

Cities in Peru at altitude
generally temperatures drop with altitude
daily temperature range also increases due drier air and less
absorption
Elevation and Temperature
Figure 3.11, p. 98

January Isotherms
Air temperature is warmer at the equator than at the poles, but land and water, ocean currents, and elevation create additional variations.
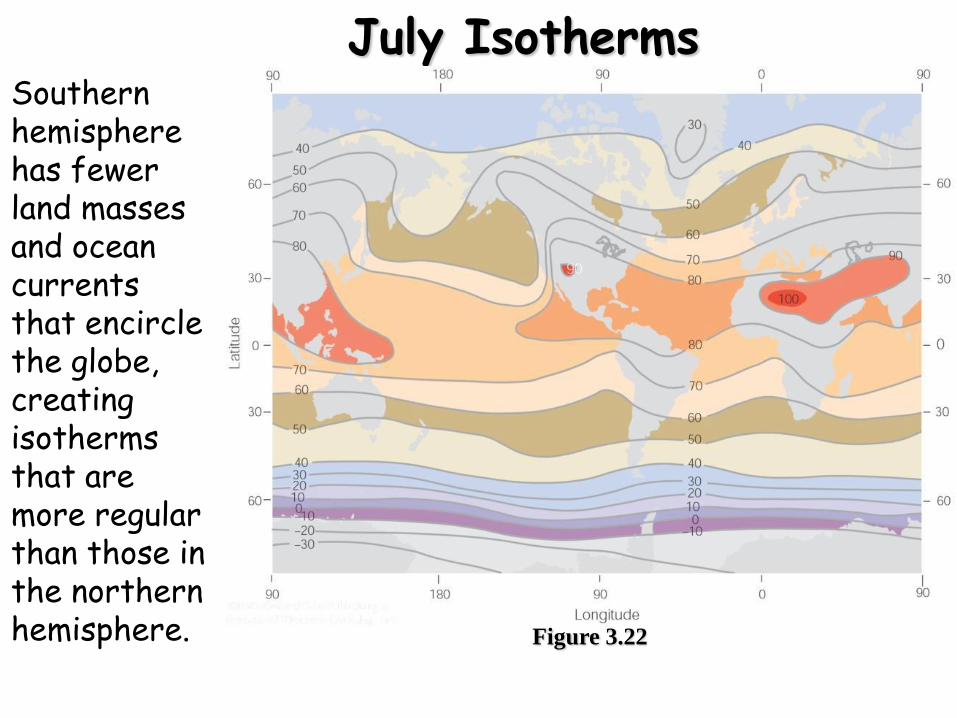
July IsothermsSouthern hemisphere has fewer land masses and ocean currents that encircle the globe, creating isotherms that are more regular than those in the northern hemisphere. Figure 3.22

World Air Temperature Patterns
1. Temperature decreases from the equator to the poles
2. Large land masses in Arctic and subarctic regions
develop centers of extreme cold
3. Temperatures in equatorial regions are relatively
constant
4. Isotherms over land masses make large seasonal shifts
5. Highlands are always colder than surrounding lowlands
6. Areas of perpetual ice and snow are always cold


The Annual Cycle of Air
Temperature: Net Radiation and
Temperature
Low latitudes have
greater amounts
and longer periods
of surplus energy
High latitudes
experience large
and long periods of
deficit
Figure 3.14, p. 100
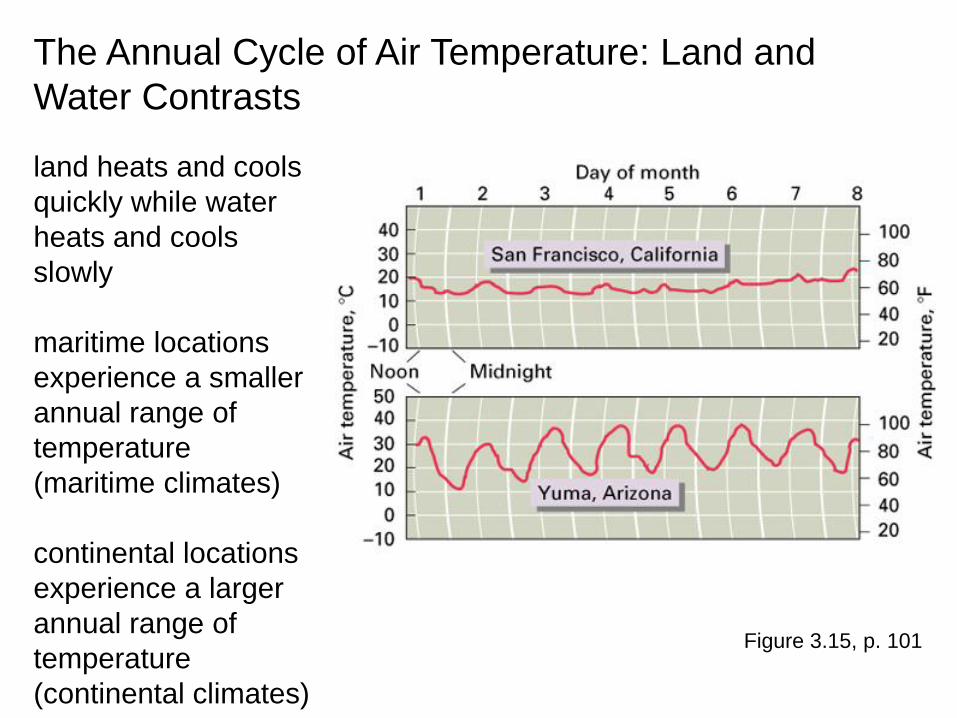
land heats and cools
quickly while water
heats and cools
slowly
maritime locations
experience a smaller
annual range of
temperature
(maritime climates)
continental locations
experience a larger
annual range of
temperature
(continental climates)
The Annual Cycle of Air Temperature: Land and
Water Contrasts
Figure 3.15, p. 101
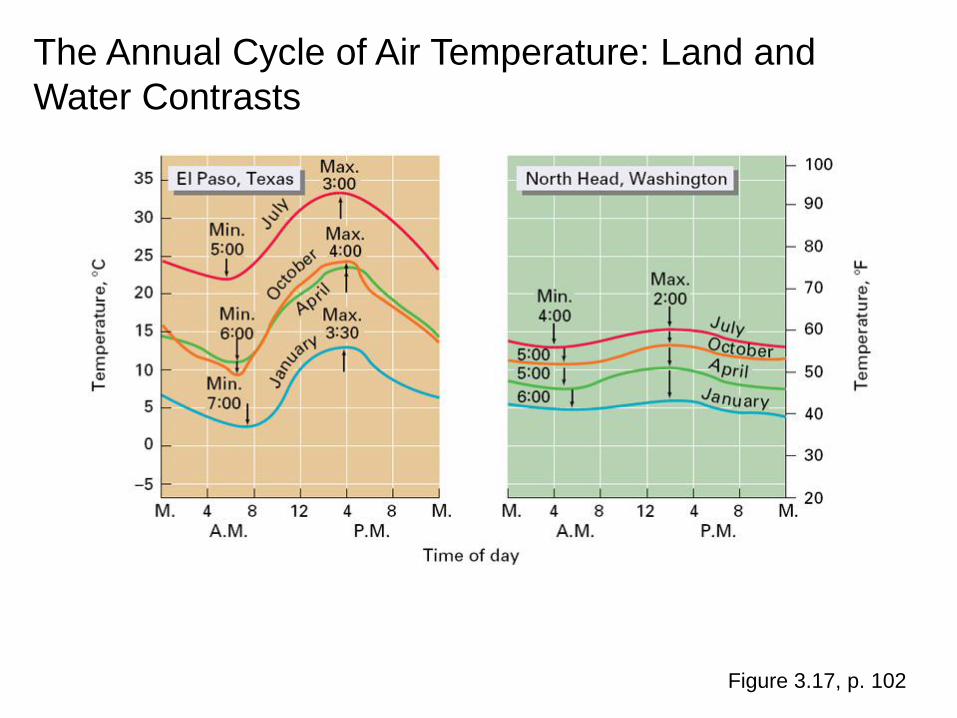
The Annual Cycle of Air Temperature: Land and
Water Contrasts
Figure 3.17, p. 102

World Patterns of Air Temperature
distribution of air
temperatures
shown on a map
uses isotherms
(lines of equal
temperature)
reveal centers of
low or high
temperatures,
and temperature
gradientsFigure 3.19, p. 103

temperatures
decrease from
the equator to
the poles
large
landmasses
located in the
subarctic and
arctic zones
develop
centers of
extremely low
temperatures in
winter
World Patterns of Air Temperature
Figure 3.20, p. 105

Temperatures in
equatorial regions
change little from
January to July
Isotherms make a
large north-south shift
from January to July
over continents in the
midlatitude and
subarctic zones
World
Patterns of Air
Temperature
Figure 3.20, p. 105

highlands are
always colder than
surrounding
lowlands
areas of perpetual
ice and snow are
always intensely
cold
World Patterns of Air Temperature
Figure 3.20,
p. 106

Global Warming and the Greenhouse Effect
p. 110
atmospheric
concentrations
of carbon
dioxide are
currently
increasing at a
rate of 4% per
year
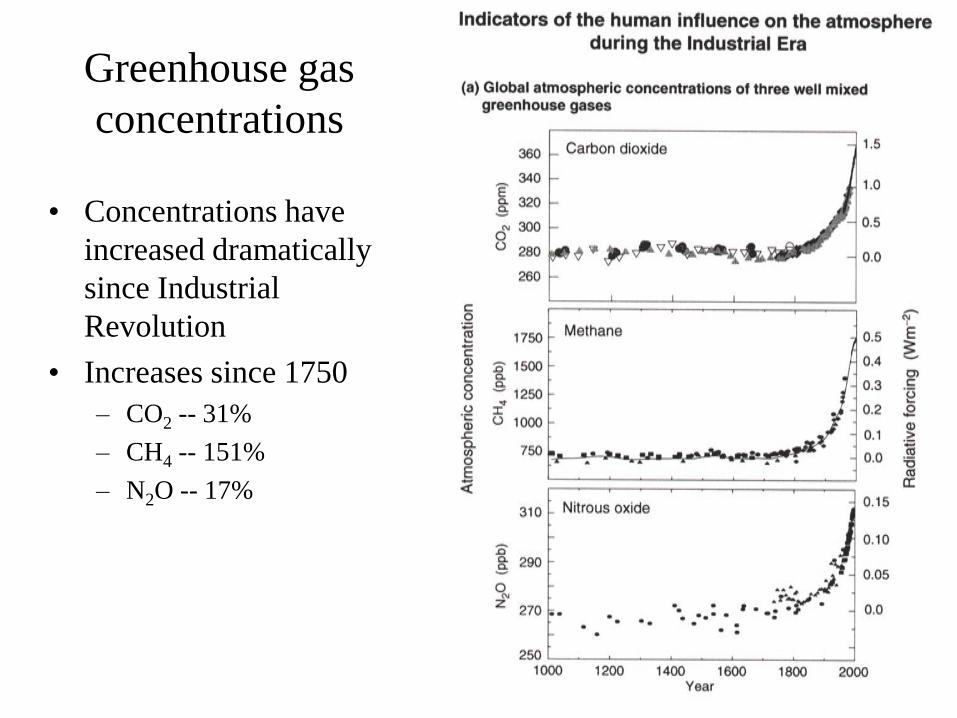
Greenhouse gas
concentrations
• Concentrations have
increased dramatically
since Industrial
Revolution
• Increases since 1750
– CO2 -- 31%
– CH4 -- 151%
– N2O -- 17%

Global Warming and the Greenhouse Effect
Figure 3.24, p. 109
Earth’s
mean
surface
temperature
(1866 –
2002)
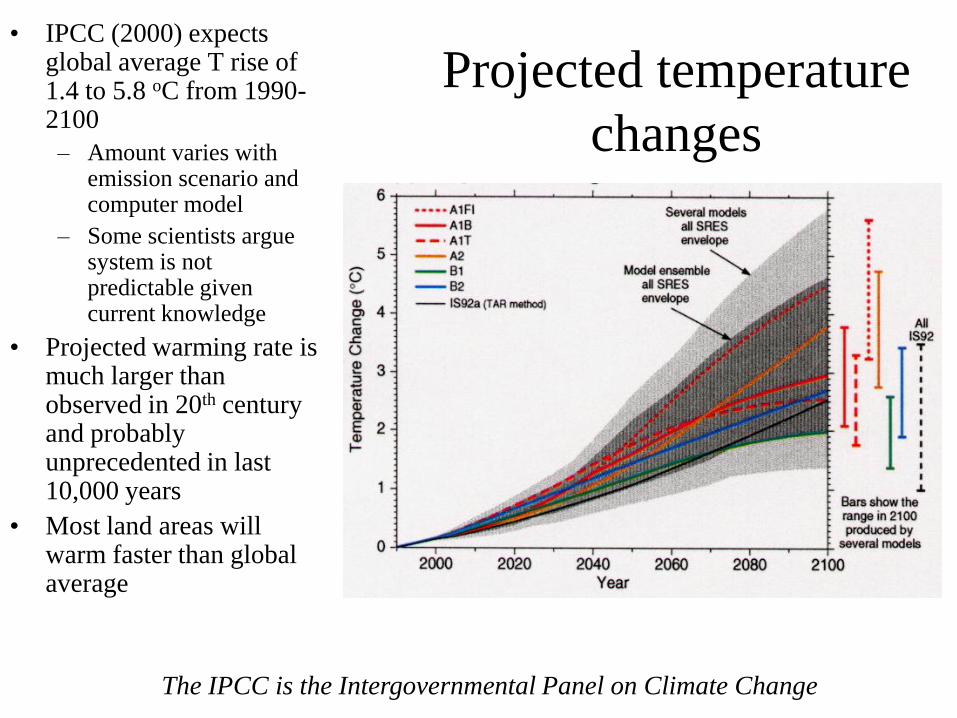
Projected temperature
changes
• IPCC (2000) expects global average T rise of 1.4 to 5.8 oC from 1990-2100
– Amount varies with emission scenario and computer model
– Some scientists argue system is not predictable given current knowledge
• Projected warming rate is much larger than observed in 20th century and probably unprecedented in last 10,000 years
• Most land areas will warm faster than global average
The IPCC is the Intergovernmental Panel on Climate Change