telling the regulatory performance story - pmn · telling the regulatory performance story steve...
TRANSCRIPT

Telling the Regulatory Performance Story
Steve MontaguePerformance Management Network Inc.
March 29, 2012
1

Agenda
• The Regulatory (Risk Management) Results Story
• The Needs / Current Situation
• Needs-Results Logic
• Measurement
• Risk Considerations
• Conclusions
[email protected] www.pmn.net 2

The Regulatory Results Story
• Problem solving, risk and harm reduction as the key focus
• Success is defined by the behaviours of target communities (e.g. compliance)
• Given the above – concepts like deterrence and improved compliance are key – but very difficult to show attribution
Source: Sparrow, Malcolm K. (2000), The Regulatory Craft: Controlling Risks, Solving Problems, and Managing Compliance, Brookings Institution
[email protected] www.pmn.net 3

Tensions Between the Regulatory Story and Convention
• Problem solving vs. organizational efficiency
• Ability to sum the accounts
• Integration vs. balance
• ‘Partnerships’ and other relationships
[email protected] www.pmn.net 4

Table 8-1. Classifications of Business Results
Tier 1. Effects, impacts, and outcomes (environmental results, health effects,
decline in injury and accident rates)
Tier 2. Behavioral outcomes
a. Compliance or noncompliance rates (significance…)
b. Other behavioral changes (adoption of best practices, other risk reduction
activities, “beyond compliance,” voluntary actions, and so on)
Tier 3. Agency activities and outputs
a. Enforcement actions (number, seriousness, case dispositions, penalties, and so on)
b. Inspections (number, nature, findings, and so on)
c. Education and outreach
d. Collaborative partnerships (number established, nature, and so on)
e. Administration of voluntary programs
f. Other compliance-generating or behavioral change-inducing activities
Tier 4. Resource efficiency, with respect to use of
a. Agency resources
b. Regulated community‟s resources
c. State authoritySource: Sparrow, Malcolm K. (2000) The Regulatory Craft Controlling Risks, Solving Problems, and Managing Compliance, The
Brookings Institution, Washington
[email protected] www.pmn.net 5

Table 7-1. Characteristics of Partnerships with the Regulated Community
Characteristic Customer service focus Compliance focus
Whom partnerships
are formed with
Whoever asks for help Whoever needs to be
involved or has
something to offer
Who partners tend to be Good actors, responsible
mentors, and leaders
Bad actors, locus of
significant problems
Stance of regulatory
agency
Reactive, responsive Proactive, seeking out
appropriate partners
Objective of partnership Response to citizen/
industry‟s requests;
meeting their needs
Compliance with
regulations,
collaborative risk
reduction
Method of avoiding
public embarrassment
Dealing only with
responsible parties
Limited use of immunity
and amnesty in
partnership design
Motivation for forming
partnership
Mutual advantage Formed under duress
Source: Sparrow, Malcolm K. (2000) The Regulatory Craft Controlling Risks, Solving Problems, and Managing
Compliance, The Brookings Institution, Washington
[email protected] www.pmn.net 6

Table 9-2. Distinguishing Characteristics of Process Improvement and Problem Solving
Characteristic Process improvement Problem solving
Work addressed Existing core operational high-volume
processes
External risks, threats, or
noncompliance problems
Objective Improve agency machinery or
processes
Eliminate or mitigate external
problems
Focus Internal; efficiency External; effectiveness
Scope Broad, long-term changes
in agency-wide procedures
Context specific, tailor-made
solutions, sometimes
temporary
Staff responsible Process owners and multifunctional
process improvement teams
Project teams formed around
specific external problem
Definition of success Greater productivity, timeliness,
efficiency in routine processes
Specific external risk or
patterns of noncompliance
mitigated or eliminated
Nature of tool Management method Operational methodSource: Sparrow, Malcolm K. (2000) The Regulatory Craft Controlling Risks, Solving Problems, and Managing Compliance, The
Brookings Institution, Washington
[email protected] www.pmn.net 7

Table 14-1. Distinguishing Characteristics of Balanced and Integrated Compliance Strategies
Characteristic Balanced strategy Integrated strategy
Strategy ― Identifies range of tools desirable
― Decides overall resource
allocation (balance)
― Each functional tool finds its own
targets
― Identifies important risks
― Develops coordinated, multifunctional
responses
― Often invents new tools, techniques, solutions
Organization ― Work organized around tools ― Tools organized around work
Key phrases ― “Opportunities for use”
― “Identify targets”
― “Right mix of tools for the agency”
― “Identify problems”
― “Invent solutions”
― “Impact” / “effect”
― “Mix of tools that work”
Organizational
challenges
― Competing styles or orientations
― On-site conflicts
― Mixed signals to outside world
― Lateral coordination
― Project-based approach
― Dynamic resource allocation
― Budgetary flexibility
Impacts or effects ― Functionally specific credit for
direct effects of actions
― Shared credit for major accomplishments
Source: Sparrow, Malcolm K. (2000) The Regulatory Craft Controlling Risks, Solving Problems, and Managing Compliance, The Brookings
Institution, Washington
[email protected] www.pmn.net 8

The Current [Typical] Policy / Program Situation:
• Accountability• Complexity• Dynamism • Tools for performance measurement and
assessment are inadequate– Scorecards – Dashboards [Simple Matrices]– Compliance rates– Process measures– Audit– Evaluation
[email protected] www.pmn.net 9

Simple-Complicated-Complex
Following a Recipe A Rocket to the Moon Raising a Child
• Formulae are critical
and necessary
• Sending one rocket
increases assurance
that next will be ok
• High level of expertise in
many specialized fields
+ coordination
• Rockets similar in critical
ways
• High degree of certainty
of outcome
• Formulae have only a limited application
• Raising one child gives no assurance of success with the next
• Expertise can help but is not sufficient; relationships are key
• Every child is unique
• Uncertainty of outcome remains
Complicated Complex
•The recipe is essential
•Recipes are tested to assure replicability of later efforts
•No particular expertise; knowing how to cook increases success
•Recipes produce standard products
•Certainty of same results every time
Simple
(Zimmerman 2003)(Zimmerman 2003)
www.pmn.net 10

Audit and Evaluation in Public Management
Audit Evaluation
DEFINITION checking, comparing, compliance, assurance assessment of merit, worth, value of administration, output and outcome
of interventions
TYPES traditional – financial and compliance
performance audit – substantive
– systems and procedures
wide variability – many „types‟ noted in the literature
WHO DOES IT? internal auditors – part of organization
external auditors – independent agency
internal evaluators – part of organization
„external‟ contracted consultants – not really independent?
ROLES provide assurance
public accountability
improve management
not as well articulated
increase knowledge
improve delivery and management
(re) consider the rationale
varies by a long list of potential clients
METHODS file review, interviews, focus groups, surveys,
observations
wide variety of methods, from scientific and quasi scientific designs to
purely qualitative and interpretative methods and methods linked to
testing program theory
REPORTING attest to legislatures
direct to management
management
various stakeholders
STRENGTH strong reputation
supported by professional associations
well established and followed standards
addresses issues of public concern (e.g. waste mis-
management etc.)
addresses attribution
explains why?
acknowledges complexity and uncertainty
flexible in design and practice
CHALLENGES dealing with complexity
operating in a collaborating state
credibility
perceived relevance
Source: Mayne, John (2006) Audit and Evaluation in Public Management, The Canadian Journal of Program Evaluation Vol. 21, No. 1
www.pmn.net 11

Measurement and Evaluation
MEASUREMENT MONITORING EVALUATION
Continuous
Periodic: at important milestones such as the mid-term of program implementation; at the conclusion of the program, or after a substantial period of time following program conclusion (3-5 years)
Keeps track of programmatic evolution; analyses and documents progress
In-depth analysis; compares planned with actual achievements
Focuses on inputs, activities, outputs, implementation processes, continued relevance, likely results at purpose level
Answers what activities were implemented and what results were achieved
Focuses on: outputs in relation to inputs; results in relation to cost; processes used to achieve results; overall relevance; impact; and sustainability
Answers why and how results were achieved; contributes to building theories and models for change
Alerts managers to problems and provides options for corrective actions
Provides managers with strategy and policy options
Self-assessment by program managers, supervisors, community stakeholders, and donors
Internal and / or external analysis by programme managers, supervisors, community stakeholders, donors, and/or external evaluators
Sources: UNICEF, 1991; WFP, May 2000, World Bank International Finance Corporation, January 2006
www.pmn.net 12

Problem: The Reasons for Doing Performance Planning, Measurement and Evaluation
• Contrasting World Views and Paradigms
Learning
Accountability
www.pmn.net 13

The Problem with Traditional Measurement and Accountability Applied to Modern Public [Regulatory] Performance:
• Most Performance Measurement is “disaggregationist”, while strategic management requires synthesis
• Balanced vs. integrated thinking (Sparrow)
• Tendency to emphasize linear thinking
• Standardized metrics (e.g. speed, compliance level – Sparrow)
• Implied command and control
• Efficiency over effectiveness (Sparrow)
[email protected] www.pmn.net 14
Case Example: Walkerton• Thousands rendered ill, 7 die from ecoli contaminated
municipal water
• Regulations ‘stiffened’ almost immediately – lots of risk shifting and paper burden to small community well operators
• 2 year O’Connor enquiry
• Blame essentially laid on local officials
• Assessment of water regulations? / risk management?
• Was this a deeper systems problem?
[email protected] www.pmn.net 15

The Need:
• Recognize a different definition of accountability – based on learning and managing for results (i.e. You are accountable for learning and adapting, not for a given outcome per se)
• Tell a Performance Story– How, Who, What, Why
• Change our mental models to recognize– synthesis– interaction– ‘communities’ (people with some common task, function or identity in
the system)– performance measures as progress markers
[email protected] www.pmn.net 16

A Deeper Aspect of the Current Problem
• Many results models for programs prove inadequate in describing programs, initiatives and cases – Too linear
– Either too complex or too simple
– Miss key community behaviours
– Analysis vs. synthesis
– Miss an important question: What problem(s) are we solving?
[email protected] www.pmn.net 17

Need to Recognize That Results Occur In Different ‘Communities’ or Levels
Broad Communities of
interest
Target Communities
of influence
Community of Control
End Outcomes
Immediate & Intermediate
Outcomes
Resources – Activities - Outputs
In fact, these communities are related and interact with each other.
www.pmn.net 18

Sparrow’s Classification of Regulatory Results
Table 8-1. Classifications of Business Results
Tier 1. Effects, impacts, and outcomes (environmental results, health effects,
decline in injury and accident rates)
Tier 2. Behavioral outcomes
a. Compliance or noncompliance rates (significance…)
b. Other behavioral changes (adoption of best practices, other risk reduction
activities, “beyond compliance,” voluntary actions, and so on)
Tier 3. Agency activities and outputs
a. Enforcement actions (number, seriousness, case dispositions, penalties,
and so on)
b. Inspections (number, nature, findings, and so on)
c. Education and outreach
d. Collaborative partnerships (number established, nature, and so on)
e. Administration of voluntary programs
f. Other compliance-generating or behavioral change-inducing activities
Tier 4. Resource efficiency, with respect to use of
a. Agency resources
b. Regulated community‟s resources
c. State authority
Source: Sparrow, Malcolm K. (2002) The Regulatory Craft Controlling Risks, Solving Problems, and Managing Compliance, The Brookings
Institution, Washington, p119
www.pmn.net 19

Operational
(How? – Tier 3)Your operational
environmentYou have direct control
over the behaviours within this sphere
Behavioural Change
(Who and What? – Tier 2)
Your environment of direct influence
e.g., People and groups in direct contact with your operations
State
(Why?- Tier 1)
Your environment of indirect influence
e.g., Broad international communities, communities of interest where you do not
make direct contact
Changes to
Support
Climate
Participation /
Reaction
Awareness /
Understanding
Ability /
Capacity
Action /
Adoption
[email protected] www.pmn.net 20
Spheres of Influence (Sparrow meets Van Der Heijden)

Office of
Boating Safety
Less
provincial
policing of inland lakes
Unsafe
PWC
boating practice
Use of PWCs
by young people
Unclear
legal status
for PWCs
Government
financial pressures
Boating families with teenagers PWC boating
accidents
New
availability of PWCs
Personal Water Craft (PWC) Safety – Early 2000s External Assessment
[email protected] www.pmn.net 21

Office of Boating Safety
Personal Water Craft (PWC) Safety – Early 2000s Internal Assessment
WEAKNESSES / CONSTRAINTS
•Resource limitations
•Lack of ‘presence’
•Lack of PWC experience
•Unclear legal mandate situation
STRENGTHS
•Boating safety knowledge
•Credibility
[email protected] www.pmn.net 22

Communications
Regional
Police
appropriately
support safety efforts
Facilitation /
Partner
Brokering
Monitoring / Enforcement
PWC boaters change
awareness and understanding
Safe PWC
operating practices
Personal Water Craft (PWC) Safety Strategy
Lake communities
support PWC safety efforts
Decrease in PWC
„incidents‟ (improved safety)
Note that the above logic involves garnering regional police and community support to help influence PWC operators. Also note that as the behaviours occur farther and farther away from the operational circle, an organization's ability to influence change is reduced. In this fact lies the analogy of behavioural ‘wave’ –sharp and forceful near the origin, broader and weaker (subject to disruption by other forces) as it moves outward.
[email protected] www.pmn.net 23
Developing a Needs-Results Hierarchy as a ‘Front End’
• Focus on important problems and priorities
• Develop a chain of results leading to
outcomes
• Focus on human change
• Distinguish control from influence
[email protected] www.pmn.net 24

A Basic Results Chain
7. End results 7. What is our impact on ‘ends’?
6. Practice and behaviour change 6. Do we influence [behavioural] change?
5. Knowledge, attitude, skill and / or aspirations changes
5. What do people learn? Do we address their needs?
4. Reactions4. Are clients satisfied? How do people learn about
us?
3. Engagement / involvement 3. Who do we reach? Who uses / participates?
2. Activities and outputs 2. What do we offer? How do we deliver?
1. Inputs 1. How much does our program cost? ($, HR etc)
Program (Results) Chain of Events(Theory of Action) Key Questions
Source: Adapted from Claude Bennett 1979. Taken from Michael Quinn Patton, Utilization-Focused Evaluation: The New Century Text, Thousand Oaks, California, 1997, p 235.
Indirect Influence
Direct Influence
Control
WHY?
WHAT?
WHO?
HOW?
[email protected] www.pmn.net 25

A Needs-Results Hierarchy Approach
[email protected] from Claude Bennett, TOP Guidelines
The Needs- Results
hierarchy sets results
in the context of a
given situation and
set of needs.
Situation / Needs AssessmentSituation / Needs Assessment Results Chain Results Chain
www.pmn.net 26
ConditionsConditions
PracticesPractices
CapacityCapacity
Support Support Climate Climate Support Support Climate Climate / Awareness // Awareness /
ReactionReaction
EngagementEngagement
ActivitiesActivities
ResourcesResources
ActivitiesActivities
EngagementEngagement
Support Climate Support Climate Support Climate Support Climate / Awareness // Awareness /
ReactionReaction
CapacityCapacity
Action / Action / AdoptionAdoption
End OutcomesEnd Outcomes
ResourcesResources
Situation/ Needs AssessmentSituation/ Needs AssessmentResults ChainResults Chain
CapacityCapacity
ConditionsConditions
ActivitiesActivities
PracticesPractices
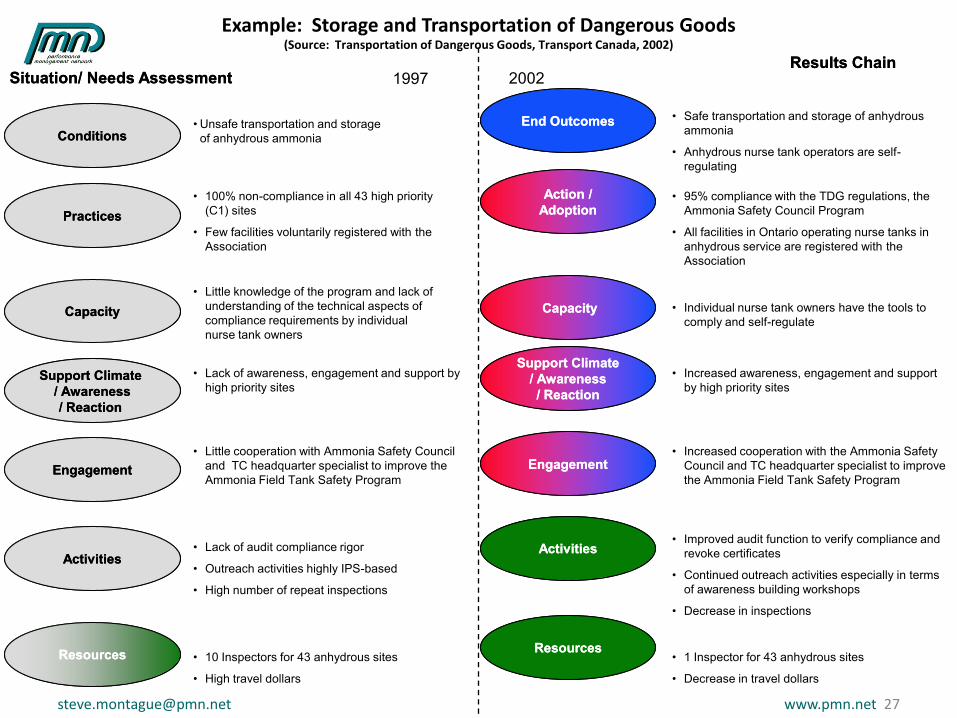
• Unsafe transportation and storage
of anhydrous ammonia
• 100% non-compliance in all 43 high priority
(C1) sites
• Few facilities voluntarily registered with the
Association
• Little cooperation with Ammonia Safety Council
and TC headquarter specialist to improve the
Ammonia Field Tank Safety Program
• Lack of audit compliance rigor
• Outreach activities highly IPS-based
• High number of repeat inspections
• Safe transportation and storage of anhydrous
ammonia
• Anhydrous nurse tank operators are self-
regulating
• 95% compliance with the TDG regulations, the
Ammonia Safety Council Program
• All facilities in Ontario operating nurse tanks in
anhydrous service are registered with the
Association
• Increased awareness, engagement and support
by high priority sites
• Increased cooperation with the Ammonia Safety
Council and TC headquarter specialist to improve
the Ammonia Field Tank Safety Program
• Improved audit function to verify compliance and
revoke certificates
• Continued outreach activities especially in terms
of awareness building workshops
• Decrease in inspections
• Individual nurse tank owners have the tools to
comply and self-regulate
• Little knowledge of the program and lack of
understanding of the technical aspects of
compliance requirements by individual
nurse tank owners
• Lack of awareness, engagement and support by
high priority sites
• 10 Inspectors for 43 anhydrous sites
• High travel dollars
• 1 Inspector for 43 anhydrous sites
• Decrease in travel dollars
1997 2002
Example: Storage and Transportation of Dangerous Goods(Source: Transportation of Dangerous Goods, Transport Canada, 2002)
www.pmn.net 27
Support Climate Support Climate Support Climate Support Climate
/ Awareness/ Awareness
/ Reaction / Reaction
EngagementEngagement
ResourcesResources
ActivitiesActivities
EngagementEngagement
Support Climate Support Climate Support Climate Support Climate
/ Awareness / Awareness
/ Reaction/ Reaction
CapacityCapacity
Action / Action /
AdoptionAdoption
End OutcomesEnd Outcomes

A Case Study in [lack of] Complex Systems Thinking / Problem Solving – The Walkerton Water Situation
Ontario
Government
(MOE)
Politicians
Private Testing
Labs
Public Utilities
Commission
Local Medical
Officer
Brockton –
Walkerton
Other Institutions:
e.g., Health Canada,
CFIA, AAFC
Public (lack of) awareness,
knowledge, and preventative
action
“Factory” farming
– antibiotics
– fecal waste
Aging water
infrastructure
Weather climate
change
– floodingEconomic
pressure on
agriculture
S&T
developments in
farming
Financial pressure
on public
infrastructure
Environment Minister announces
regulatory changes:
1- Mandatory lab accreditation
2- Mandatory to inform MOE of
lab testing changes
3- Review of testing certificates
4- Reinforce current notification
procedures
May 29 / 00
“I didn’t say we’re responsible, I
didn’t say we’re not responsible.”
Premier Mike Harris, Globe and
Mail, May 30 / 00
“Our role is only to test the water,
not to fix the problems.”
Palmateer and Patterson, Globe
and Mail, May 29 / 00
“We thought this was a disaster
waiting to happen for the last four
years.”
Dr. Murray McQuigge, Yahoo
news, May 30 / 00
E-coli:
contaminated
water leading to
health crisis
Source: Montague, Steve, A Regulatory Challenge Conference, 2000
A two year inquiry held two town officials almost completely to blame.
Deeper systems surrounding the situation were not extensively reviewed.
www.pmn.net 28

A Needs-Results Hierarchy Approach – Walkerton
Situation / Needs AssessmentSituation / Needs Assessment Results Chain Results Chain
- Weather factors
- Economic Pressures
- S&T developments re: farming
- Farmers „factory farming‟ animals, routine
feeding of antibiotics, manure spreading
- Poor „stewardship‟ practices over rural
water supplies (from gaps in testing to
fraudulent behaviour)
- Poor knowledge, understanding and
waters stewardship commitment
- Prescribed testing, lack of harmonized,
multi-government support, burden
imposed on water managers
- Lack of broad
community engagement
in water quality issues
- Ageing infrastructure
- Gaps in Ministry funding
and in-house expertise
- Traditional, isolated services,
- Certification, inspections, testing
www.pmn.net 29
ConditionsConditions
PracticesPractices
CapacityCapacity
Support Support Climate Climate Support Support Climate Climate / Awareness // Awareness /
ReactionReaction
EngagementEngagement
ActivitiesActivities
ResourcesResources
ActivitiesActivities
EngagementEngagement
Support Climate Support Climate Support Climate Support Climate / Awareness // Awareness /
ReactionReaction
CapacityCapacity
Action / Action / AdoptionAdoption
End OutcomesEnd Outcomes

A Needs-Results Hierarchy Approach – Walkerton
Situation / Needs AssessmentSituation / Needs Assessment Results Chain Results Chain
- Weather factors
- Economic Pressures
- S&T developments re: farming
- Farmers „factory farming‟ animals, routine
feeding of antibiotics, manure spreading
- Poor „stewardship‟ practices over rural
water supplies (from gaps in testing to
fraudulent behaviour)
- Poor knowledge, understanding and
waters stewardship commitment
- Prescribed testing, lack of harmonized,
multi-government support, burden
imposed on water managers
- Lack of broad
community engagement
in water quality issues
- Ageing infrastructure
- Gaps in Ministry funding
and in-house expertise
- Traditional, isolated services,
- Certification, inspections, testing
www.pmn.net 30
- Safe,
environmentally
friendly water
supply
- Sustained stewardship
practices by all communities
•Testing
•Maintenance
•Certification
•Reporting / learning /
changing
- Demonstrated
understanding of water
supply safety issues by all
concerned
- Harmonized support of all level of
Government, Local Medical Officer,
Municipalities etc. in policy,
legislation, regulation, inspections
and info. sharing
- Awareness, engagement and
involvement of all key communities
- Consultation, collaborative development,
capacity building, monitoring, learning and
follow through
- Increase Ministry expertise in-house,
and acquire more $ resources
ConditionsConditions
PracticesPractices
CapacityCapacity
Support Support Climate Climate Support Support Climate Climate / Awareness // Awareness /
ReactionReaction
EngagementEngagement
ActivitiesActivities
ResourcesResources
ActivitiesActivities
EngagementEngagement
Support Climate Support Climate Support Climate Support Climate / Awareness // Awareness /
ReactionReaction
CapacityCapacity
Action / Action / AdoptionAdoption
End OutcomesEnd Outcomes

Needs – Questions
ConditionsConditions What need/gap is your group/policy/program trying to fill?
What is the current state of affairs?
PracticesPracticesWhat are the practices currently being employed?
How do your partners and those you are trying to reach influence the current state of affairs?
CapacityCapacity What gaps exist in your key reach groups Knowledge? Abilities? Skills? Aspirations?
Support Support Climate/ Climate/ Support Support Climate/ Climate/
AwarenessAwareness
/Reaction/Reaction
What is the current state of the support climate? What gaps exist in terms of support climate? (i.e., Are there gaps in legal
rules, current international, federal, provincial, regional (governmental or non-governmental) institutional policies, etc...?)
What is the level of awareness and reaction?
EngagementEngagement Are there problems or gaps in the participation/engagement of groups which are key to achieving your objectives?
Activities/OutputsActivities/OutputsAre there activities or outputs which represent barriers or gaps to achieving your objectives? (e.g., inappropriate delivery
practices, incomplete or inappropriate assessment criteria, gaps in communications, etc).
ResourcesResources What level of financial, human, and “technical” resources are currently at your disposal? Are there gaps?
www.pmn.net 31

Results – Questions
What is the ultimate state that your group is contributing towards?
What is your vision of a “perfect world”, as it relates to your area of work?
What are the practices that are required to reach this ultimate goal?
How would your partners and those you are trying to reach act in a “perfect world”?
What knowledge, aspirations, skills, and abilities would your partners / intermediaries + target
groups have in a “perfect world”?
What partner / intermediary support do you need to achieve / address your goals?
What kind of a support climate would you need to achieve / address your goals?
What is the level of awareness and reaction needed to achieve / address your goals?
Whose participation/engagement do you need to address the identified gaps?
What tasks need to be done by your group in order to address this issue?
What outputs should be produced by your group?
What resources are required to accomplish your activities?
www.pmn.net 32
ResourcesResources
ActivitiesActivities
EngagementEngagement
Support Climate Support Climate Support Climate Support Climate
/ Awareness / Awareness
/ Reaction/ Reaction
CapacityCapacity
Action / Action /
AdoptionAdoption
End OutcomesEnd Outcomes

A Related Sequence of Needs / Problems
A related sequence of problems:
Summary: Thousands of members of Community Y put themselves at risk of skin cancer due to excessive exposure to the sun’s UV rays. This can be shown as a sequence of issues as follows:
The incidence of sun-related cancers is rising in Community Y.
Community Y shows self-assessed ratings of sun-safe precautions (e.g. clothing, sunscreen etc.) for given UV exposures which are lower than the national average.
Community Y does not currently have a shade policy for public spaces.
Market research data shows that X% of Community Y members are unaware of what appropriate precautions to take at ‘high’ or ‘medium’ levels of UV exposure.
[email protected] www.pmn.net 33
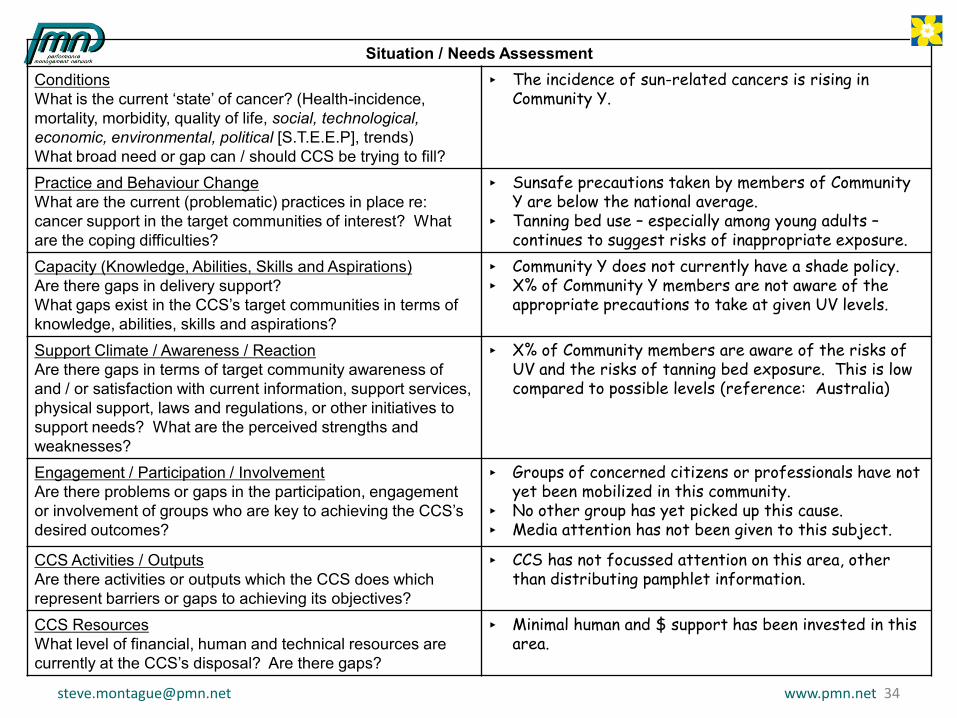
Situation / Needs Assessment
Conditions
What is the current „state‟ of cancer? (Health-incidence,
mortality, morbidity, quality of life, social, technological,
economic, environmental, political [S.T.E.E.P], trends)
What broad need or gap can / should CCS be trying to fill?
The incidence of sun-related cancers is rising in Community Y.
Practice and Behaviour Change
What are the current (problematic) practices in place re:
cancer support in the target communities of interest? What
are the coping difficulties?
Sunsafe precautions taken by members of Community Y are below the national average.
Tanning bed use – especially among young adults –continues to suggest risks of inappropriate exposure.
Capacity (Knowledge, Abilities, Skills and Aspirations)
Are there gaps in delivery support?
What gaps exist in the CCS‟s target communities in terms of
knowledge, abilities, skills and aspirations?
Community Y does not currently have a shade policy. X% of Community Y members are not aware of the
appropriate precautions to take at given UV levels.
Support Climate / Awareness / Reaction
Are there gaps in terms of target community awareness of
and / or satisfaction with current information, support services,
physical support, laws and regulations, or other initiatives to
support needs? What are the perceived strengths and
weaknesses?
X% of Community members are aware of the risks of UV and the risks of tanning bed exposure. This is low compared to possible levels (reference: Australia)
Engagement / Participation / Involvement
Are there problems or gaps in the participation, engagement
or involvement of groups who are key to achieving the CCS‟s
desired outcomes?
Groups of concerned citizens or professionals have not yet been mobilized in this community.
No other group has yet picked up this cause. Media attention has not been given to this subject.
CCS Activities / Outputs
Are there activities or outputs which the CCS does which
represent barriers or gaps to achieving its objectives?
CCS has not focussed attention on this area, other than distributing pamphlet information.
CCS Resources
What level of financial, human and technical resources are
currently at the CCS‟s disposal? Are there gaps?
Minimal human and $ support has been invested in this area.
[email protected] www.pmn.net 34

Example Needs-Results Chart – Sun Safety
Move from Needs to Results – Sun Safe*
Needs / Situation Desired Results
Conditions
• Increasing incidence of sun related cancer
End Result (WHY)
• Reduced rate of sun related cancer
Practice and Behaviour Change Problematic level of unsafe sun and tanning behaviours
Practice and Behaviour Change (WHO & WHAT)• Improved / increased ‘Sunsafe’ behaviours
• Reduced risky tanning practices• Shade policies implemented for public areas
Capacity (Knowledge, Abilities, Skills and Aspirations)• Key segments do not know appropriate Sunsafe precautions for
various UV levels• Lack of awareness / reactions to UV warnings
• Lack of apparent awareness of need for shade in public spaces
Capacity (Knowledge, Abilities, Skills and Aspirations)(WHO & WHAT)
• Understanding of what precautions to take at various UV levels• Improved awareness of UV levels and their implications
• Pick-up of need for shade messaging by media and various public institutions
Support Climate / Awareness / Reaction Inadequate institutional support for shade and tanning bed policies
Support Climate / Awareness / Reaction (WHO & WHAT)• Improved institutional support for shade and tanning bed
policies
Engagement / Participation / Involvement
• Lack of public / institutional / other related agency involvement in Sunsafe promotion
• Lack of opportunity for concerned group involvement
Engagement / Participation / Involvement (WHO & WHAT)• Media pick-up of Sunsafe messaging
• Involvement of physicians groups in sun safe cases
Activities
• Gap in promotional / educational activities
Activities (HOW)
• Promotional / educational activities and information / communication to key target groups
Resource Inputs
• Gaps in resources committed to area
Inputs (HOW)
• Level of people, skills, knowledge, $ applied to Sunsafe area
*Source: Canadian Cancer Society with permission
www.pmn.net 35

Results Chain
Time Periods – Usually Fiscal Years
T0 [Current Needs] T1 [Desired] T2 [Desired] T3(+) [Desired]
WHY?
7. „End‟ Result
Describe the overall trends with regard to the
CCS mission and Board Ends.
Recent cancer trends (incidence, mortality, morbidity, Q of L) including S.T.E.E.P. factors
• Observed health effects and broad system changes (incidence, mortality, morbidity, Q of L)
WHAT
BY
WHOM?
6. Practice and Behaviour Change
Describe the practices and behaviour of
individuals, groups, and partners over time.
5. Knowledge, Ability, Skill
and / or Aspiration Changes
Describe the level of knowledge, abilities,
skills and aspirations / commitment of
individuals, groups, and/or communities.
Current level of practices re: need/problem area
Current level of knowledge, ability, skills and/or aspirations re: issue area and services etc
• Observed behaviour changes, adaptation, action
• Observed or assessed learning / commitment
• Observed behaviour changes, adaptation, action
• Observed or assessed learning / commitment
4. Reactions
Describe feedback from individuals, groups,
and partners: satisfaction, interest, reported
strengths and weaknesses.
3. Engagement / Involvement
Describe the characteristics of individuals,
groups, and co-deliverers: numbers, nature of
involvement
Current awareness + satisfaction level with information, services etc.
Current level of usage / participation / involvement by key groups (including other deliverers)
• Reactions (satisfaction level)
• Level of usage / engagement / participation
• Reactions (satisfaction level)
• Level of usage / engagement / participation
• Reactions (satisfaction level)
• Level of usage / engagement / participation
HOW?
2. Activities / Outputs
Describe the activity: How will it be
implemented? What does it offer?
Current activities + outputs (type and level)
• # Outputs• Milestones Achieved
• # Outputs• Milestones Achieved
• # Outputs• Milestones
Achieved
1. Inputs / Resources
Resources used: dollars spent, number and
types of staff involved, dedicated time.
Current and historical$ and HR spentNeeds re: CCS capacity
• $ and HR spent• Improvements to CCS
capacity
• $ and HR spent• Improvements to CCS
capacity
• $ and HR spent• Improvements to
CCS capacity
$
Results Plan
[email protected] www.pmn.net 36

AREA OF CCS MISSION / OBJECTIVES: Reduce incidence and mortality from cancers associated with U.V. exposure
Results ChainNeeds-Results Plan Worksheet
T0 [Current Needs] T1 [Desired] T2 [Desired] T3(+) [Desired]
WHY?
7. „End‟ Result
Describe the overall trends with regard to the
CCS mission and Board Ends.
• Increasing incidence of sun related cancer • Reduced rate of sun
related cancer
WHAT
BY
WHOM?
6. Practice and Behaviour Change
Describe the practices and behaviour of
individuals, groups, and partners over time.
5. Knowledge, Ability, Skill
and / or Aspiration Changes
Describe the level of knowledge, abilities, skills
and aspirations / commitment of individuals,
groups, and/or communities.
• Problematic level of unsafe sun and tanning behaviours
• Key Segments do not know appropriate sunsafe precautions for various UV levels
4. Reactions
Describe feedback from individuals, groups,
and partners: satisfaction, interest, reported
strengths and weaknesses.
3. Engagement / Involvement
Describe the characteristics of individuals,
groups, and co-deliverers: numbers, nature of
involvement
• Lack of awareness / reactions to UV warnings
• Lack of apparent awareness of need for shade in public spaces
• Lack of public / institutional / other related agency involvement in sunsafe promotion
• Lack of opportunity for concerned group involvement
• Improved awareness of UV levels and their implications
• Pick-up of need for shade messaging by media and various public institutions
• Media pick-up of sunsafe messaging
• Involvement of physicians groups in sunsafe cause
HOW?
2. Activities / Outputs
Describe the activity: How will it be
implemented? What does it offer?
• Gap in promotional / educational activities
• Promotional / educational activities and information / communication to key target groups
1. Inputs / Resources
Resources used: dollars spent, number and
types of staff involved, dedicated time.
• Gaps in resources committed to area
• Level of people, skills, knowledge, $ applied to sunsafe area
$
Sunsafe Example
[email protected] www.pmn.net 37

AREA OF CCS MISSION / OBJECTIVES: Reduce incidence and mortality from cancers associated with U.V. exposure
Results ChainNeeds-Results Plan Worksheet
T0 [Current Needs] T1 [Desired] T2 [Desired] T3(+) [Desired]
WHY?
7. „End‟ Result
Describe the overall trends with regard to the
CCS mission and Board Ends.
• Increasing incidence of sun related cancer • Reduced rate of sun
related cancer
WHAT
BY
WHOM?
6. Practice and Behaviour Change
Describe the practices and behaviour of
individuals, groups, and partners over time.
5. Knowledge, Ability, Skill
and / or Aspiration Changes
Describe the level of knowledge, abilities, skills
and aspirations / commitment of individuals,
groups, and/or communities.
• Problematic level of unsafe sun and tanning behaviours
• Key Segments do not know appropriate sunsafe precautions for various UV levels
• Improved / increased ‘sunsafe’ behaviours
• Reduced risky tanning practices
• Shade policies implemented for public areas
• Understanding of what precautions to take at various UV levels
4. Reactions
Describe feedback from individuals, groups,
and partners: satisfaction, interest, reported
strengths and weaknesses.
3. Engagement / Involvement
Describe the characteristics of individuals,
groups, and co-deliverers: numbers, nature of
involvement
• Lack of awareness / reactions to UV warnings
• Lack of apparent awareness of need for shade in public spaces
• Lack of public / institutional / other related agency involvement in sunsafe promotion
• Lack of opportunity for concerned group involvement
• Improved awareness of UV levels and their implications
• Pick-up of need for shade messaging by media and various public institutions
• Media pick-up of sunsafe messaging
• Involvement of physicians groups in sunsafe cause
• Improved awareness of UV levels and their implications
• Pick-up of need for shade messaging by media and various public institutions
• Media pick-up of sunsafe messaging
• Involvement of physicians groups in sunsafe cause
HOW?
2. Activities / Outputs
Describe the activity: How will it be
implemented? What does it offer?
• Gap in promotional / educational activities
• Promotional / educational activities and information / communication to key target groups
• Promotional / educational activities and information / communication to key target groups
1. Inputs / Resources
Resources used: dollars spent, number and
types of staff involved, dedicated time.
• Gaps in resources committed to area
• Level of people, skills, knowledge, $ applied to sunsafe area
• Level of people, skills, knowledge, $ applied to sunsafe area
$
Sunsafe Example
[email protected] www.pmn.net 38

AREA OF CCS MISSION / OBJECTIVES: Reduce incidence and mortality from cancers associated with U.V. exposure
Results ChainNeeds-Results Plan Worksheet
T0 [Current Needs] T1 [Desired] T2 [Desired] T3(+) [Desired]
WHY?
7. „End‟ Result
Describe the overall trends with regard to the
CCS mission and Board Ends.
• Increasing incidence of sun related cancer • Reduced rate of sun
related cancer
WHAT
BY
WHOM?
6. Practice and Behaviour Change
Describe the practices and behaviour of
individuals, groups, and partners over time.
5. Knowledge, Ability, Skill
and / or Aspiration Changes
Describe the level of knowledge, abilities, skills
and aspirations / commitment of individuals,
groups, and/or communities.
• Problematic level of unsafe sun and tanning behaviours
• Key Segments do not know appropriate sunsafe precautions for various UV levels
• Improved / increased ‘sunsafe’ behaviours
• Reduced risky tanning practices
• Shade policies implemented for public areas
• Understanding of what precautions to take at various UV levels
• Improved / increased ‘sunsafe’ behaviours
• Reduced risky tanning practices
• Shade policies implemented for public areas
• Understanding of what precautions to take at various UV levels
4. Reactions
Describe feedback from individuals, groups,
and partners: satisfaction, interest, reported
strengths and weaknesses.
3. Engagement / Involvement
Describe the characteristics of individuals,
groups, and co-deliverers: numbers, nature of
involvement
• Lack of awareness / reactions to UV warnings
• Lack of apparent awareness of need for shade in public spaces
• Lack of public / institutional / other related agency involvement in sunsafe promotion
• Lack of opportunity for concerned group involvement
• Improved awareness of UV levels and their implications
• Pick-up of need for shade messaging by media and various public institutions
• Media pick-up of sunsafe messaging
• Involvement of physicians groups in sunsafe cause
• Improved awareness of UV levels and their implications
• Pick-up of need for shade messaging by media and various public institutions
• Media pick-up of sunsafe messaging
• Involvement of physicians groups in sunsafe cause
• Improved awareness of UV levels and their implications
• Pick-up of need for shade messaging by media and various public institutions
• Media pick-up of sunsafe messaging
• Involvement of physicians groups in sunsafe cause
HOW?
2. Activities / Outputs
Describe the activity: How will it be
implemented? What does it offer?
• Gap in promotional / educational activities
• Promotional / educational activities and information / communication to key target groups
• Promotional / educational activities and information / communication to key target groups
• Promotional / educational activities and information / communication to key target groups
1. Inputs / Resources
Resources used: dollars spent, number and
types of staff involved, dedicated time.
• Gaps in resources committed to area
• Level of people, skills, knowledge, $ applied to sunsafe area
• Level of people, skills, knowledge, $ applied to sunsafe area
• Level of people, skills, knowledge, $ applied to sunsafe area
$
Sunsafe Example
[email protected] www.pmn.net 39
Small Group Exercise
• Look at a regulatory case
• Suggest some situational needs / risks
• Then consider some results
[email protected] www.pmn.net 40

Needs / Situation Desired Results
Conditions End Result (WHY)
Practice and Behaviour Change Practice and Behaviour Change (WHO & WHAT)
Capacity (Knowledge, Abilities, Skills and Aspirations) Capacity (Knowledge, Abilities, Skills and Aspirations) (WHO & WHAT)
Support Climate / Awareness / Reaction Support Climate / Awareness / Reaction (WHO & WHAT)
Engagement / Participation / Involvement Engagement / Participation / Involvement (WHO & WHAT)
Activities Activities (HOW)
Resource Inputs Inputs (HOW)
Needs-Results Chart
www.pmn.net 41

[email protected] www.pmn.net 42
Logic Model
ComponentAsk yourself about the problem Examples Ask yourself about the result you want Examples
Ultimate/End
Outcomes
Societal/ Cultural
Situation
• What is the social or cultural problem?
• What is the risk to public health, the
environment, public safety, the
economy, etc.?
• What is the severity of the risk?
Rate of health incidents,
hectares of land contaminated,
rate of injuries/ deaths caused
by airplanes
• When will the problem/ risk no longer be
an issue?
• What will the problem/ risk look like when
it is no longer an issue?
• How does the program line-up with the
department‟s Strategic Objectives?
Reduced rate of health
incidents, hectares of land
remediated, reduced rate of
injuries/ deaths caused by
airplanes
Intermediate
Outcomes
Stakeholder
Behaviour
• How do stakeholder behaviours
influence the social/ cultural situation?
• What behaviours are having a negative
impact on the social/cultural situation?
Industry is not adhering to
voluntary guidelines
Canadians are putting toxic
cleaning products down the
drain
• What behaviours would you like to see
change?
• How do the behaviours need to change?
Industry compliance with new
regulations
Reduction in % of Canadians
putting toxic cleaning products
down the drain
Immediate
Outcomes
Stakeholder
Knowledge
• What gaps exist in your target
population‟s knowledge? Abilities?
Skills? Aspirations?
Poor industry awareness and
acceptance of standards
Poor Canadian knowledge of
risks
• How do we expect our target audience(s)
to react immediately to the deliverables?
• How will the target audience‟s knowledge,
abilities, skills, and/or aspirations change?
Industry awareness and
understanding of new
regulations
Canadian awareness and
acceptance of risks and need for
new rules
Reach
Stakeholder
Participation
• Are there gaps in the participation or
engagement of groups which are critical
to achieving your objective?
Low industry participation
Low engagement from
Canadians
• Who is this initiative intended to reach or
who will be affected?
• Whose behaviour needs to change?
(group/population)
• How will the participation or engagement
of important groups change as a result of
your program?
Increase in participation and
engagement from: Canadians,
industry, stakeholders, other
governments/ jurisdictions
Outputs
Programs/ supports
in place for
Addressing the
Problem
• Are there gaps in the current suite of
supports/ programs/ services in place to
address the problem or risk?
Industry is under no legal
obligation to comply with the
voluntary standards currently in
place
Information bulletins to advise
Canadians about certain risks
are not resulting in a significant
enough change in the number
of incidents
• What product or service will we deliver in
order to fill the gaps?
Regulations, inspection reports,
information campaigns
Activities
Internal practices
• Are there problems with the current
delivery practices?
• Are there programs or services being
offered in other jurisdictions that are
demonstrating better results than our
programs or services?
Inefficient delivery practices,
incomplete assessment of
criteria, gaps in communication
• What will we do?
• What actions or work will be done?
• What services will be delivered?
Conduct research, publish
documents, provide advice, draft
regulations, conduct
inspections, provide information
to the public (possibly with a
focus on particular target
groups)
Inputs
Internal resources
• Are there gaps in the financial, human,
or technical resources available?
• Is data availability a problem?
Lack of resources, lack of data/
information
• What resources do we have for this
regulatory initiative?
• What additional information would you like
to know to improve delivery?
Staff, funding, better access to
information
(Source: 2009 TBS PMEP handbook pgs 20-21)

Logic Model
ComponentAsk yourself about the problem Current Ask yourself about the result you want
Ultimate/End
Outcomes
Societal/
Cultural
Situation
• What is the social or cultural
problem?
• What is the risk to public health,
the environment, public safety, the
economy, etc.?
• What is the severity of the risk?
• When will the problem/ risk no longer be an issue?
• What will the problem/ risk look like when it is no longer an
issue?
• How does the program line-up with the department‟s
Strategic Objectives?
Intermediate
Outcomes
Stakeholder
Behaviour
• How do stakeholder behaviours
influence the social/ cultural
situation?
• What behaviours are having a
negative impact on the
social/cultural situation?
• What behaviours would you like to see change?
• How do the behaviours need to change?
Immediate
Outcomes
Stakeholder
Knowledge
• What gaps exist in your target
population‟s knowledge? Abilities?
Skills? Aspirations?
• How do we expect our target audience(s) to react
immediately to the deliverables?
• How will the target audience‟s knowledge, abilities, skills,
and/or aspirations change?
Reach
Stakeholder
Participation
• Are there gaps in the participation
or engagement of groups which
are critical to achieving your
objective?
• Who is this initiative intended to reach or who will be
affected?
• Whose behaviour needs to change? (group/population)
• How will the participation or engagement of important
groups change as a result of your program?
Outputs
Programs/
supports in
place for
Addressing the
Problem
• Are there gaps in the current suite
of supports/ programs/ services in
place to address the problem or
risk?
• What product or service will we deliver in order to fill the
gaps?
Activities
Internal
practices
• Are there problems with the current
delivery practices?
• Are there programs or services
being offered in other jurisdictions
that are demonstrating better
results than our programs or
services?
• What will we do?
• What actions or work will be done?
• What services will be delivered?
Inputs
Internal
resources
• Are there gaps in the financial,
human, or technical resources
available?
• Is data availability a problem?
• What resources do we have for this regulatory initiative?
• What additional information would you like to know to
improve delivery?
[email protected] www.pmn.net 43

Consider your Case
• Can you expand your needs-results hierarchy into a results plan?
• Form work teams
• Use post-it notes to develop a 3 year (+?) results plan using the placemat
[email protected] www.pmn.net 44

Results Chain
Needs-Results Plan Worksheet
T0 [Current Situation/Needs] T1 [Desired] T2 [Desired] T3(+) [Desired]
WHY?
7. ‘End’ Result
Describe the overall trends with regard
to the mission.
WHAT
BY
WHOM?
6. Practice and Behaviour Change
Describe the practices and behaviour of
individuals, groups, and partners over
time.
5. Knowledge, Ability, Skill
and / or Aspiration Changes
Describe the level of knowledge, abilities,
skills and aspirations / commitment of
individuals, groups, and / or communities.
4. Reactions
Describe feedback from individuals,
groups, and partners: satisfaction,
interest, reported strengths and
weaknesses.
3. Engagement / Involvement
Describe the characteristics of individuals,
groups, and co-deliverers: numbers,
nature of involvement
HOW?
2. Activities / Outputs
Describe the activity: How will it be
implemented? What does it offer?
1. Inputs / Resources
Resources used: dollars spent, number
and types of staff involved, dedicated
time.
$
[email protected] www.pmn.net 45

Measurement Implications
1. Think of it as ‘progress’ measurement, rather than performance measurement.
2. Multiple stages = Multiple metrics over time.
3. Focus on concrete human behaviours.
4. Indicators directly relate to Needs-Results statements.
[email protected] www.pmn.net 46

Sun Safety – from Results to Measures
Desired Results Measures
End Result (WHY)
• Reduced rate of sun related cancer Level of UV related melanoma (and non-melanoma)
Practice and Behaviour Change (WHO & WHAT)• Improved / increased ‘Sunsafe’ behaviours
• Reduced risky tanning practices• Shade policies implemented for public areas
% of adults applying sun-screen (and other precautionary measures)
Capacity (Knowledge, Abilities, Skills and Aspirations)(WHO & WHAT)
• Understanding of what precautions to take at various UV levels• Improved awareness of UV levels and their implications
• Pick-up of need for shade messaging by media and various public institutions
% of public knowing safety precautions at various UV levels
Support Climate / Awareness / Reaction (WHO & WHAT)• Improved institutional support for shade and tanning bed policies
Shade policy passed, legislation and / or regulations / instruments passed (and monitored / enforced)
Engagement / Participation / Involvement (WHO & WHAT)• Media pick-up of Sunsafe messaging
• Involvement of physicians groups in sun safe cases
Level of media pick-up (# stories, space, reflection of message)
Demonstrated support from Physicians groups
Activities (HOW)
• Promotional / educational activities and information / communication to key target groups
# of activities conducted, milestones and deliverables met
Inputs (HOW)
• Level of people, skills, knowledge, $ applied to Sunsafe area Level of $ and FTE’s invested
*Source: Canadian Cancer Society with permission
www.pmn.net 47

From Results to Measures
Desired Results Measures
End Result (WHY)
Practice and Behaviour Change (WHO & WHAT)
Capacity (Knowledge, Abilities, Skills and Aspirations)(WHO & WHAT)
Support Climate / Awareness / Reaction (WHO & WHAT)
Engagement / Participation / Involvement (WHO & WHAT)
Activities (HOW)
Inputs (HOW)
www.pmn.net 48

Small Group Work – Progress Indicators
• Consider your case
• What would you see or hear if this is working?
[email protected] www.pmn.net 49

What About Risk?
• Can risk ‘map’ onto the results plan?
• Can ‘outside-in’ (outcome oriented) thinking help risk management?
[email protected] www.pmn.net 50

[email protected] www.pmn.net 51
Results – Risks – Mitigation / Contingency Plans and Responsibilities
Desired Results
Particular Concerns /
Risks and Impacts
(Damages & Liabilities, Operational
Effects, Reputation loss)
Existing
Mitigation*
Measures
Risk Level
Incremental
Mitigation*
Measures
Responsible
Party
* Note that mitigation strategies become contingency plans when risks are beyond the sphere of direct influence.

Conclusion
• Risk management – regulatory initiative story is different from conventional (G+C and service) story lines
• Agencies engage intermediaries in key systems to achieve behaviour change / adoption / compliance goals
• Regulatory stories can be told moving from problem space to solution space
[email protected] www.pmn.net 52