television shopping: the effect of persuasive strategies
TRANSCRIPT

Retrospective Theses and Dissertations Iowa State University Capstones, Theses andDissertations
2008
Television shopping: the effect of persuasivestrategies on parasocial interaction, subjective well-being, and impulse buying tendency among olderwomenMin-Sun LeeIowa State University
Follow this and additional works at: https://lib.dr.iastate.edu/rtd
Part of the Gerontology Commons, and the Marketing Commons
This Thesis is brought to you for free and open access by the Iowa State University Capstones, Theses and Dissertations at Iowa State University DigitalRepository. It has been accepted for inclusion in Retrospective Theses and Dissertations by an authorized administrator of Iowa State University DigitalRepository. For more information, please contact [email protected].
Recommended CitationLee, Min-Sun, "Television shopping: the effect of persuasive strategies on parasocial interaction, subjective well-being, and impulsebuying tendency among older women" (2008). Retrospective Theses and Dissertations. 15331.https://lib.dr.iastate.edu/rtd/15331

Television shopping: the effect of persuasive strategies on parasocial interaction, subjective well-being, and impulse buying tendency among older women
By
Min-Sun Lee
A thesis submitted to the graduate faculty
In partial fulfillment of the requirement for the degree of
MASTER of SCIENCE
Major: Textiles and Clothing
Program of Study Committee: Ann Marie Fiore, Major Professor
Mary Lynn Damhorst Mack Shelley
Iowa State University
Ames, Iowa
2008
Copyright © Min-Sun Lee, 2008. All rights reserved.

UMI Number: 1453147
14531472008
Copyright 2008 byLee, Min-Sun
UMI MicroformCopyright
All rights reserved. This microform edition is protected against unauthorized copying under Title 17, United States Code.
ProQuest Information and Learning Company 300 North Zeeb Road
P.O. Box 1346 Ann Arbor, MI 48106-1346
All rights reserved.
by ProQuest Information and Learning Company.

ii
TABLE OF CONTENTS
LIST OF FIGURES ............................................................................................................... iii LIST OF TABLES ................................................................................................................. iv LIST OF TERMS..................................................................................................................... v ABSTRACT........................................................................................................................... vii CHAPTER 1: INTRODUCTION............................................................................................ 1 CHAPTER 2: REVIEW OF LITERATURE........................................................................... 6 CHAPTER 3: METHOD ....................................................................................................... 31 CHAPTER 4: RESULTS....................................................................................................... 39 CHAPTER 5: DISCUSSION AND IMPLICATIONS .......................................................... 65 APPENDIX A: IRB APPROVAL......................................................................................... 72 APPENDIX B: COVER SHEET........................................................................................... 74 APPENDIX C: THE MAIN PRETEST QUESTIONNAIRE ............................................... 77 APPENDIX D: INVITATION FLYER................................................................................. 86 REFERENCES ...................................................................................................................... 88

iii
LIST OF FIGURES
Figure 1.1. A conceptual framework of relationship between personal selling approach,
parasocial interaction, perceived social involvement, perceived loneliness, perceived risk, and impulse buying in the television shopping environment ......30
Figure 4.1. A final empirical model showing the effects of persuasive strategies on
parasocial interactions, social involvement, loneliness, positive mood, social risk, and impulse buying ..............................................................................................57

iv
LIST OF TABLES
Table 4.1. Sample characteristics............................................................................................40 Table 4.2. Factor analysis results for the persuasive strategies variable.................................44 Table 4.3. Factor analysis results for perceived parasocial interaction ..................................45 Table 4.4. Factor analysis results for perceived social involvement ......................................46 Table 4.5. Factor analysis results for perceived loneliness.....................................................48 Table 4.6. Factor analysis results for mood ............................................................................59 Table 4.7. Factor analysis results for perceived risk...............................................................50 Table 4.8. Factor analysis results for perceived impulse buying ............................................52 Table 4.9. Correlations among research variables ..................................................................53 Table 4.10. Path estimates for the theoretical model and the fully recursive model ..............56 Table 4.11. Decomposition of direct, indirect, and total effects for the empirical model .......63

v
LIST OF TERMS
The followings are definitions of the major concepts investigated in this study.
Impulse Buying: An unplanned or spontaneous purchase (Rook, 1987)
Loneliness: The unpleasant experience related to the unmet need for human intimacy
(Weiss, 1973).
Mood: Subjective feeling state (positive or negative state) induced by pleasant or
unpleasant experiences (Clark & Isen, 1982).
Parasocial Interaction: A viewer’s perceived relationship with a media personality
(Papa, Singhal, Law, Pant, Sood, Rogers, & Shefner-Rogers, 2000).
Perceived Risk: The extent to which an individual senses the uncertainty in
contemplating a particular purchase decision (Cox & Rich, 1964).
Personal Selling Approach: The promotional strategy the salesperson uses to
persuade a customer to buy products through the direct interaction and
communication of information (Jaramillo & Marshall, 2004).
Persuasive Strategy: One of the personal selling approaches using symbolic
transactions (messages) to appeal to the emotions of the individual and to modify the
individuals’ attitude or behavior (Dillard & Pfau, 2002). Six persuasive strategies
are:
1) Reciprocation: The social rule that people are likely to repay others (Cialdini,
1984).
2) Consistency: People are likely to make choices consistent with their other
decisions (Cialdini, 1993).

vi
3) Social proof: People are willing to comply with a request for behavior that is
similar to behaviors performed by others (Cialdini, 1984).
4) Liking: People are willing to comply with the requests of friends or others they
like (Cialdini, 1984).
5) Authority: People are willing to follow the suggestions of an individual with
legitimate authority (Cialdini, 1984).
6) Scarcity: A general norm that what is less available is perceived to be more
valuable (Cialdini, 1984).
Social Involvement: The extent to which an individual has a relationship with other
people within a society (Weiss, 1998).
Subjective Well-Being: An individual’s cognitive and affective perception about the
quality of his/her life (Diener, 2000).

vii
ABSTRACT
The purpose of this study is to investigate the effects of persuasive strategies on
perceived parasocial interactions between the host and viewers in the television home
shopping environment. The effects of perceived parasocial interactions, perceived social
involvement, and perceived loneliness on mood, and mood’s consequent influence on
perceived risk and impulse buying tendency are examined. A questionnaire assessed
perceived use of persuasive strategies, parasocial interaction with the host, social
involvement, loneliness, mood, risk, and impulse buying. Through two different sampling
methods, 109 usable responses from female television home shopping shoppers aged 55 to 80
were retained for data analyses. Analysis of Moment Structures (AMOS) version 7.0 was
used to derive the maximum-likelihood estimation for analysis of the model. In this study,
three models were tested—the theoretical model, the fully recursive model, and the empirical
model. The fully recursive model was run after the theoretical model resulted in marginal fit.
The effect of level of persuasive strategies on parasocial interaction was not significant.
However, the results indicated that parasocial interaction between hosts and viewers
significantly influence older middle-aging and elderly consumers’ subjective well-being.
Discussions of the results, practical implications, and limitations are also described.

1
CHAPTER 1: INTRODUCTION
Background
Introduced in the early 1980s, television shopping has shown remarkable growth
during the past few years. Television shopping has reached a mature stage in terms of
market size and sales volume. Two dominant television shopping channels, Quality Value
Convenience (QVC) and Home Shopping Network (HSN), lead the t-commerce market
(Economist, 1996). QVC and HSN generated more than $5.7 and $2.4 billion sales in 2004,
respectively (“QVC Corporate Facts,” 2006; “HSN Company Information,” 2006). QVC
launched in 1986 and generated $112 million in its first full fiscal year (“QVC corporate
Facts,” 2008). HSN reported annual sales of approximately $53.4 million in 1986, up from
$4.9 million in 1985 (Parker, 2007). Recently, QVC introduced 250 new products weekly to
viewers in approximately 87 million homes across the United States and attracted over 153.4
million cable and satellite homes worldwide (“QVC Business Overview,”; “QVC
International Business,” 2006). Similarly, HSN reached more than 85 million U.S.
households (“HSN Company Information,” 2006). In 2004, HSN responded to 66 million
calls and delivered 50 million product packages worldwide (“HSN Company Information,”
2006).
During television shopping programs, the host plays several roles. The host leads a
one-hour program and presents the product in detail. The main role of the host is to
introduce a product to the viewers (Skumanich & Kintsfather, 1998; Stephens, Hill, &
Bergman, 1996). Typically, the host makes the viewers feel as if he/she is talking directly to
them (Skumanich & Kintsfather, 1998). In addition, the host tries to talk about some
common life issues of the viewers, such as their families, interests, and personal feelings

2
about themselves (Skumanich & Kintsfather, 1998). Through this process, the host also may
play the role of a friend. Therefore, the viewer may feel an intimacy with the host. As the
host plays the role of a friend, viewers may be able to fulfill their lack of social interaction
through television shopping. Because a need for social interaction is a basic desire of
humans, those who have limited opportunities for socialization are likely to turn to television
shopping programs to fulfill social needs and, hence, may be likely to interact with the hosts
(Rubin, Perse, & Powell, 1985).
During the show, the host uses various personal selling approaches to evoke viewers’
purchase intentions. Television shopping hosts frequently use persuasive approaches for
selling. Cialdini (1993) identifies six persuasive strategies—reciprocation, consistency,
social proof, liking, authority, and scarcity. Fritchie and Johnson (2003) examine the
presence of these persuasive strategies in television shopping programs and find that all
persuasive strategies are present and two persuasive strategies, on an average, are used by the
hosts every show.
Due to the strong population growth of the middle-aging and older population,
shopping behavior of middle-aging and older people has become a major interest to
marketers, consumer educators, and social scientists. Marketers are interested in exploring
and segmenting the middle-aging and older consumer market because it has shown a
remarkable increase in size (Michman, Mazze, & Greco, 2003) and purchase power (Shim &
Bickle, 1993). As the population size of this group increases, the potential market for apparel
expands as well.
The middle-aging and older consumer market also has some unique characteristics as
compare to other age groups (Ahern, 1996). The middle-aging and older consumers have

3
diverse needs and characteristics influenced by health, age, gender, wealth, and family
relations (Nummelin, 2005). For example, middle-aging and older women, on the average,
are likely to take more time to make decisions than middle-aging and older men and seek an
advisor when they make a decision (Kostrunek, 2005). Additionally, middle-aging and older
people who lack mobility tend to enjoy places, such as restaurants or shopping malls, with
easy access (Moschis, 1996). Thus, television shopping may be an attractive shopping venue
to middle-aging and older shoppers. Several unique benefits are offered by television
shopping programs, including ease in finding diverse clothing sizes and convenience to shop
at home. Park and Lennon (2004) surveyed people with purchase experience via television
shopping programs and found that nearly 87% of the respondents were over the age of 45.
As the individual ages body shape changes, such as thickening of the waist, enlargement of
the hips, a more protruding abdomen, and a drooping bustline (Jackson & O’Neal, 1994).
Middle-aging and older people may experience some difficulties in finding suitable sizes
because of these physical changes. Television shopping programs may fulfill these needs.
In addition, the health and mobility of elderly shoppers may influence motivation to
shop via television shopping programs. For example, driving or walking may be too difficult
for middle-aging and older consumers to shop at traditional malls or retail stores. Moreover,
related to mental health and subjective well-being, a broader concept of life satisfaction has
become a main issue in elderly life and influences shopping behavior. Elderly life is a time
when individuals search for meaning of their lives (Michman et al., 2003). Loneliness
(Weiss, 1973) and social involvement (Joung, 2002) are important contributors of subjective
well-being. Lack of social involvement may cause loneliness and, in turn, result in
depression (Russell, Cutrona, Mora, & Wallace, 1997). Thus, in the traditional shopping

4
setting, middle-aging and older shoppers place greater importance on interactions and
relationships with the salespeople when purchasing a product; whereas, younger consumers
tend to concentrate on seeking product information (Johnson-Hillery & Kang, 1997).
Because middle-aging and older people are likely to have less social involvement than
younger people (Gibson, 2000), they tend to perceive friendships with the television
shopping show host as an alternative form of social interaction. A perceived relationship
with hosts from television shopping programs can minimize loneliness, evoke positive moods,
and ultimately influence customers’ purchase tendency (Johnson-Hillery & Kang, 1997; Kim,
Kang, & Kim, 2005).
Purpose
Despite widespread awareness of the importance of a middle-aging and older
consumer market, it is surprising that very little research has been conducted on consumer
behavior for this age group. Most studies in the past have focused on younger female
consumers and ignored middle-aging and older consumers. Even though the number of
studies for middle-aging and older consumers has continued to increase, scholarly attention is
lacking in shopping behavior via multiple retail channels and several areas still remain
unexplored.
The purpose of this study is to investigate the effects of persuasive strategies on
perceived parasocial interactions between the host and viewers in the television home
shopping environment. The effects of perceived parasocial interactions, perceived social
involvement, and perceived loneliness on mood, and mood’s consequent influence on
perceived risk and impulse buying tendency are examined. This study will focus on middle-
aging and older female television home shoppers.

5
A few studies have investigated the television home shopping context related to
parasocial interaction, mood, risk, and impulse buying tendency. However, little attention
has been paid to the host’s use of personal selling approaches and the effect of parasocial
interaction on middle-aging and older consumers. Subjective well-being measures an
individual’s perception of quality of life. Related to parasocial interaction, the important
issue of subjective well-being (social involvement and loneliness) of middle-aging and older
people will also be examined in this study.

6
CHAPTER 2: REVIEW OF LITERATURE
Previous literature that pertains to consumer behavior of elderly, parasocial
interaction between television shopping show hosts and viewers, the personal selling
approach, and subjective well-being, mood, risk, and loyalty will be reviewed in Chapter 2.
A theoretical model capturing ten research hypotheses will be proposed, based on past
literature.
Middle-aging and Older Consumers
Women 65 and older are a unique group, due to their fast growing population number
and purchasing power. In the United States, a remarkable increase in the growth of the older
population has become one of the major market trends. The number of people 65 and older
was 36.3 million in 2004. This means that about one in every eight people is an older person.
By the year 2030, the older population is projected to more than double to 72.1 million (U.S.
Bureau of Census, 2004). The growth rate of the older consumer market is twice that of the
general population rate (Michman et al., 2003). Another reason for recognition of the older
consumer market lies in its purchasing power. The spending of householders aged 65 or
older grew 12 percent between 1990 and 1999, after adjusting for inflation, far surpassing the
2 percent rise in spending by the average household during the same period. Moreover, their
spending is increasing greater than they are usually expected to spend. Based on a consumer
expenditure survey, people aged 55 to 74 earned an average of $46,993 annual income and
spent $1,376 for apparel in 2003; whereas, people under 25, who presented greater interest
and purchase power in apparel, spent $1,117 for apparel in 2003. The average annual
expenditures of people aged 55 to 64 was $44,191, more than $40,817 spent by all consumer
units and $40,525 spent by people aged 25-34 (U.S. Bureau of Census, 2005).

7
In 2002, there were 33 million women aged 55 years and over (U.S. Bureau of
Census, 2003). People aged 55 and over are considered a market having much potential due
to their buying power; this particular market spent more than $20 billion on apparel each year
(Michman, Mazze, & Greco, 2003). Seventy-five percent of the nation’s wealth is currently
owned by people aged 50 and over (Kostrunek, 2005). The over fifty group is expected to
rise to 30 percent of the population by 2030 (Michman et al., 2003). Middle-aging and older
women, aged 50 and over, play an important role in managing household finances, whether
they are married or not (Hibib, Zohry, Nuwayhid, & Najdi, 2006). Therefore, the middle-
aging and older women’s market can be an important and rewarding customer group on
which to focus. This study focused on middle-aging and older women from 55 to 80.
The older consumer group has unique characteristics (Ahern, 1996). Several studies
(Hildreth & Kelly, 1984-85; Jackson, 1992; Reinecke, 1976) found a strong relationship
between changes in the life cycle and apparel expenditure. Changes in age (Reinecke, 1976),
retirement (Hildreth & Kelly, 1984-85), income, marital status, and household size influence
individual expenditure (Jackson, 1992). Reinecke (1976) showed that expenditure on apparel
decreases as people get older and the decrease in apparel expenditure is greater for men than
for women. Additionally, apparel expenditure decreases dramatically after retirement
(Hildreth & Kelly, 1984-1985). In contrast to these early findings, recent studies (Jackson,
1992) revealed that age does not significantly affect apparel expenditure. Jackson (1992)
examined the effect of age and income on apparel expenditure among the elderly (age 60 and
above) and found a positive relationship between income and apparel expenditure. Spending
for apparel increased as income increases, regardless of age.

8
Michman et al. (2003) described recent trends of elderly lifestyles. In comparison to
previous generations, the elderly today are healthier and more affluent, fashion conscious,
sophisticated, feel and act younger, exhibit greater interest in activities, and spend more
money on grandchildren. Michman et al. (2003) classified older consumers into two
groups—the mature market (age 55 to 64) and active elderly (age 65 to 74). Consumers in
the mature market are fashion conscious and tend to perceive themselves ten to fifteen years
younger than their chronological age. They also may be less price-conscious. The active
elderly market tends to use shopping trips as exercise or recreation, and usually likes to shop
with others. Most of them are retired and tend to be careful when making a purchase
decision.
Older Women and Television Shopping
Older shoppers may prefer in-home shopping over in-store shopping (Michman et al.,
2003). The methods of in-home shopping include catalogs, televisions, and the Internet.
Several studies show that older women tend to shop via television shopping programs. Park
and Lennon (2004) find that the average age of television shoppers is nearly 56 years old.
Physical and psychological factors such as body shape changes, limited mobility, and
loneliness may motivate older shoppers to watch television shopping programs (Park &
Lennon, 2004). These body shape changes (e.g., thickened waist, enlarged hips, protruding
abdomen, and drooping bustline) make it difficult for older women to find apparel that fits
well in traditional retail stores, which cater to younger markets (Kaiser & Chandler, 1984).
Older women also may experience fewer social interactions and spend more time alone
(Nordlund, 1978). During television shopping shows, viewers may feel a close relationship
with hosts, which may help alleviate loneliness caused by a lack of social involvement.

9
Stephens et al. (1996) found that television shoppers tend to feel a kind of friendship with the
host. Similarly, viewers perceive that they have a meeting with the host during television
shopping programs (Skumanich & Kintsfather,1998). Thus, it is possible that older shoppers
may view television shopping as entertainment and fun, and use television shopping to
alleviate loneliness (Park & Lennon, 2004). This indicates that home shopping programs are
used not only for apparel purchase, but also for hedonic fulfillment for older women.
Parasocial Interaction
People seek human contact and desire to achieve acceptance and affection through
interpersonal relationships (Conway & Rubin, 1991). Actual face-to-face relationships may
be substituted by parasocial interaction with media personnel. In the television setting,
parasocial interaction is defined as a viewer’s perceived relationship with a media personality
(Papa et al., 2000).
Several studies investigated parasocial interactions between viewers and media
personalities such as actors, newscasters, and show hosts (Auter & Moore, 1993; Fritchie &
Johnson, 2003; Grant, Guthrie, & Ball-Rokeach, 1991; Levy, 1979; Papa et al., 2000; Rubin
et al., 1985; Skumanich & Kintsfather, 1998; Stephens et al., 1996). During television
shopping programs, parasocial relationships can be developed between viewers and hosts.
Media personae share their opinions with the viewers and sometimes communicate with
callers’ (Fritchie & Johnson, 2003). Parasocial interaction is an important motivation for
watching home shopping programs (Auter & Moore, 1993) and may induce viewers to watch
more television shows (Conway & Rubin, 1991). Levy (1979) found that the stronger the
parasocial interaction, the more television news the viewers watch. Similarly, Rubin et al.

10
(1985) also found a positive relationship between parasocial interaction and television
reliance.
Some researchers emphasized the effect of parasocial interaction on viewers’ social
activities. Papa et al. (2000) found that parasocial interaction can facilitate behavioral
changes among media viewers. People with greater parasocial interactions were more likely
to have a conversation with other community members about the content of media programs
they watched than those who interacted less (Papa et al., 2000). People with less social
interactions may develop parasocial relationships with media personae as an alternative form
of social involvement. Levy (1979) studied the parasocial interaction between audience and
television newscasters, and found that the more social interaction opportunities an individual
has, the less likely a person will engage in a parasocial interactions with newscasters.
Parasocial Interaction and Older People
Loneliness may motive shopping (Tauber, 1972). Shopping is considered a way of
alleviating loneliness (Das, Echambadi, McCardle, & Luckett, 2003). Loneliness is often
caused by less social interactions and limited leisure activities (Nordlund, 1978). Thus,
people tend to go shopping when they feel lonely and need contact with others (Tauber,
1972). Rubin et al. (1985) found that people who feel lonely tend to interact with salespeople
more frequently than people who are not lonely. Similarly, elderly consumers, who tend to
be socially-isolated, are more likely to interact with salespeople than younger consumers
(Levy, 1979).
Personal Selling Approaches
Personal selling is defined as an interaction and communication of information
between the seller and the customer, and is often used to persuade a customer to buy products

11
or services (Jaramillo & Marshall, 2004). Personal selling becomes overwhelmingly
important for high volume goods and services in the mass market (Jaramillo & Marshall,
2004). Using persuasive strategies is one of the most fundamental promotion techniques in
social and marketing communication (Dillard & Pfau, 2002). A broad range of practitioners
such as salespeople, fund-raisers, advertisers, and politicians use persuasive strategies
(Cialdini, 1993). Dillard and Pfau (2002) defined persuasion as the process of/skill of
symbolic message transmissions in order to appeal to emotions and to modify the persons’
attitude or behavior (Dillard & Pfau, 2002). A persuasive strategy can change how people
think about and act toward other people, groups, objects, or issues. Cialdini (1993) identified
six persuasive strategies—reciprocation, consistency, social proof, liking, authority, and
scarcity.
Reciprocation
Societies contain a norm for reciprocation that pushes people to repay others (Cialdini,
1984). Cialdini (1993) explained the rule of reciprocation as “…we are obligated to the
future repayment of favors, gifts, invitations, and the like” (p. 12). Because the rule of
reciprocation is deeply embodied in every human society, people give something to another
with an expectation that it will be returned. The pressure of reciprocation is frequently used
as a marketing technique, such as a free sample (Cialdini, 1993) and gift or favor (Cialdini &
Goldstein, 2002). When salespeople give free merchandise or offer additional products,
customers tend to feel the pressure of reciprocation. So, they are likely to purchase a product
as a form of reciprocation. Usually, the return (or purchase) from the customers is worth
more for sellers than the cost of the free merchandise or additional products the customers
receive (Cialdini, 1984). Scott (1976) also found a positive effect of incentives on a purchase

12
decision for newspaper subscriptions. Incentives tended to generate a positive purchase
decision. A customer who received the newspaper as a free incentive may feel the pressure
of subscribing to the newspaper.
Consistency
Consistency means that individuals are likely to make decisions that are consistent
with their other choices (Cialdini, 1993). Individuals tend to confirm they have made a right
decision to feel better about their decision. Cialdini (1984) argued this behavior results from
a socially desirable need for a consistent image, because consistency is positively valued by
society. Consistency is often related to stability, honesty, and intellectual strength.
A variety of techniques can be used to induce consistency. For example, door-to-
door salespeople may start to ask a few questions that customers are likely to answer “yes.”
Then, the customers may have the pressure for consistency with the previous answers and
continue to say “yes” to the main final question (Cialdini, 1984). In a restaurant, if servers
ask customers about potential dessert purchases first and remind the customers of their earlier
choices after they finish dining, the customers may feel obligated to say “yes” (Cialdini &
Goldstein, 2002). In a sales situation, salespeople can ask customers the reason why they
want a product first and then explain how a product matches these criteria (Fritchie &
Johnson, 2003). This strategy may motivate the customer to make a purchase.
Social proof
Cialdini (1984) explained that social proof occurs when people are willing to comply
with a request similar to the level of compliance of others. Use of a social proof technique
can be easily found in marketing strategies. Marketers emphasize that a product is the best
seller. Customers think “if others are buying, I should buy” (Fritchie & Johnson, 2003).

13
Social proof becomes most effective when people are uncertain in the buying situation and
when they find a strong similarity of shopping motives with others (Cialdini, 1993).
Liking
The liking strategy notes that people are more willing to comply with the requests of
friends or others they like (Cialdini, 1984). The power of “‘liking”’ can make viewers feel
affinity to the host, when viewers see a product for the first time and within a relatively short
time (Cialdini & Goldstein, 2002). During selling presentations, a salesperson is not only a
likeable person, but also can seen as a friend (Cialdini & Goldstein, 2002). Factors such as
physical attractiveness, similarity, praise, repeated contact, and association with positive
things tend to increase the level of liking (Cialdini, 1993). Thus, the liking strategy is often
referred to as ‘the friendly thief’ (Cialdini, 1993).
Authority
Cialdini (1984) explained that “authority” is at work when people are willing to
follow the suggestions of an individual with legitimate authority. People are more likely to
obey authorities because of their high level of knowledge, wisdom, and power (Cialdini,
1993). In the marketing field, the strategy of authority is frequently used. For example,
advertisers for health-related products frequently employ a real doctor as a spokesperson or
an actor wearing the outfit of an expert. In home shopping programs, the host leads a
program with an expert co-host, such as a designer or celebrity (Fritchie & Johnson, 2003).
Scarcity
In many societies, what is less available is more valuable (Cialdini, 1984). This norm
is the root of the scarcity strategy. Cialdini (1993) called the scarcity strategy “the rule of the
few.” The scarcity strategy works well in selling situations. A product that is less available

14
decreases customers’ freedom of choice (Cialdini, 1993). Limited availability may force
viewers to purchase a product at that moment (Fritchie & Johnson, 2003). A variety of
scarcity techniques can be used, such as offering a limited supply of memberships (Cialdini,
1984). When salespeople mention the limited number of the products or the limited time to
purchase, customers perceive it as more valuable, which persuades consumers to purchase.
This type of a selling technique often drives customers to make an immediate purchase
decision (Cialdini, 1984).
Subjective Well-Being
As life expectancy increases, subjective well-being related to aging becomes an
important and interesting issue in society. It is desirable for people to maintain physical and
mental health. Every individual has personal indicators to define whether his/her life is
worthwhile, which is often called ‘subjective well-being’. Subjective well-being is defined
as cognitive and affective evaluations of life, based on an individual’s self-assessment.
Subjective well-being also can be labeled “happiness” in the colloquial term (Diener, 2000).
Subjective well-being is a broad and complex concept. Diener, Suh, Lucas, and
Smith (1999) identified three dimensions of subjective well-being: 1) emotional responses
(or affect), 2) life satisfaction, and 3) domain satisfactions. Affect refers to mood and
emotion that represent an individual’s positive or negative feelings of the event such as joy,
elation, affection, ecstasy, guilt, shame, sadness, stress, and depression. Life satisfaction is
based on global judgments of life quality, including satisfaction with the current, past, and
future life as well as significant others’ views of one’s life. Domain satisfaction is based on
evaluations of where people are satisfied in their life such as work, family, leisure, health,
finance, or self.

15
Subjective well-being is affected by various factors such as social activity (Smith &
Moschis, 1985) and loneliness (Weiss, 1973). Joung (2002) found older people, who
participated in more social activities, showed greater life satisfaction than those having less
social activities. Social relationship also is positively related to physical health and mental
well-being among older people (Kang & Ridgway, 1996).
Social Involvement
Social involvement is a key dimension affecting quality of life. Several studies
(Joung, 2002; Neugarten, Havighurst, & Tobin, 1961) investigated the effects of social
involvement on life satisfaction or psychological well-being. Joung (2002) found that older
people are more likely to be satisfied when they are physically, mentally, and socially active,
and have frequent social interactions with others. Older people, who are more involved in
social activities, reported greater life satisfaction than those who had less social activities.
Thus, the greater the range of social participation, the greater the subjective well-being of
older people (Neugarten, Havighurst, & Tobin, 1961). Some researchers argued that older
people became more active and are more involved in social relationships such as family ties,
close friends, good neighbors, and community participation (Neugarten & Neugarten, 1986).
However, compared to the younger generation, it is still true that older people have fewer
opportunities for social activities and social interactions than younger people because people
usually have fewer family members or friends in their later years. This is described as a
‘solitary survivor’ (Kang & Ridgway, 1996). Smith and Moschis (1985) also found that
people tend to engage in interactions with their families less frequently as they age.
Several studies examined the relationship between older people’s social activities and
their shopping behaviors. Lee and Geistfeld (1999) found that older consumers are willing to

16
listen to what a telemarketer says over the phone. Furthermore, Joung (2002) found a
significant positive relationship between older women’s activity participation and apparel
shopping. Older women, who participated in more social activities, exhibited more fashion
interests and engaged in more apparel shopping activities than those who participated less
(Joung, 2002).
Loneliness
Loneliness is one of the important predictors of subjective well-being (Weiss, 1973).
Loneliness is a universal phenomenon (“Web of Loneliness,” 2006), so all humans may
experience loneliness to some extent. Loneliness is an unpleasant experience occurring when
there is the unmet need for human intimacy (Weiss, 1973). People may feel loneliness when
there is the absence of a particular type of relationship. For instance, Horley and Larvery
(1994) found a relationship between marital status and loneliness. Married individuals
reported higher scores of subjective well-being and, in turn, lower scores of loneliness than
those who were single.
Researchers have focused on the effects of loneliness on consumer behavior. For
example, previous studies examined the effects of loneliness on Internet usage (Das et al.,
2003; Seepersad, 1997) and television news viewing (Rubin et al., 1985). Das et al. (2003)
found lonely people to use the Internet as a coping strategy. Socially lonely people also are
likely to use the Internet for surfing (Seepersad, 1997) and watch television news (Rubin et
al., 1985). Perlman and Landolt (1999) focused on how age and gender correlate with
loneliness. Loneliness increased slightly with age from middle age to older age. Women
more than men were likely to report to be lonely.

17
Loneliness is influenced by aging. Older people may experience different forms of
loneliness, due to the ‘biogenic’ and ‘sociogenic’ problems of aging as compared to younger
people (Gibson, 2000). A biogenic problem is caused by the natural physical deterioration
during the aging process, such as decline in physical robustness, less efficient sight and
hearing, weakened muscles and joints, and dysfunctional internal organs (Gibson, 2000).
Even though older people want to continue their active lifestyle, these biogenic problems
may make them practically housebound. A sociogenic problem causing loneliness in later
life is related to social relationships of older people (Gibson, 2000). Because of the longer
life expectancy of women compared to men, there may be more and more widows in later
life. Absence of a husband, as well as few chances of finding a male companion, may cause
loneliness for older women. Retirement also can cause loneliness due to the decline of social
relationships with others who shared interests and gossip (Gibson, 2000).
Mood
Several studies (Brandstatter & Eliasz, 2001; Clark & Isen, 1982; Watson, Clark, &
Tellegen, 1988) in consumer behavior used ‘feeling,’ ‘emotion,’ ‘mood,’ and, more generally,
‘affect’ to assess consumer responses to marketing stimuli. The present study will examine
‘mood’ to explain an individual’s emotional state. Mood is a guiding spirit that leads us in
how we should move and act (Brandstatter & Eliasz, 2001). Mood is based on a global
evaluation of an individual’s situation and can be stimulated by pleasant or unpleasant
experiences with marketing stimuli or by the memory of past experiences (Clark & Isen,
1982). For example, receiving a free gift at the shopping mall may enhance mood;
conversely, experiencing poor customer service may lead to a negative mood state.

18
Researchers classify two states of mood—positive and negative states. Positive mood
state includes feeling attentive, interested, alert, excited, enthusiastic, inspired, proud,
determined, strong, and active; whereas, negative mood includes feeling distressed, angry,
fearful, guilty, and nervous (Watson, Clark, & Tellegen, 1988).
Bower (1981) examined the relationship between mood and memory, and found that
an individual in a depressed mood is likely to recall only unpleasant events. A person in the
depressed mood also tends to show a negative interpretation about a common life event.
Bagozzi, Gopinath, and Nyer (1999) mentioned that positive and negative mood states
influence aspects of the shopping experience, including complaints, repurchase, word-of-
mouth communication, and satisfaction.
Mood may affect customer evaluations of the product and judgments of how much
they like the product. Gorn, Goldberg, and Basu (1993) mentioned that people may be
influenced by the mood state they experience at the moment when making a decision. A
negative mood state can lead to a less favorable evaluation of the situation (e.g., decreased
buying intention); whereas, a positive mood state can result in a more favorable evaluation of
the situation (e.g., increased buying intention) (Andrade, 2005). Andrade (2005) found that
people were more likely to try a new product when they were in a positive mood state than in
a negative mood state.
Perceived Risk
Perceived risk can be defined as the uncertainty during contemplating a particular
purchase decision (Cox & Rich, 1964). Despite the significant growth of television home
shopping, some obstacles for selling apparel still exist. When consumers make a purchase
decision about a product on a television shopping programs, they may experience uncertainty

19
in their decision due to a lack of physical product contact. Several studies (e.g., Kim &
Lennon, 2000; McCorkle, 1990) reported that the main concern of television home shopping
is the inability to examine and evaluate merchandise before making a purchase. Uncertainty
may be strongly related to the inability to inspect products and service quality such as size,
color, fabric, pattern, and delivery (McCorkle, 1990). In fact, the merchandise return rate of
20 to 40% in television home shopping may result from the inability to inspect apparel
physically (Jasper & Ouellette, 1994, Kim & Lennon, 2000; Solomon, 1994). Kim and
Lennon (2000) found the main reason for returning products was the product received did not
meet expectations. Physical experience with the product prior to purchase, especially for
apparel products, is required (Kwon, Paek, & Arzeni, 1991), but is not available in television
home shopping. Thus, the absence of physical experience with the product strongly
influences television shoppers’ perceived risk and, in turn, purchase intention (Kim &
Lennon, 2000). Perceived risk includes four dimensions: 1) financial, 2) functional, 3) social,
and 4) time dimensions (Kwon et al., 1991).
Financial risk refers to an individual’s uncertainty about monetary loss in the
purchase process (O’Bannon, Feather, Vann, & Dillard, 1988). Financial loss includes the
initial product cost as well as the potential cost of repair, maintenance, or return (McCorkle,
1990). Financial risk may occur when the price of a product is relatively expensive and/or
when the product return and refund is complex (Kwon et al., 1991). Several promotion
strategies—special discounts, reduced shipping charges, clearance items, a free gift, and
exclusive offers—are frequently used by home shopping marketers to reduce financial risk
(McCorkle, 1990).

20
Functional risk may be caused by the uncertainty of product quality and the tendency
to avoid a poor quality product (O’Bannon et al., 1988). When customers cannot examine
merchandise before making a purchase, perceived functional risk is likely to be greater. In-
home shoppers tend to exhibit a greater level of perceived functional risk than in-store
shoppers regarding apparel selection because of uncertainty about size, quality of fabric,
color, and style (McCorkle, 1990).
Perceived social risk refers to the uncertainty of reassurance from others such as
family and friends about a particular product purchase (McCorkle, 1990; O’Bannon et al.,
1988). Eastlick and Feinberg (1995) explained that social risk results from ‘disapproval by
family or friends’. People are likely to perceive greater social risk with socially visible
products, such as clothing, accessories, and household furnishings than other consumer goods
(McCorkle, 1990). Similarly, Kwon et al. (1991) found that fashion products are associated
with social risk. Because of perceived social risk, people are likely to purchase branded
products that can be clearly recognized and socially accepted by others.
Perceived time risk is defined as the concern of time-loss involved in receiving or
returning the product (Eastlick & Feinberg, 1995). Perceived time risk involves the time lost
between the order and receipt of products, and/or time lost in returning the products.
McCorkle (1990) mentioned that customers considered difficulties and associated possible
time lost in returning an unsatisfactory product before they finalized a purchase decision.
Perceived risk plays an important role in purchase decisions (Eastlick & Feinberg,
1995). Purchase intention increases when perceived risk decreases (Kim & Lennon, 2000).
For older consumers, new product trial is influenced by perceived risk (Schiffman,1972).
The amount of perceived risk may differ by shopping channel. Previous researchers studied

21
perceived risk of multiple shopping channels and found consumers perceive more risk in
home shopping than in-store shopping (McCorkle, 1990).
Impulse Buying
Traditionally, impulse buying is defined as an unplanned or spontaneous purchase
(Rook, 1987). Consumer behavior researchers have studied impulse buying (Han, Morgan,
Kotsiopulos, & Kang-Park, 1991; Rook, 1987; Rook & Fisher, 1995). Rook (1987)
considered impulse buying to be a widespread behavior associated with an array of product
categories. Impulse purchases are hard to resist, due to pleasurable feelings such as “good,”
“happy,” “satisfied,” or “wonderful” associated with the experience (Rook, 1987).
Impulse buying of apparel shoppers (Han et al., 1991; Park & O’Neal, 2000), Internet
shoppers (Shin, Lee, Bae, & Noh, 2003), and television shoppers (Park & Lennon, 2004) has
been studied. Impulse buying tendency is frequently observed in non-store shopping of
apparel. Television home shoppers are more likely to purchase impulsively rather than
engage in information search for a particular product (Economist, 1996). The more time
shoppers watch television shopping programs, the more likely they are to purchase products
on impulse (Park & Lennon, 2004). Due to the nature of the television shopping
environment (e.g., products are presented for only 30 minutes, specific products are not
announced in the program guide), consumers do not know what products will be presented
and will watch a series of product presentations without much prior information (Lennon &
Sanik, 2003). Thus, television shoppers cannot plan their purchases before they watch a
shopping program.
Impulse buying may be stimulated by parasocial interaction with the show hosts.
Grant et al. (1991) found that parasocial interactions are related to television shopping

22
program exposure. As exposure to television shopping programs increases, viewers tend to
interact with television shopping program hosts and purchase more (Grant et al., 1991). Park
and Lennon (2004) also found that television home shoppers of apparel, who develop more
parasocial relationships with the hosts, tend to purchase on impulse.
Hypotheses Development
Personal Selling Approach and Parasocial Interaction
For television shopping, the host tends to use various personal selling approaches to
evoke viewers’ purchase intentions. The informal and friendly verbal style of the television
shopping show host may create the illusion of an inter-personal relationship with the host for
viewers (Grant et al., 1991). Jaramillo and Marshall (2004) found that salespeople, who use
a customer-friendly language during the sales presentation, are more likely to be successful
than those who use technical and non-friendly language. Several researchers (e.g., Auter &
Moore, 1993) argued that television shopping show hosts encourage parasocial interaction,
using a friendly verbal style. Through parasocial interaction, customers may seek guidance
for purchasing products and see media personalities as friends (Rubin et al., 1985).
Television shopping show hosts may use persuasive strategies to accelerate purchases
as well as to develop parasocial interactions with their customers. In fact, Fritchie and
Johnson (2003) examined the occurrences of Cialdini’s (1993) persuasive strategies in the
television shopping environment and found that the hosts used six persuasive strategies.
Among the six persuasive strategies, social proof and scarcity strategies were the most
commonly used by the television shopping program hosts (Fritchie & Johnson, 2003).
All persuasive strategies are executed through informal and friendly conversations
with the hosts. In this communication process, viewers may feel the hosts are friends

23
(Cialdini & Goldstein, 2002) and tend to interact with the program hosts. It is reasonable to
expect that some persuasive selling approaches lead to parasocial interactions between hosts
and viewers. Thus, this study will examine the effect of consumer perception of persuasive
strategies on parasocial interactions. Therefore, the following hypothesis is proposed (see
Figure 1):
Hypothesis 1: Consumer perceptions of the use of a personal selling approach
(persuasive strategies) are positively associated with level of perceived parasocial
interactions.
Parasocial Interaction and Perceived Social Involvement
Older people tend to have fewer opportunities than younger people for social
activities and experience fewer social interactions, due to limited mobility and health (Rahtz,
Sirgy, & Meadow, 1989). Levy (1979) mentioned that people with less social interactions
are more likely to have parasocial relationships with media personae as an alternative form of
social involvement. Shopping may be considered to be a social activity among older people
(Rahtz et al., 1989; Michman et al., 2003).
Television shopping includes social involvement because it simulates the perceived
interpersonal relationship between hosts and viewers (Fritchie & Johnson, 2003). During
television shopping, parasocial interactions between viewers and the hosts may lead the
viewers to feel that the hosts are friends. Thus, television-shopping activities can enhance
older consumers’ perceived social involvement (Cialdini & Goldstein, 2002).
Based on previous literature of older consumers, it is reasonable to expect a positive
relationship between parasocial interaction and perceived social involvement. Therefore, the
following hypothesis is posited:

24
Hypothesis 2: Perceived parasocial interactions have a positive effect on perceived
social involvement of older consumers.
Parasocial Interaction and Mood
Shoppers’ moods may be affected by their relationships with the salespeople. A
positive mood is enhanced when consumers experience good service from salespeople
(Diener, 2000; Johnson-Hillery & Kang, 1997). Older people are even more sensitive to
salespeople’s treatment than younger consumers (Braus, 1990). They tend to shop more in
stores where salespeople know them. Therefore, when older people have dynamic
interactions with salespeople, they are likely to feel better and be in a positive mood
(Johnson-Hillery & Kang, 1997). In television shopping, because older people who have
limited opportunities for social interaction (Rubin et al., 1985) and less social involvement
(Gibson, 2000) tend to interact with the hosts, they are more likely to develop a close
relationship with the host, feel a sense of social involvement that fulfill their social needs,
and, in turn, feel pleasure. Therefore, it is reasonable to expect that parasocial interactions
with the hosts in the television shopping environment may lead to a positive mood state for
older consumers. Based on the literature, the following hypothesis is developed:
Hypothesis 3: Perceived parasocial interaction enhances positive mood state of older
consumers.
Parasocial Interaction and Perceived Loneliness
People may feel lonely when they perceive a lack of social participation (Rubin et al.,
1985). Older women may use television home shopping to alleviate loneliness (Park &
Lennon, 2004) resulting from fewer social interactions and spending more time alone.

25
Stephens et al. (1996) mentioned that television shoppers feel a type of friendship with the
host.
Several researchers (Kang & Ridgway, 1996; McDonald, 1995) have found that
television shopping attracts consumers for hedonic reasons. Consumers may enjoy
recreational experiences from television shopping through indirect conversation and a
perceived close relationship with the affable and accessible program hosts (Consumer
Reports, 1995; McDonald, 1995). For people living alone or having few social interactions,
interacting with the hosts can be an alternative form of social activity (Kang & Ridgway,
1996). Thus, parasocial interaction with media personae can be an antidote for loneliness
(Levy, 1979). Therefore, the following hypothesis is developed (see Figure 1):
Hypothesis 4: Perceived parasocial interaction has a negative effect on perceived
loneliness of older consumers.
Perceived Social Involvement and Perceived Loneliness
Loneliness is a significant issue for older people (Townsend, 1973). Several
researchers (Kang & Ridgway, 1996; Manthorpe, 2005) described life events, such as
retirement and death of a spouse and/or friends, as contributing to loneliness among older
people (Manthorpe, 2005). Loneliness also may result from a decrease in social involvement.
Previous literature showed a strong inverse relationship between social involvement and
loneliness among older people. Increasing and maintaining levels of social involvement may
alleviate loneliness among older people (Cattan, White, Bond, & Learmouth, 2005).
Similarly, Kim et al. (2005) found that older consumers, who had less social involvement,
were likely to feel lonelier than those who had greater social involvement. When shopping is
seen as a social activity, loneliness can be reduced (Kim et al., 2005). Based on the literature,

26
it is reasonable to expect that perceived social involvement of older consumers will be
inversely related to perceived loneliness. Therefore, the following hypothesis is generated:
Hypothesis 5: Perceived social involvement has a negative effect on perceived
loneliness of older consumers.
Perceived Social Involvement and Mood
Social involvement and mood are important indicators of subjective well-being
(Diener et al., 1999). Researchers (e.g., Gore, Aseltine, & Colten, 1993; Klumb, 2004; Lu,
1999) have determined that social involvement may influence mood state. Klumb (2004)
found a positive relationship between social involvement and mood state. People included in
a social context, such as a company, are more likely to have a positive mood than those who
are alone (Klumb, 2004). Similarly, Lu (1999) found that social support enhances the degree
of happiness and positive mood among older people. Therefore, based on the literature, it is
reasonable to expect a positive relationship between perceived social involvement and mood
of older consumers. The following hypothesis is generated:
Hypothesis 6: Perceived social involvement has a positive effect on mood state of
older consumers.
Perceived Loneliness and Mood
Loneliness may be a painful and stressful experience (Rokach, 2004) often influenced
by the death of close friends or family members, fewer neighbor visitors, and less
participation in social activities for older people (Adams, Sanders, & Auth, 2004). These
causes of loneliness contribute to negative experiences in later life. Several researchers
(Holmen, Ericsson, & Winblad, 1999; Groothof, 2004) found a negative relationship between
perceived loneliness and a positive mood state. In particular, loneliness had a negative effect

27
on the mood state of older people (Holmen et al., 1999). Those who were lonely were likely
to experience a negative mood state (Groothof, 2004; Holmen et al., 1999). Based on the
literature, it is reasonable to expect that older consumers’ level of perceived loneliness may
inversely influence their mood state. Therefore, the following hypothesis is generated (see
Figure 1):
Hypothesis 7: Perceived loneliness has a negative effect on positive mood of older
consumers.
Mood and Perceived Risk
Mood state influences decision-making (Schwarz & Clore, 1983; Slovic, Finucane,
Peters, & MacGregor, 2004; Yeung & Wyer, 2004). Product evaluation may be affected by
mood state (Yeung & Wyer, 2004) and mood state may influence customers’ risk perceptions
during the process of product evaluation (Slovic et al., 2004; Williams, Zainuba, & Jackson,
2003).
A consumer’s positive mood state may lead to a positive evaluation of a product by
reducing perceived risk. A relationship between mood and perceived risk was found in past
studies. A positive mood was negatively related to perceived risk (Arjun, 1997). Park,
Lennon, and Stoel (2005) found that consumers in positive moods perceived less risk than
those in negative moods in an on-line apparel shopping environment (Park et al., 2005).
Consumers in positive moods may evaluate risk situations more optimistically. Moreover,
individuals with negative moods were less willing to take risk (Williams et al., 2003). Based
on the literature, it is reasonable to expect that a positive mood state may reduce the level of
perceived risk in purchasing merchandise. Therefore, the following hypothesis is proposed:

28
Hypothesis 8: Positive mood negatively affects perceived risk involved in purchasing
merchandise.
Perceived Risk and Impulse Buying
The relationship between perceived risk and purchase intention has been a focus of
in-home shopping studies, including telephone shopping (Cox & Rich, 1964), catalog
purchases (Gaal & Burns, 2005; Jasper & Ouellette, 1994), television shopping (Kim &
Lennon, 2000; Stanforth, Lennon, & Moore, 2000), and Internet apparel shopping (Park et al.,
2005). Jasper and Ouellette (1994) found a significant negative relationship between
perceived risk, due to lack of physical inspection of products, and the amount of money spent
on catalog shopping. Park et al. (2005) found a significant negative relationship between
perceived risk and apparel purchase intention from the Internet. Similarly, in television
home shopping, a decrease in risk perceived may lead to more purchases (Burgess, 2003).
Kim and Lennon (2000) found that purchase intention increases when perceived risk
decreases during television home shopping. The greater the level of perceived risk, the less
the customer is willing to pay for the product (Tsiros & Heilman, 2005).
Consumers perceive television home shopping as a high-risk shopping environment.
Moreover, clothing is the riskiest product category to purchase among all products sold
through television shopping programs (Burgess, 2003). When television shoppers feel less
risk associated with purchasing apparel, impulse purchases increase (Park & Lennon, 2004).
According to Schiffman (1972), older people who perceive less risk may be more willing to
try a new product. Based on the literature, it is reasonable to expect that perceived risk may
negatively influence impulse buying. Therefore, the following hypothesis is developed (see
Figure 1):

29
Hypothesis 9: Perceived risk associated with purchase of merchandise on television
shopping shows negatively affects impulse buying.
Mood and Impulse Buying
Impulse buying is strongly affected by mood (Weinberg & Gottwald, 1982). Several
researchers examined the effect of customers’ mood state on their purchase behavior
(Gardner, 1985; Park et al., 2005) and impulse buying (Rook & Gardner, 1993). Customers
in a positive mood are more willing to try on clothing than those who are in a negative mood
(Gardner, 1985). Park et al. (2005) also found those who are in a positive mood are more
willing to purchase. A pleasurable mood state also is a stronger antecedent to impulse
buying than carefree, exciting, and powerful mood states (Rook & Gardner, 1993).
Therefore, there may be a positive relationship between customers’ mood and impulse
buying behavior in the television home shopping environment. The following hypothesis is
posited (see Figure 1):
Hypothesis 10: Mood has a positive effect on impulse buying.
Proposed Model
Based on previous research, the following model (see Figure 1.1) was developed to
examine the effect of persuasive strategies on parasocial interaction, perceived social
involvement, perceived loneliness, mood, and risk in the television home shopping
environment.

Figure 1.1. Relationship between Personal Selling Approach, Parasocial Interaction, Perceived Social Involvement, Perceived Loneliness, Perceived Risk, and Impulse Buying in the Television Shopping Environment
Mood
Risk
Perceived Social
Involvement
Loneliness
Parasocial Interaction
H10 (+)
H1 (+)
H2 (+)
H3 (+)
H4 (-)
H5 (-)
H6 (+)
H7 (-)
H8 (-)
Perceived Level of Persuasive Approach
Impulse Buying
H9 (-)
30

31
CHAPTER 3: METHOD
This chapter includes a description of procedures and data collection methods for this
study. A questionnaire assessed perceived use of persuasive strategies, parasocial interaction
with the host, social involvement, loneliness, mood, risk, and impulse buying. Before data
analysis, NORM, which performs multiple imputation of multivariate continuous data under
a normal model, was used for missing data (Schafer & Olsen, 1998). Each missing value
was replace by m>1 simulated version (Rubin, 1987). Multiple imputation is one of the
approaches to the statistical analysis of missing data (Rubin, 1987). This instrument was pre-
tested prior to data collection. Data were analyzed using descriptive statistics, Pearson
correlations, factor analysis, and AMOS.
Sample
Two different sampling methods were used in this study because of a low response
rate in the initial method. Elderly women (55 and older) who had experience with television
home shopping programs were recruited through a variety of churches, senior centers, or
senior agencies in central and eastern Iowa in the initial sample. To increase the number of
respondents, a mail survey was sent to 200 women (55 to 80) drawn from a list of college
alumni of a major Midwestern university. If these elderly women had never watched a
television home shopping program, they were asked to watch any television home shopping
program at least once and then complete the survey.
Procedure
Sample Identification
For the first stage of sampling, I approached 10 administrators from churches, senior
centers, and senior agencies via mail, and then visited the administrators at their central Iowa

32
locations to personally request permission to obtain the data from their members/clients.
Once approval was acquired, I provided invitation letters/announcements to be shared with
members/clients. After obtaining permission to visit the agencies, I set up a date with the
administrators to visit each church, senior center, and senior agency. Administrators assisted
in identifying women who were television home shoppers and helped recruit participants
prior to the researcher’s visit.
On the scheduled dates, I visited the agencies and collected the data from those who
were television home shopping shoppers, between the ages of 55 to 80, and who agreed to
participate. Human Subjects information was provided along with a description of the
purpose of the study. Individuals who agreed to participate completed the questionnaire and
then left their signed consent form and contact information with the completed questionnaire.
The instruments did not contain the names of participants. Rather, identification numbers
were assigned to questionnaires completed by participants. In this sampling, 117 surveys
were distributed and 59 responses were collected.
For the second stage of the sampling, the survey used in the first stage of sampling
was mailed to two hundred randomly selected female members of a college alumni list, who
were aged 55 to 80. In July 2007, an invitation flyer, a copy of the questionnaire, and a
postage-paid self-addressed return envelope were mailed to the 200 Alumni members. Due
to limitations in research funds, a reminder letter and another questionnaire were not
distributed. After a month, 75 questionnaires had been received. Fifty usable questionnaires
were retained, after incomplete questionnaires were removed. Compensation was not offered
to either sample.

33
Instrument
The consent form and questionnaire were pre-tested using 10 university faculty and
staff members (55 and older) to identify any wording, procedural, or format problems (e.g.,
font size) and to confirm the length of time needed to complete the questionnaire prior to
collecting data for this study. Approval was obtained from the ISU Human Subjects
Research Office to ensure the rights and confidentiality of the participants. The
questionnaire, consisting of seven parts, contained Likert-type scales to measure perceived
levels of persuasive strategies, parasocial interaction with the host, social involvement,
loneliness, mood, risk, and loyalty. Demographic information was also collected. See
Appendix A for the questionnaire.
Level of persuasive strategies
Fritchie and Johnson (2003) found that two persuasive strategies, consistency and
reciprocation, were seldom used by television shopping show hosts. They counted how
frequently each persuasive strategy was used by television shopping show hosts. In their
study, 197 incidences of persuasive strategy usage were identified. Consistency and
reciprocation appeared in 9.1 and 2.0 percent of the total persuasive strategies, respectively
(Fritchie & Johnson, 2003). Thus, the present study will focus on the four more frequently
used persuasive strategies—social proof, liking, authority, and scarcity. Because no existing
scale was found, I developed a fourteen-item scale for these four persuasive strategies
proposed by Cialdini (1993). Using a 5-point Likert-type scale ranging from 1 (Strongly
disagree) to 5 (Strongly agree), participants indicated their perception regarding the use of
the four persuasive strategies during television shopping programs they have watched.
Social proof items captured whether viewers recognized the use of social proof techniques of

34
television shopping show hosts such as mentioning best-selling items or product popularity.
For instance, the item “The hosts inform the viewer that the product they are selling is one of
the best sellers” was created. Liking items captured factors such as physical attractiveness,
similarity, praise, repeated contact, and association with positive things. For instance, the
item “The hosts have the same preferences or same concerns as me” was used. Authority
items captured perceptions of the presence of a co-host or a fashion expert on television
shopping programs. For example, the item “The hosts introduce a designer/expert who co-
hosts the show with them” was included. Scarcity items captured whether viewers recognize
the use of a scarcity technique by television shopping show hosts such as mentioning limited
availability or a limited time offer. For instance, the item “The hosts mention that there are a
limited number of the products left” was included. Using three Textiles and Clothing
graduate students, all items of persuasive strategies were pre-tested to identify whether the
scale had face validity.
Perceived parasocial interaction
To measure perceived parasocial interactions between hosts and viewers, I used seven
items originally developed by Levy (1979) and modified by Park and Lennon (2004). Park
and Lennon revised the original scale to reflect a television home shopping context, which
makes their scale relevant to the present study. Using a 5-point Likert-type response scale
ranging from 1 (Strongly disagree) to 5 (Strongly agree), respondents were asked to rate
perceptions of their relationship with the hosts. For instance, the item, “The hosts are almost
like friends I see everyday” captured a viewer’s perceived relationship with television
shopping show hosts. The reported reliability of the parasocial interaction scale was .85
(Park & Lennon, 2004).

35
Perceived social involvement
I used items from the Social Provisions Scale to assess social involvement. The
original Social Provisions Scale included six subscales—guidance, reassurance of worth,
social integration, attachment, nurturance, and reliable alliance (Cutrona & Russell, 1987).
Among the six subscales of the Social Provisions Scale, four subscales focused on actual
relationships and only two subscales (social integration and attachment) focused on the
perceived relationships. Because the present study focused on older consumers’ perceived
level of social involvement, I adopted the two subscales, social integration and attachment.
These two scales consisted of eight items scored on a 4-point Likert-type response scale from
1 (Strongly disagree) to 4 (Strongly agree). For instance, for social integration “I feel part of
a group of people who share my attitudes and beliefs” was designed to capture a viewer’s
sense of belonging to a group. For attachment, “I believe I do not have close personal
relationships with other people” captured a viewer’s emotional closeness to others.
According to Cutrona and Russell (1987), the coefficient alphas were .67 for social
integration and .75 for attachment.
Perceived loneliness
To assess viewers’ perceived loneliness, the UCLA Loneliness Scale (Version 3) was
adopted (Russell, 1996). The scale is composed of 10 items, containing 5 negatively worded
(lonely) and 5 positively worded (non-lonely) items, using a 4-point Likert-type scale—
“Never;” “Rarely;” “Sometimes;” and “Always.” 1 represented Never, and 5 represented
Always. Respondents were asked about their feelings when they watched television shopping
programs. For instance, the item “I feel isolated from others” captured a viewer’s perceived
level of loneliness. Several studies evaluated the reliability, validity, and factor structure of

36
the UCLA Loneliness Scale (Version 3) using a variety of populations (e.g., college students,
elderly individuals) and research methods (e.g., self-report questionnaires, mail surveys,
personal interviews) (Russell & Cutrona, 1991; Russell, Kao, & Cutrona, 1987). Cronbach’s
alpha coefficients for the UCLA Loneliness Scale ranged from .89 to .94 for four studies
using different samples (Russell, 1996).
Mood
To capture respondents’ mood, Izard’s (1972) six-item scale measured positive and
negative mood states. Reliabilities of the two subscales (positive and negative mood)
were .80 and .90, respectively, in a previous study (Izard, 1972). This scale has been
frequently used to measure emotional state of consumers. Park et al. (2005) used this mood
scale in an Internet shopping context and measured pre-mood and post-mood in an
experimental study. They reported high reliabilities for pre-mood and post-mood
(alphas=.81 and .76, respectively). In the present study, participants were asked to rate their
mood state with three positive mood state (happy, delighted, joyful) and three negative mood
state (discouraged, sad, downhearted) items using a 5-point Likert-type scale: “Not at all,”
“Slightly,” “Moderately,” “Considerably,” and “Very strongly.” 1 represented Not at all and
5 represented Very Strongly.
Perceived risk
To measure perceived risk, I modified a scale developed by Kwon et al. (1991) to
reflect the television-shopping context. The scale was composed of 16 items with four
subscales of perceived risks (i.e., social, functional, financial, and time risk). Kwon et al.
(1991) found that all four dimensions of perceived risk were related to a catalog-shopping
context. Because both catalog shopping and television shopping are considered to represent

37
a home shopping context, all subscales were used in the present study. All statements were
rated on a 5-point Likert-type scale, with 1 representing strongly disagree and 5 representing
strongly agree. An example item for social risk is, “Products purchased from TV home
shopping programs will not be in fashion.” Reliability for this scale was not reported, but
loadings of the items within the factor ranged from .50 to .90 (Kwon et al., 1991).
Impulse buying
To measure impulse buying, a scale originally developed by Martin, Weun, and Betty
(1993) and revised by Weun, Jones, and Beatty (1997) was adapted to reflect the television
shopping context. The scale was composed of 10 items, such as “When I watch TV shopping
shows, I buy things I had not intended to purchase.” A 7-point Likert-type scale ranging
from 1 (Strongly disagree) to 7 (Strongly agree) was used. An alpha of .82 was reported by
Mick (1996).
Sample characteristics
Information collected about the participants’ general background included age,
ethnicity, income, marital status, and education. Because health status is one of the most
important issues among older people, participants were also asked how they perceived their
health status. Participants also indicated how often they watched television and purchased
products from television home shopping programs, and what programs or home shopping
channels they watched.
38
Analysis
I used SPSS 15.0 for calculating descriptive statistics describing the sample, as well
as Pearson correlations, reliabilities, and factor analysis. A factor analysis with varimax
rotation determined factor items and reliabilities for each variable in the model. For multi-
item variables, a Cronbach’s alpha coefficient above .70 was used as an acceptable level of
internal consistency. In addition, items were retained in the factor if they loaded at .50 or
more on a factor and did not cross load on another factor more than .30 (Hair, Anderson,
Tatham, & Black 1998). I used Analysis of Moment Structures (AMOS) version 7.0 to
derive the maximum-likelihood estimation for analysis of the model. A Chi-square statistic,
goodness-of-fit index (GFI), adjusted goodness of fit index (AGFI), comparative fit index
(CFI), and root mean square error of approximation (RMSEA) were used.

39
CHAPTER 4: RESULTS
The following chapter includes the sample description and factor analysis results,
including reliabilities for the factors. Also, the proposed model analysis, the results of
hypothesis testing and decomposition of effects are discussed.
Description of Sample
Out of 134 responses, 109 usable responses from female television home shopping
shoppers aged 55 to 80 were retained for data analyses. The description of the sample
includes participants’ demographic profiles and previous television home shopping
experience, such as frequency of buying from or watching television home shopping
programs. A description of the sample is summarized in Table 4.1. The largest percentage
of participants was aged 55 to 64 (57.8 %), followed by those aged 75 and over (22.9 %) and
those aged 65 to 74 (19.3 %). The majority of the respondents were White or European
(92.5 %), followed by Native American (3.7 %), Asian American (1.9 %), Black or African
American (0.9 %), and two or more races (0.9 %). Over 60% of the participants were
married, about 18% were widowed, 14% were divorced, and 3% were never married. About
50% of the respondents were retired and 50% were working full/part time. About 40% of the
participants reported less than $50,000 annual income, while the remaining 60% reported
over $50,000 annual income. Almost all (95.4%) of participants perceived their health as
above ‘fair’ status. Also, over 90% of the respondents reported their financial status to be
above ‘fair’. About 95% of the participants had a driver’s license and currently drove their
own vehicles. The education level of the respondents was high because one-half of the
participants were college alumni. About 58.8% of the participants had a college bachelor’s
degree and 29.4 % had a graduate or professional degree. The majority watched television
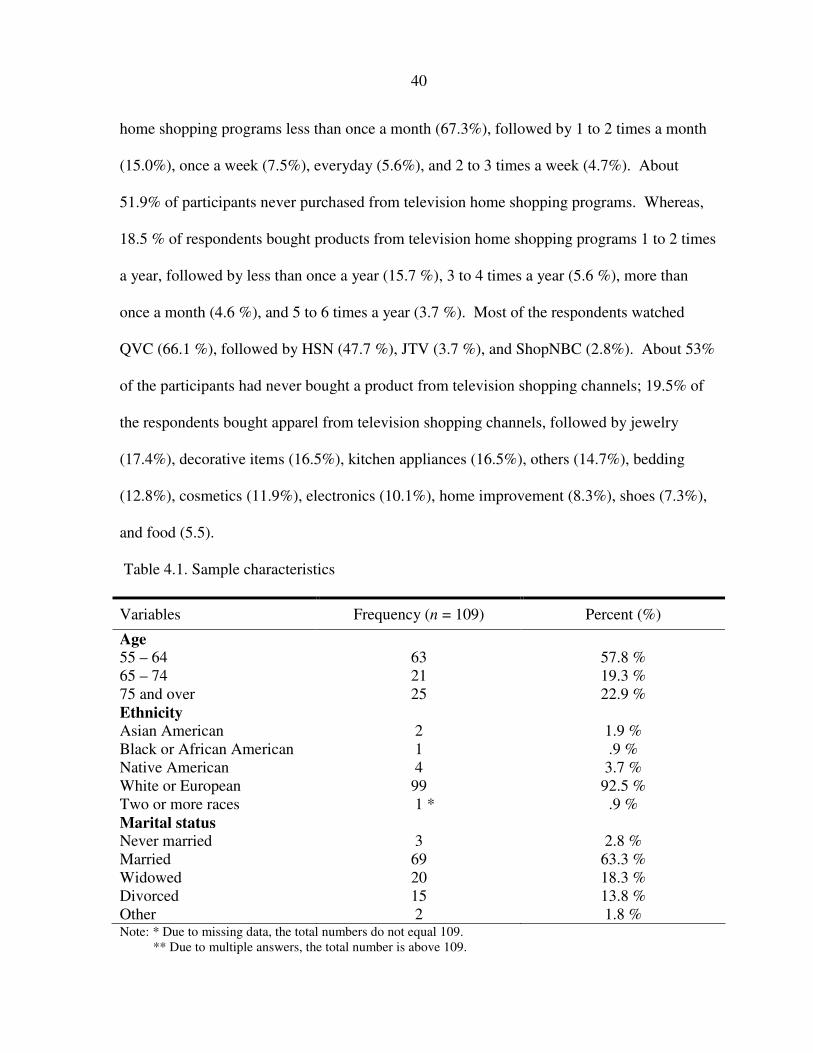
40
home shopping programs less than once a month (67.3%), followed by 1 to 2 times a month
(15.0%), once a week (7.5%), everyday (5.6%), and 2 to 3 times a week (4.7%). About
51.9% of participants never purchased from television home shopping programs. Whereas,
18.5 % of respondents bought products from television home shopping programs 1 to 2 times
a year, followed by less than once a year (15.7 %), 3 to 4 times a year (5.6 %), more than
once a month (4.6 %), and 5 to 6 times a year (3.7 %). Most of the respondents watched
QVC (66.1 %), followed by HSN (47.7 %), JTV (3.7 %), and ShopNBC (2.8%). About 53%
of the participants had never bought a product from television shopping channels; 19.5% of
the respondents bought apparel from television shopping channels, followed by jewelry
(17.4%), decorative items (16.5%), kitchen appliances (16.5%), others (14.7%), bedding
(12.8%), cosmetics (11.9%), electronics (10.1%), home improvement (8.3%), shoes (7.3%),
and food (5.5).
Table 4.1. Sample characteristics
Variables Frequency (n = 109) Percent (%)
Age
55 – 64 65 – 74 75 and over
63 21 25
57.8 % 19.3 % 22.9 %
Ethnicity
Asian American Black or African American Native American White or European Two or more races
2 1 4 99
1 *
1.9 % .9 % 3.7 % 92.5 % .9 %
Marital status
Never married Married Widowed Divorced Other
3 69 20 15 2
2.8 % 63.3 % 18.3 % 13.8 % 1.8 %
Note: * Due to missing data, the total numbers do not equal 109. ** Due to multiple answers, the total number is above 109.

41
Table 4.1. (continued)
Work status
Working full time Working part time Retired Never worked outside the home
43 12 52 2
39.4 % 11.0 % 47.7 %
1.8 %
Income
Less than $25,000 $25,000 – $49,999 $50,000 – $74,999 $75,000 – $99,999 Over $100,000
14 25 25 17
18 *
14.1 % 25.3 % 25.3 % 17.2 % 18.2 %
Perception of health status
Very poor Poor Fair Good Excellent
2 3 12 52 40
1.8 % 2.8 % 11.0 % 47.7 % 36.7 %
Perception of finance status
Very poor Poor Fair Good Excellent
2 6 20 57
23 *
1.9 % 5.6 % 18.5 % 52.8 % 21.3 %
Education
Less than high school graduate High school diploma or GED certificate Some college or technical school Associate degree College degree Graduate or professional degree
3
21
18 3 32
32
2.8 %
19.3 %
16.5 % 2.8 % 29.4 %
29.4 %
Driver’s license
Yes No
104 5
95.4 % 4.6 %
Vehicle own
Yes No
101 7 *
93.5 % 6.5 %
Note: * Due to missing data, the total numbers do not equal 109. ** Due to multiple answers, the total number is above 109.

42
Table 4.1. (continued)
Television shopping
program watching
Less than once a month 1 to 2 times a month Once a week 2 to 3 times a week Everyday
72 16 8 5
6 *
67.3 % 15.0 % 7.5 % 4.7 % 5.6 %
Frequency of buying
products from television
home shopping programs
Never bought from TV shopping Less than once a year 1 to 2 times a year 3 to 4 times a year 5 to 6 times a year More than once a month
56 17 20 6 4
5 *
51.9 % 15.7 % 18.5 % 5.6 % 3.7 % 4.6 %
Television home shopping
channels watched
QVC HSN JTV ShopNBC
72 52 4
3 **
66.1 % 47.7 % 3.7 % 2.8 %
Products bought from
television shopping
channels
Apparel Bedding Cosmetics Decoration items Food Electronics Home improvement Jewelry Kitchen appliances Shoes Other None of these
21 14 13 18 6 11 9 19 18 8 16
58 **
19.3 % 12.8 % 11.9 % 16.5 % 5.5 % 10.1 % 8.3 % 17.4 % 16.5 % 7.3 % 14.7 % 53.2 %
Note: * Due to missing data, the total numbers do not equal 109. ** Due to multiple answers, the total number is above 109.

43
Factor Analysis
Factor analysis using a principal axis factoring method with varimax rotation was
conducted to determine the multi-item structure of the following variables: level of
persuasive strategies, perceived parasocial interaction, perceived loneliness, perceived social
involvement, mood, perceived risk, and impulse buying. An “eigenvalue greater than 1”
criterion was used to determine the number of factors. Items were retained using guidelines
noted above, as found in Hair, Anderson, Tatham, and Black (1998). Cronbach alpha
coefficients above .70 were used as a measure of internal consistency of the multi-item
variables (Nunnally, 1978). The means of the summated multiple items in each variable
were used to create all research variables for hypothesis testing.
Level of persuasive strategies
Factor analysis was performed on the 14 persuasive strategy items. The first iteration
of exploratory factor analysis extracted three factors with eigenvalues greater than 1, but four
of the 14 items were cross-loaded on more than one factor. After removing the cross-loaded
items, the remaining 10 items were again factor analyzed, and two factors with eigenvalues
greater than 1 (Costello & Osborne, 2005) were extracted. The first factor included six
items: three social proof items and three scarcity items. The second factor included liking
items. To simplify the tested model only one factor, consisting of six items (three social
proof items and three scarcity items) and explaining the most variance, was used for this
study. This factor was entitled, ‘Persuasive strategies’. Factor items, variance explained, and
alpha coefficients are presented in Table 4.2. The first factor explained 38.43 percent of the
total variance in the persuasive strategies variable. Factor loadings ranged from .61 to .91.

44
Table 4.2. Factor analysis results for the persuasive strategies variable
Factor title and items Loadings
Persuasive strategies The hosts inform the viewer that the product they are selling is one of the best sellers. The hosts explain the level of popularity of the product. The hosts inform me that an item that was popular in a past show is now available for purchase. The hosts mention that there are a limited number of the products left. The hosts tell me that the product is almost sold out. The hosts mention that this is last chance for me to purchase a product. Eigenvalue = 3.84 Cronbach’s alpha = .88 Variance explained = 38.43 Liking The hosts feel like my friends. The hosts have the same preferences or same concerns as me. The hosts praise me when I make a purchase from the show. The hosts agree with what I think.
Eigenvalue = 2.51 Cronbach’s alpha = .79 Variance explained = 25.09
Total Percent of Variance = 63.53
Cross-loaded items not included in the second factor analysis The hosts encourage me to watch, purchase, or contact the program/host again. The hosts appear knowledgeable about the product. The hosts introduce a designer/expert who co-hosts the show with them. The hosts inform me how the name brands on their show are reliable.
.69
.68
.61
.90
.91
.86
.78
.80
.67
.80
Perceived parasocial interaction
Factor analysis on the seven perceived parasocial interaction items resulted in one
factor, which explained 56.27 percent of the variance. The eigenvalue of this factor was 3.94

45
and factor loadings ranged from .59 to .85. The Cronbach’s alpha was .87. Factor items and
factor loadings are presented in Table 4.3.
Table 4.3. Factor analysis results for perceived parasocial interaction
Factor title and items Loadings
Parasocial interaction The hosts are almost like friends I see everyday. I like hearing the voices of the hosts in my home. When the hosts show how they feel about the product, it helps me make up my mind about the product. I like to compare my feelings for the product with what the hosts say about it. When the hosts joke around with each other, it makes the program even more enjoyable. The hosts show me what people in the media are really like. I feel sorry for the hosts when they make mistakes. Eigenvalue = 3.94 Cronbach’s alpha = .87 Total variance explained = 56.27
.81
.85
.84
.71
.78
.59
.64
Perceived social involvement
Factor analysis of the eight items of perceived social involvement resulted in two
factors (see Table 4.4). These two factors represented 69.28 percent of the total variance.
Factor loadings ranged from .70 to .96. The first factor included four items with a
Cronbach’s alpha of .89 and was labeled “Social involvement.” The second factor, labeled
as “Non-social involvement,” consisted of four items with a Cronbach’s alpha of .79. The
Social involvement factor, which explained the most variance, was used in hypothesis testing.
The factor items and their factor loadings are listed in Table 4.4.

46
Table 4.4. Factor analysis for perceived social involvement
Factor title and items Loadings
Social involvement When watching television shopping programs, I believe there are people who depend on me for help. I feel part of the group of people who share my attitudes and beliefs. I believe I have close relationships that provide me with a sense of emotional security and well-being. I feel a strong emotional bond with at least one other person. Eigenvalue = 3.04 Cronbach’s alpha = .89 Variance explained = 38.04%
.75
.85
.96
.90
Non-social involvement When watching television shopping programs, I believe I do not have close personal relationships with other people. I believe there is no one who shares my interests and concerns. I lack a feeling of intimacy with another person. I believe there is no one who likes to do the things I do. Eigenvalue = 2.50 Cronbach’s alpha = .79 Variance explained = 31.24%
.70
.87
.75
.83
Total percent of variance = 69.28
Perceived loneliness
Factor analysis was performed on the 10 items of perceived loneliness. The first
iteration of exploratory factor analysis extracted two factors with eigenvalues greater than 1,
but one item cross-loaded on more than one factor. After its removal, two factors with
eigenvalues greater than 1 resulted from the remaining nine items. The first factor included
five items and was labeled “Loneliness 1.” It showed good internal consistency with a
Cronbach’s alpha of .88. The second factor, labeled “Loneliness 2,” consisted of four items

47
with a Cronbach’s alpha of .80. Again, to simplify hypothesis testing, only the Loneliness 1
factor, which explained more of the variance, was used for this study. Loneliness 1 factor
included five positively worded (non-lonely) items, such as “When watching television
shopping programs, I feel I have a lot in common with other people.” These five items were
reverse coded, which means that higher scores for the Loneliness 1 variable represent higher
levels of loneliness. Factor items and factor loadings are presented in Table 4.5. The factor
used in hypothesis testing explained 38.05 percent of the variance. Factor loadings ranged
from .63 to .93.
Mood
Factor analysis of the six items of mood resulted in two factors (see Table 4.6).
These two factors represented 83.30 percent of the total variance. Factor loadings ranged
from .83 to .94. The first factor included three items with a Cronbach’s alpha of .94 and was
labeled “Positive mood.” The second factor, labeled as “Negative mood,” consisted of three
items with a Cronbach’s alpha of .85. The Positive mood factor, which explained the most
variance was used for hypothesis testing. The items and their factor loadings are listed in
Table 4.6.

48
Table 4.5. Factor analysis results for perceived loneliness
Factor title and items Loadings
Loneliness 1 When watching television shopping programs, I feel I have a lot in common with other people. I feel close to people. I feel there are people who really understand me. I feel there are people I can talk to. I feel there are people I can turn to. Eigenvalue = 3.43 Cronbach’s alpha = .88 Variance explained = 38.05%
.68
.63
.89
.92
.93
Loneliness 2 When watching television shopping programs, I feel lack of companionships. I feel left out. How often do you feel that no one really knows you well. I feel isolated from others. Eigenvalue = 2.52 Cronbach’s alpha = .80 Variance explained = 28.03% Total percent of variance = 66.09 Cross-loaded items not included in the second factor analysis When watching television shopping programs, I feel that people are around me but not with me.
.75
.80
.81
.77

49
Table 4.6. Factor analysis results for mood
Factor title and items Loadings
Positive mood Happy Delighted Joyful Eigenvalue = 2.69 Cronbach’s alpha = .94 Variance explained = 44.85%
.94
.92
.94
Negative mood Discouraged Sad Downhearted Eigenvalue = 2.31 Cronbach’s alpha = .85 Variance explained = 38.45%
.85 .83 .90
Total percent of variance = 83.30
Perceived risk
Factor analysis was performed on the 16 items of perceived risk. The first iteration of
exploratory factor analysis extracted three factors with eigenvalues greater than 1, but eight
of 16 items were cross-loaded on more than one factor. After removing the cross-loaded
items, three factors with eigenvalues greater than 1 were extracted. The 16 items developed
by Kwon et al. (1991) were modified to reflect a television shopping context. The resulting
factors did not coincide with the subscales proposed by Kwon et al. (1991). The first factor
(Social risk) included four items: three social risk items and one functional risk item with a
Cronbach’s alpha of .84. The second factor included two functional risk items with a

50
Cronbach’s alpha of .65. The third factor was composed of two items; one financial risk item
and one time risk item with a Cronbach’s alpha of .41. Only the Social risk factor was used
in hypothesis testing because it is the most relevant to this study and had an alpha above .70.
Factor items and loadings are presented in Table 4.7. The first factor explained 33.54 percent
of the variance with factor loadings from .73 to .83.
Table 4.7. Factor analysis results for perceived risk
Factor title and items Loadings
Social risk Products purchased from TV home shopping programs will not be the same as shown on TV. Products purchased from TV home shopping programs will not be in fashion. Products purchased from TV home shopping programs will not fit. Products purchased from TV home shopping programs will not fit into my existing wardrobe. Eigenvalue = 2.68 Cronbach’s alpha = .84 Variance explained = 33.54%
.80
.83
.83
.73
Functional risk The assortment of products on TV home shopping programs is competitive with store apparel. Prices of product from TV home shopping programs are competitive with those of store products. Eigenvalue = 1.58 Cronbach’s alpha = .65 Variance explained = 19.79%
.73
.92
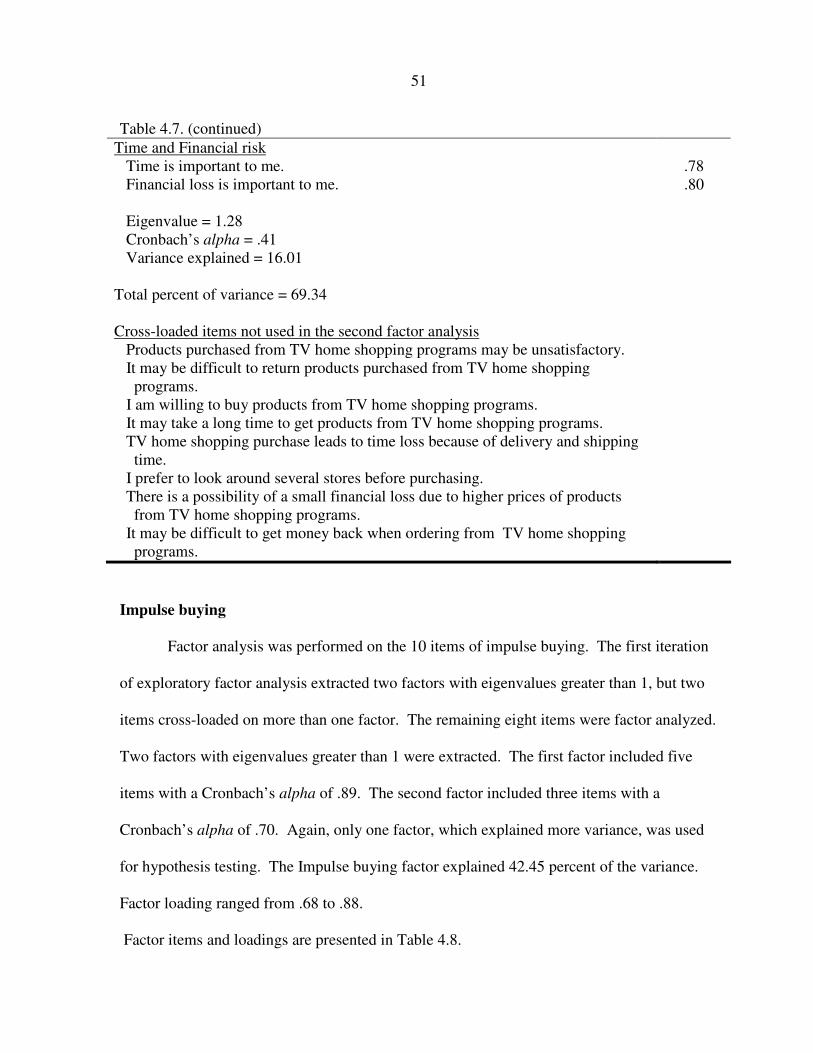
51
Table 4.7. (continued)
Time and Financial risk Time is important to me. Financial loss is important to me. Eigenvalue = 1.28 Cronbach’s alpha = .41 Variance explained = 16.01 Total percent of variance = 69.34
.78 .80
Cross-loaded items not used in the second factor analysis Products purchased from TV home shopping programs may be unsatisfactory. It may be difficult to return products purchased from TV home shopping programs. I am willing to buy products from TV home shopping programs. It may take a long time to get products from TV home shopping programs. TV home shopping purchase leads to time loss because of delivery and shipping time. I prefer to look around several stores before purchasing. There is a possibility of a small financial loss due to higher prices of products from TV home shopping programs. It may be difficult to get money back when ordering from TV home shopping programs.
Impulse buying
Factor analysis was performed on the 10 items of impulse buying. The first iteration
of exploratory factor analysis extracted two factors with eigenvalues greater than 1, but two
items cross-loaded on more than one factor. The remaining eight items were factor analyzed.
Two factors with eigenvalues greater than 1 were extracted. The first factor included five
items with a Cronbach’s alpha of .89. The second factor included three items with a
Cronbach’s alpha of .70. Again, only one factor, which explained more variance, was used
for hypothesis testing. The Impulse buying factor explained 42.45 percent of the variance.
Factor loading ranged from .68 to .88.
Factor items and loadings are presented in Table 4.8.

52
Table 4.8. Factor analysis results for impulse buying
Factor title and items Loadings
Impulse buying If a TV shopping show introduces something new that really interests me, I buy it right away just to see what it is like.
I may buy things from a TV shopping show without hesitation if I like them when I first see them.
If a TV shopping show introduces something new and I really want, I purchase it immediately, even if I had not planned to buy it. I can make unplanned purchases from a TV shopping show. If a TV shopping show introduces something that really interests me, I buy it without considering the consequences. Eigenvalue = 3.40 Cronbach’s alpha = .89 Variance explained = 42.45%
.86
.88
.84
.72
.68
Non-impulse buying Even when I see something I really like, I do not buy it unless it is a planned purchase. I am not willing to buy things from a TV shopping show that are not on my shopping list. I do not buy until I can make sure the TV shopping show is offering a real
bargain. Eigenvalue = 2.03 Cronbach’s alpha = .70 Variance explained = 25.41% Total percent of variance = 67.86
.70
.78
.78
Cross-loaded items not used in the second factor analysis When I watch TV shopping shows, I buy things I had not intended to purchase. It is fun to buy spontaneously from a TV shopping show.

53
Correlations Among Research Variables
The correlations among variables are summarized in Table 4.9. Whereas Persuasive
strategies was not significantly correlated with other variables, statistically significant
correlations were found:
• Parasocial interaction was correlated with Social involvement, Positive mood state,
and Impulse buying. The results showed negative correlations between Parasocial
interaction and Loneliness and Social risk.
• Loneliness was negatively correlated with Social involvement , Positive mood state,
and Impulse buying.
• Social involvement was correlated with Positive mood and Impulse buying.
• Positive mood state was negatively correlated with Social risk and positively
correlated with Impulse buying.
• Social risk was negatively correlated with Impulse buying.
Table 4.9. Correlations among research variables
Variables 1 2 3 4 5 6 7
1. Persuasive Strategies
1
2. Parasocial Interaction
.15 1
3. Social Involvement
.03 .44** 1
4. Loneliness -.06 -.41** -.78** 1
5. Positive Mood
.08 .48** .52** -.54** 1
6. Social risk -.15 -.41** -.19 -.16 -.22* 1
7. Impulse Buying
-.03 .53** .27** -.25** .30** -.42** 1
Notes: * p < .05. ** p < .01.

54
Hypotheses Testing
The theoretical model consisted of one exogenous variable (level of Persuasive
strategies) and six endogenous variables (Parasocial interaction, Social involvement,
Loneliness, Positive mood, Social risk, and Impulse buying). To assess the overall fit of the
hypothesized model to the data, a Chi-square statistic, goodness-of-fit index (GFI), adjusted
goodness of fit index (AGFI), comparative fit index (CFI), and root mean square error of
approximation (RMSEA) were used. A Chi-square statistic was used as a function of the
maximum likelihood estimator for the parameters and a value close to zero indicates a good
fit of the model. GFI is based on a ratio of the sum of the squared differences between the
observed and reproduced matrices to the observed variances. A value of 1.00 indicates a
perfect fit and a value greater than .90 indicates an acceptable fit of the model (Schumacker
& Lomax, 1996). AGFI takes into account degrees of freedom available for testing the
model. A value of 1.00 indicates a perfect fit and a value greater than .90 indicates
acceptable fit of the model. CFI ranges from 0 to 1 and a value greater than .90 indicates
acceptable fit. RMSEA is a population-based index and is relatively unaffected by sample
size. A value .05 or less would indicate a good fit of the model in relation to the degrees of
freedom (Browne & Cudeck, 1993).
Three models were tested—the theoretical model, the fully recursive model, and the
empirical model. The fully recursive model was run after the theoretical model resulted in
marginal fit. The fully recursive model identified the statistically significant paths. The
results of both the theoretical model and the fully recursive model are presented in Table 4.10.
The empirical model, which included the two additional statistically significant paths
identified in the fully recursive model, was used for hypothesis testing.

55
The theoretical model and the fully recursive model
The theoretical model was first tested and the results indicated that overall fit indices
were marginal. The results revealed a χ2 of 35.82 with 11 degrees-of-freedom (p < .01). The
GFI was .92; AGFI was .80; CFI was .89; and RMSEA was .15. These results indicate that
the theoretical model did not fully explain the data. Therefore, the fully recursive model was
examined and revealed a χ2 of 0.00 with 0 degrees-of-freedom. The GFI was 1.00, CFI was
1.00.
Standardized path estimates, critical values, and square multiple correlations for both
the theoretical model and the fully recursive model are shown in Table 4.10. The theoretical
model and the fully recursive model resulted in two significant differences. First, positive
mood had significant effects on social risk and impulse buying in the theoretical model (ß = -
.22, C.R. = -2.29, p < .05; ß = .22, C.R. = 2.52, p < .05, respectively) whereas positive mood
had no significant effects on social risk and impulse buying in the fully recursive model (ß =
-.03, C.R. = -.28; ß = .05, C.R. = .46, respectively). From the fully recursive model two
statistically significant paths, not included in the theoretical model, were found. Parasocial
interaction with television home shopping show hosts had significant effects on social risk
and impulse buying (ß = -.39, C.R. = -3.80, p < .01; ß = .41, C.R. = 4.13, p < .01,
respectively). These two significant paths were added to the empirical model. The present
study tested the hypothesized relationships using the empirical model.

Table 4.10. Path estimates for the theoretical model and the fully recursive model
Notes: Standardized path estimates are reported with critical ratio (C.R.) in parentheses. M1 refers to the theoretical model; M2 refers to the fully recursive model * p < .05. ** p < .01.
Predictor variables
Parasocial interaction
Social involvement
Loneliness Positive mood Social risk Impulse buying
M1 & M2 M1 M2 M1 M2 M1 M2 M1 M2 M1 M2
Persuasive strategies
.15 (1.52)
-.04
(-.51)
-.03 (-.40)
.02
(.25)
-.10 (-1.08)
-.13
(-1.61)
Parasocial interaction
.44** (5.10)
.45** (5.10)
-.09 (-1.30)
-.08 (-1.21)
.28** (3.35)
.28** (3.28)
-.39** (-3.80)
.41** (4.13)
Social involvement
-.74**
(-11.18) -.74**
(-11.21) .17
(1.39) .17
(1.41)
-.05 (-.31)
.01
(.09)
Loneliness -.29*
(-2.37) -.29*
(-2.36)
-.07 (-.46)
-.02
(-.13)
Positive mood
-.22*
(-2.29) -.03
(-.28) .22*
(2.52) .05
(.46)
Social risk -.37** (-4.22)
-.25** (-2.91)
R2 .02 .19 .20 .62 .62 .38 .38 .05 .18 .22 .34
56

.15
(1.52)
.44**
(5.10)
-.09
(-1.30)
-.74**
(-11.18)
.28**
(3.35)
-.29*
(-2.37)
.17
(1.39) .06
(.62)
-.02
(-.22)
-.24**
(-2.73)
.40**
(4.16)
-.40**
(-4.05)
R2 = .02
R2 = .19
R2 = .62
R2 = .38
R2 = .33
R2 = .17
Notes: Standardized path estimates are reported with critical ratio (C.R.) in parentheses.
* p < .05. ** p < .01. Figure 4.1. The final empirical model showing the effects of persuasive strategies on parasocial interactions, social involvement, loneliness, positive mood, social risk, and impulse buying.
Persuasive strategies
Parasocial interaction
Social involvement
Loneliness
Positive mood
Social risk
Impulse buying
χ2 = 4.48; df = 9; p = .88
GFI = .99 AGFI = .96 CFI = 1.00 RMSEA = .000
57

58
The empirical model
The empirical model was tested after two significant paths identified in the fully
recursive model were added. The results revealed a χ2 of 4.48 with 9 degrees-of-freedom (p
= .88). The GFI was .99; AGFI was .96; CFI was 1.00; and RMSEA was .00. The fit indices
showed the data fit the empirical model very well with the two added significant paths from
perceived parasocial interaction to perceived social risk and impulse buying tendency. Path
coefficients, critical ratios (C.R.), and squared multiple correlations (R2) for the empirical
model were illustrated in Figure 4.1. Several paths were significant, as hypothesized.
Level of persuasive strategies and parasocial interaction
Hypothesis 1 tested the relationship between the level of persuasive strategies and
parasocial interactions.
H1. Consumer perceptions of the use of a personal selling approach (persuasive
strategies) are positively associated with level of perceived parasocial
interactions.
Using the 6-item Persuasive strategies factor, consumer perceptions of the use of
persuasive strategies did not have a significant effect on the level of perceived parasocial
interactions (ß = .15, C.R. = 1.52, p = .21). Therefore, H1 was not supported.
Parasocial interaction and social involvement
Hypothesis 2 examined the relationship between parasocial interaction and social
involvement of older consumers.
H2. Perceived parasocial interactions have a positive effect on perceived social
involvement of older consumers.

59
Using the four-item Social involvement factor, results revealed that parasocial
interactions positively affected social involvement of older consumers (ß = .44, C.R. = 5.10,
p < .01). In other words, those who perceived that they had higher levels of parasocial
interaction with television home shopping show hosts felt like they had higher levels of
social involvement. Therefore, hypothesis 2 was supported. In addition, parasocial
interactions explained 19% of the variance for social involvement (R2 = .19).
Effects of parasocial interaction, social involvement, and loneliness on positive mood
Hypotheses 3, 6, and 7 tested the effects of parasocial interaction, social involvement,
and loneliness on positive mood.
H3. Perceived parasocial interaction enhances positive mood state of older
consumers.
H6. Perceived social involvement has a positive effect on positive mood states of
older consumers.
H7. Perceived loneliness has a negative effect on positive mood of older consumers.
Results revealed that hypothesis 3 was supported. Parasocial interaction positively
affected positive mood state of older consumers (ß = .28, C.R. = 3.35, p < .01). However,
hypothesis 6 was not supported (ß = .17, C.R. = 1.39, p = .29). In line with hypothesis 7,
results revealed that loneliness negatively affected positive mood state of older consumers (ß
= -.29, C.R. = -2.37, p < .05). Therefore, hypotheses 3 and 7 were supported, whereas
hypothesis 6 was not supported. Consumers’ perceived parasocial interaction, social
involvement, and loneliness explained 38% of the variance for positive mood state (R2 = .38).
Effects of parasocial interaction and social involvement on loneliness

60
Hypotheses 4 and 5 examined the effect of parasocial interaction and social
involvement on loneliness of older consumers.
H4. Perceived parasocial interaction has a negative effect on perceived loneliness of
older consumers.
H5. Perceived social involvement has a negative effect on perceived loneliness of
older consumers.
A statistically significant relationship between perceived parasocial interaction and
loneliness was not found (ß = -.09, C.R. = -1.30, p = .22). However, social involvement
negatively affected loneliness (ß = -.74, C.R. = -11.18, p < .01). Therefore, hypothesis 5 was
supported, whereas hypothesis 4 was not supported. Consumers’ perceived parasocial
interaction and social involvement explained 62% of the variance for perceived loneliness of
older consumers (R2 = .62).
Effects of parasocial interaction, and positive mood on social risk
Hypothesis 8 tested the relationship between positive mood state and perceived risk
involved in purchasing merchandise.
H8. Positive mood negatively affects perceived risk involved in purchasing
merchandise.
Positive mood state did not have a statistically significant negative effect on
perceived social risk (ß = -.02, C.R. = -.22, p = .84). Hence, hypothesis 8 was not supported.
As previously discussed, a significant path from parasocial interaction to social risk was
added to the empirical model. This path revealed a statistically significant negative
association between perceived level of parasocial interactions and social risk (ß = -.40, C.R.

61
= -4.05, p < .01). Positive mood state and perceived level of parasocial interactions
explained 17% of the variance for social risk (R2 = .17).
Effects of parasocial interaction, social risk and positive mood on impulse buying
Hypotheses 9 and 10 examined the effects of perceived risk and mood on impulse
buying tendency.
H9. Perceived risk associated with purchase of merchandise on television shopping
negatively affects impulse buying.
H10. Mood has a positive effect on impulse buying.
Results revealed that perceived social risk had a significant negative effect on impulse
buying tendencies (ß = -.24, C.R. = -2.73, p < .01), whereas there was no statistically
significant effect of positive mood state on impulse buying (ß = .06, C.R. = .62, p = .53).
Therefore, hypothesis 9 was supported and hypothesis 10 was not supported. Moreover, the
added path from parasocial interaction to impulse buying was statistically significant (ß = .40,
C.R. = 4.16, p < .01). Thirty-three percent of the consumers’ impulse buying tendency was
explained by social risk, positive mood state, and parasocial interaction (R2 = .33), although
positive mood was not a significant predictor.
Decomposition of Effects
Decomposition of direct, indirect, and total effects of predictor variables on
endogenous variables are found in Table 4.11. Direct effects refer to the hypothesized effects,
represented by the path arrows in Figure 4.1. An indirect effect reflects the influence of a
mediating variable on an endogenous variable. The total effect is the sum of the direct and
indirect effects of the predictor variables. The direct, indirect, and total effects of the
empirical model were presented in Table 4.11.

62
Persuasive strategies had no significant direct or indirect effect on any endogenous
variables, including parasocial interaction (ß = .15, p = .21). Parasocial interaction had a
significant direct effect on social involvement (ß = .44, p < .01). For loneliness, social
involvement had the largest significant direct and total effect on loneliness (ß = -.74, p < .01),
but parasocial interaction also had a statistically significant indirect effect on loneliness (ß = -
.33, p < .01).
For positive mood, parasocial interaction and loneliness had statistically significant
direct effects (ß = .28, p < .01; ß = -.29, p < .05, respectively). Parasocial interaction (ß = .20,
p < .01) and social involvement (ß = .22, p < .05) had statistically significant indirect effects.
Overall, parasocial interaction had the largest total effect on positive mood (ß = .48, p < .01).
This suggests that it is not only parasocial interaction that affects positive mood, but that the
effect of parasocial interaction was partially explained by mediating affects of social
involvement and loneliness.
For social risk, parasocial interaction only had a significant direct effect (ß = -.40, p
< .01) and total effect (ß = -.41, p < .01). For impulse buying, parasocial interaction and
social risk had significant direct effects on impulse buying (ß = .40, p < .01; ß = -.24, p < .01,
respectively). Parasocial interaction had a statistically significant indirect effect (ß = .13, p
< .05). Overall, parasocial interaction had the largest total effect on impulse buying (ß = .53,
p < .01).

63
Table 4.11. Decomposition of direct, indirect, and total effects for the empirical model
Predictor variables Parasocial interaction Social involvement
Indirect
effect
Direct
effect
Total
effect
Indirect
effect
Direct
effect
Total
effect
Persuasive strategies – .15 .15 .06 – .06
Parasocial
interaction – .44** .44**
Social involvement
Loneliness
Positive mood
Social risk
R2 .02 .19
Predictor variables Loneliness Positive mood
Indirect
effect
Direct
effect
Total
effect
Indirect
effect
Direct
effect
Total
effect
Persuasive strategies -.06 – -.06 .07 – .07
Parasocial
interaction -.33** -.09 -.41** .20** .28** .48**
Social involvement – -.74** -.74** .22* .17 .39**
Loneliness – -.29* -.29*
Positive mood
Social risk
R2 .62 .38

64
Table 4.11. (continued)
Predictor variables Social risk Impulse buying
Indirect
effect
Direct
effect
Total
effect
Indirect
effect
Direct
effect
Total
effect
Persuasive strategies -.06 – -.06 .08 – .08
Parasocial
interaction -.01 -.40** -.41** .13* .40** .53**
Social involvement -.01 – -.01 .02 – .02
Loneliness .01 – .01 -.02 – -.02
Positive mood – -.02 -.02 .01 .06 .06
Social risk – -.24** -.24**
R2 .17 .33
Notes: Standardized path estimates are reported with significant levels of direct effect. * p < .05. ** p < .01.

65
CHAPTER 5: DISCUSSION AND IMPLICATIONS
This study investigated the effects of persuasive strategies on perceived parasocial
interactions between the host and viewers, social involvement, loneliness, mood, perceived
risk and impulse buying tendency among older female shoppers in the television shopping
environment. The results of this study show the effects of parasocial interactions from
television shopping on older consumers subjective well-being (social involvement and
loneliness), their mood states, perceived social risk, and impulse buying behavior. This
chapter provides a summary of the findings, limitations, implications and recommendations
for future research.
Discussion
In this study, the host’s use of persuasive strategies was expected to directly affect
viewer’s perceived level of parasocial interaction with the host in the television home
shopping context. However, the effect of level of persuasive strategies on parasocial
interaction was not significant. This might be due to the characteristics of participants.
Parasocial interaction is defined as a viewer’s perceived relationship with a media personality
(Papa et al., 2000) and the relationship may be garnered over repeated exposure to television
home shopping hosts. In this study, only about 32% of the participants watched television
home shopping programs more than once a month, and about 51.9% of participants never
purchased from television home shopping programs. This suggests that the majority of the
participants did not have enough experience to perceive a relationship with television home
shopping hosts. Yet, the results indicated that parasocial interaction between hosts and
viewers significantly influence older consumers’ subjective well-being. Older consumers
with higher levels of parasocial interaction with television home shopping show hosts

66
believed they had higher levels of social involvement. This finding is consistent with Levy’s
(1979) findings, which showed parasocial interaction with a media personality had a positive
influence on older viewer’s perceived social involvement. Also consistent with previous
research (Johnson-Hillery & Kang, 1997), the present findings revealed that parasocial
interaction was associated with the positive mood state of older consumers. When older
people perceived higher parasocial interactions with the television home shopping host, they
reported being in a more positive mood.
Inconsistent with earlier findings (Levy, 1979; Rubin et al., 1985), a significant
negative association between parasocial interaction and loneliness was not found. Parasocial
interaction did not have a significant effect on loneliness, but social involvement did have a
significant effect on loneliness, which may have resulted in a mediating effect. Kraus, Davis,
Bazzini, Church, and Kirchman (1993) examined the effects of personal and social
interaction factors on loneliness, before/after controlling for the effect of social involvement.
They found the mediating effect of social involvement between personal and social
interactions and loneliness.
Inconsistent with previous research (Klumb, 2004; Lu, 1999), social involvement did
not enhance mood among older women, but loneliness had a significant negative effect on
positive mood. Again, a non-significant effect of social involvement on positive mood might
be due to the mediating effect of loneliness. Even though a significant direct effect of social
involvement on mood was not found, the results showed a significant indirect effect of social
involvement, which is mediated by loneliness, on mood. Several studies (Groothof, 2004;
Holmen, Ericsson, & Winblad, 1999) have found a negative relationship between loneliness
and a positive mood state. In particular, Holmen et al. (1999) found that loneliness had a
67
negative effect on the positive mood states of older individuals. Moreover, the results
showed that social involvement had a significant negative effect on loneliness among older
female television home shopping shoppers. This is consistent with Kim et al.’s (2005)
finding that older consumers, who had less social involvement, were likely to feel lonelier
than those who had greater social involvement. Yet, it is important to mention that Kim et al.
(2005) examined person-to-person relationships; whereas, this study focused on a viewer’s
perceived relationship with television home shopping hosts through the media.
The findings of the present study did not support the hypothesized negative
relationship between positive mood and perceived social risk of older consumers. Therefore,
the results are inconsistent with previous research, which found that consumers in positive
moods perceived less risk than those in negative moods in the on-line apparel shopping
environment (Park et al., 2005). As mentioned above, one reason for this might be the
characteristics of the study’s sample. Another reason could be a different concept of
perceived risk. This study captured consumers’ social risk, which is only one among four
dimensions: 1) financial, 2) functional, 3) social, and 4) time dimensions used in previous
research.
Social risk had a significant effect on impulse buying. This result supports Park and
Lennon’s (2004) finding that impulse buying increases when television shoppers feel less
risk associated with products. However, positive mood did not influence impulse buying,
which contradicts previous research (Rook & Gardner, 1993). This may result from the
characteristics of older consumers. Older consumers are likely to shop with specific
purposes; whereas, younger consumers are more likely to make impulse buying behavior in
response to mood (DeNora & Belcher, 2000).

68
The present study found two interesting associations between variables, which were
not hypothesized. First, there was a significant negative effect of parasocial interaction on
social risk. Dholakia (2001) mentioned that social risk increases when significant other
people have unfavorable opinions about a product. In the television home shopping
environment, if a viewer received a favorable opinion of the television home shopping host,
who is perceived as a friend through parasocial interaction, a viewer’s social risk would
decrease. Thus, television home shoppers, who formed parasocial interactions with hosts,
were less likely to perceive social risk of a product.
Second, a significant positive effect of parasocial interaction on impulse buying was
found. This supports Stephens et al.’s (1996) study, which analyzed conversations between
television home shopping hosts and viewers of QVC programs. In their study, television
home shopping hosts tried to create parasocial interactions with viewers, while selling
products, and viewers indicated their increased impulse buying experiences when television
home shopping hosts encouraged them to buy a product.
Limitation of the Study
The results of this study should be reviewed in the context of several limitations.
First, there is a limitation with respect to the study’s sample. Data were collected from not
only those who frequently shop from a television home shopping program, but also those
who watched a television home shopping program only once as part of the study.
Respondents who have never watched television home shopping programs were asked to
watch one of the television home shopping programs about 5 to 10 minutes and then
complete the survey. Length of exposure to home shopping programs may influence effects
proposed in the present study. Those who have previous experience with television home

69
shopping may have higher levels of parasocial interaction with hosts than those who have
watched a television home shopping program only once. This difference might also
influence other variables such as older consumers subjective well-being (social involvement
and loneliness), their mood states, perceived social risk, and impulse buying behavior.
Second, respondents were asked to think of the situation when they watch television
home shopping programs. For example, the item “when watching television shopping
programs, I feel a lack of companionship” was used to capture respondents’ feelings about
the television home shopping programs they usually watch. Thus, the respondents had to
depend on memory when they answered the questions. In particular, because mood is
temporal, it may not be accurately recalled from memory.
Third, one of the limitations is related to the measure of persuasive strategies.
Because no existing scale was found, I developed a fourteen-item scale for four of the six
persuasive strategies proposed by Cialdini (1993). Based on factor analysis, six items (three
social proof items and three scarcity items) capturing only two of the four persuasive strategy
constructs, were used for this study. Whereas, the scale had internal consistency with a
Cronbach’s alpha of .88, tests of validity were not performed before its usage in the present
study. Thus, it is possible that a better measure of persuasive strategies should be developed.
Implications and Future Research
Several recommendations for television home shopping retailers and future research
are suggested, based on this study. Television shopping has shown remarkable growth
during the past few years and has reached a mature stage in terms of market size and sales
volume. In this stage, it is important to maintain a relationship with previous customers as
well as to encourage new customers to watch television home shopping programs. Results of

70
this study revealed the importance of parasocial interaction between hosts and viewers in the
television home shopping context. The effects of perceived parasocial interaction with the
hosts could be bolstered through live experiences, such as actually meeting favorite hosts
during promotional tours. The television home shopping industry should further strengthen
parasocial interactions through various marketing efforts. For example, if the hosts offer
products that reflect issues important to the demographic, such as a line of apparel with a
portion of profits supporting women’s breast cancer or heart disease research, it may
strengthen customers’ perceived parasocial interaction and increase sales. At present, older
women are more likely to shop via television shopping programs than younger consumers.
To extend their consumer base, perhaps hosts popular among younger consumers and
promoted on websites and TV channels attractive to these younger consumers could attract a
new audience. In addition, new program formats using technology popular among these
consumers, such as iPods and cell phones, could be explored.
The present study does not support research, which found persuasive strategies to
have a significant impact on parasocial interaction. Future research may explore the reason
for the differences in results. For instance, past research focused on one persuasive strategy,
scarcity (Cialdini, 1984). The present study captured two persuasive strategies—social proof
and scarcity. Perhaps the effect of scarcity is diluted when other persuasive strategies are
added for certain product categories or used with certain target markets.
Parasocial interactions between hosts and viewers may enhance older consumers’
subjective well-being, which is enhanced by social activity (Smith & Moschis, 1985). This
study focused on older consumers’ subjective well-being and found a significant effect of
parasocial interaction on social involvement. Older people may perceive a host to be a friend

71
through parasocial interaction leading to an increase in social involvement. Future studies
may examine this effect among consumers with different levels of disposable income. Are
those who are able to act on the advice of the host (i.e., purchase products) more likely to
experience positive effects due to parasocial interactions; whereas, those who are not able to
fully participate through the purchase of products more likely to experience a diminished
sense of social involvement, decreased mood, and increased loneliness?
The present study focused impulse buying behavior of middle-aging and older
consumers. However, older consumers are likely to shop with specific purposes; whereas
younger consumers are more likely to make an impulse purchase in response to mood
(DeNora & Belcher, 2000). Future studies may examine other shopping response variables
such as purchase intention, rather than impulse buying behavior.

72
APPENDIX A: IRB APPROVAL

73

74
APPENDIX B: COVER SHEET

75
IOWA STATE UNIVERSITY OF SCIENCE AND TECHNOLOGY
Dear Participant:
We would like to invite you to participate in research about older women’s shopping behavior toward television home shopping. We want to know your thoughts about personal selling approaches used by television shopping show hosts.
Due to the strong population growth of people above 55 years of age in the U.S., shopping behavior of older persons has been a major interest to marketers. In addition, television home shopping networks have also increased their audiences. During the television home shopping show, the host uses various personal selling approaches to evoke viewers' loyalty level. Knowledge of how the personal selling approach influences the loyalty of shoppers can provide strategic information for a broad range of practitioners such as television home shopping marketers, hosts, and advertisers. The purpose of this study is to examine television home shopping shows and the effects of interaction between the host and viewers in the television shopping environment, focusing on older female television home shoppers.
Your individual responses will be kept in strict confidence. Your names will not be attached to any responses you give. Results will be published in summary form only. There are no foreseeable risks from participating in this study. We are very appreciative of your participation in our study. No monetary compensation will be allocated for doing so; however, you will be offered some chocolates and candies as a token of our appreciation.
Your participation in this study is completely voluntary. You may discontinue participation at any time without recrimination from the researcher or Iowa State University. Also, you may skip any question you do not feel comfortable answering in the survey. The questionnaire will take no more than 15 minutes of your time. We greatly appreciate your participation. You will be asked your perception about the use of hosts as a persuasive strategy in television home shopping shows, the interaction with the hosts, social involvement, loneliness, mood, risk, and your loyalty to television home shopping networks.
You are encouraged to ask questions at any time during this study. For further information about the study contact Minsun Lee, e-mail address: [email protected], phone: 515-520-0429 or the major advisor for the study: Mary Lynn Damhorst, [email protected], 515-294-9919. If you have any questions about the rights of research subjects or research-related injury, please contact the IRB Administrator, (515) 294-4566, [email protected], or Director, (515) 294-3115, Office of Research Assurances, Iowa State University, Ames, Iowa 50011.
Sincerely,

76
Minsun Lee Master Student Apparel, Educational Studies, & Hospitality Management E016 Lagomarcino Hall Iowa State University Ames, IA 50011-1102 Phone: 515-520-0429 E-mail: [email protected]
Mary Lynn Damhorst, Ph.D. Associate Professor Apparel, Educational Studies, & Hospitality Management 1068 Le Baron Hall Iowa State University Ames, IA 50011-1102 Phone: 515-294-9919 E-mail:[email protected]
************************************************************************
PARTICIPANTS SIGNATURE
Your signature indicates that you voluntarily agree to participate in this study, that the
study has been explained to you, that you have been given the time to read the document, and
that your questions have been satisfactorily answered.
Participant’s Name (printed) (Participant’s Signature) (Date) ************************************************************************
INVESTIGATOR STATEMENT
I certify that the participant has been given adequate time to read and learn about the study and all of their questions have been answered. It is my opinion that the participant understands the purpose, risks, benefits and the procedures that will be followed in this study and has voluntarily agreed to participate. (Signature of Person Obtaining (Date) Informed Consent)

77
APPENDIX C: THE MAIN QUESTIONNAIRE

78
TV Home Shopping Behavior Survey ID# .
Female television shoppers aged 55 and over should complete this survey. I am interested in your feelings about television home shopping as well as your shopping behaviors through television home shopping. This survey takes approximately 15 minutes to complete.
NOTE: This survey is composed of two parts. Please THINK ABOUT THE TELEVISION SHOPPING PROGRAM YOU USUALLY WATCH when you answer the following questions.
Part I. The questions below ask about YOUR FEELINGS ABOUT THE TELEVISION HOME SHOPPING PROGRAMS YOU USUALLY WATCH. Please complete the questions by circling one number for each statement.
Instructions: Please respond to each statement by circling one number from 1 to 5 that most closely corresponds to your position. (1=Strongly Disagree. . . 5=Strongly Agree). NOTE: Please THINK ABOUT THE TV SHOPPING SHOW HOSTS YOU USUALLY WATCH. Strongly
Disagree Neutral
Strongly Agree
1. The hosts inform the viewer that the product they are selling is one of the best sellers.
1 2 3 4 5
2. The hosts explain the level of popularity of the product.
1 2 3 4 5
3. The hosts inform me that an item that was popular in a past show is now available for purchase.
1 2 3 4 5
4. The hosts feel like my friends. 1 2 3 4 5
5. The hosts have the same preferences or same concerns as me.
1 2 3 4 5
6. The hosts praise me when I make a purchase from the show.
1 2 3 4 5
7. The hosts encourage me to watch, purchase, or contact the program/host again.
1 2 3 4 5
8. The hosts agree with what I think. 1 2 3 4 5
9. The hosts appear knowledgeable about the product.
1 2 3 4 5
10. The hosts introduce a designer/expert who co-hosts the show with them.
1 2 3 4 5

79
Strongly Disagree
Neutral Strongly Agree
11. The hosts inform me how the name brands on their show are reliable.
1 2 3 4 5
12. The hosts mention that there are a limited number of the products left.
1 2 3 4 5
13. The hosts tell me that the product is almost sold out.
1 2 3 4 5
14. The hosts mention that this is last chance for me to purchase a product.
1 2 3 4 5
Strongly
Disagree Neutral
Strongly Agree
1. The hosts are almost like friends I see everyday. 1 2 3 4 5
2. I like hearing the voices of the hosts in my home. 1 2 3 4 5
3.
When the hosts show how they feel about the product, it helps me make up my mind about the product.
1 2 3 4 5
4. I like to compare my feelings for the product with what the hosts say about it. 1 2 3 4 5
5. When the hosts joke around with each other, it makes the program even more enjoyable. 1 2 3 4 5
6. The hosts show me what people in the media are really like. 1 2 3 4 5
7. I feel sorry for the hosts when they make mistakes. 1 2 3 4 5
Instructions: Please respond to each statement by circling one number from 1 to 4 that most closely corresponds to your position. (1=Never. . . 4=Always).
When watching television shopping programs…..
Never Rarely Sometimes Always
1. I feel lack of companionship? 1 2 3 4
2. I feel I have a lot in common with other people?
1 2 3 4

80
When watching television shopping programs…..
Never Rarely Sometimes Always
3. I feel close to people? 1 2 3 4
4. I feel left out? 1 2 3 4
5. How often do you feel that no one really knows you well?
1 2 3 4
6. I feel isolated from others? 1 2 3 4
7. I feel there are people who really understand me?
1 2 3 4
8. I feel that people are around me but not with me?
1 2 3 4
9. I feel there are people I can talk to? 1 2 3 4
10. I feel there are people I can turn to? 1 2 3 4
Instructions: Please respond to each statement by circling one number from 1 to 5 that most closely corresponds to your position. (1=Strongly Disagree. . . 4=Strongly Agree)
When watching television shopping programs…..
Strongly Disagree
Disagree Agree Strongly Agree
1. I believe I do not have close personal relationships with other people.
1 2 3 4
2. I believe there are people who depend on me for help.
1 2 3 4

81
When watching television shopping programs…..
Never Rarely Sometimes Always
3. I feel part of the group of people who share my attitudes and beliefs.
1 2 3 4
4. I believe I have close relationships that provide me with a sense of emotional security and well-being.
1 2 3 4
5. I believe there is no one who shares my interests and concerns.
1 2 3 4
6. I feel a strong emotional bond with at least one other person.
1 2 3 4
7. I lack a feeling of intimacy with another person.
1 2 3 4
8. I believe there is no one who likes to do the things I do.
1 2 3 4
Instructions: In answering the following questions, think about your feelings WHEN YOU WATCH TELEVISION SHOPPING PROGRAMS. Please indicate how strongly you feel by circling one number provided for each word. Not at all Slightly Moderately Considerably
Very Strongly
1. Discouraged 1 2 3 4 5
2. Happy 1 2 3 4 5
3. Sad 1 2 3 4 5
4. Delighted 1 2 3 4 5
5. Downhearted 1 2 3 4 5
6. Joyful 1 2 3 4 5

82
Instructions: Please indicate the extent to which you agree with the following statements by circling one number provided for each statement. Strongly
Disagree Neutral
Strongly Agree
1. Products purchased from TV home shopping programs will not be the same as shown on TV. 1 2 3 4 5
2. Products purchased from TV home shopping programs will not be in fashion. 1 2 3 4 5
3. Products purchased from TV home shopping programs will not fit. 1 2 3 4 5
4. Products purchased from TV home shopping programs will not fit into my existing wardrobe. 1 2 3 4 5
5. Products purchased from TV home shopping programs may be unsatisfactory. 1 2 3 4 5
6. It may be difficult to return products purchased from TV home shopping programs. 1 2 3 4 5
7. I am willing to buy products from TV home shopping programs. 1 2 3 4 5
8.
The assortment of products on TV home shopping programs is competitive with store apparel.
1 2 3 4 5
9. Time is important to me. 1 2 3 4 5
10. It may take a long time to get products from TV home shopping programs. 1 2 3 4 5
11. TV home shopping purchase leads to time loss because of delivery and shipping time. 1 2 3 4 5
12. I prefer to look around several stores before purchasing. 1 2 3 4 5
13.
There is a possibility of a small financial loss due to higher prices of products from the TV home shopping programs.
1 2 3 4 5

83
Strongly Disagree
Neutral Strongly Agree
14. Financial loss is important to me. 1 2 3 4 5
15.
Prices of product from TV home shopping programs are competitive with those of store products.
1 2 3 4 5
16. It may be difficult to get money back when ordering from a TV home shopping program. 1 2 3 4 5
Instructions: Please indicate the degree to which the following statements describe your behavior when you are watching TV home shopping programs. Please respond to each statement by circling one number from 1 to 7 that most closely corresponds to your position. Strongly
disagree Neutral Strongly
agree
1. Even when I see something I really like, I do not buy it unless it is a planned purchase.
1 2 3 4 5 6 7
2. When I watch TV shopping shows, I buy things I had not intended to purchase.
1 2 3 4 5 6 7
3. I am not willing to buy things from TV shopping show that are not on my shopping list.
1 2 3 4 5 6 7
4. It is fun to buy spontaneously from TV shopping show.
1 2 3 4 5 6 7
5. I do not buy until I can make sure TV shopping show is offering a real bargain.
1 2 3 4 5 6 7
6. If TV shopping show introduces something new that really interests me, I buy it right away just to see what it is like.
1 2 3 4 5 6 7
7. I may buy things from TV shopping show without hesitation if I like them when I first see them.
1 2 3 4 5 6 7
8. If TV shopping show introduces something new I really want, I purchase it immediately, even if I had not planned to buy it.
1 2 3 4 5 6 7
9. I can make unplanned purchases from TV shopping show.
1 2 3 4 5 6 7
10. If TV shopping show introduces something that really interests me, I buy it without considering the consequences.
1 2 3 4 5 6 7

84
Instructions: Please indicate the extent to which you agree with the following statements by circling one number provided for each statement.
If I were actually shopping for products, I would…..
Strongly disagree
Neutral Strongly agree
1. ……be willing to buy products through the home shopping channel.
1 2 3 4 5 6 7
2. ……likely visit a real store to buy a product I have seen on the home shopping channel.
1 2 3 4 5 6 7
3. …..visit a home shopping channel in the hopes of purchase a product.
1 2 3 4 5 6 7
Part II. General Background Information. Please check or fill in the appropriate information.
1. What is your age? ___________
2. What is your ethnicity? Please CHECK ONE.
Asian American Black or African-American Hispanic or Latino American
Native American Native Hawaiian or Pacific Islander White or European
Two or more races Other (Please specify)
3. What is your CURRENT marital status? CHECK ONE.
Never married _______ Married Widowed Separated Divorced Other
4. What is your CURRENT work status? Please CHECK ONE.
Working full time Working part time Retired Never worked outside the home
5. How do you feel about your health? Please CHECK ONE. Very poor Poor Fair _________ Good __________ Excellent
6. What is your annual household income before taxes and other reductions? Check one.
Less than $25,000 $25,000-$49,999 $50,000-$74,999
$75,000-$99,999 Over $100,000
7. What do you think about your financial status?
Excellent Good Fair
Poor Very poor

85
8. In which county do you CURRENTLY live?
County and State Name (Please list):
Zip code
9. What is the highest level of formal education you have completed? Please CHECK ONE answer.
Less than High School Graduate High School Diploma or GED certificate Some college or technical school
Associate degree College degree Graduate, or professional degree
10.
11.
Do you have a driver’s license? Yes No Do you CURRENTLY drive your own vehicle? Yes No
12. How often do you watch television home shopping programs?
Less than once a month 1 to 2 times a month Once a week 2 to 3 times a week Everyday
13. How often do you actually buy products from television home shopping? Never bought from TV shopping Less than once a year 1 to 2 times a year 3 to 4 times a year 5 to 6 times a year More than once a month
14. Please list television home shopping channels you have watched (e.g., HSN, QVC, etc.)
15. Please check all which products you have bought from television home shopping channels. Apparel Bedding Cosmetics Decoration items Food Electronics Home improvement Jewelry Kitchen appliances Shoes Other None of these
Thank you very much for your time. Please give this survey to the researcher. If you would like a copy of the results summary, please provide Min Sun Lee your name and address. Minsun Lee, Graduate Student Textiles and Clothing Program, Iowa State University E016 Lagomarcino Ames, IA. Phone: (515) 294-1941 Email: [email protected]

86
APPENDIX D: INVITATION FLYER
87
Television Home Shopper Survey
My name is Minsun Lee. I am working on my Master’s degree in Textiles and Clothing at Iowa State University. I am really interested in understanding how the media is used by women between the ages of 55 and over, and I am asking for your assistance. To complete my thesis, I will be collecting data from women aged over 55 who are television home shoppers. Television home shopper means those who have watched television home shopping programs, such as HSN and QVC, more than once. If you match that description, I would like to invite you to participate in a survey tapping your opinions regarding television home shopping. Even through you have never watched television home shopping program, you can still participate in this survey. Just watch one of television home shopping about 5 to 10 minutes, and then complete the survey. The survey will take about 15 minutes of your time. If you are female, aged over 55, and willing to participate in this survey, PLEASE COMPLETE A SURVEY. After you fill out all questions through the survey PLEASE PLACE IT IN THE RETURN ENVELOPE AND SEND IT BACK. Your participation in my project is very important to me and my research. All information is strictly confidential and voluntary. If you have questions, I can send more information about my survey in detail. Please contact me via e-mail address: [email protected] or phone: 515-520-0429, anytime. Thank you for your time,

88
REFERENCES
Adams, K.B., Sanders, S., & Auth, E. A. (2004). Loneliness and depression in independent
living retirement communities: risk and resilience factors. Aging & Mental Health,
8(6), 475-485. Ahern, K. D. (1996). The older woman: The able self. New York:Garland. Andrade, E. B. (2005). Behavioral consequences of affect: Combining evaluative and
regulatory mechanisms. Journal of Consumer Research, 32(3), 355-362. Arjun, C. (1997). Consumption emotion and perceived risk: A macro-analytic approach.
Journal of Business Research, 39(2), 81-92. Auter, P. J., & Moore, R. L. (1993). Buying from a friend: A content analysis of two
teleshopping programs. Journalism Quarterly, 70(2), 425-436. Bagozzi, R. P., Gopinath, M., & Nyer, P. U. (1999). The role of emotions in marketing.
Journal of the Academy of Marketing Science, 27(2), 184-206. Bower, G. H. (1981). Mood and memory. American Psychologist, 36(2), 129-148. Brandstatter, H., & Eliasz, A. (Eds.). (2001). Persons, situations, and emotions: An
ecological approach. New York:Oxford University. Braus, P. (1990). What is good service?. American Demographics, 12(7), 36-39. Browne, M.W., & Cudeck, R. (1993). Alternative ways of assessing model fiIt. In K. A. Bollen & J.
S. Long (Eds.), Testing structural equations models (pp. 136–162). Newbury Park, CA: Sage.
Burgess, B. (2003). A comparison of TV home shoppers based on risk perception. Journal of
Fashion Marketing and Management, 7(3), 259-271. Cattan, M., White, M., Bond, J., & Learmouth, A. (2005). Preventing social isolation and
loneliness among older people: A systematic review of health promotion interventions. Aging & Society, 25(1), 41-67.
Cialdini, R. B. (1984). Principles of Automatic Influence. In J. Jacoby & C. S. Craig (Eds.),
Personal Selling. (pp. 1-28). Lexington, MA:Lexington Books. Cialdini, R. B. (1993). Influence: Science and practice (3rd ed.). New York:Harper Collins
College.
89
Cialdini, R. B., & Goldstein, N. J. (2002). The science and practice of persuasion. Cornell
Hotel and Restaurant Administration Quarterly, 43(2), 40-50. Clark, M. S. & Isen, A. M. (1982). Toward understanding the relationship between feeling
states and social behavior. In A. H. Hastrof & A. M. Isen (Eds.), Cognitive Social
Psychology (pp. 73-108). New York, NY: Elsevier North Holland. Conway, J. C., & Rubin, A. M. (1991). Psychological predictors of television viewing
motivation. Communication Research, 18(4), 443-463. Costello, A. B., & Osborne, J (2005). Best practices in exploratory factor analysis: four
recommendations for getting the most from your analysis. Practical Assessment
Research and Evaluation,10(7), 1-9. Cox, D. F., & Rich, S. U. (1964). Perceived risk and consumer decision-making: The case of
telephone shopping. Journal of Marketing Research, 1, 32-39. Cutrona, C. E., & Russell, D. (1987). The provisions of social relationships and adaptation to
stress. Advances in Personal Relationships, 1, 37-67. Das, S., Echambadi, R., McCardle, M., & Luckett, M. (2003). The effect of interpersonal
trust, need for cognition, and social loneliness on shopping, information seeking and surfing on the web. Marketing Letters, 14(3), 185-202.
Davis, L. (2001). Establishing online store loyalty: The role of atmospherics and pleasure in
creating online store loyalty. Unpublished doctoral dissertation, University of Cincinnati, Cincinnati.
De Nora, T., & Belcher, S. (2000). When you're trying something on you picture yourself in a place
where they are playing this kind of music-musically sponsored agency in the British clothing
retail sector. Sociological Review, 80-101. Dholakia, U. M. (2001) A motivational process model of product involvement and consumer
risk perception. European Journal of Marketing, 35(11/12), 1340-1360. Diener, E. (2000). Subjective well-being. American Psychologist, 55(1), 34-43. Diener, E., Suh, E. M., Lucah, R. E., & Smith, H. L. (1999). Subjective well-being: Three
decades of progress. Psychological Bulletin, 125(2), 276-302. Dillard, J. P., & Pfau, M. (2002). The persuasion handbook: Developments in theory and
practice. Thousand Oaks, CA:Sage Publication.

90
Eastlick, M. A., & Feinberg, R. A. (1995). Differences in attitudes toward catalog retailers of apparel among social/economic risk orientation groups. Clothing and Textiles
Research Journal, 13(4), 220-226. Economist (1996). Home alone? The Economist, 12, 70. Fritchie, L. L., & Johnson, K. K. P. (2003). Personal selling approaches used in television
shopping. Journal of Fashion Marketing and Management, 7(3), 249-258. Gaal, B., & Burns, L. D. (2005). Apparel descriptions in catalogs and perceived risk
associated with catalog purchases. Clothing and Textiles Research Journal, 19(1), 22- 30.
Gardner, M. P. (1985). Mood states and consumer behavior: a critical review. Journal of
Consumer Research, 12(3), 281-300. Gibson, H. B. (2000). Loneliness in later life. New York:St. Martins. Gore, S., Aseltine, R. H. Jr., Colten, M. E. (1993). Gender, social-relational involvement, and
depression. Journal of research on adolescence, 3(2), 101-125. Gorn, G. J., Goldberg, M. E., & Basu, K. (1993). Mood, awareness, and product evaluation.
Journal of Consumer Psychology, 2(3), 237-256. Grant, A. E., Guthrie, K. K., & Ball-Rokeach, S. J. (1991). Television Shopping: A media
system dependency perspective. Communication Research, 18(6), 773-798. Groothof, H. A. K. (2004). When others are doing better or worse: Responses from the heart
and the head. Retrieved April 18, 2006, from University of Groningen: http://dissertations.ub.rug.nl/FILES/faculties/ppsw/2004/h.a.k.groothof/thesis.pdf
Habib, R. R., Zohry, A., Nuwayhid, I., & Najdi, F. (2006). Older adults in the division of
domestic labor in communities on the outskirts of Beirut. European Journal of
Ageing, 3(3), 137-145. Han, Y. K., Morgan, G. A., Kotsiopulos, A., & Kang-Park, J. (1991). Impulse buying
behavior of apparel purchasers. Clothing and Textiles Research Journal, 9(3), 15-21. Hair, J. F., Anderson, R. E., Tatham, R. L., & Black, W. C. (1998). Multivariate data
analysis (5th ed.). Upper Saddle River, NJ: Prentice-Hall. Hildreth, G., & Kelly, E. (1984-85). Family expenditures before and after retirement: A
research model for measuring priorities. International Journal of Aging and Human
Development, 20(2), 145-159.

91
Holmen, K., Ericsson, K., & Winblad, B. (1999). Quality of life among the elderly. Scan J
Caring Sci, 13(2), 91-95. Horley, J., & Lavery, J. J. (1994). Subjective well-being and age. Social Indicators Research,
34, 275-282. HSN company information. Retrieved January 24, 2006, from
http://www.hsn.com/corp/info/default.aspx?aid=3666 Izard, C. E. (1972). Patterns of emotions: A new analysis of anxiety and depression.
New York:Academic Press. Jackson, H. O. (1992). Aging and expenditures on apparel. Clothing and Textile Research
Journal, 10(2), 24-28. Jackson, H. O., & O’Neal, G. S. (1994). Dress and appearance responses to perceptions of
aging. Clothing and Textiles Research Journal, 12(4), 8-15. Jaramillo, F., & Marshall, G. W. (2004). Critical success factors in the personal selling
process. The International Journal of Bank Marketing, 22(1), 9-25. Jasper, C. R., & Ouellette, S. J. (1994). Consumers’ perception of risk and the purchase of
apparel from catalogs. Journal of Direct Marketing, 8(2), 23-36. John-Hillery, J., & Kang, J. (1997). Elderly consumers and retail sales personnel. New
York:Garland. Joung, H. (2002). Older female (55+) consumers’ apparel shopping and life satisfaction: An
application of activity theory. Unpublished doctoral dissertation, Iowa State University, Ames.
Kaiser, S. B., & Chandler, J. L. (1984). Fashion alienation: Older adults and the mass media.
International Journal of Aging and Human Development, 19(3), 203-221. Kang, Y. S., & Ridgway, N. M. (1996). The importance of consumer market interactions as a
form of social support for elderly consumers. Journal of Public Policy &
Marketing,15(1), 108-117. Kim, M., & Lennon, S. J. (2000). Television shopping for apparel in the United States:
Effects of perceived amount of information on perceived risks and purchase intentions. Family and Consumer Sciences Research Journal, 28(3), 301-330.
Kim, Y., Kang, J., & Kim, M. (2005). The relationships among family and social interaction,
loneliness, mall shopping motivation, and mall spending of older consumers. Psychology & Marketing, 22(12), 995-1015.

92
Klumb, P. L. (2004). Benefits from productive and consumptive activities: Results from the
Berlin aging study. Social Indicators Research, 67(1/2), 107. Kostrunek, S. (2005). Find strength in numbers: Sell to women 50 and over. National
Underwriter. Life & Health, 31, 16. Kwon, Y., Paek, S. L., & Arzeni, M. (1991). Catalog vs non-catalog shoppers of apparel:
Perceived risks, shopping orientations, demographics, and motivations. Clothing and
Textiles Research Journal, 10(1), 13-19. Lee, J., & Geistfeld, L. (1999). Elderly consumers’ receptiveness to telemarketing fraud.
Journal of Public Policy & Marketing, 18(2), 208-217. Lennon, S. J., & Sanik, M. M. (2003). Compulsive buying, parasocial interaction, and
television shoppers. ITAA Proceedings, #60. Levy, M. R. (1979). Watching TV news as para-social interaction. Journal of Broadcasting,
23(1), 69-80. Lu, L. (1999). Personal or environmental causes of happiness: A longitudinal analysis.
Journal of Social Psychology, 139(1), 79-90. Manthorpe, J. (October 2005-April 2006). Older people. Research Matters, 20, 33-38. Martin, W. K., Weun, S., & Beatty, S. (1993). Validation of an impulse tendency scale, Paper
presented at the Association of Consumer Research conference, Nashville, TN. McCorkle, D. E. (1990). The role of perceived risk in mail order catalog shopping. Journal of
Direct Marketing, 4(4), 26-35. McDonald, W. J. (1995). Home shopping channel customer segments: A cross-cultural
perspective. Journal of Direct Marketing, 9(4), 57-67. Michman, R. D., Mazze, E. M., & Greco, A. J. (2003). Lifestyle marketing.
Westport:Greenwood. Mick D. G. (1996). Are studies of dark side variables confounded by socially desirable
responding? The case of materialism. Journal of Consumer Research, 23(2), 106-129. Moschis, G. P. (1996). Life stages of the mature market. American Demographics, 50, 44-47. Neugarten, B. L., Havighurst, R. J., & Tobin, S. S. (1961). The measurement of life
satisfaction. Journal of Gerontology, 16, 134-143.

93
Neugarten, B., & Neugarten, D. (1986). Changing meanings of age in the aging society. In A. Pifer & L. Bronte (Eds.), Our aging society: Paradox and promise (pp. 33-51). New York, NY:Norton.
Nordlund, J. (1978). Media interaction. Communication Research, 5(2), 150-175. Nummelin, J. (2005). Business potential in senior services. International Journal of Strategic
Property Management, 9(3), 191-200. Nunnally, J. (1978). Psychometric theory. McGraw-Hill, New York, NY. O’Bannon, P. B., Feather, B. L., Vann, J. W., & Dillard, B. G. (1988). Perceived risk and
information sources used by wheelchair-bound consumers in clothing purchase decisions. Clothing and Textiles Research Journal, 7(1), 15-22.
Parker, E. (June 27, 2007). There’s no place like home shopping. In Daily News. Retrieved April 15,
2008, from http://www.nydailynews.com/lifestyle/2007/06/25/2007-06-25_theres_no_place_like_home_shopping.html
Park, J. H., & Lennon, S. J. (2004). Television apparel shopping: Impulse buying and
parasocial interaction. Clothing and Textiles Research Journal, 22(3), 135-144. Park J. H., Lennon, S. J., & Stoel, L. (2005). On-line product presentation: Effects on mood,
perceived risk, and purchase intention. Psychology & Marketing, 22(9), 695-719. Park, J. H., & O’Neal, G. S. (2000). Factors and post-purchase evaluation of apparel impulse
buying. ITAA Proceedings, #57. Papa, M. J., Singhal, A., Law, S., Pant, S., Sood, S., Rogers, E. M., & Shefner-Rogers, C. L.
(2000). Entertainment-education and social change: An analysis of parasocial interaction, social learning, collective efficacy, and paradoxical communication. Journal of Communication, 50(4), 31-55.
Perlman, D. & Landolt, M. A. (1999). Examination of loneliness in children-adolescents and
in adults: Two solitudes or unified enterprise? In K. J. Rotenberg & H. Shelley (Eds.), Loneliness in childhood and adolescence (pp. 325-347). Cambridge, UK:Cambridge University.
QVC business overview. Retrieved January 27, 2006, from
http://www.qvc.com/asp/frameset.asp?dd=nav/navhqwel.html&nest=/mainhqpress.html?tmp=hp&cont=mi&cm_re=HP-_-INFO-_-PRESSROOM

94
QVC corporate facts. Retrieved January 27, 2006, from http://www.qvc.com/asp/frameset.asp?dd=nav/navhqwel.html&nest=/mainhqpress.html?tmp=hp&cont=mi&cm_re=HP-_-INFO-_-PRESSROOM
QVC corporate facts. Retrieved April 19, 2008, from
http://www.qvc.com/qic/qvcapp.aspx/app.html/params.file.%7Ccp%7Cmainhqabout,html/left.html.file.%7Cnav%7Cnavhqabout,html/walk.html.%7Cnav%7Cnavhqabout,html
QVC international business. Retrieved April 18, 2006, from
http://www.qvc.com/asp/frameset.asp?dd=/nav/navhqabout.html&nest=/mainhqabout.html&cp=sitemap&cm_re=HP-_-SITEMAP-_-CORPORATE:ABOUTQVC
Rahtz, D. R., Sirgy, M. J., & Meadow, H. L. (1989). The elderly audience: Correlates of
television orientation. Journal of Advertising, 18(3), 9-20. Reinecke, J. (1976). Expenditure of two-person units and individuals after age 55. In F. E.
Waddell (Eds.), The elderly consumer (pp. 83-107). Columbia, MD:Antioch College. Rokach, A. (2004). Loneliness then and now: reflections on social and emotional alienation
in everyday life. Current psychology: developmental Learning Personality Social,
23(1), 24-40. Rook, D. W. (1987). The buying impulse. Journal of Consumer Research, 14, 189-199. Rook, D. W., & Fisher, R. J. (1995). Normative influences on impulsive buying behavior.
Journal of Consumer Research, 22(3), 305-313. Rook, D. W., & Gardener, M. P. (1993). In the mood: Impulse buyings’ affective antecedents.
Research in Consumer Behavior, 6, 1-28. Rubin, A. M. Perse, E. M., & Powell, R. A. (1985). Loneliness, parasocial interaction, and
local television news viewing. Human Communication Research, 12(2), 155-180. Rubin, D. B. (1987). Multiple Imputation for Nonresponse in Surveys. J. Wiley & Sons, New York. Russell, D. W. (1996). UCLA loneliness scale (version 3): Reliability, validity, and factor
structure. Journal of Personality Assessment, 66(1), 20-40. Russell, D. W., Cutrona, C. E., Mora, A., & Wallace, R. B. (1997). Loneliness and nursing
home admission among rural older adults. Psychology and Aging, 12(4), 574-589. Schafer, J. L. & Olsen, M. K. (1998). Multiple imputation for multivariate missing-data problems: a data analyst’s perspective. Multivariate Behavioral Research, 33(4), 545-571.

95
Schiffman, L. G. (1972). Perceived risk in new product trial by elderly consumers. Journal of
Marketing Research, 9(1), 106-108. Schumacher, R. E. & Lomax, R. G. (1996). Abeginner’s guide to structural equation
modeling. Lawrence Erlbaum Associates, Mahwah, NJ. Schwarz, N., & Clore, G. L. (1983). Mood, misattribution, and judgments of well-being:
Informative and directive functions of affective states. Journal of Personality and
Social Psychology, 45(3), 513-523. Scott, C. A. (1976). The effects of trial and incentives on repeat purchase behavior. Journal
of Marketing Research, 13, 263-269. Seepersad, S. S. (1997). Analysis of the relationship between loneliness, coping strategies
and the Internet. Unpublished master’s thesis, University of Illinois, Urbana- Champaign.
Shim, S., & Bickle, M. C. (1993). Women 55 years and older as catalog shoppers:
Satisfaction with apparel fit and catalog attributes. Clothing and Textiles Research
Journal, 11(4), 53-64. Shin, C. Y., Lee, S. H., Bae, K., & Noh, Y. (2003). Compulsive shopping behavior among
internet shoppers. ITAA Proceedings, #60. Shopping by television. (1995, January). Consumer Reports, 8-9, 11-12. Skumanich, S. A., & Kintsfather, D. P. (1998). Individual media dependency relations within
television shopping programming. Communication Research, 25(2), 200-219. Slater, L., Daniel, J. H., & Banks, A. E. (Eds.). (2003). The complete guide to mental health
for women. Boston:Beacon. Slovic, P., Finucane, M. L., Peters, E., & MacGregor, D. G. (2004). Risk as analysis and risk
as feelings: some thoughts about affect, reason, risk, and rationality. Risk Analysis,
24(2), 311-322. Smith, R. B., & Moschis, G. P. (1985). A socialization perspective on selected consumer
characteristics of the elderly. The Journal of Consumer Affairs, 19(1), 74-95. Solomon, B. (1994). TV shopping comes of age. Management Review, 83(9), 22-26. Solomon, M.R., & Rabolt, N. J. (2004). Consumer behavior in fashion. New Jersey:Prentice
Hall.

96
Stanforth, N. F., Lennon, S. J., & Moore, S. (2000). Perceived risk and purchase intent associated with television shopping. Frontiers in Direct and Interactive Marketing
Research Proceedings, 3, 53-64. Stephens, D. L., Hill, R. P., & Bergman, K. (1996). Enhancing the consumer-product
relationship lessons from the QVC home shopping channel. Journal of Business
Research, 37(3), 193-200. Tauber. E. M. (1972). Why do people shop? Journal of Marketing, 36(1), 46-49. Townsend, P. (1973). Isolation and loneliness in the aged. In R. S. Weiss (Eds.),
Loneliness: The experience of emotional and social isolation (pp. 175-188). Cambridge, MA:MIT.
Tsiros, M., & Heilman, C. M. (2005). The effect of expiration dates and perceived risk on
purchasing behavior in grocery store perishable categories. Journal of Marketing,
69(2), 114-129. User Interface Engineering (2002, February 4-5). What causes customers to buy on impulse?.
Retrieved April 22, 2007, from http://www.uie.com/publications/whitepapers/ImpulseBuying.pdf
U. S. Bureau of Census. (2003). The Older Population in the United States: March 2002,
Washington, DC:U. S. Government Printing Office. U. S. Bureau of Census. (2004). Selected age groups by states and Puerto Rico: 2004,
Washington, DC:U. S. Government Printing Office. U. S. Bureau of Census. (2005). Consumer expenditures in 2003. Washington, DC:U. S.
Government Printing Office. Watson, D. Clark, L. A., & Tellegen, A. (1988). Development and validation of brief
measures of positive and negative affect: The PANAS scales. Journal of Personality
and Social Psychology, 54(6), 1064-1070. Web of loneliness. Retrieved February 9, 2006, from
http://hbswk.hbs.edu/item.jhtml?id=4586&t=technology Weinberg, P., & Gottwald, W. (1982). Impulsive consumer buying as a result of emotions.
Journal of Business Research, 10(1), 43-57. Weiss, R. S. (Ed.). (1973). Loneliness: The experience of emotional and social isolation.
Cambridge:MIT.

97
Weun, S., Jones, M. A., & Beatty, S. E. (1997). A parsimonious scale to measure impulse buying tendency. In W.M. Pride and G.T. Hult: AMA Educator’s Proceedings: Enhancing Knowledge Development in Marketing. Chicago:American Marketing Association, 306–307. In W.O. Bearden and R.G. Netemayer: Handbook of
Marketing Scales. Second edition. London:Sage: Association for Consumer Research, cop., 1999, 57.
Williams, S., Zainuba, M., & Jackson, R. (2003). Affective influences on risk perceptions
and risk intention. Journal of Managerial Psychology, 18(2), 126-137. Yeung, C. W. M., & Wyer, R. S. Jr. (2004). Affect, appraisal, and consumer judgment.
Journal of Consumer Research, 31(2), 412-424.