telegate analyst presentation results 2014 f1 - 11880.com · analyst presentation results 2014 3...
TRANSCRIPT
telegate Group
We make our customer visible on the Internet
Munich,
March 19th 2015
2Analyst presentation results 2014
Market & Strategy
Financials
Outlook
2
3Analyst presentation results 2014
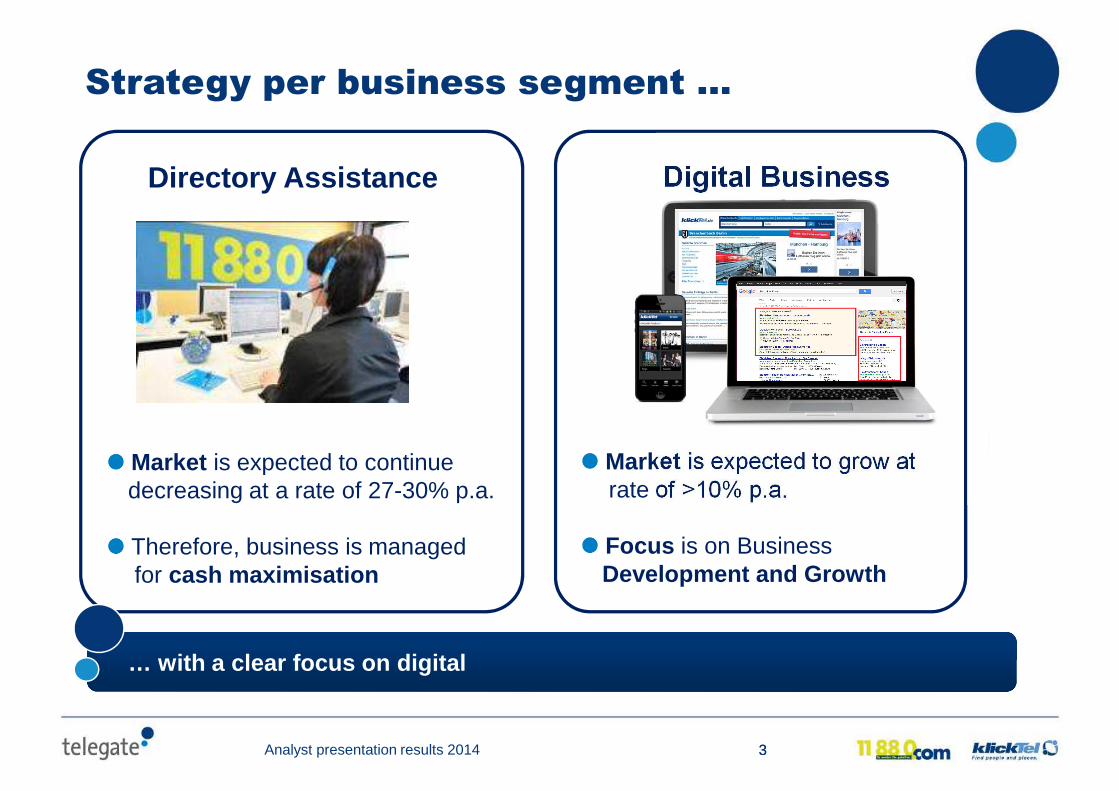
Digital Business
Market is expected to grow at rate of >10% p.a.
Focus is on Business Development and Growth
Directory Assistance
Market is expected to continue decreasing at a rate of 27-30% p.a.
Therefore, business is managed for cash maximisation
Strategy per business segment …
… with a clear focus on digital
3

4Analyst presentation results 2014
341 429 459 515 574 638 701
383482 516
580646
717789
255
321344
386431
478526
341
429459
515
574
638
701
0
500
1000
1500
2000
2500
3000
2009 2010 2011 2012 2013 2014 2015 FC
Classified local
local Display advertising
local paid Searches
local Directories
The local online advertising market in
Germany …
Source: ovk, IAB Europe; Euromonitor; PwC; EIAA; Eurostat; Bain analysis
Relevant segments for
telegate
In k€
… is continuously growing

5Analyst presentation results 2014
Growth derives from …
15
42
19
111313
35
26
1214
0
5
10
15
20
25
30
35
40
45
keineAusgaben
<100€ p.m. 100-250€ p.m. 200-500€pm >500€
SME allocation of online advertising spending in %
2013
2014
Source: GFK SME Advertising spending 2014
… increasing advertising spending of SMEs
� ��
No information provided
5
250-500€ p.m. >500€ p.m.
6Analyst presentation results 2014
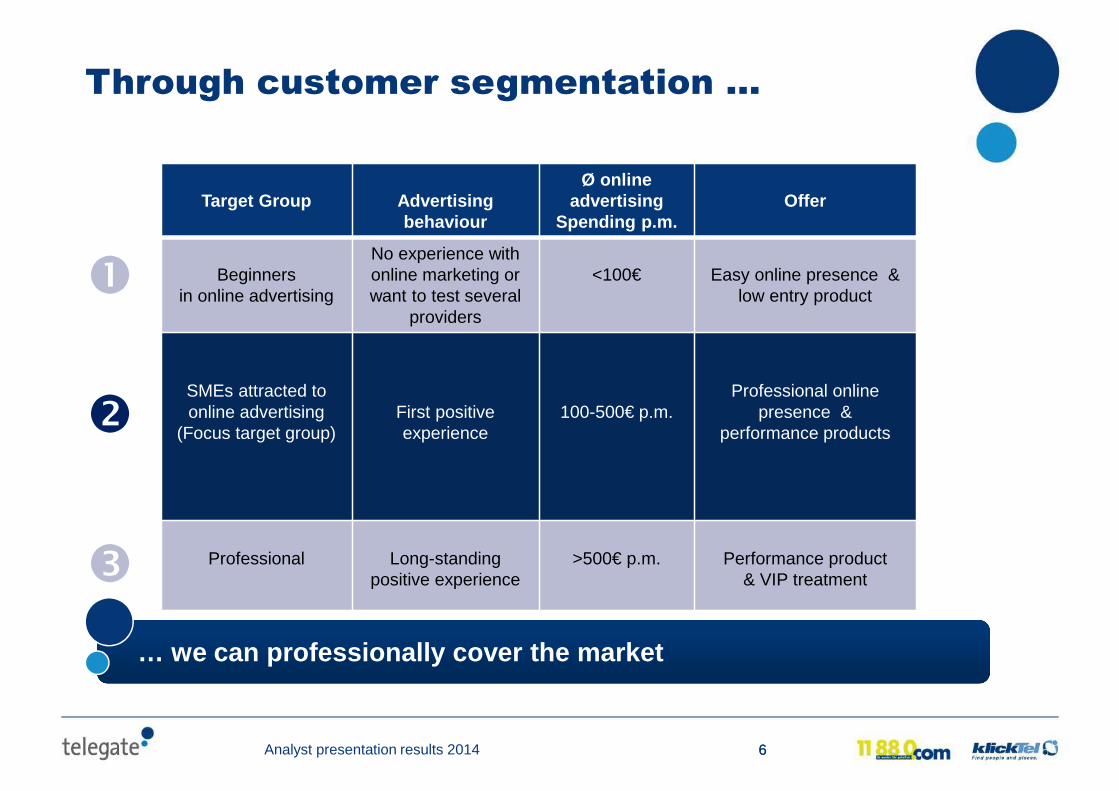
Through customer segmentation …
Target Group Advertisingbehaviour
Ø onlineadvertising
Spending p.m.Offer
Beginnersin online advertising
No experience with online marketing or want to test several
providers
<100€ Easy online presence & low entry product
SMEs attracted to online advertising
(Focus target group)First positive experience
100-500€ p.m.Professional online
presence &performance products
Professional Long-standing positive experience
>500€ p.m. Performance product& VIP treatment
… we can professionally cover the market
�
�
�
6

7Analyst presentation results 2014
Traditional Alternative Digital Digital
Trying to defend print revenueFragmented / regionalEstablished customer relation
Innovative, „digital-only“ playersMany only offering one productrather than solution telegate is biggest player in respect of revenues generated with SMEs
Great brand / awareness & trafficBut: No sales force, accessto SMEs only via partner/reseller
Agencies
Competitive Landscape
7

8Analyst presentation results 2014
Market research of our customers show …
����
����
����
SMEs have realised the importanceof online marketing
SMEs have high expectations and seeperformance of online marketing withcritical eyes
If they have a positive experience,SMEs invest more in online marketing
87% already invest
in online marketing*
71,3% have difficulties
to reach local interestedprospects online*
Ø online marketing spending of SMEsincreased by approx.10% in 2014*
...their high expectations with regard to service a nd performance; especially at the beginning
*Source: GFK SME advertising spending 2014
8
9Analyst presentation results 2014
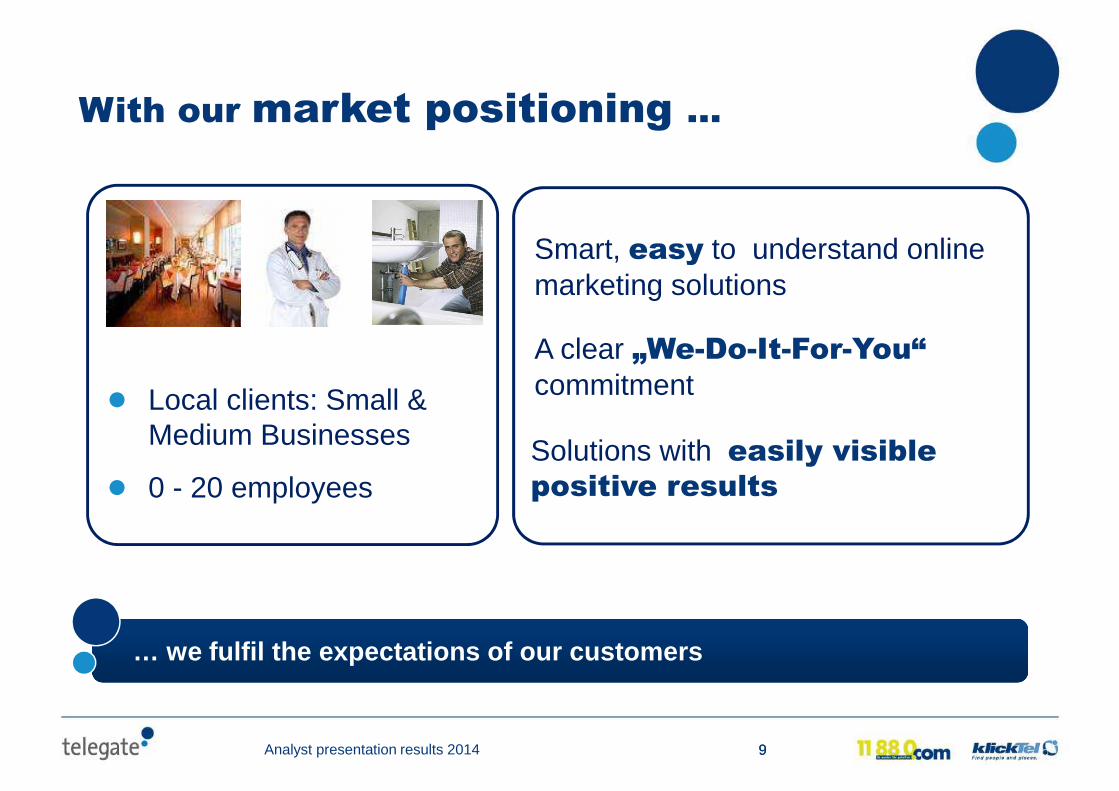
With our market positioning …
����
����
����
… we fulfil the expectations of our customers
● Local clients: Small & Medium Businesses
● 0 - 20 employees
Smart, easy to understand online marketing solutions
A clear „We-Do-It-For-You“ commitment
Solutions with easily visible positive results
9

10Analyst presentation results 2014
… meets exactly customers’ expectation
• Website
• Listing
• Landingpage
• Google My Business
• Facebook Page
• Video clip
• Google Business View
• Google Adwords
• Top-Listing
• Facebook Advertising
Presence Advertising
Our product portfolio …
Advertising
11Analyst presentation results 2014
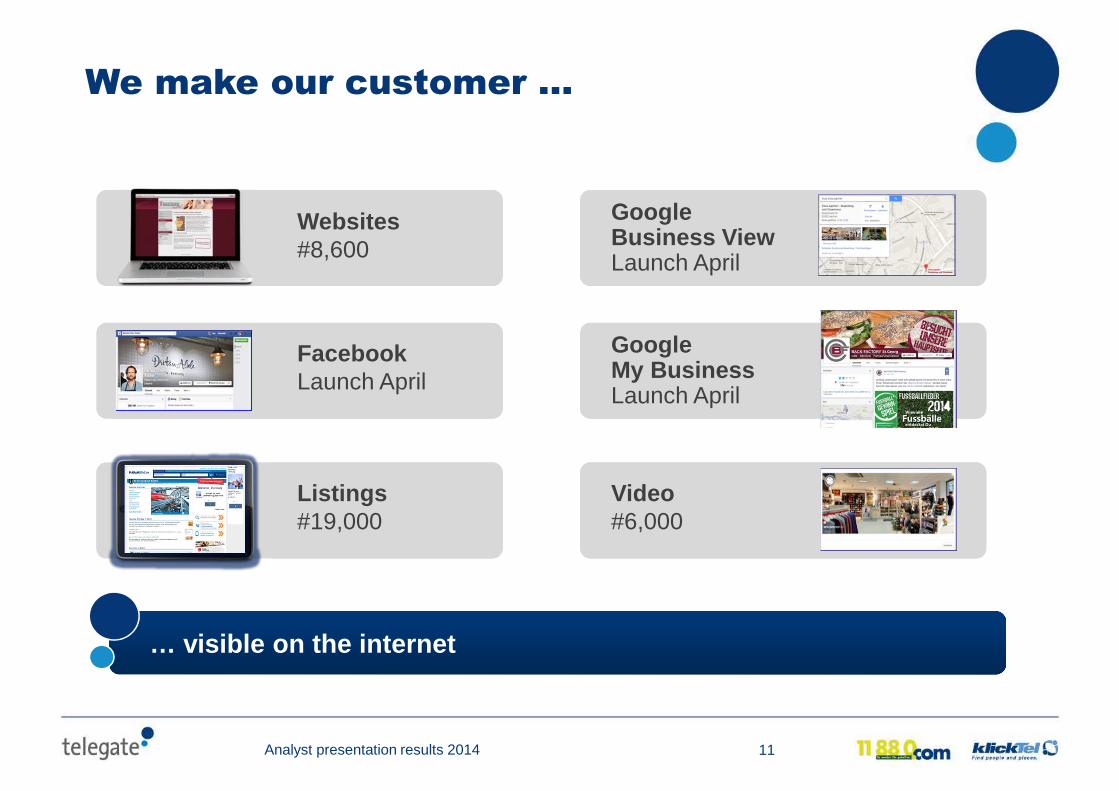
… visible on the internet
We make our customer …
Websites#8,600
Facebook Launch April
Listings#19,000
Google Business View Launch April
Video#6,000
Google My BusinessLaunch April
12Analyst presentation results 2014
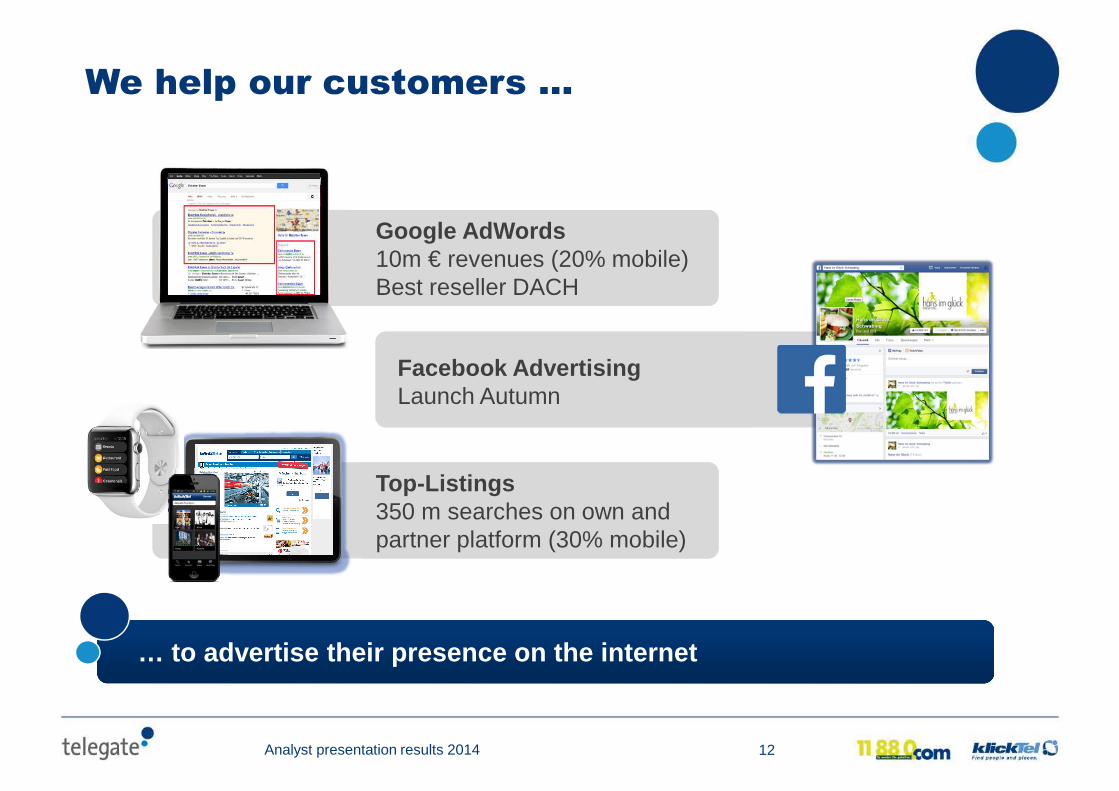
… to advertise their presence on the internet
We help our customers …
Google AdWords10m € revenues (20% mobile)Best reseller DACH
Facebook AdvertisingLaunch Autumn
Top-Listings350 m searches on own and partner platform (30% mobile)
13Analyst presentation results 2014
Market & Strategy
Financials
Outlook
13
14Analyst presentation results 2014
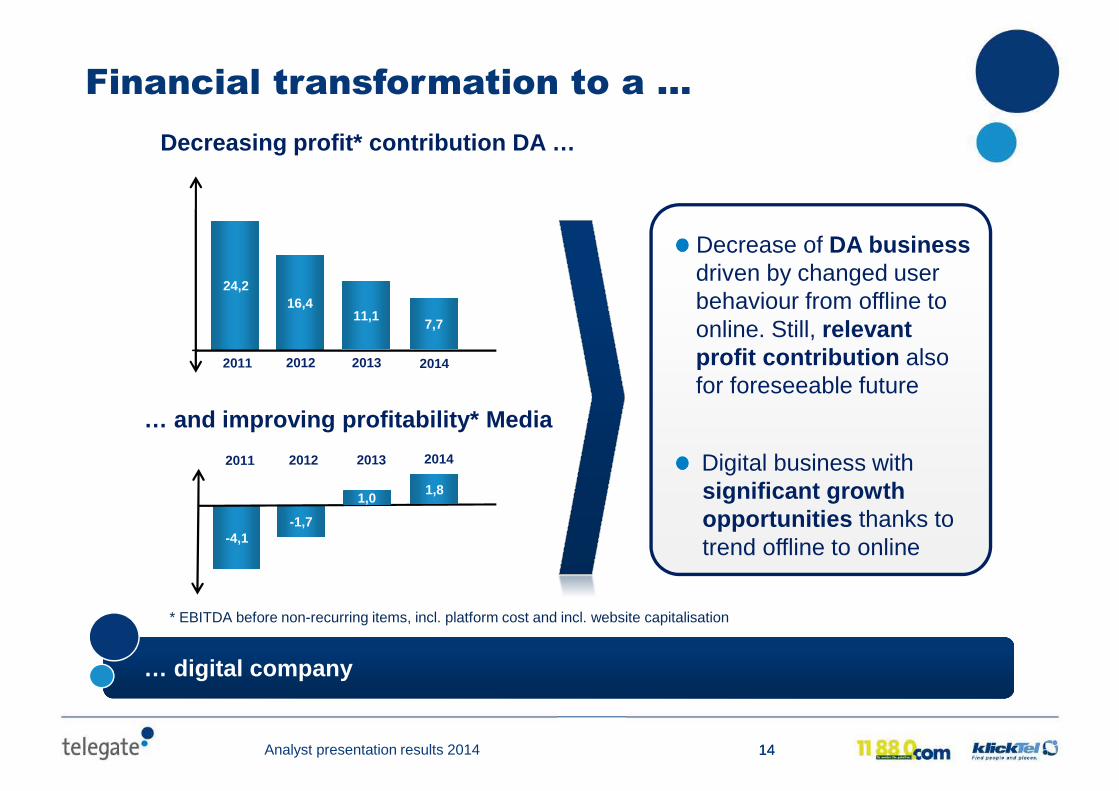
2011 2012 2013 2014
-1,7-4,1
1,01,8
… and improving profitability* Media
Decrease of DA businessdriven by changed user behaviour from offline to online. Still, relevant profit contribution also for foreseeable future
Digital business withsignificant growthopportunities thanks to trend offline to online
16,424,2
2011 2012
11,17,7
2013 2014
Decreasing profit* contribution DA …
* EBITDA before non-recurring items, incl. platform cost and incl. website capitalisation
Financial transformation to a …
… digital company
14
15Analyst presentation results 2014
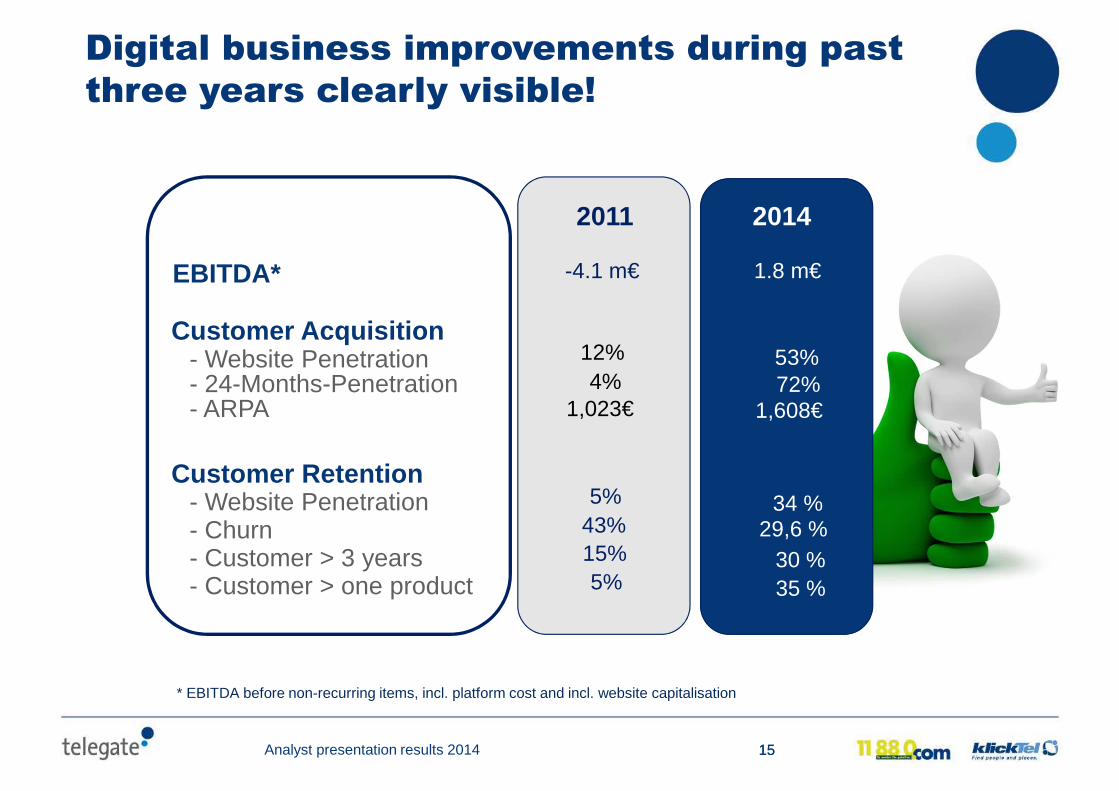
20142011
-4.1 m€EBITDA*-0.6 m€
Customer Retention- Website Penetration- Churn
12%4%
1,023€
5%
15%43%
61%67%
1,523 €
29%41%32%
2014
1.8 m€
53%72%
1,608€
34 %
30 %29,6 %
Digital business improvements during past
three years clearly visible!
- Customer > 3 years5% 35 %- Customer > one product
Customer Acquisition- Website Penetration- 24-Months-Penetration - ARPA
15
* EBITDA before non-recurring items, incl. platform cost and incl. website capitalisation
16Analyst presentation results 2014
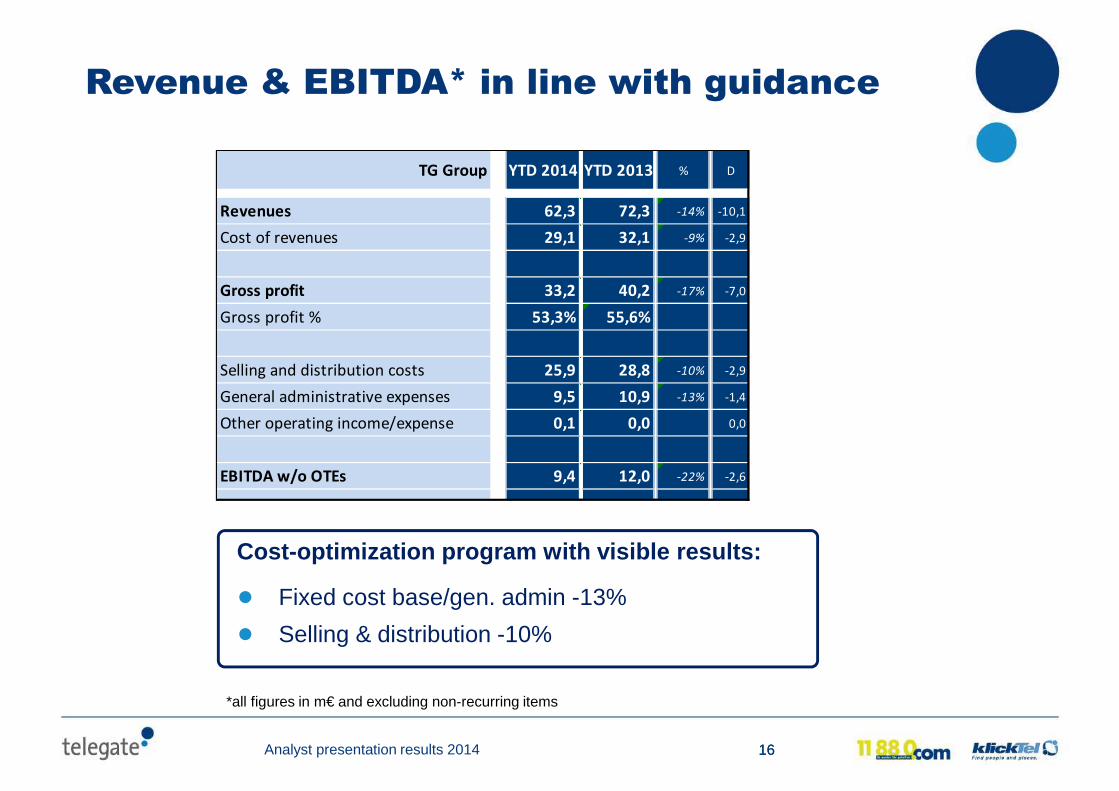
Cost-optimization program with visible results:
● Fixed cost base/gen. admin -13%
● Selling & distribution -10%
*all figures in m€ and excluding non-recurring items
Revenue & EBITDA* in line with guidance
16
TG Group YTD 2014 YTD 2013 % D
Revenues 62,3 72,3 -14% -10,1
Cost of revenues 29,1 32,1 -9% -2,9
Gross profit 33,2 40,2 -17% -7,0
Gross profit % 53,3% 55,6%
Selling and distribution costs 25,9 28,8 -10% -2,9
General administrative expenses 9,5 10,9 -13% -1,4
Other operating income/expense 0,1 0,0 0,0
EBITDA w/o OTEs 9,4 12,0 -22% -2,6
17Analyst presentation results 2014
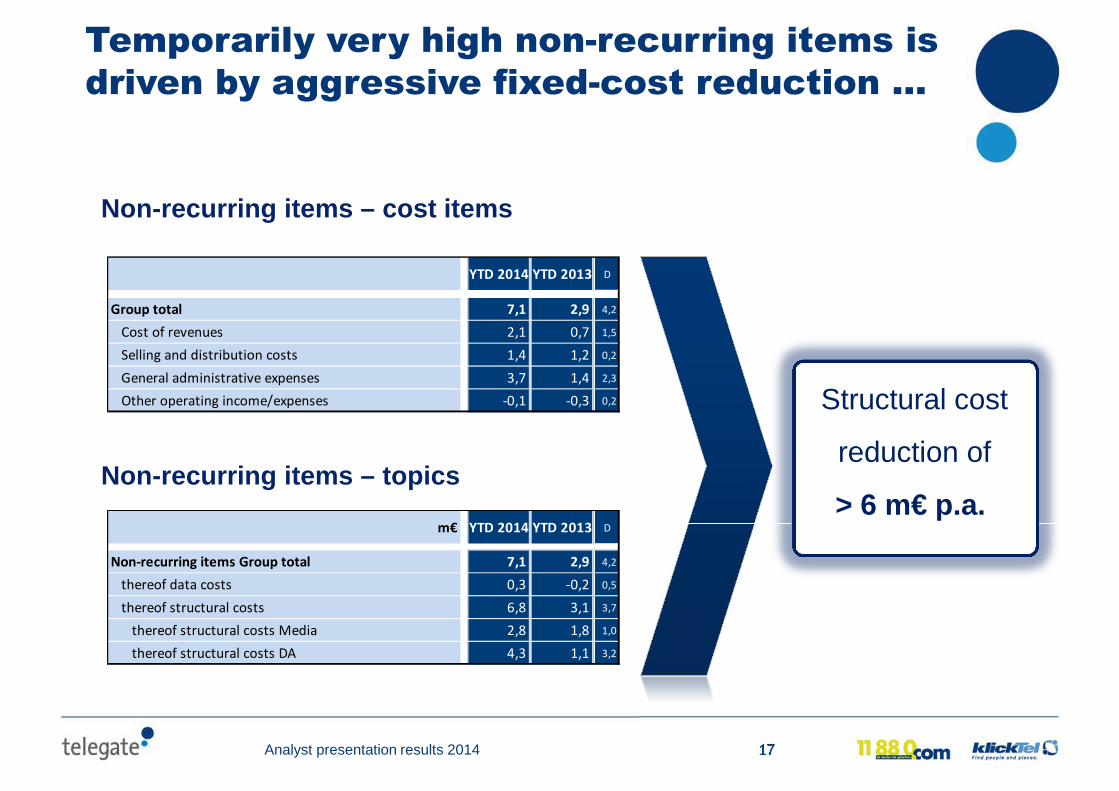
Non-recurring items – cost items
Non-recurring items – topics
Structural cost
reduction of
> 6 m€ p.a.
Temporarily very high non-recurring items is
driven by aggressive fixed-cost reduction …
17
m€ YTD 2014 YTD 2013 D
Non-recurring items Group total 7,1 2,9 4,2
thereof data costs 0,3 -0,2 0,5
thereof structural costs 6,8 3,1 3,7
thereof structural costs Media 2,8 1,8 1,0
thereof structural costs DA 4,3 1,1 3,2
m€ YTD 2014 YTD 2013 D
Non-recurring items Group total 7,1 2,9 4,2
thereof data costs 0,3 -0,2 0,5
thereof structural costs 6,8 3,1 3,7
thereof structural costs Media 2,8 1,8 1,0
thereof structural costs DA 4,3 1,1 3,2
YTD 2014 YTD 2013 D
Group total 7,1 2,9 4,2
Cost of revenues 2,1 0,7 1,5
Selling and distribution costs 1,4 1,2 0,2
General administrative expenses 3,7 1,4 2,3
Other operating income/expenses -0,1 -0,3 0,2
YTD 2014 YTD 2013 D
Group total 7,1 2,9 4,2
Cost of revenues 2,1 0,7 1,5
Selling and distribution costs 1,4 1,2 0,2
General administrative expenses 3,7 1,4 2,3
Other operating income/expenses -0,1 -0,3 0,2

18Analyst presentation results 2014
2013*** 2014
2.17.8
2013 2014
-2.8 -3.3
Operating Cash Flow * (m€) Net Cash Flow * ,** (m€)
** Net Cash Flow: Operating CF + investing CF (w/o available for sale financialassets) +/- interest income/expenses
*** amount adjusted according to IAS 8
● Decrease in operating cash flow* driven by expenses of non-recurring items
● Investments (Capex) 2014 are on much lower level vs. 2013, compensating partially higher non-recurring items
* adjusted by effects related to data cost claims and tax payments following tax audit & data cost claims
Cash position of 26.9 m€ available to strengthen our digital businessCash position of 26.9 m€ available to strengthen our digital businessCash position of 26.9 m€ available to strengthen our digital business
… accordingly operating Cash Flow suffers
from expenses of cost reduction program
18
19Analyst presentation results 2014 19
● telegate AG claims for 86 Mio.€ plus interest
● German Federal Court has stated violation of cartel law by DTAG for data-records already in reclamation claims of telegate
● Reasoning:● Violation of cartel law by DTAG● Telegate was not able to spend more marketing at the times of market
liberalisation; therefore less market share in the directory business● Damage: loss of profit
Next milestone: Oral hearing scheduled for April 15 , 2015
Damage claim against Deutsche Telekom AG
19
20Analyst presentation results 2014
Market & Strategy
Financials
Outlook
20
21Analyst presentation results 2014
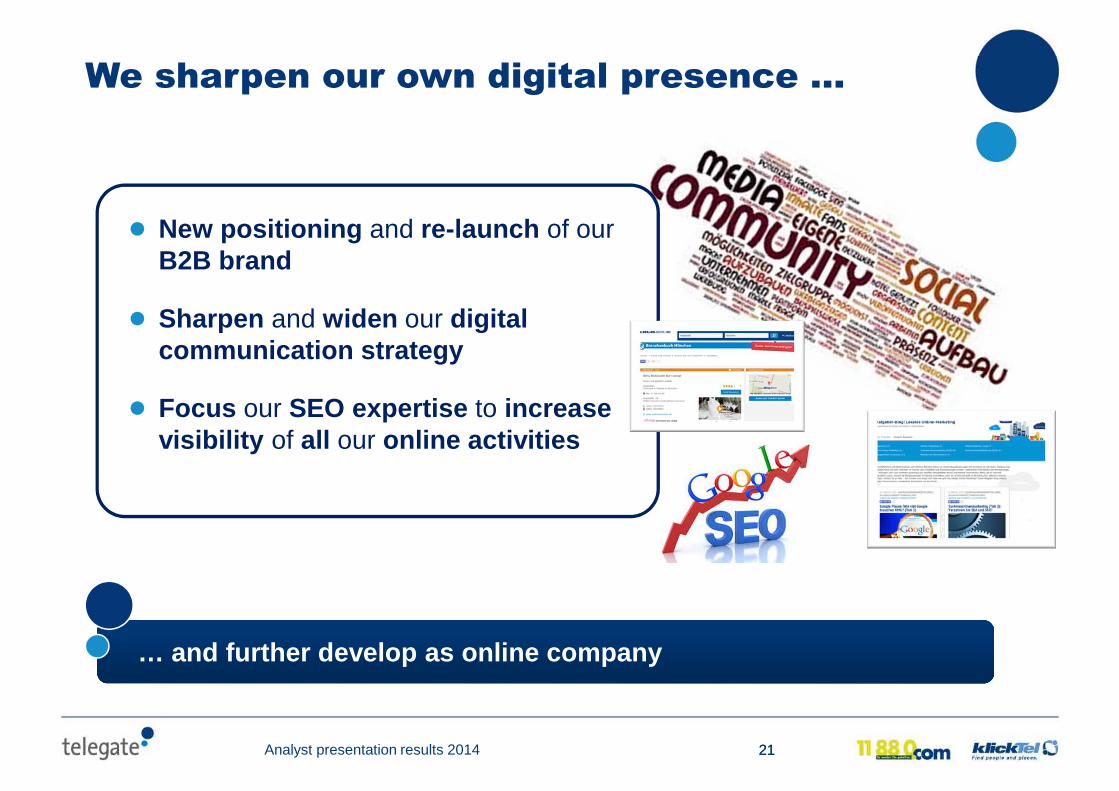
We sharpen our own digital presence …
… and further develop as online company
● New positioning and re-launch of our B2B brand
● Sharpen and widen our digital communication strategy
● Focus our SEO expertise to increase visibility of all our online activities
21
22Analyst presentation results 2014
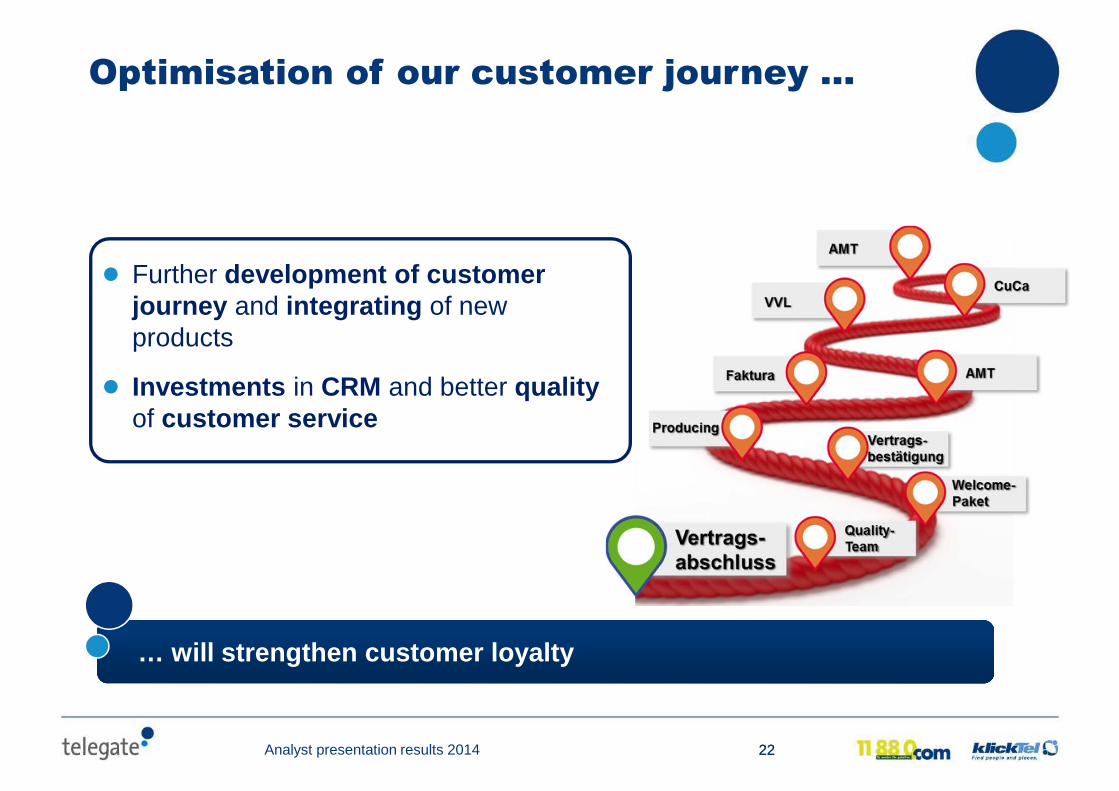
● Further development of customer journey and integrating of new products
● Investments in CRM and better qualityof customer service
Optimisation of our customer journey …
… will strengthen customer loyalty
22
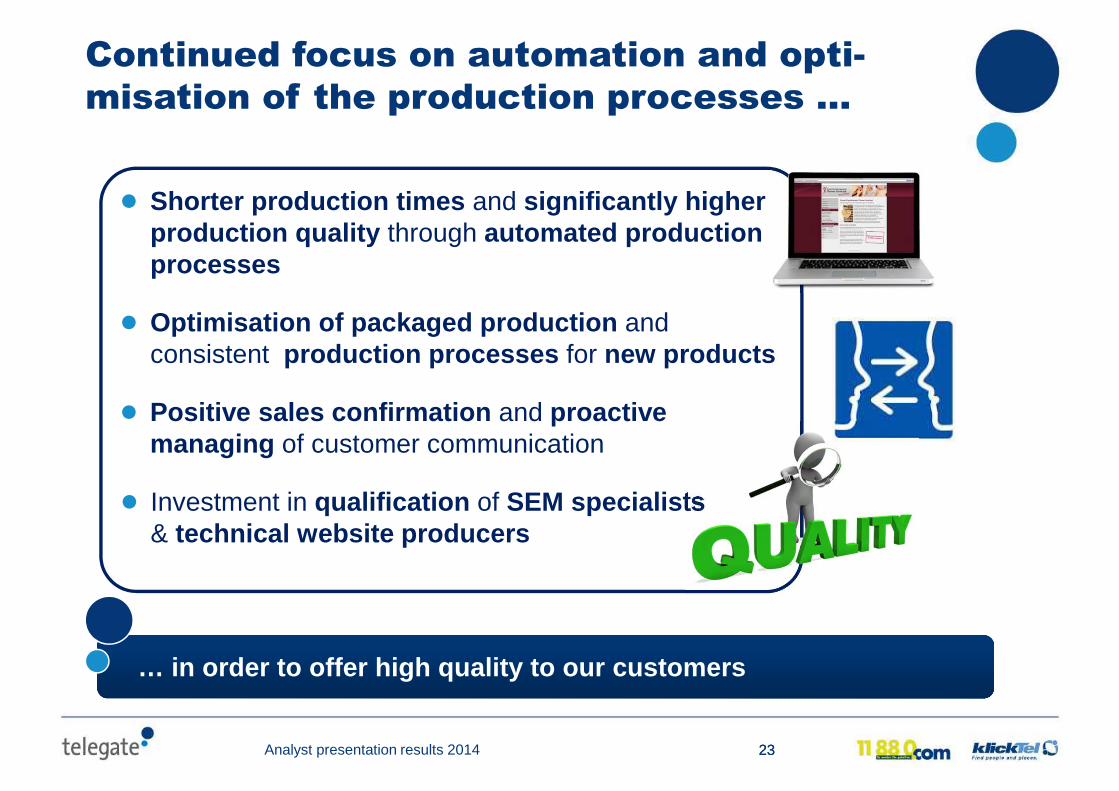
23Analyst presentation results 2014
Continued focus on automation and opti-
misation of the production processes …
… in order to offer high quality to our customers
● Shorter production times and significantly higher production quality through automated production processes
● Optimisation of packaged production and consistent production processes for new products
● Positive sales confirmation and proactive managing of customer communication
● Investment in qualification of SEM specialists& technical website producers
23

24Analyst presentation results 2014
Revenues DigitalRevenues Digital
Double digit growth 2016 YoyDouble digit growth 2016 Yoy
ProfitabilityProfitability EBITDA** of 2-3 m€ in 2015EBITDA** of 2-3 m€ in 2015
… to boost growth in Digital Business
Investments in Digital Business …
Investments DigitalInvestments Digital
Net cash flow* 2015: -6 to -7 due to investments & business transformationNet cash flow* 2015: -6 to -7 due to investments & business transformation
24
*without data cost items **before non-recurring items
25Analyst presentation results 2014
Spokesman of the Management Board | Franz Peter Weber
Management Board | Michael Geiger
Investor Relations | Thomas Kley
telegate AGFraunhoferstraße 12a82152 MartinsriedGermany
Phone | +49 (0) 89-8954-1755Fax | +49 (0) 89-8954-1020Email | [email protected] | www.telegate.com
March 19, 2015 | Annual Results 2014
May 7, 2015 | 3-months results 2015
June 24, 2015 | AGM 2015
August 6, 2015 | 6-months results 2015
November 12, 2015 | 9-months results 2015
Financial Calendar
telegate AG
Contacts and financial calendar
25
26Analyst presentation results 2014
This presentation contains “forward looking statements” regarding telegate Group (telegate), includingopinions, estimates and projections regarding telegate’s financial position, business strategy, plans andobjectives of management and future operations. Such forward looking statements involve known andunknown risks, uncertainties and other important factors that could cause the actual results,performance or achievements of telegate to be materially different from future results, performance andachievements expressed or implied by such forward looking statements. These forward lookingstatements speak only as of the date of this presentation and are based on numerous assumptionswhich may or may not prove to be correct.
Whilst all reasonable care has been taken to ensure that the information and facts stated herein areaccurate and that the opinions and expectations contained herein are fair and reasonable, norepresentation or warranty, express or implied, is made by telegate with respect to fairness,completeness, correctness, reasonableness or accuracy of any information and opinions containedherein. The information in this presentation is subject to change without a prior notice, it may beincomplete or condensed, and it may not contain all material information concerning telegate. telegateundertakes no obligation to publicly update or revise any forward looking statements or otherinformation stated herein, whether as a result of new information, future events or otherwise.
Disclaimer
26

27Analyst presentation results 2014
Backup
27
28Analyst presentation results 2014
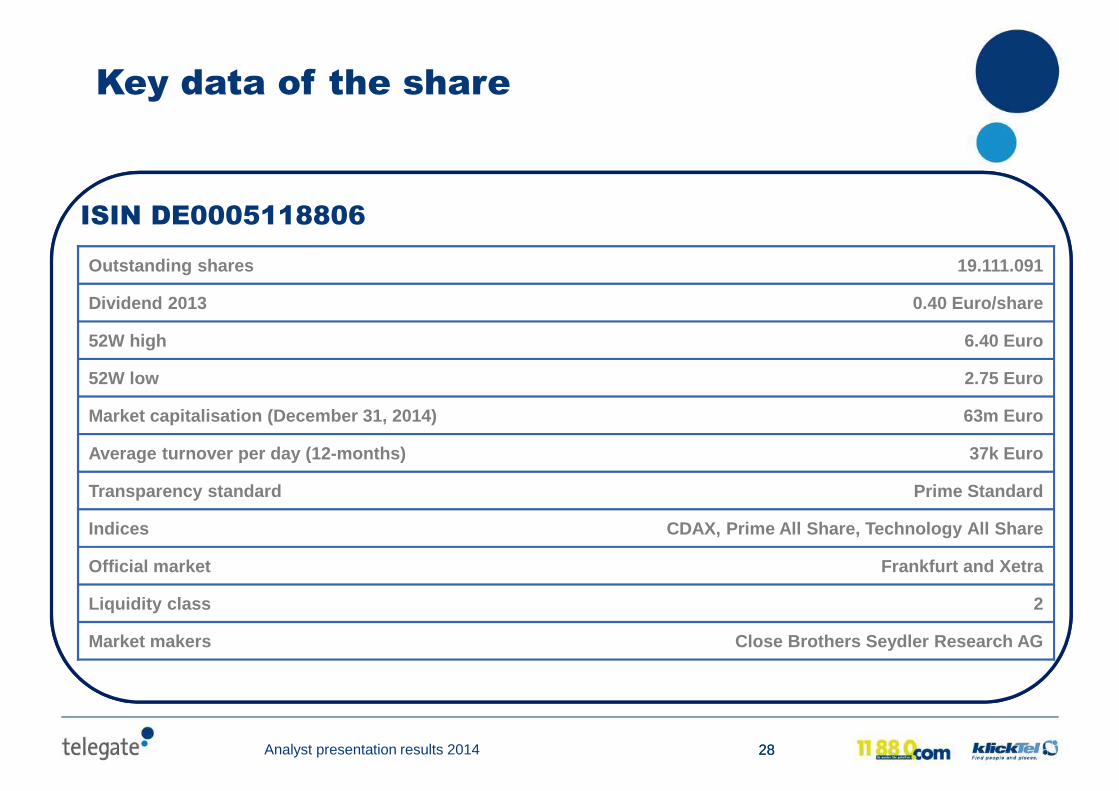
ISIN DE0005118806
63m EuroMarket capitalisation (December 31, 2014)
2.75 Euro52W low
6.40 Euro52W high
CDAX, Prime All Share, Technology All ShareIndices
Prime StandardTransparency standard
37k EuroAverage turnover per day (12-months)
19.111.091Outstanding shares
0.40 Euro/shareDividend 2013
Frankfurt and XetraOfficial market
2Liquidity class
Close Brothers Seydler Research AGMarket makers
Key data of the share
28
29Analyst presentation results 2014
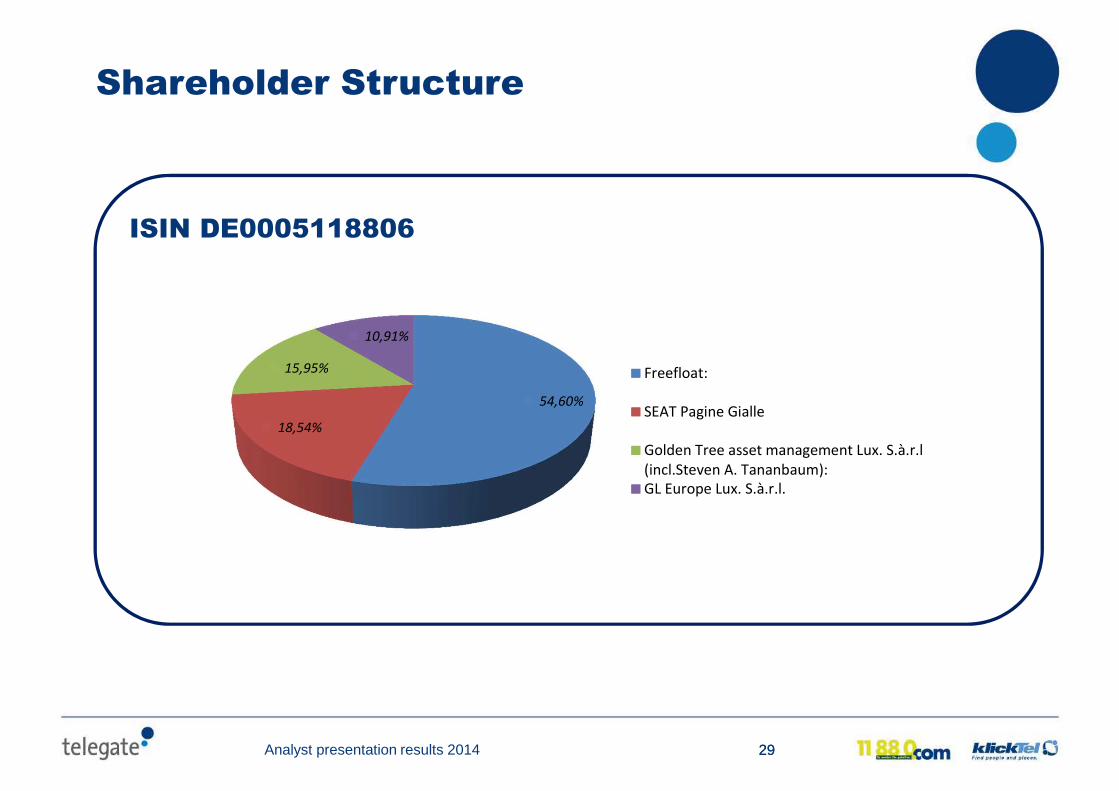
ISIN DE0005118806
Shareholder Structure
29
54,60%
18,54%
15,95%
10,91%
Freefloat:
SEAT Pagine Gialle
Golden Tree asset management Lux. S.à.r.l
(incl.Steven A. Tananbaum):
GL Europe Lux. S.à.r.l.
30Analyst presentation results 2014
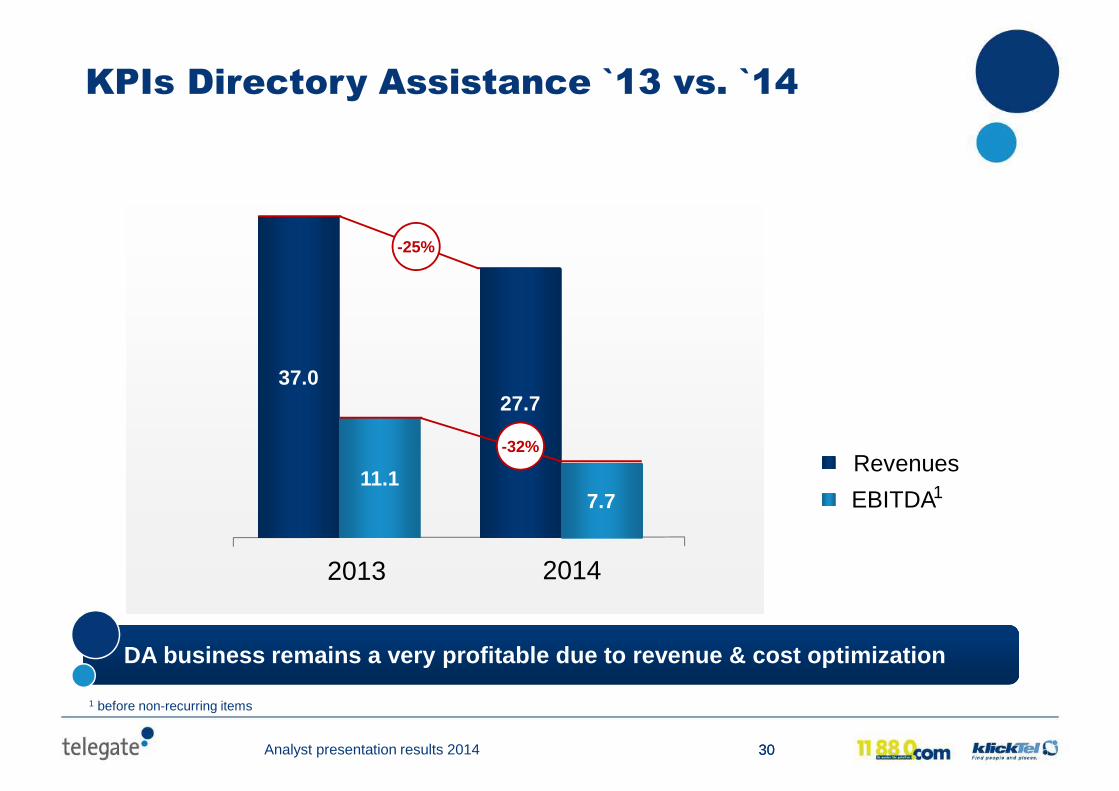
2014
37.0
1 before non-recurring items
2013
11.1
27.7
7.7
-25%
Revenues
EBITDA
-32%
1
DA business remains a very profitable due to revenu e & cost optimization
KPIs Directory Assistance `13 vs. `14
30

31Analyst presentation results 2014
34.6
+1.8
2014
35.3
1 before non-recurring items
2013
1.0
Revenues
EBITDA1
Digital business displays steady improvement in pro fitability
KPIs Digital Business `13 vs. `14
31
32Analyst presentation results 2014
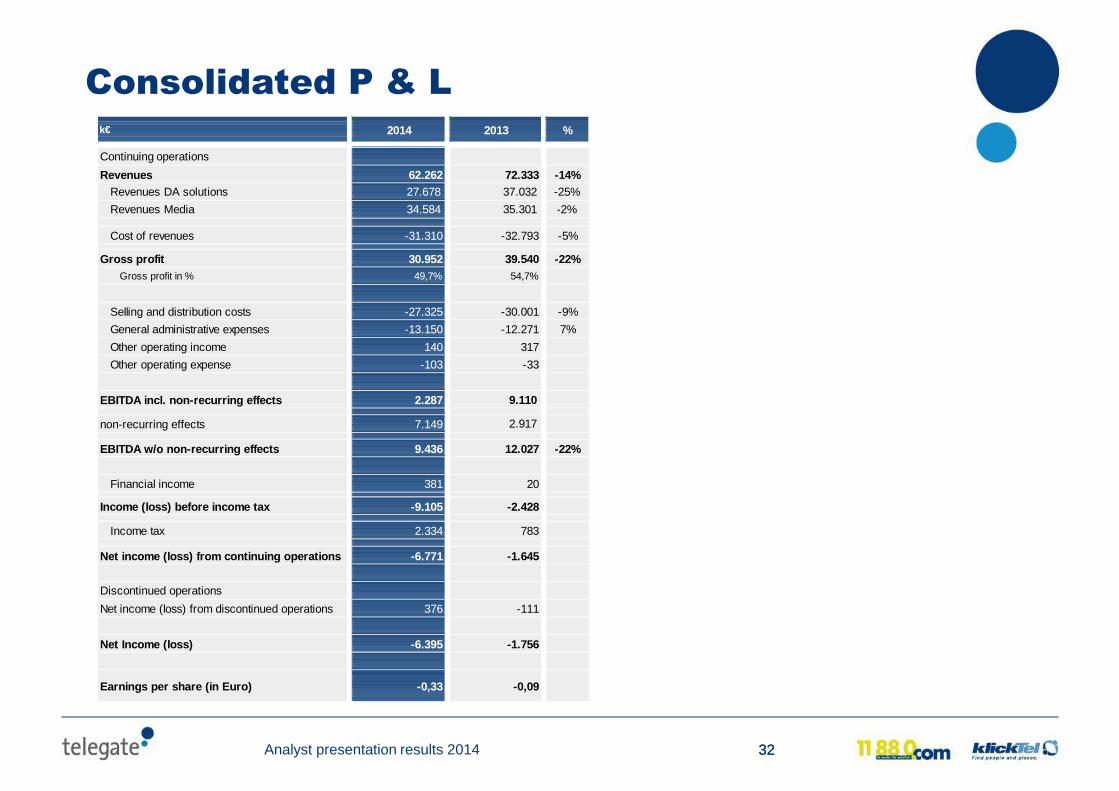
Consolidated P & L
32
k€ 2014 2013 %
Continuing operations
Revenues 62.262 72.333 -14%Revenues DA solutions 27.678 37.032 -25%
Revenues Media 34.584 35.301 -2%
Cost of revenues -31.310 -32.793 -5%
Gross profit 30.952 39.540 -22%Gross profit in % 49,7% 54,7%
Selling and distribution costs -27.325 -30.001 -9%
General administrative expenses -13.150 -12.271 7%
Other operating income 140 317
Other operating expense -103 -33
EBITDA incl. non-recurring effects 2.287 9.110
non-recurring effects 7.149 2.917
EBITDA w/o non-recurring effects 9.436 12.027 -22%
Financial income 381 20
Income (loss) before income tax -9.105 -2.428
Income tax 2.334 783
Net income (loss) from continuing operations -6.771 -1.645
Discontinued operations
Net income (loss) from discontinued operations 376 -111
Net Income (loss) -6.395 -1.756
Earnings per share (in Euro) -0,33 -0,09

33Analyst presentation results 2014
Consolidated balance sheet
33
in kEUR 2014 2013
Assets
Cash and cash equivalents 4.262 9.950
Trade accounts receivable 11.915 13.158
Current tax assets 145 499
Available for sale financial assets 22.606 30.128
Other financial assets 413 24.570
Other current assets 1.697 2.274
Total current assets 41.038 80.579
Tangible and intangible assets 20.921 25.770
Other non-current assets 15 15
Total non-current assets 20.936 25.785
Total Assets 61.974 106.364
Liabilities & Shareholders' equity
Current liabilities 11.888 40.273
Non-current liabilities 2.506 4.383
Shareholders' equity 47.580 61.708
Total liabilities & shareholders' equity 61.974 106.364

34Analyst presentation results 2014
Consolidated Cash Flow statement
34
in kEUR 2014 2013
Income (loss) from continuing operations -9.105 -2.428
Income (loss) from discontinued operations 376 -95
Income (loss) before income tax -8.729 -2.523
Depreciation & amortisation 11.840 11.701
Changes in operating assets & liabilities -1.643 -3.650
Interest income / expense -348 1
Income taxes paid -745 -10.876
Other items -466 770
Cash used in operating activities -91 -4.577
Purchase of assets -5.620 -10.746
disposal of subsidiaries -180 982
Purchase / disposal of other current financial assets 24.208 -24.209
Purchase / disposal of available for sale financial assets 7.507 -29.966
Interest received 394 125
Cash provided by (used in) investing activities 26.309 -63.814
Dividends paid to Seat Pagine Gialle S.p.A. und Telegate Holding GmbH -30.122 0
Dividends paid to free float -1.730 -14.014
Interest paid -53 -894
Cash used in financing activities -31.905 -14.908
Effect of exchange rate changes on cash and cash eq uivalents -1 -1
Change in cash and cash equivalents -5.688 -83.300
Cash and cash equivalents at the beginning of reporting period 9.950 93.250
Cash and cash equivalents at the end of reporting p eriod 4.262 9.950

Thank you for
your attention!
telegate AGFraunhoferstr. 12 a82152 Martinsried bei München
Tel 089/8954-0Fax 089/8954-1010
Follow us on