telefonicas profile
TRANSCRIPT

Telefónica’s Profile
Telefónica S.A.April 2014

DISCOVER, DISRUPT, DELIVER2
Telefónica is the result of more than 85 years of anticipation and transformation...
1990 - 1994 1995 - 19991924 - 1964 1965 - 1989
• CTNE is set up in Madrid; ITT is one of its initial shareholders (1924)
• The Spanish government takes 79.6% of CTNE shares (1945)
• Installs the phone 1 million (1953)
• CTNE becomes the #1 Spanish enterprise (1960)
Start of satellite communications (1967)
Begins operations of the 1st European Data Transmission Special Network (1971)
Installs the phone number 10 million (1978)
Lists on New York Stock Exchange (1987)
Enters in Chile (CTC) and in Argentina (TASA) (1990)
Launches MoviLine in Spain (1990), the analogue mobile service, reaching a geographic coverage of 98% in three years.
Enters in Peru (TdP) (1994)
Launches digital mobile telephony: Movistar (1994)
Commercial Internet is being born. Telefónica launches Infovía (1995)
Wins the tender for Telespin Brazil (1998)
Telefónica becomes fully public again (1999)
Launches fixed broadband access service ADSL (1999)

DISCOVER, DISRUPT, DELIVER3
...especially during the last decade
2009 - 2011 2012 - 20142000 - 2005 2006 - 2008
• Veronica Operation: Telefónica de Argentina; Telefónica del Perú; Telespand Tele Sudeste in Brazil (2000)
• Joint venture of Telefónicaand Portugal Telecom in Brazil: Vivo (2003)
• Launches Imagenio (2003)
• Acquisition of BellSouth's assets in Latin America (2004)
Acquisition of CeskyTelecom (2005)
Takes a 5% stake in China Netcom (2005)
Acquisition of the O2 assets in the UK, Germany and Ireland (2006)
Mobile license awarded in Slovakia (2006)
51% stake taken in Colombia Telecom (2006)
Industrial alliance with Telecom Italia (10.47% of the voting rights) (2007)
Acquisition of Telemig by Vivo in Brazil (2008)
Reaches a 5.38% participation in China Unicom after the CU-CNC merger (2008)
Strengthening of the strategic alliance with China Unicom (2009)
Acquisition of Hansenet in Germany, Jajah in Israeland Tuenti in Spain (2010)
Control of Vivo obtained by buying PT stake out of Brasilcel (2010)
Mobile license awarded in Costa Rica (2011)
T.Digital and TGR creation (2011)
Sale of 4.56% stake in China Unicom (2012)
IPO Telefónica Deutschland (2012)
Sale of Atento (2012)
Sale of 40% of Telefónica’sstake in Centroamérica(2013)
Sale of Telefónica Ireland (2013)*
Acquisition of E-Plus in Germany (2013)*
Capital increase in Telco (from 46,18% to 66%) (2013)
Sale of Telefónica Czech Republic (2014)**
New totally customer-centred organization
* The operations are subject to obtaining the relevant regulatory approval.** Telefónica holds a 4.9% stake in Telefónica Czech Republic.

DISCOVER, DISRUPT, DELIVER4
Since the beginning of internationalization, the company has experienced a significant growth
1989 2000 2013 1989 - 2013
Customers (Mn) 12 68 323 x27
Countries * 1 16 24 +23
Team (‘000) 71 149 130 x2
Revenues (Mn €) 4,273 28,482 57,061 x13
* Includes Ireland, Czech Republic and Slovakia. At the end of 2013, the sale of operations in these countries were pending regulatory approval.

DISCOVER, DISRUPT, DELIVER5
Telefónica is a reference in the Latin American Telco market...
Accesses December 2013 (Mn)
Brazil: 92.7
Argentina: 26.7
Mexico: 21.9
Peru: 20.9
Colombia: 14.8
Chile: 13.6
Central America: 11.8
Venezuela: 11.7
Ecuador: 5.2
Uruguay: 1.8
Total Accesses 222 Mn
Leading Contract
penetration*: 25%
Leading Smartphones
penetration*: 22%
Notes: Central America includes Guatemala, Panama, El Salvador, Nicaragua and Costa Rica. Total accesses figure includes Narrowband Internet accesses of Terra Brazil and Terra Colombia, and Broadband Internet accesses of Terra Brazil, Telefónica de Argentina, Terra Guatemala and Terra Mexico.* Penetration over mobile accesses.

DISCOVER, DISRUPT, DELIVER6
...and has a relevant scale in Europe
Total Accesses 102 Mn
Contract
penetration*: 61%
Smartphones
penetration*: 42%
Note: Accesses includes Ireland, Czech Republic and Slovakia. At the end of 2013, the sale of operations in these countries were pending regulatory approval.* Penetration over mobile accesses.
Accesses December 2013 (Mn)
Spain: 41.7
Germany: 25.2
United Kingdom: 23.9
Czech Republic: 7.8
Ireland: 1.6
Slovakia: 1.5

DISCOVER, DISRUPT, DELIVER7
Our scale is reinforced with global partnerships and collaboration agreements
+PARTNERS PROGRAM PARTNERS PROGRAM
~ 13 mn customers ~ 3 mn customers~ 148 mn customers ~ 70 mn customers
Strategic & Industrial Alliances
Stake 5.02%Stake 5.02% Stake 14.96%Stake 14.96%
million combinedcustomers *>1,000
* Telecom Italia doesn't include Brazil.

DISCOVER, DISRUPT, DELIVER8
Telefónica enjoys today a unique portfolio in the industry...
OIBDA by RegionRevenues by RegionAccesses by Region
Spain
Rest T-Europe
Brazil
Rest T-Latam
T-Latam 68%T-Europe 32% T-Latam 51%T-Europe 47% T-Latam 49%T-Europe 52%
Spain
Rest T-Europe
Brazil
Rest T-Latam
Spain
Rest T-Europe
Brazil
Rest T-Latam
23%
24%21%
30% 33%
19%21%
29%13%
19%
29%
40%
* Organic growth: Assumes constant exchange rates as of 2012 (average Fx in 2012), excludes hyperinflationary accounting in Venezuela and considers constant perimeter of consolidation.** Operating CF = OIBDA - CapEx (excluding spectrum).Note: Differences up to and over 100% are due to “Others & Eliminations”.
2013 (Mn €) % Var. Reported vs 2012
% Var. Organic vs 2012 *
Revenues 57,061 -8.5% +0.7%
OIBDA 19,077 -10.1% 0.0%
OIBDA Margin 33.4% -0.6 p.p. -0.2 p.p.
Operating CF ** 10,905 -11.8% -2.7%

DISCOVER, DISRUPT, DELIVER9
...both by its diversification...
% out of market of origin Accesses Revenues OIBDA
95.5% 85.7% (*) 89.4% (**)
87.1% 77.3% 66.8%
71.7% 64.9% 52.7%
69,9% 51.2% 44.7%
61.6% 62.7% 46.9%
54.9% 30.9% 18.8%
Operational data as of December 2013 and financial data as of January - December 2013.* Data calculated with Service Revenue.** Data as of April – September 2013.

DISCOVER, DISRUPT, DELIVER10
...as well as by customer base and revenues...
Top 10 worldwide...
Total accesses (as reported by companies) = Fixed Lines + Mobile Customers + Narrow and Broad Band Internet + Pay TV.* Vodafone’s Fixed Accesses as of Dec12.
Note: FY 2013 revenues as reported by companies.* Data as of FY 2012.
...by total accesses Million, December 2013)
... by revenues(Million Euros, FY 2013)
767.2
441.5
433.3
428.4
339.3
323.1
287.4
243.8
236.3
228.2
China Mobile
China Telecom
China Unicom
Vodafone *
América Móvil
Telefónica
Bharti-Airtel
Axiata
France Telecom
Vimpelcom
99,979
96,923
90,748
77,173
60,132
57,061
54,525
46,356
41,765
40,981
NTT *
at&t
Verizon
China Mobile
Deutsche Telekom
Telefónica
Vodafone *
América Móvil
NTT DoCoMo *
France Telecom
DISCOVER, DISRUPT, DELIVER11
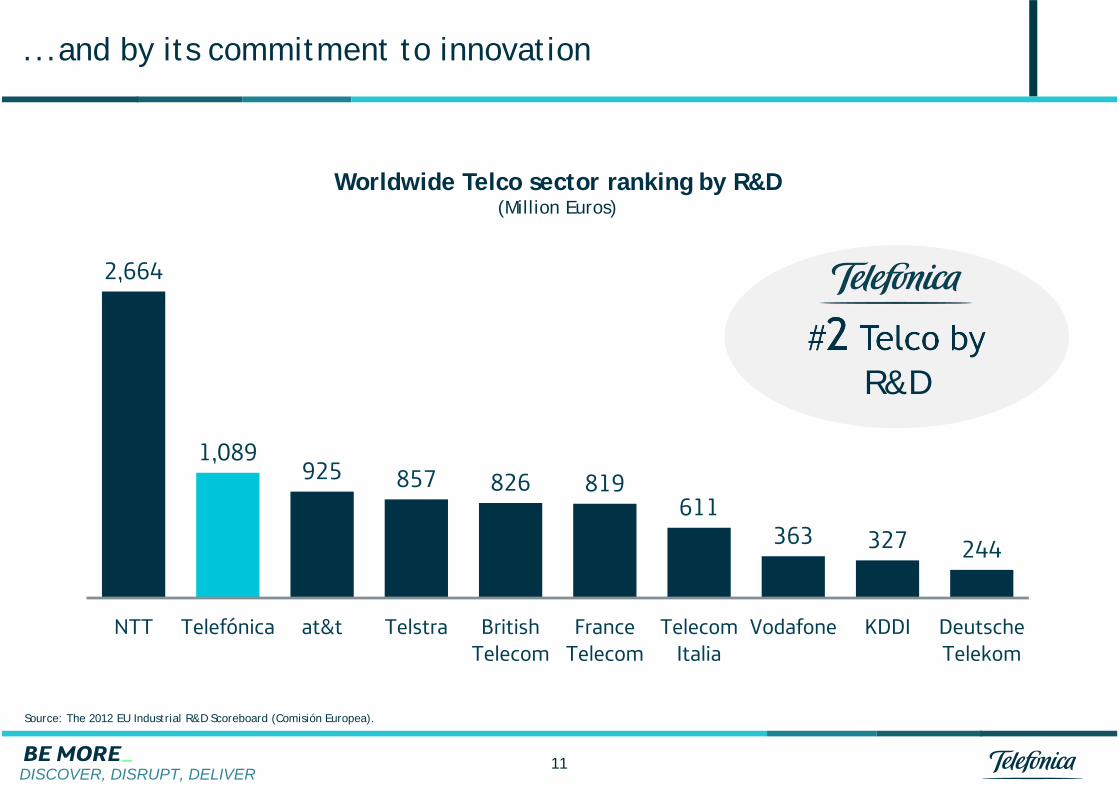
...and by its commitment to innovation
Source: The 2012 EU Industrial R&D Scoreboard (Comisión Europea).
2,664
1,089925 857 826 819
611363 327 244
NTT Telefónica at&t Telstra BritishTelecom
FranceTelecom
TelecomItalia
Vodafone KDDI DeutscheTelekom
Worldwide Telco sector ranking by R&D(Million Euros)
#2 Telco by R&D

DISCOVER, DISRUPT, DELIVER12
Telefónica among the Top 10 in the Telco sector worldwide
Worldwide Telco sector ranking by market cap (Million Euros)
Source: Bloomberg 03/31/2014.
143,040
134,023
132,591
70,551
65,976
52,346
52,269
50,777
50,062
44,996
Verizon
China Mobile
at&t
Vodafone
Softbank
Deutsche Telekom
Telefónica
América Móvil
NTT DoCoMo
NTT

DISCOVER, DISRUPT, DELIVER13
1Telefónica’s activity has a clear positive impact in the societies where
it is present
As an engine for economic sustainable development and innovation...
...and to help overcome social divides

DISCOVER, DISRUPT, DELIVER14
The ICT sector is key to improve productivity and for economic sustainable growth
Increase in GDP growth (pp) per each 10 ppincrease in penetration of Telco services
Broadband development
Direct BenefitsInfrastructure Investment
Consumer surplus
Contribution to GDP growth
Private IncomeTotal Factor Productivity
Household Penetration
Enterprise penetration
Developed countries Developing countries
ICT impact on the economyICT impact on the economy
0,0 0,3 0,6 0,9 1,2 1,5
Fixed-Line Phone
Mobile Phone
Dial-Up Internet
Broadband Internet
0.0 0.3 0.6 0.9 1.2 1.5
Source: World Bank; Qiang.
DISCOVER, DISRUPT, DELIVER
8,2288,928 8,871
8,172
13.5%14.2% 14.2% .14.3%
2010 2011 2012 2013
15
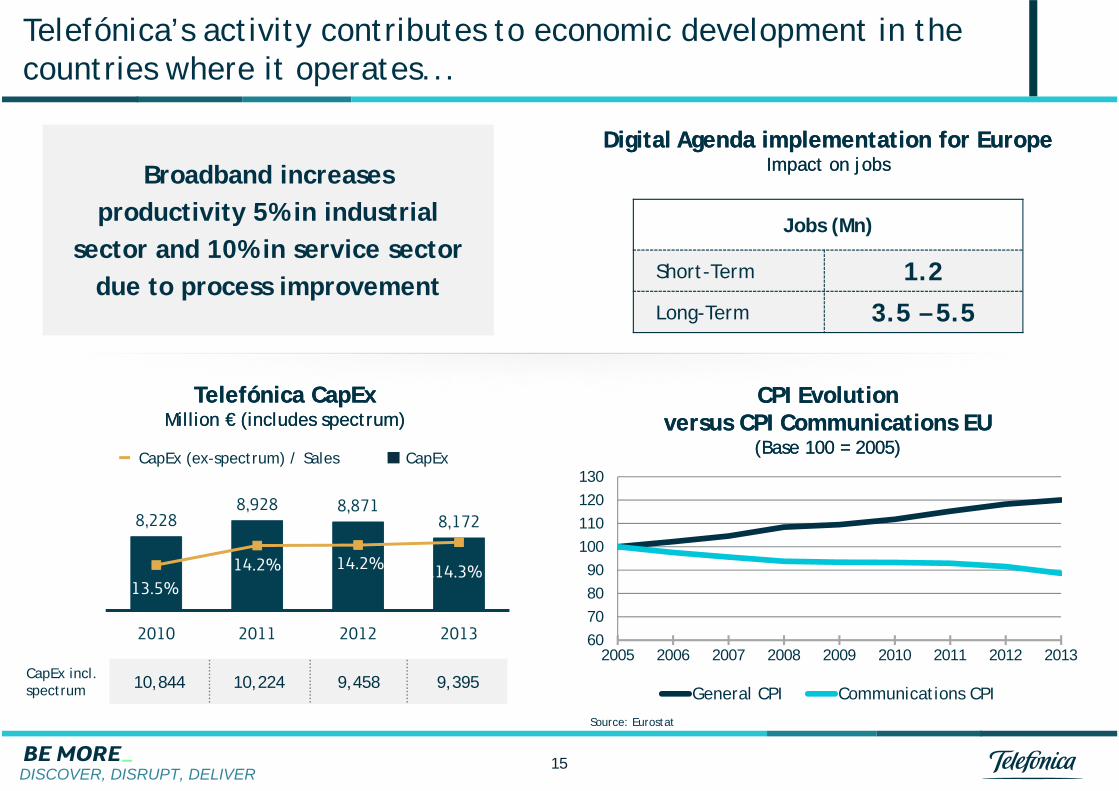
Telefónica’s activity contributes to economic development in the countries where it operates...
Digital Agenda implementation for EuropeImpact on jobs
Digital Agenda implementation for EuropeImpact on jobsBroadband increases
productivity 5% in industrial sector and 10% in service sector
due to process improvement
CPI Evolution versus CPI Communications EU
(Base 100 = 2005)
CPI Evolution versus CPI Communications EU
(Base 100 = 2005)
60708090
100110120130
2005 2006 2007 2008 2009 2010 2011 2012 2013
General CPI Communications CPI
Jobs (Mn)
Short-Term 1.2Long-Term 3.5 – 5.5
Telefónica CapExMillion € (includes spectrum)
Telefónica CapExMillion € (includes spectrum)
CapEx (ex-spectrum) / Sales CapEx
CapEx incl. spectrum 10,844 10,224 9,458 9,395
Source: Eurostat

DISCOVER, DISRUPT, DELIVER
THINK BIG
TALENTUM
CAMPUS PARTY
CROWDWORKING SPACES
WAYRA
AMÉRIGO
MARKET ACCESS
...with a clear commitment with innovation and entrepreneurship
16
INVE
STM
ENT
Crow
dfun
ding
-VA
’s-
VC’s
TALENTSELECTION &
QUALIFICATION
PARTNERSALLIANCES
TALENT EMPLOYMENT INVESTMENT
ACEL
ERAT
ION
Open Platform_

DISCOVER, DISRUPT, DELIVER17
Telefónica also promotes social cohesion through the development of social programs
• 716,641 children at risk of social exclusion have been attended in Latin America to fight against child labor
• 30,332 teachers have been trained
• More than 24,000 volunteers have taken part in solidarity initiatives
• 12,004 young people have been trained to support the development of 3,726 projects
Total beneficiaries of Telefónica Foundation 1,542,898
Education and learningArt and digital cultureCorporate Volunteering
Presence of FundaciónTelefónica in the world
Countries where Fundación Telefónica collaborates
12COUNTRIES
8COUNTRIES

DISCOVER, DISRUPT, DELIVER18
Different organizations have recognized our commitment with corporate sustainability
Telefónica in the top 5 sector
Carbon Disclosure Project: Signed by 551 institutional investors, with assets of US$71 trillion. CDP Global 500 Report examines the carbon reduction activities at the world’s largest public corporations
Included in FTSE4Good Index, an index that measure the performance of companies that meet globally recognized corporate responsibility standards
Member of DJSI World. Best practice in:• Risk & Crisis Management• Impact of Telecommunication services
The most admired Telco in Europe, and the second worldwide, according to the World’s Most Admired Companies Ranking in 2013

DISCOVER, DISRUPT, DELIVER19
Our brands, one of our main assets, are managed globally
Speaks to:• Institutions• Governments• Employees• Multinational Clients,• ...
Institutional Role
Speaks to Customers and Society
Commercial Role
Brand Architecture
