telefônica brasil s.a.static.telefonica.aatb.com.br/arquivos/download/1154... · 2017. 11. 9. ·...
TRANSCRIPT

Telefônica Brasil S.A.
BUSINESS VALUATION OF GLOBAL VILLAGE TELECOM S.A. (GVT)
DISCOUNTED CASH FLOW METHOD
VOLUME ONE
Base Date: December/2014

1
INDEX 1. EXECUTIVE SUMMARY ...................................................................... 3 1.1 Keyinformationandvaluationreportconclusions..................................................................3 1.2 Criteriaadoptedandmainassumptions.......................................................................................6 1.3 ValuationMethod....................................................................................................................................8 1.4 Discountrate.............................................................................................................................................9 1.5 ValueandValuationmethodology...................................................................................................9
2. GOAL ............................................................................................. 11 3. INFORMATION ABOUT THE APPRAISAL COMPANY ............................ 11 3.1 Institutionresponsiblefortheappraisalreport.....................................................................11 3.2 Descriptionoftheinternalprocessfortheappraisalreportapproval.........................15 3.3 IdentificationandQualificationoftheprofessionalsresponsible forthisValuationReport.....................................................................................................................................................................15 3.4 Disclaimer................................................................................................................................................16 3.5 Commercialorcreditinformationthatmayimpactthevaluationreport...................16 3.6 Absenceofconflictofinterest.........................................................................................................17
4. COMPANY PRESENTATION AND BUSINESS CONTEXT ................... 18 4.1 BriefhistoryoftheCompany..........................................................................................................18 4.2 Briefdescriptionofthemarketsegment...................................................................................21 4.3 BriefanalysisofthesectorwheretheCompanyoperates.................................................21 4.4 Macroeconomicassumptionsusedinthepreparationofthereport............................24 4.5 Relevantinvestmentprojectsthathavebeenconsideredinthevaluation,indicatingtheamountsinvolvedandthefinancialimpact...................................................................................25
5. COMPANY'S VALUE BY DIFFERENT CRITERIA ................................... 25 6. METHODOLOGY CONSIDERATIONS ................................................ 26
2
7. CASH FLOW ASSUMPTIONS ............................................................ 28 7.1 TimeFrame.............................................................................................................................................28 7.2 DiscountRate.........................................................................................................................................28 7.3 Salesrevenues.......................................................................................................................................29 7.4 OperationalExpenses.........................................................................................................................29 7.5 Administrative,CommercialandOtherExpenses.................................................................29 7.6 Depreciationandamortization......................................................................................................29 7.7 Interestandloanamortization.......................................................................................................30 7.8 Investiments...........................................................................................................................................30 7.9 Taxes..........................................................................................................................................................30 7.10 WorkingCapitalVariation................................................................................................................30 7.11 Sinergies...................................................................................................................................................30 7.12 Observationsregardingthevaluation.........................................................................................30 7.13 SubsequentEvents...............................................................................................................................31 7.14 SummaryofOperatingandFinancialProjections.................................................................31
8. CONCLUSION ................................................................................. 35 9. ANNEXES ....................................................................................... 36

3
1. EXECUTIVE SUMMARY 1.1 Key information and valuation report conclusions The valuation of GVT Participações S.A. (“GVTPar”) and Global Village Telecom S.A. (GVT or Company), whose base date is December 31, 2014, utilized information from the 2012 to 2014 balance sheets as well as strategic projections, complemented by other documents, information and estimates, such as investment, debt, taxes, administrative and commercial expenses, and forecast evolution, provided by the management of GVT and Telefônica Brasil S.A. (Telefônica Brasil). The information provided is reasonable and reliable and reflects the best estimate in light of the Company's business plan. Considerations were made about future events, which may be changed, or modifying the conclusions. This appraisal report is issued in the context of the acquisition, by Telefônica Brasil, of all shares issued by GVTPar, holder of 99.96% of the shares of GVT (Operational Company) and therefore its direct parent. The valuation in this Report was conducted taking into consideration the cash flow generated by GVT, and therefore, analyzing GVTPar on a consolidated basis. With this in mind, references are made to GVTPar interchangeably in relation to GVTPar and GVT and vice versa. The GVTPar is pure holding company, which holds, as its only asset, the investment in GVT. The valuation report performed by Planconsult was not an audit of the information of GVT, provided by GVT and Telefônica Brasil, as GVT is a corporation audited by independent auditors. The information processed did not have its validity and legal effects analyzed by Planconsult, as this analysis is beyond its professional scope. Planconsult did not analyze the validity and enforceability of the liens or encumbrances on the properties of the Company. However, the figures for liens or encumbrances that we were informed by the Company were considered in our work. Brief Description of Operation Pursuant to the press release of September 18, 2014, date on which Vivendi SA, Société d'Investissements et de Gestion 72 SA ("FrHolding72"), Société d'Investissements et de Gestion SAS 108 ("FrHolding108" ), Telefônica Brasil, Telefónica, S.A. and, as consenting parties, GVTPar and GVT, signed a Stock Purchase Agreement and Other Covenants (Purchase and Sale Agreement). This Purchase and Sale Agreement has as its object the acquisition of the shares of GVTPar ( parent company of GVT) by Telefônica Brasil.l

4
As consideration for the acquisition of the shares of GVTPar by Telefônica Brasil, the latter will pay part of the price with financial resources and also with shares to be issued by it under the incorporation of shares of GVTPar by Telefônica Brasil, with the corresponding delivery of common and preferred shares issued by Telefônica Brasil for FrHolding108 to replace the GVTPar shares, subject to the number of shares negotiated between the parties and set out in the Purchase and Sale Agreement, as follows: (i) the amount of EUR 4.663 billion (four billion, six hundred sixty three million euros) corresponding portion of the price in financial resources that will be paid in cash on the closing date; and (ii) shares of Telefônica Brasil's equivalent to 12% of its common shares and 12% of its preferred shares after the merger of GVTPar shares, that will be delivered to FrHolding108. GVTPar - Corporate Structure - Pre Operation
Telefónica Public Vivendi
Telefônica Brasil GVT
5
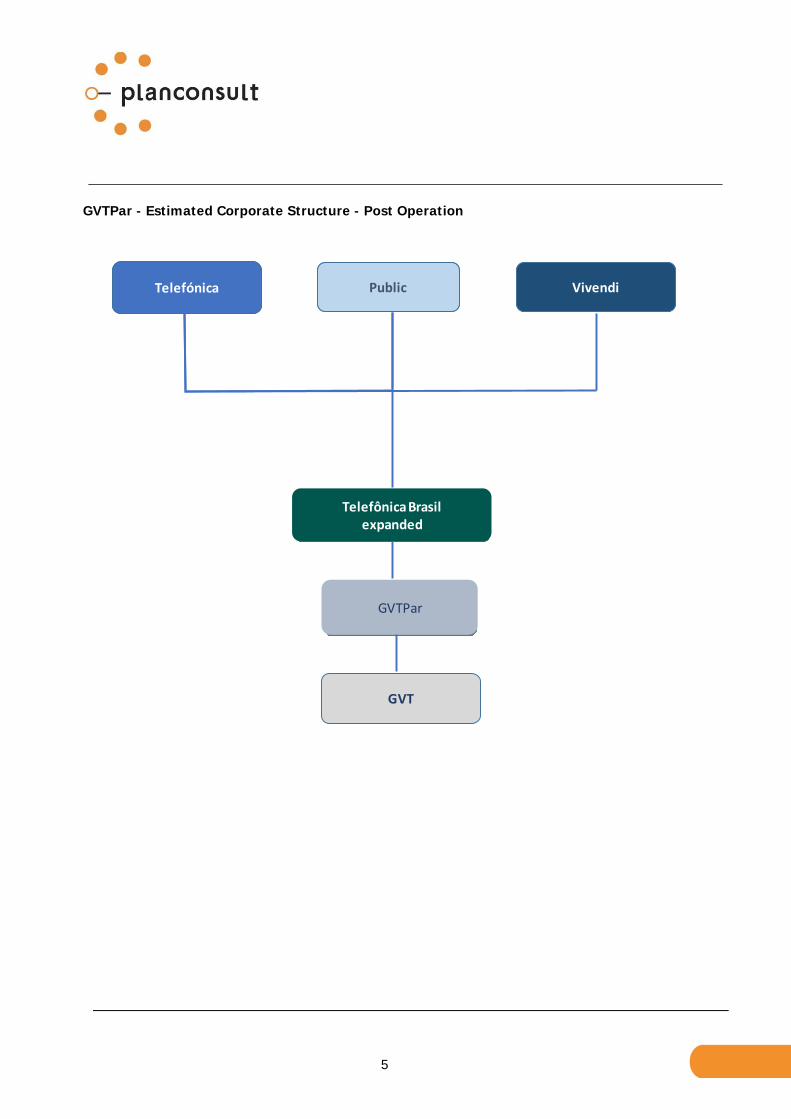
GVTPar - Estimated Corporate Structure - Post Operation
Telefônica Público Vivendi
GVTPar
Telefónica Public Vivendi
Telefônica Brasilexpanded
GVT

6
1.2 Criteria adopted and main assumptions This valuation was performed under an operating environment, according to the objective of the Company's bylaws. The Company is engaged in providing telecommunications services, including the transmission of voice, data and information; the sale of equipment and / or telecommunications and electronic accessories; and participation in other companies as a shareholder or member. The following methods can be used to value a company:
a) Weighted average price of the shares – not used in this case since GVT shares are not traded in a stock exchange or over-the-counter markets, and therefore is not an appropriate basis for the valuation of the company.
b) Book value - not used in this case since it focuses the enterprise's past performance and does not
take into account future projections of potential return of capital to the shareholders.
c) Multiples of comparative transactions and market - not used in this case since the Company does not have shares traded on the stock exchange. Therefore, it is not possible to establish the relationship of values with other comparable companies.
d) Net worth at market value – provides a "static picture" and therefore discarded. This methodology
considers only the market value of tangible assets and liabilities adjusted to market value, not including therefore fair values of intangible assets, which are present in most of the companies, andtherefore not considering the prospect of future profitability of the Company;
e) Free Cash Flow to Firm (FCFF) - is the used method, and the most appropriate in order to reflect
the company's profitability perspective, also taking into account the value of the intangible assets. The following information was the basis for the Valuation:
Financial Statements and Balance Sheets of 2012 to 2014; Prospects of development of the Company's target markets, provided by GVT and Telefônica
Brasil; Company's strategic planning complemented with other information, such as investment, debt,
taxes, administrative and commercial expenses, as well as evolution forecast; Discussions with executives of Telefônica Brasil regarding the past performance and
expectations for the future of GVT’s business.

7
Macroeconomic assumptions of FCFF The macroeconomic assumptions used in the projection of Free Cash Flow were prepared jointly by Planconsult and Telefônica Brasil, based on public information on the base date of 12/31/2014, and are described below:
Source Unit 2015E 2016E 2017E 2018E 2019E 2020E 2021E 2022E 2023E 2024E
Exchange Rate
Average Focus R$/US$ 2,71 2,76 2,79 2,86 2,74 2,78 2,88 2,97 3,07 3,17Final Focus R$/US$ 2,78 2,81 2,84 2,92 2,74 2,83 2,92 3,02 3,12 3,22
Inflation
IPCA Focus % 6,66% 5,68% 5,73% 5,75% 5,75% 5,75% 5,75% 5,75% 5,75% 5,75%
IGP-M Focus % 6,14% 5,25% 4,50% 4,50% 4,50% 4,50% 4,50% 4,50% 4,50% 4,50%
US CPI Gov % 2,30% 2,40% 2,40% 2,40% 2,40% 2,40% 2,40% 2,40% 2,40% 2,40%
Diferencial de Inf lação Brasil-USA Cálculo % 4,26% 3,20% 3,25% 3,27% 3,27% 3,27% 3,27% 3,27% 3,27% 3,27%
Interest Rate
SELIC Average Focus % 12,25% 11,67% 10,83% 10,25% 9,50% 9,50% 9,50% 9,50% 9,50% 9,50%
TJPL BNDES % 5,00% 5,00% 5,00% 5,00% 5,00% 5,00% 5,00% 5,00% 5,00% 5,00%
GDP
Annual grow th rate Bacen % 0,45% 1,75% 2,30% 2,50% 2,50% 2,50% 2,50% 2,50% 2,50% 2,50%
Perpetuity value was adopted in this valuation. The valuation includes the explicit period of cash flow between January 1st 2015 and December 31, 2024, and perpetuity the forward. Sales Revenue Sales revenues of the explicit period of free cash flow were projected based on information provided by the management of Telefônica Brasil. This information has reliability / reasonableness in the light of market practices, and all the cities involved in the businesshave been considered, both those in which GVT is present as well as where it could be, divided into 4 categories that guided the projections scenarios: Mature Market (broadband penetration in over 50% of households) with NET (currently main competitor of Telefônica Brasil), Mature Market without NET, Not mature with NET and not mature without NET. Each city profile was analyzed considering the operational strategies of Telefônica Brasil and GVT and certain projections of changes in income over the projected period, based on market behavior and broadband penetration in households in each city. Additionally, Pay-TV revenues, voice and other were projected proportionally to broadband revenue. A real growth was projected in perpetuity of 1.09% p.y. (Source: Central Bank regarding the average of 10 lower results of GDP growth in the last 20 years). Operating Costs Operating costs were estimated based on the percentage of Gross Operating Revenue, obtained from the historical data of the 2012 to 2014 income statement, as well as management information provided by Telefônica Brasil.

8
Administrative, Commercial, and Other Expenses Commercial, general and administrative expenses were determined according to the historical data of the 2012 to 2014 income statements provided by the management of GVT and Telefônica Brasil. Taxes i. Sales Taxes
The projections considered the Net Sales Revenue forecast provided by GVT, along the explicit period of Cash Flow
ii. Income Tax and Social Contribution Calculated according to the current rates and legislation.
Interest and loan amortization The interest and loan amortization were considered in accordance with the conditions of each of the operation, both in short and long terms, as reported by GVT management. Adjustments and Contingencies No adjustments or contingencies were considered, given that the valuation of the Company through FCFF (Free Cash Flow to Firm). Observations regarding the valuation Sale of non-operating assets was not considered in the cash flow, nor any income from subsidiaries or affiliates without profit or little equity. 1.3 Valuation Method Among the several valuation criteria, the one we consider the most appropriate, is the free cash flow, including the purpose of its incorporation to the equity of Telefônica Brasil, considering the provisions of Articles 252 and 256 of Law 6404/76, as amended.

9
1.4 Discount rate The discount rate was calculated according to the methodology of Weighted Average Cost of Capital – WACC of Telefônica Brasil, with appropriate application of CAPM (Capital Asset Pricing Model - Asset Pricing Model). The WACC used in this valuation is the one of Telefônica Brasil since it is the Company that is acquiring GVT. The WACC of Telefónica Espanha was not taken into consideration since it includes other businesses in several countries (other than Brazil) and different from those in Brazil. The adoption of the WACC of Telefônica Brasil is justified on the basis that GVT is now administered under the policies and guidelines of its purchaser, where the merits and risks iof the business will be responsibility of the new Company: Telefônica Brasil. The criteria used in the calculation of WACC take into consideration the market indicator data on the base date of December 31, 2014, considering the capital structure of Telefônica Brasil. The indicators used in the WACC calculation are based on historical return of US Treasury securities (20 years) and the S & P, beta of comparable companies in the industry, the Country Risk (Brazil) and the inflation differential between these countries. As a result, the WACC considered in this valuation is 12.535% (nominal fee). 1.5 Value and Valuation methodology The result of this valuation was based on the future profitability criteria, according to the discounted cash flow methodology, which set a value of R$ 26.4 billion, as below indicated:
Discount Rate (WACC) 12,535%
Real growth rate in Perpetuity 1,090%
Value of the explicit forecast period (R$ thousand) 8.167.234,8
Value of the Perpetuity (R$ thousand) 18.249.876,6
ENTERPRISE VALUE (R$ Thousand) 26.417.111,4
DescriptionResult of the Free Cash Flow to Firm -
FCFF

10
In order to comply with article 256 of Law 6404/76, a range between R$ 24.7 billion and R$ 28.3 billionwas established, supported by the sensitivity analysis that considered the WACC and growth of perpetuity, as below indicated:
Discount Rate (WACC) 12,735% 12,335%
Real growth rate in Perpetuity 0,590% 1,590%
Value of the explicit forecast period (R$ thousand) 8.092.090 8.243.427
Value of the Perpetuity (R$ thousand) 16.653.608 20.108.238
ENTERPRISE VALUE (R$ Thousand) 24.745.697 28.351.665
Description Minimum Value Maximum Value

11
2. GOAL PLANCONSULT Planejamento e Consultoria Ltda (Planconsult) was hired by Telefônica Brasil to establish the value of the shares of GVT, for their economic value, on the base date of December 31, 2014, for the purpose of its incorporation to the equity of Telefônica Brasil. According to Article 256 - Paragraph 1, in conjunction with Article 8 of Law 6404/76, as amended, this valuation will also serve as a basis for (i) approval of the acquisition of GVTPar by the General Meeting of Telefônica Brasil pursuant to Article 256 of Law 6404/76, as amended; and (ii) determining the value of the capital increase of Telefônica Brasil to be formalized due to the merger of GVTPar by Telefônica Brasil under Article 252 of Law 6404/76, as amended. It is important to mention that the valuation in this Report was conducted taking into consideration the cash flow generated by GVT, the operating Company. GVTPar, is a pure holding company, which holds the investment in GVT as its only asset,. With this in mind, references are made to GVTPar interchangeably in relation to GVTPar and GVT and vice versa. The valuation was conducted based on the future profitability criteria, using the method of discounted cash flow to present value, using as discount rate WACC (Weighted Average Cost of Capital) which includes the determination of the Company's Total Value - FCFF (Free Cash Flow to Firm).
3. INFORMATION ABOUT THE APPRAISAL COMPANY 3.1 Institution responsible for the appraisal report Planconsult specialized in the Appraisal of companies and fixed assets, is a market leader in large companies appraisal, focusing on medium and large size customers,. To this effect, we have been successful for over 39 years. Planconsult provides asset appraisals, business valuations, advisory services in corporate transactions (M&A) and restructuring, for the mainstream industrial and financial Brazilian corporations, domestic as well as multinational. Planconsult is registered with several Brazilian public agencies for appraisal of fixed assets as well as economic-financial appraisal,, with currently valid registrations. Our works have traditionally been fully approved by the CVM (Brazilian Securities and Exchange Commission), SEC (Securities Exchange Commission - USA). Examples thereof are the launching of VCP’s ADRs, CIMPOR’s IPO, organization of the holding companies of TELEFONICA and Portugal Telecom in Brazil and Appraisal of the Actual Shareholders’ Equity at Market Value (PLR) of VIVO, PERDIGÃO, BATAVIA, and ELEVA. Planconsult, besides its technical capacity and know-how, facilities, staff and developed and proven own computer systems (hardware and software), also has the necessary and essential field experience, which can be evidenced by the appraisal works performed for private and publicly-held companies such as:

12
EMPRESA 1) Alicante Comércio, Importação e Exportação Ltda. 2) Allied S.A. 3) Aricanduva S.A. 4) Banco do Brasil - BB – Banco de Investimentos S.A.
Brasilveículos Companhia de Seguros Brasilcap Capitalização S.A. Companhia de Seguros Aliança do Brasil Brasilsaúde Companhia de Seguros Brasilprev Seguros e Previdência S.A.
5) Braskem S.A. 6) BRINOX Metalúrgica Ltda. 7) Bunge Fertilizantes S/A
Fertilizantes Fosfatados S/A - Fosfértil FosBrasil S/A.
8) CCL Label do Brasil 9) Companhia Siderúrgica de Mogi das Cruzes - COSIM 10) Company S.A. 11) CSN – Companhia Siderúrgica Nacional
Cia. Metalúrgica Prada Mineração Casa de Pedra
12) CPFL Geração de Energia S.A. 13) Damovo do Brasil S.A. 14) DIPIL – Indústria Química Dipil Ltda. 15) ENESA Engenharia S.A. 16) Elevadores Atlas Schindler S.A. 17) Empresas Perdigão (incluindo ELEVA) 18) Fibra Experts Empreendimentos Imobiliários Ltda. 19) Fosfértil Fertilizantes Fosfatados S.A. 20) GEP Indústria e Comércio Ltda. 21) Givaudan do Brasil Ltda. 22) Grupo Camargo Corrêa
Camargo Corrêa Industrial S.A. Cimento Cauê S.A.
23) Grupo Cimpor Companhia de Cimentos do Brasil (CCB) Companhia de Cimento Atol Companhia Paraíba de Cimento Portland (Cimepar) Cimento Brumado S.A.

13
EMPRESAS
24) Grupo Electrolux (Prosdócimo, Electrolux e WAP) 25) Grupo Eucatex 26) Grupo Julio Simões
Lubiani Transportes Ltda. Original Veículos Ltda.
27) Gurpo LTM 28) Grupo Marchesan
Marchesan Implementos e Máquinas Agrícolas "Tatu" S/A Marchesan Agro Industrial e Pastoril S/A
29) Grupo Votorantim Companhia de Cimento Portland Itaú Geral de Concreto S.A. Votorantim Celulose e Papel S.A.
30) Grupo Telefônica Adquira do Brasil Ltda. Katalyx Cataloguing do Brasil Ltda. Katalyx do Brasil Ltda. Katalyx Transportation do Brasil Ltda.
31) GuardeAqui Self Storage 32) Helbor Empreendimentos S.A. 33) Henkel do Brasil Indústrias Químicas Ltda. 34) Hispamar Satélites S/A 35) Hypermarcas S/A.
DM Farmacêutica Ltda. Assolan Quimivale Industrial Ltda. Etti Produtos Alimentícios Ltda. Sul Química Ltda. FINN Administração de Marcas Ltda. ÉH Cosméticos S.A.
36) Indústrias Gessy Lever Ltda. 37) Lindencorp Desenvolvimento Imobiliário S.A 38) LOCAR Transportes Intermodais S.A. 39) LOG-IN Logística Intermodal S/A 40) Lojas Americanas S.A. 41) Maersk Brasil Brasmar Ltda. 42) MLS Wireless S.A. 43) NAMISA Nacional Minérios S/A

14
EMPRESAS 44) Orema Indústria e Comércio Ltda. 45) Profarma Distribuidora de Produtos Farmacêuticos S.A 46) Qualcomm do Brasil Ltda. 47) PAV – Indústria e Comércio Ltda. 48) Grupo Politeno:
Politeno Ind. e Com. S.A. e Politeno Linear Ind. e Com. S.A.
49) PROGEN Projetos Gerenciamento e Engenharia Ltda. 50) Schneider Electric Participações Ltda. 51) Scopel Desenvolvimento Urbano S.A. 52) SIN – Sistema de Implante Nacional Ltda. 53) SONDA PROCWORK Informática Ltda. 54) Sur Tec do Brasil Ltda. 55) Tallento Engenharia Ltda. 56) Transportadora Grande ABC Ltda. 57) TRIKEM S.A. e Salgema Indústrias Químicas S.A. 58) Tópico Centro Logístico 59) Ultrafétil S.A. 60) VIVO telefonia celular:
Tele Leste Celular Participações S.A.: Telebahia e Telergipe Tele Sudeste Celular Participações S.A.: Telerj e Telest Celular CRT Participações S.A.: CRT Telesp Celular Participações S.A.: Telesp e Global Telecom Tele Centro Oeste Participações S.A.: Telegoiás, Telemat, Telems,
Teleron, Teleacre, NBT, TCO IP Telemig Celular S.A. e Telemig Celular Participações S.A. VIVO Celular S.A. e VIVO Participações S.A.
Besides know-how, facilities, personnel and own computer systems, has the necessary and indispensable experience in mergers, acquisitions and reorganizations of companies, performing: I. Business Valuation: Economic valuation - DCF (including amortization of goodwill); Net worth at market value; Book value.
II. Fixed and intangible assets valuation, including insurance purposes. III. Economic and financial feasibility studies and business plans. IV. Technical and financial due diligence. V. Physical Inventories, deployments and data remodeling for control of fixed assets.

15
3.2 Description of the internal process for the appraisal report approval The internal process of review and approval of the work herein presented was performed by a committee of analysts, managers and members of Planconsult, as well as consultants to the Company, with academic and professional background in the areas of business administration, economics, engineering and accounting. This committee approved the report from the exhibition held by analysts, managers and the managing partner responsible for preparing the work. 3.3 Identification and Qualification of the professionals responsible for this
Valuation Report
Knowledge of the mechanical engineering area, working on the reconciliation andappraisal of fixed assets. In PLANCONSULT has been highlighted in AssetValuation, Business and Project Feasibility.
Degree in Business Administration from FAAP , and MBA in Finance from Insper.
Specific experience in appraisals, engineering investigation and technical -economic-financial feasibility studies.
In PLANCONSULT as managing partner and responsible engineer, has participatedactively in the activities of the Company over the years as a Business and AssetValuation, feasibility, Privatization, Sanitation, and Business Management.
Degree in Industrial Engineering from FEI, in Business Administration from FGV andspecialization courses from IBAPE . Ex-president of IBAPE.
Edgar Victor Salem
Managing Partner
Marcos Benedito Jorge
Manager
Edgar Victor Salem Jr.
Director
Senior Consultant at PLANCONSULT on assessments of medium and largecompanies for economic-financial appraisal purposes.
Before working PLANCONSULT, worked for 20 years as a financial advisor inStrategic Planning in large and medium enterprises.
Degree in Economics from University of Mogi das Cruzes and Project Valuationgraduation from FMU.
Wide experience in the Administrative and Commercial areas, both in large and smallcompanies. Experienced in the development and coordination of projects carried out in different corporate segments.

16
3.4 Disclaimer This Economic-Financial Valuation Report has been prepared by Planconsult based on the information provided by the management of GVT and Telefônica Brasil, including accounting and financial statements of the company as of 12/31/2014. Planconsult has taken precaution and acted on a highly diligent basis in order to request that information provided by the Company was true and consistent. Notwithstanding the foregoing, it may not warrant that such information is correct and complete. Also public information was considered, such as interest rates, macroeconomic assumptions, growth projections of the company, etc. Planconsult has not carried out any legal, accounting or other audit processes nor has independently investigated the information made available for purposes of preparing the Economic-Financial Valuation Report. Accordingly, impacts of any other audit or investigation process were not taken into consideration and Planconsult does not undertake any responsibility for the truthfulness, accuracy or extent of the information obtained. Planconsult was assured by the Company that all information provided is complete, correct and sufficient, provided that all the information was prepared in a reasonable manner and that reflect the best estimates and valuations at the time they were made, and the best judgment of the administration of the Company about its future financial performance 3.5 Commercial or credit information that may impact the valuation report Forward-looking considerations were made, which may be subject to changes, thus modifying the work conclusions. It may not be guaranteed that any of the assumptions, estimates, projections, partial or total results or conclusions used or presented in this Economic-Financial Valuation Report are or may be actually achieved, either fully or partially. The final results may differ from the projections, which may be material. The final results may be also impacted, among other factors, by market conditions. Therefore, no guarantee may be provided by Planconsult as for projections contained in this document being realized or not, especially those occurrence of which depends on future and uncertain events. These considerations about future events, reflect the best estimate on the elements present. The processed information was not analyzed by Planconsult as to its validity and legal effectiveness, since such analysis is beyond its professional scope. The validity and enforceability of the liens or encumbrances over the Company’s properties have also not been analyzed. Therefore, Planconsult does not undertake any liability for legal, engineering or finance issues, other than those implicit in the exercise of its specific duties in the case, as primarily set forth in Brazilian laws, codes or regulations.

17
The companies staff has not, in any way, directed, prevented or acted in any way which could have impaired the access, use or knowledge of the information material for the quality of the work, having declared that all the documents and/or other information available for the valuation and quality of the respective conclusions were provided to Planconsult. It must be pointed out that all the amounts considered in this work were recorded on a uniform basis as cash values, at the base date of December 31, 2014. 3.6 Absence of conflict of interest Planconsult as well as their partners, directors and employees have no direct or indirect interest in GVTor Telefônica Brasil, in relation to the subject involved in this Valuation Report nor receive any advantage, without any conflict or pooling of interests, current or potential, that prevents them from preparing this report, including but not limited to, for example, GVTand Telefônica Brasil controllers. To our best knowledge,, the analyzes, opinions and conclusions expressed in this Valuation Report are based on true and correct data, research and surveys. The Valuation Report presents all the restrictive conditions imposed by the adopted methodologies, which affect the analyzes, opinions and conclusions contained therein. Planconsult professional fees are not, in any way, subject to the conclusions of this Valuation Report. For the Valuation Report preparation, Planconsult used information and audited unaudited data by third parties, provided in writing or verbally by the company management, or obtained from the sources mentioned. Planconsult assumed as true information and management data supplied by GVTand Telefônica Brasil and has no responsibility regarding its accuracy and completeness. São Paulo, April 27th, 2015. PLANCONSULT Planejamento e Consultoria Ltda. CREA: 21973 - SP CRA: E-1256 - SP CORECON: RE / 2849 – SP EDGAR VICTOR SALEM CREA: 0600461524 CRA: 12.500 – SP
EDGAR VICTOR SALEM JUNIOR CRA: 82.986 - SP
MARCOS BENEDITO JORGE CORECON: 17.198 - SP

18
4. COMPANY PRESENTATION AND BUSINESS CONTEXT 4.1 Brief history of the Company GVT is a publicly-held company, with unlimited duration, governed by its Bylaws and applicable legal provisions, based in the city of Maringá, Estado do Paraná, Rua João Paulino Vieira Filho, n° 752, CEP 87020-015. CNPJ: 03.420.926/0001-24 NIRE: 4120420075-3 The Company is engaged to provide telecommunications services, including the transmission of voice, data and information; the sale of equipment and / or telecommunications and electronic accessories; and participation in other companies as a shareholder or member. The share capital of GVT, fully subscribed and paid, is R$ 1,919,280,354.00 (one billion, nine hundred nineteen million, two hundred eighty thousand, three hundred fifty-four Reais), represented by 1,919,280,354 (one billion nine hundred and nineteen million, two hundred eighty thousand, three hundred fifty-four) registered common shares with no nominal value, distributed among the shareholders as follows: a) GVTPar owns 1,918,604,783 (99.96%) shares; b) GIS 72 owns 675 751 (0.04%) shares. Company's Balance Sheet – 2012, 2013 e 2014
Values in R$ thousand ASSETS
CURRENT ASSETSCash and cash equivalents 590.981 496.676 578.485 Accounts receivable 967.583 1.127.245 1.342.687 Taxes recoverable 161.780 203.938 164.238 Prepaid expenses 5.663 12.673 26.824 Other assets 27.669 1.663.676 55.739 1.896.271 23.277 2.135.511
NONCURRENT ASSETSDeferred taxes 77.966 1.803.590 1.518.102 Taxes recoverable 155.853 117.567 85.377 Other assets 268.552 502.371 241.028 2.162.185 529.970 2.133.449
FIXED ASSETSNet Assets 6.023.634 7.345.098 8.366.075 Intangible assets 202.767 6.226.401 227.824 7.572.922 221.313 8.587.388
TOTAL ASSETS 8.392.448 11.631.378 12.856.348
20142012 2013

19
Values in R$ thousand
LIABILITIES AND EQUITYCURRENT LIABILITIES
Trade accounts payable 803.604 997.694 1.140.303 Deferred VAT payable 48.107 - 530 Loans and financing 106.316 151.142 1.333.295 Taxes, charges and contributions 401.535 416.226 515.262 Loans to related parties 24 - - Provision for contingencies 7.648 12.043 15.761 Dividend and interest on equity - 48.954 145.646 Traffic to pay (DETRAF) 56.511 52.089 38.963 Income tax and social contribution payable 22.187 677 321 Other liabilities 9.213 1.455.145 12.970 1.691.795 19.485 3.209.566
NONCURRENT LIABILITIESLoans and financing 3.198.987 4.350.968 3.527.412 Deferred revenues 1.180 Loans to related parties 715.294 - - Provision - costs with fixed assets disassembly 49.670 47.018 64.746 Traffic to pay (DETRAF) 201.737 66.622 67.742 Deferred VAT payable 21.413 4.633 697 Advance for capital increase 137.936 - - Provision for contingencies 32.637 48.854 66.114 Other liabilities 45.336 4.404.190 46.091 4.564.186 23.137 3.749.848
EQUITYCAPITAL 1.781.345 1.919.281 1.919.281 CAPITAL RESERVES - 2.556.312 2.577.309 INCOME RESERVES 724.036 882.352 1.399.826 INCENTIVE GRANT TAX 13.757 - - OPTIONS - GRANTED RECOGNISED 13.968 - - VARIATION SHEET ADJUSTMENTS 7 2.533.113 17.452 5.375.397 518 5.896.934
TOTAL LIABILITIES AND SHAREHOLDERS 'EQUITY 8.392.448 11.631.378 12.856.348
20132012 2014
STATEMENT OF FINANCIAL RESULTS Values in R$ thousand
NET OPERATING REVENUE 4.300.562 4.861.473 5.484.743
COST OF SALES 1.270.385 2.220.166 2.542.399
S, G & A 2.116.409 2.334.442 2.008.111
OPERATING INCOME 913.767 306.865 934.233
INCOME BEFORE TAXES 913.767 306.865 934.233
TAXES 292.350 77.811 302.594
NET INCOME 621.417 229.054 631.639
201420132012

20
4.300.562 4.861.473
5.484.743
2.012 2.013 2.014
Net EarningsR$ thousand
Source: Information provided by the Company.
1.859.136 2.015.558
2.156.116
2.012 2.013 2.014
EBITDAR $ thousand
Source: Information provided by the Company.
43,2% 41,5%39,3%
2.012 2.013 2.014
% EBITDA
Source: Information provided by the Company.

21
4.2 Brief description of the market segment GVT is a Brazilian Company operating since November 2000, which provides nationwide broadband services with ultra-speed, cable TV and fixed telephone solutions for residential and corporate sectors. The company is part of the Vivendi group, a world leader in production and distribution of content in the digital age. 4.3 Brief analysis of the sector where the company operates Present in 156 cities in the country, has more than 6 million telecommunications lines in service and more than 800,000 Pay TV spots, also the highest Internet penetration rates in the Brazilian market by offering products based on innovation and quality.
Growth curves, historical and projected period, by segment (Source: Ovum and Pyramid):
Wireline - million hits 45,0 45,4 45,5 45,2 44,8 44,5
2013 2014 2015 2016 2017 2018

22
Broadband - million hits
20,5
24,226,3
29,732,1
2013 2014 2015 2016 2017
Pay TV – million hits
17,919,6
21,323,0
24,626,2
2013 2014 2015 2016 2017 2018 Forecast Fixed Line revenues in Brazil 2013-2018 According to recent information from Frost & Sullivan there is a recovery trend of the voice market for the SME segment (Specialized Mobile Service), which should reach 55% of total segment revenues and mitigate the projected fall (Source: Frost & Sullivan 2013).

23
5,31 5,10 4,89 4,68 4,45 4,20
(6,0%)
(5,0%)
(4,0%)
(3,0%)
(2,0%)
(1,0%)
0,0%
0,00
1,00
2,00
3,00
4,00
5,00
6,00
2013 2014 2015 2016 2017 2018
Revenue ($ Billion) Growth Rate
Data Market revenue forecast for Brazil 2013-2018 The market data continues to expand with little slowdown every year, especially in large companies (Source: Frost & Sullivan 2013).
4,9% 4,3% 3,8% 3,4% 3,1% 3,0%
13,8%12,1%
10,9% 9,9% 9,1% 8,7%
2013 2014 2015 2016 2017 2018
Growth Rate – Data and Internet
LARGE SME
3,17 3,37 3,563,74 3,92 4,09
0%
1%
2%
3%
4%
5%
6%
7%
0,000,501,001,502,002,503,003,504,004,50
2012 2013 2014 2015 2016 2017
Revenue ($ Billion) Growth Rate

24
Main competitors and market share, period 2009-2014 (Source: Anatel)
14%16%
19% 21%
24% 26%
3% 5%7% 8% 9% 10%
52%48%
45%42%
39%37%
27% 27% 26%24%
23% 23%
2009 2010 2011 2012 2013 2014
Fixed
América Móvil GVT
Oi Vivo
24% 25%28% 28%
30%
31%
5%7%
9%11% 11% 12%
38%
33% 32% 31%29%
28%
24% 24%22%
20% 19%18%
2009 2010 2011 2012 2013 2014
Broadband
América Móvil GVT
Oi Vivo
52%54% 55%
53% 54% 53%
3%
4% 4%3%
4% 3%
5% 5% 5%9%7% 5%
4%
3% 4%
26% 26%30% 31% 30% 29%
2009 2010 2011 2012 2013 2014
Pay‐TV
América Móvil GVTOi VivoSky
4.4 Macroeconomic assumptions used in the preparation of the report This economic and financial valuation of GVT was developed under the prevailing economic environment on the base date of December 31, 2014. The macroeconomic assumptions used in the projection of free cash flow were prepared jointly by Planconsult and Telefônica Brasil, based on public information, and are described below:
Source Unit 2015E 2016E 2017E 2018E 2019E 2020E 2021E 2022E 2023E 2024E
Exchange Rate
Average Focus R$/US$ 2,71 2,76 2,79 2,86 2,74 2,78 2,88 2,97 3,07 3,17Final Focus R$/US$ 2,78 2,81 2,84 2,92 2,74 2,83 2,92 3,02 3,12 3,22
Inflation
IPCA Focus % 6,66% 5,68% 5,73% 5,75% 5,75% 5,75% 5,75% 5,75% 5,75% 5,75%
IGP-M Focus % 6,14% 5,25% 4,50% 4,50% 4,50% 4,50% 4,50% 4,50% 4,50% 4,50%
US CPI Gov % 2,30% 2,40% 2,40% 2,40% 2,40% 2,40% 2,40% 2,40% 2,40% 2,40%
Diferencial de Inf lação Brasil-USA Cálculo % 4,26% 3,20% 3,25% 3,27% 3,27% 3,27% 3,27% 3,27% 3,27% 3,27%
Interest Rate
SELIC Average Focus % 12,25% 11,67% 10,83% 10,25% 9,50% 9,50% 9,50% 9,50% 9,50% 9,50%
TJPL BNDES % 5,00% 5,00% 5,00% 5,00% 5,00% 5,00% 5,00% 5,00% 5,00% 5,00%
GDP
Annual grow th rate Bacen % 0,45% 1,75% 2,30% 2,50% 2,50% 2,50% 2,50% 2,50% 2,50% 2,50%
In the present valuation was adopted value in perpetuity. This valuation comprehends the explicit cash flow period between Jan 1st, 2015 and dec 31th, 2024, and later perpetuity.
25
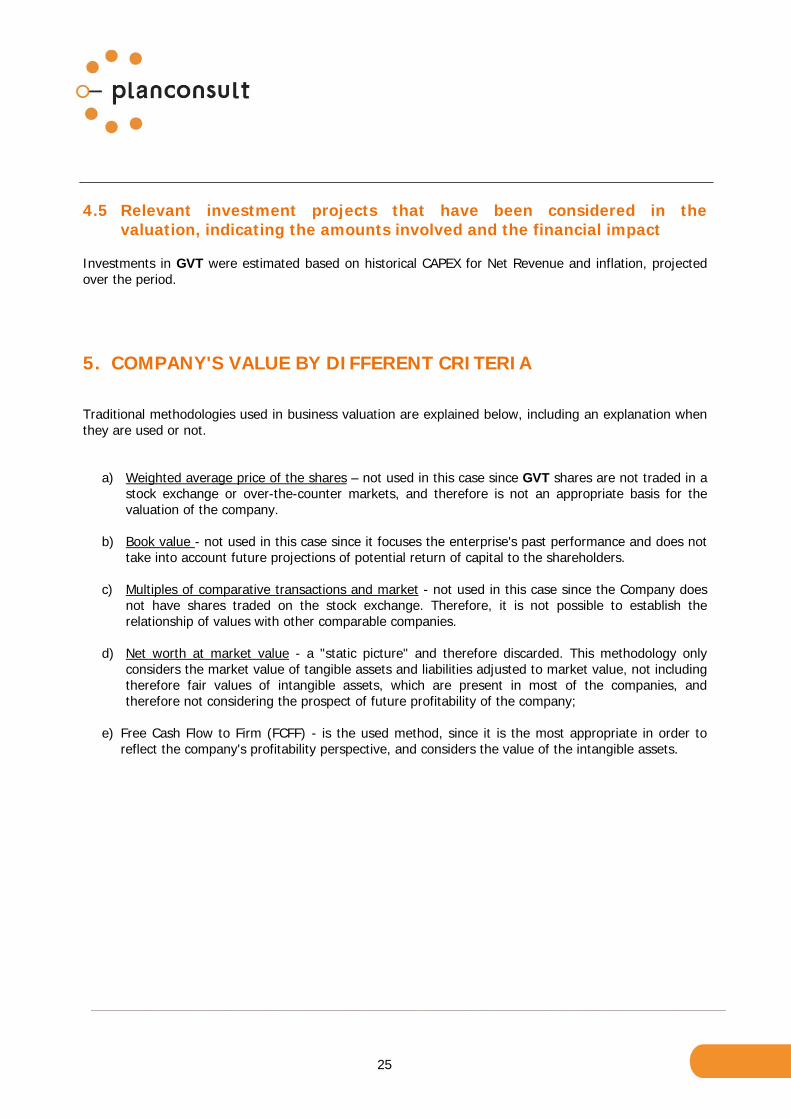
4.5 Relevant investment projects that have been considered in the
valuation, indicating the amounts involved and the financial impact Investments in GVT were estimated based on historical CAPEX for Net Revenue and inflation, projected over the period.
5. COMPANY'S VALUE BY DIFFERENT CRITERIA Traditional methodologies used in business valuation are explained below, including an explanation when they are used or not.
a) Weighted average price of the shares – not used in this case since GVT shares are not traded in a stock exchange or over-the-counter markets, and therefore is not an appropriate basis for the valuation of the company.
b) Book value - not used in this case since it focuses the enterprise's past performance and does not
take into account future projections of potential return of capital to the shareholders.
c) Multiples of comparative transactions and market - not used in this case since the Company does not have shares traded on the stock exchange. Therefore, it is not possible to establish the relationship of values with other comparable companies.
d) Net worth at market value - a "static picture" and therefore discarded. This methodology only
considers the market value of tangible assets and liabilities adjusted to market value, not including therefore fair values of intangible assets, which are present in most of the companies, andtherefore not considering the prospect of future profitability of the company;
e) Free Cash Flow to Firm (FCFF) - is the used method, since it is the most appropriate in order to
reflect the company's profitability perspective, and considers the value of the intangible assets.

26
6. METHODOLOGY CONSIDERATIONS The purpose of this valuation’s is to establish the economic value of the GVT company, in a DCF basis. The Free Cash Flow to Equity method is used in valuing a Company according to the present value of the cash flow it generates,. The valuation is carried out by analyzing all the income and capital accounts influence the operational results, as well as assets which do not generate cash flows, but have a market value for sale (realization). After the initial understanding of the business (a stable, cyclic Company with growth potential, useful assets, undergoing a restructuring process, etc.), we considered its historic aspects and a defined scenario, projected the company’s growth model (stability, and growth in one, two or more stages) and the variables; sales, costs, new investments required for the expansion and technological adequacy of the business, as well as the operational investments, replacement, and cash recovery from depreciation and amortization, and defined the residual value of the assets, as applicable. The overall business risk is determined as per the business nature risk, its stage of development or maturation, the competing conditions arising out of the industry structure (oligopoly or competitive scenario), and the globalization. We have further considered the interest rate free of risk in the economy. In general, the discount rate reflects expectancy based on similar investment opportunities at the present time. Throughout the appraisal process, we took into consideration the existence of eventual non-operational assets and their realization, as well as the existence of cash surplus at the initial date of the project, as well as the residual value of the assets, if applicable. The period during which cash generation is computed is, in general, such time as is consistent with the life of the assets and the technical and marketing feasibility of the Company. We developed the valuation process with the identification of the business model and the Company’s market position, considering, whenever possible, the current stage of adjustment of the Company to the globalization process, in particular as far as it refers to price, costs and standard of products and services. Two aspects of this method deserve special attention: the Time Frame of the Free Cash Flow and the discount rate, which reflects Capital Cost. As for the Time Frame of the cash flow, the appraisal of the Company was carried out in two different periods, during and after a certain explicit forecasting period. Therefore, we have:
Company Value =
Present value of the cash flows during the explicit
forecasting period (Annuities)
Present value of the cash flow after the explicit forecasting period
(Perpetuity) +

27
Present value of the Free Cash Flow (FCF) during the explicit period: is the present value resulting from the operating cash flows during a certain period of time that is feasible for projections, according to the type of activity of the Company. Perpetual value: also defined as residual value or terminal value, is the value for the period after the last year of the explicit period. It is calculated as from the FCF result for the period subsequent to the last projection period, divided by the discount rate adopted, deducted from the perpetual growth rate, that is:
Residual Value = Net Result of last year’s explicit forecasting period (n+1) (Discount rate) – (perpetual growth rate)
Where: n is the number of forecasting periods. The discount rate of the Free Cash Flow (FCF) is the Weighted Average Cost of Capital, as defined by the WACC methodology, shown in the item 7.2 below. All the cash flow elements must be discounted to their present values and, in totaling these results, their net present value is achieved, which reflects the market value of the Company, pursuant to the method of the Free Cash Flow to Firm, discounted at present value. The present value concept includes the notion of the opportunity cost of capital. The discount rate reflects the return that the shareholders of the Company are able to obtain on the market, on an investment with a similar profile. Important Notes:
a) In the present valuation, a value in perpetuity was adopted. This valuation comprehends the explicit cash flow period between Jan 1st, 2015 and dec 31th, 2024, and perpetuity, thereafter.
b) All projections are based on nominal values (R$), therefore contemplate inflation.

28
7. CASH FLOW ASSUMPTIONS The information used to value GVT was based on information such as audited balance sheet of 2012-2013 (Jan. through Dec.) and non-audited balance sheet of 2014, strategic projections, investments, loans, taxes, administrative and business expenses, all provided by GVT and Telefônica Brasil. The operational assumptions used in the projection of the cash flow of the Company are presented as follow: 7.1 Time Frame The Discounted Cash Flow is forecasted for an explicit period of 10 years (jan2015-dec/2024) 7.2 Discount Rate To discount the free cash flow to firm (FCFF), it was estimated a discount rate of 12.535% according to the standard methodology of Weighted Average Cost of Capital (WACC), which is represented by: where:
WACC - Weighted Average Cost of Capital; Ke: Cost of Equity; Kd: Cost of Debt; T: Income Tax Rate; E: Shareholder’s Equity; D: Net Debt.
All data for the calculation of the discount rate were provided by Telefônica Brasil administrators.
WACC = E
E + D
D
E + Dx Ke + x Kd x (1-T)

29
7.3 Sales revenues As previously mentioned, the main assumptions of GVT’s revenue projection for the period jan/2015-dec/2024 are sustained in historical data and strategic actions of the Company, as well as market forecasts provided by the management of Telefônica Brasil (information at their degree of reliability / reasonableness in the light of market practices), represented by the graphs below:
0
2.000
4.000
6.000
8.000
10.000
12.000
14.000
16.000
18.000
2015 2016 2017 2018 2019 2020 2021 2022 2023 2024
Net Sales Revenue (R$ million)
7.4 Operational Expenses Operational expenses were estimated based on the percentage of Gross Operating Revenue, obtained from the historical data of the 2012 to 2014 income statement, provided by the management of GVT and market forecasts provided by the management of Telefônica Brasil. 7.5 Administrative, Selling and Other Expenses Commercial, general and administrative expenses were determined according to the historical data of the 2012 to 2014 income statement, provided by the management of GVT and market forecasts provided by the management of Telefônica Brasil. 7.6 Depreciation and amortization
a) Historical Calculated resulting from the balance to depreciate on December 31, 2014, according to each relevant fixed assets accounts.

30
b) Investiments
Investments are also depreciated linearly from the year of its implementation, in accordance with the relevant rates for each fixed assets account.
7.7 Interest and loans amortization Interest and loan amortization were considered in accordance with the conditions of each of the operations, both short and long terms, as reported by GVT management. 7.8 Investiments Investments in GVT were estimated based on historical CAPEX for Net Revenue and inflation, projected over the explicit period. 7.9 Taxes Sales taxes: The projections were considered from the Net Sales Revenue forecast by GVT, along the explicit period of Cash Flow Income Taxes and Social Contribution: Calculated according to the current legislation rates. 7.10 Working Capital Variation The changes in working capital requirement were calculated based on the effective maturities of the historical operating assets and liabilities of GVT, applied in proportion to the amounts of net income projected over the explicit period of the cash flow. 7.11 Sinergies The synergies that GVT brings to the operation of Telefônica Brasil were considered. 7.12 Notes regarding the valuation The sale of non-operating assets was not considered in the cash flow, nor any income of cash from subsidiaries or affiliates without profit or little equity.

31
7.13 Subsequent Events This valuation does not reflect events occurring after the closing date of this report. No relevant facts which have occurred between the base date of the valuation and the closing date of this report were brought to the attention of Planconsult. Up to the the closing date of this report, Planconsult is unaware of any event that can substantially change the valuation result. 7.14 Summary of Operating and Financial Projections
16,8%15,9% 15,5% 15,9%
11,2%10,2% 10,0% 9,8% 9,7% 9,7%
2015 2016 2017 2018 2019 2020 2021 2022 2023 2024
Net Sales RevenueEvolution % Projected

32
0
2.000
4.000
6.000
8.000
10.000
12.000
14.000
16.000
18.000
2015 2016 2017 2018 2019 2020 2021 2022 2023
R$
mill
ion
Net Revenues Projected
0
500
1.000
1.500
2.000
2.500
3.000
3.500
4.000
2015 2016 2017 2018 2019 2020 2021 2022 2023 2024
R$
mill
ion
S, G & A

33
2.6743.115
3.7884.378
4.9525.455 5.952
6.4997.102
7.773
2015 2016 2017 2018 2019 2020 2021 2022 2023 2024
EBITDA R$ million
40,1% 39,7% 39,0% 38,5% 38,1% 38,0%37,5% 37,1% 36,9% 36,7%
2015 2016 2017 2018 2019 2020 2021 2022 2023 2024
EBITDA % Net Operating Revenue

34
595
1.048
1.4471.743
2.808 2.939 2.9653.116 3.351
3.726
2015 2016 2017 2018 2019 2020 2021 2022 2023 2024
Net IncomeR$ million
2.067
2.3582.189
2.698 2.693 2.714 2.808 2.692 2.773 2.840
2015 2016 2017 2018 2019 2020 2021 2022 2023 2024
Investiments R$ million

35
8. CONCLUSION Therefore, in Dec/31/2014 the Firm Value attributed to GVT was defined, according to assumptions mentioned above, as shown in the Discounted Cash Flows (APPENDIX A). The result of this valuation was based on the future profitability criteria, with the use of the discounted cash flow methodology, which set a value of R$ 26.4 billion, as below indicated:
Discount Rate (WACC) 12,535%
Real growth rate in Perpetuity 1,090%
Value of the explicit forecast period (R$ thousand) 8.167.234,8
Value of the Perpetuity (R$ thousand) 18.249.876,6
ENTERPRISE VALUE (R$ Thousand) 26.417.111,4
DescriptionResult of the Free Cash Flow to Firm -
FCFF
In order to comply with article 256 of Law 6404/76, a range between R$ 24.7 billion and R$ 28.3 billionwas established, supported by the sensitivity analysis that considered the WACC and growth of perpetuity, as below indicated:
Discount Rate (WACC) 12,735% 12,335%
Real growth rate in Perpetuity 0,590% 1,590%
Value of the explicit forecast period (R$ thousand) 8.092.090 8.243.427
Value of the Perpetuity (R$ thousand) 16.653.608 20.108.238
ENTERPRISE VALUE (R$ Thousand) 24.745.697 28.351.665
Description Minimum Value Maximum Value
It is important to emphasize that the Company’s valuation was based on assumptions defined and informed by Telefônica Brasil. K:\Dropbox\Projetos\1572 - Telefonica-VIVO - Aval. Econ. Fin - GVT\Arquivos\Laudos\Executive Summary - ValuationPlanconsult‐art.256eincorporação‐27abr15.docx

36
9. ANNEXES ANNEX A – Value Summary, Discount Rate, Free Cash Flow to the Firm - FCFF and Free Cash Flow Synergies ANNEX B – Financial Statements 2012, 2013 and 2014 – GVT ANNEX C – Amendment of Articles of Association – Bylaws – GVT ANNEX D – Material Fact Telefônica Brasil

37
A N N E X E S

38
ANNEX A
Value Summary, Discount Rate, Free Cash Flow to the Firm - FCFF and Free Cash Flow Synergies

39
GVT - Global Village Telecom S.A. Free Cash Flow to Firm SUMMARY OF CASH FLOWS - VALUATIONBase Date: 12/31/2014
Enterprise Value Value of TOTAL VALUEStand Alone Synergies FCFF
Discount Rate (WACC) 12,535% 12,535% 12,535%
Real growth rate in Perpetuity 1,090% 1,090% 1,090%
Value of the explicit forecast period (R$ thousand) 3.858.547 4.308.688 8.167.235
Value of the Perpetuity (R$ thousand) 12.143.568 6.106.309 18.249.877
ENTERPRISE VALUE (R$ Thousand) 16.002.115 10.414.997 26.417.111
DiscriminaçãoResult of the Free Cash Flow to Firm - FCFF
GVT - Global Village Telecom S.A. Free Cash Flow to Firm SUMMARY OF THE VALUATION - SENSITIVITY ANALYSISBase Date: 12/31/2014
Discount Rate (WACC) 12,735% 12,535% 12,335%
Real growth rate in Perpetuity 0,590% 1,090% 1,590%
Value of the explicit forecast period (R$ thousand) 8.092.090 8.167.235 8.243.427
Value of the Perpetuity (R$ thousand) 16.653.608 18.249.877 20.108.238
ENTERPRISE VALUE (R$ Thousand) 24.745.697 26.417.111 28.351.665
Description Minimum Value Maximum ValueResult of the Free Cash Flow to Firm -
FCFF

40
GVT - Global Village Telecom S.A. Free Cash Flow to FirmBase Date: 12/31/2014
In Thousand Reais BASE YEAR OFP&L and Cash Flow 2.015 2.016 2.017 2.018 2.019 2.020 2.021 2.022 2.023 2.024 PERPETUITY
NET OPERATING REVENUE 6.143.044 6.848.552 7.660.812 8.605.004 9.628.425 10.664.352 11.770.580 12.958.816 14.246.796 15.689.997 15.689.997
(-) OPERATING COSTS 1.961.360 2.238.816 2.594.706 2.999.695 3.457.825 3.908.749 4.428.216 4.986.632 5.574.447 6.235.757 6.110.454
CONTRIBUTION MARGIN 4.181.685 4.609.736 5.066.106 5.605.309 6.170.600 6.755.602 7.342.364 7.972.183 8.672.349 9.454.240 9.579.54368,1% 67,3% 66,1% 65,1% 64,1% 63,3% 62,4% 61,5% 60,9% 60,3% 6 1,1%
S, G & A 1.717.556 1.891.493 2.075.483 2.294.763 2.497.962 2.708.019 2.932.026 3.163.750 3.414.752 3.688.542 3.688.542
EBITDA 2.464.129 2.718.243 2.990.623 3.310.545 3.672.638 4.047.583 4.410.339 4.808.433 5.257.597 5.765.699 5.891.00140,1% 39,7% 39,0% 38,5% 38,1% 38,0% 37,5% 37,1% 36,9% 36,7% 37,5%
(-) Depreciation and Amortization 1.772.568 1.735.384 1.881.616 2.097.273 1.206.698 1.434.513 1.756.138 2.088.993 2.351.189 2.414.602 2.471.395
EBIT 691.561 982.859 1.109.007 1.213.272 2.465.941 2.613.070 2.654.200 2.719.440 2.906.408 3.351.097 3.419.607
(-) Income Taxes and Social Contribution 235.107 233.896 263.920 288.735 649.179 765.001 902.404 924.586 988.155 1.139.349 1.162.642
NET INCOME 456.454 748.962 845.087 924.537 1.816.762 1.848.069 1.751.796 1.794.854 1.918.253 2.211.748 2.256.964
(+) Depreciation and Amortization 1.772.568 1.735.384 1.881.616 2.097.273 1.206.698 1.434.513 1.756.138 2.088.993 2.351.189 2.414.602 2.471.395(-) Investiments 2.001.617 2.159.990 2.111.768 2.404.947 2.482.479 2.504.545 2.591.993 2.467.798 2.529.128 2.591.982 2.384.625(-) Working Capital Investments 70.248 71.891 89.499 60.372 92.815 105.597 93.667 130.009 120.337 132.481 132.481
FREE CASH FLOW TO FIRM 157.158 252.466 525.437 556.492 448.165 672.440 822.275 1.286.041 1.619.977 1.901.886 2.211.253
x Discount Factor 0,9427 0,8377 0,7444 0,6614 0,5878 0,5223 0,4641 0,4124 0,3665 0,3257 0,2894
PRESENT VALUE - FREE CASH FLOW TO FIRM 148.146 211.481 391.112 368.088 263.417 351.213 381.634 530.391 593.694 619.371
Discount rate assumed (% p.y.) = WACC 12,535%
PRESENT VALUE - FREE CASH FLOW TO FIRM (10 YEARS) 3.858.547
(+) PRESENT VALUE OF PERPETUITY 12.143.568
= TOTAL VALUE OF FREE CASH FLOW TO FIRM 16.002.115

41
GVT - GLOBAL VILLAGE TELECOM S.A.
Free Cash Flow to FirmSUMMARY - SYNERGY GAINS GVT- Telefônica
Base Date: 12/31/2014In Thousand Reais
TOTAL TOTAL 2.015 2.016 2.017 2.018 2.019 2.020 2.021 2.022 2.023 2.024 PERPETUITY10 anos
RESULT OF SYNERGY GAINS 10.414.997 4.308.688 489.876 484.871 568.731 527.340 413.403 499.280 342.534 335.170 325.748 321.735 6.106.309
OPEX and CAPEX in the network 4.125.258 2.139.374 443.604 387.004 316.760 256.362 156.096 242.760 91.390 85.367 79.775 80.256 1.985.884S, G & A 982.041 218.758 6.198 9.561 -15.090 9.292 22.269 28.140 33.370 37.924 41.837 45.257 763.283REVENUE INCREASE 2.349.361 834.865 35.554 69.280 100.941 91.437 90.994 90.575 90.120 89.628 89.071 87.265 1.514.496Pay TV 2.372.156 897.691 19.730 18.443 159.320 125.868 104.544 102.595 96.200 94.127 89.973 86.892 1.474.465Corporate Market 586.181 218.001 -15.210 584 6.800 44.381 39.500 35.209 31.453 28.125 25.092 22.067 368.180
Discount rate assumed (% p.y.) = WACC 12,535%
PRESENT VALUE - FREE CASH FLOW TO FIRM (10 YEARS) 4.308.688
(+) PRESENT VALUE OF PERPETUITY 6.106.309
= TOTAL VALUE OF FREE CASH FLOW TO FIRM 10.414.997

42
GVT - TelefônicaBase Date: 12/31/2014
Weighted Average Cost of Capital - WACC nominal fee Brazil
WACC = Ke * (E/(D+E) + Kd * (D/(D+E) * (1-T) ===> 12,535%
